Submitted:
16 December 2024
Posted:
18 December 2024
You are already at the latest version
Abstract
Semi-supervised clustering incorporates prior knowledge such as class labels or pairwise constraints into classical clustering methods to obtain better quality clustering result. While many literature publications made great effort to develop novel and efficient semi-supervised clustering variants, the impact of imbalanced constraint set and noisy constraint set has not been fully explored. In this article, we simulate the realistic settings where the input is noisy, that means, the constraint sets are skewed or contain noisy constraints. We analyze the robustness and accuracy of six state-of-the-art semi-supervised clustering algorithms, and highlight the scenarios in which each approach is more suitable for. The experimental results on prominent UCI benchmark datasets demonstrate that most semi-supervised clustering approaches benefit more from must-link constraints than from cannot-link constraints. Moreover, pure cannot-link constraint set sometimes leads to a decrease in performance. We also find that semi-supervised clustering approaches do not have good robustness properties against noisy constraints, especially noisy must-link constraints.
Keywords:
machine learning
; data mining and knowledge discovery
; semi-supervised clustering
; imbalanced constraints
; experimental study
; noisy input
; robustness analysis
1. Introduction
Clustering methods aim at grouping data into homogeneous groups such that instances in the same group are more similar to each other than to those in other groups [1,2]. As unsupervised learning approaches, clustering is often used to analyze datasets that lack any supervisory information [3]. However, in practice, some prior knowledge may be available about the underlying data space clustering properties, such as a few numbers of instance labels or a set of constraints, for instance. In order to take advantage of the available supervisory information and extract relevant information for the user, recent research work focused on semi-supervised clustering, also called constrained clustering, which uses prior knowledge to guide the clustering process [4,5].
Different types of prior knowledge and semi-supervised clustering approaches are considered in the literature. The most widely used type of constraint is the instance-level must-link and cannot-link constraints [6]. A must-link constraint implies that two instances should be assigned to the same group. On the other hand, a cannot-link constraint enforces that two instances cannot be placed in the same group. Many semi-supervised clustering approaches have been developed based on must-link and cannot-link constraints. Most of them extend classical clustering algorithms, such as the K-means algorithm, to a constrained version [6,7,8,9,10,11]. Some other methods focus on using the must-link and cannot-link constraints to infer new data grouping metrics [12,13,14,15] or model the problem using a declarative framework [16,17,18,19]. There are also methods that integrate constraints into a collaborative process [20] or an ensemble process [21,22,23,24] that involves several clustering algorithms. Recently, some studies have proposed making use of constraints in the deep clustering method [25,26].
Although many authors in the literature have made great efforts to develop novel and efficient semi-supervised clustering variants, the impact of noisy input on semi-supervised clustering algorithms has not been fully explored. Most research work assumes that the input, for example, the number k of clusters and constraint sets, is accurate. The input set of constraints is usually generated based on the ground-truth labeling of instances and is always balanced in terms of cannot-link and must-link constraints. The situation where noisy constraints exist and the distribution of constraints is extremely biased, which is more realistic for operational applications, is barely considered. Among the few articles dealing with this topic, [9] analyzes the complexity of their semi-supervised clustering approach in the case that the constraint set is skewed. [27] points out the impact of the constraint set on performance, proving that some constraint sets can actually decrease algorithm accuracy, and leads to further work that focuses on how to select the informative and/or "easy" constraint sets [28]. Few publications discuss the impact of noisy constraints, among which we can cite [29,30,31], and the impact of an incorrect number k of clusters [31]. In addition, [32] and [33] report the behavior of semi-supervised clustering algorithms in the presence of erroneous constraints.
In this paper, we simulate practical settings where the input is noisy, which means that the constraint sets are skewed or contain noisy constraints. We analyze the robustness and accuracy of semi-supervised clustering algorithms and highlight the scenarios in which each approach is more suitable. The remainder of the paper is organized as follows. Section 2 introduces state-of-the-art semi-supervised clustering approaches that are utilized in the article. In Section 3, we present the datasets, noisy constraint generation strategy, and experiment design. Section 4 reports the experimental results and their analysis. Section 5 concludes the article with the essential findings of the study.
2. Semi-Supervised Clustering Approaches
In this section, we present the six state-of-the-art semi-supervised clustering algorithms used in the experiments. These include the COP-Kmeans [6], PC-Kmeans and MPC-Kmeans [8] variants of K-means that integrate constraints in the classical K-means algorithm, and the RCA [34], MMC [12] and ITML [14] metric learning methods that use constraints to learn distance functions.
2.1. Constrained K-Means
Constrained K-means clustering (COP-Kmeans) was proposed in [6] and is one of the most famous constrained clustering algorithms. The idea is to ensure that none of the constraints is violated. A data point, i.e., instance, i is assigned directly to a cluster if the cluster contains a data point that has a must-link constraint with i. Otherwise, i will be assigned to the cluster with the closest centroid, excluding those clusters containing a data point that has a cannot-link constraint with i. If a legal cluster cannot be found, then an empty partition is returned.
COP-Kmeans is a simple and efficient approach. However, as COP-Kmeans enforces that every single constraint must be satisfied, a noisy constraint will definitely lead to noisy output. COP-Kmeans can also be sensitive to data point assignment order. Once a data point is assigned to a cluster, all the other data points that have must-link with it will be assigned to the same cluster. Thus, a different assignment order may end up in completely different clustering results for those data points. COP-Kmeans may return an empty partition when a data point cannot be assigned to any cluster due to having a cannot-link constraint with data points in each cluster, meaning that the instance is excluded.
2.2. Pairwise Constrained K-Means and Metric Pairwise Constrained K-Means
Based on the idea of using constraints in the K-means algorithm, [8] proposed Pairwise Constrained K-means (PC-Kmeans) and Metric Pairwise Constrained K-means (MPC-Kmeans). PC-Kmeans utilizes constraints to seed initial clusters and directs the cluster assignments to respect these constraints. The connected components, which consist of points connected by must-link constraints, are taken as initial cluster centroids. The objective function is formulated as the sum of the total squared distances between data points and their cluster centroids, and the penalty incurred by violating any constraints. During the cluster assignment step, a data point will be assigned to the cluster centroid that minimizes the objective function.
MPC-Kmeans involves both cluster initialization, cluster assignment, and metric learning in a unified framework. The definition of the objective function and cluster initialization are the same as in PC-Kmeans. Moreover, the distance metric is adapted by re-estimating the weight matrices during each iteration based on the current cluster assignments and constraint violations.
PC-Kmeans and MPC-Kmeans never return empty partitions as COP-Kmeans. But, as variants of the K-means algorithm, they can be order sensitive as well. The complexity of MPC-Kmeans is critical [33] as MPC-Kmeans updates the weight matrices during each iteration of the clustering process.
2.3. Relevant Components Analysis
Relevant Components Analysis (RCA) [34] is one of the earliest methods that integrates constraints in metric learning. It makes use of "chunklet", which is essentially a connected component, to compute a global linear transformation to assign large weights to relevant dimensions and low weights to irrelevant dimensions [35]. This transformation is based on chunklet information only and does not use any cannot-link constraints.
2.4. Mahalanobis Metric for Clustering
Mahalanobis Metric for Clustering (MMC) [12] aims to minimize the sum of Mahalanobis distances between data points linked by must-link constraints, and at the same time enforce the distances between data points linked by cannot-link constraints to be greater than a constant (often set to 1). This distance metric is trained using convex optimization, and thus the training process is free from local optimization.
Although MMC is efficient, the computation of eigenvalues during the metric learning step can sometimes be time-consuming. Another restriction is its idealistic assumption that all clusters follow an unimodal distribution. In addition, MMC has been reported to have some uncertainty about the optimality of the final solution. Indeed, the MMC gradient-based algorithm proposed needs the adjustment of several parameters and is not guaranteed to find the optimum solution without such an adjustment [13].
2.5. Information-Theoretic Metric Learning
Similar to MMC, the Information-Theoretic Metric Learning (ITML) approach [14] aims to learn an optimal Mahalanobis distance subject to constraints. It bijects the Mahalanobis distance to an equal mean multivariate Gaussian distribution. In this way, the problem is translated into minimizing the differential relative entropy, also known as the Kullback-Leibler divergence, between two multivariate Gaussian distributions under constraints on the distance function. The problem is then expressed as a particular Bregman optimization problem by minimizing the LogDet divergence subject to linear constraints.
Unlike some other metric learning methods, in ITML, no eigenvalue computation or semi-definite programming is required. It can also handle a wide variety of constraints and can optionally incorporate prior knowledge on the distance function. However, a simple bijection between the Mahalanobis distance and the equal-mean multivariate Gaussian distribution oversimplifies the underlying metric structure. In practice, there will frequently be no feasible solution to the general ITML problem, particularly when the number of constraints is large, as reported in [36].
3. Experimental Setting
The prominent Iris, Wine and Seeds UCI benchmark datasets [37] and Cassini synthetic two-dimensional benchmark dataset [38] are used in the experiments. The main characteristics of these datasets are presented in Table 1. A central reason for selecting these datasets is that the distribution of their classes is balanced. Indeed, the existence of a minority class can result in a mismatch between the number of classes and the real number of clusters in the dataset, leading to confusion about the choice of the number of clusters extracted, that is, parameter k, for semi-supervised clustering approaches. This feature ensures that only the impact of the properties of the set of constraints is reflected in the results.
The six semi-supervised clustering approaches presented in Section 2 are used for the experiments. Implementations of these semi-supervised clustering approaches are available in the active-semi-supervised-clustering [39] and metric-learn [40] Python packages. These approaches require an input number of clusters k as a parameter, for which the number of classes is given. The semi-supervised clustering results are evaluated using the standard NMI index score [41].
4. Experimental Results
The experimental results regarding the impact of noisy input on the performance of semi-supervised clustering approaches are reported in this section. Section 4.1 tackles the problem of imbalanced constraint sets in terms of the number of cannot-link and must-link constraints. In Section 4.2, we address the problem of noisy cannot-link and must-link constraints in the constraint sets. Section 4.3 makes use of the Cassini benchmark dataset to visualize and analyze the impact of different constraint sets on the results of semi-supervised clustering approaches.
4.1. Impact of Imbalanced Constraint Sets
During this experiment, we analyze the impact of extremely imbalanced constraint sets on semi-supervised clustering approaches. The number of constraints ranges from 0 to 210. For each number of constraints, 30 different sets of constraints were generated to obtain repeated trials. The generated constraint set may contain 50% must-link constraints and 50% cannot-link constraints, only must-link constraints, or only cannot-link constraints, to separately investigate their impact on performance.
The results of COP-Kmeans, PC-Kmeans, MPC-Kmeans, RCA, MMC and ITML are presented in Figure 1 for the Iris dataset, in Figure 2 for the Wine dataset, and in Figure 3 for the Seeds dataset. The horizontal axis shows the number of total pairwise constraints used during the run and the vertical axis shows the average NMI index score of the output clustering solution over all trials for each approach. The vertical axis is normalized to the [0.0,1.0] range for all figures. The blue curve corresponds to the result of unsupervised clustering in which no constraint is used, with the input parameter k set to the number of classes. The orange curve corresponds to the NMI index score of each approach in the case where the number of must-link constraints is equal to the number of cannot-link constraints. The green curve and red curve respectively represent the NMI evaluation of each approach in the situation where the constraint set contains only must-link constraints or cannot-link constraints. The red curve is not illustrated for the RCA approach because this approach does not use any cannot-link constraints.
For the Wine and Seeds datasets, the MMC approach does not find the optimal final solution, proving the statement in [13] that the MMC approach needs the adjustment of several parameters and is not guaranteed to find the optimum without such adjustment. The ITML approach fails to find a feasible solution for the Iris dataset when the number of constraints is large, as presented by the green curve. This corresponds to the report in [36], arguing that there will often be no feasible solution to the general ITML problem in practice, particularly when the number of constraints is large.
Comparing the blue curve with the orange, green and red curves, we can clearly see the negative effect issue. This issue relates to the use of pairwise constraints as supervised information in the clustering process that sometimes leads to worse performance than using no constraint, which commonly occurs in semi-supervised clustering approaches, especially when the number of constraints is small. Overall, the semi-supervised clustering approaches benefit more from must-link constraints than cannot-link constraints. A pure cannot-link constraint set, as demonstrated by the red curve, sometimes leads to a decrease in performance, especially for metric learning methods MPC-Kmeans, MMC and ITML. In contrast, must-link constraints have a significant positive impact on performance. Most approaches achieve their best performance with only a set of must-link constraints, as illustrated by the green curve. The COP-KMeans, ITML and MMC approaches are shown to have the ability of making use of cannot-link constraints, since their orange curve has better performance than the green curve.
The metric learning methods RCA, MMC and ITML converge faster than the COP-Kmeans, PC-Kmeans and MPC-Kmeans K-means variants, as the curves quickly reach peak performance when the size of the constraint set is small. The performance then remains stable, even as the number of constraints increases. However, K-means variants, especially MPC-Kmeans seem to have a higher NMI index score when the number of constraints is large enough.
Among all metric learning methods, the RCA approach generally has the best performance, even if only must-link constraints are used. MPC-Kmeans has the highest NMI index score compared to other K-means variants.
4.2. Impact of Noisy Constraint Sets
In this experiment, the impact of noisy constraints on semi-supervised clustering approaches is analyzed. The number of total pairwise constraints is fixed to 100, including 50 must-link constraints and 50 cannot-link constraints. This guarantees that the semi-supervised clustering approaches have sufficient supervised information to generate an initial clustering solution. The number of noisy constraints ranges from 0 to 20. For each number of noisy constraints, 30 different sets of constraints were generated to obtain repeated trials. The generated noisy constraints may exist equally in must-link constraints and cannot-link constraints, or only in must-link constraints, or only in cannot-link constraints.
The results of COP-Kmeans, PC-Kmeans, MPC-Kmeans, RCA, MMC and ITML are presented in Figure 4 for the Iris dataset, in Figure 5 for the Wine dataset, and in Figure 6 for the Seeds dataset. The horizontal axis shows the number of total noisy constraints used during the run, and the vertical axis shows the average NMI index score of the output clustering solution over all trials for each approach. The vertical axis is normalized to the [0.0,1.0] range for all plots. The blue curve corresponds to the NMI index score of each approach in the case where the number of noisy must-link constraints is equal to the number of noisy cannot-link constraints. The orange and green curves, respectively, represent the NMI evaluation of each approach in the situation where noisy constraints exist only within must-link constraints or only within cannot-link constraints.
According to the analysis in the previous experiment, semi-supervised clustering approaches benefit more from must-link constraints. This finding is confirmed in this experiment, as we can observe from the orange curve, since there is an important decrease in performance when noise exists in must-link constraints.
The MMC approach and the ITML approach have better robustness against noise in cannot-link constraints, as illustrated by the green curve. In addition, for all other approaches, we can conclude by comparing the starting point and the end point of the curves that noisy constraints usually lead to a significant drop in performance. This illustrates the weakness of these approaches in stability, especially when noisy constraints exist among must-link constraints. The good robustness of the MMC approach and the PC-Kmeans approach on the Wine and Seeds datasets actually comes from the fact that the performance of the clustering solutions without noisy constraints is subpar. Therefore, noisy constraints do not result in worse performance.
4.3. Visualization and Explanation
This experiment makes use of the Cassini two-dimensional benchmark dataset. This popular dataset consists of three groups of 50 instances: Two banana-shaped groups, that is, non-convex clusters, bending around a circular cluster in the middle [42]. The presence of the two banana-shaped groups makes it impossible to discover three clusters using the unsupervised K-means algorithm, as it only generates convex clusters. We use the Cassini dataset to visualize and analyze the impact of different must-link and cannot-link constraint sets for each of the COP-Kmeans, PC-Kmeans, MPC-Kmeans, RCA, MMC and ITML semi-supervised clustering approaches.
We selected four different sets of constraints to evaluate their impact and compare the final clustering result of each semi-supervised clustering approach. The first one is a randomly selected small set of constraints, with three must-link constraints and three cannot-link constraints that were randomly selected. The second is a representative small set of constraints, where three representative must-link constraints and three cannot-link constraints were manually selected. The third is an imbalanced randomly selected large set of constraints, with thirty cannot-link constraints and three must-link constraints. The fourth is an imbalanced randomly selected large set of constraints, with three cannot-link constraints and thirty must-link constraints.
To visualize and analyze the impact of the four constraint sets, the pairwise constraints used and the output clustering solutions for the unsupervised K-means algorithm and the six semi-supervised clustering approaches are plotted in two-dimensional graphical representations. These graphical representations are shown in Figure 7 for the first set of constraints, in Figure 8 for the second set of constraints, in Figure 9 for the third set of constraints, and in Figure 10 for the fourth set of constraints. The cannot-link constraints used are represented by red lines and the must-link constraints used are represented by green lines. The color of each point indicates which of the three clusters the instance is assigned to in the output clustering solution.
When comparing the results for the first and the second constraint sets, metric learning approaches are highly affected if the constraint set does not express the cluster distribution effectively. The reason is that the metric learning approaches aim to learn an adapted metric based on constraints. With the representative small constraint set, the must-link constraints within the two banana-shaped clusters help the metric learning approaches to "shrink" the horizontal distance, and the cannot-link constraints allow for enlarging the vertical distance. Therefore, metric learning approaches achieve high clustering quality. However, based on the randomly selected small constraint set, the metric learning approaches adapt the metric to reduce the diagonal distance from the bottom left corner to the top right corner, where the data structure is not well reflected, and result in poor performance. This also implies the potential reason for the negative effect issue. As the metric learning approaches strongly rely on the representative must-link constraints, non-representative constraints in the small constraint set may cause these approaches to fall into a local optima and give worse performance than using no constraints. On the other hand, the K-means variants integrate constraints to improve the clustering process of K-means. Thus, the quality of constraint sets has less influence on their performance than on metric learning approaches. They also have fewer negative effect issues.
As we can see from the result for the third constraint set, increasing the size of cannot-link constraints does not help much in improving the performance. With the same randomly selected must-link constraints as in the first constraint set, even when the number of cannot-link constraints is increased to thirty, the semi-supervised clustering approaches still fail to give good performance. In contrast, when the number of must-link constraints increases, the performance of all approaches is significantly improved. This confirms the finding outlined in Section 4.1 that must-link constraints have an effective positive impact on performance. A presumed reason for this is that, as the number of must-link constraints increases, the probability that representative must-link constraints are included in the constraint set also increases.
5. Conclusion
In this paper, we analyze the impact of imbalanced constraint sets and noisy constraint sets on six state-of-the-art semi-supervised clustering approaches. The results of experiments conducted on the prominent Iris, Seeds, and Wine UCI benchmark datasets and the visualizations based on the representative Cassini benchmark dataset have led to the following principal conclusions. The metric learning semi-supervised clustering approaches converge faster than K-means variants semi-supervised clustering approaches. However, K-means variants can achieve better performance when the number of constraints is large enough. Most semi-supervised clustering approaches benefit more from must-link constraints than from cannot-link constraints. Therefore, the must-link constraints have a significant positive impact on performance. In contrast, a pure cannot-link constraint set sometimes leads to a decrease in performance. Most semi-supervised clustering approaches do not have good robustness against noisy constraints, especially noisy must-link constraints. These findings clearly demonstrate that the quality and distribution of cannot-link and must-link constraints in the constraint set are essential for obtaining relevant results with semi-supervised clustering approaches.
Author Contributions
Conceptualization, T.Y. and N.P.; methodology, T.Y. and N.P.; software, T.Y.; validation, N.P.; formal analysis, T.Y. and N.P.; investigation, T.Y. and N.P.; resources, T.Y. and N.P.; writing—original draft preparation, T.Y. and N.P.; writing—review and editing, N.P.; visualization, T.Y. and N.P.; supervision, N.P.; All authors have read and agreed to the published version of the manuscript.
Funding
This research received no external funding.
Institutional Review Board Statement
Not applicable.
Informed Consent Statement
Not applicable.
Data Availability Statement
All datasets used are referred to in the paper.
Conflicts of Interest
The authors declare no conflicts of interest.
Abbreviations
The following abbreviations are used in this manuscript:
| COP-Kmeans | Constrained K-means clustering |
| ITML | Information-Theoretic Metric Learning |
| MMC | Mahalanobis Metric for Clustering |
| MPC-Kmeans | Metric Pairwise Constrained K-means |
| NMI | Normalized Mutual Information |
| PC-Kmeans | Pairwise Constrained K-means |
| RCA | Relevant Components Analysis |
| UCI | University of California, Irvine |
References
- Xu, R.; Wunsch, D. Survey of clustering algorithms. IEEE Transactions on Neural Networks 2005, 16, 645–678. [Google Scholar] [CrossRef] [PubMed]
- Xu, D.; Tian, Y. A Comprehensive Survey of Clustering Algorithms. Annals of Data Science 2015, 2, 165–193. [Google Scholar] [CrossRef]
- Wagstaff, K.L. Value, Cost, and Sharing: Open Issues in Constrained Clustering. In Proceedings of the International Workshop on Knowledge Discovery in Inductive Databases. Springer International Publishing; 2006; pp. 1–10. [Google Scholar] [CrossRef]
- Dinler, D.; Tural, M.K. A survey of constrained clustering. In Unsupervised Learning Algorithms; Springer International Publishing, 2016; pp. 207–235. [CrossRef]
- Gançarski, P.; Crémilleux, B.; Forestier, G.; Lampert, T.; et al. Constrained clustering: Current and new trends. In A Guided Tour of Artificial Intelligence Research; Springer International Publishing, 2020; pp. 447–484. [CrossRef]
- Wagstaff, K.; Cardie, C.; Rogers, S.; Schroedl, S.; et al. Constrained K-means clustering with background knowledge. In Proceedings of the 18th International Conference on Machine Learning; Morgan Kaufmann Publishers Inc., 2001; Vol. 1, pp. 577–584. [Google Scholar] [CrossRef]
- Wagstaff, K.; Cardie, C. Clustering with instance-level constraints. In Proceedings of the 17th International Conference on Machine Learning. Morgan Kaufmann Publishers Inc. 2000; pp. 1103–1110. [Google Scholar] [CrossRef]
- Bilenko, M.; Basu, S.; Mooney, R.J. Integrating constraints and metric learning in semi-supervised clustering. In Proceedings of the 21st International Conference on Machine learning. Association for Computing Machinery; 2004; p. 11. [Google Scholar] [CrossRef]
- Davidson, I.; Ravi, S. Clustering with constraints: Feasibility issues and the K-means algorithm. In Proceedings of the SIAM International Conference on Data Mining. SIAM; 2005; pp. 138–149. [Google Scholar] [CrossRef]
- Pelleg, D.; Baras, D. K-means with large and noisy constraint sets. In Proceedings of the European Conference on Machine Learning. Springer International Publishing; 2007; pp. 674–682. [Google Scholar] [CrossRef]
- Ganji, M.; Bailey, J.; Stuckey, P.J. Lagrangian constrained clustering. In Proceedings of the SIAM International Conference on Data Mining. SIAM; 2016; pp. 288–296. [Google Scholar] [CrossRef]
- Xing, E.P.; Ng, A.Y.; Jordan, M.I.; Russell, S. Distance metric learning, with application to clustering with side-information. In Proceedings of the 15th International Conference on Neural Information Processing Systems. MIT Press; 2002; pp. 521–528. [Google Scholar] [CrossRef]
- Bar-Hillel, A.; Hertz, T.; Shental, N.; Weinshall, D.; Ridgeway, G. Learning a Mahalanobis metric from equivalence constraints. Journal of Machine Learning Research 2005, 6, 937–965. [Google Scholar] [CrossRef]
- Davis, J.V.; Kulis, B.; Jain, P.; Sra, S.; Dhillon, I.S. Information-theoretic metric learning. In Proceedings of the 24th International Conference on Machine Learning. Association for Computing Machinery; 2007; pp. 209–216. [Google Scholar] [CrossRef]
- Qi, G.J.; Tang, J.; Zha, Z.J.; Chua, T.S.; Zhang, H.J. An efficient sparse metric learning in high-dimensional space via ℓ1-penalized log-determinant regularization. In Proceedings of the 26th International Conference on Machine Learning. Association for Computing Machinery; 2009; pp. 841–848. [Google Scholar] [CrossRef]
- Davidson, I.; Ravi, S.; Shamis, L. A SAT-based framework for efficient constrained clustering. In Proceedings of the SIAM International Conference on Data Mining. SIAM; 2010; pp. 94–105. [Google Scholar] [CrossRef]
- Guns, T.; Nijssen, S.; De Raedt, L. k-Pattern Set Mining under Constraints. IEEE Transactions on Knowledge and Data Engineering 2011, 25, 402–418. [Google Scholar] [CrossRef]
- Ouali, A.; Loudni, S.; Lebbah, Y.; Boizumault, P.; Zimmermann, A.; Loukil, L. Efficiently finding conceptual clustering models with integer linear programming. In Proceedings of the 25th International Joint Conferences on Artificial Intelligence. AAAI Press; 2016; pp. 647–654. [Google Scholar] [CrossRef]
- Gilpin, S.; Davidson, I. A flexible ILP formulation for hierarchical clustering. Artificial Intelligence 2017, 244, 95–109. [Google Scholar] [CrossRef]
- Forestier, G.; Gançarski, P.; Wemmert, C. Collaborative clustering with background knowledge. Data & Knowledge Engineering 2010, 69, 211–228. [Google Scholar] [CrossRef]
- Al-Razgan, M.; Domeniconi, C. Clustering ensembles with active constraints. In Applications of Supervised and Unsupervised Ensemble Methods; Springer International Publishing, 2009; pp. 175–189. [CrossRef]
- Iqbal, A.M.; Moh’d, A.; Khan, Z. Semi-supervised clustering ensemble by voting. arXiv preprint arXiv:1208.4138, arXiv:1208.4138 2012, pp. 1–5.
- Xiao, W.; Yang, Y.; Wang, H.; Li, T.; Xing, H. Semi-supervised hierarchical clustering ensemble and its application. Neurocomputing 2016, 173, 1362–1376. [Google Scholar] [CrossRef]
- Yang, T.; Pasquier, N.; Precioso, F. Semi-supervised consensus clustering based on closed patterns. Knowledge-Based Systems 2022, 235, 107599. [Google Scholar] [CrossRef]
- Ren, Y.; Hu, K.; Dai, X.; Pan, L.; Hoi, S.C.; Xu, Z. Semi-supervised deep embedded clustering. Neurocomputing 2019, 325, 121–130. [Google Scholar] [CrossRef]
- Zhang, H.; Zhan, T.; Basu, S.; Davidson, I. A framework for deep constrained clustering. Data Mining and Knowledge Discovery. [CrossRef]
- Davidson, I.; Wagstaff, K.L.; Basu, S. Measuring constraint-set utility for partitional clustering algorithms. In Proceedings of the European Conference on Principles of Data Mining and Knowledge Discovery. Springer International Publishing; 2006; pp. 115–126. [Google Scholar] [CrossRef]
- Davidson, I.; Ravi, S. Identifying and generating easy sets of constraints for clustering. In Proceedings of the 21st National Conference on Artificial Intelligence. AAAI Press, Vol. 1; 2006; pp. 336–341. [Google Scholar] [CrossRef]
- Coleman, T.; Saunderson, J.; Wirth, A. Spectral clustering with inconsistent advice. In Proceedings of the 25th International Conference on Machine Learning. Association for Computing Machinery; 2008; pp. 152–159. [Google Scholar] [CrossRef]
- Nelson, B.; Cohen, I. Revisiting probabilistic models for clustering with pair-wise constraints. In Proceedings of the 24th International Conference on Machine Learning. Association for Computing Machinery; 2007; pp. 673–680. [Google Scholar] [CrossRef]
- Zhang, H.; Basu, S.; Davidson, I. A framework for deep constrained clustering-algorithms and advances. In Proceedings of the Joint European Conference on Machine Learning and Knowledge Discovery in Databases. Springer International Publishing; 2019; p. 57. [Google Scholar] [CrossRef]
- Ares, M.E.; Parapar, J.; Barreiro, Á. An experimental study of constrained clustering effectiveness in presence of erroneous constraints. Information Processing & Management 2012, 48, 537–551. [Google Scholar] [CrossRef]
- Covoes, T.F.; Hruschka, E.R.; Ghosh, J. A study of K-means-based algorithms for constrained clustering. Intelligent Data Analysis 2013, 17, 485–505. [Google Scholar] [CrossRef]
- Shental, N.; Hertz, T.; Weinshall, D.; Pavel, M. Adjustment learning and relevant component analysis. In Proceedings of the European Conference on Computer Vision. Springer International Publishing; 2002; pp. 776–790. [Google Scholar] [CrossRef]
- Yang, L.; Jin, R. Distance Metric Learning: A Comprehensive Survey; Michigan State University, 2006; pp. 1–51.
- Kulis, B. Metric learning: A survey. Foundations and Trends in Machine Learning 2012, 5, 287–364. [Google Scholar] [CrossRef]
- Kelly, M.; Longjohn, R.; Nottingham, K. The UCI Machine Learning Repository. 2023. Available online: https://archive.ics.uci.edu (accessed on 19th September 2024).
- Leisch, F.; Dimitriadou, E. mlbench: Machine Learning Benchmark Problems. 2024.Rpackageversion2.1-5. 2020. Available online: https://CRAN.R-project.org/package=mlbench (accessed on 19th September 2024).
- Svehla, J. Active Semi-supervised Clustering. 2020. Available online: https://github.com/datamole-ai/active-semi-supervised-clustering (accessed on 19th September 2024).
- de Vazelhes, W.; Carey, C.J.; Tang, Y.; Vauquier, N.; Bellet, A. metric-learn: Metric Learning Algorithms in Python. Journal of Machine Learning Research 2020, 21, 1–6. [Google Scholar] [CrossRef]
- Kvålseth, T. On Normalized Mutual Information: Measure Derivations and Properties. Entropy 2017, 19, 631. [Google Scholar] [CrossRef]
- Wiwie, C.; Baumbach, J.; Röttger, R. Comparing the performance of biomedical clustering methods. Nature Methods 2015, 12, 1033–1038. [Google Scholar] [CrossRef]
Figure 1.
Performance of semi-supervised clustering approaches with imbalanced constraint sets for the Iris dataset. The horizontal axis shows the number of pairwise constraints used during the run, and the vertical axis shows the NMI evaluation index value of the clustering solution generated.
Figure 1.
Performance of semi-supervised clustering approaches with imbalanced constraint sets for the Iris dataset. The horizontal axis shows the number of pairwise constraints used during the run, and the vertical axis shows the NMI evaluation index value of the clustering solution generated.
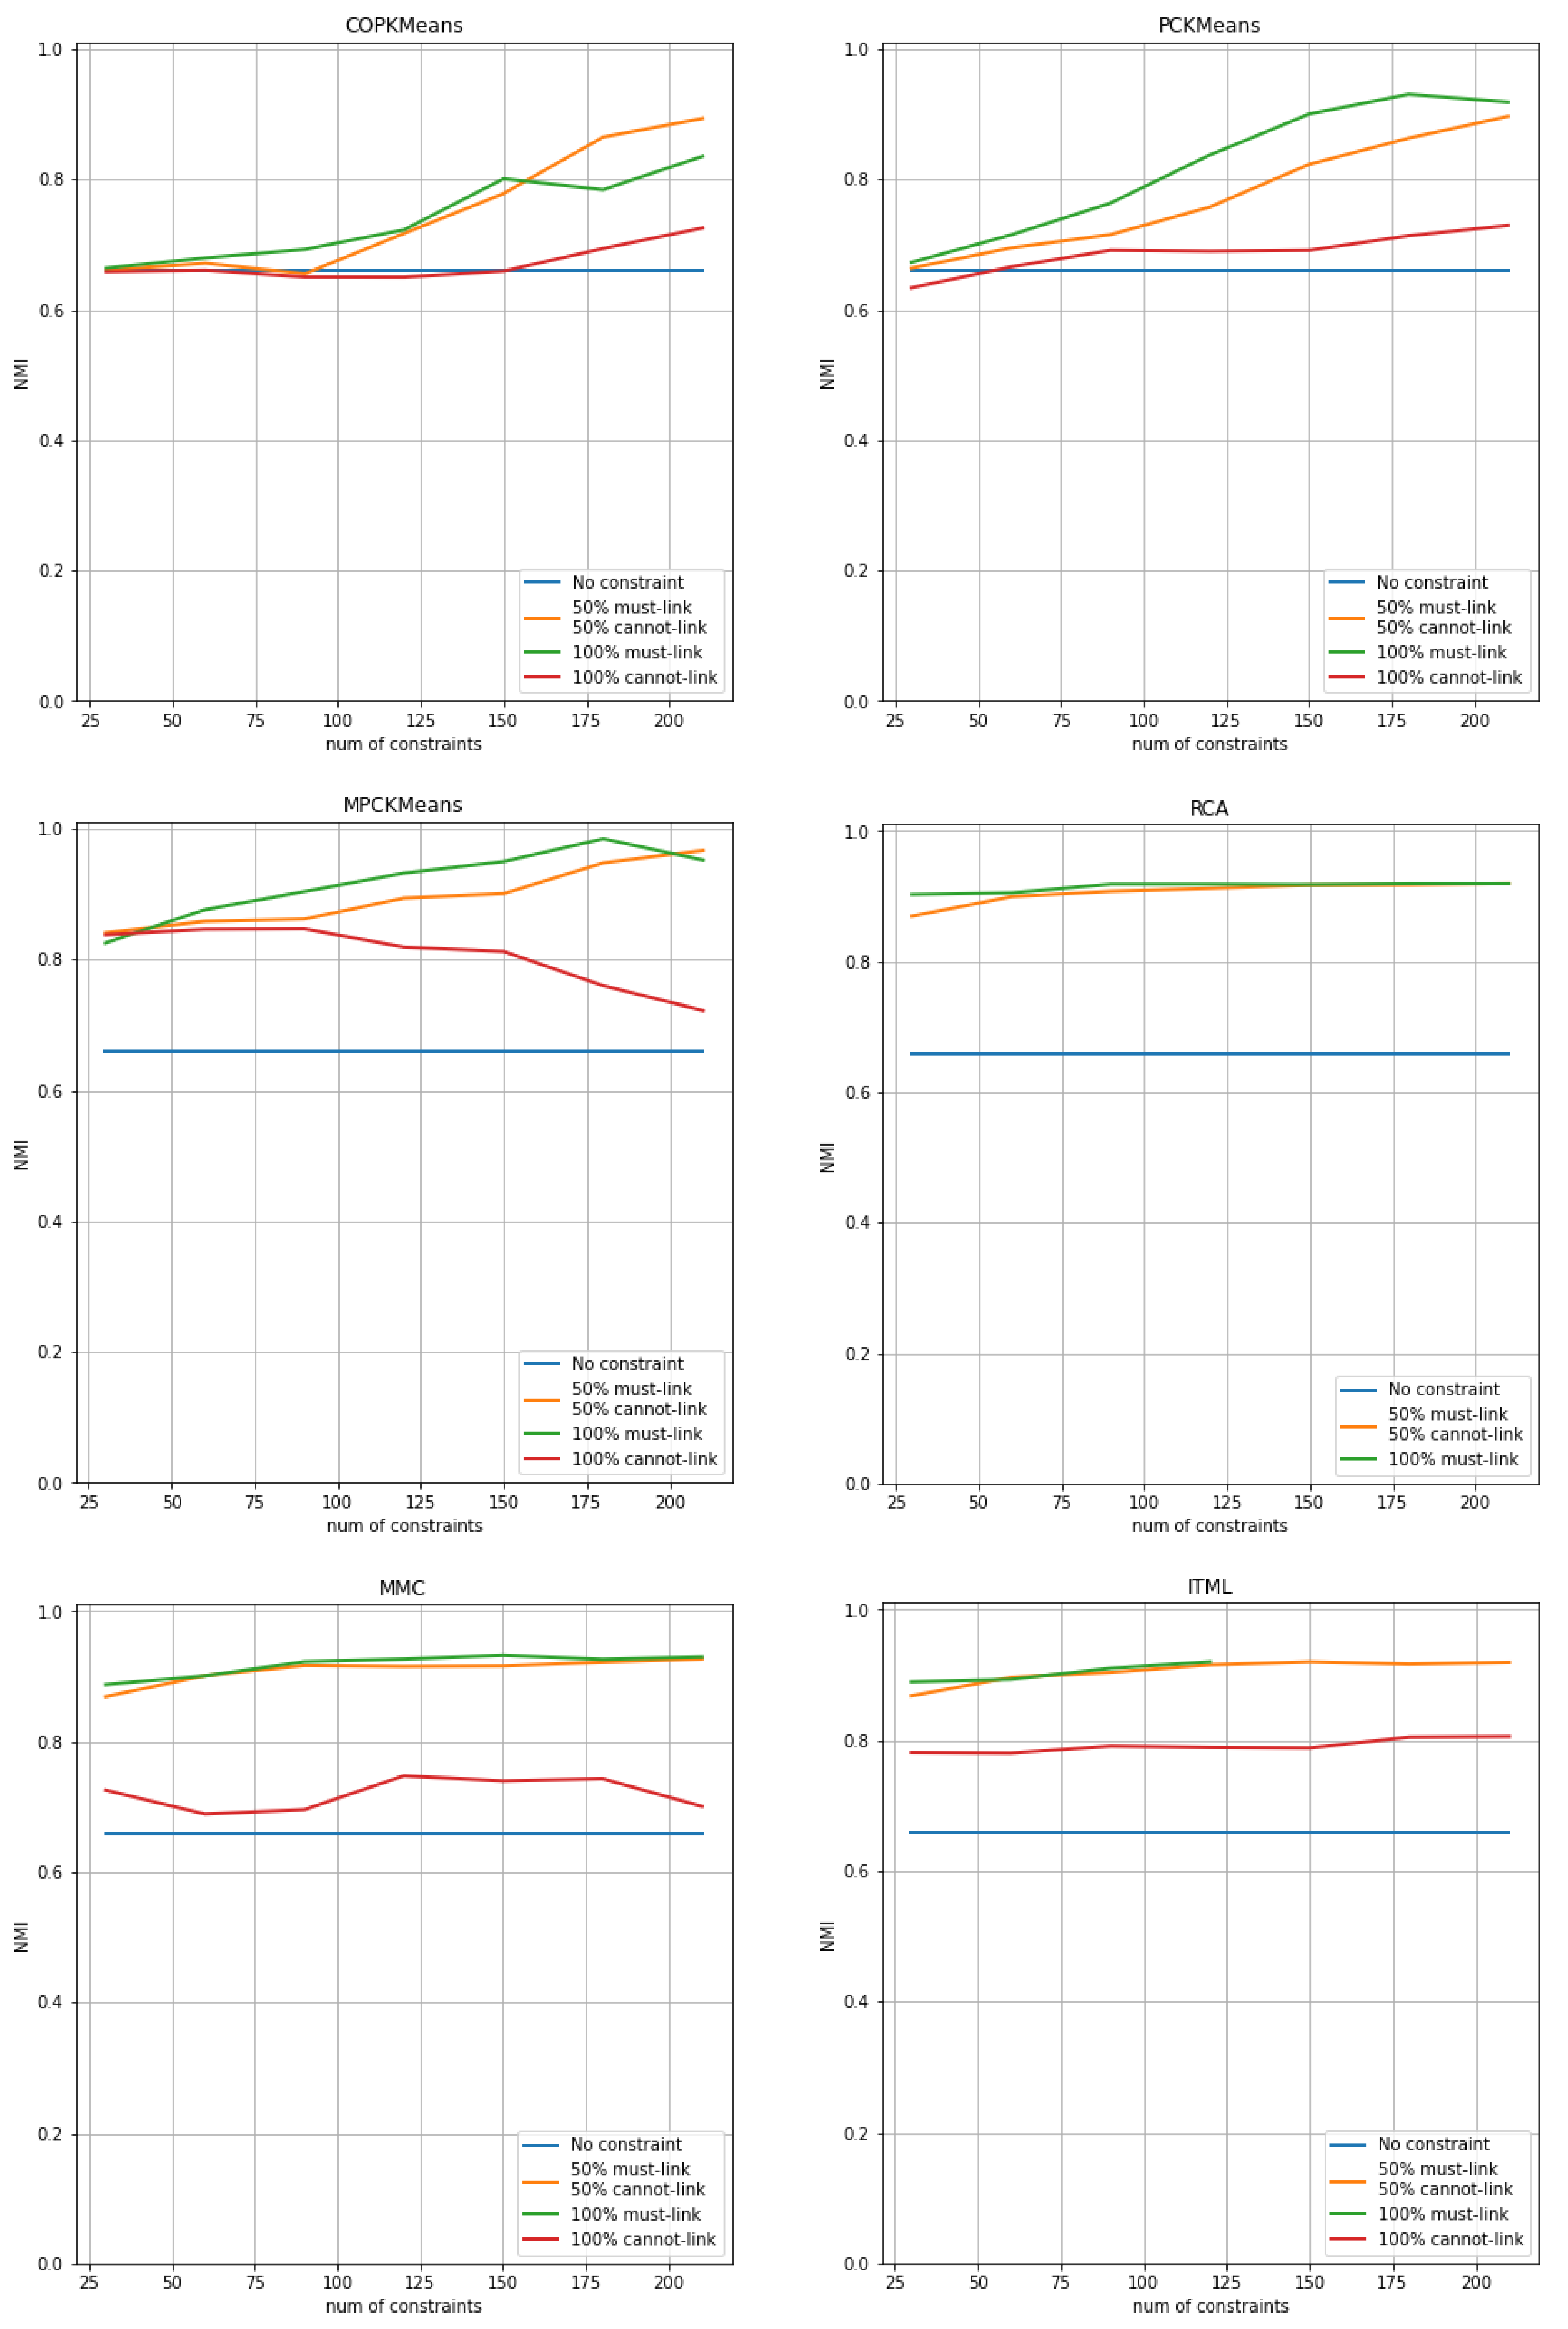
Figure 2.
Performance of semi-supervised clustering approaches with imbalanced constraint sets for the Wine dataset. The horizontal axis shows the number of pairwise constraints used during the run, and the vertical axis shows the NMI evaluation index value of the clustering solution generated.
Figure 2.
Performance of semi-supervised clustering approaches with imbalanced constraint sets for the Wine dataset. The horizontal axis shows the number of pairwise constraints used during the run, and the vertical axis shows the NMI evaluation index value of the clustering solution generated.
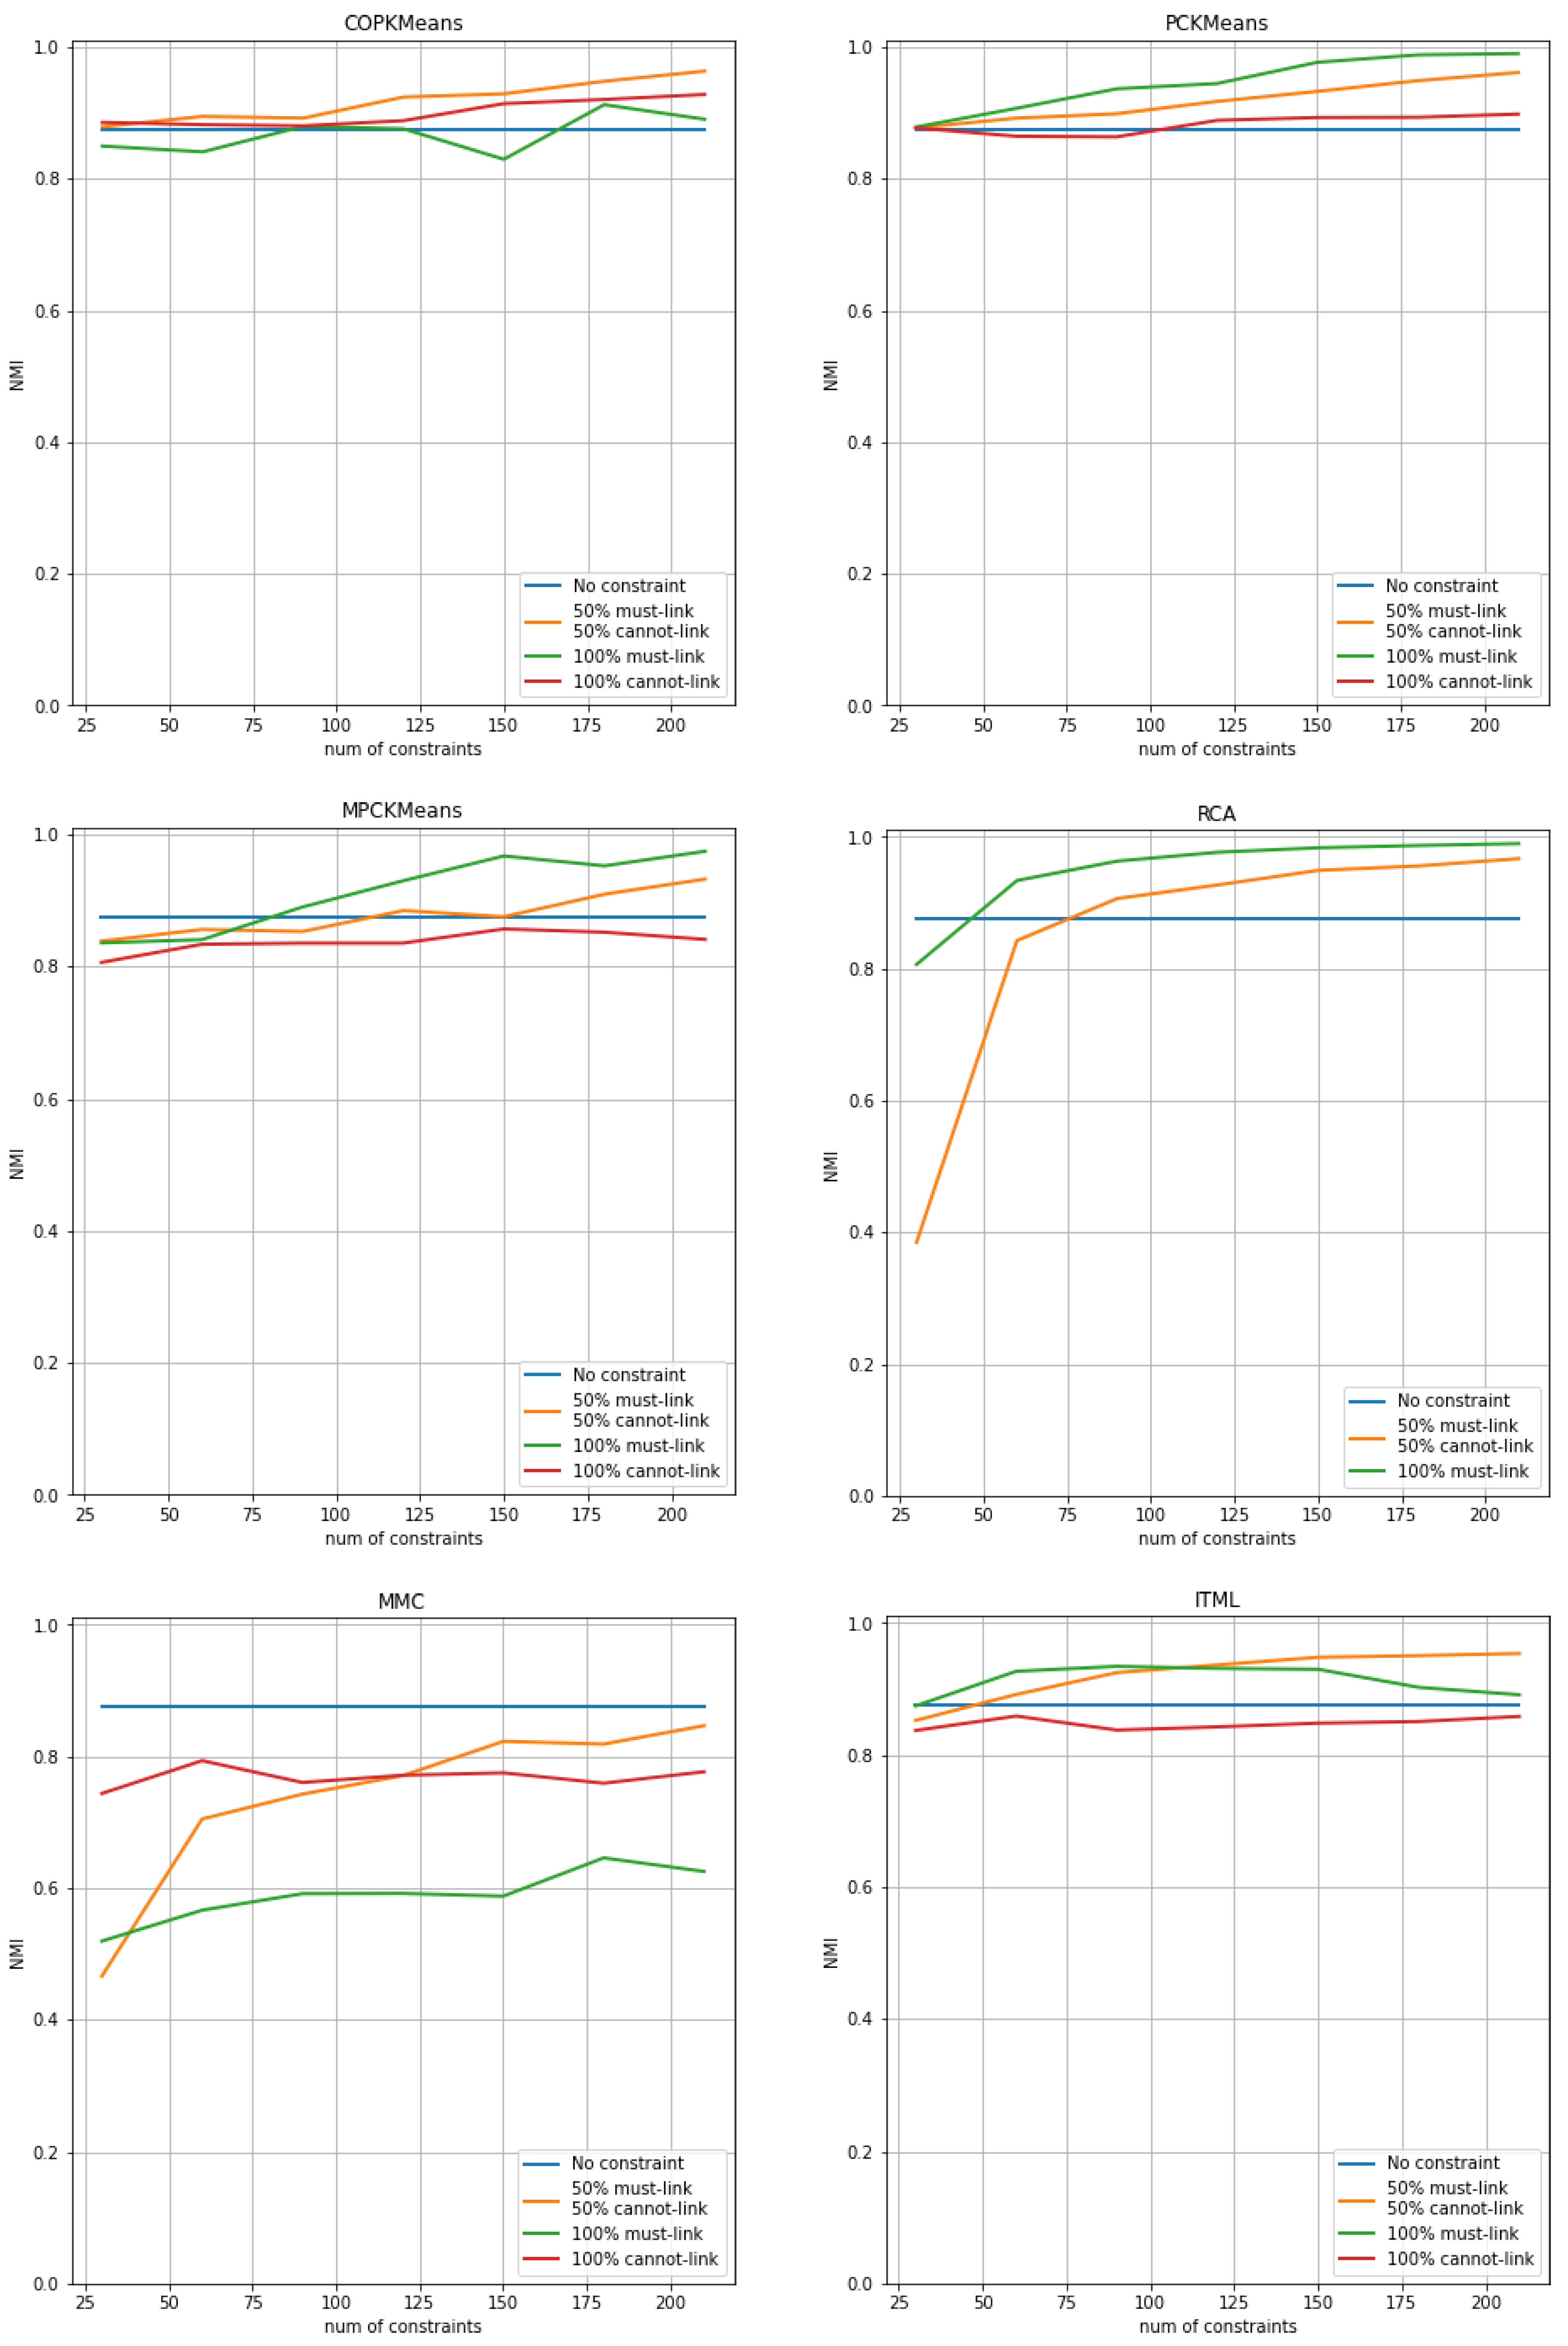
Figure 3.
Performance of semi-supervised clustering approaches with imbalanced constraint sets for the Seeds dataset. The horizontal axis shows the number of pairwise constraints used during the run, and the vertical axis shows the NMI evaluation index value of the clustering solution generated.
Figure 3.
Performance of semi-supervised clustering approaches with imbalanced constraint sets for the Seeds dataset. The horizontal axis shows the number of pairwise constraints used during the run, and the vertical axis shows the NMI evaluation index value of the clustering solution generated.
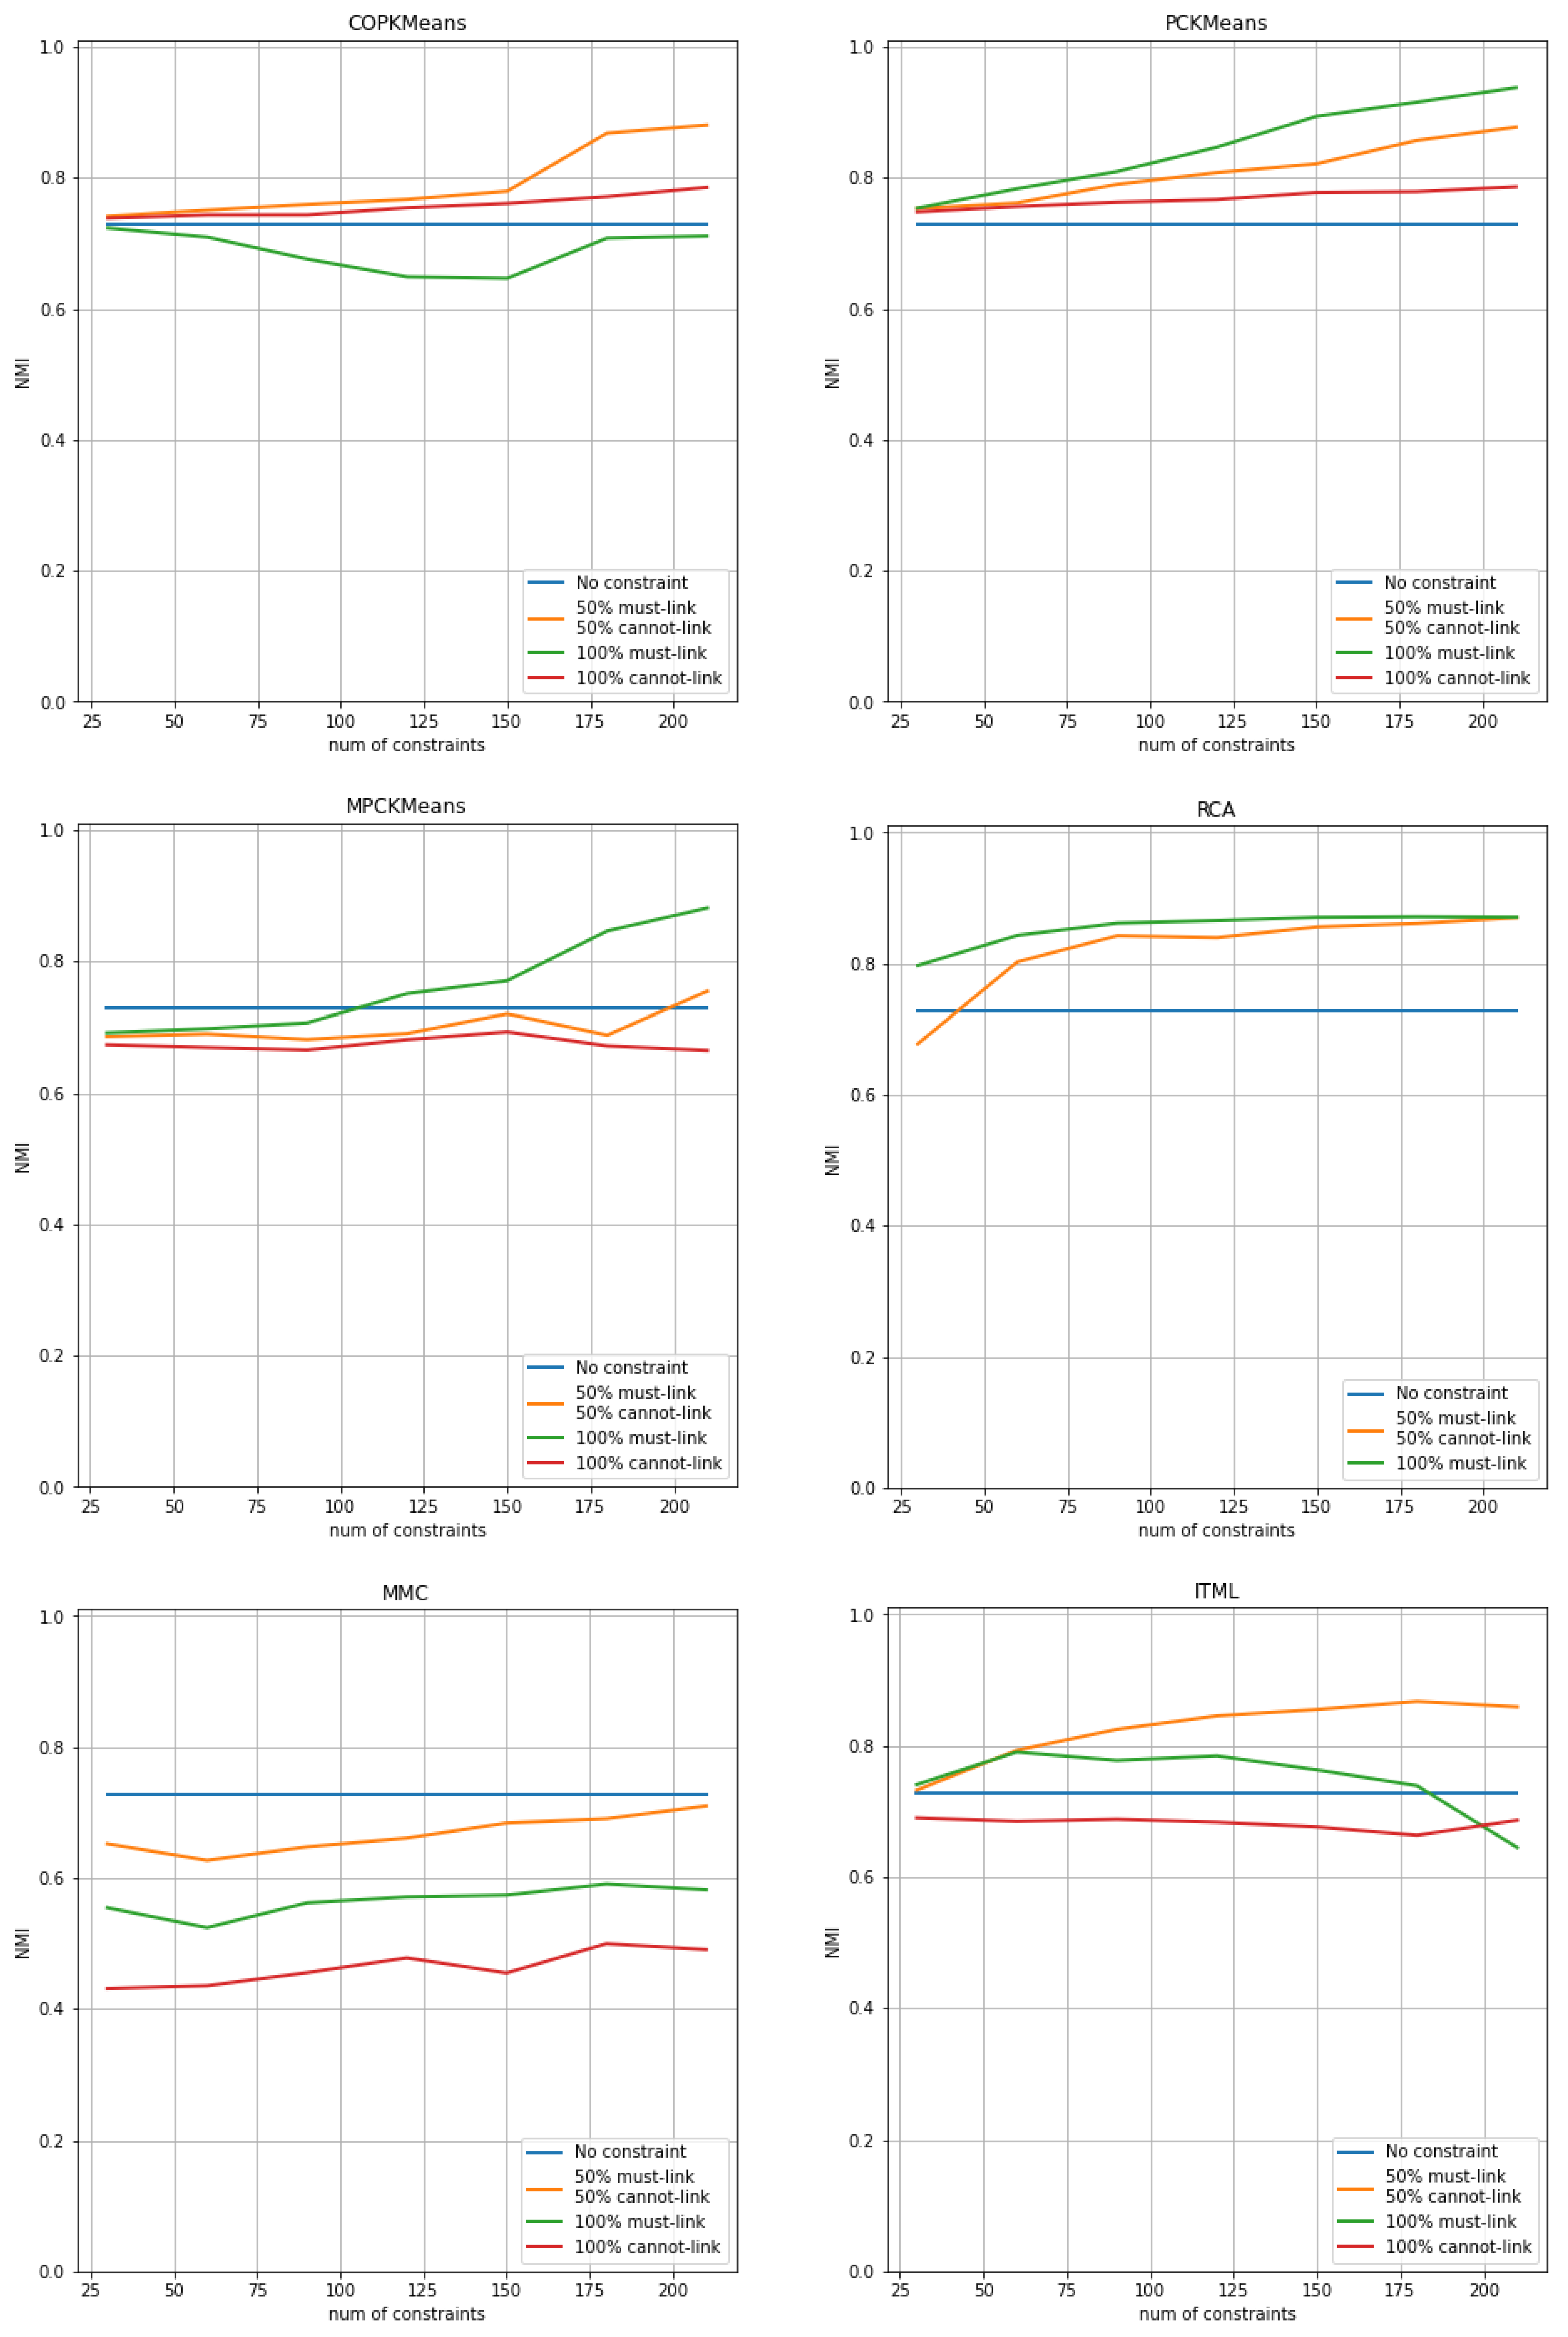
Figure 4.
Performance of semi-supervised clustering approaches with noisy constraint sets for the Iris dataset. The horizontal axis shows the number of total noisy constraints used during the run and the vertical axis shows the average NMI index score of the output clustering solution over all trials for each approach.
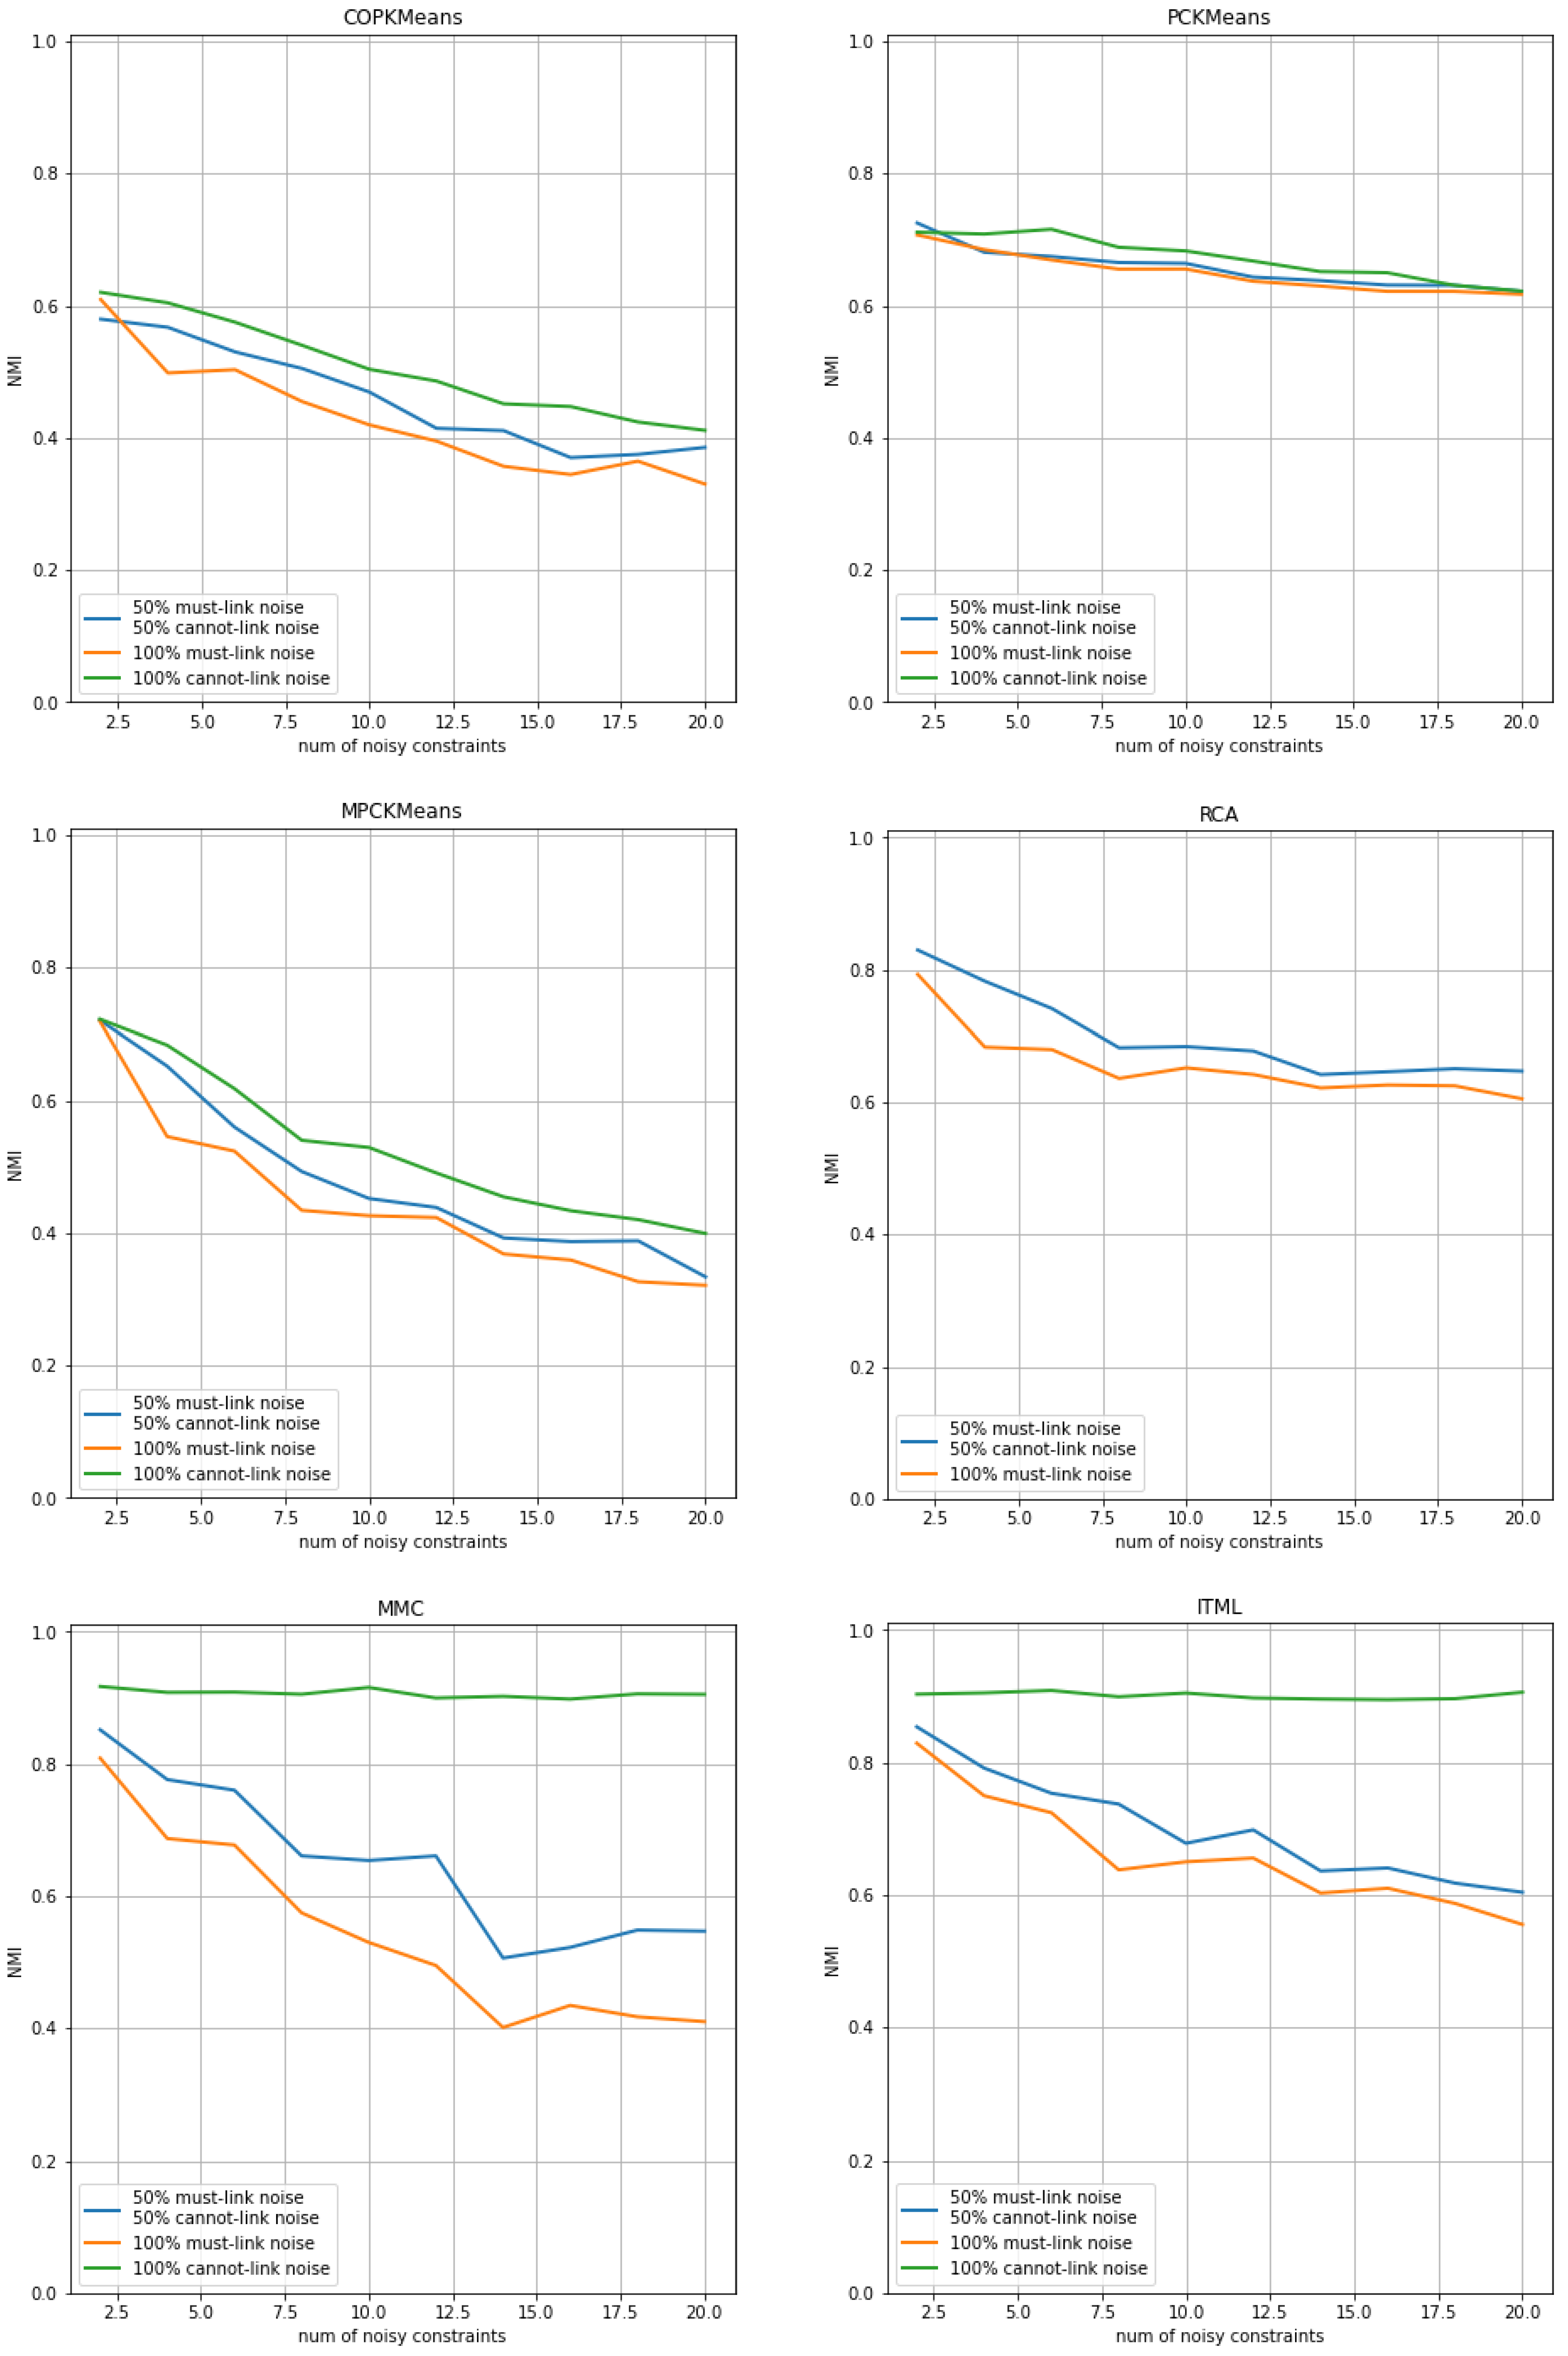
Figure 5.
Performance of semi-supervised clustering approaches with noisy constraint sets for the Wine dataset. The horizontal axis shows the number of total noisy constraints used during the run and the vertical axis shows the average NMI index score of the output clustering solution over all trials for each approach.
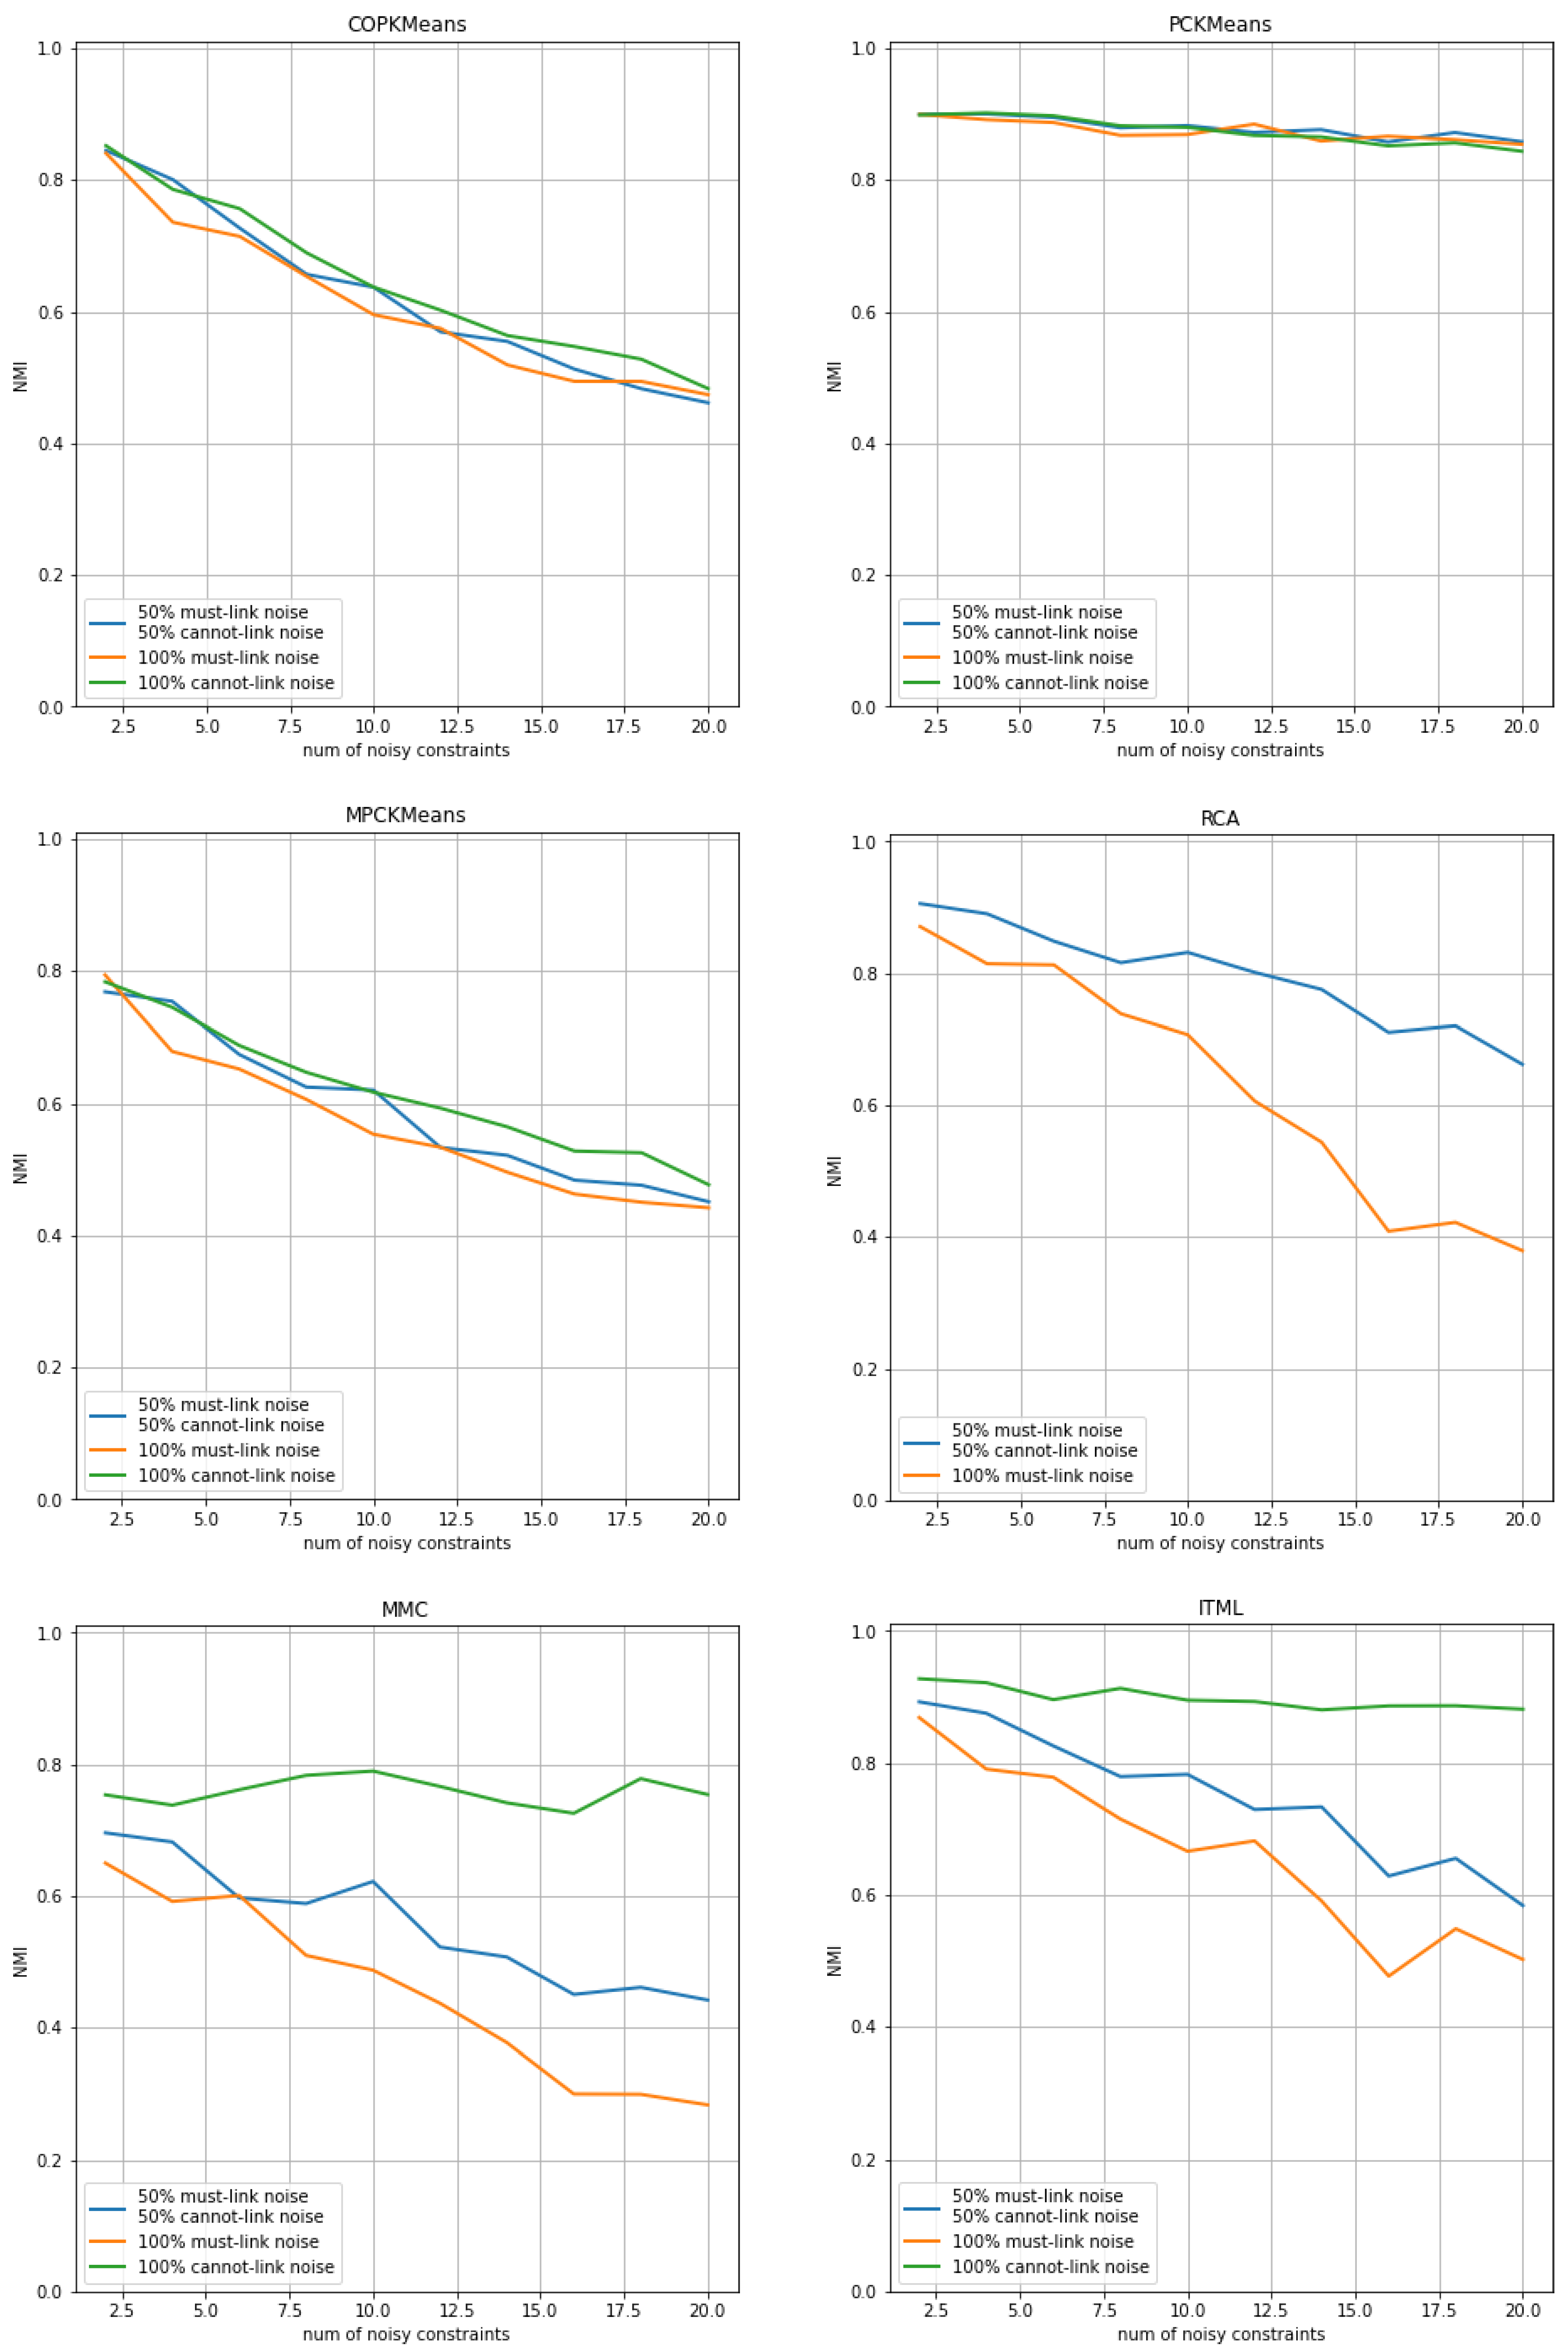
Figure 6.
Performance of semi-supervised clustering approaches with noisy constraint sets for the Seeds dataset. The horizontal axis shows the number of total noisy constraints used during the run and the vertical axis shows the average NMI index score of the output clustering solution over all trials for each approach.
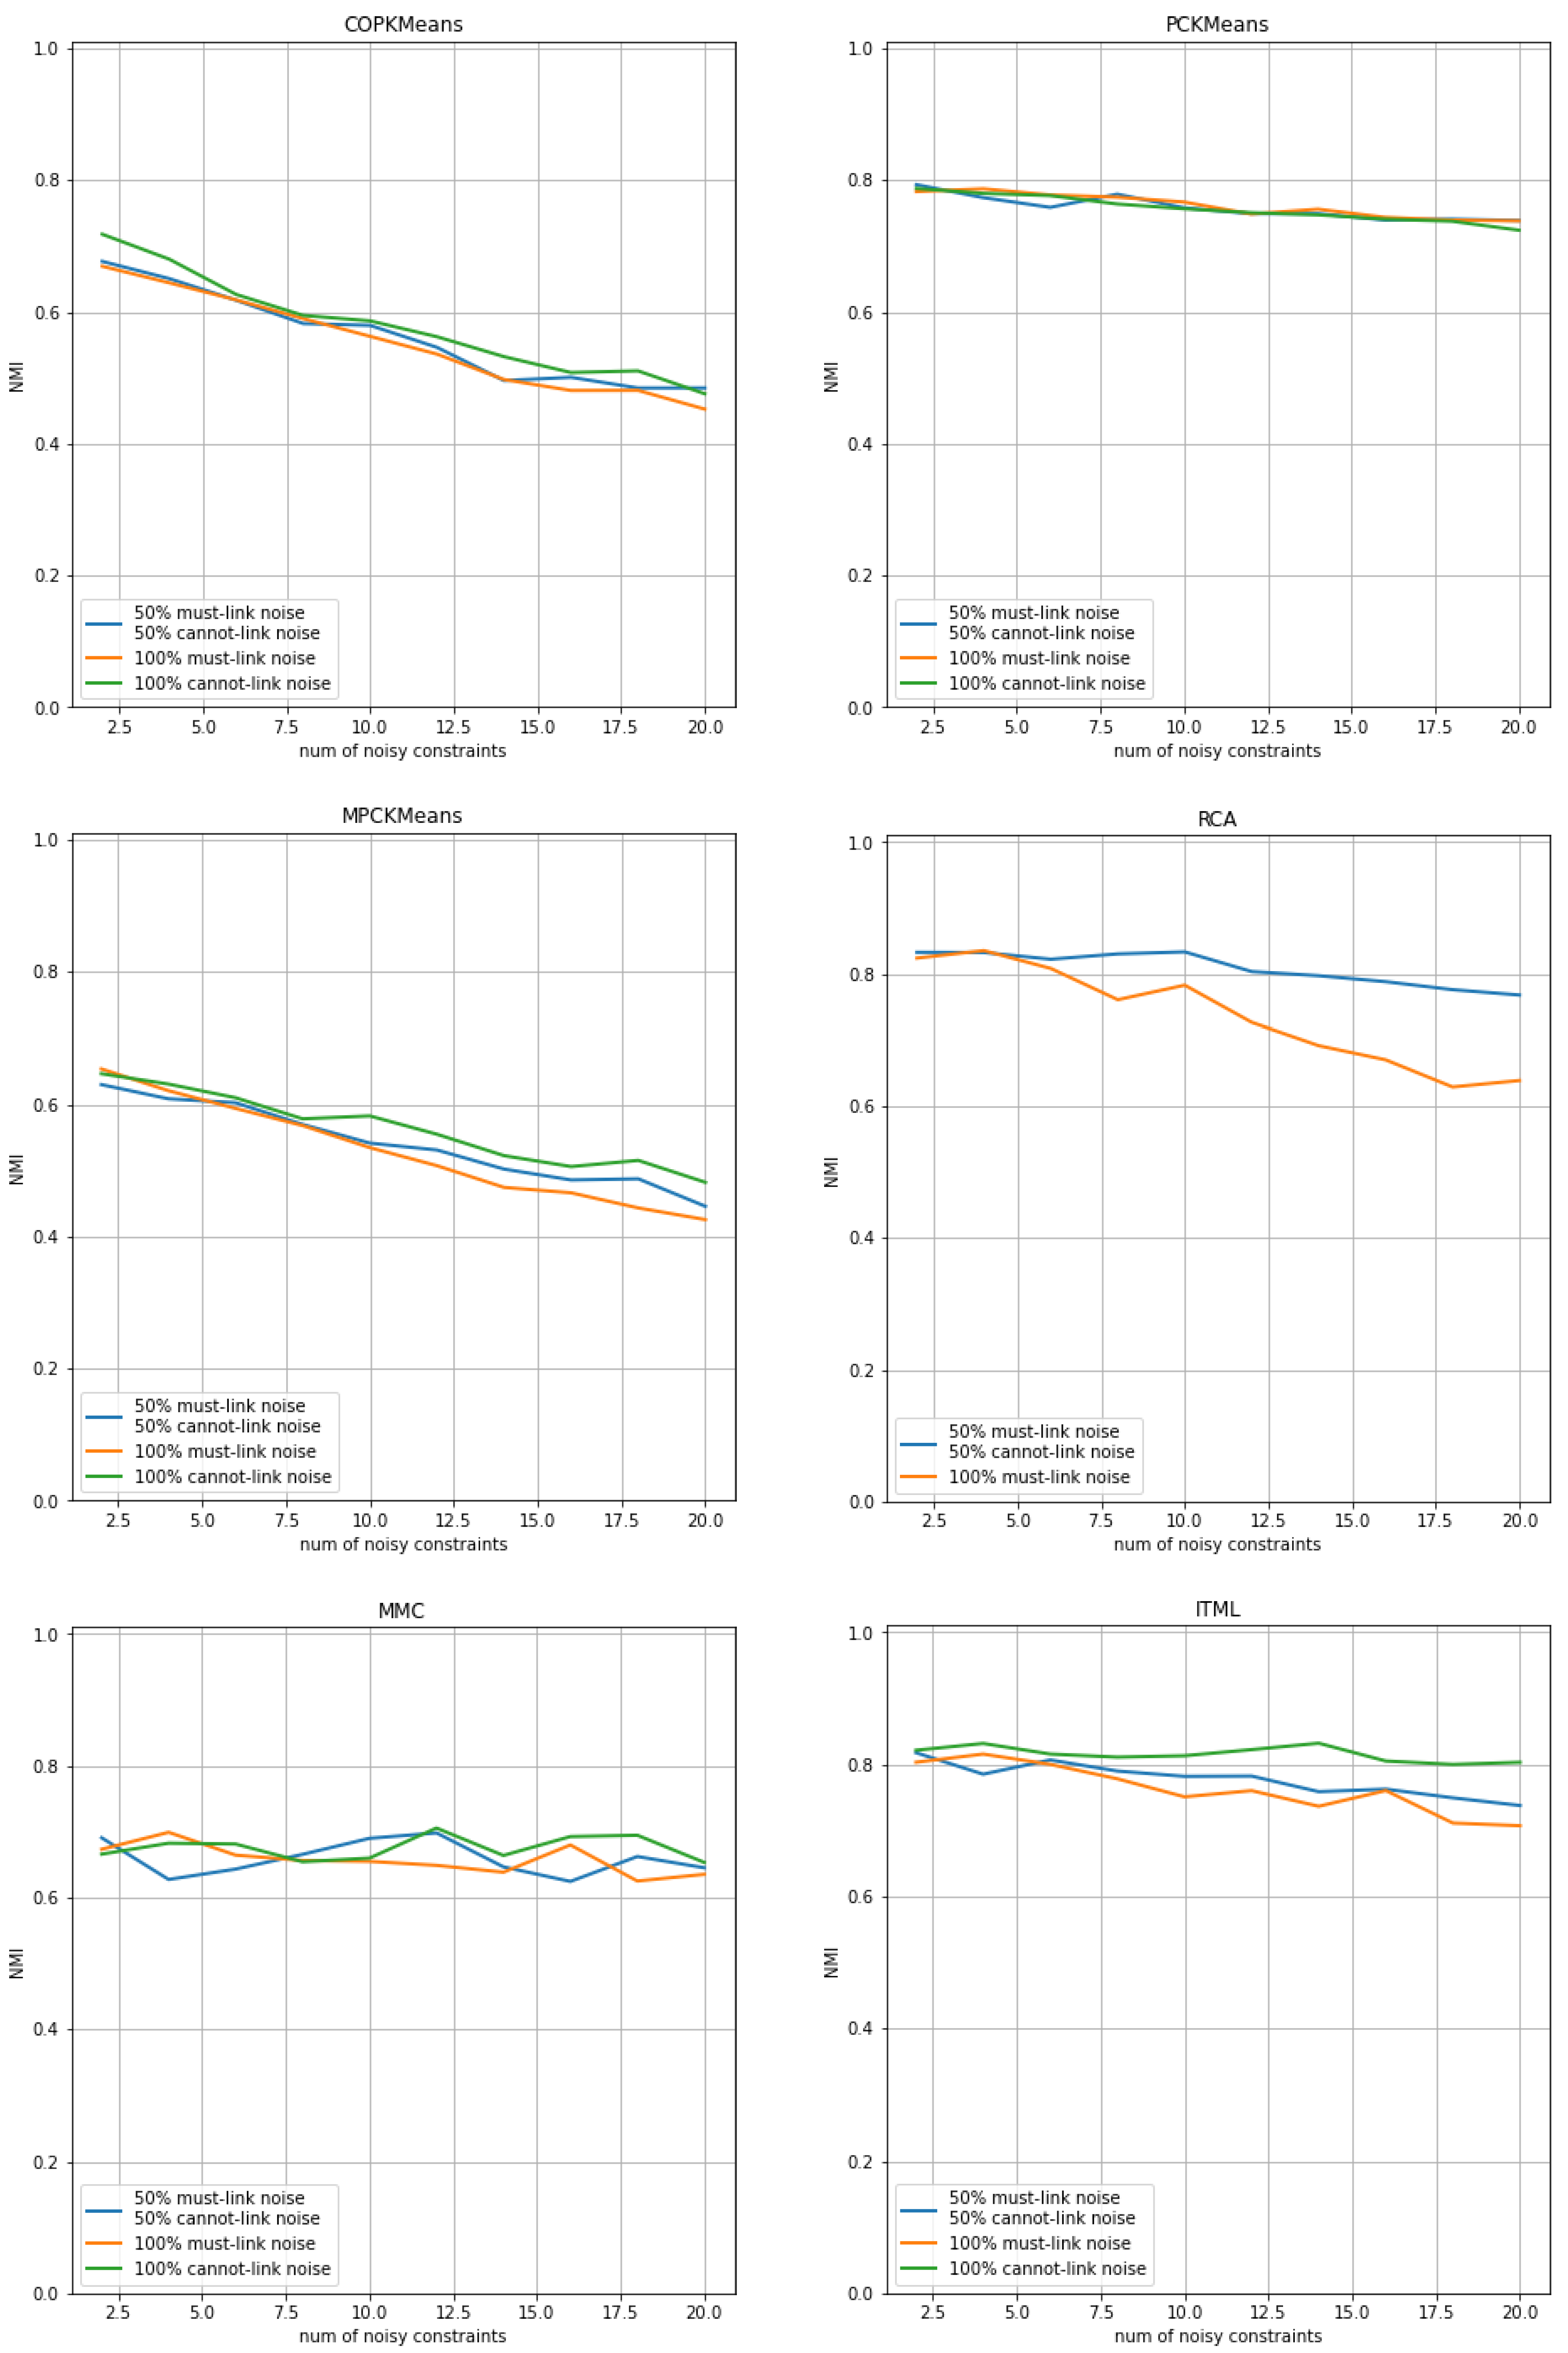
Figure 7.
Performance of semi-supervised clustering approaches for the Cassini dataset with randomly selected constraints. The horizontal and vertical axes depict the two-dimensional data space. The three colors of the points represent clusters in the output clustering solution. The three cannot-link and the three must-link constraints are represented by red and green lines respectively.
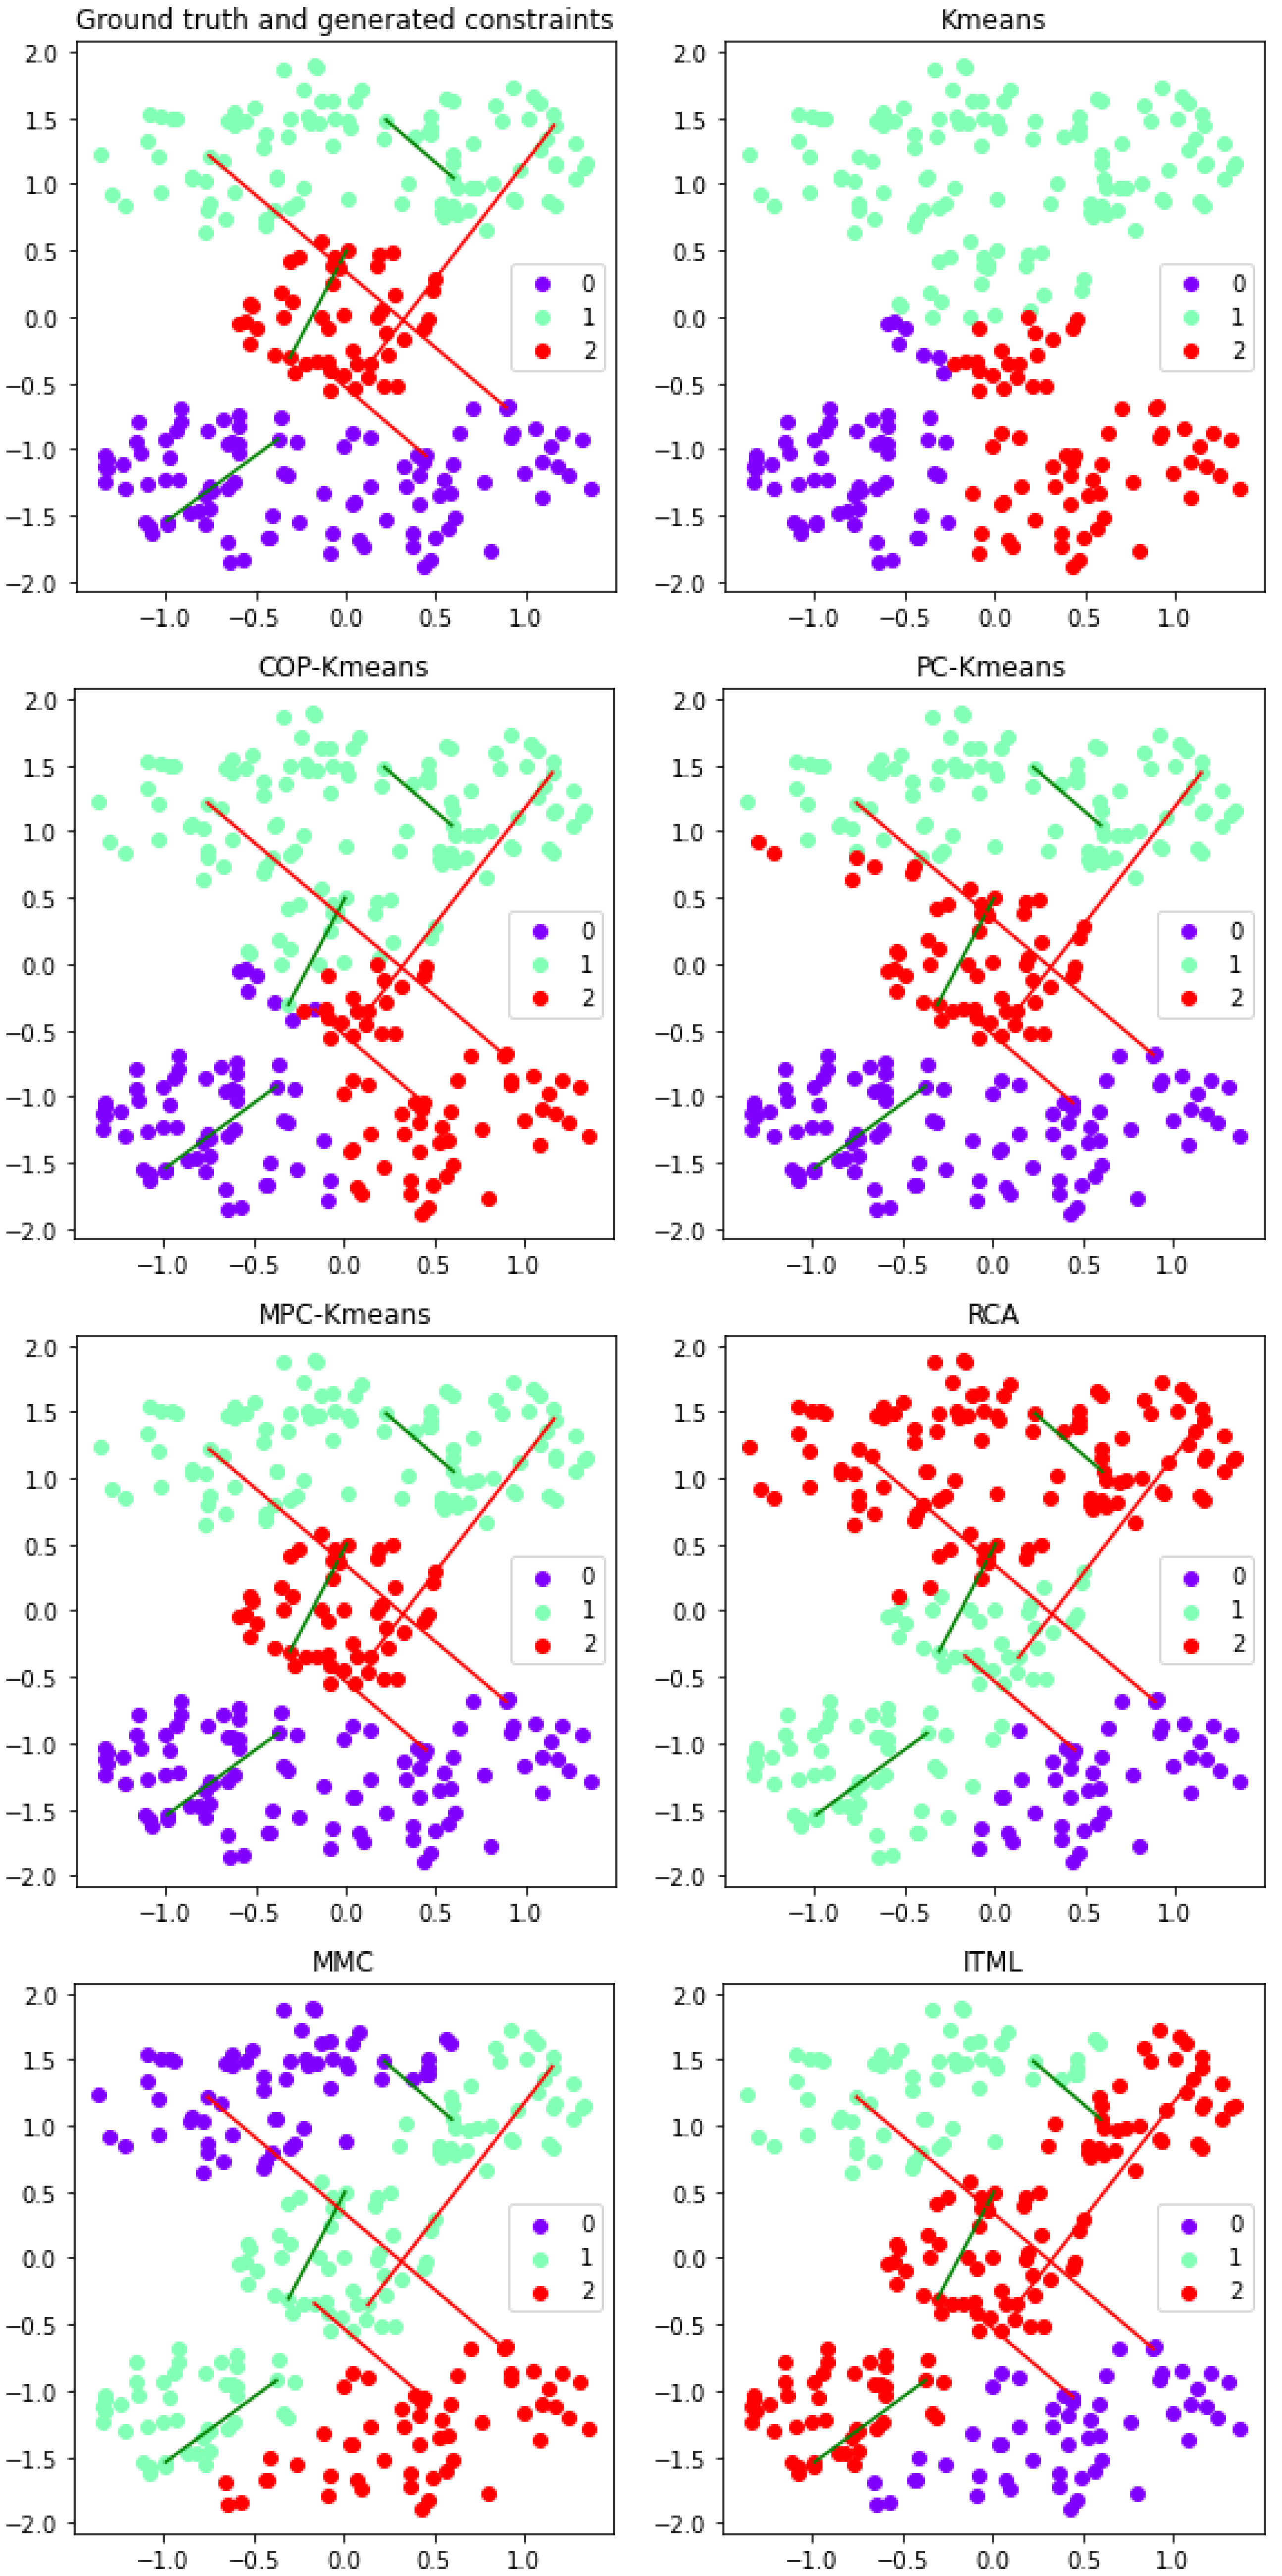
Figure 8.
Performance of semi-supervised clustering approaches for the Cassini dataset with manually selected representative constraints. The horizontal and vertical axes depict the two-dimensional data space. The three colors of the points represent clusters in the output clustering solution. The three cannot-link and the three must-link constraints are represented by red and green lines respectively.
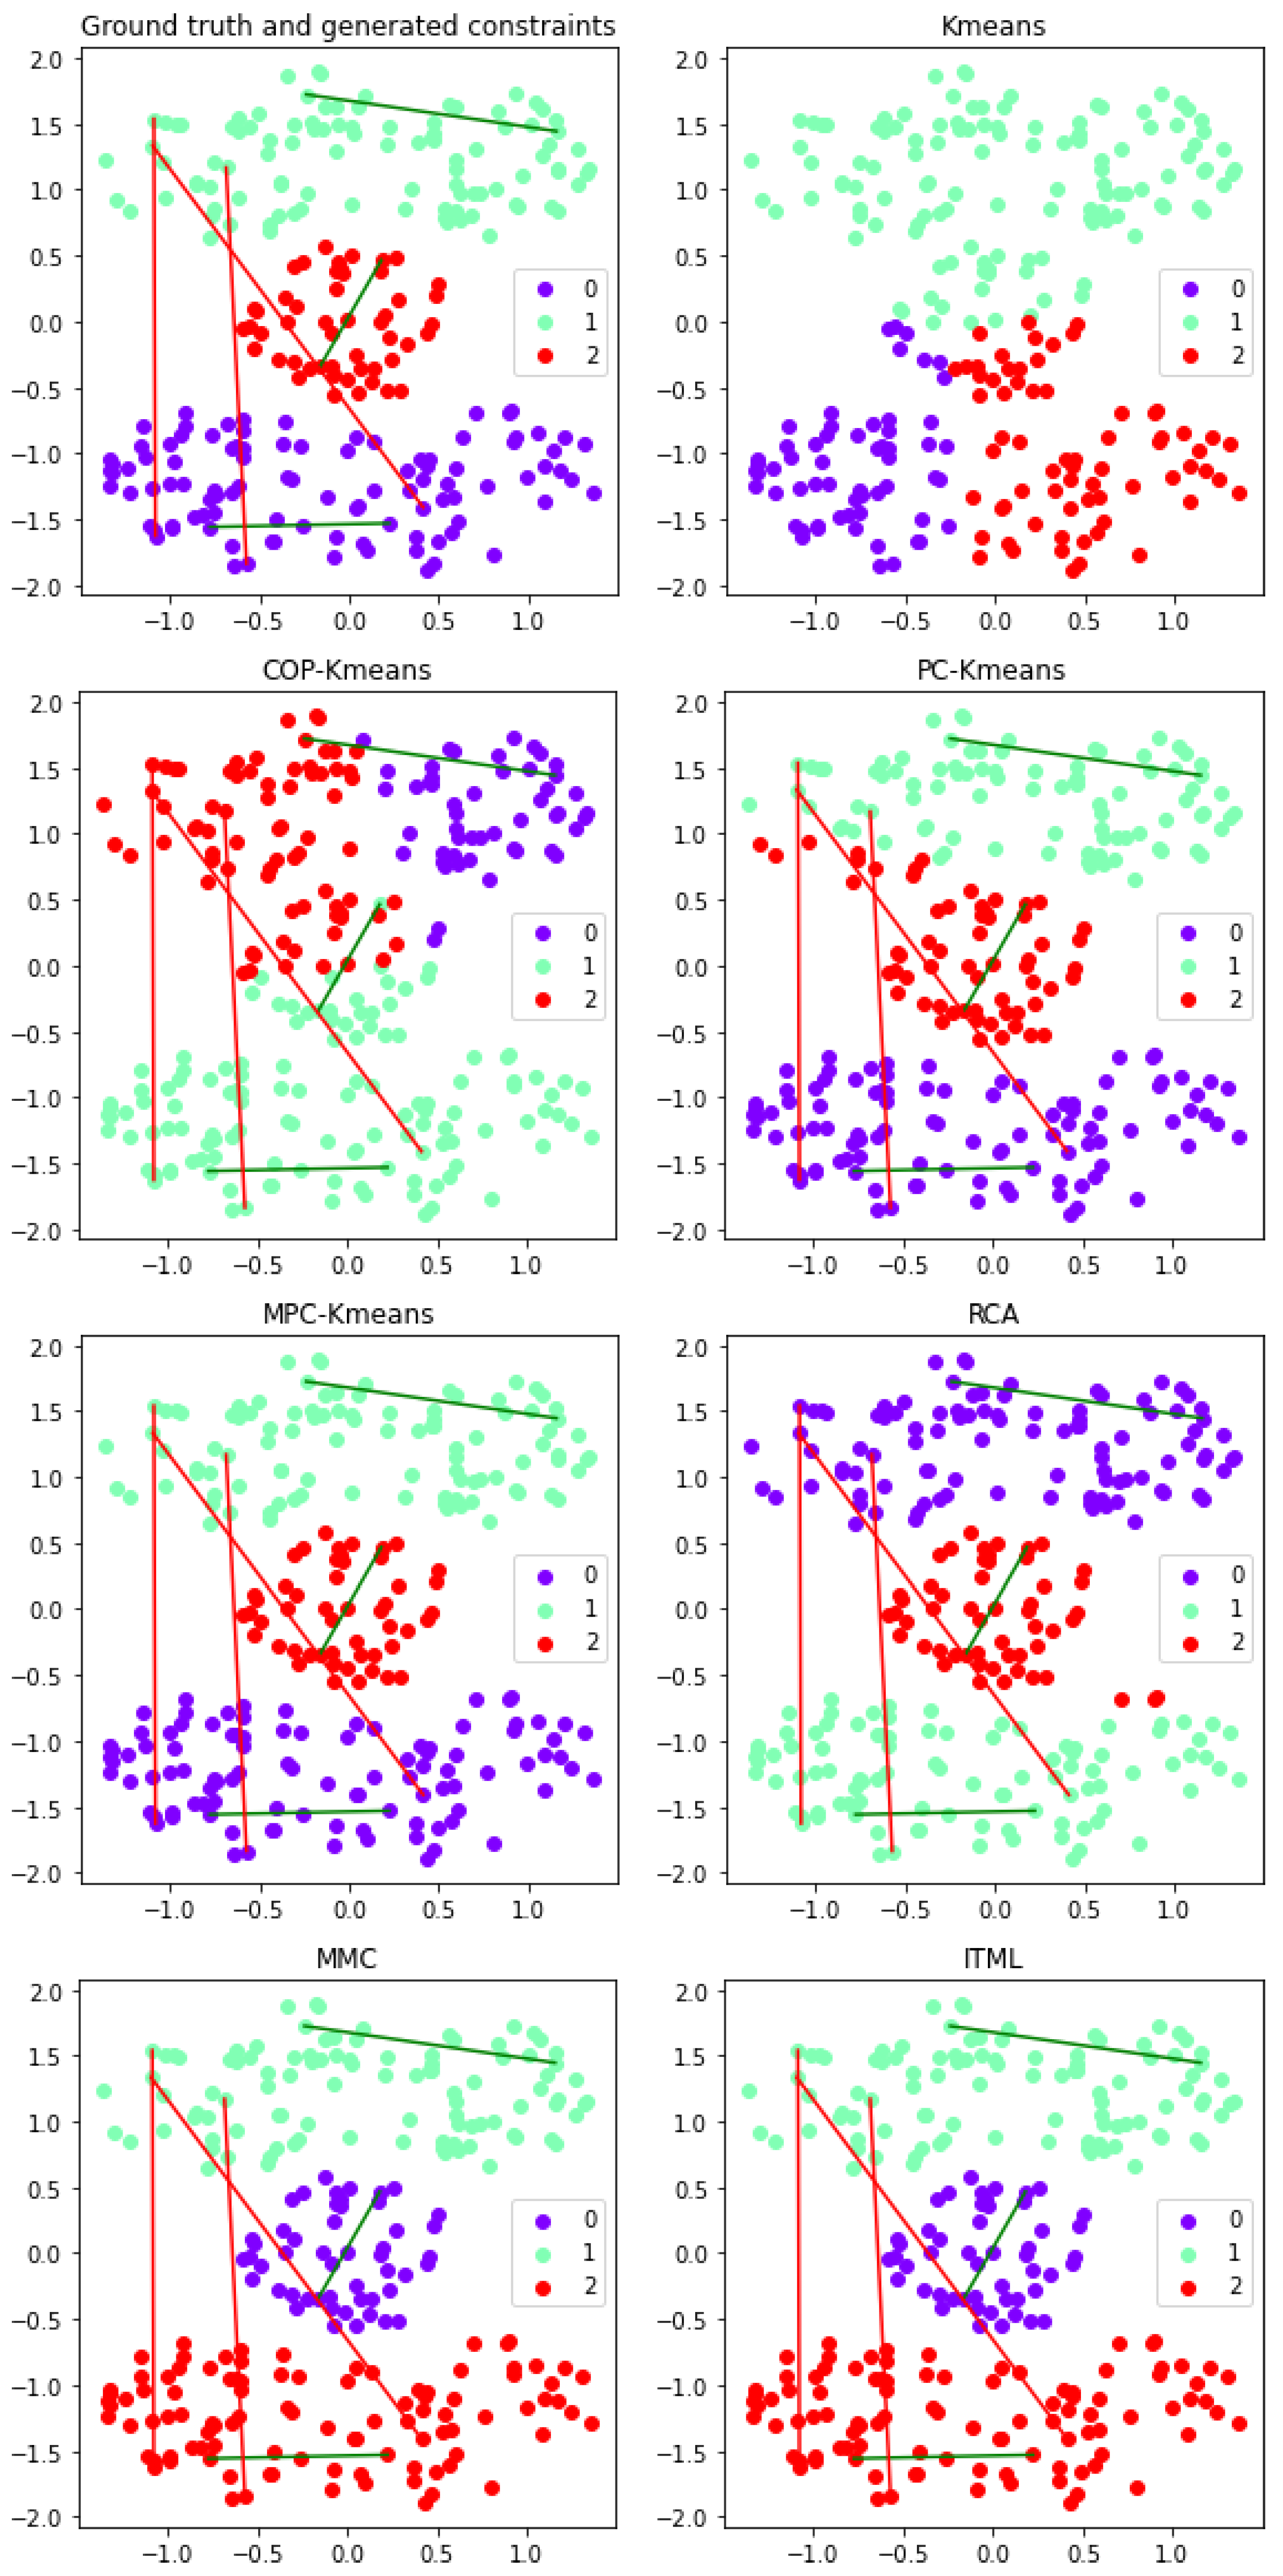
Figure 9.
Performance of semi-supervised clustering approaches for the Cassini dataset with more cannot-link constraints than must-link constraints. The horizontal and vertical axes depict the two-dimensional data space. The three colors of the points represent clusters in the output clustering solution. The thirty cannot-link and the three must-link constraints are represented by red and green lines respectively.
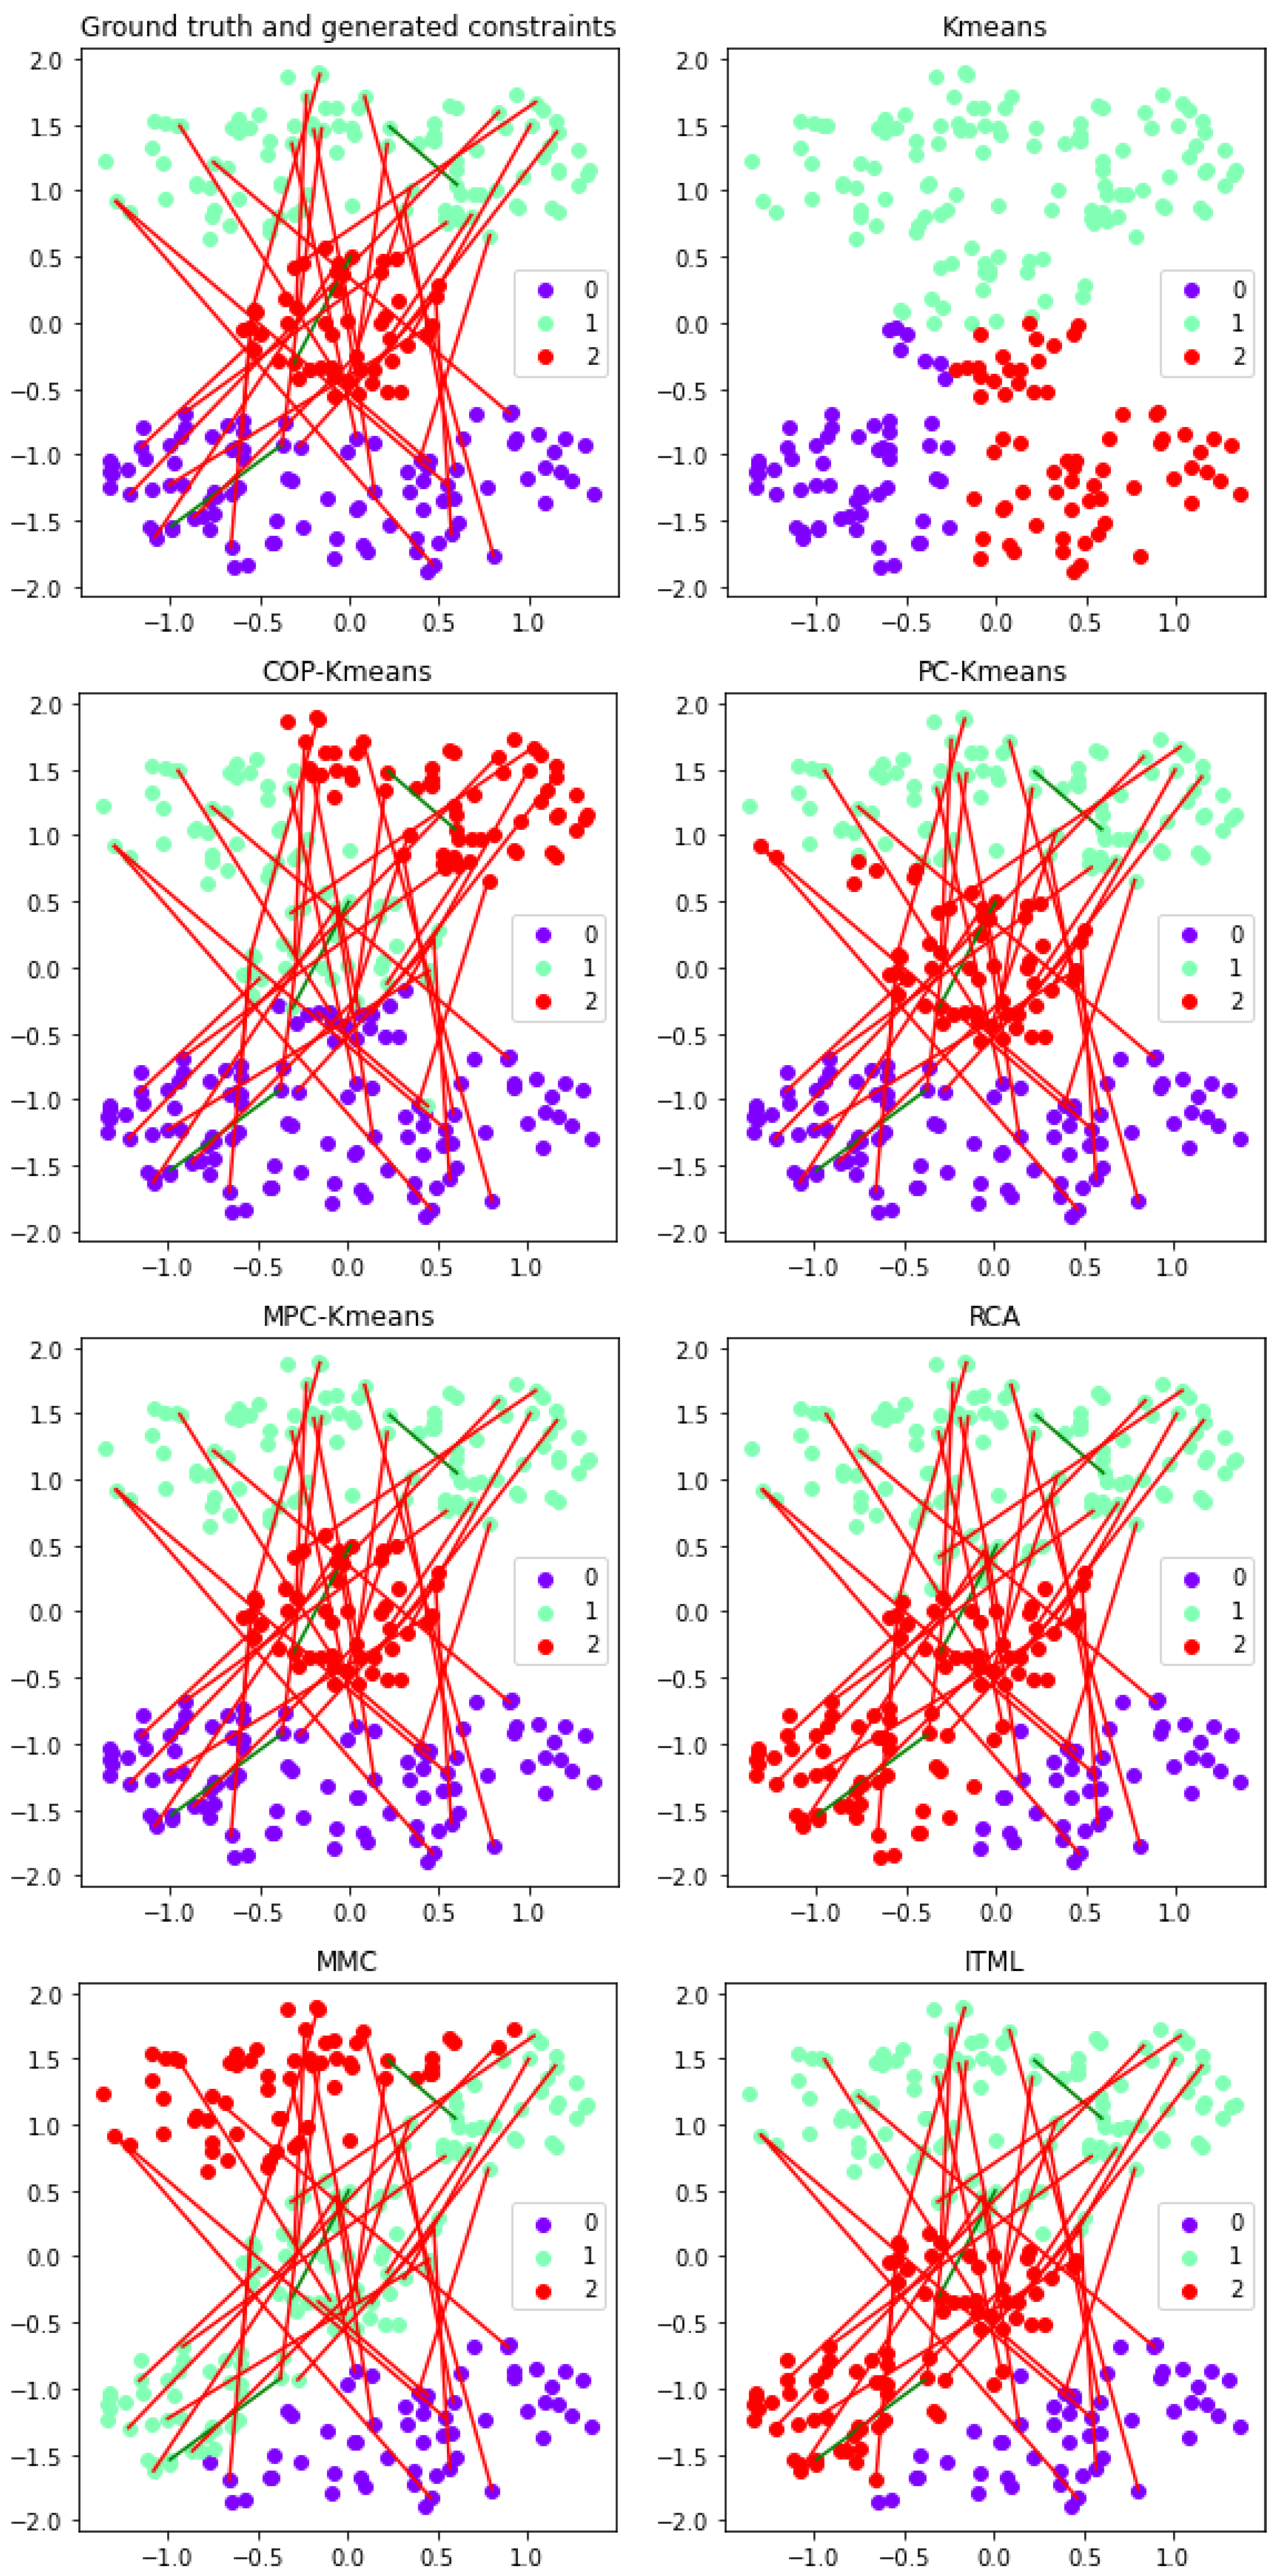
Figure 10.
Performance of semi-supervised clustering approaches for the Cassini dataset with more must-link constraints than cannot-link constraints. The horizontal and vertical axes depict the two-dimensional data space. The three colors of the points represent clusters in the output clustering solution. The three cannot-link and the thirty must-link constraints are represented by red and green lines respectively.
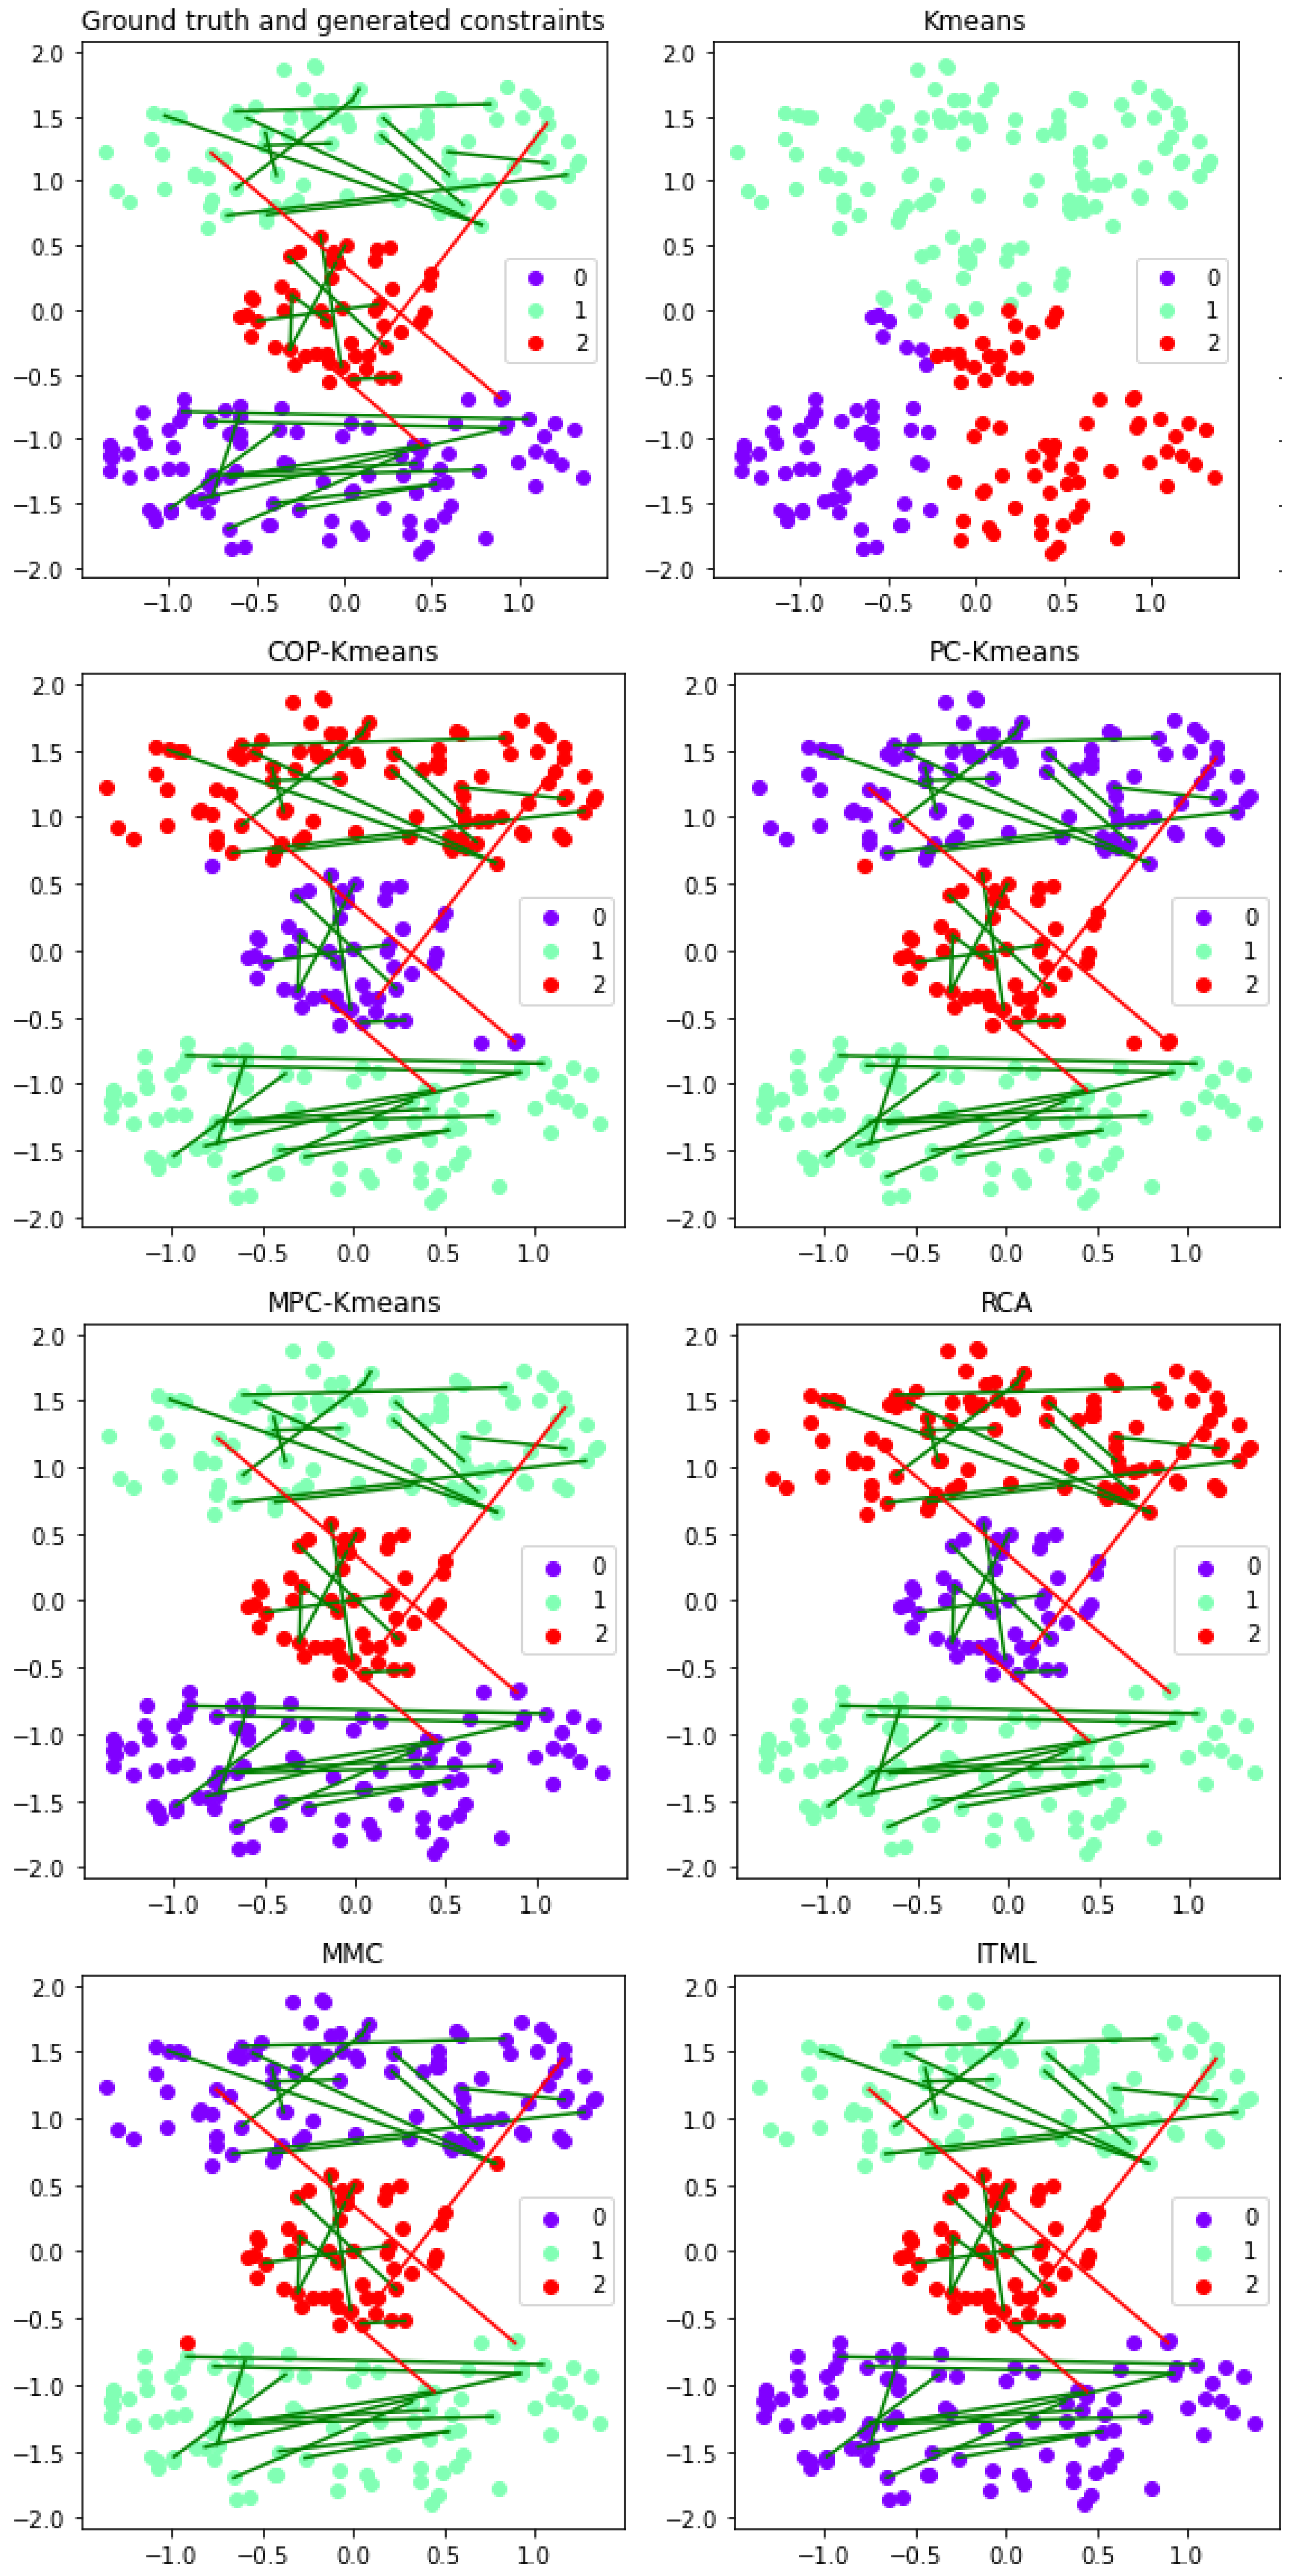

Table 1.
Benchmark dataset properties. For each experimental datasets, the number of classes, the number of attributes and the number of instances are shown.
Table 1.
Benchmark dataset properties. For each experimental datasets, the number of classes, the number of attributes and the number of instances are shown.
| Dataset | Classes | Attributes | Number of instances |
|---|---|---|---|
| Iris | 3 | 4 | 150 |
| Wine | 3 | 13 | 178 |
| Seeds | 3 | 7 | 210 |
| Cassini | 3 | 2 | 150 |
Disclaimer/Publisher’s Note: The statements, opinions and data contained in all publications are solely those of the individual author(s) and contributor(s) and not of MDPI and/or the editor(s). MDPI and/or the editor(s) disclaim responsibility for any injury to people or property resulting from any ideas, methods, instructions or products referred to in the content. |
© 2024 by the authors. Licensee MDPI, Basel, Switzerland. This article is an open access article distributed under the terms and conditions of the Creative Commons Attribution (CC BY) license (http://creativecommons.org/licenses/by/4.0/).
Copyright: This open access article is published under a Creative Commons CC BY 4.0 license, which permit the free download, distribution, and reuse, provided that the author and preprint are cited in any reuse.


