

Submitted:
16 December 2024
Posted:
17 December 2024
You are already at the latest version
Abstract
In amyloid brain PET, after parcellation using the finite element method (FEM)-based algorithm FreeSurfer and voxel-based algorithm PMOD, SUVr examples can be extracted and compared. This study presents the classification SUVr threshold in PET images of F-18 florbetaben (FBB), F-18 flutemetamol (FMM), and F-18 florapronol (FPN) and compares and analyzes the classifica-tion performance according to computational algorithm in each brain region. PET images were co-registered after the generated MRI was registered with standard template information. Using MATLAB script, SUVr was calculated using the built-in parcellation number labeled in the brain region. PMOD and FreeSurfer with different algorithms were used to load the PET image, and after registration in MRI, it was normalized to the MRI template. The volume and SUVr of the individual gray matter space region were calculated using an automated anatomical labeling at-las. The SUVr values of eight regions of the frontal cortex (FC), lateral temporal cortex (LTC), mesial temporal cortex (MTC), parietal cortex (PC), occipital cortex (OC), anterior and posterior cingulate cortex (GCA, GCP), and composite were calculated. After calculating the correlation of SUVr using the FreeSurfer and PMOD algorithms and calculating the AUC, the classification ability was calculated, and the SVUr threshold was calculated using the Youden index. The cor-relation coefficients of FreeSurfer and PMOD SUVr calculations of the eight regions of the brain cortex were FBB (0.95), FMM (0.94), and FPN (0.91). The SUVr threshold was SUVr(LTC,min) = 1.264 and SUVr(THA,max) = 1.725 when calculated using FPN-FreeSurfer, and SUVr(MTC,min) = 1.093 and SUVr(MCT,max) = 1.564 when calculated using FPN-PMOD. The AUC comparison showed that there was no statistically significant difference (p>0.05) in SUVr classification results using the three radiopharmaceuticals, specifically for LTC and OC regions in PMOD analysis, and LTC and PC regions in FreeSurfer analysis. The SUVr calculation using PMOD (voxel-based algorithm) has a strong correlation with the calculation using FreeSurfer (FEM-based algorithm); therefore, they are complement with each other. Quantitative classification analysis with high accuracy is possible using the suggested SUVr threshold. The SUVr classification performance was good in the order of FMM, FBB, and FPN and showed good classification performance in the LTC region, regardless of the type of radiotracer and analysis algorithm.
Keywords:
Amyloid PET
; Alzheimer’s disease
; finite element method (FEM)-based algorithm
; voxel-based algorithm
1. Introduction
Previous research has shown an association between accumulated amyloid and cognitive changes in individuals at risk for Alzheimer’s disease (AD) [1,2,3]. The amyloid uptake radiopharmaceuticals F-18 florbetaben (FBB), F-18 flutemetamol (FMM), and F-18 florapronol (FPN, Alzavue®, FutureChem, Seoul, Korea) show non-specific white matter and cortical uptake in patients with AD and mild cognitive impairment (MCI) compared to cognitively normal controls (NC)[4,5,6,7]. Depending on the stage of amyloid accumulation, the direction of diffusion and amount of accumulated change play an important role in the diagnosis of AD or cognitive decline using positron emission tomography (PET) imaging [8]. Use of amyloid PET images has increased the diagnostic accuracy through quantitative analyses [9,10].
Amyloid imaging using PET and cortical thickness measurement using MRI constitute suitable biomarkers for diagnosing early AD progression within the small brain atlas region [11]. For amyloid brain PET analysis, the accuracy is determined by several combinations of spatial normalization, reference tissue determination, and partial volume correction [12,13,14]. Spatial normalization is an important factor affecting the accuracy of quantitative analysis of amyloid PET images; however, not all subjects have appropriate MRI matching. An adaptive template method is useful because the statistical power can be increased when quantitative analysis is performed using data with only amyloid PET images [15,16,17,18,19]. Finite element method (FEM)-based algorithm brain structure calculation using FreeSurfer [20] is effective for the normalization of regions with small structures because precise calculations are possible in microregions. The resulting calculations are different from those obtained using the PMOD [21], which performs voxel-based normalization algorithm. Quantitative evaluation of amyloid accumulation using FBB, FMM, and FPN brain PET images in subjects with NC, MCI, and AD is a key research topic for diagnosis [22,23,24]. The correlation coefficient between radiotracers for amyloid PET images in the same brain atlas regions is very strong [25], especially in the cortex region; therefore, a study on their compatibility has been conducted [22]. PMOD, which implements a voxel-based analysis algorithm, and FreeSurfer, which is based algorithm on an FEM, are the most widely used software programs for calculating the SUV from PET images. The PMOD is relatively convenient to use, and the calculation process is intuitive with a shorter calculation time. Both the automated anatomical labeling (AAL) atlas of PMOD and the Desikan-Killiany Atlas of FreeSurfer showed similar accuracies in the resulting measures of quantification of amyloid brain PET data [26].
Automated quantitative analysis has been studied using statistical comparison [27,28,29] and a method employing artificial intelligence [30,31]. Brain PET analysis using PMOD and FreeSurfer provides the most reliable SUVr in standard atlas regions of the brain in neurodegeneration studies [32,33,34,35]. The classification of amyloid PET scans using SUVr thresholds showed good agreement with visual diagnosis [17,24,36,37]. This study aimed to statistically compare amyloid brain PET images scanned with three types of radiopharmaceuticals by calculating the SUV using PMOD and FreeSurfer software. After quantitative analysis of the tracers, the classification performance was compared, and the compatibility was evaluated by calculating the correlation coefficients. Further, this study aimed to investigate the diagnostic performance of PMOD and FreeSurfer and determine its usefulness in clinical diagnosis.
2. Materials and Methods
2.1. Database of Amyloid Brain PET Images
The Institutional Review Board (IRB) of Dong-A University Hospital reviewed and approved this retrospective study protocol (DAUHIRB-17-108). The IRB waived the need for informed consent because only anonymized data were used for research purposes. All methods were performed according to relevant guidelines and regulations. This study retrospectively enrolled patients diagnosed with clinical cognitive impairment and normal controls who underwent FBB, FMM, and FPN PET between December 2015 and May 2021. For this analysis, subjects who had undergone both MRI and PET imaging within one year were selected. Amyloid positive and negative were randomly selected considering the ratio of age and sex; the clinical characteristics of the subjects are summarized in Table 1.
For FBB analysis, 79 amyloid-negative and amyloid-positive PET images and MRIs with amyloid negative and positive changes were selected by a nuclear medicine specialist. In the calculation process using PMOD (PMOD TECHNOLOGIES LLC, version 3.603) and FreeSurfer (Laboratory for Computational Neuroimaging at the Athinoula A. Martinos Center for Biomedical Imaging, version 5.3.0), a total of 36 images were randomly compared and analyzed with consideration of age and sex; 43 images which did not include the complete brain region in the MRI or could not be analyzed, were excluded. According to the age and sex ratio, FBB brain PET images were randomly selected for males and females, ≥ 70 years old and < 70 years old (Table 1). For FMM and FPN brain PET image analysis, 105 and 77 images with negative and positive differences, respectively, were selected by nuclear medicine experts. A total of 78 (FMM) and 65 (FPN) images were included in the calculation process using PMOD and FreeSurfer; 27 (FMM) and 12 (FPN) brain PET images were excluded, where MRI brain regions were cut or were difficult to calculate.
2.2. Image Scan
All PET imaging scans (FBB, FMM:90 min after the injection of 8 mCi, FPN:60 min after the injection of 10 mCi) were performed [38,39,40,41] using a Biograph 40 mCT Flow PET/CT scanner (Siemens Healthcare, Knoxville, TN, USA). A helical CT scan was performed with a rotational time of 0.5 s at 120 kVp and 100 mA without an intravenous contrast agent. The PET scan was followed by a CT scan and acquired for 10 min in the 3D mode. All images were acquired from the vertex to the base of the skull. Image reconstruction was performed with a point spread function (PSF) and time-of-flight (TOF) algorithm with a 400 × 400 matrix, voxel size of 1.02 x 1.02 x 1.50 mm3, five iterations, and 21 subsets. MRI scans were acquired using a 3.0T GE Discovery MR750 scanner at a coronal T1 weighted sequence, voxel size 0.41 x 0.41 x 1.50 mm3, FOV = 21 cm, TR = 9.5 ms, TE = 4.0 ms. MRI was converted into a surface image from a voxel image using FreeSurfer’s reconstruction.
2.3. Images and Statistical Analysis
For the convenience of image data management, the MRI and PET image files in the .dcm file format were converted to .nii file format. The PET scan file was loaded as a function image in the PMOD tool and cropped as required. PMOD was used to load the PET image, and, after registration in the MRI, was normalized to the MRI template. After cropping by loading T1-weighted MRI matched with PET as T1 MR image input, the AAL atlas was selected, segmentation was performed, the SUV was extracted, and SUVr was calculated using the reference tissue. Using the PET and MR images cropped in PMOD as the input file for FreeSurfer, segmentation was performed using recon-all. After checking the brainmask.mgz result using Freeview, the SUV was extracted from the aparc.DKTatlas+aseg.mgz and wmparc.mgz files using SPM, and the SUVr was then calculated using reference tissue. A MATLAB script was used to calculate SUVr using the built-in parcellation number labeled in the brain region. Image analysis was performed using a MW Digitbox (Single Processor 4GPU, Miruware) at the Neuroscience Translational Research Solution Center (Busan, South Korea).
In FBB, FMM, and FPN brain PET, amyloid negativity and positivity were classified by three nuclear medicine specialists. The volume and SUVr of the individual space gray matter (GM) regions were calculated using the AAL atlas. The SUVr values of eight regions of the frontal cortex (FC), lateral temporal cortex (LTC), mesial temporal cortex (MTC), parietal cortex (PC), occipital cortex (OC), anterior and posterior cingulate cortex (GCA, GCP), and composite were calculated. The major regions with high amyloid accumulation potentials are shown in Table 2 [9]. After calculating the correlation of SUVr using the PMOD and FreeSurfer algorithm s, and calculating the AUC, the classification ability was calculated, and the SVUr threshold was calculated using the Youden index by MedCalc Ver. 19.7.2 [42,43]. A comparison of the diagnostic ability between the three radiopharmaceuticals using the AUC comparison algorithm demonstrated that there was no significant difference (p > 0.05).
The negative and positive FBB brain PET images for each individual are shown in Figure 1. For quantitative analysis, cropped T1-weighted MRI and cropped PET scans in the MRI space were used. Cropped brain segment images using the AAL atlas in the MRI space were extracted using PMOD, and are presented in Figure 1. Using Tobias Tuszynski’s region classification [9], SUVr was calculated for 11 regions and the cerebellar cortex was used as the reference tissue. In most cases, it was possible to visually confirm that the segment using MRI performed well without any error. The ‘mri_convert’ is a general purpose utility for converting between different file formats. The ‘mgz’ file was converted to a ‘nii’ file and SUVr were extracted using an in-house software.
Parcellation and segmentation images by MRI contrast are presented in individual spaces overlaid on the MRI, as shown in Figure 2. To extract the SUV values, brain PET, parcellation, and segment images were co-registered using SPM. For parcellation images extracted by the PMOD algorithm, the SUV was calculated in the region of the AAL atlas, and parcellation images extracted by the FreeSurfer algorithm were used to find the SUV in the region of the Desikan-Killany atlas. These two atlases may differ slightly in the cortical and subcortical regions. Figure 2 illustrates the regions of the AAL atlas in the PMOD viewer, and the regions of the Desikan-Killany atlas in Freeview.
As shown in Figure 2, cropping was performed using PMOD for the PET images and T1-weighted MRI to reduce the computation time. After re-slicing individual images of the subject using SPM, co-registration was performed on cropped T1-weighted MRI. Re-slicing of brain PET, parcellation, and segmentation were performed to match the resolution of T1-weighted MRI. After T1-weighted MRI was processed for skull stripping and intensity normalization, the regions were determined by registration to the atlas. SUV were extracted from regions where brain parcellation and segment images in the MRI space overlapped the brain atlas. For the brain atlas, SUV data were extracted using the AAL atlas in PMOD and Desikan-Killiany atlas in FreeSurfer.
For a comparative analysis, 36 FBB PET, 78 FMM PET, and 65 FPN PET images were used for classification. In the PMOD and FreeSurfer analysis process, images that could not be analyzed normally and images in which spatial normalization was difficult to perform, were evaluated visually and were not selected for the analysis. Assuming that there is a confounding effect of age and sex, the images were randomly divided into four groups: ≥ 70 years old, < 70 years old, male and female. To increase the legitimacy of statistical comparisons of SUVr, images of the subjects were balanced; however, selection bias may still have occurred
3. Results
Figure 3 shows a box plot comparing the subject groups by extracting the SUVr of FBB, FMM, and FPN brain PET from nine regions using voxel-based algorithm PMOD. In the distribution of SUVr of FBB, there was a significant difference between the amyloid-negative and positive groups in all regions, and these are summarized in Table 3. The distributions of SUVr in FBB and FMM were similar, and in the patient group, the distribution was wider than that of FPN, as shown in Figure 3, Figure 4, Figure 5 and Figure 6. For all three radiopharmaceuticals, the mean value and distribution of SUVr in the normal group were similar. Because the SUVr of the FMM is distributed with the narrowest value, it is considered the easiest to compare with the subject group, as shown in Figure 4. The SUVr of FPN does not show a large difference in comparison value relative to the other two radiopharmaceuticals; however, it is distinguishable from the others. SUVr in the composite region was calculated as the sum of FC, LTC, MTC, PC, OC, GCA, and GCP, so that the distributions were similar. The distribution of SUVr in the composite region was not significantly different between CN and PQ; however, in the CN region, it was confirmed that discrimination using SUVr was lowered. The PQ region presented a box-plot distribution similar to that of the composite region, with a wider data distribution than the composite region.
Figure 4 shows a box plot comparing FBB, FMM, and FPN brain PET SUVr from nine regions using FEM-based algorithm FreeSurfer and comparing the normal and patient groups. The distribution of SUVr in FMM was significant (p < 0.01) between amyloid negative and amyloid-positive groups in all regions (shown in Table 4). It had the lowest p-value among the three radiopharmaceuticals tested. The distribution of SUVr in brain PET calculated using FreeSurfer was similar to the distribution of data calculated using PMOD. The distributions of SUVr in FPN brain PET in the composite region found in the two algorithms (PMOD, FreeSurfer) were similar. As shown in Figure 4, the SUVr distributions of FPN brain PET in CN did not differ significantly between the normal and patient groups, making it difficult to distinguish them. The FreeSurfer algorithm necessitates attention because the distribution of the SUVr in the CN region varies widely. In the FreeSufer algorithm, the SUVr of the FMM is distributed as a concentrated value; therefore, comparison with the patient group is considered the easiest.
The SUVr values of FBB, FMM, and FPN brain PET were extracted from the composite region using PMOD. The extracted SUVr was compared between the normal and patient groups, and a box plot divided by age and sex is shown in Figure 5. The distribution of SUVr of FPN was significant (p < 0.01) between amyloid negative and amyloid-positive groups in all brain cortex regions and is summarized in Table 4. It had the highest p-value among the three radiopharmaceuticals (FBB, FMM, and FPN). The FBB, FMM, and FPN brain PET data were classified based on the age at which the number of comparison subjects was similarly distributed. There was no significant difference in the classification ability according to age distribution. In the normal group, SUVr over 70 years of age was found to have a slightly higher distribution; however, only a small difference was observed. There was no significant difference in the discrimination ability according to sex. In the distribution of the normal group, SUVr in the female group was slightly higher in the FBB group and slightly lower in the FMM and FPN groups; however, no significant difference was observed.
The distribution of brain PET SUVr in the FBB and FMM groups was similar, and it was more widely distributed than FPN in the patient group. For the three radiopharmaceuticals, it was observed that the mean value and distribution of the extracted SUVr data were not significantly different in the normal group. It was observed that the SUVr of the normal group of FBB brain PET was distributed with the narrowest value, making comparison with the patient group the easiest. The SUVr of FPN brain PET did not have a significant difference in comparison value relative to the other two radiopharmaceuticals, and there was no significant difference in classification. The SUVr in the composite region was calculated as the sum of the seven regions (FC, LTC, MTC, PC, OC, GCA, and GCP); therefore, the distribution was reflected in proportion to the volume of the characteristics of each region. The distribution of SUVr in the composite region was not significantly different between the CN and PQ, which was not considered. However, in the CN region, the classification ability of SUVr was lowered. The PQ region presented a box-plot distribution similar to that of the composite region, with a wider data distribution than in the composite region.
The sensitivity, specificity, threshold of SUVr, p-value, and correlation coefficient calculated by PMOD and FreeSurfer software using FBB, FMM, and FPN brain PET SUVr are summarized in Table 3, Table 4 and Table 5. Amyloid negative and positive diagnosis results of nuclear medicine specialists using brain PET SUVr in the FC, LTC, MTC, PC, OC, GCA, GCP, PQ, and composite regions were used. The SUVr threshold values for the quantitative analysis to classify amyloid positives and negatives are presented in Table 3, Table 4 and Table 5. The threshold of FBB SUVr was SUVr(FC) = 1.009 for the lowest region when calculated using FreeSurfer, SUVr(PUT) = 1.471 for the highest region; SUVr(PQ) = 1.173 for the smallest region when calculated using PMOD SUVr(PUT) = 1.466 for the largest region, as presented in Table 3. The threshold of FMM SUVr was SUVr(LTC) = 1.264 for the smallest region when calculated using FreeSurfer, SUVr(THA) = 1.725 for the largest region; SUVr(MTC) = 1.093 for the smallest region when calculated using PMOD and SUVr(GCP) = 1.598 for the largest region, as presented in Table 4. The threshold of FMM SUVr was SUVr(FC) = 1.208 when calculated using FreeSurfer, the largest region was SUVr(PUT) = 1.838, and when calculated using PMOD, the smallest region was SUVr(PC) = 1.218, and the largest region was SUVr(MCT) = 1.564, as presented in Table 5.
The SUVr of FBB, FMM, and FPN brain PET were extracted from the composite region using FreeSurfer, and a box plot comparing the normal and patient groups by age and sex is shown in Figure 6. There was no significant difference in classification ability according to age and sex distribution. It was observed that there was little difference in discrimination ability between PMOD and FreeSurfer, each with different algorithms. The distribution of brain PET SUVr of FBB and FMM was not significantly different from the results obtained by PMOD and FreeSurfer. For the three radiopharmaceuticals, it was observed that the mean value and distribution of the extracted SUVr data were not significantly different in the normal group. In the FreeSurfer algorithm, similar to the PMOD algorithm, SUVr in the normal group of FBB brain PET was distributed with the narrowest value; therefore, it was observed that the classification with the patient group was the best. The SUVr of FPN brain PET did not show a significant difference in comparison value compared to the other two radiopharmaceuticals, even by the FreeSurfer algorithm; however, it was observed that there was no significant difference in classification.
The distribution of FBB brain PET SUVr calculated using PMOD and FreeSurfer in the FC, LTC, MTC, PC, OC, GCA, GCP, PQ, and composite regions was observed to be linear, as shown in Figure 7. In this case, the correlation coefficient was > 0.95, as summarized in Table 3. In the FBB brain PET SUVr scatter plots of the CN, PUT, and THA regions, the scatter plot deviated from the linear distribution. The correlation coefficients for the central region of the brain were 0.44, 0.76, and 0.45, respectively.
The distribution of FMM brain PET SUVr calculated using PMOD and FreeSurfer of the FC, LTC, MTC, PC, OC, GCA, GCP, PQ, and composite regions was observed to be linear, as shown in Figure 8. The correlation coefficient of the cortical region of the brain was > 0.94, as summarized in Table 4. The correlation coefficients for the central region of the brain were 0.74, 0.80, and 0.60, respectively. In the distribution of SUVr data in both the brain central region and the cortex region, there was little difference in the distribution of SUVr between the two radiopharmaceuticals, FBB and FMM. The distribution of FMM brain PET SUVr data, calculated using PMOD and FreeSurfer in the FC, LTC, MTC, PC, OC, GCA, GCP, PQ, and composite regions, was observed to be linear, as shown in Figure 9. Table 5 shows that the correlation coefficient for the brain cortex region was greater than 0.91. The correlation coefficients for the central region of the brain were 0.26, 0.41, and 0.25, respectively. In the distribution of SUVr in the cortex region, although the difference in the correlation coefficient of SUVr between the two radiopharmaceuticals (FBB and FMM) was small, a difference in the distribution range was observed.
Figure 10 shows the comparison results by calculating ROC in FC, PC, OC, GCP, PQ, and composite regions using different analysis algorithms (PMOD, FreeSurfer) and three radiopharmaceuticals (FBB, FMM, and FPN). According to the analysis algorithm, the AUC of the ROC calculated by the algorithm using FreeSurfer was observed to be larger than the result of PMOD. From the ROC analysis of FreeSurfer using FBB brain PET SUVr, the classification performance was the best, with a sensitivity of 95.83 and specificity of 100.00 in the PC, OC, GCP, and composite regions, as shown in Table 3. From the ROC analysis of PMOD using the FBB brain PET SUVr, the classification performance was the best in FC, PC, OC, and composite regions, with a sensitivity of 91.67 and specificity of 100.00. It was confirmed that the sensitivity and specificity analyzed by FreeSurfer using FBB brain PET SUVr were slightly higher than PMOD. From the ROC analysis of FreeSurfer using the FMM brain PET SUVr, the classification performance was the best in the FC region, with a sensitivity of 97.37 and a specificity of 100.00, as shown in Table 4. From the ROC analysis of PMOD using FMM brain PET SUVr, the classification performance was excellent, with a sensitivity of 97.37 and specificity of 100.00 in the PC, GCP, PQ, and composite regions. Four regions with high sensitivity and specificity were analyzed by PMOD using FBB brain PET SUVr, and two regions were analyzed by FreeSurfer. From the ROC analysis of FreeSurfer using FPN brain PET SUVr, the classification performance was the best in the LTC region, with a sensitivity of 80.95 and specificity of 100.00, as shown in Table 5. The ROC analysis of PMOD using the FPN brain PET SUVr showed a sensitivity of 80.95, a specificity of 100.00 in the FC region, and the best classification performance; however, the sensitivity and specificity were lower than other radiotracers (FBB and FMM).
4. Discussion
This study investigated the effect of SUVr, calculated by PMOD and FreeSurfer with different calculation algorithms, on the classification performance of amyloid-negative and amyloid-positive groups. Further, the effect of the difference between the voxel-based algorithm analysis of PMOD and the FEM-based algorithm analysis of FreeSurfer on the classification results was investigated. The FEM-based algorithm analysis of the FreeSurfer algorithm made it possible to precisely parcellate the brain cortex region on MRI; however, the effect did not significantly affect the conclusion. The parcellation region of the FEM-based algorithm is smaller than the PET resolution. The advantage of sophisticated structure resolution may disappear in the procedure of performing co-registration with SPM after conversion to a voxel image using mri_convert. In conclusion, though performing a classification using PMOD saves time, it is considered to show similar results.
The matrix size of the re-sliced image can be calculated based on the brain PET image and T1-weighted MRI, and a slight difference may occur in the extracted SUV. The SUV extraction calculations in this study were performed using high-resolution T1-weighted MRI. Because PMOD uses the AAL atlas and FreeSurfer uses the Desikan-Killiany atlas to extract the SUV, there may be some differences in the comparative analysis. Regions with a high probability of amyloid accumulation were set as the regions of interest in the brain cortex [9], and composite regions were established by synthesis. Depending on the setting range of the composite region, the classification performance may differ and may vary for each radiopharmaceutical, and new research may be required to further analyze these differences.
The classification of the normal and patient groups was most effective when compared using the distribution of SUVr extracted from FMM brain PET, as shown in Figure 5. As shown in Figure 6, the brain PET SUVr distributions of FBB and FMM, calculated using PMOD in the composite region, were more concentrated in the amyloid-negative group than in the FPN group, and more widely distributed in the positive group. The classification of amyloid-negative and amyloid-positive groups using the SUVr distribution calculated using PMOD in the composite region was observed to have good classification ability in the order of FBB, FMM, and FPN. The sensitivity and specificity of FreeSurfer analysis using FBB, FMM, and FPN brain PET SUVr were slightly better; however, there was no significant difference in the classification performance.
The distribution of SUVr calculated by the FreeSurfer algorithm was not significantly different from the distribution of SUVr calculated by the PMOD algorithm, as shown in Figure 4, Figure 5, Figure 6, Figure 7, Figure 8, Figure 9 and Figure 10. The correlation coefficient of the cortex region for the PMOD and FreeSurfer algorithms using FBB brain PET SUVr was 0.95 or more, indicating a very strong correlation; however, a relatively weak correlation was observed in the central region of the brain, as shown in Figure 8, Figure 9 and Figure 10. The weak correlation coefficient of the central brain region may be because the volume is small and the boundary between the gray matter and white matter is relatively indistinct compared to the cortex. The correlation coefficients between PMOD and FreeSurfer in the FBB and FMM brain PET SUVr of the cortex region were very strong for the two radio-pharmaceuticals, and the difference between them was not significant. Because the correlation coefficients in the cortex region of SUVr by FBB and FMM have similar tendencies, they are highly compatible with each other.
The correlation coefficient of the cortex region for the PMOD and FreeSurfer algorithms using FPN brain PET SUVr was very strong, as with the other two radiopharmaceuticals (FBB and FMM), but the range of the scatter plot was slightly different. If the range of SUVr is wider than that of the normal group, it can be concluded that the classification is performed relatively well. The distribution of FPN brain PET SUVr is narrow compared to the other two radiopharmaceuticals (FBB and FMM), which may affect the classification performance. There are more regions with high sensitivity and specificity analyzed by PMOD using FBB brain PET SUVr than when analyzed by FreeSurfer, which is advantageous for classification; however, this might not show a significant difference in performance. The classification performance from ROC analysis of PMOD and FreeSurfer using FPN brain PET SUVr showed lower sensitivity and specificity than other radiotracers (FBB and FMM); however, there was no significant difference in the specific region (LTC).
Because the composite region occupies a fairly large volume for the difference between SUVr in the normal and patient groups, the occurrence of errors owing to minute differences is offset and can be accepted as a reliable value. The classification of amyloid-negative and amyloid-positive groups using the SUVr distribution calculated using FreeSurfer in the composite region was not significantly different from the results of the PMOD algorithm. Classification using SUVr as a parameter in most cortex regions was successfully performed using the two algorithms (PMOD and FreeSurfer), and the correlation coefficient was also very strong, thus indicating that both results are acceptable. Depending on the time required for the calculation and the complexity of the process, one of the two algorithms may be selected and used.
Because the FreeSurfer algorithm resulted in a wide distribution of SUVr in the CN region, a comparative study may be required for further evaluation, as shown in Figure 5. The FMM SUVr value of the cortical region of the brain is an important variable for the classification of negative and positive values, as shown in Table 4. The classification of negative and positive FMM SUVr in the central regions of the brain (CN, THA, PQ) was significant, along with the FPN brain PET SUVr; however, the statistical significance was lower. It can be used as a variable for the negative and positive classification of FPN SUVr, but it is inferior to that of FMM and FBB SUVr.
The database used in this study did not have a uniform distribution of parameters according to age and sex. Therefore, to select a constant parametric distribution, images were randomly selected by forming four groups based on age and sex; however, there could be a possibility of selection bias. The results of the study showed that the difference in SUVr between the normal and patient groups according to age and sex was not significant. Although the age and sex distribution in the database was not uniformly parametric, and the data numbers were limited, the classification of brain PET SUVr was statistically significant. The SUVr threshold value has a selection bias in the quantitative analysis of FBB brain PET and has a limitation in that the data numbers were insufficient for the FMM and FPN. In future studies, the data numbers will be reinforced, and the SUVr threshold suggested in this study will be used for quantitative analysis.
Regardless of the three radiopharmaceuticals (FBB, FMM, and FPN) and the two analysis algorithms (PMOD, FreeSurfer), the region showed the same performance in the classification of amyloid negativity and positivity as the LTC region, as shown in Table 6. FBB and FMM showed similar classification performances in most cortex regions, while FPN did not have many regions showing classification performances similar to FMM and FBB. For FPN to perform similar to FBB and FMM in quantitative analysis classification, it is necessary to analyze the LTC and OC regions in the PMOD analysis and the LTC and PC regions in the FreeSufer analysis with common caution. Quantitative evaluation using PMOD saves time because the procedure is simpler than using FreeSurfer, and the ability to distinguish did not show a significant difference in performance. There is no significant difference between quantitative evaluation and classification using PMOD and FreeSurfer; therefore, it can be used selectively. In conclusion, the SUVr threshold value for classifying amyloid-negative and amyloid-positive is presented, which can be used for quantitative analysis. It will be possible to use the suggested threshold by matching the protocol for extracting PET SUVr.
Author Contributions
Conceptualization, H.J.Y. and D.Y.K.; methodology, H.J.Y, Y.J.J. and D.Y.Y.; software, H.J.Y. and Y.J.J.; validation, S.M.J., D.Y.Y. and D.Y.K.; investigation, Y.J.J. and D.Y.Y.; data curation, H.J.Y. and D.Y.Y.; writing—original draft preparation, H.J.Y., Y.J.J. and D.Y.K.; writing—review and editing, D.Y.K, H.J.Y. and D.Y.Y.; visualization, H.J.Y. and S.M.J.; supervision, D.Y.Y. and D.Y.K.; project administration, D.Y.K. All authors have read and agreed to the published version of the manuscript.
Funding
Please add: This research was supported by ‘Regional Innovation Strategy (RIS)’ through the National Research Foundation of Korea (NRF) funded by the Ministry of Education (MOE) (No. 2023RIS-007).
Data Availability Statement
Data are available from the corresponding author upon reasonable request.
Acknowledgments
The authors would like to thank Dr. Adrian Ankiewicz at the Australian National University (Australia) for helpful comments on the manuscript. The authors would also like to thank Prof. Jae Sung Lee and Dr. Seung Kwan Kang of the Seoul National University for their skillful use of FreeSurfer. We would like to thank Editage (www.editage.co.kr) for English language editing.
Conflicts of Interest
The authors declare no conflicts of interest.
References
- Aschenbrenner AJ, Gordon BA, Benzinger TL, Morris JC, Hassenstab JJ. Influence of tau PET, amyloid PET, and hippocampal volume on cognition in Alzheimer disease. Neurology (2018) 91, pp. 859-66. [CrossRef]
- Perani D. FDG-PET and amyloid-PET imaging: the diverging paths. Curr Opin Neurol (2014) 27, pp. 405-13.
- Yoon H, Kim BS, Jeong JH, Kim GH, Park HK, Chun MY, et al. Dual-phase 18F-florbetaben PET provides cerebral perfusion proxy along with beta-amyloid burden in Alzheimer’s disease. NeuroImage: Clinical (2021) 31, 102773. [CrossRef]
- Catafau AM, Bullich S. Amyloid PET imaging: applications beyond Alzheimer’s disease. Clinical and translational imaging (2015) 3, pp. 39-55. [CrossRef]
- Matías-Guiu JA, Oreja-Guevara C, Cabrera-Martín MN, Moreno-Ramos T, Carreras JL, Matías-Guiu J. Amyloid proteins and their role in multiple sclerosis. Considerations in the use of amyloid-PET imaging. Frontiers in neurology (2016) 7, pp. 53. [CrossRef]
- Hatashita S, Wakebe D, Kikuchi Y, Ichijo A. Longitudinal assessment of amyloid-β deposition by [18F]-flutemetamol PET imaging compared with [11C]-PIB across the spectrum of Alzheimer’s disease. Frontiers in Aging Neuroscience (2019), pp. 251. [CrossRef]
- Li J, Antonecchia E, Camerlenghi M, Chiaravalloti A, Chu Q, Costanzo AD, et al. Correlation of [18F] florbetaben textural features and age of onset of Alzheimer’s disease: a principal components analysis approach. EJNMMI research (2021) 11, pp. 1-14. [CrossRef]
- Jeon S, Kang JM, Seo S, Jeong HJ, Funck T, Lee S, et al. Topographical heterogeneity of Alzheimer’s disease based on MR imaging, tau PET, and amyloid PET. Frontiers in aging neuroscience (2019), 211.
- Tuszynski T, Rullmann M, Luthardt J, Butzke D, Tiepolt S, Gertz H, et al. Evaluation of software tools for automated identification of neuroanatomical structures in quantitative β-amyloid PET imaging to diagnose Alzheimer’s disease. European journal of nuclear medicine and molecular imaging (2016) 43, pp. 1077-87. [CrossRef]
- Cho SH, Shin J, Jang H, Park S, Kim HJ, Kim SE, et al. Amyloid involvement in subcortical regions predicts cognitive decline. European journal of nuclear medicine and molecular imaging (2018) 45, pp. 2368-76. [CrossRef]
- Ortner M, Drost R, Heddderich D, Goldhardt O, Müller-Sarnowski F, Diehl-Schmid J, et al. Amyloid PET, FDG-PET or MRI?-the power of different imaging biomarkers to detect progression of early Alzheimer’s disease. BMC neurology (2019) 19, pp. 1-6.
- Schwarz CG, Senjem ML, Gunter JL, Tosakulwong N, Weigand SD, Kemp BJ, et al. Optimizing PiB-PET SUVR change-over-time measurement by a large-scale analysis of longitudinal reliability, plausibility, separability, and correlation with MMSE. Neuroimage (2017) 144, pp. 113-27.
- Morris E, Chalkidou A, Hammers A, Peacock J, Summers J, Keevil S. Diagnostic accuracy of 18F amyloid PET tracers for the diagnosis of Alzheimer’s disease: a systematic review and meta-analysis. European journal of nuclear medicine and molecular imaging (2016) 43, pp. 374-85. [CrossRef]
- Schwarz CG, Gunter JL, Lowe VJ, Weigand S, Vemuri P, Senjem ML, et al. A comparison of partial volume correction techniques for measuring change in serial amyloid PET SUVR. J Alzheimer’s Dis (2019) 67, pp. 181-95. [CrossRef]
- Akamatsu G, Ikari Y, Ohnishi A, Matsumoto K, Nishida H, Yamamoto Y, et al. Voxel-based statistical analysis and quantification of amyloid PET in the Japanese Alzheimer’s disease neuroimaging initiative (J-ADNI) multi-center study. EJNMMI research (2019) 9, pp. 1-9. [CrossRef]
- Shimokawa N, Akamatsu G, Kadosaki M, Sasaki M. Feasibility study of a PET-only amyloid quantification method: a comparison with visual interpretation. Ann Nucl Med (2020) 34, pp. 629-35. [CrossRef]
- Akamatsu G, Ikari Y, Ohnishi A, Nishida H, Aita K, Sasaki M, et al. Automated PET-only quantification of amyloid deposition with adaptive template and empirically pre-defined ROI. Physics in Medicine & Biology (2016) 61, pp. 5768. [CrossRef]
- Shimokawa N, Akamatsu G, Kadosaki M, Sasaki M. Feasibility study of a PET-only amyloid quantification method: a comparison with visual interpretation. Ann Nucl Med (2020) 34, pp. 629-35. [CrossRef]
- Lundqvist R, Lilja J, Thomas BA, Lötjönen J, Villemagne VL, Rowe CC, et al. Implementation and validation of an adaptive template registration method for 18F-flutemetamol imaging data. Journal of Nuclear Medicine (2013) 54, pp. 1472-8. [CrossRef]
- FreeSurfer https://surfer.nmr.mgh.harvard.edu/ Accessed 1 March 2022.
- PMOD https://www.pmod.com/ Accessed 1 March 2022.
- Chang Y, Li C, Yang H, Wu Y, Xu B, Zhang J, et al. 18F-Florbetaben Amyloid PET Imaging: A Chinese Study in Cognitive Normal Controls, Mild Cognitive Impairment, and Alzheimer’s Disease Patients. Frontiers in Neuroscience (2020), 745.
- Hatashita S, Wakebe D, Kikuchi Y, Ichijo A. Longitudinal assessment of amyloid-β deposition by [18F]-flutemetamol PET imaging compared with [11C]-PIB across the spectrum of Alzheimer’s disease. Frontiers in Aging Neuroscience (2019), 251. [CrossRef]
- Cho SH, Choe YS, Kim YJ, Lee B, Kim HJ, Jang H, et al. Concordance in detecting amyloid positivity between 18F-florbetaben and 18F-flutemetamol amyloid PET using quantitative and qualitative assessments. Scientific Reports (2020) 10, pp. 1-10. [CrossRef]
- Landau SM, Thomas BA, Thurfjell L, Schmidt M, Margolin R, Mintun M, et al. Amyloid PET imaging in Alzheimer’s disease: a comparison of three radiotracers. European journal of nuclear medicine and molecular imaging (2014) 41:1398-407. [CrossRef]
- Schain M, Varnäs K, Cselényi Z, Halldin C, Farde L, Varrone A. Evaluation of two automated methods for PET region of interest analysis. Neuroinformatics (2014) 12, pp. 551-62. [CrossRef]
- Marcoux A, Burgos N, Bertrand A, Teichmann M, Routier A, Wen J, et al. An automated pipeline for the analysis of PET data on the cortical surface. Frontiers in neuroinformatics (2018), 94. [CrossRef]
- Landau SM, Breault C, Joshi AD, Pontecorvo M, Mathis CA, Jagust WJ, et al. Amyloid-β imaging with Pittsburgh compound B and florbetapir: comparing radiotracers and quantification methods. Journal of Nuclear Medicine (2013) 54, pp. 70-7. [CrossRef]
- Chawalparit O, Wontaneeporn N, Muangpaisan W, Thientunyakit T, Charnchaowanish P. MRI hippocampal subfield volume analysis: Comparison between Alzheimer’s disease, mild cognitive impairment, and normal aging subjects in an amyloid PET project. J Alzheimers Dis Parkinsonism (2019) 9, 2161,0460.1000459.
- Ouyang J, Chen KT, Gong E, Pauly J, Zaharchuk G. Ultra-low-dose PET reconstruction using generative adversarial network with feature matching and task-specific perceptual loss. Med Phys (2019) 46, pp. 3555-64. [CrossRef]
- Chen KT, Gong E, de Carvalho Macruz, Fabiola Bezerra, Xu J, Boumis A, Khalighi M, et al. Ultra–low-dose 18F-florbetaben amyloid PET imaging using deep learning with multi-contrast MRI inputs. Radiology (2019) 290, pp. 649-56. [CrossRef]
- Okonkwo DO, Puffer RC, Minhas DS, Beers SR, Edelman KL, Sharpless J, et al. [18F] FDG,[11C] PiB, and [18F] AV-1451 PET imaging of neurodegeneration in two subjects with a history of repetitive trauma and cognitive decline. Frontiers in Neurology (2019), pp. 831. [CrossRef]
- Su Y, D’Angelo GM, Vlassenko AG, Zhou G, Snyder AZ, Marcus DS, et al. Quantitative analysis of PiB-PET with freesurfer ROIs. PloS one (2013) 8, e73377.
- Tsubaki Y, Akamatsu G, Shimokawa N, Katsube S, Takashima A, Sasaki M. Development and evaluation of an automated quantification tool for amyloid PET images. EJNMMI physics (2020) 7, pp. 1-12. [CrossRef]
- Battle MR, Pillay LC, Lowe VJ, Knopman D, Kemp B, Rowe CC, et al. Centiloid scaling for quantification of brain amyloid with [18 F] flutemetamol using multiple processing methods. EJNMMI research (2018) 8, pp. 1-11. [CrossRef]
- Haller S, Montandon M, Lilja J, Rodriguez C, Garibotto V, Herrmann FR, et al. PET amyloid in normal aging: direct comparison of visual and automatic processing methods. Scientific reports (2020) 10, pp. 1-8. [CrossRef]
- Oliveira F, Leuzy A, Castelhano J, Chiotis K, Hasselbalch SG, Rinne J, et al. Data driven diagnostic classification in Alzheimer’s disease based on different reference regions for normalization of PiB-PET images and correlation with CSF concentrations of Aβ species. NeuroImage: Clinical (2018) 20, pp. 603-10.
- Yoon HJ, Cho K, Kim WG, Jeong Y, Jeong J, Kang D. Heterogeneity by global and textural feature analysis in F-18 FP-CIT brain PET images for diagnosis of Parkinson’s disease. Medicine (2021) 100. [CrossRef]
- Son HJ, Jeong YJ, Yoon HJ, Kim JW, Choi G, Park JH, et al. Parkinson disease-related cortical and striatal cognitive patterns in dual time F-18 FP CIT: evidence for neural correlates between the caudate and the frontal lobe. The Quarterly Journal of Nuclear Medicine and Molecular Imaging: Official Publication of the Italian Association of Nuclear Medicine (AIMN)[and] the International Association of Radiopharmacology (IAR),[and] Section of the Society of.. (2017) 63, pp. 379-86.
- Yoon HJ, Jeong YJ, Son HJ, Kang D, Hyun K, Lee M. Optimization of the spatial resolution for the GE discovery PET/CT 710 by using NEMA NU 2-2007 standards. Journal of the Korean Physical Society (2015) 66, pp. 287-94. [CrossRef]
- Jeong YJ, Jeong J, Cheon S, Yoon B, Kim JW, Kang D. Relationship between the washout rate of I-123 MIBG scans and autonomic function in Parkinson’s disease. Plos one (2020) 15, e0229860. [CrossRef]
- MedCalc https://www.medcalc.org/ Accessed 1 June 2022.
- Unal I. Defining an optimal cut-point value in ROC analysis: an alternative approach. Computational and mathematical methods in medicine (2017) 2017.stylefix. [CrossRef]
Figure 1.
The negative (A) and positive (B) FBB brain PET images. Cropped T1-weighted MRI (top), cropped PET in MRI space (middle), and cropped brain segments image using the AAL atlas in MRI space (bottom) are shown.
Figure 1.
The negative (A) and positive (B) FBB brain PET images. Cropped T1-weighted MRI (top), cropped PET in MRI space (middle), and cropped brain segments image using the AAL atlas in MRI space (bottom) are shown.
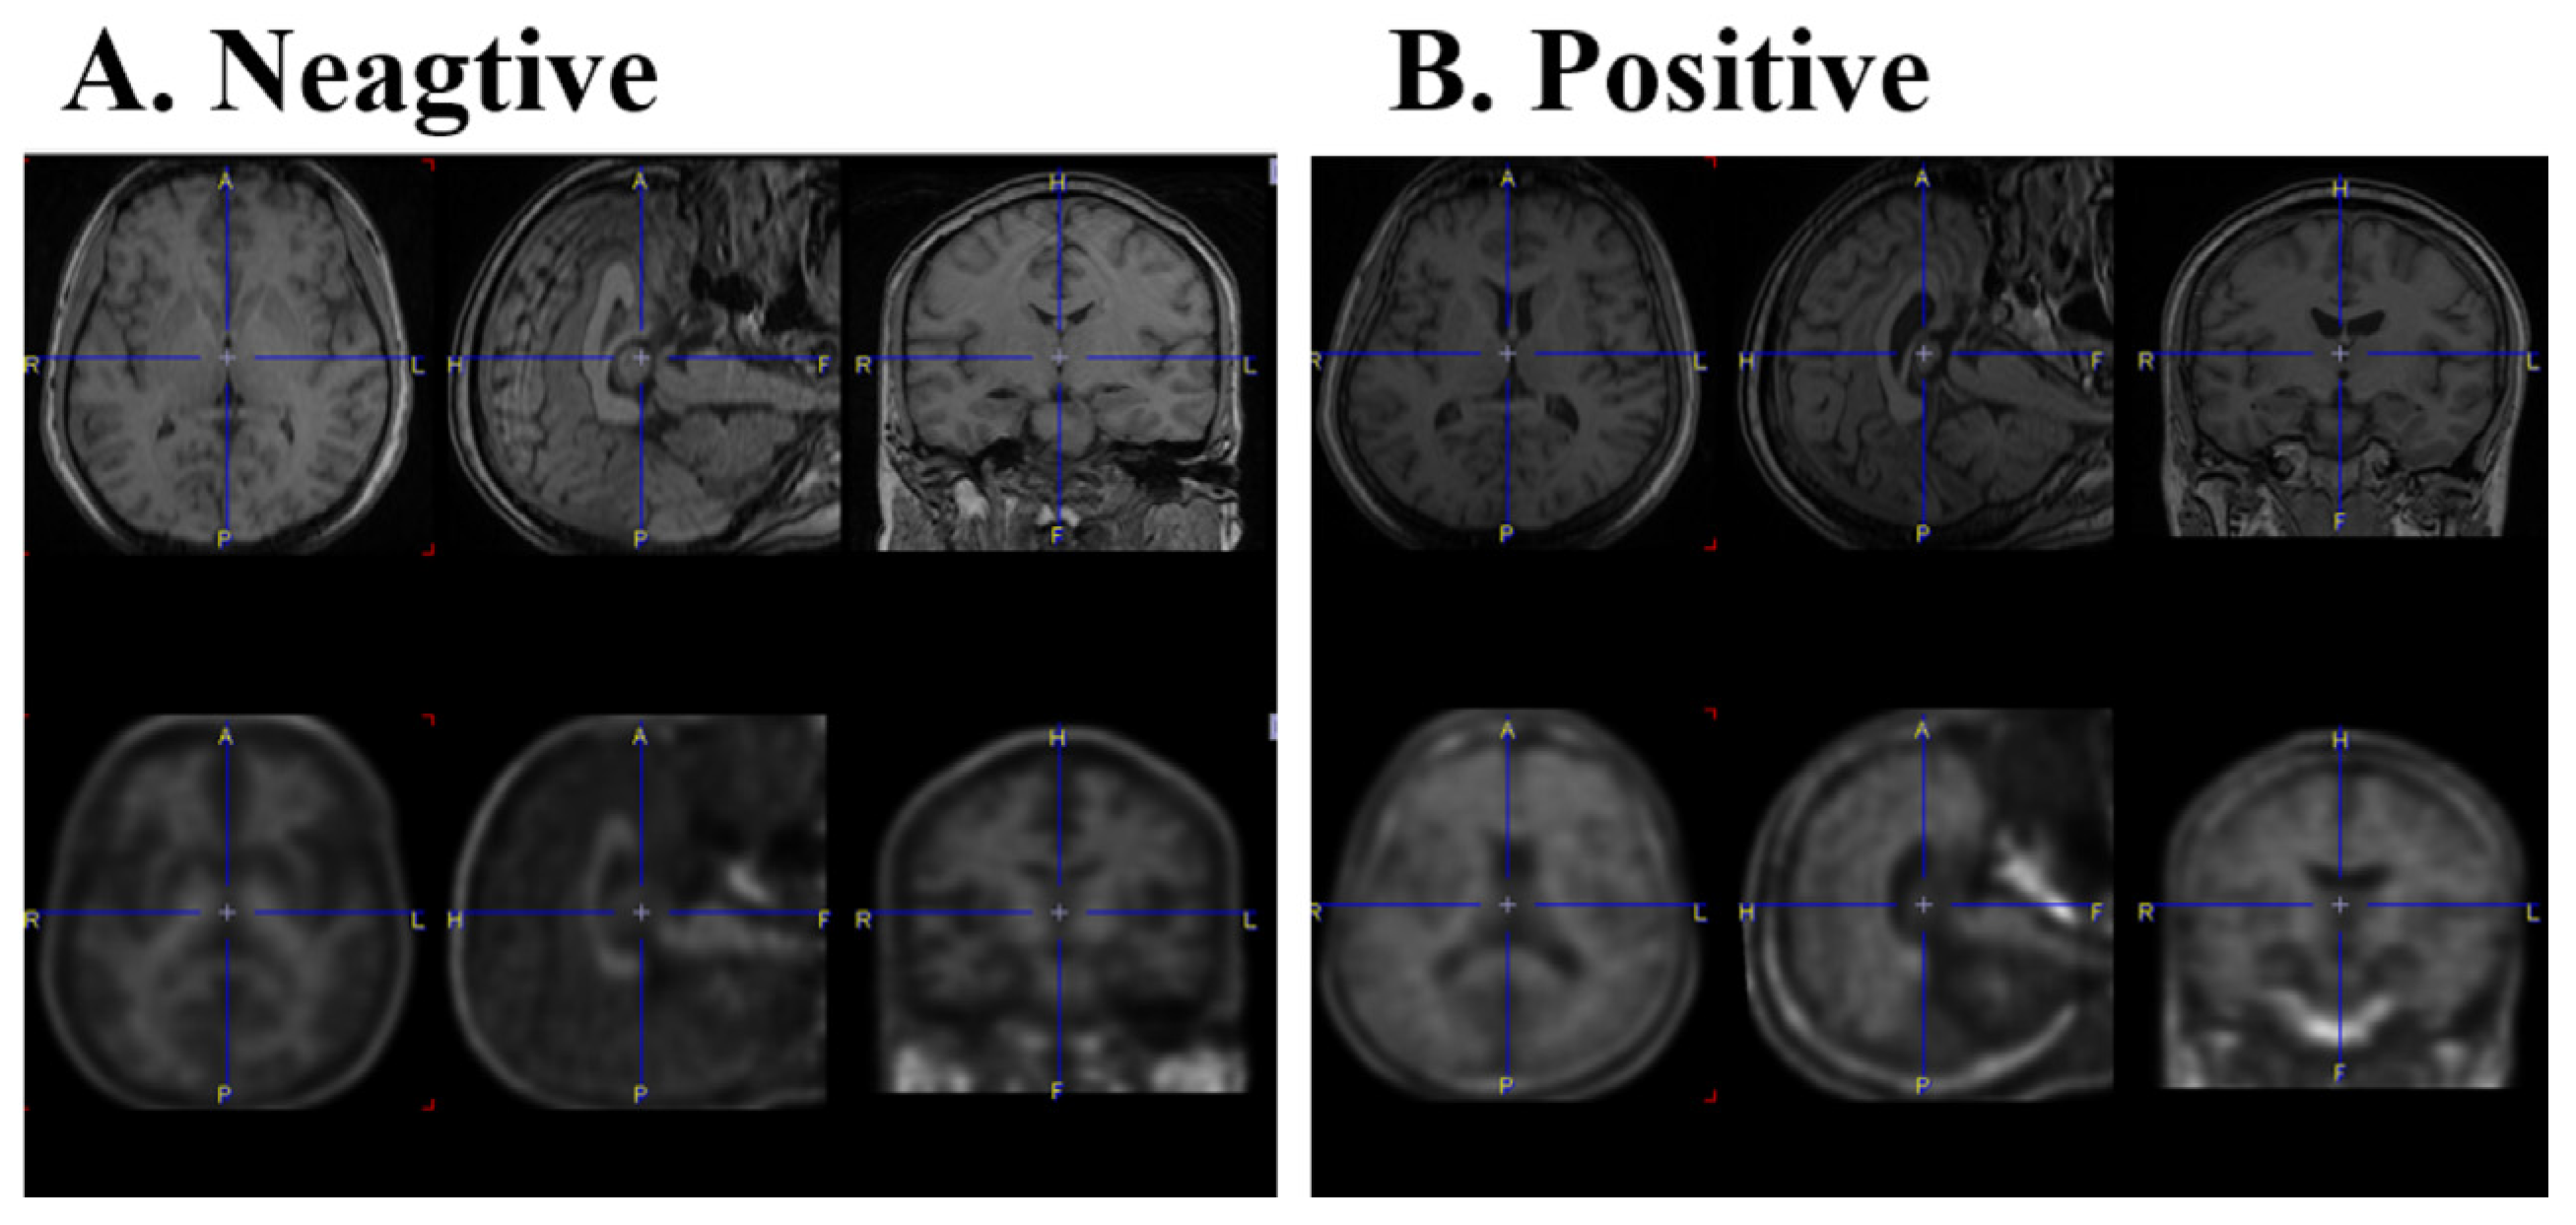
Figure 2.
Representation of parcellation and segmentation images using PMOD (A), cortical parcellation, and sub-cortical segmentation images using FreeSurfer (B), AAL atlas (C), and Desikan-Killiany atlas (D).
Figure 2.
Representation of parcellation and segmentation images using PMOD (A), cortical parcellation, and sub-cortical segmentation images using FreeSurfer (B), AAL atlas (C), and Desikan-Killiany atlas (D).
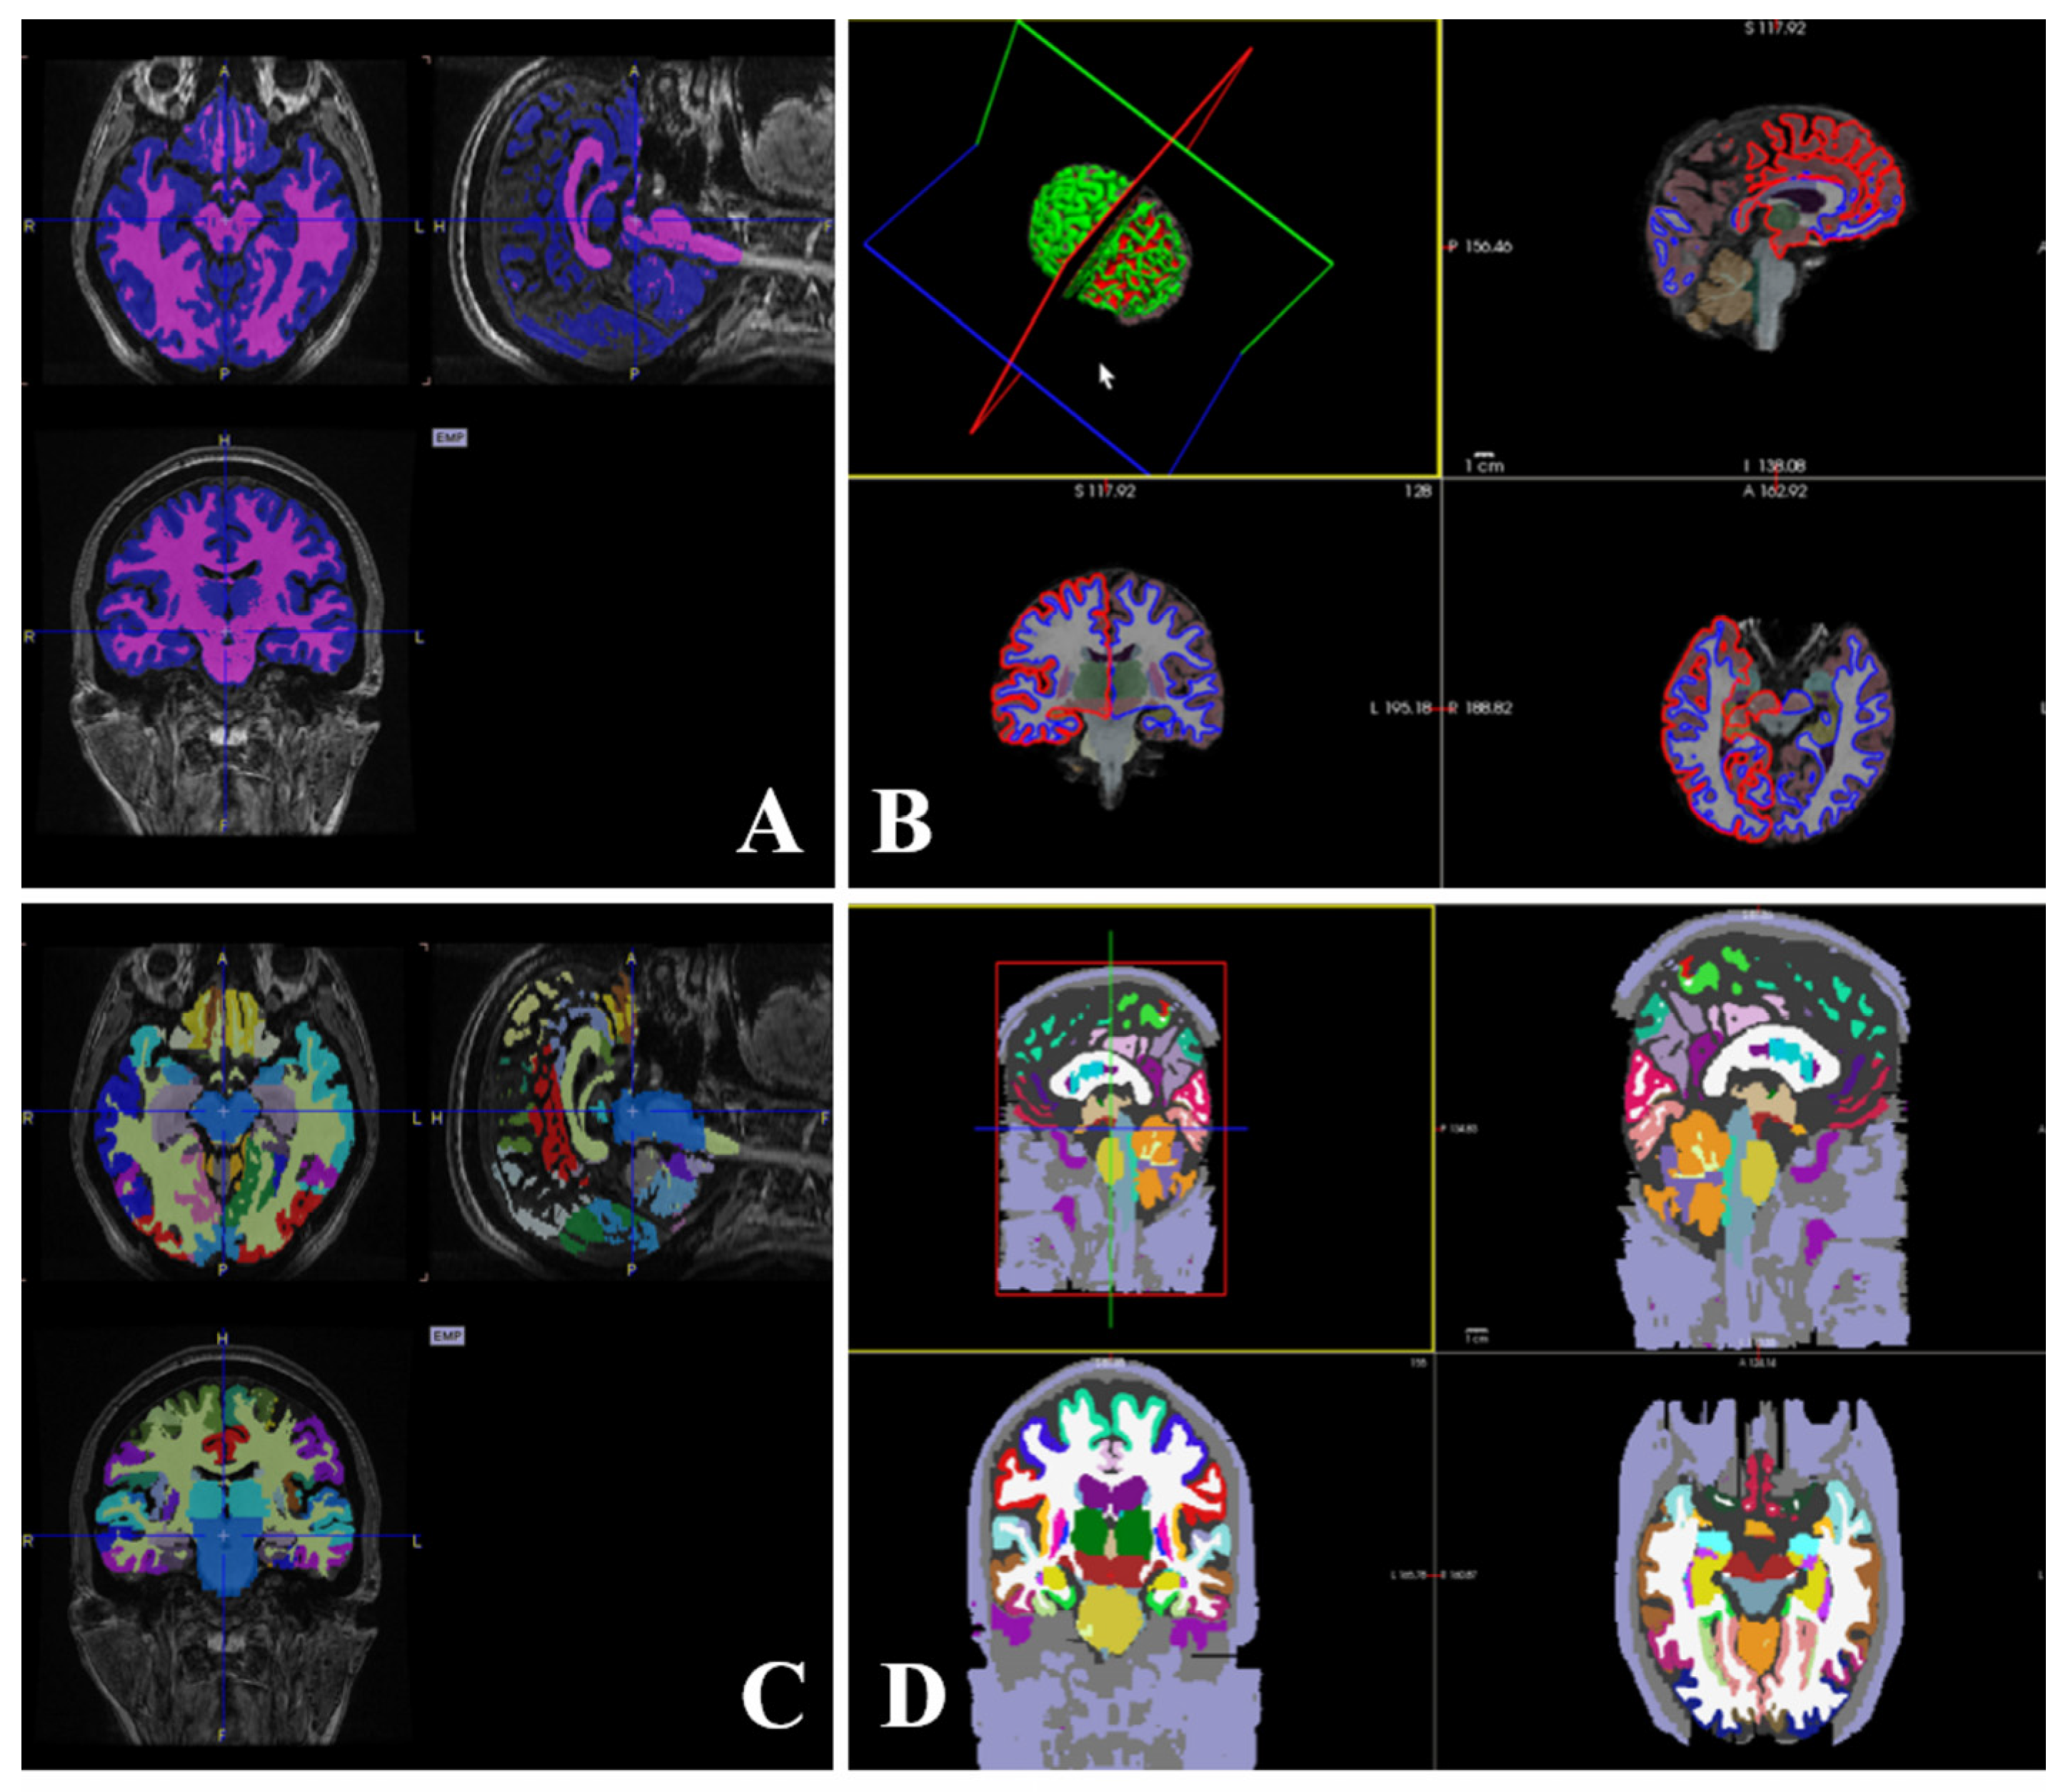
Figure 3.
A box plot comparing the normal and patient groups by extracting SUVr of FBB, FMM, and FPN PET from nine regions using PMOD.
Figure 3.
A box plot comparing the normal and patient groups by extracting SUVr of FBB, FMM, and FPN PET from nine regions using PMOD.
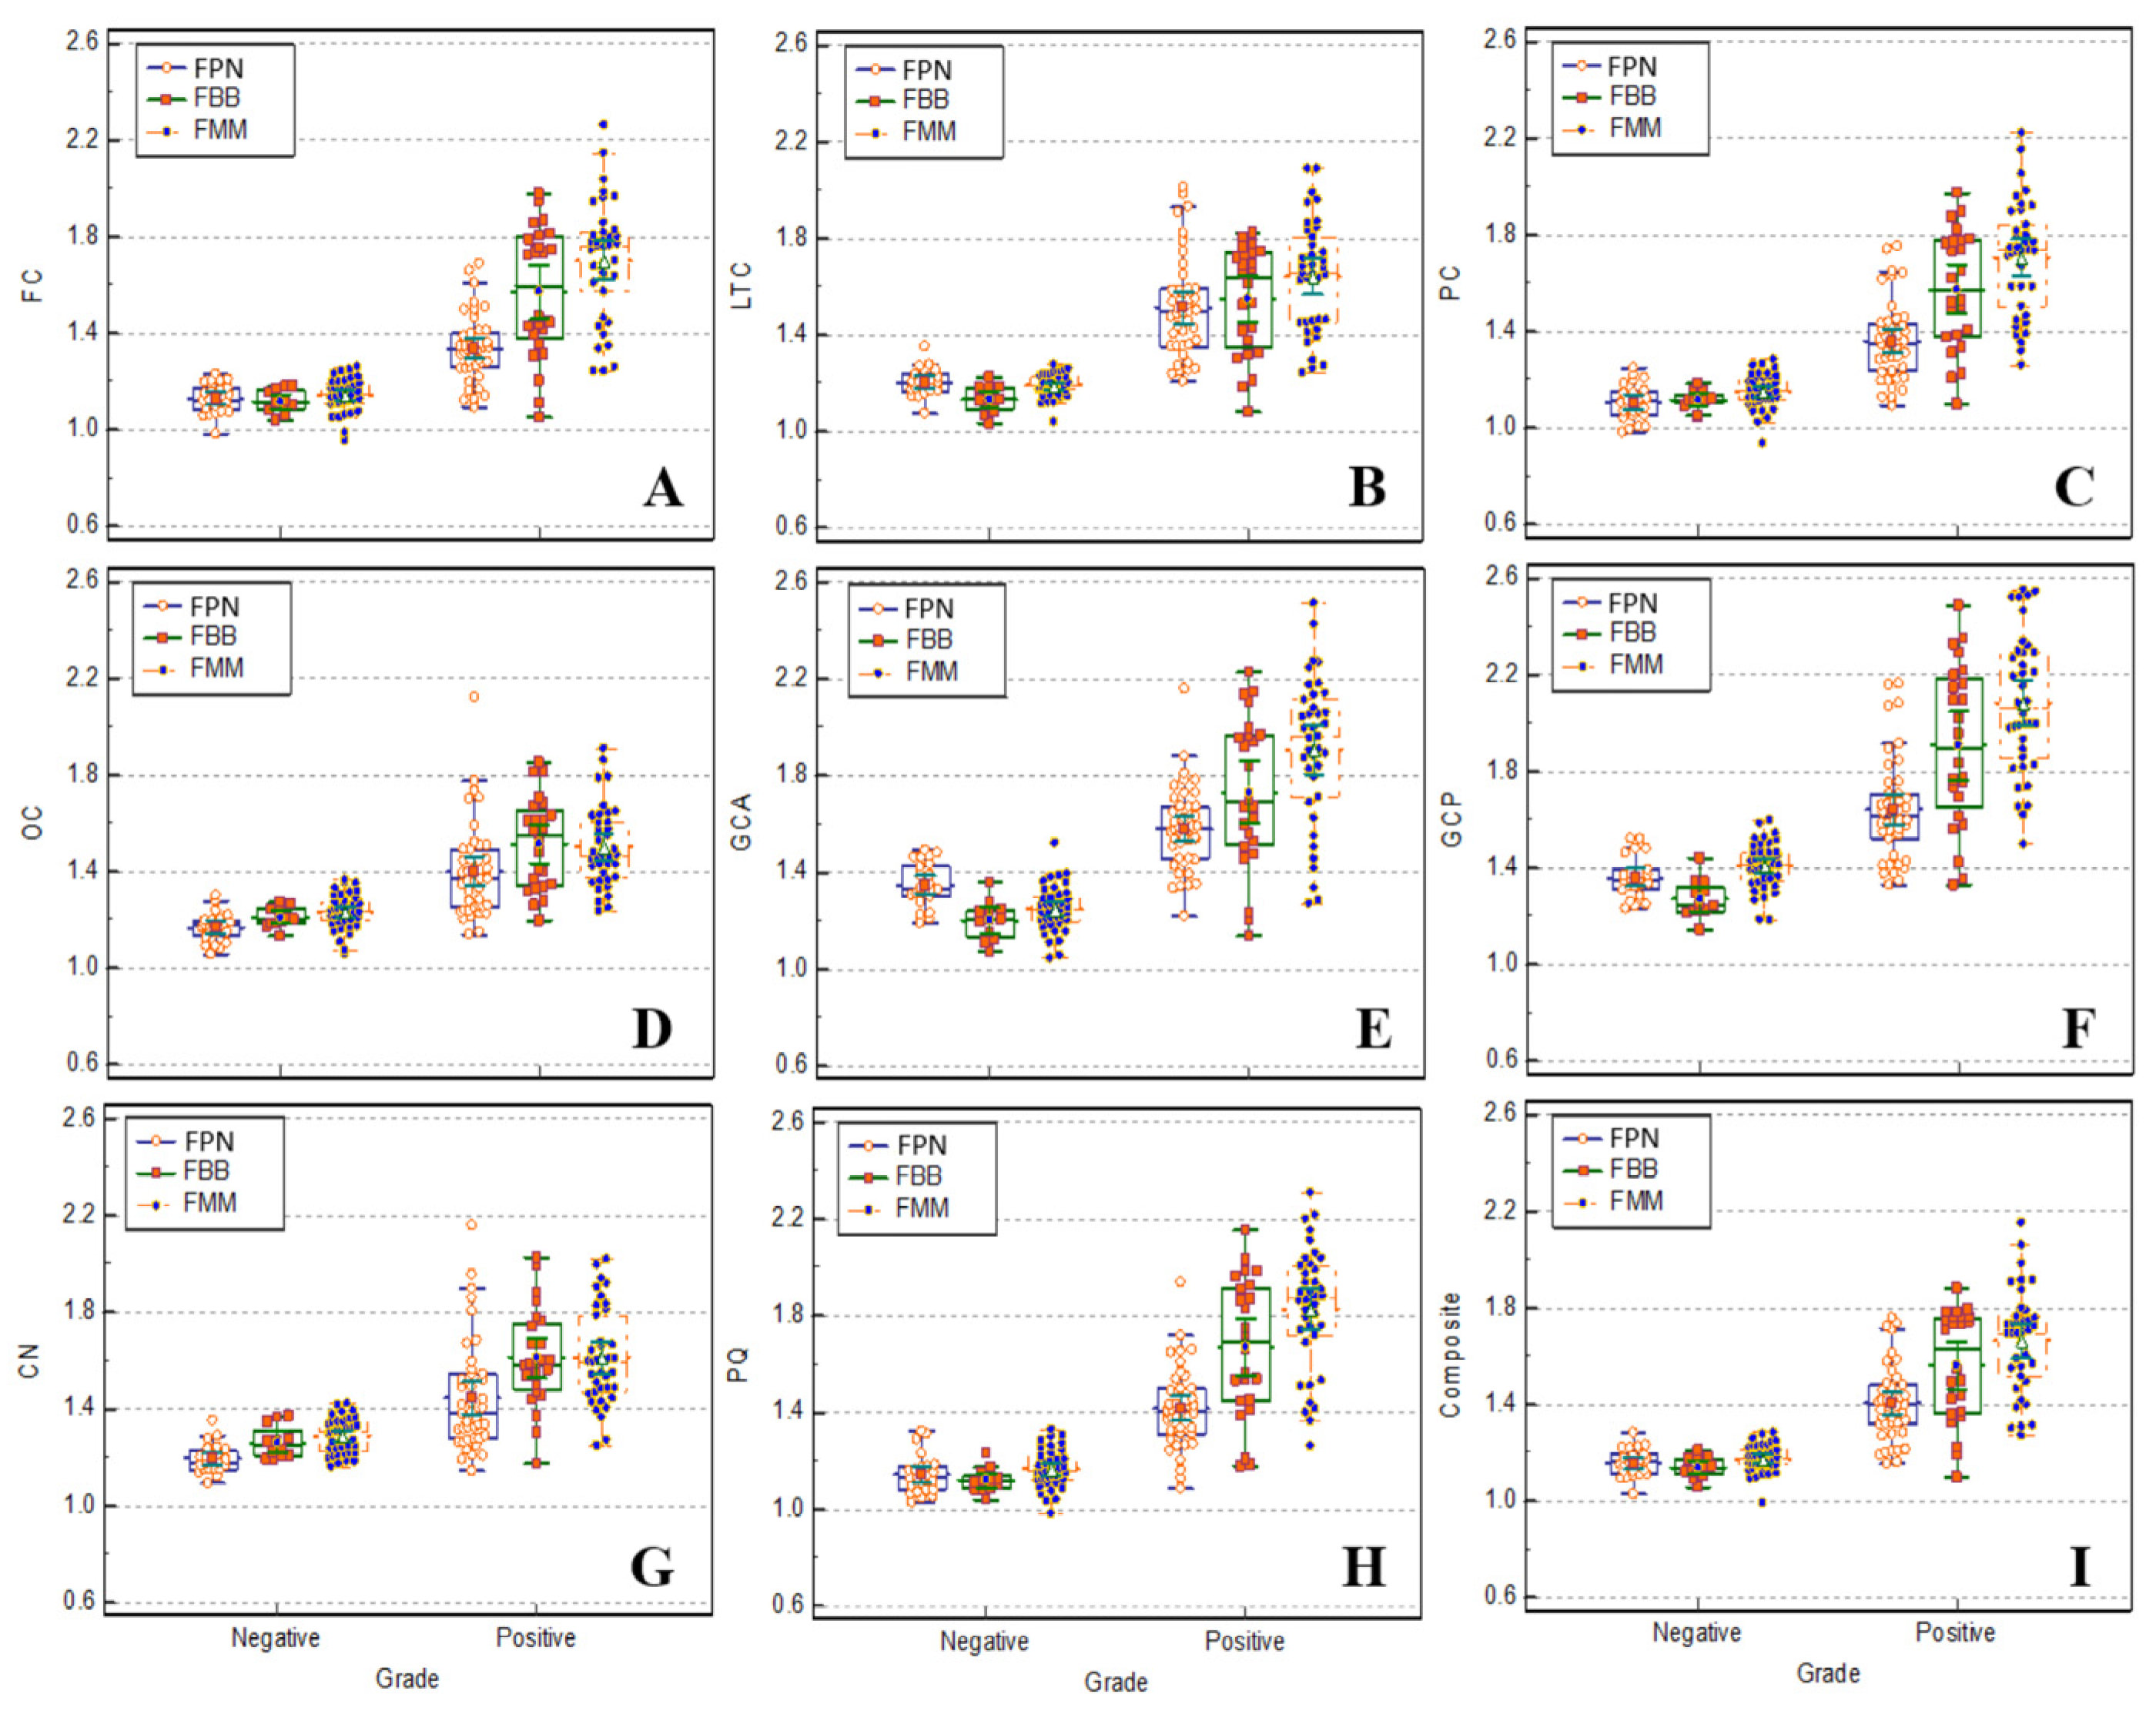
Figure 4.
A box plot comparing the normal and patient groups by extracting SUVr of FBB, FMM, and FPN PET from nine regions using FreeSurfer.
Figure 4.
A box plot comparing the normal and patient groups by extracting SUVr of FBB, FMM, and FPN PET from nine regions using FreeSurfer.
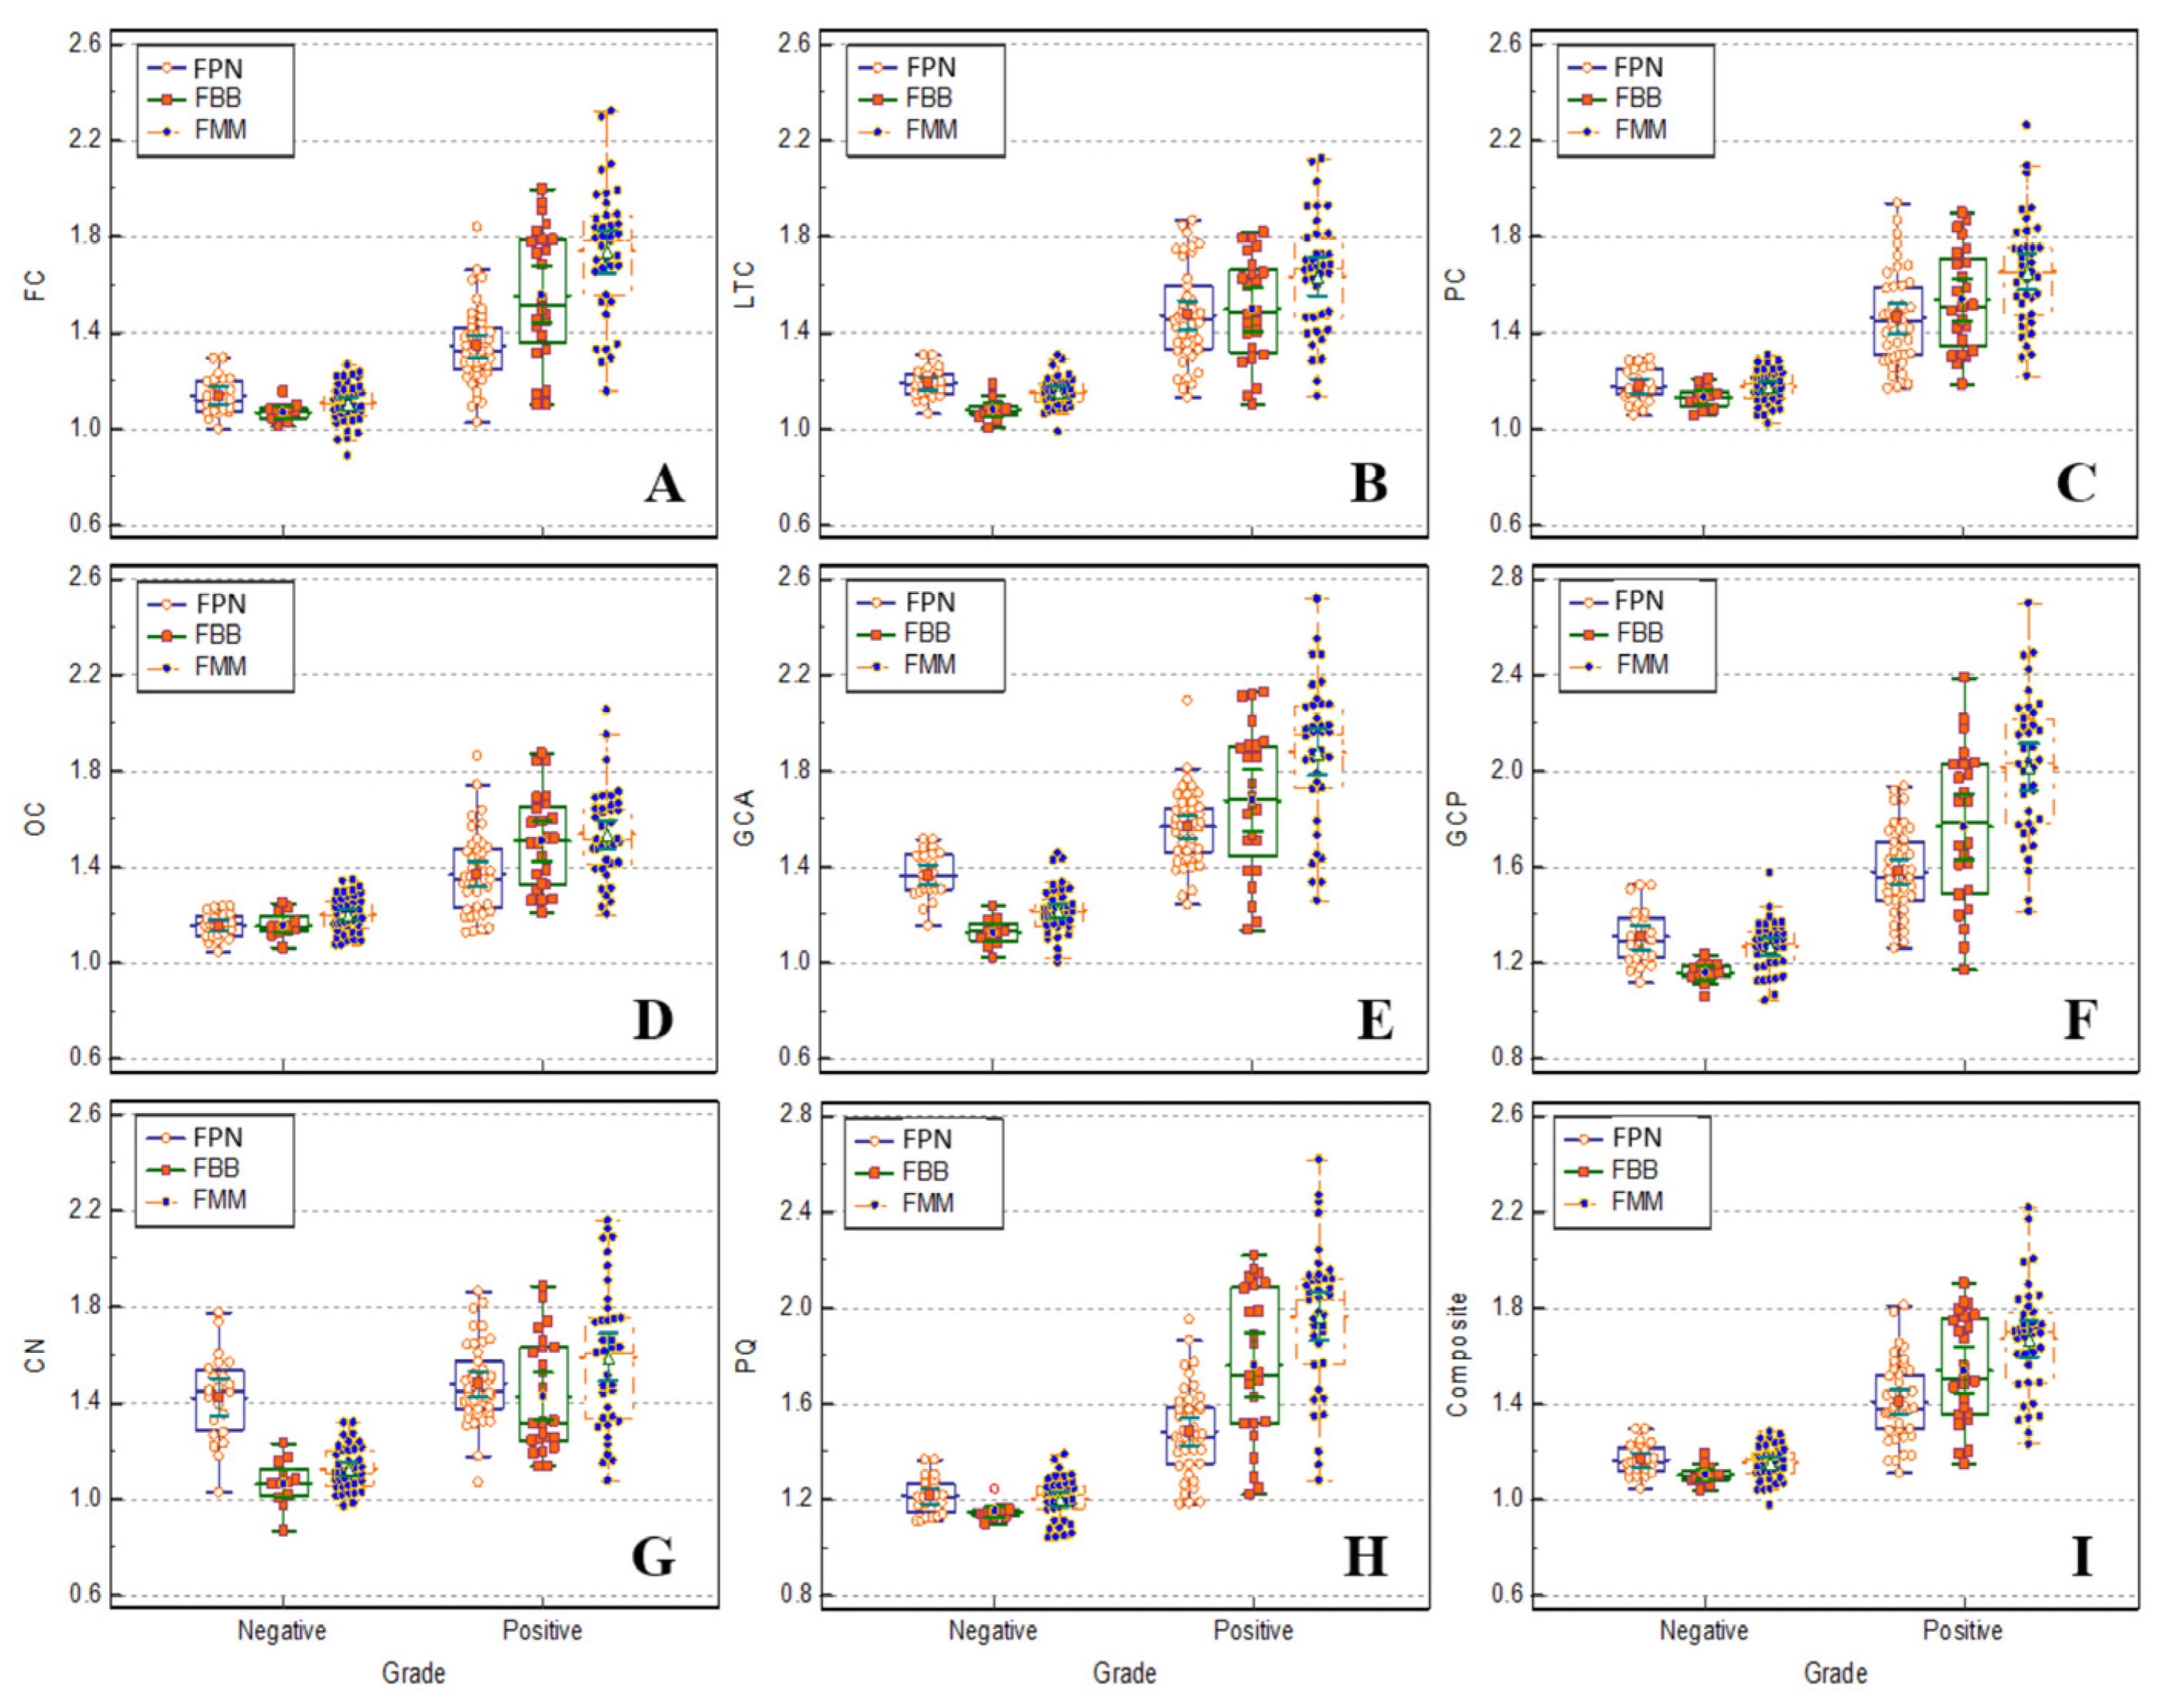
Figure 5.
Box plot comparing SUVr calculated in the composite region using PMOD of FBB (A, B, C), FMM (D, E, F), FPN (G, H, I) brain PET between the normal and patient groups. The distribution of SUVr in the composite region is presented as a box plot between normal and patient groups by dividing according to age (B, E, H) and sex (C, F, I).
Figure 5.
Box plot comparing SUVr calculated in the composite region using PMOD of FBB (A, B, C), FMM (D, E, F), FPN (G, H, I) brain PET between the normal and patient groups. The distribution of SUVr in the composite region is presented as a box plot between normal and patient groups by dividing according to age (B, E, H) and sex (C, F, I).
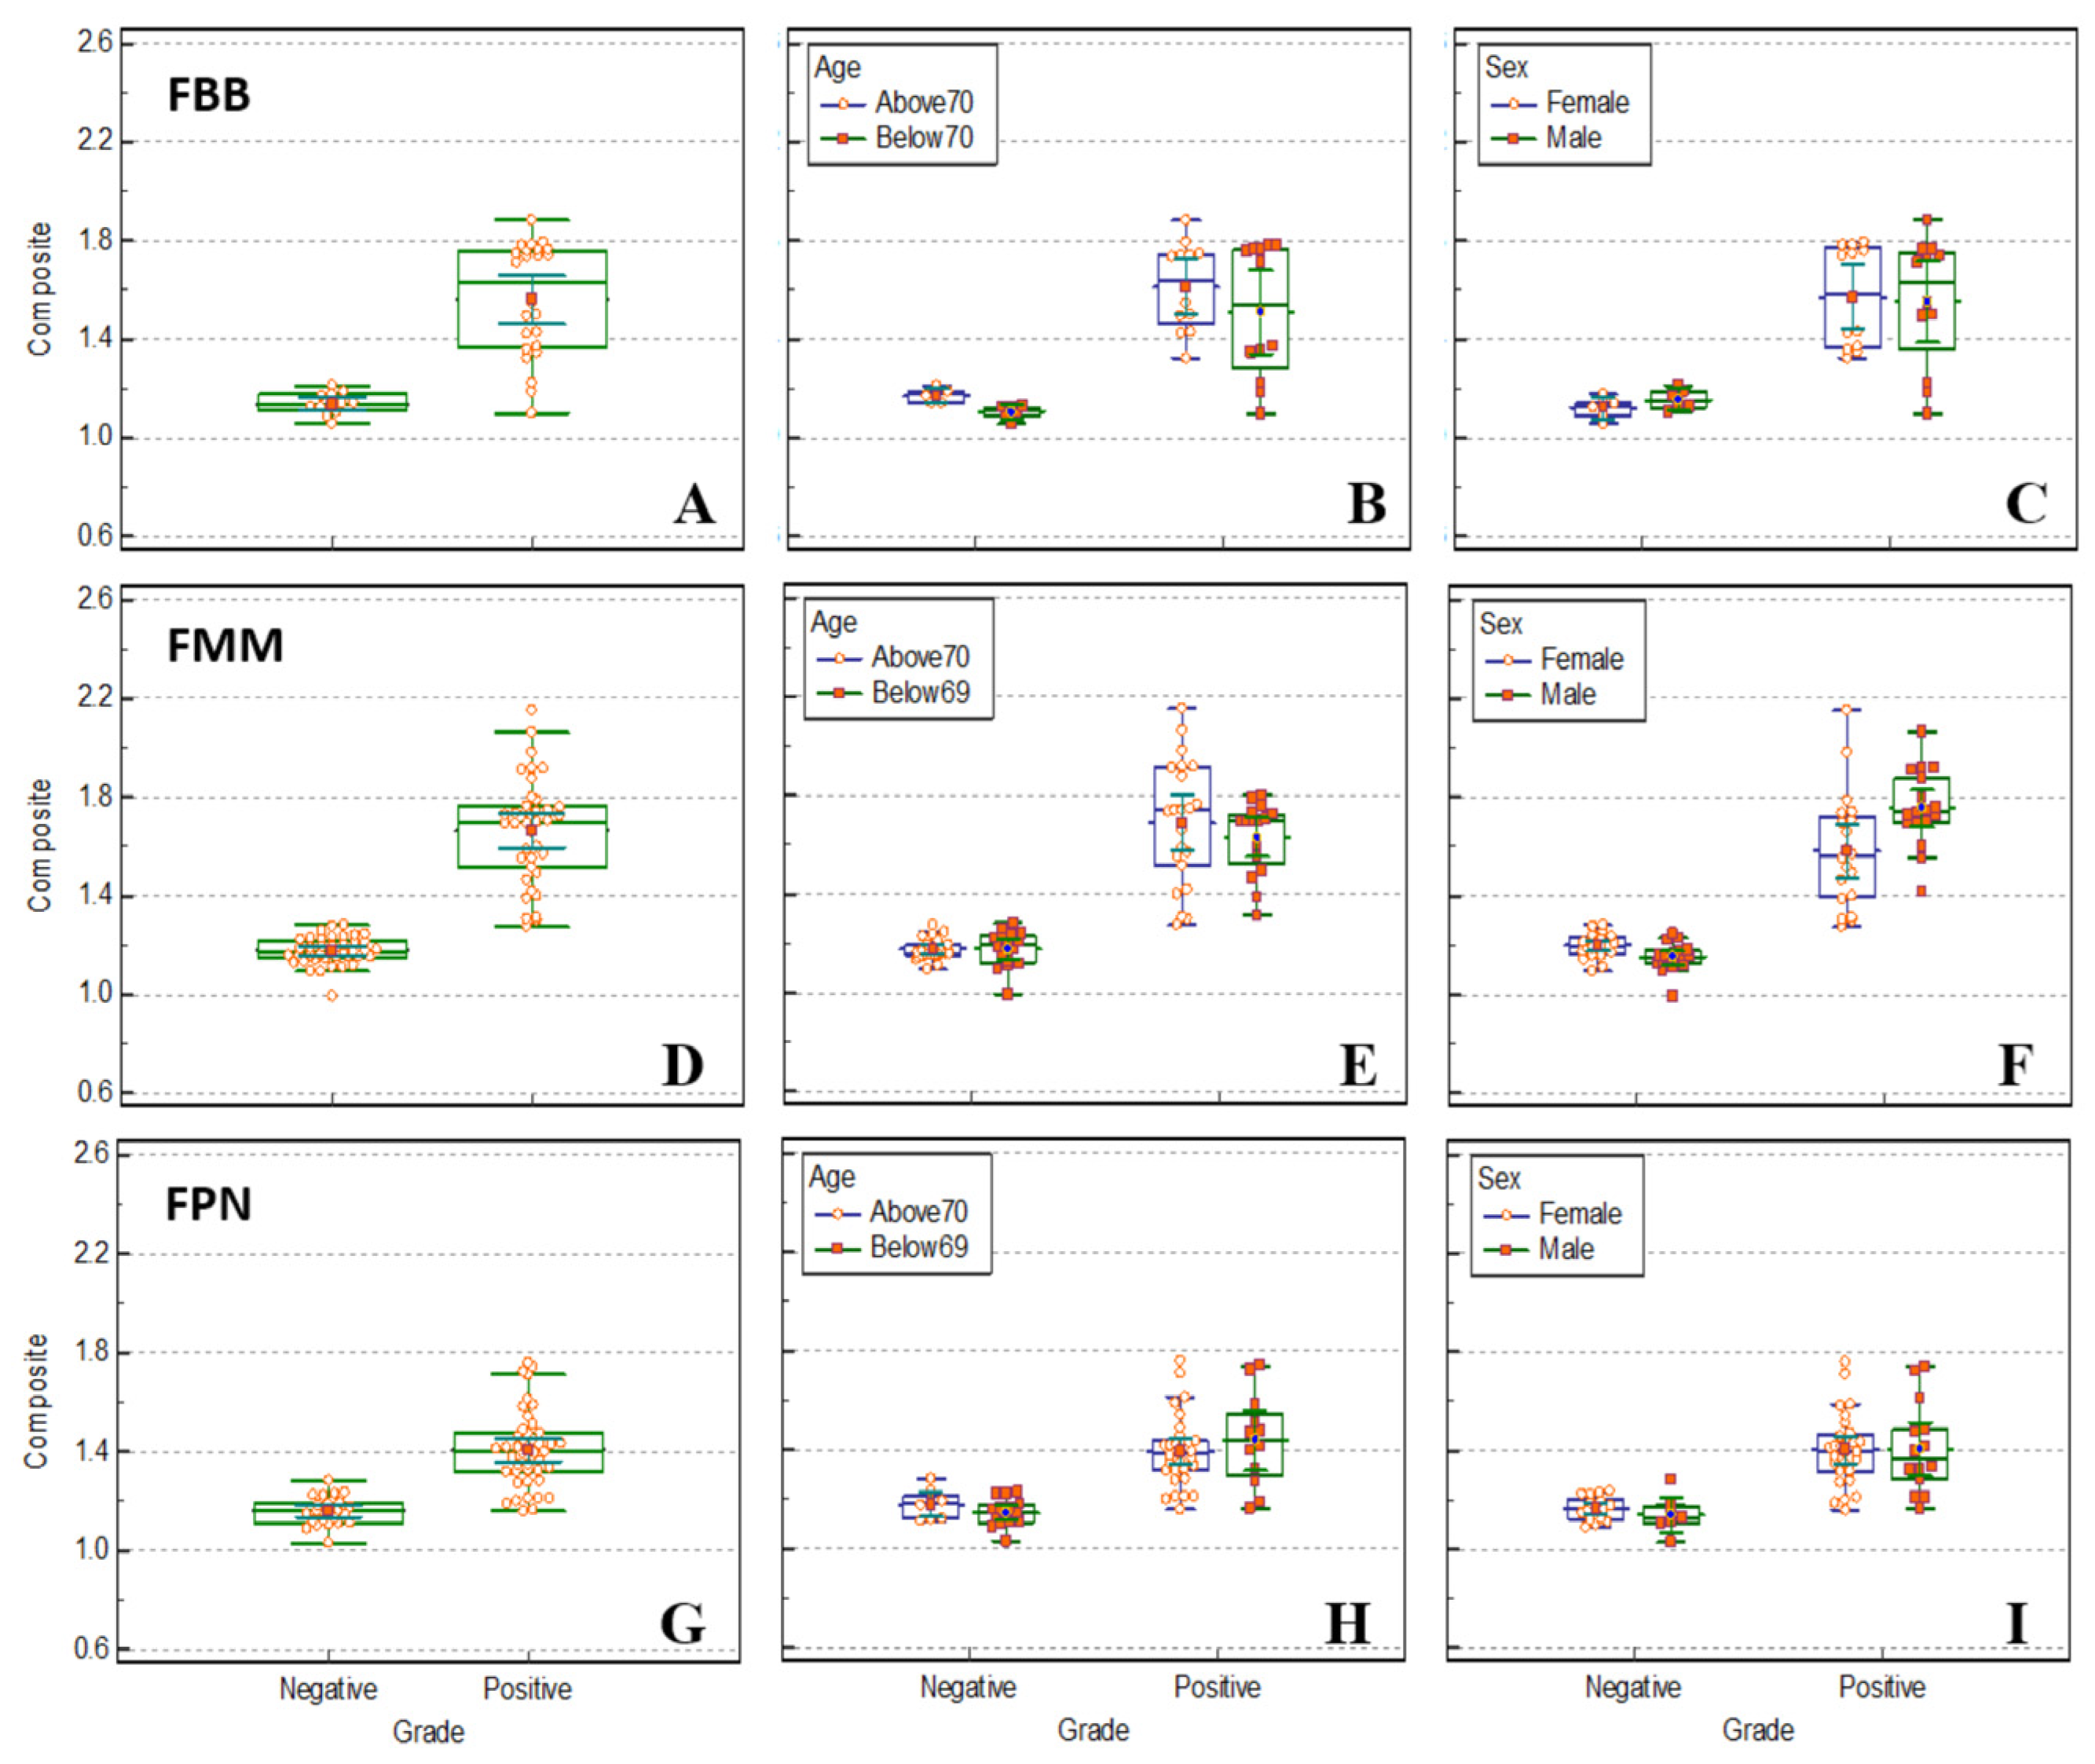
Figure 6.
Box plot comparing SUVr calculated in the composite region using FreeSurfer of FBB (A, B, C), FMM (D, E, F), FPN (G, H, I) brain PET between the normal and patient groups. The distribution of SUVr in the composite region is presented as a box plot between the normal and patient groups by dividing according to age (B, E, H) and sex (C, F, I).
Figure 6.
Box plot comparing SUVr calculated in the composite region using FreeSurfer of FBB (A, B, C), FMM (D, E, F), FPN (G, H, I) brain PET between the normal and patient groups. The distribution of SUVr in the composite region is presented as a box plot between the normal and patient groups by dividing according to age (B, E, H) and sex (C, F, I).
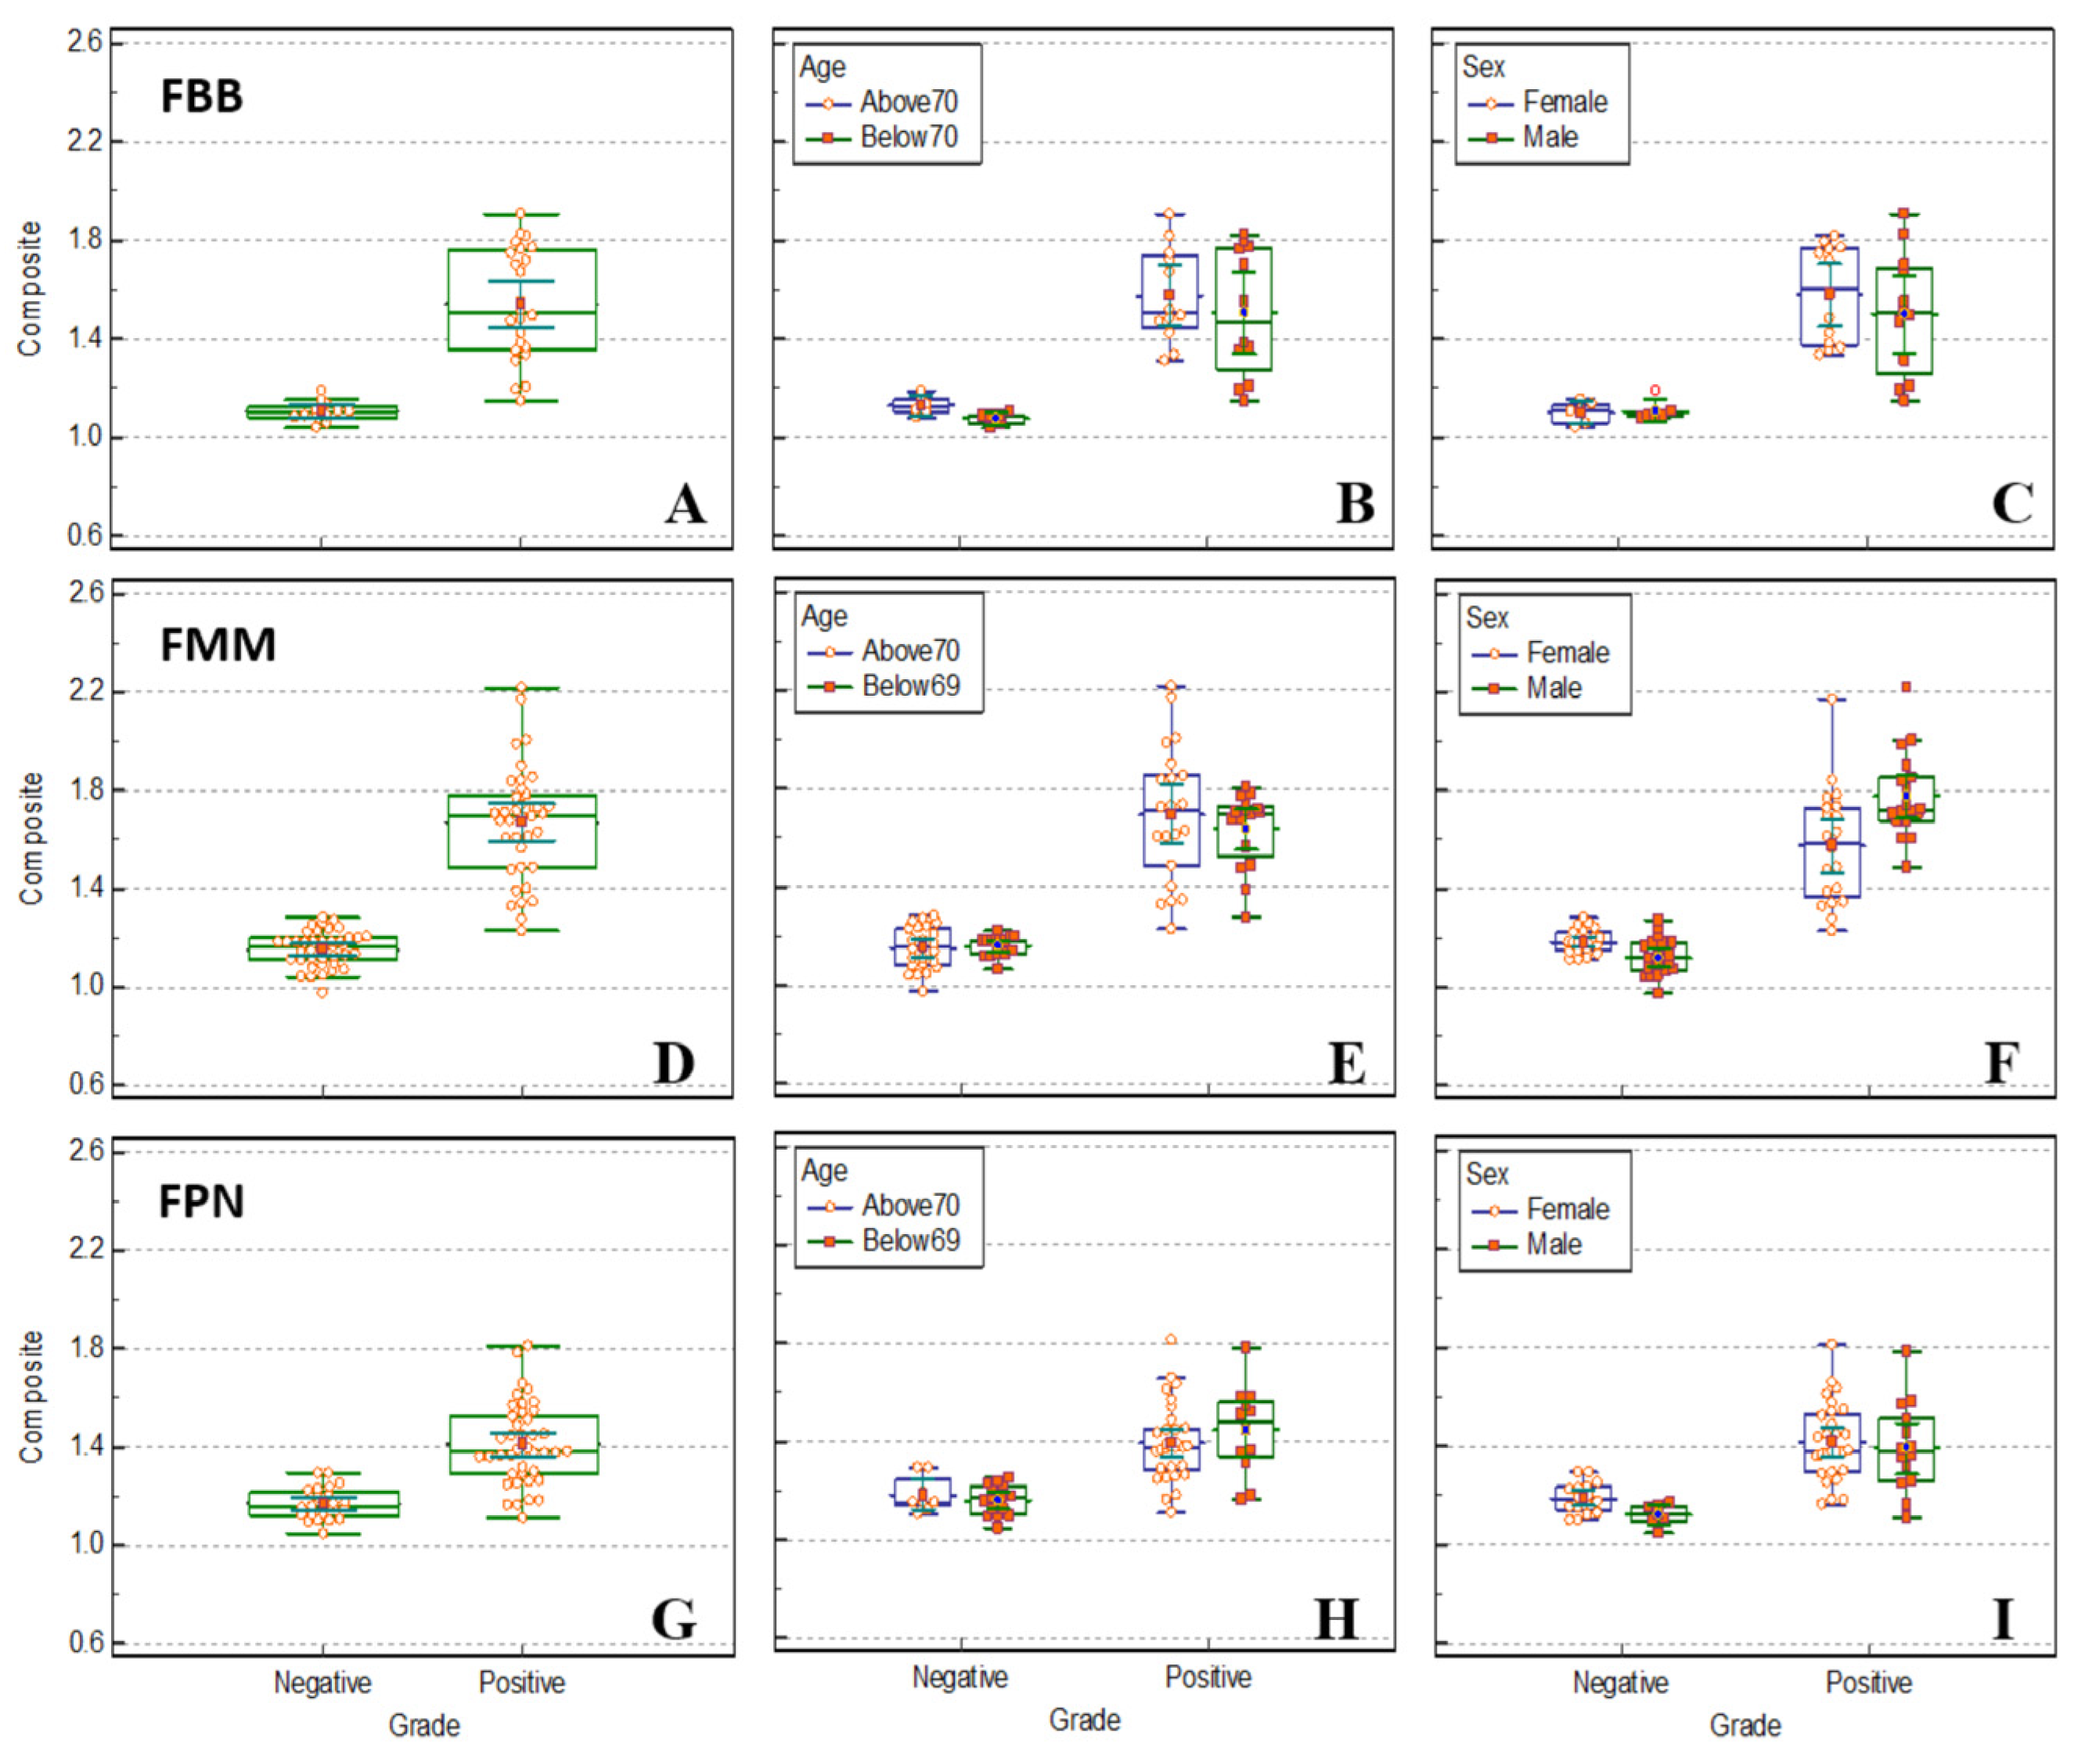
Figure 7.
Scatter plot of FBB brain PET SUVr calculated using PMOD and FreeSurfer algorithms. The x-axis is FreeSurfer and the y-axis is the FBB brain PET SUVr calculated using the FreeSurfer algorithm.
Figure 7.
Scatter plot of FBB brain PET SUVr calculated using PMOD and FreeSurfer algorithms. The x-axis is FreeSurfer and the y-axis is the FBB brain PET SUVr calculated using the FreeSurfer algorithm.
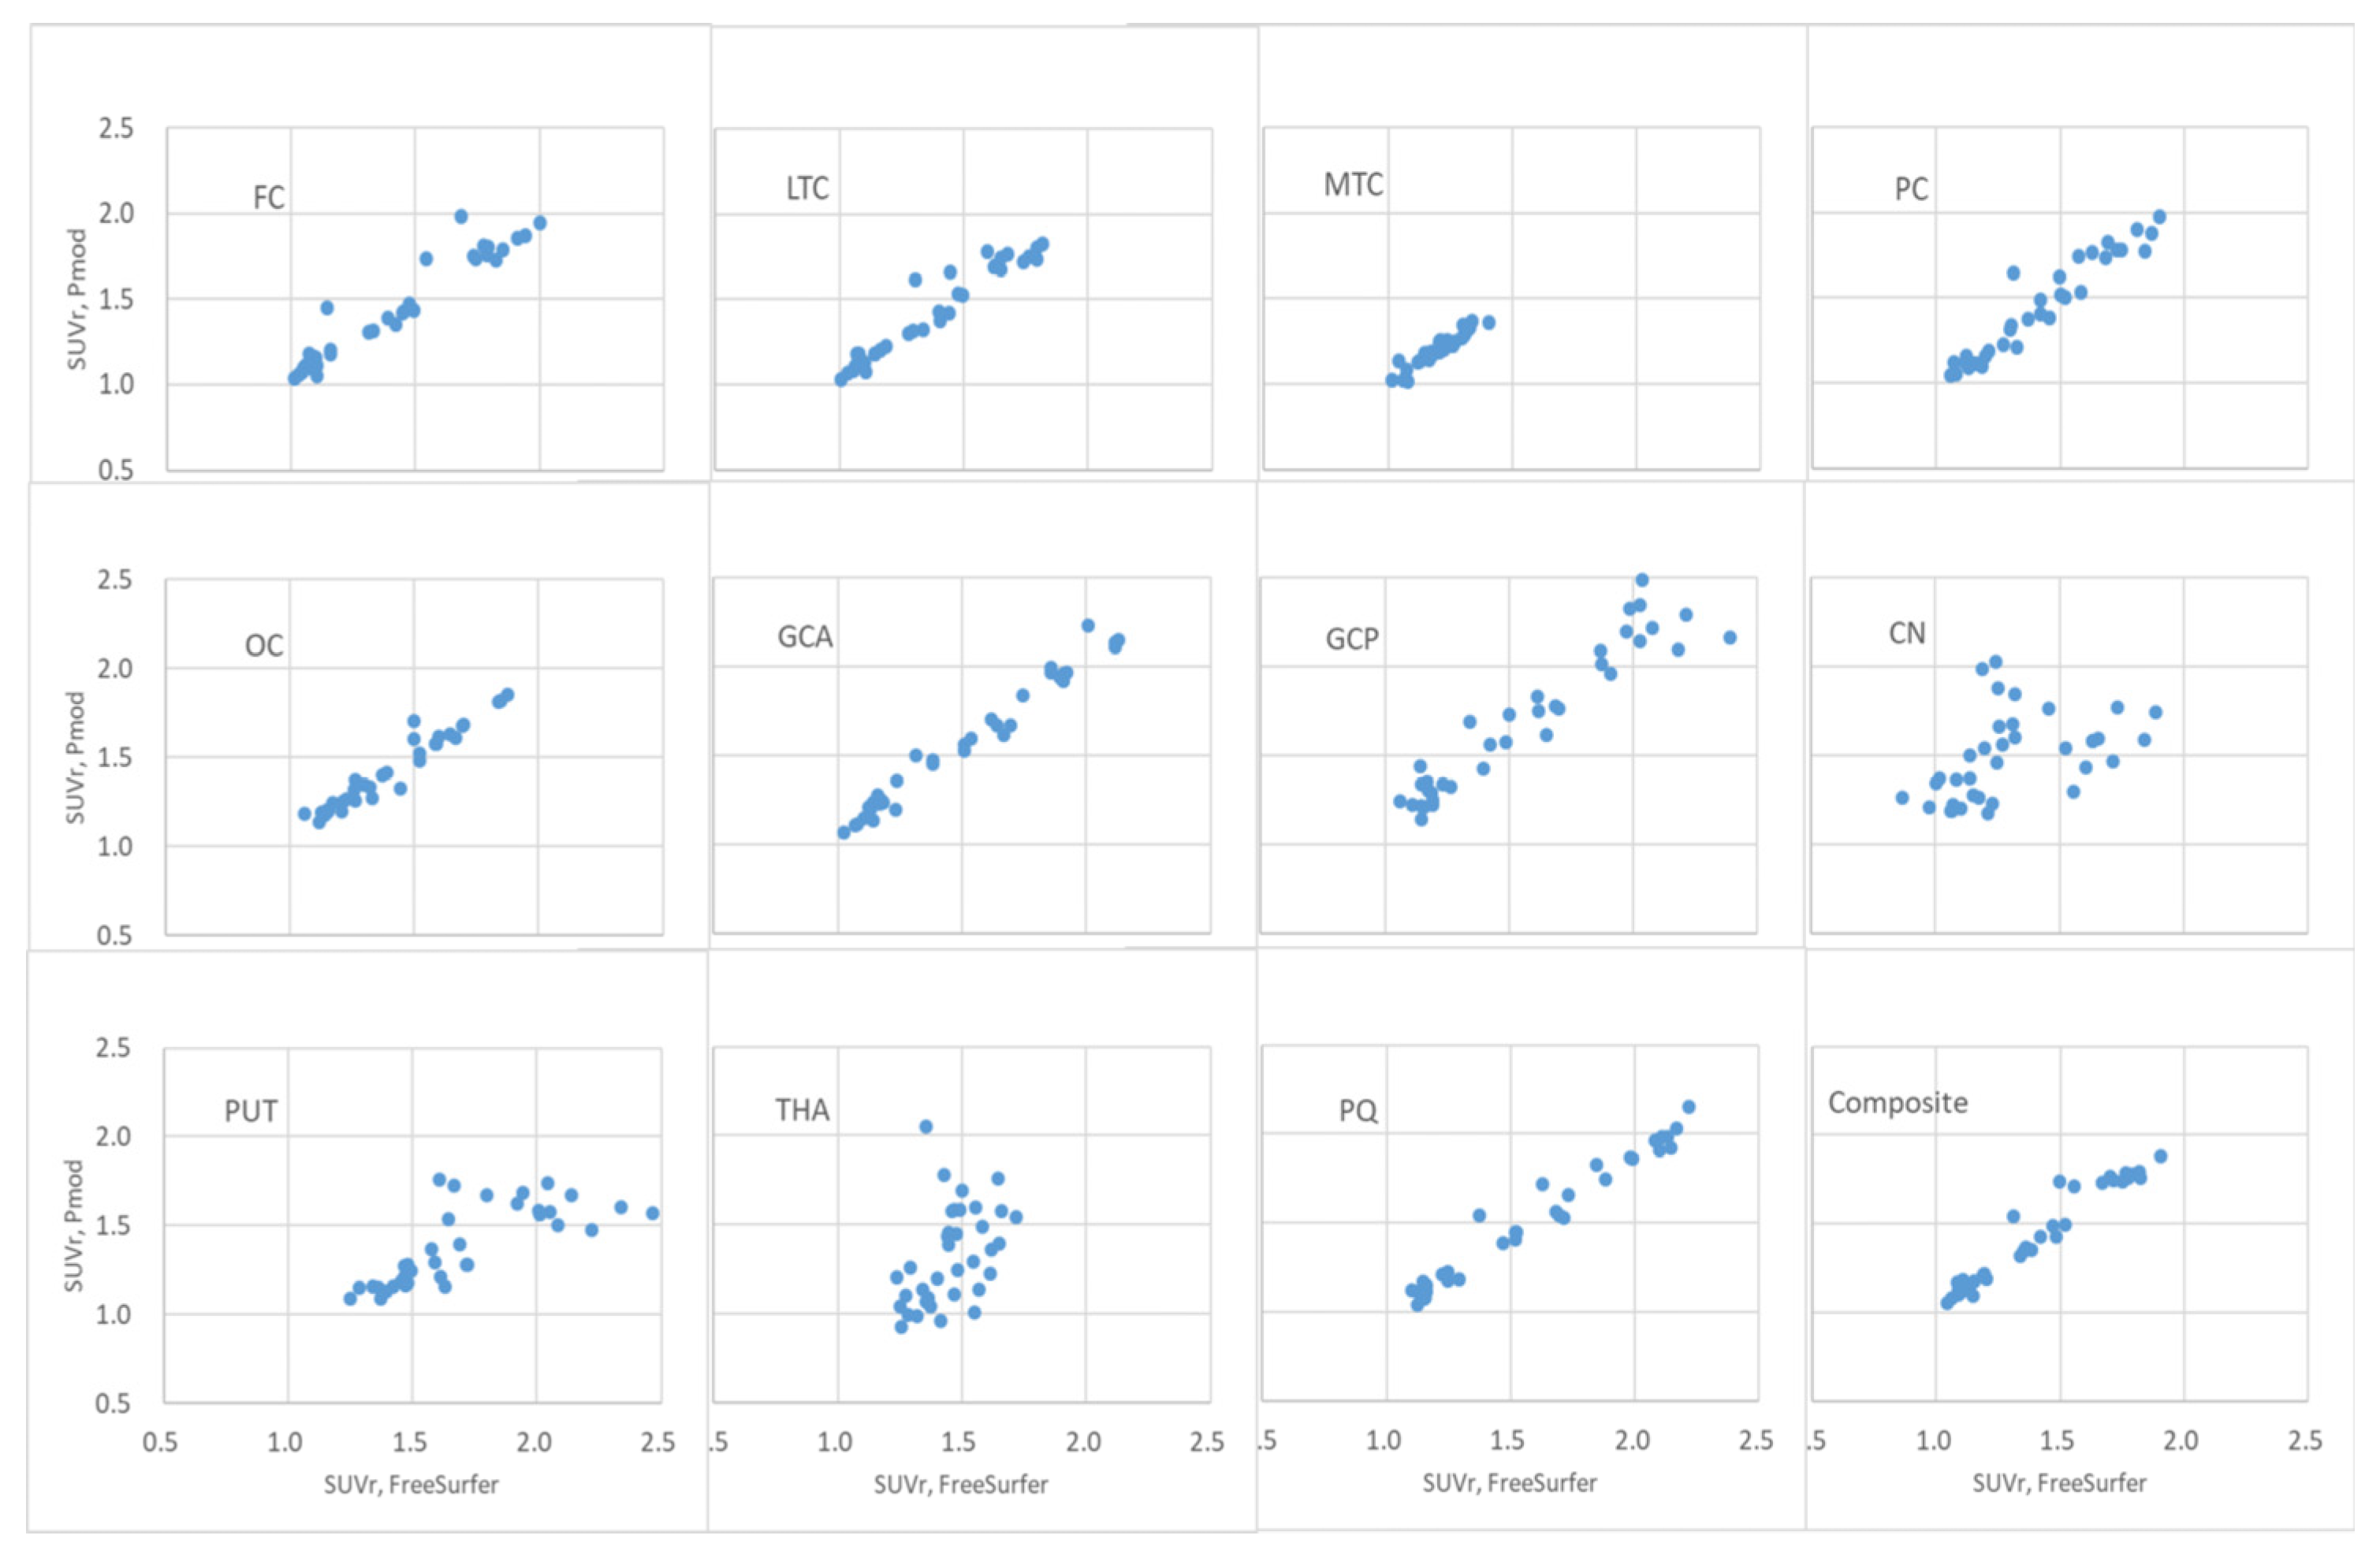
Figure 8.
Scatter plot of FMM brain PET SUVr calculated using PMOD and FreeSurfer algorithms. The x-axis is FreeSurfer and the y-axis is the FMM brain PET SUVr calculated using the FreeSurfer algorithm.
Figure 8.
Scatter plot of FMM brain PET SUVr calculated using PMOD and FreeSurfer algorithms. The x-axis is FreeSurfer and the y-axis is the FMM brain PET SUVr calculated using the FreeSurfer algorithm.
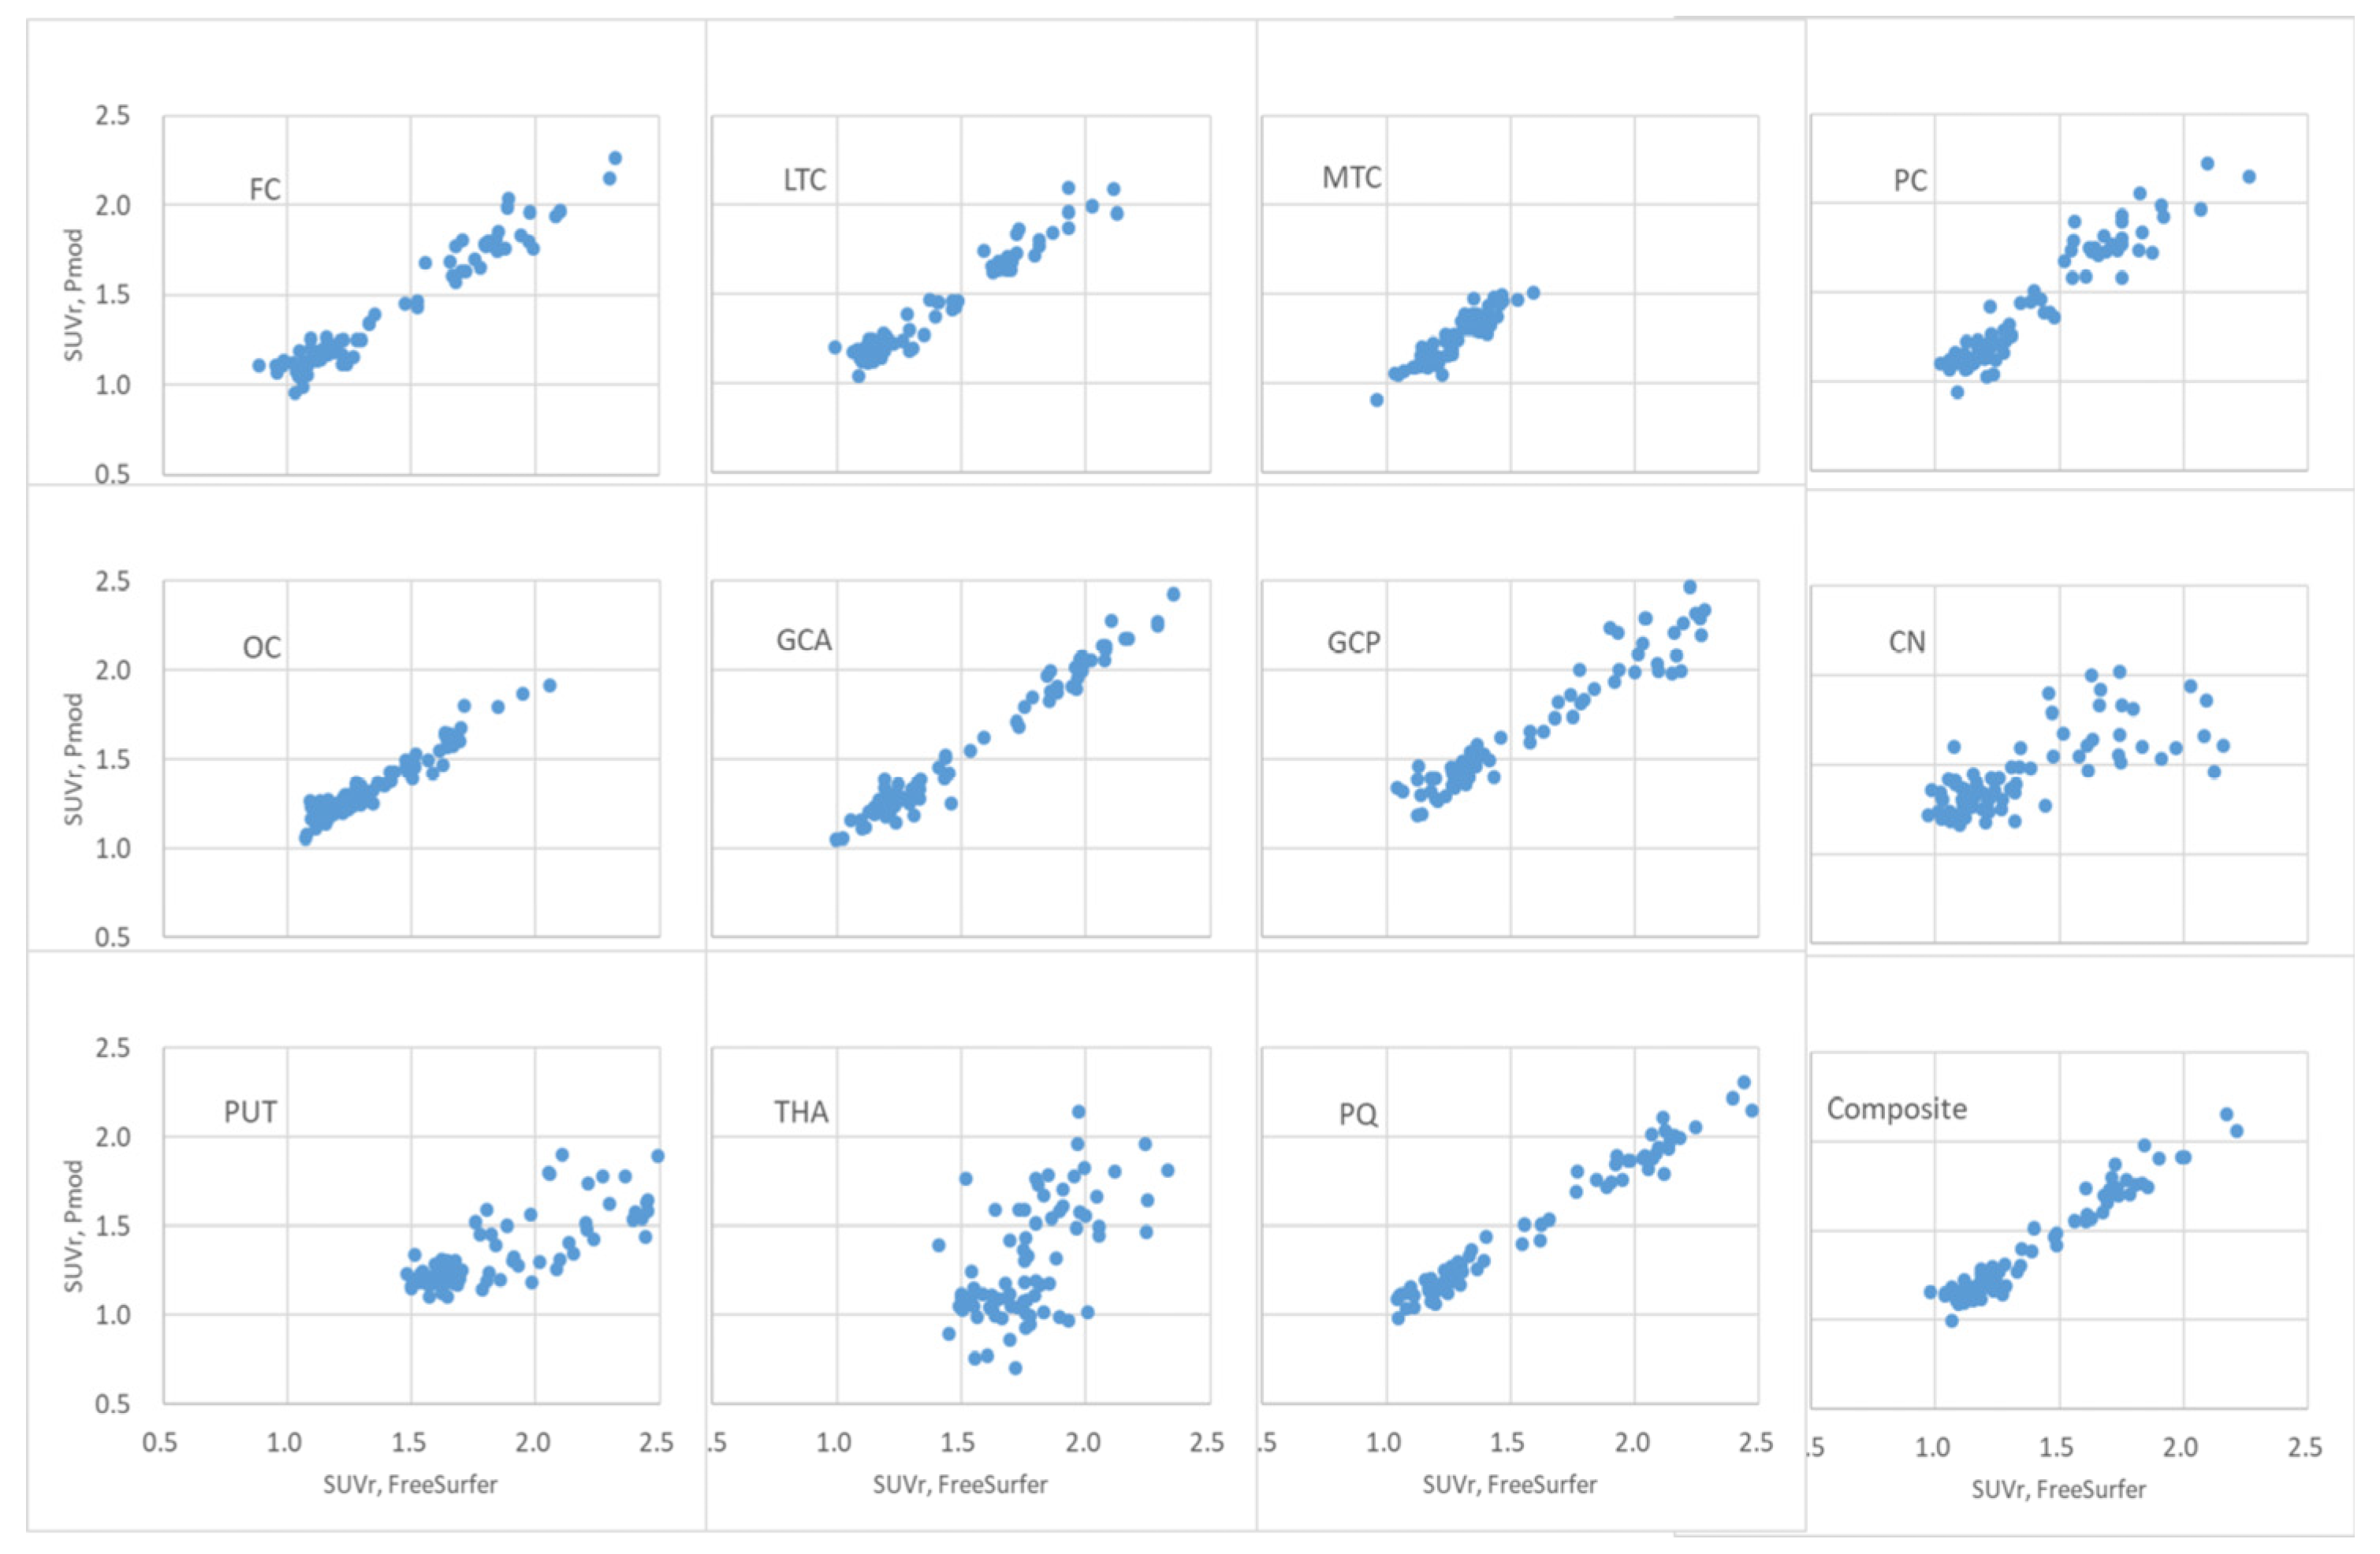
Figure 9.
Scatter plot of FPN brain PET SUVr calculated using PMOD and FreeSurfer algorithms. FPN brain PET SUVr was calculated using the FreeSurfer algorithm on the x-axis and FreeSurfer on the y-axis.
Figure 9.
Scatter plot of FPN brain PET SUVr calculated using PMOD and FreeSurfer algorithms. FPN brain PET SUVr was calculated using the FreeSurfer algorithm on the x-axis and FreeSurfer on the y-axis.
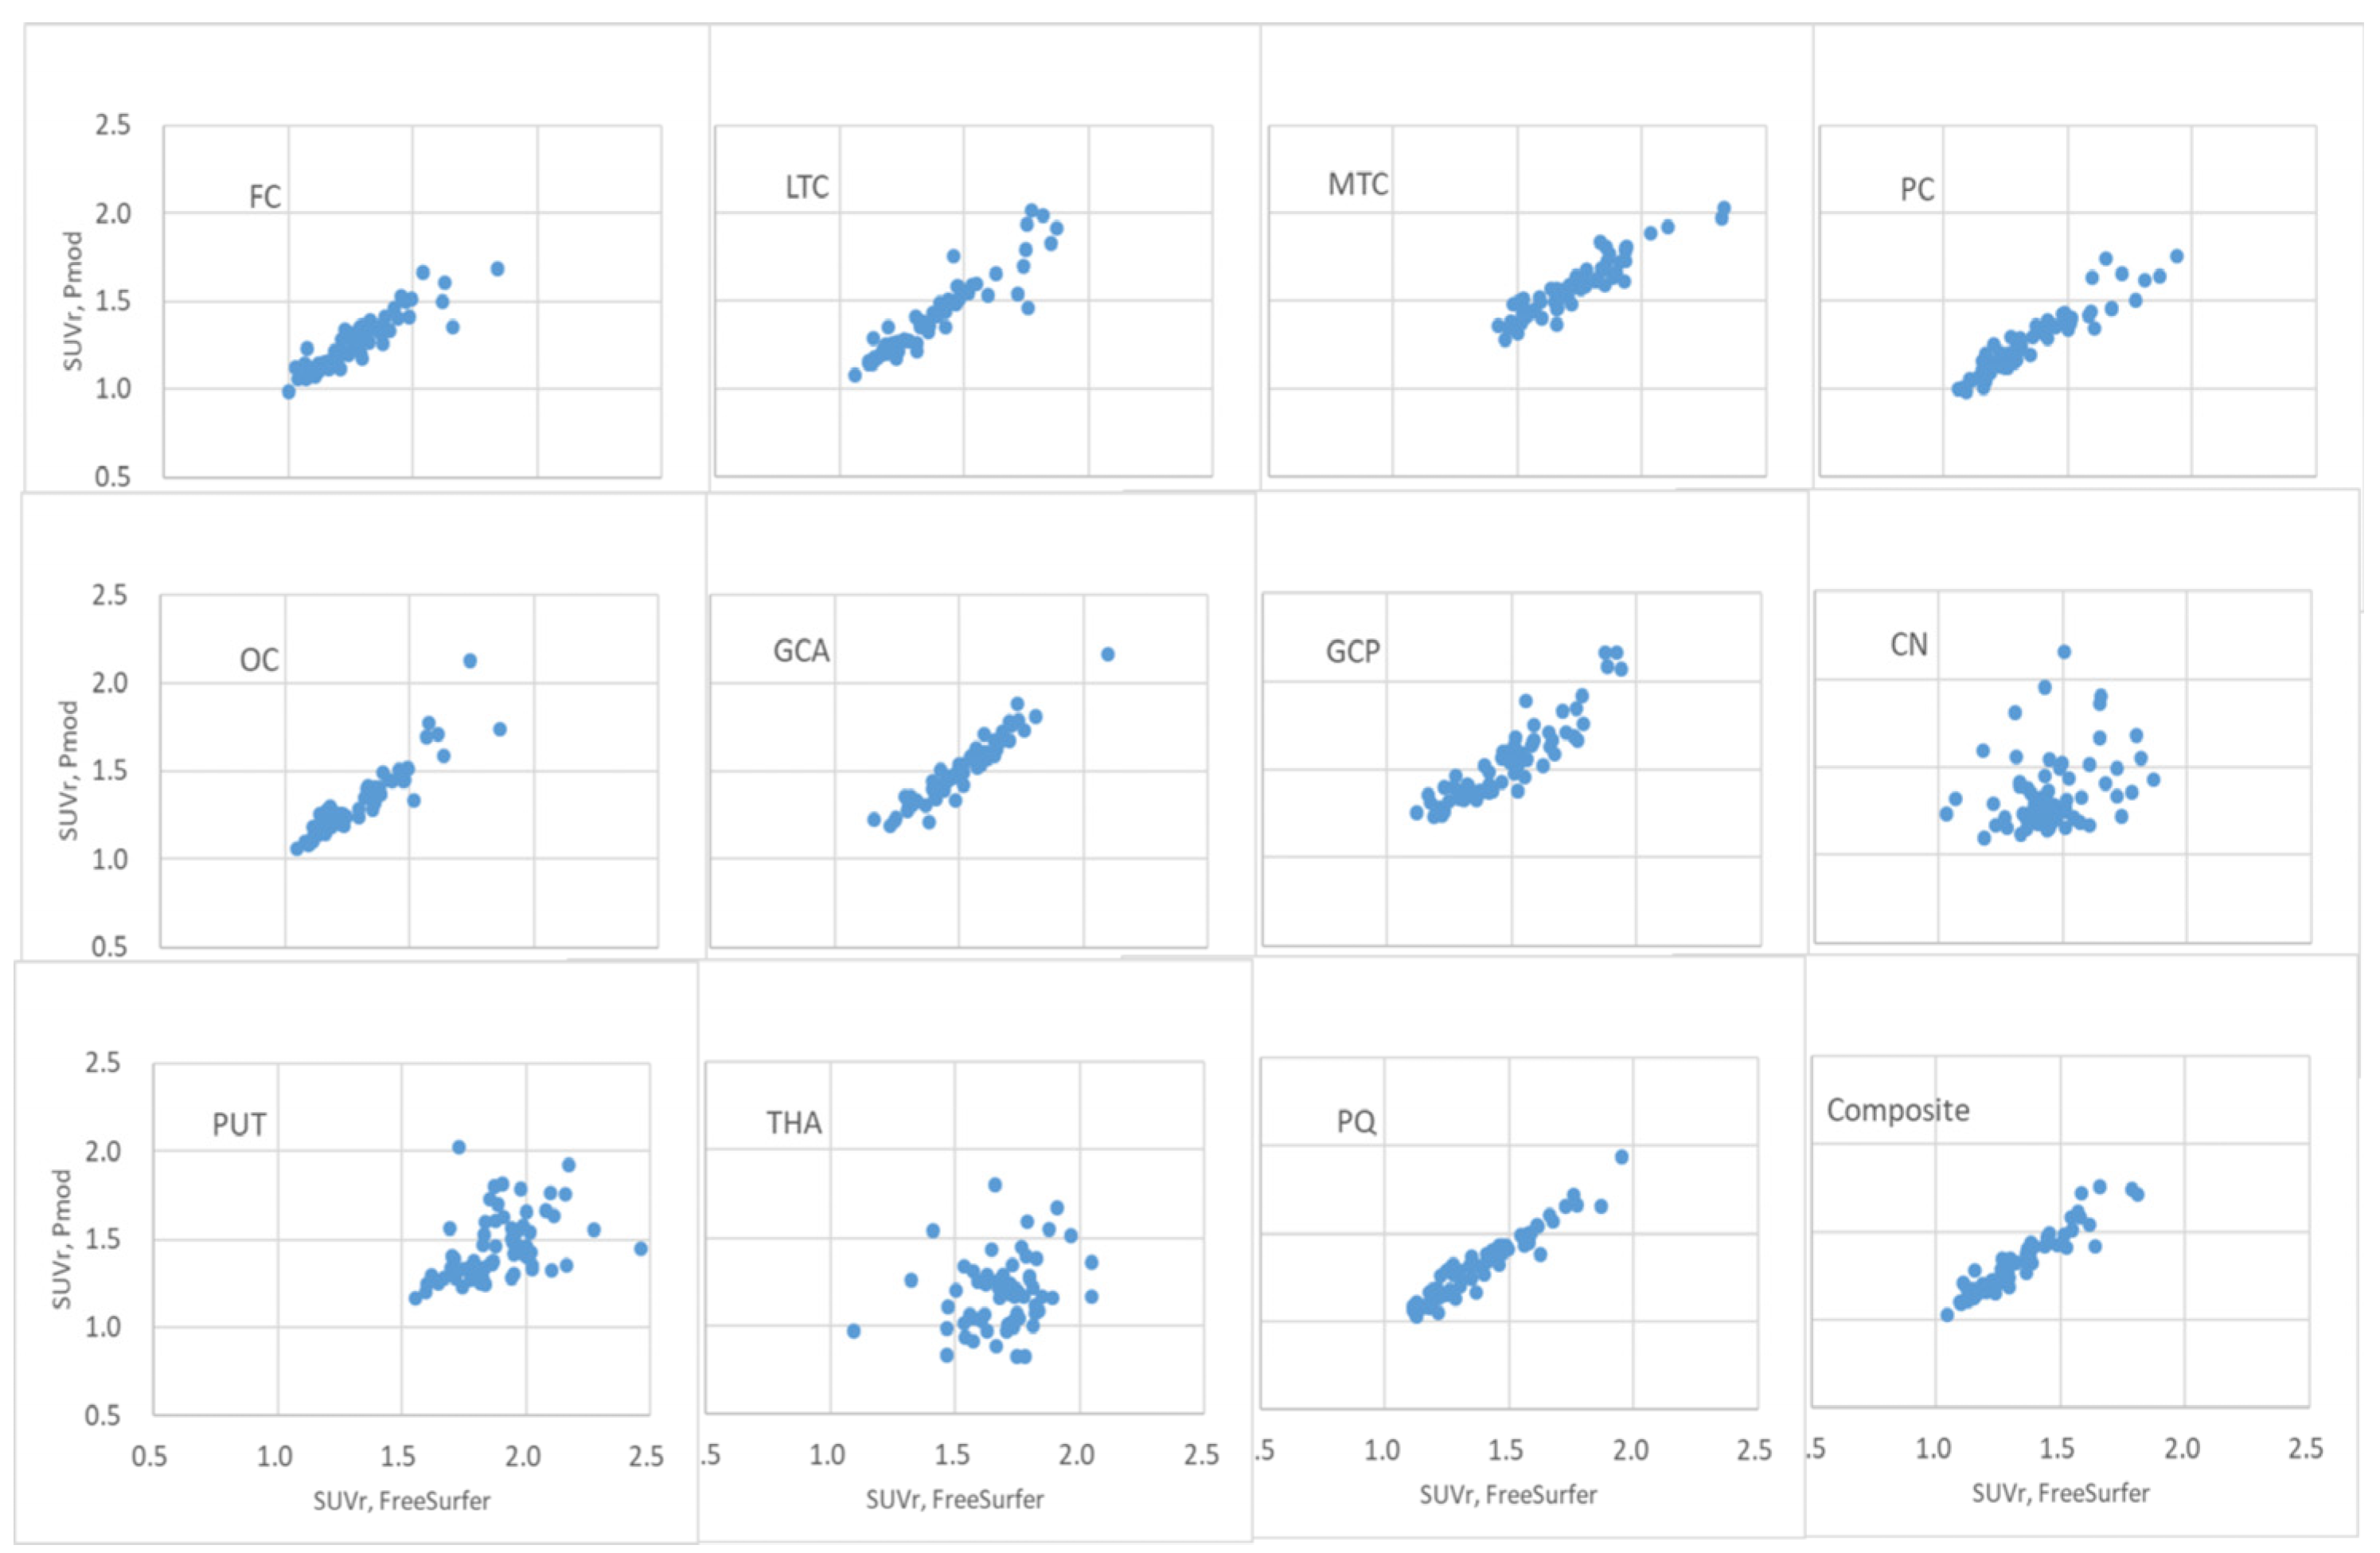
Figure 10.
ROC comparison calculated using PMOD and FreeSurfer algorithms in FBB, FMM, FPN brain PET SUVr. ROCs were calculated and compared in FC, PC, OC, GCP, PQ, and composite regions.
Figure 10.
ROC comparison calculated using PMOD and FreeSurfer algorithms in FBB, FMM, FPN brain PET SUVr. ROCs were calculated and compared in FC, PC, OC, GCP, PQ, and composite regions.
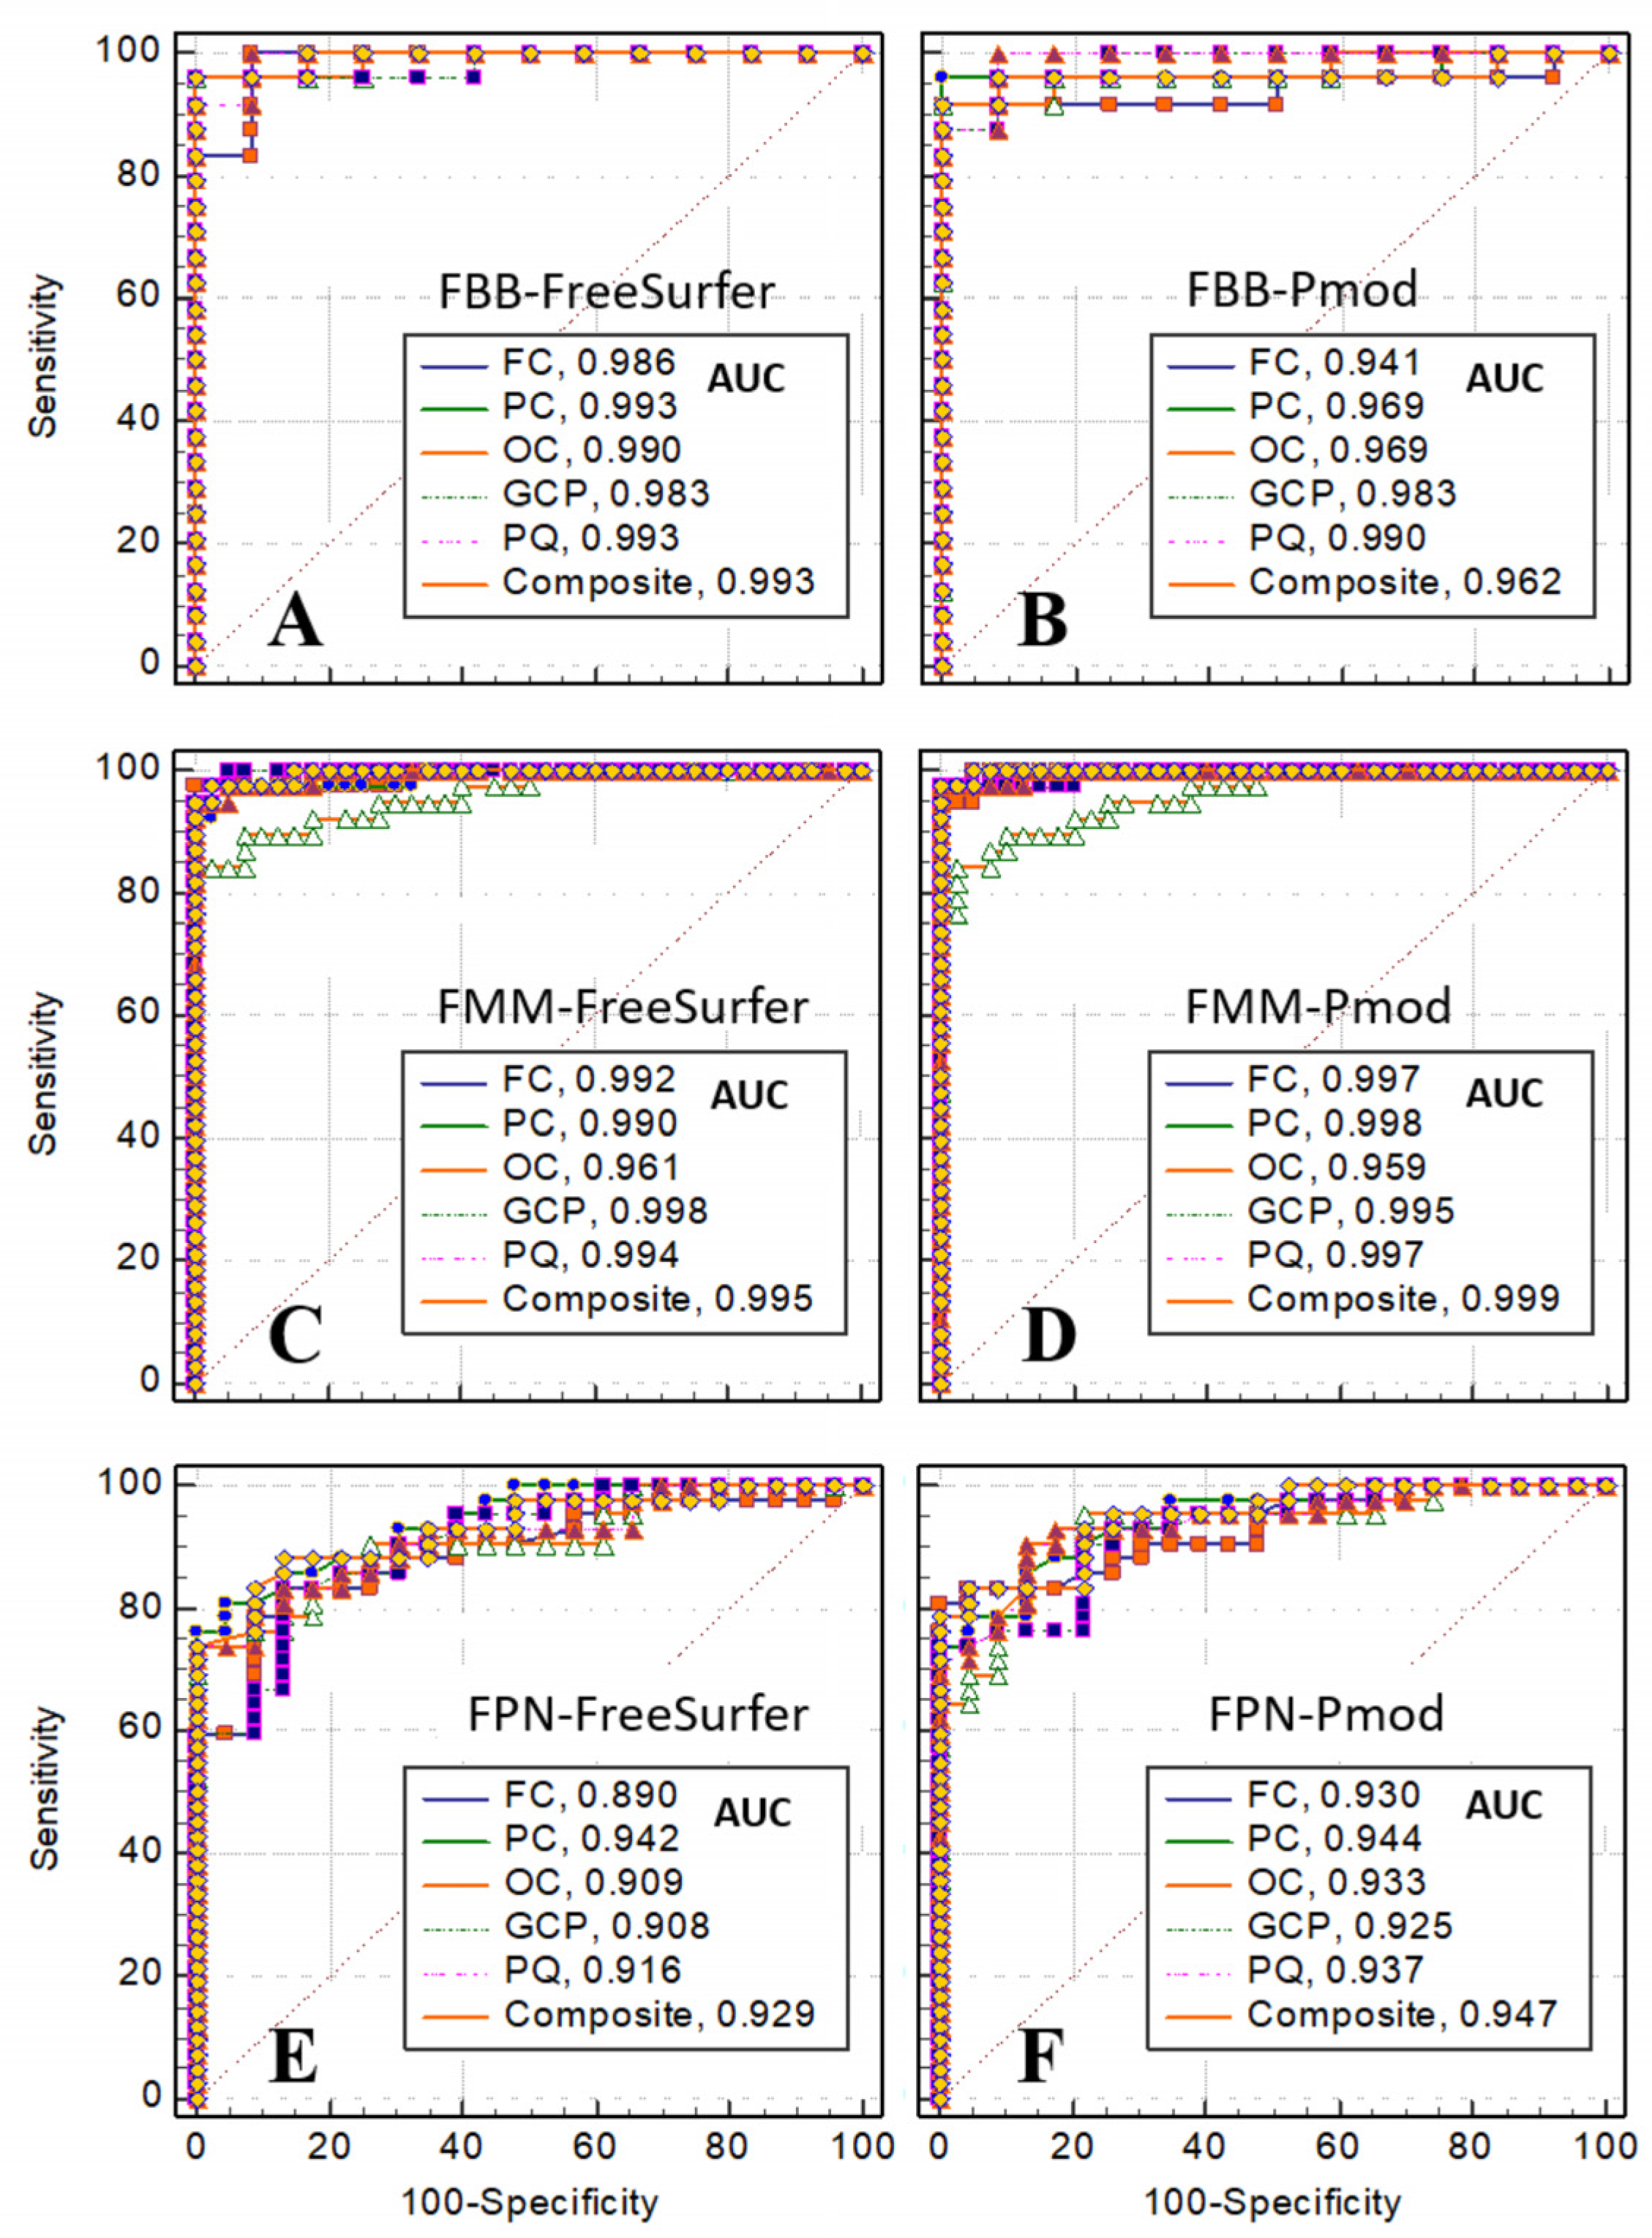

Table 1.
Distribution of the number, sex and age of patients with FBB, FMM, and FPN PET images used in this study.
Table 1.
Distribution of the number, sex and age of patients with FBB, FMM, and FPN PET images used in this study.
| Number | Age(mean±SD) | ||||
| Total | M:F* | 70≥:70<** | |||
| FBB | Negative | 12 | 6:6 | 6:6 | 62.42±10.21 |
| Positive | 24 | 12:12 | 12:12 | 67.25±6.63 | |
| FMM | Negative | 40 | 19:21 | 24:16 | 71.78±8.37 |
| Positive | 38 | 20:18 | 22:16 | 71.89±7.52 | |
| FPN | Negative | 33 | 7:16 | 8:15 | 67.57±7.27 |
| Positive | 42 | 14:28 | 30:12 | 73.67±6.67 |
*M:F, Male:Female. **70≥:70<, over 70: under 70.
Table 2.
List of the 11 regions evaluated for SUV calculations. A composite region is the sum of regions marked with *.
Table 2.
List of the 11 regions evaluated for SUV calculations. A composite region is the sum of regions marked with *.
| FC* | Frontal cortex (r/l)* |
| LTC* | Lateral temporal cortex (r/l)* |
| MTC | Mesial temporal cortex (r/l) |
| PC* | Parietal cortex (r/l)* |
| OC* | Occipital cortex (r/l)* |
| GCA* | Anterior cingulate cortex (r/l)* |
| GCP* | Posterior cingulate cortex (r/l)* |
| CN | Caudate nucleus (r/l) |
| PUT | Putamen (r/l) |
| THA | Thalamus (r/l) |
| PQ | precuneus (r/l) |
| CBLCTX** | cerebellum (r/l) |
| Composite | Sum of regions marked with * |
** reference tissue.
Table 3.
Sensitivity, specificity, threshold of SUVr, p-value in t-test, and correlation coefficient (R) calculated using PMOD and FreeSurfer algorithms in FBB brain PET SUVr. Each value was calculated for FC, LTC, MTC, PC, OC, GCA, GCP, PQ, and composite regions.
Table 3.
Sensitivity, specificity, threshold of SUVr, p-value in t-test, and correlation coefficient (R) calculated using PMOD and FreeSurfer algorithms in FBB brain PET SUVr. Each value was calculated for FC, LTC, MTC, PC, OC, GCA, GCP, PQ, and composite regions.
| FBB-FS* | FBB-PMOD | R | |||||||
| Sensitivity | Specificity | Threshold | p-value | Sensitivity | Specificity | Threshold | p-value | ||
| FC | 100.00 | 91.67 | 1.099 | 1.14.E-08 | 91.67 | 100.00 | 1.182 | 2.20.E-08 | 0.96 |
| LTC | 95.83 | 91.67 | 1.140 | 1.22.E-09 | 87.50 | 100.00 | 1.225 | 2.37.E-09 | 0.97 |
| MTC | 75.00 | 100.00 | 1.207 | 9.43.E-05 | 70.83 | 100.00 | 1.218 | 2.43.E-04 | 0.95 |
| PC | 95.83 | 100.00 | 1.210 | 1.07.E-09 | 91.67 | 100.00 | 1.182 | 2.28.E-09 | 0.96 |
| OC | 95.83 | 100.00 | 1.250 | 6.82.E-09 | 91.67 | 100.00 | 1.275 | 3.80.E-08 | 0.97 |
| GCA | 87.50 | 100.00 | 1.237 | 4.95.E-09 | 87.50 | 100.00 | 1.359 | 1.45.E-08 | 0.99 |
| GCP | 95.83 | 100.00 | 1.232 | 3.06.E-09 | 95.83 | 91.67 | 1.341 | 1.52.E-09 | 0.95 |
| CN | 91.67 | 91.67 | 1.174 | 1.70.E-07 | 87.50 | 100.00 | 1.373 | 1.52.E-08 | 0.44 |
| PUT | 95.83 | 83.33 | 1.471 | 1.24.E-07 | 100.00 | 75.00 | 1.466 | 7.76.E-09 | 0.76 |
| THA | 87.50 | 75.00 | 1.371 | 2.92.E-03 | 87.50 | 100.00 | 1.206 | 2.72.E-08 | 0.45 |
| PQ | 100.00 | 91.67 | 1.160 | 1.98.E-09 | 100.00 | 91.67 | 1.173 | 1.39.E-09 | 0.98 |
| Composite | 95.83 | 100.00 | 1.189 | 1.43.E-09 | 91.67 | 100.00 | 1.210 | 3.15.E-09 | 0.97 |
*FS : FreeSurfer.
Table 4.
Sensitivity, specificity, threshold of SUVr, p-value in t-test, and correlation coefficient (R) calculated using PMOD and FreeSurfer algorithms in FMM brain PET SUVr. Each value was calculated for FC, LTC, MTC, PC, OC, GCA, GCP, PQ, and composite regions.
Table 4.
Sensitivity, specificity, threshold of SUVr, p-value in t-test, and correlation coefficient (R) calculated using PMOD and FreeSurfer algorithms in FMM brain PET SUVr. Each value was calculated for FC, LTC, MTC, PC, OC, GCA, GCP, PQ, and composite regions.
| FMM-FS* | FMM-PMOD | R | |||||||
| Sensitivity | Specificity | Threshold | p-value | Sensitivity | Specificity | Threshold | p-value | ||
| FC | 97.37 | 100.00 | 1.268 | 1.33.E-17 | 100.00 | 95.00 | 1.242 | 5.04.E-17 | 0.98 |
| LTC | 94.74 | 95.00 | 1.264 | 5.33.E-15 | 97.37 | 97.50 | 1.258 | 9.00.E-15 | 0.98 |
| MTC | 26.32 | 92.50 | 1.399 | 3.18.E-01 | 97.37 | 20.00 | 1.093 | 2.38.E-01 | 0.94 |
| PC | 97.37 | 97.50 | 1.283 | 1.37.E-15 | 97.37 | 100.00 | 1.282 | 9.45.E-18 | 0.95 |
| OC | 84.21 | 100.00 | 1.347 | 1.38.E-13 | 84.21 | 97.50 | 1.353 | 2.36.E-12 | 0.96 |
| GCA | 97.37 | 90.00 | 1.323 | 6.68.E-17 | 92.11 | 97.50 | 1.395 | 3.63.E-16 | 0.99 |
| GCP | 100.00 | 95.00 | 1.391 | 4.94.E-19 | 97.37 | 100.00 | 1.598 | 1.30.E-17 | 0.97 |
| CN | 84.21 | 95.00 | 1.27 | 9.15.E-12 | 92.11 | 95.00 | 1.392 | 2.43.E-12 | 0.74 |
| PUT | 89.47 | 82.50 | 1.704 | 8.71.E-12 | 97.37 | 85.00 | 1.256 | 7.65.E-13 | 0.80 |
| THA | 89.47 | 70.00 | 1.725 | 1.36.E-07 | 97.37 | 95.00 | 1.178 | 8.85.E-19 | 0.60 |
| PQ | 94.74 | 100.00 | 1.391 | 2.05.E-18 | 97.37 | 100.00 | 1.332 | 2.51.E-19 | 0.99 |
| Composite | 97.37 | 97.50 | 1.272 | 4.90.E-17 | 97.37 | 100.00 | 1.285 | 5.60.E-17 | 0.98 |
*FS : FreeSurfer.
Table 5.
Sensitivity, specificity, threshold of SUVr, p-value in t-test, and correlation coefficient (R) calculated using PMOD and FreeSurfer algorithms in FPN brain PET SUVr. Each value was calculated for FC, LTC, MTC, PC, OC, GCA, GCP, PQ, and composite regions.
Table 5.
Sensitivity, specificity, threshold of SUVr, p-value in t-test, and correlation coefficient (R) calculated using PMOD and FreeSurfer algorithms in FPN brain PET SUVr. Each value was calculated for FC, LTC, MTC, PC, OC, GCA, GCP, PQ, and composite regions.
| FPN-FS* | FPN-PMOD | R | |||||||
| Sensitivity | Specificity | Threshold | p-value | Sensitivity | Specificity | Threshold | p-value | ||
| FC | 83.33 | 86.96 | 1.208 | 2.27E-09 | 80.95 | 100.00 | 1.231 | 5.49E-12 | 0.91 |
| LTC | 80.95 | 100.00 | 1.310 | 8.55E-12 | 85.71 | 95.65 | 1.278 | 4.10E-12 | 0.93 |
| MTC | 71.43 | 82.61 | 1.705 | 5.13E-06 | 69.05 | 82.61 | 1.564 | 6.34E-05 | 0.93 |
| PC | 80.95 | 95.65 | 1.286 | 1.08E-11 | 78.57 | 95.65 | 1.218 | 3.64E-12 | 0.94 |
| OC | 73.81 | 100.00 | 1.237 | 2.22E-10 | 90.48 | 86.96 | 1.219 | 2.49E-09 | 0.93 |
| GCA | 64.29 | 100.00 | 1.517 | 3.35E-08 | 71.43 | 100.00 | 1.492 | 2.04E-09 | 0.96 |
| GCP | 83.33 | 86.96 | 1.411 | 1.97E-10 | 73.81 | 100.00 | 1.520 | 3.12E-10 | 0.91 |
| CN | 95.24 | 26.09 | 1.276 | 2.08E-01 | 88.1 | 86.96 | 1.245 | 1.33E-08 | 0.26 |
| PUT | 76.19 | 73.91 | 1.838 | 1.85E-02 | 90.48 | 87.50 | 1.354 | 5.71E-12 | 0.41 |
| THA | 88.10 | 26.09 | 1.558 | 4.30E-01 | 76.19 | 95.65 | 1.164 | 2.44E-10 | 0.25 |
| PQ | 73.81 | 100.00 | 1.371 | 1.60E-11 | 90.48 | 86.96 | 1.229 | 1.37E-12 | 0.96 |
| Composite | 88.10 | 86.96 | 1.237 | 9.41E-12 | 83.33 | 95.65 | 1.234 | 6.70E-13 | 0.95 |
*FS : FreeSurfer.
Table 6.
AUC comparison and classification compatibility of FBB, FMM, and FPN. When p>0.05, * indicates that there is no difference in AUC.
Table 6.
AUC comparison and classification compatibility of FBB, FMM, and FPN. When p>0.05, * indicates that there is no difference in AUC.
| Comparison of ROC | Composite | FC | LTC | PC | OC | GCA | GCP |
| FPN ~ FBB, PMOD | * | * | * | * | * | * | * |
| FPN ~ FMM, PMOD | * | * | |||||
| FBB ~ FMM, PMOD | * | * | * | * | * | * | * |
| FPN ~ FBB, FS** | * | * | |||||
| FPN ~ FMM, FS** | * | * | * | ||||
| FBB ~ FMM, FS** | * | * | * | * | * | * |
*FS: FreeSurfer.
Disclaimer/Publisher’s Note: The statements, opinions and data contained in all publications are solely those of the individual author(s) and contributor(s) and not of MDPI and/or the editor(s). MDPI and/or the editor(s) disclaim responsibility for any injury to people or property resulting from any ideas, methods, instructions or products referred to in the content. |
© 2024 by the authors. Licensee MDPI, Basel, Switzerland. This article is an open access article distributed under the terms and conditions of the Creative Commons Attribution (CC BY) license (http://creativecommons.org/licenses/by/4.0/).
Copyright: This open access article is published under a Creative Commons CC BY 4.0 license, which permit the free download, distribution, and reuse, provided that the author and preprint are cited in any reuse.


