Submitted:
15 December 2024
Posted:
16 December 2024
Read the latest preprint version here
Abstract
Mpox is an infectious viral disease endemic to Central African countries. It has seen a resurgence in this region, particularly in the Democratic Republic of Congo (DRC), disproportionately affecting children under 15 years. In this study, we developed an age-structured mathematical model to assess the effect of vaccination on Mpox dynamics in the DRC, focusing on children under 15 as the primary target of upcoming vaccination campaigns. The model captures transmission dynamics across different vaccination coverage levels (10%, 20%, 30%, and 40%) and incorporates critical factors such as age-based susceptibility, waning immunity and control measures). Results reveal a peak in MPOX-confirmed cases on September 29, 2024, with 410 cases and four deaths. From January to December 2025, 4860 cases and 52 deaths were predicted, and a higher vaccination coverage (40%) combined with improved non-pharmaceutical interventions (Φ1 = 20%) targeting under-15s could significantly reduce Mpox transmission and burden, with up to 1,800 cases and 17 deaths averted. The findings underscore the importance of vaccination campaigns, coupled with improved public health measures, in mitigating Mpox transmission and alleviating its burden on vulnerable populations. This study provides a framework for evaluating vaccination strategies and their effectiveness in controlling emerging infectious diseases.
Keywords:
Infectious disease
; endemic
; Vaccination schedule
; dynamics
; Control measures
; Central Africa
1. Introduction
Mpox is a viral disease caused by the mpox virus (MPXV), which belongs to the Orthopoxvirus genus. This virus mainly affects animals such as monkeys, squirrels, and rodents [1]. Additionally, Mpox is classified as a zoonotic disease, meaning it can be transmitted from animals to humans. However, transmission is not limited to animal-to-human interactions; human-to-human transmission has also been documented. Researchers suggest that Mpox spreads among humans through close contact with infected individuals, particularly through respiratory droplets or direct contact with skin lesions and other bodily fluids. In addition, environmental transmission is possible through contact with contaminated objects or surfaces. Common symptoms of Mpox infection include fever, headache, muscle pain, and fatigue [2].
Although MPOX cases are found in numerous countries worldwide, they are most commonly found in Africa. The first monkeypox case was identified in 1958 following the occurrence of outbreaks in a group of monkeys that were being studied. Globally, there have been a total of 88,122 reported cases, with 30,555 of them occurring in the United States [3].
Since 2017, there has been a resurgence of Mpox in Nigeria, the Democratic Republic of Congo (DRC), and other parts of Africa, attributed to the waning immunity to smallpox vaccines and the accumulation of cohorts that have never been vaccinated against smallpox [4]. In 2022, a global outbreak of Mpox resulted in more than 91,000 confirmed cases in 115 countries, establishing chains of human-to-human transmission and leading to a renewed focus on vaccination as a preventive measure [5]. In 2023, there were 14,626 suspected cases of clade I Mpox in the Democratic Republic of Congo, more than double the 6,216 cases recorded in 2020 [6]. The sexual transmission of clade I Mpox was observed for the first time, with outbreaks among MSM (men who have sex with men) networks and commercial sex workers [6]. However, unlike the clade IIb outbreak, where more than 95% infections were recorded among adult men [7], cases of the ongoing DRC epidemic have been concentrated in children. From 1 January to 26 May 2024, 50% of the confirmed cases were under 15 years old, reflecting the age patterns seen in the MPOX dynamics [6]. In addition, preliminary evidence from the DRC indicates that children under 15 years old accounted for 86% (254 out of 296) of reported deaths in 2024, suggesting a potentially higher severity of Mpox infections in younger age groups [6].
Age-specific variations in disease severity are crucial for understanding the burden of Mpox and for designing targeted interventions to reduce overall morbidity and mortality. Recent studies have provided age-specific severity estimates for clade I Mpox, highlighting a significantly higher risk of severe outcomes among younger populations, particularly children under 15 years old [8]. Furthermore, it remains unclear to what extent age-related severity differences can be explained by the concentration of vaccine coverage in older age groups [8]. Public health policies addressing the Mpox outbreak require adequate disease modeling strategies. This need has been emphasized during the COVID-19 pandemic, where mathematical models of disease transmission have played a critical role in shaping public health policies [9]. However, Mpox has historically been a neglected zoonotic disease, resulting in limited development of mathematical models for its transmission, particularly those assessing the impact of vaccination.
Various mathematical models have been developed to understand Mpox dynamics before, during, and after the 2022-2023 outbreak. Some of these models specifically focus on the transmission of Mpox from animals to humans [10,11,12,13,14,15,16], while others examine sexual transmission or spread within high-risk populations [17,18,19,20]. Additional models have explored the impact of smallpox or Mpox vaccination on curbing the virus’s spread [21,22], while others have investigated the co-interaction between Mpox and other diseases [17,23]. Despite these contributions, the impact of vaccination on MPOX transmission and its overall burden remains a critical and pressing concern.
In this study, we developed a mathematical age-structured model with two subgroups: individuals under 15 years old and those over 15. The model emphasizes the impact of vaccination, as the upcoming campaign primarily targets children under 15 [24]. We analyzed trends in MPOX cases and deaths averted in the DRC under various vaccination coverage levels.
2. Method
2.1. Model Formulation
In this study, we developed a deterministic compartmental model of Mpox stratified by age group, infection status and vaccination status to describe the impact of a vaccine on Mpox transmission. The mathematical model comprises twelve epidemiological states depending on the individual’s health, vaccination, and age status. The total population at time t denoted by is divided into two subpopulations, meaning under-15 and over-15 years old individuals, which are represented by subscripts 1 and 2, respectively. Each subpopulation, with size or is further subdivided into six compartments that are Susceptible (), Vaccinated (), Exposed (), Infectious (), Detected infectious (), and Recovered (). Thus, the total population size for the under-15 years old individuals is given by:
Similarly, the over-15 year subpopulation denoted by is also further subdivided into six compartments: Susceptible (), Vaccinated (), Exposed (), Infectious (), Detected infectious (), and Recovered (). The total population size for the over-15 years old individuals is given by:
Therefore, the total population at time t, denoted by , is
Newborns enter the system at a constant rate (), joining the susceptible compartment, . From , individuals may be vaccinated at a rate , transitioning to the vaccinated compartment . As they age, individuals in move to at a constant ageing rate . Vaccinated individuals in and lose immunity over time at a rate , returning to the susceptible compartments and , respectively.
From the susceptible compartments ( and ), individuals may become exposed ( and ) through effective contact with confirmed infectious individuals ( and ) or undetected infectious individuals ( and ) at rates and , respectively. Here, and represent the force of infection for under-15 and over-15 individuals (), respectively, while and account for the reduction in the force of infection due to age-specific biological, behavioral, and epidemiological factors. Vaccinated individuals ( and ) may also become exposed ( and ) through effective contact with infected, at rates and , where represents vaccine efficacy.
Once exposed, individuals progress to the infectious compartments ( and ) at a rate . A fraction of infectious individuals may be detected through contact tracing and testing and move to the confirmed infectious compartments ( and ) at rates . Individuals in these compartments may recover at rates and , transitioning to the recovered compartments ( and ), or die at rates and . Similarly, those in the undetected infectious compartments ( and ) may recover at rates and or die at rates and .
Natural mortality affects all compartments at rates and . Furthermore, individuals in compartments associated with the under-15 subpopulation transition to the corresponding over-15 subpopulation compartment through ageing at the rate .
When developing the mathematical model, we made some assumptions or comments, which are as follows.
- (i)
- Vaccination is administered to under-15 years old individuals that are susceptible. The model doesn’t consider vaccination of detected and confirmed infectious individuals.
- (ii)
- We assume that there is homogeneous mixing among the population, which means that every individual in the community is equally likely to mix and acquire infections from each member when they make contact.
- (iii)
- Since the Mpox outbreak has persisted for a long time, we include the vital dynamics (birth and natural death) in the model.
- (iv)
- The proportion of under-15s in the total Mpox cases remains constant at 0.5 throughout the modeling period.
Using the flow diagram in Figure 1 and the above description, we obtain the following system of equations:
In (1), and are the forces of infection for under-15 and over-15 individuals respectively, which are defined by:
where and is a modification parameter that accounts for the fact that over 15 years are less likely to be infected.
The proportion of MPOX cases among those under 15 can be approximated using the expression:
where and are the proportions of under-15 and over-15 years old individuals, respectively, in DRC [25]. Thus, from (2), we deduce the expression of , which is:
With as reported by [6],
From (4), if , one can notice that since .
The last equation of (1) is added to determine the cumulative number of vaccinated individuals by time t (), which is used to dynamically adjust the vaccination rate. This helps to ensure that the vaccination coverage over a given period reaches a target value (see section 2.2.2).
From (1), it follows that the dynamics of the whole population is governed by the equation: Applying the comparison theorem, we obtain . Thus, . Let and . Thus, is a forward invariant set. The model is analyzed in this set.

Table 1.
State variables and their description.
| State Variable | Description |
|---|---|
| Under 15 (over 15) Susceptible individuals | |
| Under 15 (over 15) Vaccinated individuals | |
| Under 15 (over 15) Exposed individuals | |
| Under 15 (over 15) Infectious individuals | |
| Under 15 (over 15) Detected infectious individuals | |
| Under 15 (over 15) Recovered individuals |
Table 2.
Description of the model parameters.
| Parameter | Description | Unit |
|---|---|---|
| Birth rate in DRC | ||
| Age-based transition rate | ||
| Natural death rate of under 15 (over 15) individuals | ||
| Vaccination Rate | ||
| Waning rate of the vaccine efficacy | ||
| Vaccine efficacy | dimensionless | |
| () | Percent reduction in the force of infection due to intervention measures (excluding vaccination) and acquired immunity. | dimensionless |
| Transmission rates of under 15 (over 15) infectious individuals | ||
| Transmission rates of under 15 (over 15) detected infectious individuals | ||
| Latent period | ||
| Detection rate of infectious individuals | ||
| Mpox-induced death rate for under 15 (over 15) infectious individuals | ||
| Mpox-induced death rate for under 15 (over 15) detected infectious individuals | ||
| Recovery rate of under 15 (over 15) infectious individuals | ||
| Recovery rate of under 15 (over 15) detected infectious individuals |
Table 3.
Fixed parameter values of the model.
| Parameter | Value | Reference |
|---|---|---|
| . | [26] | |
| N | Individuals | [26] |
| [27] | ||
| 0.8 | [28] | |
| Calculated | ||
| () | Calculated | |
| [29] | ||
| (0.004) | Assumed | |
| 0.004 (0.003) | ||
| 1/3.5 (1/3) | Assumed | |
| 1/3 (1/2.5) | [29] |
and are calibrated to ensure the model accurately aligns with the observed MPOX-related death incidence (our world in data).
2.2. DRC MPOX Data and Parameter Estimation Procedure
2.2.1. DRC Mpox Data
Data on the daily MPOX cases in DRC were obtained from MPOX data respiratory by Our World in Data (https://ourworldindata.org/mpox, accessed on 15 November 2024). These data were converted in weekly cases and span from April 30, 2023, to September 22, 2024. The start date considered for the modeling aligns with the initial establishment of a clearer upward trend, signifying the onset of sustained transmission dynamics suitable for modeling. It also ensures sufficient data points for early transmission patterns while avoiding noise from sporadic cases in the preceding months. In the DRC, where MPOX is endemic or elsewhere, the reported confirmed cases are infectious individuals who have been tested (especially with PCR). Hence, we assume that the weekly number of confirmed MPOX cases corresponds to newly detected infectious individuals from the (). Demographic data (population size, birth rate and life expectancy) for the country were obtained from [26].
2.2.2. Model Fiting and Parameter Estimation Procedure
We consider a mixed population where under-15 and over-15-year-old individuals interact, with the transition from the under-15 subpopulation to the over-15 subpopulation governed by the parameter . We set ; ; and . The expression represents the number of reported MPOX cases in DRC on April 30, 2024. For simplicity, we assume .
The solutions of (1) were obtained using the MatlabR2024b built-in function . The minimization was achieved through the built-in constraint minimization algorithm fminsearchbnd. The fitting was carried out using a nonlinear least squares technique, finding the best set of parameter values that minimizes the root mean square differences between the observed weekly confirmed MPOX cases and the predicted weekly cases from the model (1). Thus, we estimated the best values of the unknown parameters (, , , , , , and ) in the model (1) using a cross-validation procedure of parameter estimation [30], where 90% of the observations were considered to estimate values of the seven unknown model parameters with an value and the remaining observations were used to validate the model with an value. We simulated 2,000 different starting values of the seven parameters using the resample function in Matlab. The final values considered for the seven unknown parameters were those related to both the smallest values of and to guarantee a good fit of the model and a good predictive power [30]. The fixed parameters used in the model-fitting process were obtained from the literature as presented in Table 3, while other fixed parameters were calculated, calibrated or assumed).
Thus, we estimated the best values of the unknown parameters (, , , , , , and ) in the model (1) using a cross-validation procedure of parameter estimation [30], where 90% of the observations were considered to estimate values of the seven unknown model parameters with an value and the remaining observations were used to validate the model with an value. We simulated 2,000 different starting values of the seven parameters using the resample function in Matlab. The final values considered for the seven unknown parameters were those related to both the smallest values of and to guarantee a good fit of the model and a good predictive power [30]. The fixed parameters used in the model-fitting process were obtained from the literature and presented in Table 3, while other fixed parameters were calculated, calibrated or assumed.
In the fitting procedure, we introduce vaccination in the model from January to December, 2025, which targets under-15 individuals with LC16m8 vaccine following [31]. Before January 2025, all vaccination parameters (, , and ) were set to zero. Our model did not account for the vaccination campaign, which started in October 2024, since it prioritized health workers and other high-risk groups (adults) due to limited vaccine availability (265,000 doses) [24]. We define a vaccinated individual as one who has received at least one dose of the LC16m8 vaccine. We consider different vaccination coverage levels, (, , , , and ). We implemented a dynamic vaccination rate, , designed to ensure that the vaccination coverage reaches the predefined target, , over the specified vaccination period, ( weeks: January 12 - December 31, 2025). This approach explicitly accounts for the interplay between vaccination and other dynamic factors affecting the susceptible population.
The total number, , of individuals vaccinated by the end of the modeling period, T (April 30, 2023 - December 31, 2025; weeks), is proportional to the initial susceptible population, , and the target coverage, :
where is the time-dependent vaccination flow rate, is the number of susceptibles at time t and is the initial number of susceptibles.
To achieve over the modeling period, the vaccination rate is dynamically adjusted. At any time t during the modeling period (), the vaccination rate is computed as:
where
- is start time of the vaccination campaign. Since our modeling period started on April 30, 2023, and we consider the vaccination starting in the second week of January 2025, = 89 weeks).
- is the remaining number of individuals to be vaccinated at time t, calculated as:is the total number of under-15 individuals vaccinated at time t, determined by the ODEs (see equations (1)).
- spreads the vaccination over the remaining weeks in the modeling period.
To quantify the vaccine impact, we determined the vaccine effectiveness in terms of effective reproduction number and weekly and total cases and deaths averted for one year (January to December 2025) considering the above vaccination levels (, , , and ) combined with non-pharmaceutical interventions targeting under-15s (Figure 3, Figure 4, Figure 5 and Figure 6).
3. Results
3.1. Analytical Results
3.1.1. Basic and Control Reproduction Numbers
Before determining the control reproduction number, the disease-free equilibrium () of the model is given by:
, where
, ,
, .
In the absence of vaccination, and , , , .
To determine the control reproduction number, we use the next-generation approach. The new infection matrix F and the transition matrix V, all evaluated at DFE, are given by:
,
,
where,
, , , ,
, .
, .
The largest eigenvalue of is the control reproduction number of the model given by:
where,
and ,
with , , .
To evaluate the numerical value of the control reproduction in the absence of vaccination (), we set in the expression of . The control reproduction number in the absence of vaccination is given by:
with
,
and
.
It is worth mentioning that in the absence of vaccination and other control measures, . Hence, . Replacing these particular values into the expression of the control reproduction number yields the basic reproduction number, , of the model given by:
where
and ,
with , and .
It is important to highlight that is the contribution of the over 15-year-old individuals involving the age-transition rate, .
3.1.2. Effective Reproduction
The effective reproduction number, is given by:
where
,
, with ,
.
The effective reproduction number in the absence of vaccination, is given by:
where
, and
; the are as above.
3.2. Stability Analysis of the DFE and Possible Extinction of Mpox
Theorem 1.
The Disease Free Equilibrium DFE is Globally asymptotically stable whenever .
Proof.
Assume , then the DFE is locally asymptotically stable, and the principal eigenvalue of J is negative. Notice that J is a quasi-positive matrix. Thus, by Perron-Frobenus theorem, J has a negative eigenvalue, say with a corresponding eigenvector strictly positive, U that satisfy . Next, let Y denote the vector whose coordinates are the infected compartments, i.e., and define . Based on (13),
Then and consequently as . By invoking the limiting argument, one can notice that the DFE attracts all solutions of (13) in , completing the proof. The importance of this theorem in terms of the disease extension is that it guarantees the elimination of the disease whenever the basic reproduction threshold is smaller than unity.
3.3. Numerical Results
The results from the model fitting demonstrate a strong agreement between the observed weekly numbers of confirmed cases (represented by red dots) and the predicted numbers of confirmed cases generated by the model (depicted as the blue curve; Figure 2(a)). Similarly, the predicted number of deaths aligns closely with the observed reported deaths (Figure 2(b)). The root mean square error () for the model fit is 208.16. Additionally, the cross-validation process, performed on the remaining 10% of observations, yields an value of 29.06, indicating the model’s robust predictive capability.
3.3.1. MPOX Dynamics in the Absence of Vaccination
The basic reproduction number () for MPOX was 1.73, while the control reproduction number () was 1.48. The peak in the number of confirmed cases occurred on September 29, 2024, with approximately 411 cases (Figure 2(a) and Table 4) and 4 reported deaths (Figure 2(b)). The detection rate of confirmed cases was low (0.0001), likely attributable to limited testing efforts.
Furthermore, we examine the evolution of the number of confirmed MPOX cases and deaths and the effective reproduction number over time in the absence of vaccination. The estimated model parameters, presented in Table 4, were used to predict these dynamics by December 2025. Figure 2 illustrates a declining trend in the number of confirmed MPOX cases and deaths, as well as a similar downward trend in the effective reproduction number during this period (Figure 2(c)). This highlights the gradual decline of Mpox transmission in the DRC. However, the projected increase in the effective reproduction number () starting around July 2025 raises concerns about a potential re-emergence of the disease.
3.3.2. Impact of Vaccination on MPOX Transmission Dynamics
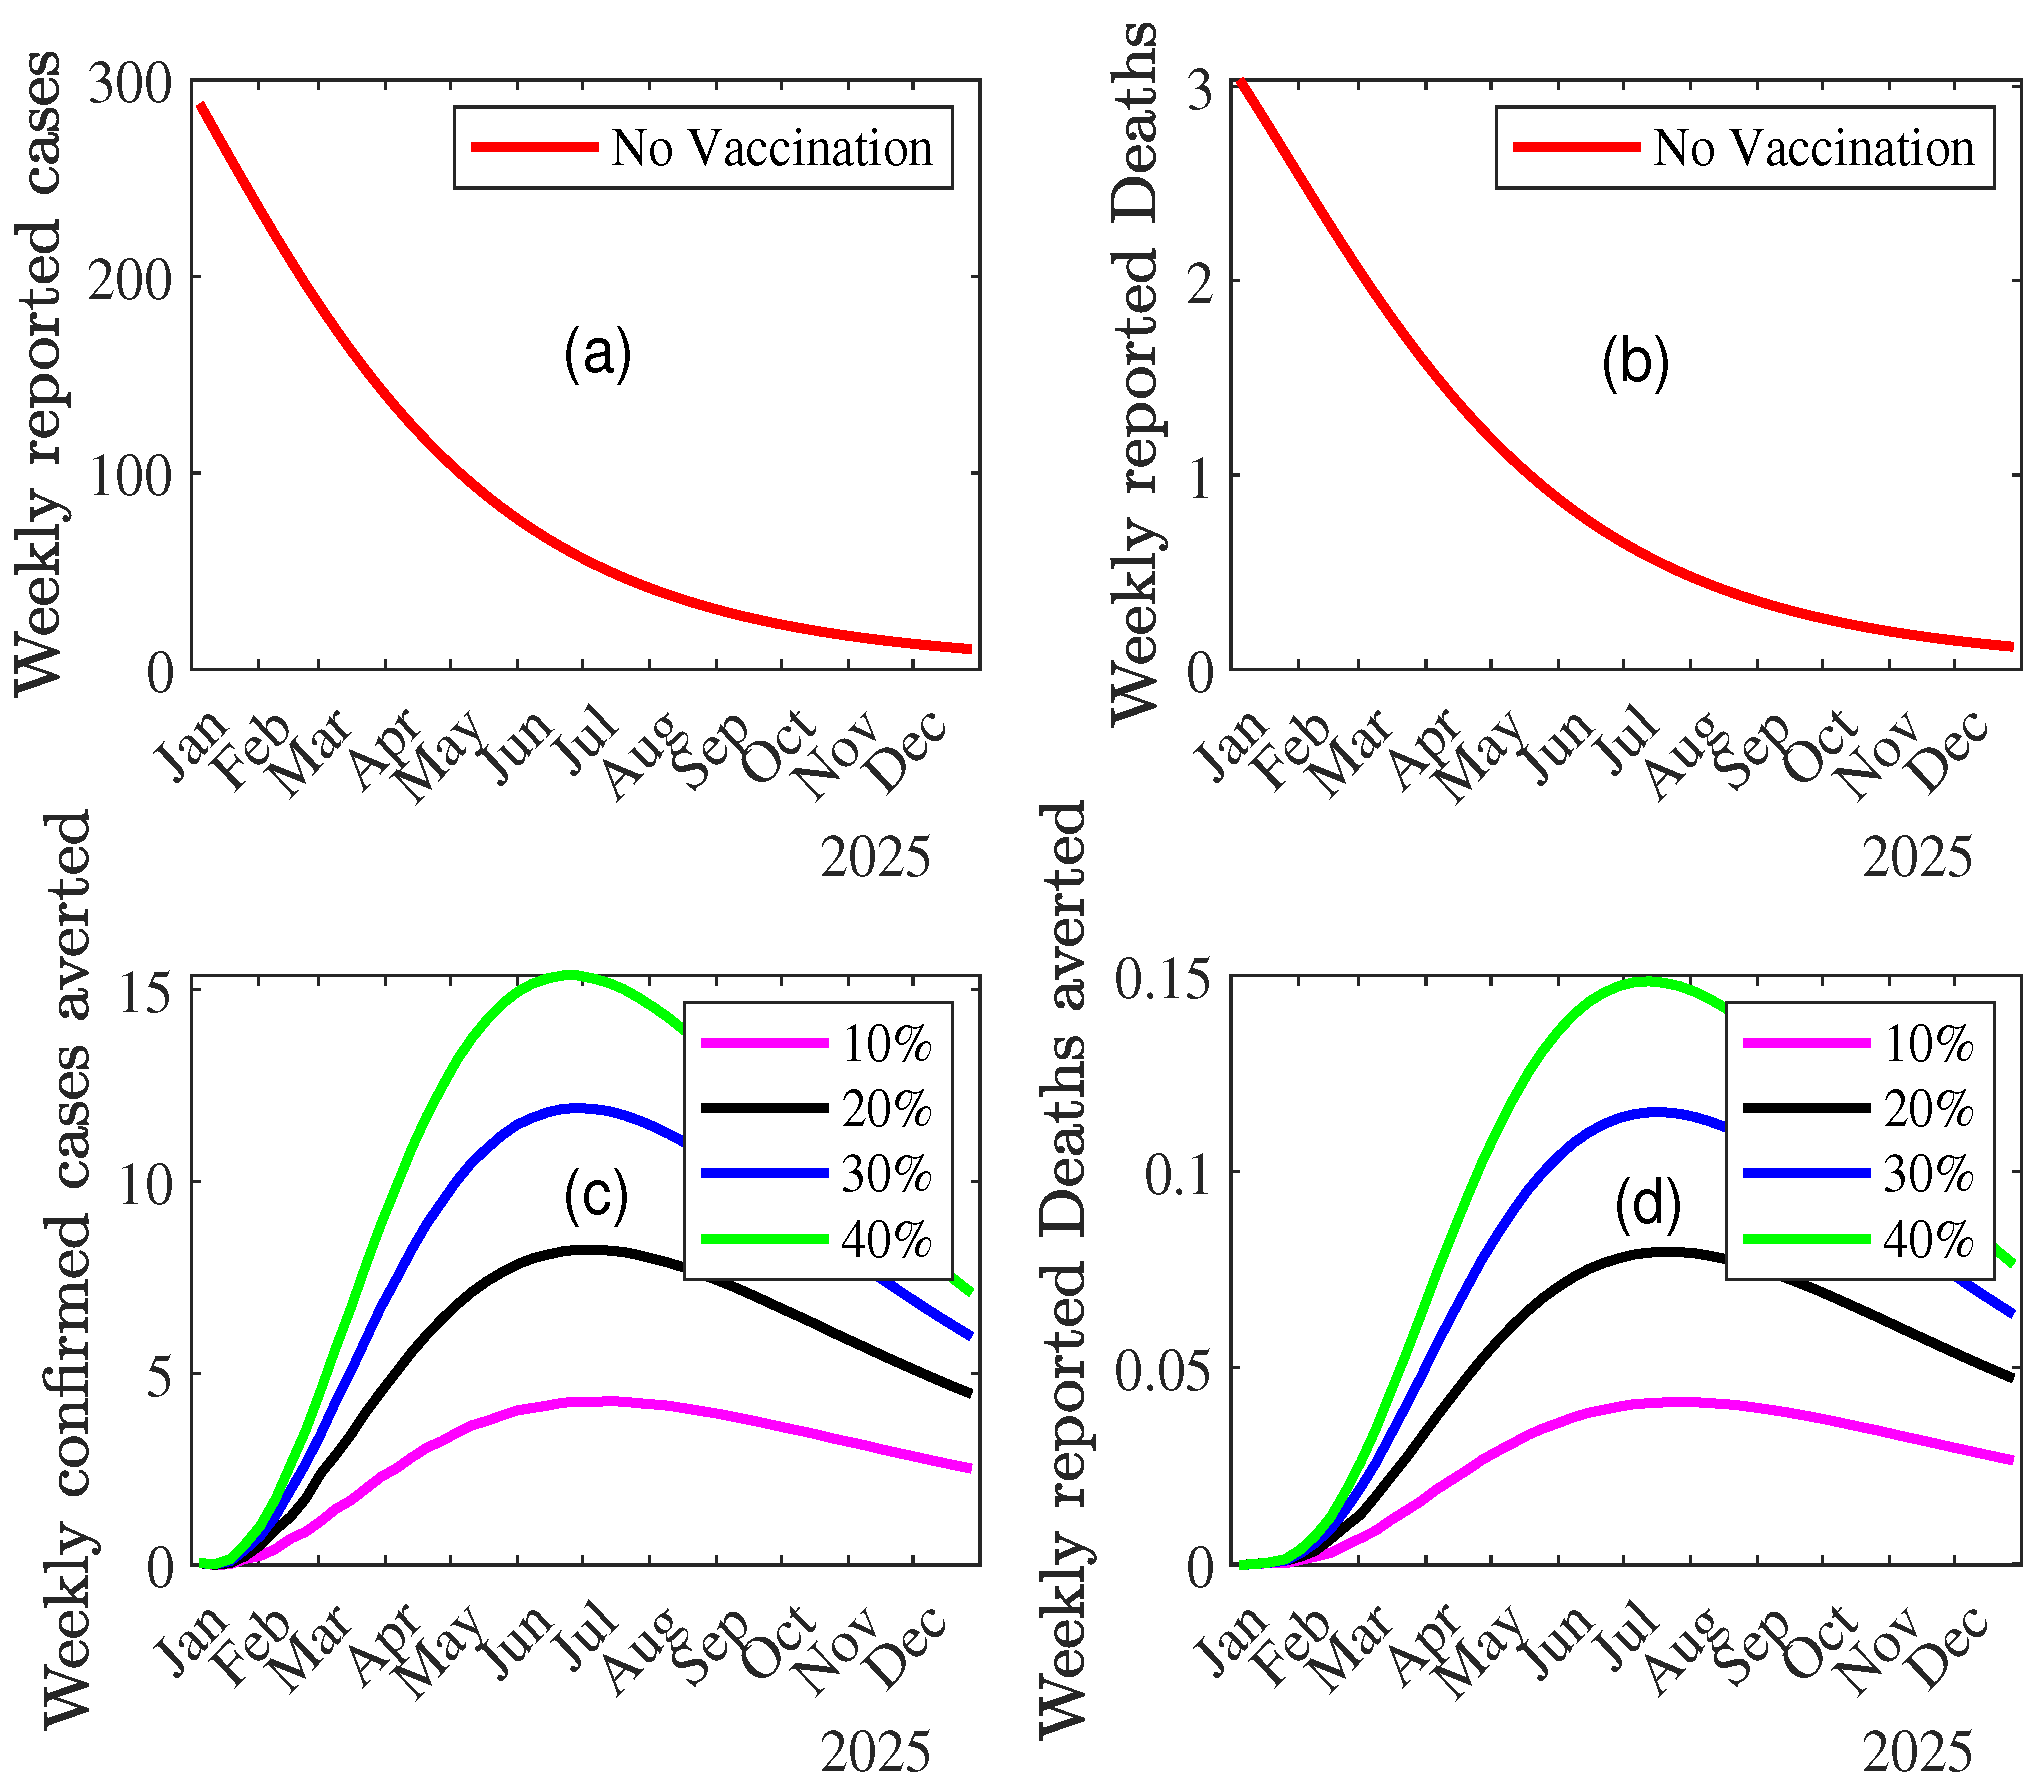
We simulated the model to evaluate the impact of vaccination on MPOX dynamics in the DRC by predicting the effective reproduction number, the weekly numbers of confirmed MPOX cases and deaths under two scenarios: without vaccination and with increasing vaccination coverage levels (10%, 20%, 30%, and 40%). This simulation provides insights into the weekly trends of confirmed MPOX cases and deaths across these vaccination levels. Figure 3 illustrates the weekly incidence of MPOX-confirmed cases and deaths averted under different vaccination levels with the baseline scenario corresponding to no vaccination. The first two graphs (Figure 3(a) and (b)) of this figure depict the weekly number of confirmed cases and deaths in the absence of vaccination, showing a consistent decline throughout 2025. The weekly number of confirmed cases begins at approximately 300 in January 2025 and steadily declines to near zero by the end of the year. Similarly, the weekly number of reported deaths starts at around 3 in January 2025 and also diminishes to negligible levels by December 2025. The number of confirmed cases averted increases with higher vaccination coverage, peaking mid-year for all scenarios. Specifically, at 40% vaccination coverage, the weekly number of cases averted reaches a maximum of approximately 15 (3(c)). The weekly number of deaths averted shows a similar trend (3(d)).
These results emphasize that increasing vaccination coverage significantly reduces both the number of confirmed cases and deaths, particularly during the first half of 2025. The higher the vaccination level, the greater the averted burden of disease, highlighting the critical role of vaccination in controlling MPOX dynamics.
Figure 3.
Weekly incidence of Mpox cases and deaths averted across combined vaccination and control measure () levels.
Figure 3.
Weekly incidence of Mpox cases and deaths averted across combined vaccination and control measure () levels.
Combined Effect of Vaccination and Increasing Control Measures Levels ()
Since under-15 individuals are the most affected by MPOX, non-pharmaceutical interventions targeting behavioral factors could be crucial in reducing MPOX transmission and its overall burden. In this study, we also examine the impact of varying levels of the reduction factor of the force of infection among under-15 individuals, in combination with different vaccination coverage levels, on the effective reproduction number, and the total number of cases and deaths averted by December 2025 (Figure 4, Figure 5 and Figure 6).
Figure 4.
Effective reproduction number of MPOX across combined vaccination and control measure () levels.
Figure 4.
Effective reproduction number of MPOX across combined vaccination and control measure () levels.
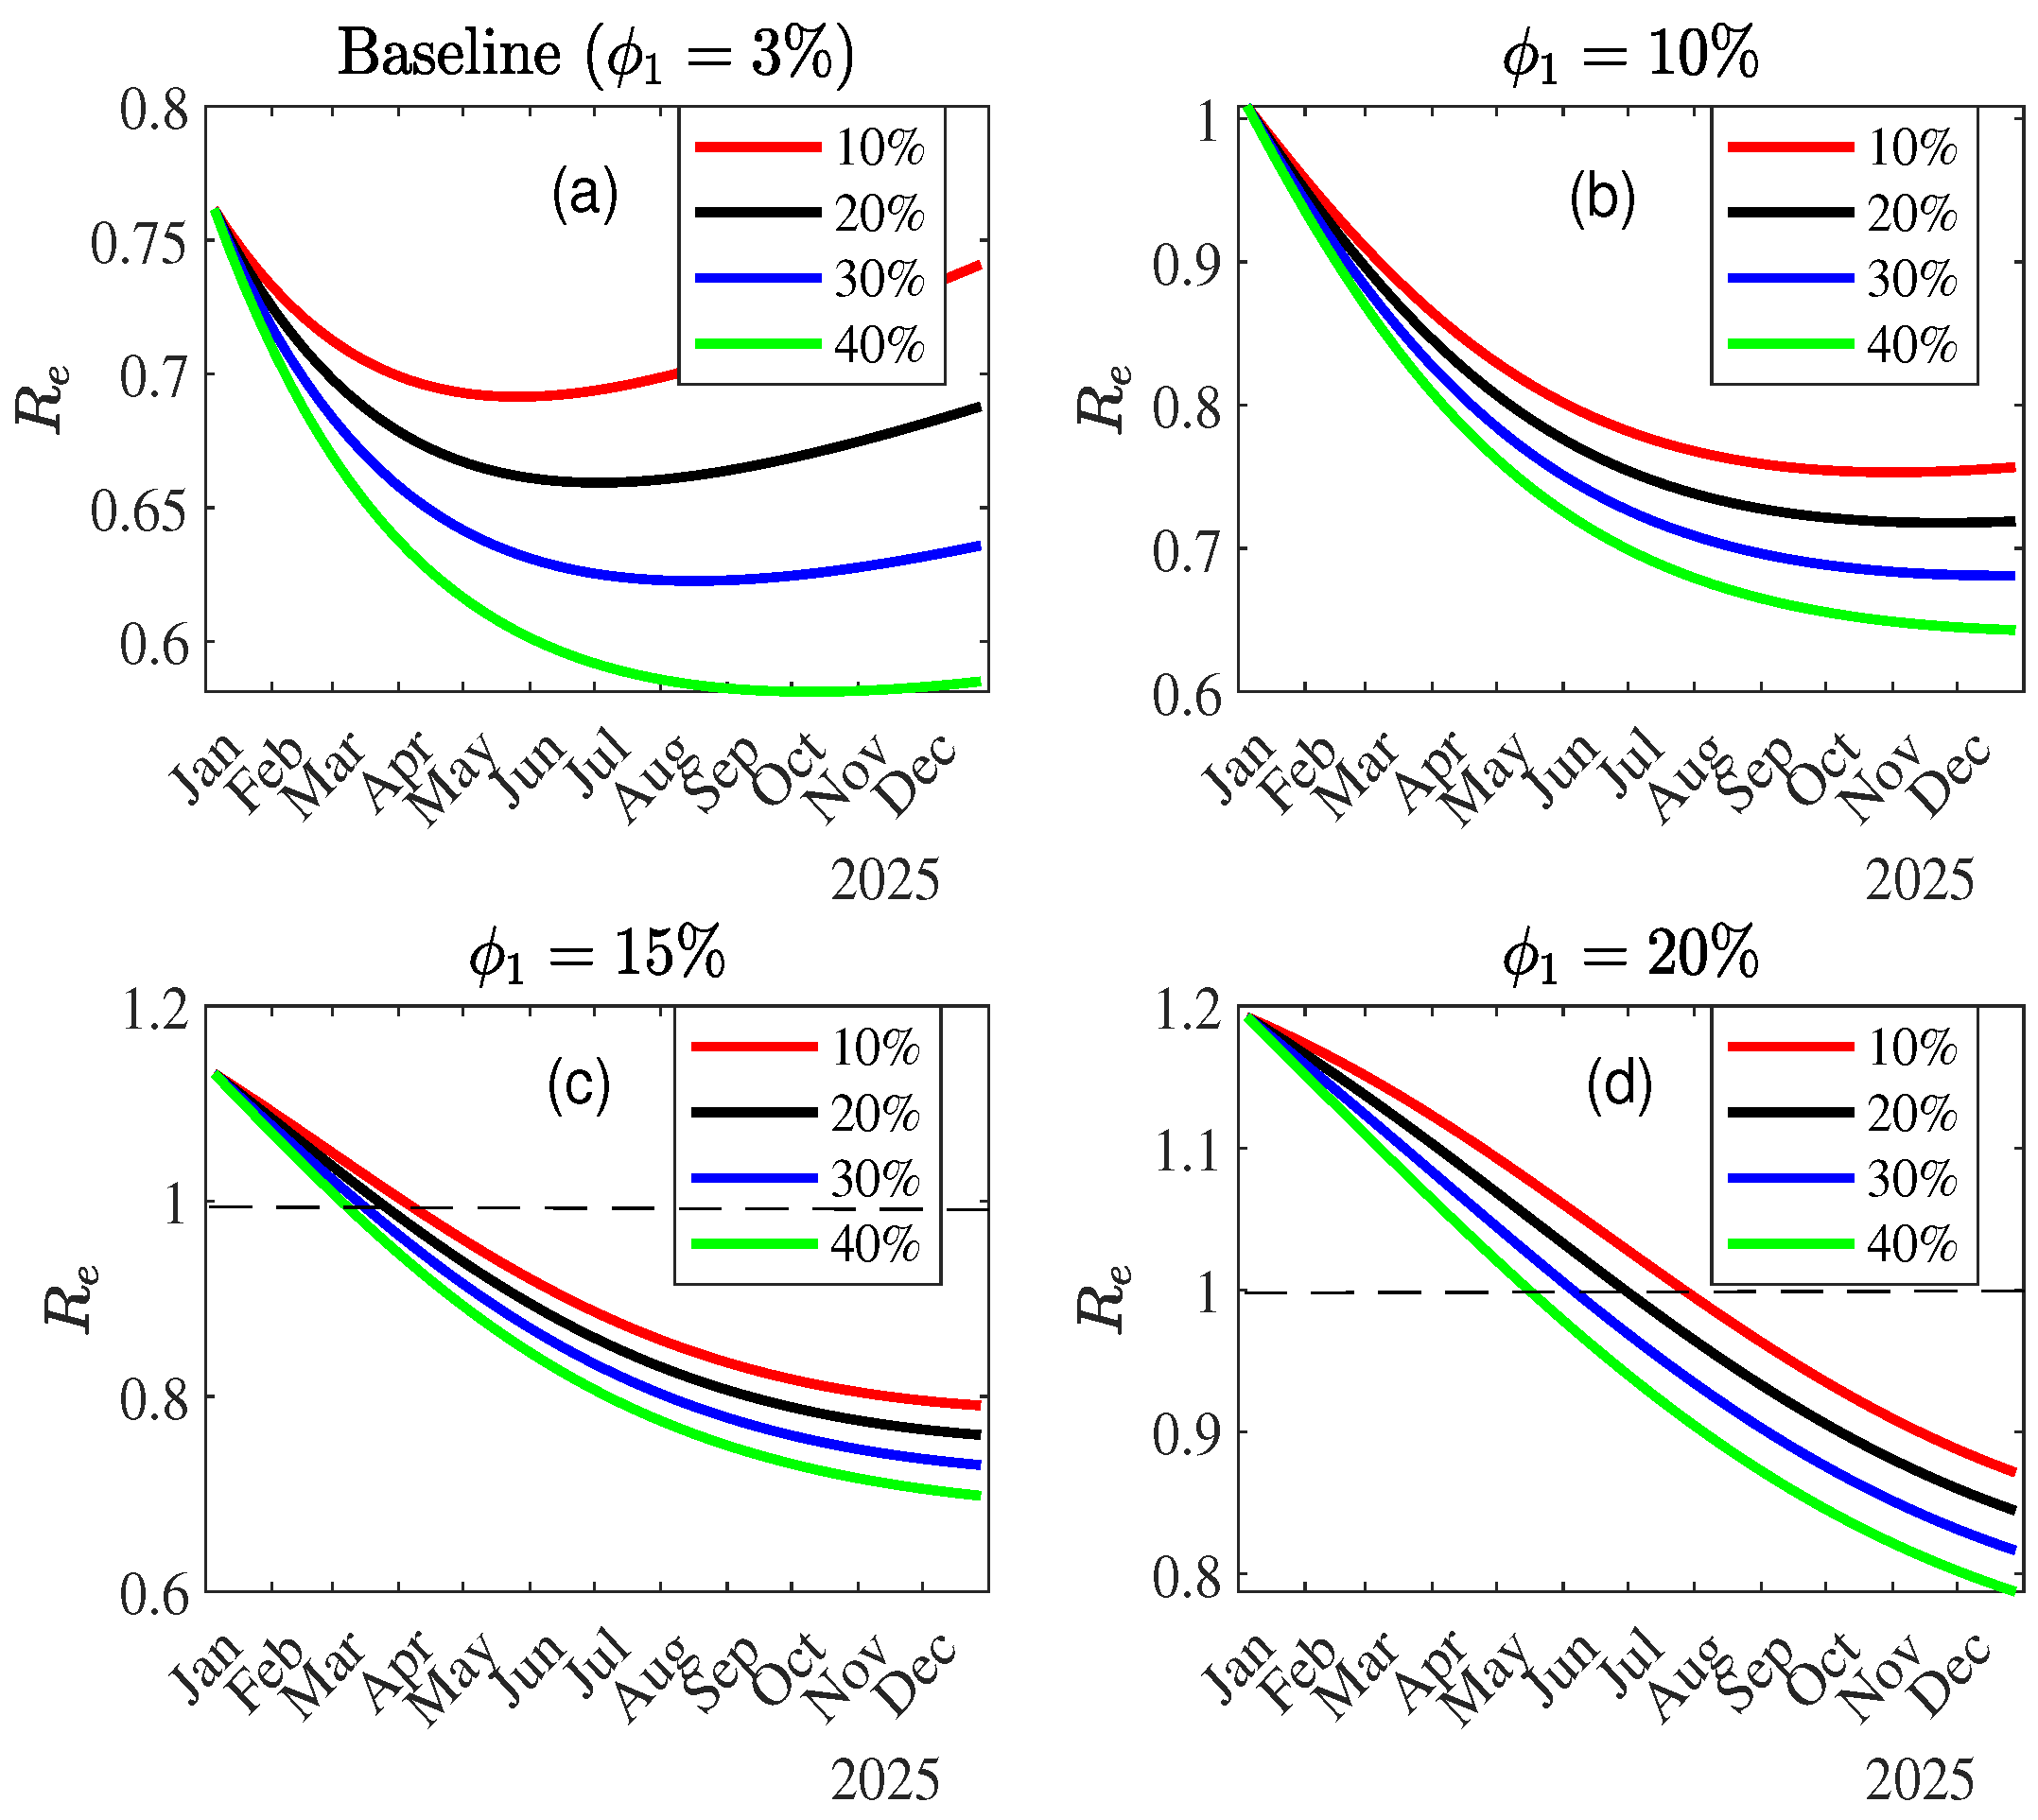
Figure 4 shows a decreasing trend in the effective reproduction number () across all scenarios, except for the baseline scenario, where an increase in is observed around July 2025, even with vaccination (Figure 4(a)). In scenarios with simulated improvements in control measure efficacy targeting the under-15s (Figure 4(b), (c), and (d)), the downward trend in becomes consistent with, however, a delay in the peak in MPOX cases and deaths () from January 2025 (Figure 4(b)) to June 2025 (for vaccination coverage) or later in September 2025 (for vaccination coverage) (Figure 4(d)). These findings emphasize the critical importance of adopting an integrated approach to Mpox control.
Figure 5 shows the trend in the total number of MPOX cases averted across varying vaccination coverage levels (10%, 20%, 30%, and 40%) and different control measure levels (). The total number of MPOX cases without vaccination or control measures is 4602, serving as the baseline for comparison. With the baseline value of (), the number of cases averted increases with vaccination coverage, ranging from approximately 100 cases averted at 10% coverage to over 500 cases averted at 40% coverage. With an improved control measure efficacy, the number of cases averted increases substantially. For example, for , nearly 1000 cases are averted compared to the baseline scenario at 40% vaccination coverage and 1500 cases averted for an increased control measure efficacy () at the same vaccination level (40%). With the highest control measure efficacy considered (), the number of averted cases reaches its maximum, surpassing 1800 cases at 40% vaccination coverage.
Figure 5.
Total Mpox cases averted across combined vaccination and control measure () levels.
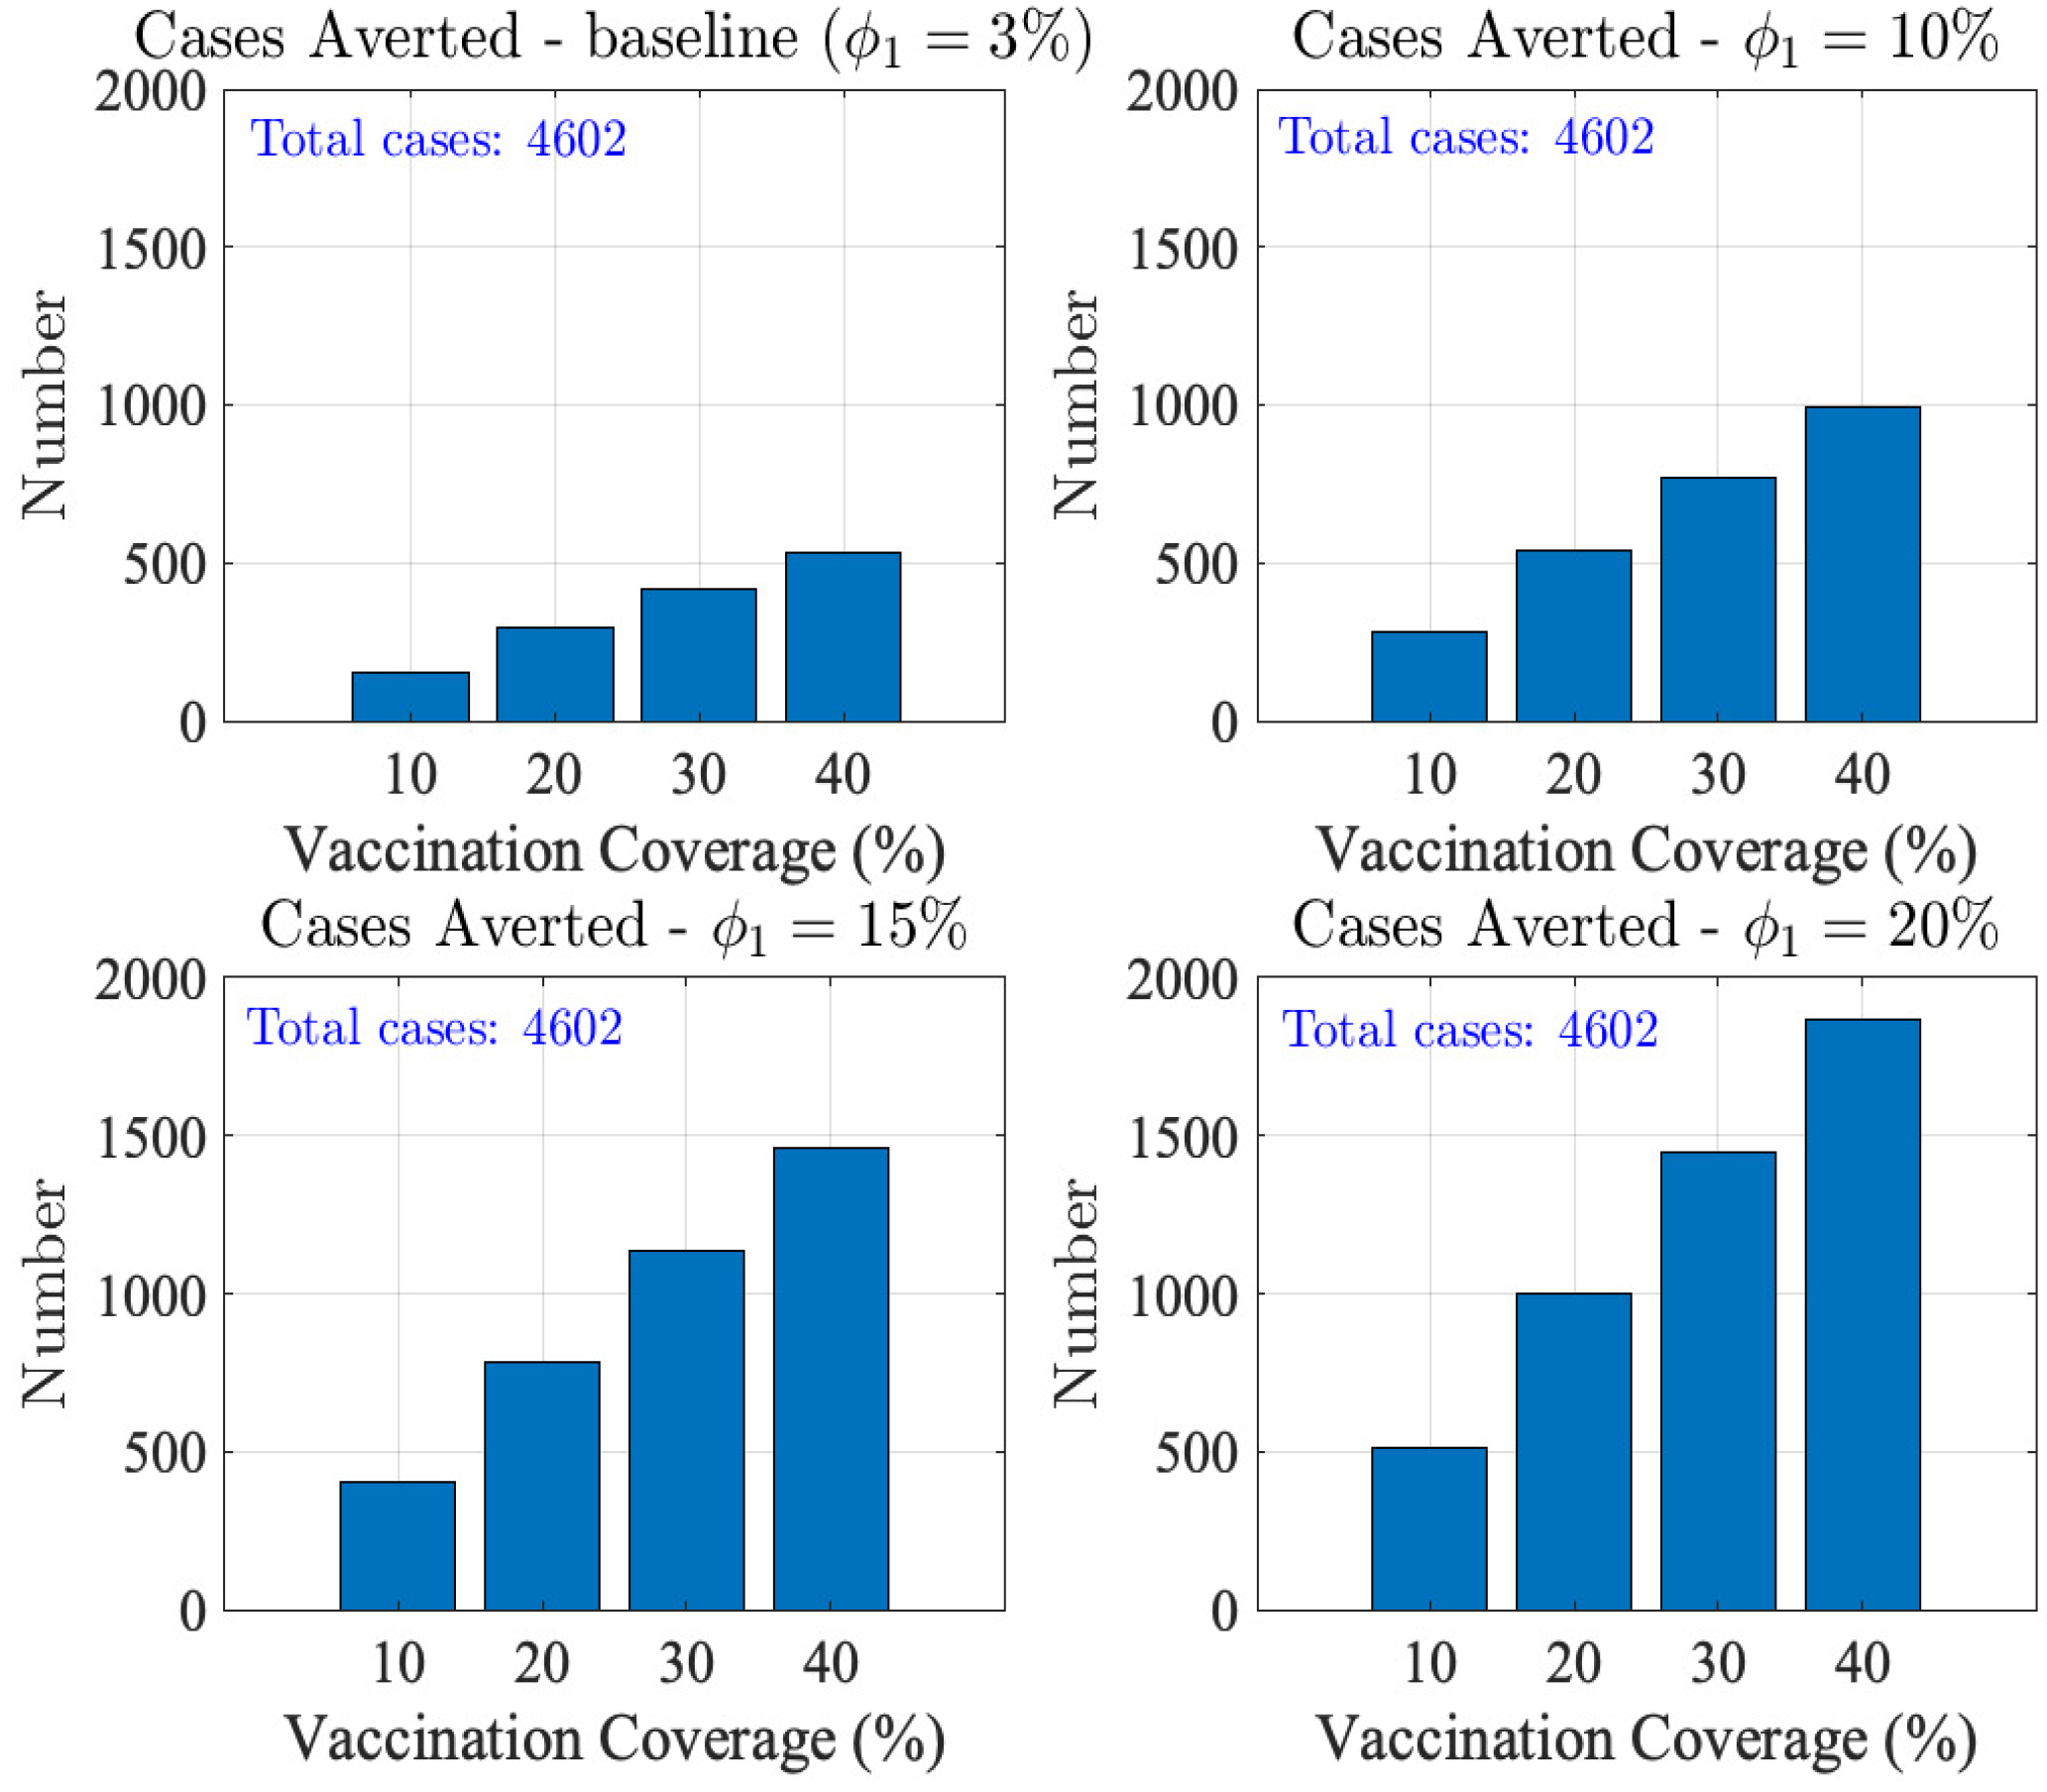
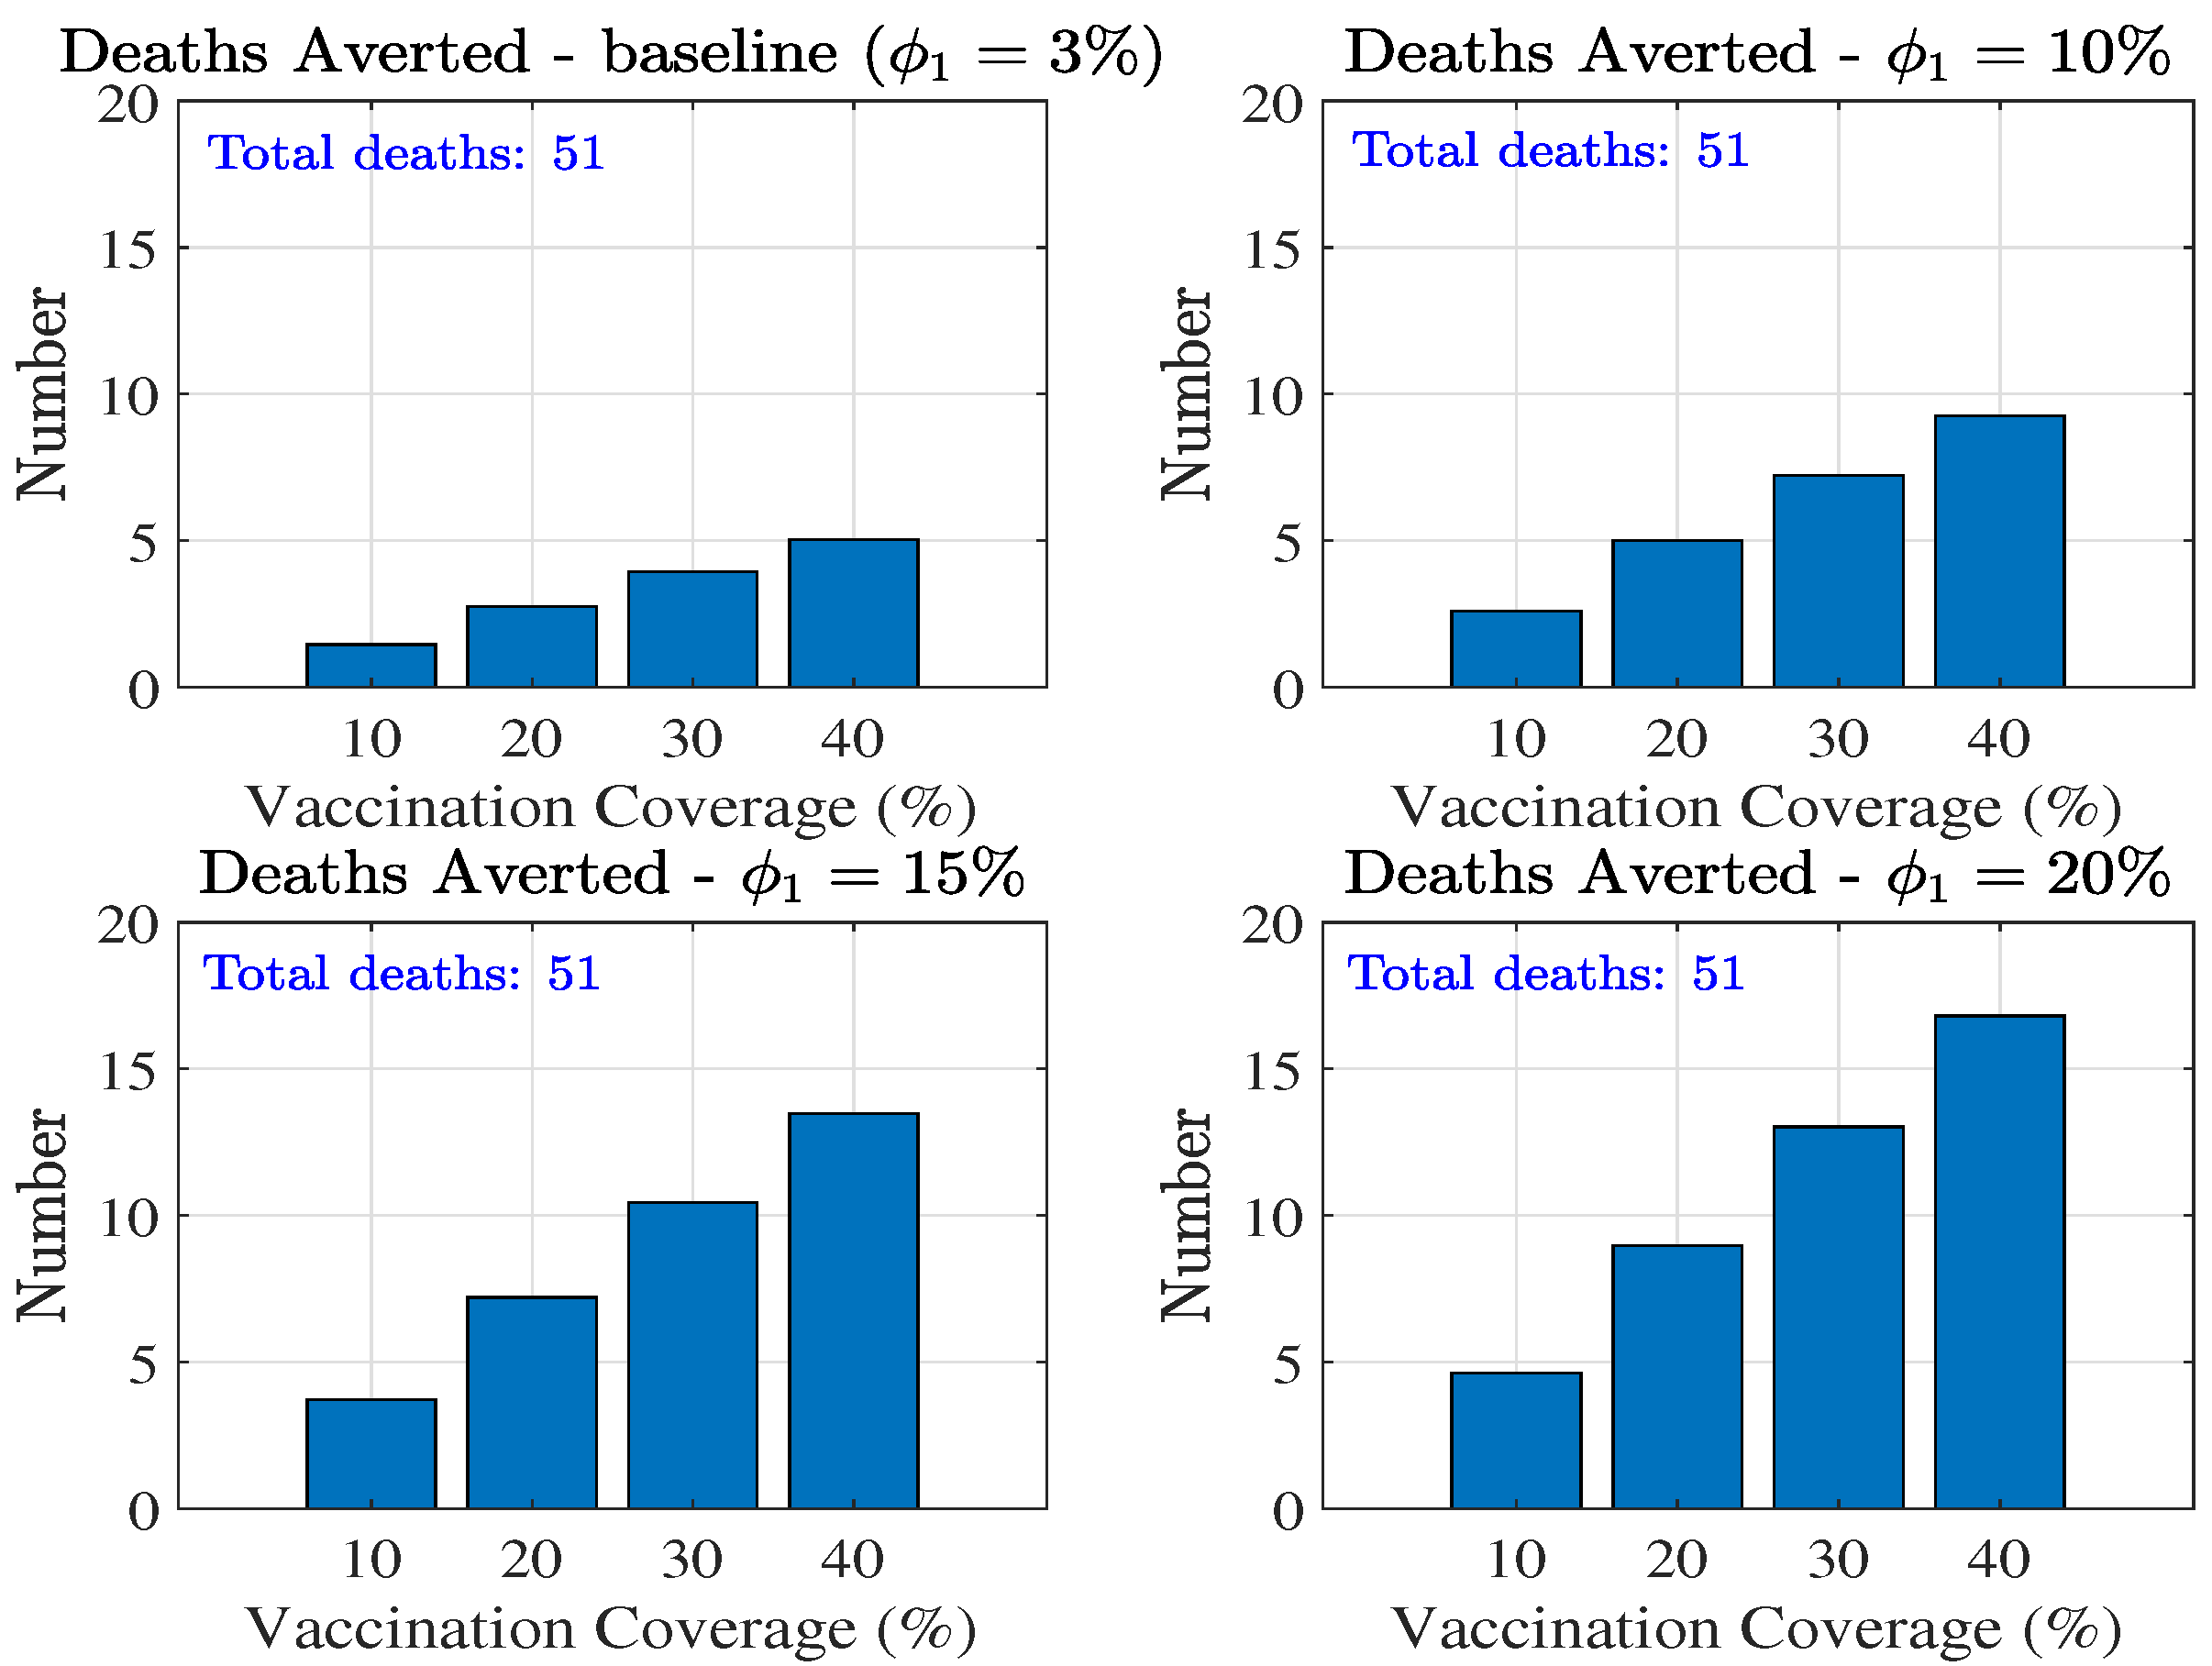
Figure 6 shows the total number of MPOX deaths averted across varying vaccination coverage levels (10%, 20%, 30%, and 40%) and different control measure efficacy levels (=3%, 10%, 15%, and 20%). The total number of deaths in the absence of vaccination with baseline control measures is 51.
With the baseline control efficacy (=3%), the number of deaths averted increases proportionally with vaccination coverage, ranging from approximately 1 death averted at 10% coverage to over 4 deaths averted at 40% coverage. With improved control efficacy, the number of deaths averted increases significantly. At 40% vaccination coverage, approximately 10, 15 and 17 deaths are averted for =10%, 15%, and 20%, respectively. These results highlight the synergistic effect of increasing vaccination coverage and improving control measure efficacy on reducing MPOX-related cases and deaths. The findings underscore the critical importance of combining vaccination campaigns with effective public health interventions to minimize MPOX transmission and burden.
Figure 6.
Total Mpox Deaths averted across combined vaccination and control measure () levels.
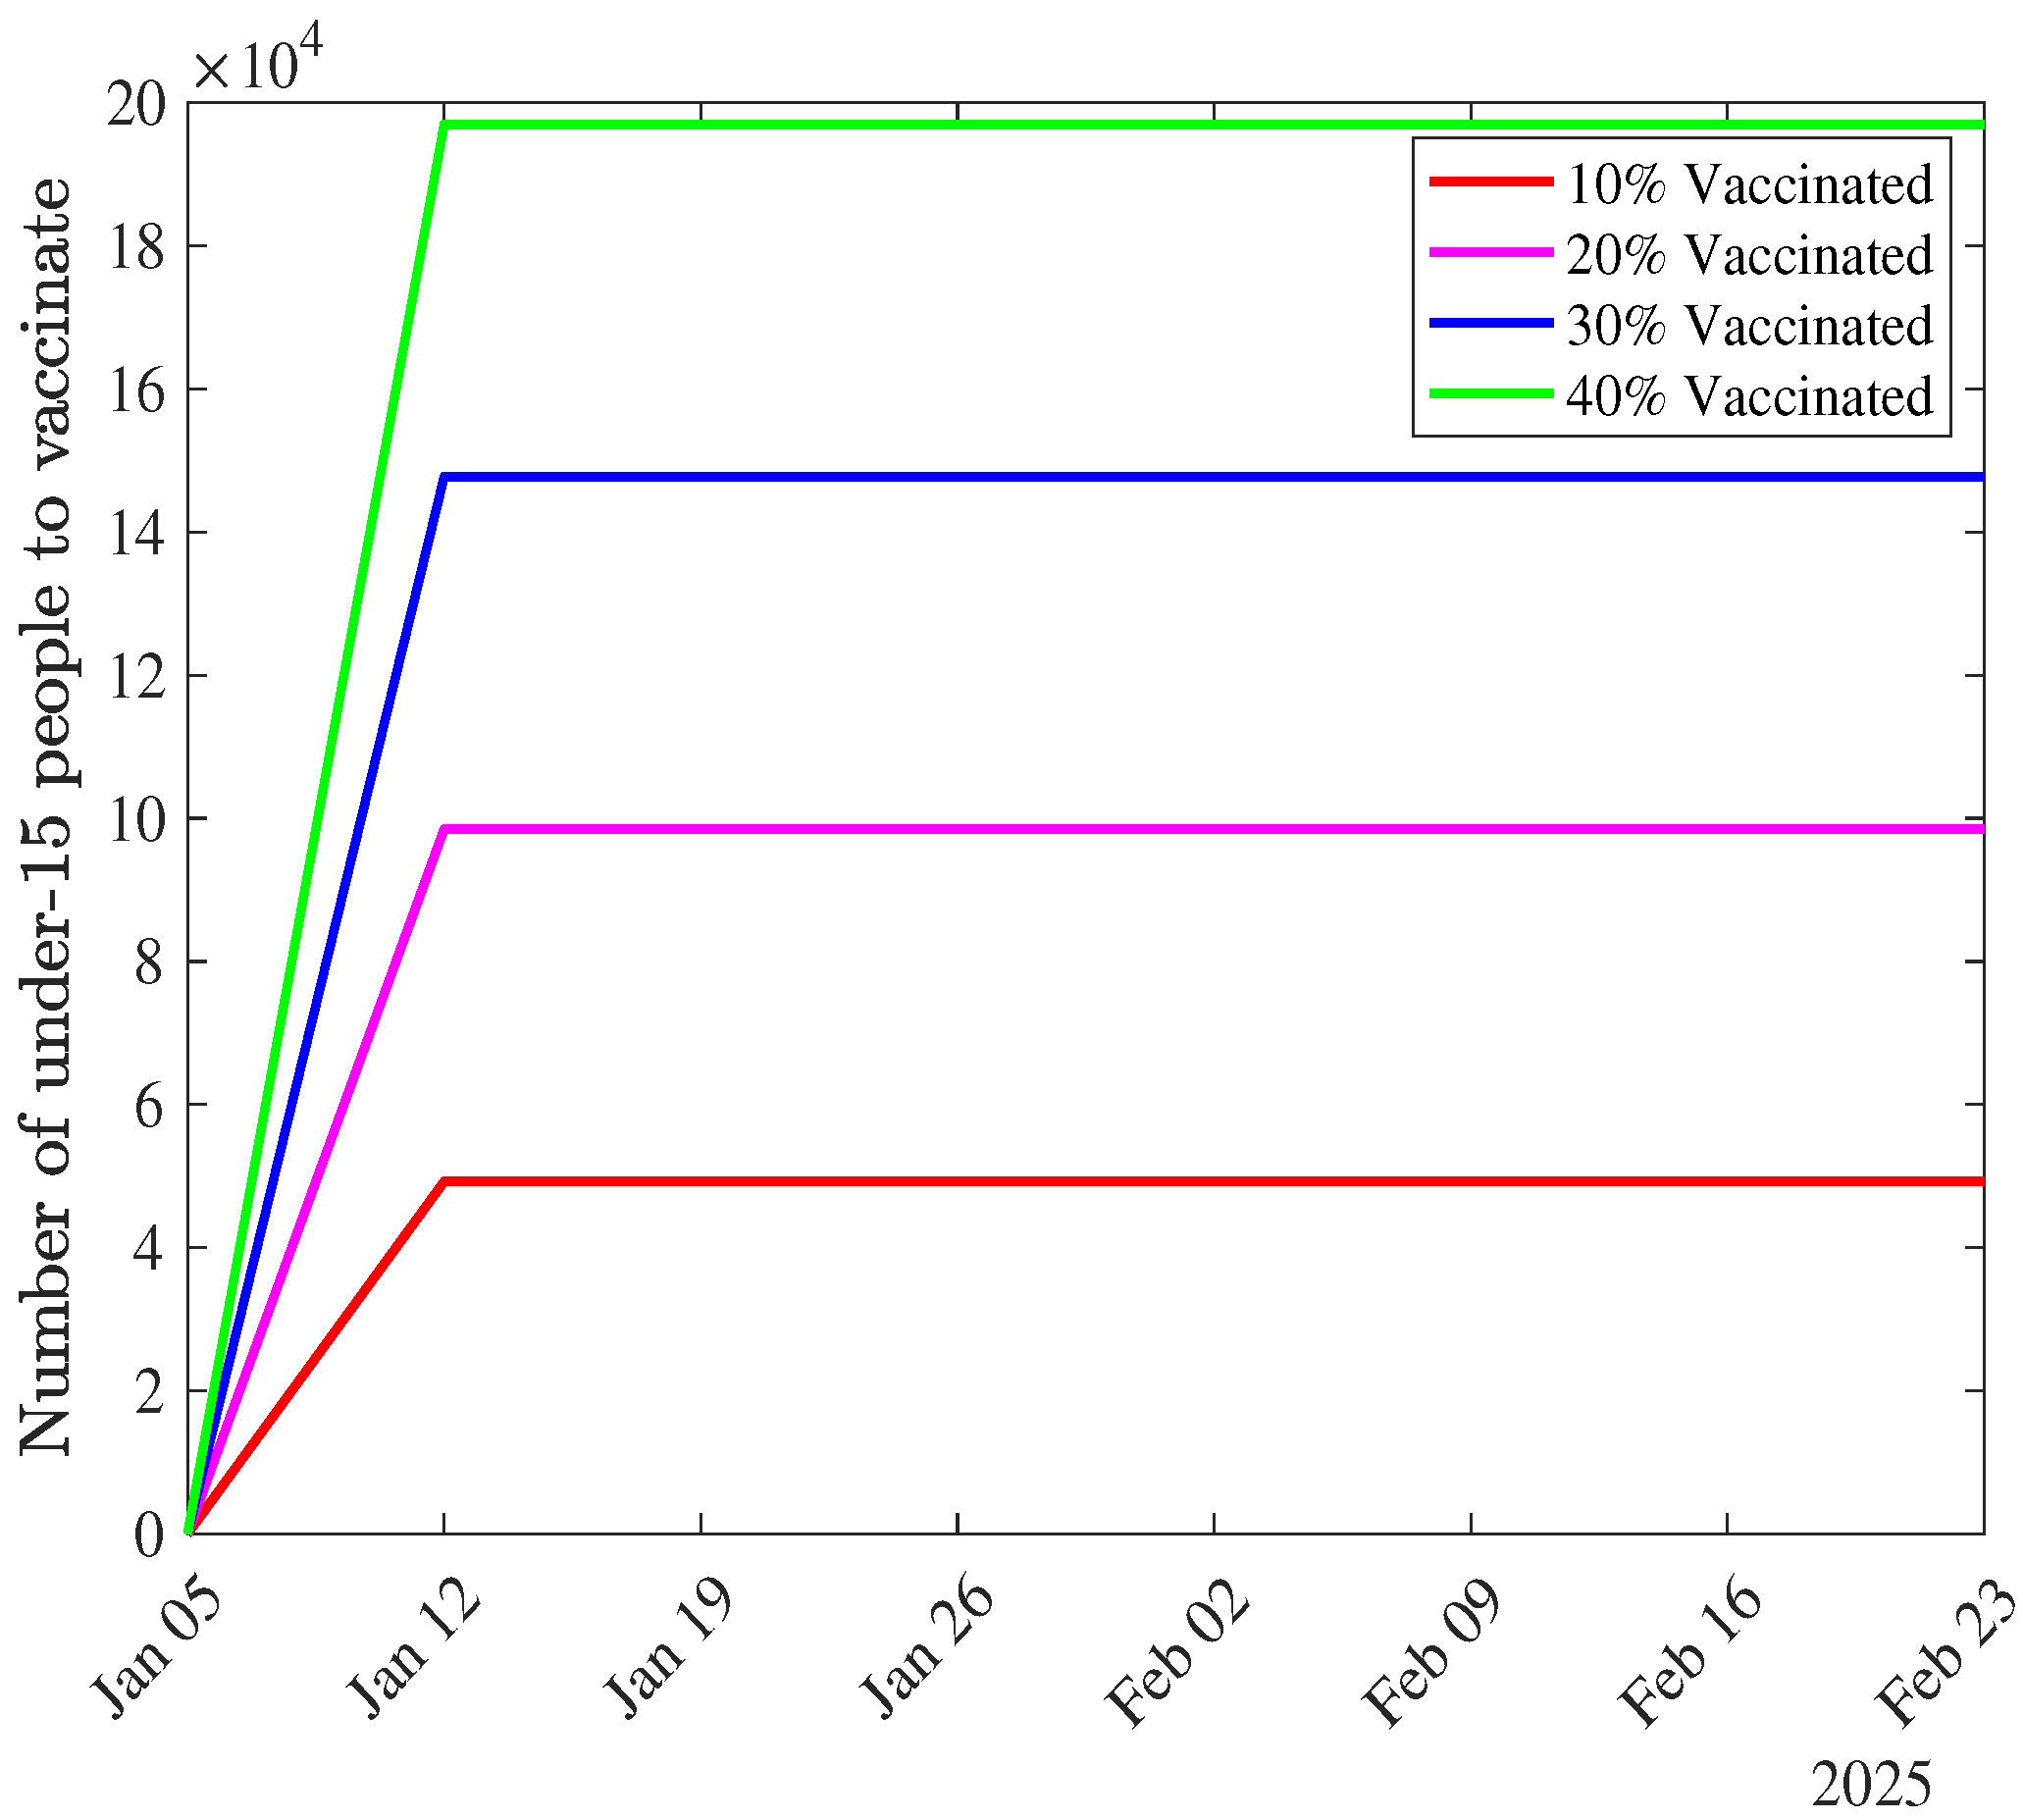
The weekly numbers of under-15s that need to be vaccinated to achieve coverage levels of 10%, 20%, 30%, and 40% are provided as a supplementary file. A graph of these numbers for the first two months (January and February 2025) (Figure A1) shows an initial increase in the number of under-15s to be vaccinated in the first week of the campaign, followed by a steady allocation throughout the remainder of the vaccination campaign.
4. Discussion
This study uses a mathematical age-structured model to evaluate the impact of vaccination strategies on Mpox dynamics in the Democratic Republic of Congo (DRC), focusing on those under 15 years old as the primary target of upcoming vaccination campaigns. The model stratifies the total population into two subgroups according to age status (under-15 and over-15 year old subpopulation). It is fitted to weekly numbers of confirmed MPOX cases and deaths using the nonlinear least square technique. Our findings contribute to existing efforts to control the disease, with important implications for public health interventions.
Our study shows that vaccination can significantly reduce Mpox cases and deaths, particularly at higher coverage levels. For instance, at 40% coverage, the model predicts up to 1,800 cases and 17 deaths averted, emphasizing the critical role of vaccination campaigns in mitigating disease transmission and burden. These findings align with previous studies that highlighted the effectiveness of vaccination in reducing Mpox transmission during outbreaks ([21] and [22]). To be effective, the vaccination campaign will need to target under-15s in highly affected provinces in the DRC such as South-Kivu and Equateur [7].
Our analysis also highlights the synergistic benefits of combining vaccination with non-pharmaceutical interventions (NPIs). The study reveals a possible re-emergence of MPOX even with vaccination combined with no improved control measures targeting under-15s. Enhancing NPIs, such as public awareness campaigns, behavioral modifications, and improved hygiene practices, can address the potential rebound in and avert a re-emergence of Mpox in the population. Active surveillance systems should be expanded to rapidly detect and respond to new cases. Enhanced behavioral measures, such as reducing contact rates and improving awareness, mainly targeting under-15 individuals, further amplified the effectiveness of vaccination, supporting the conclusions from [23], who modeled the interplay between vaccination and behavioral interventions in zoonotic disease control. Similarly, [17] demonstrated that co-interventions, including vaccination, significantly reduce the overall burden of zoonotic diseases like Mpox.
Despite these encouraging results, our study underscores some challenges and gaps in current Mpox control efforts. First, the disproportionately low reduction of the force of infection linked to control measures (=3.4%) among under 15-year-old individuals, as observed in this study, calls for targeted interventions focusing on this vulnerable age group. As noted by [23] and corroborated by recent findings [8], the need for age-specific severity estimates remains critical for optimizing vaccination strategies.
Another limitation is the lack of data on cross-immunity and LC16m8 vaccine waning immunity, which could influence long-term vaccination outcomes. Studies by [21] have highlighted the importance of understanding vaccine efficacy over time to ensure sustainable Mpox control. Future research should focus on addressing these gaps to improve model predictions and inform policy decisions.
Overall, this study emphasizes the need for integrated approaches combining vaccination with other interventions to effectively control Mpox in endemic regions. Public health efforts can maximize the impact of interventions and mitigate the disease’s burden by targeting the most affected populations and addressing existing data gaps. Our findings provide a valuable framework for policymakers and researchers to design and implement evidence-based Mpox control strategies.
5. Conclusions
This study developed and applied an age-structured mathematical model to evaluate the impact of vaccination on Mpox transmission and burden in the DRC. Our findings highlight the critical role of vaccination in reducing Mpox cases and deaths. Simulations revealed that increasing vaccination coverage from 10% to 40% substantially reduces disease transmission and burden, with the number of averted cases and deaths increasing significantly under higher coverage levels and enhanced non-pharmaceutical interventions. These results emphasize the need for targeted vaccination campaigns focusing on under-15-year-old individuals and the importance of integrating vaccination with other control measures to maximize public health outcomes. This work provides valuable insights into vaccination strategy design and its implications for controlling Mpox in endemic regions.
Supplementary Materials
A table providing detailed information on the number of under-15s to be vaccinated across different vaccination levels is available as a supplementary file.
Author Contributions
Conceptualization, R.G.K.; methodology, R.G.K.; formal analysis, H.B.T., R.G.K. and K.T.; software, R.G.K.; data curation, Y.M. and K.T.; validation, R.G.K.; writing original draft preparation, Y.M and R.G.K.; writing, review and editing, all authors; supervision, R.G.K. All authors have read and agreed to the published version of the manuscript.
Funding
This work was carried out with the support of the European and Developing Countries Clinical Trials Partnership (EDCTP) through the TEBWA programme (Training Epidemiologists and Biostatisticians for Enhanced Response to Disease Outbreaks and Epidemics in West Africa), grant number CSA2020E-3131.
Data Availability Statement
The data presented in this study are openly available in https://ourworldindata.org/mpox.
Conflicts of Interest
The authors declare that there are no conflicts of interest.
Appendix A. Next-Generation Matrix
The next-generation matrix is as follows:
where, , , ,
and
.
Appendix B. Distribution of Under-15 s to be Vaccinated According to Vaccination Levels
Figure A1.
Weekly number of under-15s to be vaccinated according to vaccination levels.
References
- Liu, B.; Farid, S.; Ullah, S.; Altanji, M.; Nawaz, R.; Wondimagegnhu Teklu, S. Mathematical assessment of monkeypox disease with the impact of vaccination using a fractional epidemiological modeling approach. Scientific Reports 2023, 13, 13550. [Google Scholar] [CrossRef] [PubMed]
- Centers for Disease Control and Prevention (U.S.). What you should know about monkeypox. https://stacks.cdc.gov/view/cdc/26229. Accessed: 10 Nov 2024.
- Centers for Disease Control and Prevention 2021. National Center for Emerging and Zoonotic Infectious Diseases (NCEZID), Division of High-Consequence Pathogens and Pathology (DHCPP), Monkeypox. https://www.cdc.gov/poxvirus/Monkeypox/index.html. Accessed: 10 Nov 2024.
- Nguyen, P.Y.; Ajisegiri, W.S.; Costantino, V.; Chughtai, A.A.; MacIntyre, C.R. Reemergence of human monkeypox and declining population immunity in the context of urbanization, Nigeria, 2017–2020. Emerging Infectious Diseases 2021, 27, 1007. [Google Scholar] [CrossRef]
- WHO Emergency Response Team. Multi-country outbreak of mpox, External situation report 29. https://www.who.int/publications/m/item/multi-country-outbreak-of-mpox–external-situation-report-30—25-november-2023. Accessed: 10 Nov 2024.
- WHO, Mpox - Democratic Republic of the Congo [Internet]. 2024 [accessed October 31, 2024]. https://www.who.int/emergencies/disease-outbreak-news/item/2024-DON522. Accessed: 10 Nov 2024. 31 October.
- World Health Organization, 2022-23 Mpox (Monkeypox) Outbreak. Global Trends [Internet]. [cited 2023 Sep 14]. https://worldhealthorg.shinyapps.io/mpx_global//#2_Global_situation_update. Accessed: 10 Nov 2024.
- Whittles, L.K.; Mbala-Kingebeni, P.; Ferguson, N.M. Age-patterns of severity of clade I mpox in historically endemic countries. medRxiv 2024, pp. 2024–04. [Google Scholar] [CrossRef]
- Rhodes, T.; Lancaster, K.; Rosengarten, M. A model society: maths, models and expertise in viral outbreaks. Critical Public Health 2020, pp. 253–256. [Google Scholar] [CrossRef]
- Peter, O.J.; Abidemi, A.; Ojo, M.M.; Ayoola, T.A. Mathematical model and analysis of monkeypox with control strategies. The European Physical Journal Plus 2023, 138, 242. [Google Scholar] [CrossRef]
- Peter, O.J.; Kumar, S.; Kumari, N.; Oguntolu, F.A.; Oshinubi, K.; Musa, R. Transmission dynamics of Monkeypox virus: a mathematical modelling approach. Modeling Earth Systems and Environment 2022, pp. 1–12. [Google Scholar]
- Peter, O.J.; Madubueze, C.E.; Ojo, M.M.; Oguntolu, F.A.; Ayoola, T.A. Modeling and optimal control of monkeypox with cost-effective strategies. Modeling Earth Systems and Environment 2023, 9, 1989–2007. [Google Scholar] [CrossRef]
- Allehiany, F.; DarAssi, M.H.; Ahmad, I.; Khan, M.A.; Tag-Eldin, E.M. Mathematical modeling and backward bifurcation in monkeypox disease under real observed data. Results in Physics 2023, 50, 106557. [Google Scholar] [CrossRef] [PubMed]
- El-Mesady, A.; Adel, W.; Elsadany, A.; Elsonbaty, A. Stability analysis and optimal control strategies of a fractional-order monkeypox virus infection model. Physica Scripta 2023, 98, 095256. [Google Scholar] [CrossRef]
- Adel, W.; Elsonbaty, A.; Aldurayhim, A.; El-Mesady, A. Investigating the dynamics of a novel fractional-order monkeypox epidemic model with optimal control. Alexandria Engineering Journal 2023, 73, 519–542. [Google Scholar] [CrossRef]
- Lasisi, N.; Akinwande, N.; Oguntolu, F. Development and exploration of a mathematical model for transmission of monkey-pox disease in humans. Mathematical Models in Engineering 2020, 6, 23–33. [Google Scholar] [CrossRef]
- Omame, A.; Han, Q.; Iyaniwura, S.A.; Ebenezer, A.; Bragazzi, N.L.; Wang, X.; Kong, J.D.; Woldegerima, W.A. Understanding the impact of HIV on mpox transmission in an MSM population: a mathematical modeling study. Infectious Disease Modelling 2024. [Google Scholar] [CrossRef] [PubMed]
- Rabiu, M.; Dansu, E.J.; Mogbojuri, O.A.; Idisi, I.O.; Yahaya, M.M.; Chiwira, P.; Abah, R.T.; Adeniji, A.A. Modeling the sexual transmission dynamics of mpox in the United States of America. The European Physical Journal Plus 2024, 139, 250. [Google Scholar] [CrossRef]
- Xiridou, M.; Miura, F.; Adam, P.; Op de Coul, E.; de Wit, J.; Wallinga, J. The fading of the mpox outbreak among men who have sex with men: a mathematical modelling study. The Journal of infectious diseases 2024, 230, e121–e130. [Google Scholar] [CrossRef]
- Yang, S.; Guo, X.; Zhao, Z.; Abudunaibi, B.; Zhao, Y.; Rui, J.; Wang, Y.; Song, W.; Wei, H.; Chen, T. Possibility of mpox viral transmission and control from high-risk to the general population: a modeling study. BMC Infectious Diseases 2023, 23, 119. [Google Scholar] [CrossRef]
- Brand, S.P.; Cavallaro, M.; Cumming, F.; Turner, C.; Florence, I.; Blomquist, P.; Hilton, J.; Guzman-Rincon, L.M.; House, T.; Nokes, D.J.; others. The role of vaccination and public awareness in forecasts of Mpox incidence in the United Kingdom. Nature Communications 2023, 14, 4100. [Google Scholar] [CrossRef]
- Clay, P.A.; Pollock, E.D.; Saldarriaga, E.M.; Pathela, P.; Macaraig, M.; Zucker, J.R.; Crouch, B.; Kracalik, I.; Aral, S.O.; Spicknall, I.H. Modeling the impact of prioritizing first or second vaccine doses during the 2022 mpox outbreak. medRxiv 2023, pp. 2023–10.
- Bhunu, C.P.; Mushayabasa, S.; Hyman, J. Modelling HIV/AIDS and monkeypox co-infection. Applied Mathematics and Computation 2012, 218, 9504–9518. [Google Scholar] [CrossRef] [PubMed]
- Africa CDC congratulates the Democratic Republic of the Congo on launching Mpox vaccination campaign. https://africacdc.org/news-item/africa-cdc-congratulates-democratic-republic-of-the-congo-on-launching-mpox-vaccination-campaign. Accessed: 10 Nov 2024.
- World Health Organization, Democratic Republic of the Congo Health data overview for the Democratic Republic of the Congo [Internet]. [cited 2022]. https://data.who.int/countries/180. Accessed: 10 Nov 2024.
- United Nations, Department of Economic and Social Affairs, Population Division (2024). World Population Prospects 2024. New York: United Nations. https://population.un.org/wpp/. Accessed: 10 Nov 2024.
- Collier, A.r.; McMahan, K.; Jacob-Dolan, C.; Liu, J.; Borducchi, E.; Moss, B.; Barouch, D.H. Rapid Decline of Mpox Antibody Responses Following MVA-BN Vaccination. medRxiv 2024, pp. 2024–09.
- Berry, M.T.; Khan, S.R.; Schlub, T.E.; Notaras, A.; Kunasekaran, M.; Grulich, A.E.; MacIntyre, C.R.; Davenport, M.P.; Khoury, D.S. Predicting vaccine effectiveness for mpox. Nature Communications 2024, 15, 3856. [Google Scholar] [CrossRef]
- Bunge, E.M.; Hoet, B.; Chen, L.; Lienert, F.; Weidenthaler, H.; Baer, L.R.; Steffen, R. The changing epidemiology of human monkeypox—A potential threat? A systematic review. PLoS neglected tropical diseases 2022, 16, e0010141. [Google Scholar] [CrossRef] [PubMed]
- Honfo, S.H.; Taboe, H.B.; Kakai, R.G. Modeling COVID-19 dynamics in the sixteen West African countries. Scientific African 2022, 18, e01408. [Google Scholar] [CrossRef] [PubMed]
- ASSOCIATED PRESS, Japan pledges to donate 3 million doses of Mpox vaccine to the Democratic Republic of the Congo. https://apnews.com/article/50dbd1f75a4bb61ceeefcb9bbeb95314. Accessed: 10 Nov 2024.
- Taboe, H.B.; Pilyugin, S.S.; Ngonghala, C.N. Resolve Lassa Fever Persistence: A Compartmental Model with Environmental Virus-Host-Vector Interaction. 2024.
Figure 1.
Flowchart of the formulated model.
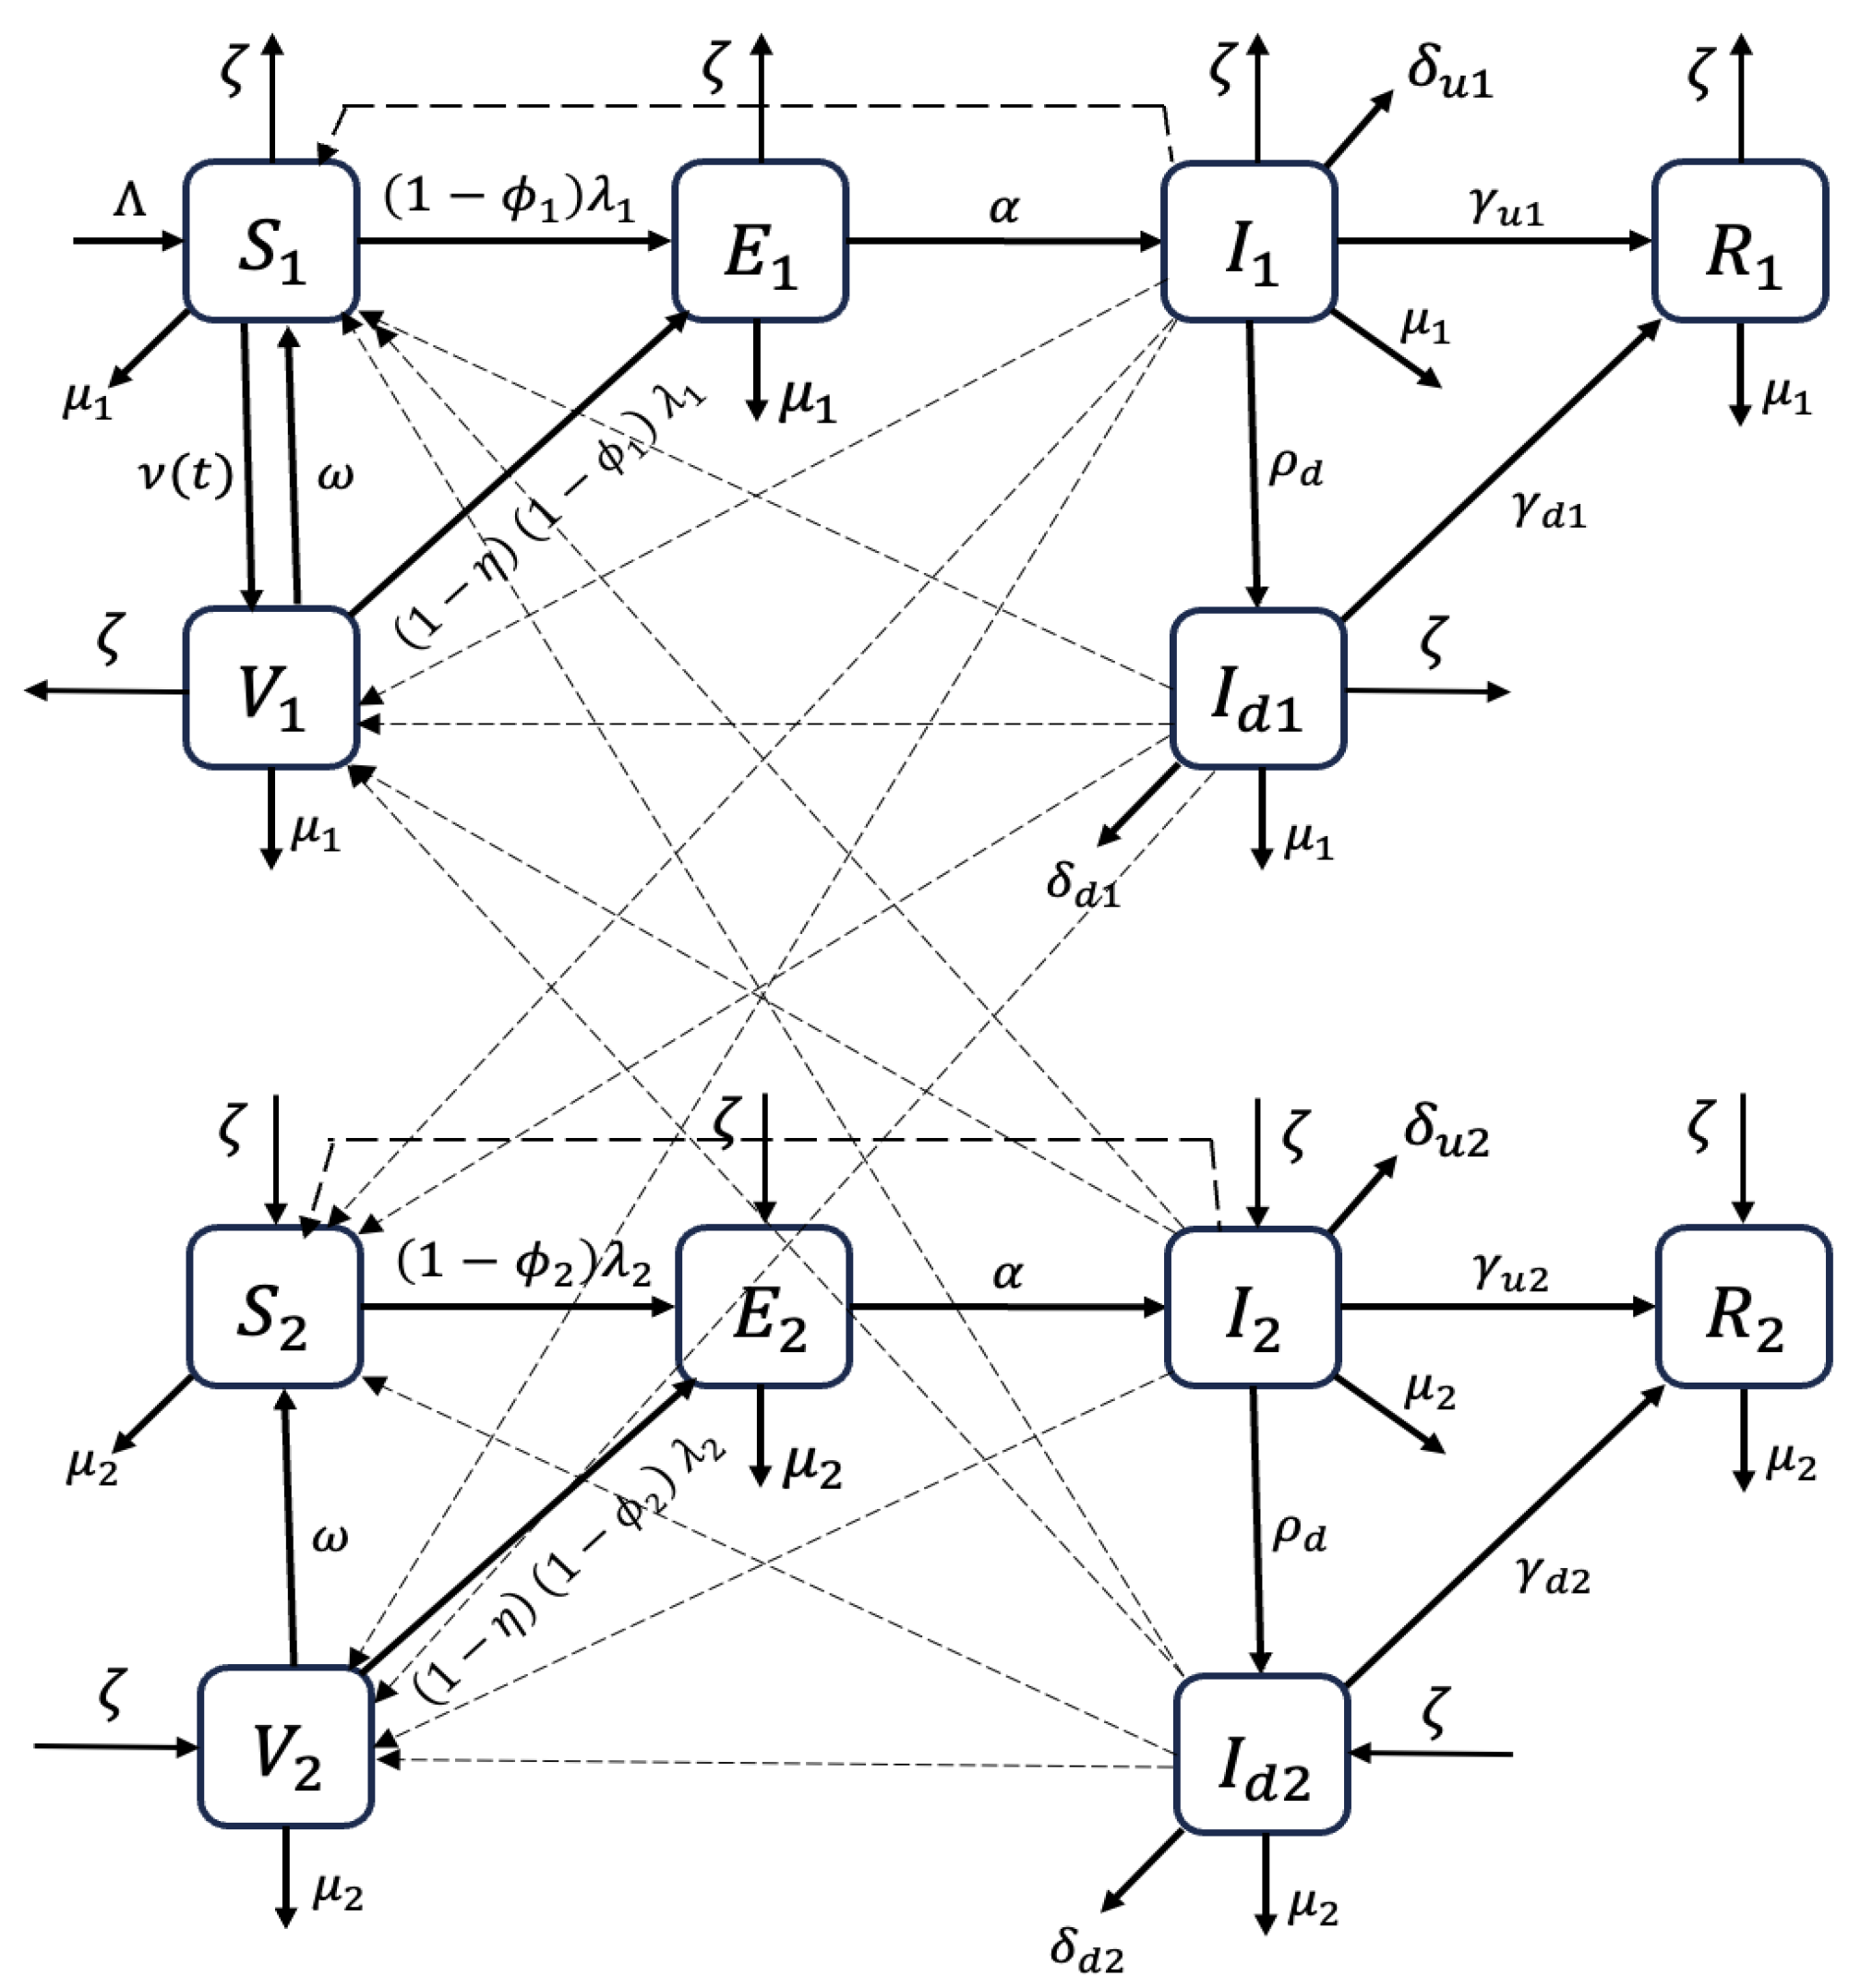
Figure 2.
Model fit and long-term trend of MPOX dynamics without vaccination.
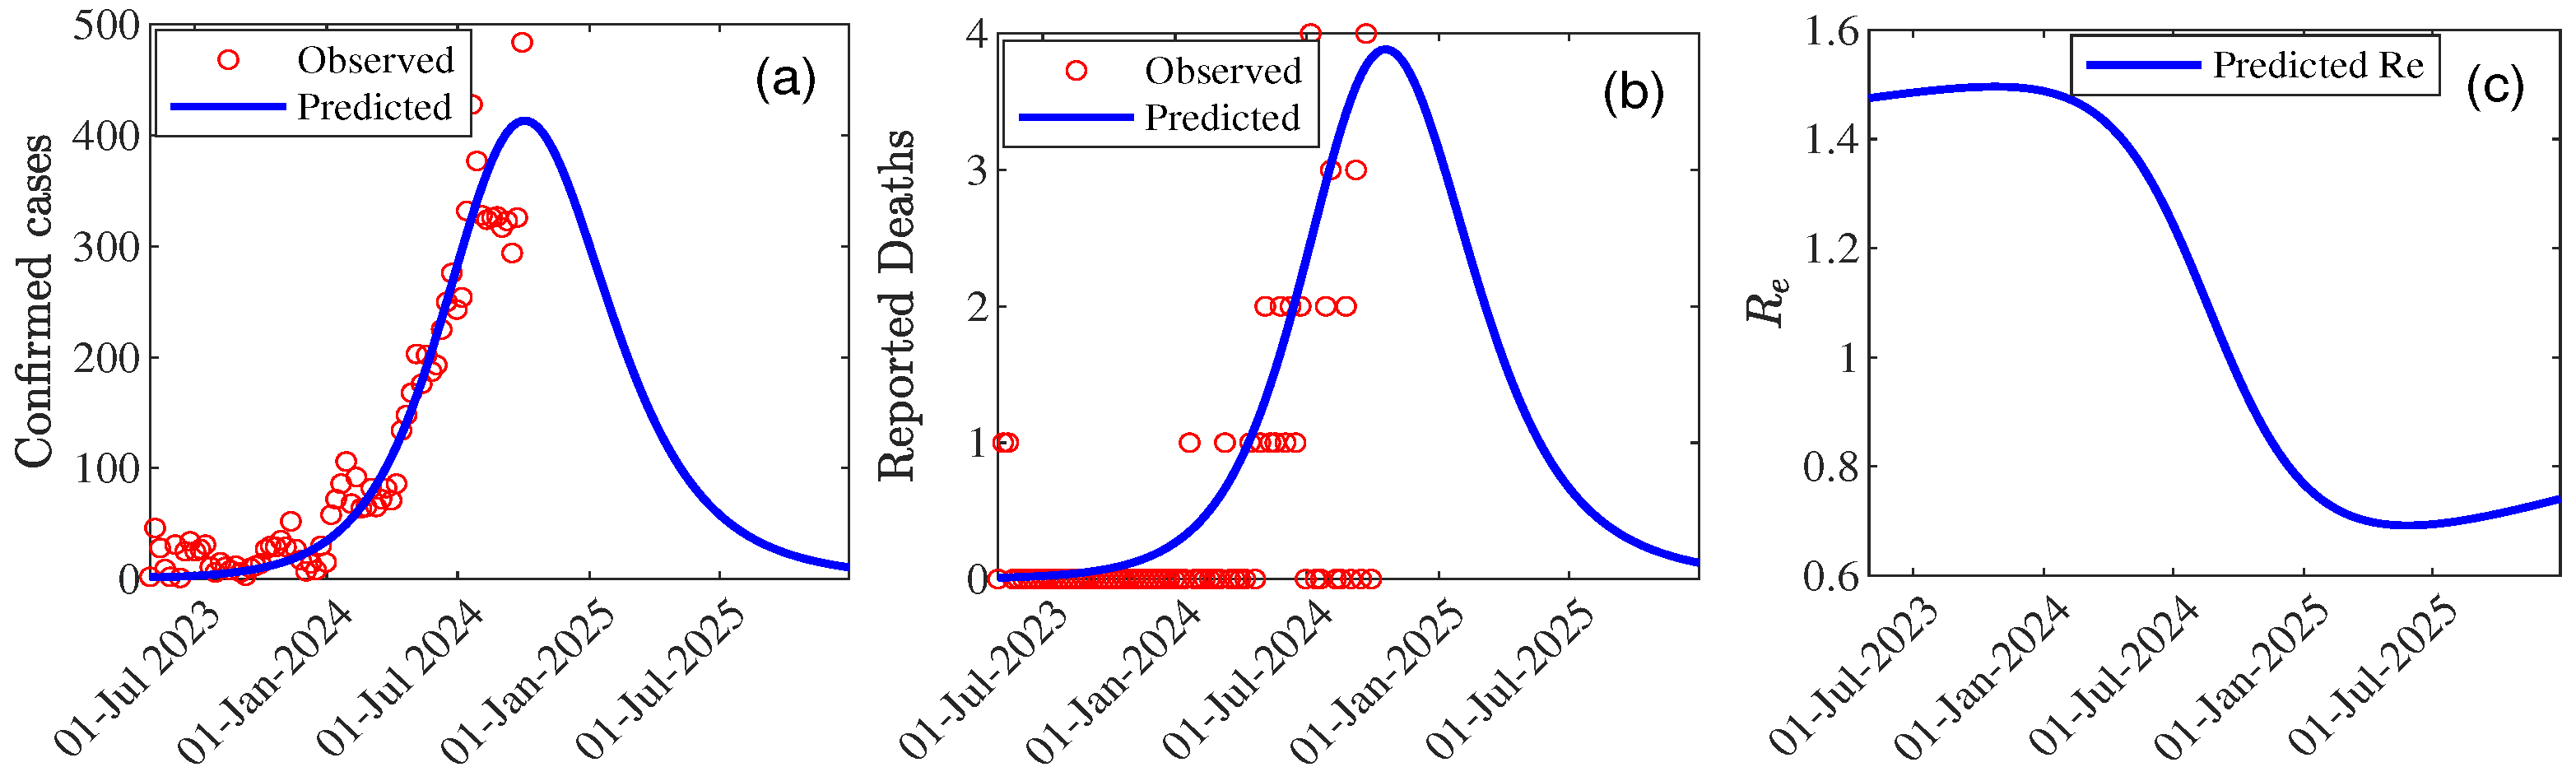
Table 4.
Estimated parameter values and their 95% CI for the model.
| Parameter | Value | 95% CI |
|---|---|---|
| 0.813 | [0.729 , 0.897] | |
| 1.590 | [1.584 , 1.596] | |
| 0.312 | [0.305 , 0.320] | |
| 0.813 | [0.800 , 0.830] | |
| 0.587 | [0.580 , 0.594] | |
| 0.0001 | [0 , 0.0006] | |
| 0.034 | [0.032 , 0.037] | |
| 0.696 | [0.695 , 0.697] | |
| Peak Time | 75 (29/09/2024) | [74.69 , 75.30] |
| Peak Size | 410.62 | [0 , 1085.85] |
| 1.73 | [1.71 , 1.74] | |
| 1.48 | [1.47 , 1.48] | |
| 0.76 | [0.75 , 0.76] | |
| 208.16 | - | |
| 29.06 | - |
Disclaimer/Publisher’s Note: The statements, opinions and data contained in all publications are solely those of the individual author(s) and contributor(s) and not of MDPI and/or the editor(s). MDPI and/or the editor(s) disclaim responsibility for any injury to people or property resulting from any ideas, methods, instructions or products referred to in the content. |
© 2024 by the authors. Licensee MDPI, Basel, Switzerland. This article is an open access article distributed under the terms and conditions of the Creative Commons Attribution (CC BY) license (http://creativecommons.org/licenses/by/4.0/).
Copyright: This open access article is published under a Creative Commons CC BY 4.0 license, which permit the free download, distribution, and reuse, provided that the author and preprint are cited in any reuse.


