Preprint
Article

This version is not peer-reviewed.

Analysis of Ageing in Spain. Contemporary Sociological and Demographic Implications

A peer-reviewed article of this preprint also exists.

Submitted:

12 December 2024

Posted:

16 December 2024

You are already at the latest version

Abstract

Ageing, as a phenomenon of profound social significance, has important repercussions. In this work, focused on Spain, the indicators of ageing and population structure are analyzed. This base for demographic analysis is later useful for preparing a sociological essay on the most pressing challenges facing Spanish society, with regard to population ageing. The methodology used, as is usual in the framework of the Social Sciences, involves a combination of the quantitative and qualitative approach. Specifically, from the eminently quantitative perspective, the important methodological shift of the 2021 Population and Housing Census has been taken into account. It also considers how the Statistics on Migrations and Changes of Residence emerge with the aim of measuring the migratory phenomenon between two consecutive censuses, a phenomenon, also, of great social significance in our country. The work culminates with a brief sociological interpretation of the challenges facing Spanish society, as a consequence of the population dynamics studied.

Keywords: 
;  ;  ;  ;  
Subject: 
Social Sciences  -   Demography

1. Introduction

Population ageing is a demographic phenomenon of deep social significance, which in Spain is occurring a decade later than in the rest of Europe (Pérez Fructuoso, 2017). The reality of population ageing has major socio-economic implications, since, for example, pension expenditure will be higher, as has already been attested by doctrine (Ayuso and Holzmann, 2014) and (López Carrascosa, 2003). There are authors who have incorporated the analytical category of “pension demography” into doctrine. (González Martínez, 2013, 2019).
The socioeconomic precariousness of certain vulnerable social groups (Iglesias de Ussel, 1993: 346-350), the Leasing Law for the elderly, the search for fruitful intergenerational equity, unwanted loneliness, pharmaceutical expenditure, the achievement of healthy longevity (Nicolau, 2005: 77-154), (OECD, 2019), leisure linked to an active lifestyle (Saz Peiró and Martínez Moure, 2023), the measurement of per capita health expenditure or lifelong training acquire great relevance in this framework. In the case of Spain, it is necessary to add the existing fracture between the rural and urban worlds, as a consequence of demographic aging and depopulation. (Ramiro Fariñas, 2022), REDS (2021) y (C.S.I.C, 2022).
As a consequence of the described reality, in the long term the generation of a fourth age in terms of cohort is evident (Guerra, 2019: 10 and 11), as already happened with the third age (Gilleard and Higgs, 2007: 14-15), which emerged from Laslett's research (Guerra, 2019: 10 and 11), among other authors. According to Moreno (2010: 4) the population included in this cohort has characteristics such as "biochemical alterations in the tissues, changes at the sensory level, at the functional level (mobility), physical deficit (...) psychological disorders and in the emotional or affective sphere (...)", with which dependency (Goldin-Meadow, 2015) will be a problem that will mark this age group (Guerra, 2019: 10 and 11), which will have an impact not only on life trajectories but also on the composition of households. (Sánchez Vera, 1996).
The challenge of dependency is, in fact, one of the factors to be considered as a priority within the framework of the European Welfare States, above all, from the perspective of the efficient management of public policies (Robertson et al., 2014), the financing of care (Rodríguez Madroño and López-Matus, 2018) and, specifically, what concerns informal care. (Pérez Ortiz, 1995: 525).
The article presented is a continuation of the work carried out by Pérez Fructuoso (2017), which described the demographic factors that had a higher level of impact on the aging situation of the Spanish population. Using data from the INE (2016, 2021, 2022, 2023, 2024), quantitative evidence has been generated on the evolution of these data, bringing them to the present and trying to project them into the future, to explain the possible sociological consequences. According to the data from the demographic projections (Bretos, 2024) and following Esteve (2024), the Spanish population within half a century will respond to a larger, more socially diverse society and, due to the migratory phenomenon, with different cultural backgrounds.
To address the applied part, demographic indicators were selected, based on the models of the Ministry of Territorial Policy (2024) and Pérez Fructuoso (2017). To understand aging, the age structure, fertility and migrations must be studied (Economic and Social Council of Spain, 2019) and future projections must be established (Conde and González, 2019).

Definitions of Demographic Determinants of Aging

For the conceptual delimitation we based ourselves on the work of Pérez Fructuoso (2017).
The birth rate refers to the births that occur in a specific population and is calculated using the formula of the Crude Birth Rate:
T B N t = N t P t · 1000
In which:
Nt = Births registered during year t to mothers belonging to the study área.
Pt = Average resident population in the study area, in the year t
Mortality is defined as the number of deaths that occurred in a specific territorial area in the time period taken into consideration and is calculated using the TBM formula, such that:
T B M t = D t P t · 1000
In which:
Dt are the deaths recorded during the year under study, t.
The probability of death is obtained as follows:
q x = 1 2 · D x z + D x z + 1 P x z + 1 2 · D x z
In which:
Dxz represents the deaths that occurred in year z at age x.
Dxz+1 represents the deaths that occurred in year z+1 at age x.
Pxz It is the population as of December 31 of the year under study with age x.
The probability of survival is configured as the complementary probability to that of death, represented in such a way that, (px=1-qx).
Another statistical measure that provides relevant information on the mortality rate is the so-called life expectancy at birth - also known as the average number of years that the inhabitants of the population will foreseeably live (INE, 2023a), according to the observed mortality pattern. Life expectancy is configured as one of the Sustainable Development Indicators developed by EUROSTAT within the framework of Objective 3: “Good health and well-being and the Eurostat Gender Equality Indicators” (INE, 2023b). In Spain, the difference in life expectancy at birth in favor of women grew, or remained in a more or less stable trend, until the mid-1990s, mainly due to higher male mortality. (I.N.E., 2023a).
In general terms, an essential factor in Spanish demographics in recent decades has been the increase in life expectancy in the population, both in middle age and in older age groups. The sustained and gradual reduction in mortality rates has increased the number of population members (INE, 2023b), as a result of, among other factors, improvements in health, active leisure and the democratization of healthy habits for the bulk of the population..
Fertility is the frequency of births that occur in a specific population and takes into account women of childbearing age. It is calculated using the “fertility rate”, also known as the current fertility indicator, and determines or studies the average number of children a woman would have throughout her fertile life (Pérez Fructuoso, 2017). There is consensus in demographic doctrine when it comes to pointing out that the female fertile life spans from 15 to 49 years of age, with the reduction in birth rates being a phenomenon that runs parallel to the delay in the age of motherhood. In light of the data, since 2016 there has been a 137% increase in the number of births to women who are 50 years old or over fifty. At the same time, births to mothers between the ages of 45 and 49 have increased by almost 51%. According to Olcese (2023), births to mothers over 45 have experienced a 55% increase since 2016.
As regards migration - an essential factor in demographic relief - the main indicator for its analysis is the migration balance, calculated as the total net migration over t per 1000 inhabitants, according to the formula presented:
T M N t = I t E T P t · 1000
Res being:
It = Immigration from abroad, recorded during the year under consideration (t)
Et = Emigration abroad, recorded during the year taken into consideration (t)
Pt = Average resident population in the study area in the year taken into consideration (t)
Following Ayuso and Holzmann (2014), if a population maintains constant mortality and migration is equal to zero, its demographic times will depend on its fertility rate (which is directly related to the level of reproduction it presents). For a description of the scenarios generated by the fertility rate, the reader is referred to the work of Pérez Fructuoso (2017).
The publication of the Population and Housing Census for the year 2021 (I.N.E., 2021) produces an important methodological shift. The Migration and Change of Residence Statistics (EMCR) (I.N.E. 2024) appears with the objective of measuring and accounting for the migratory phenomenon between two consecutive censuses. Until its creation, there were two statistics that computed the variations in this phenomenon, namely, the Migration Statistics (EM) (I.N.E. 2024) and the Residential Variations Statistics (EVR) (I.N.E. 2022) obtained by the exploitation and statistical analysis of the registrations and de-registrations recorded in the INE census database.
The new EMCR has a much more subtle level of territorial detail than the previous ones and sheds light on changes of residence that have occurred between neighborhoods in the same municipality. This information is highly relevant, not only statistically and demographically, but also sociologically, since sometimes very close neighborhoods, or even adjacent ones, show very different demographic profiles, an issue that needs to be further investigated. It also adds variables of an educational nature or access to the labor market, which are essential for the design of public policies.
To calculate and design the data series belonging to this Statistic, the following are used as fundamental sources of information (INE, 2024), the Population and Housing Census (as of January 1, 2021), the Population Census (from 2022, for January 1 of each year) and administrative data (the Continuous Register). Finally, it should be mentioned that this statistic is published from December 2023 on an annual basis and with the reference period of the figures being the immediately preceding calendar year.
In preparing this work, the Proposal for a Regulation of the European Parliament and of the Council on European population and housing statistics, amending Regulation (EC) No 862/2007 and repealing Regulations (EC) No 763/2008 and (EU) No 1260/2013 (European Commission, 2023) has also been consulted. The regulatory changes are the response to the EU's need to obtain complete, frequent and standardized statistics on the migration phenomenon.

2. Methodology and Methods

As is usual in the field of Social Sciences, a combination of quantitative and qualitative methodologies turned out to be the most appropriate path. Not in vain, the analysis of population dynamics is configured as one of the most defining elements of demographic analysis and is, perhaps, the most complete element, not only because of the difficulty in the methodological aspect -the rates and indexes are directly related to both the stock variables and the flow variables- but also in the eminently theoretical aspect, of terminological definition. We agree with Vallin (1995: 37) when he points out that to the arithmetic of demography itself it is necessary to add the various elements of social change, such as legislative, economic, cultural, values, biological, etc.
The main gross rates included in this study are the Gross Birth Rate (GBR), the Gross Mortality Rate (GMR) and the Vegetative Growth Rate. This last rate, as Reques Velasco (2014: 3-6) points out, does not correspond to the so-called real growth rate, which is why migrations have also been added to the analysis.
Also derived from the aforementioned difficulty, in demographic analyses it is essential to establish distinctions between gross and specific rates, which led us to the analysis of the synthetic fertility index (which gives us the replacement index) and life expectancy at birth. These types of measures were included because they made the analysis more subtle.
The methodological shift of the 2021 Population and Housing Census (I.N.E., 2021) has been taken into account. It also considers how the Migration and Change of Residence Statistics (MCRS) (I.N.E. 2024) emerges with the aim of measuring the migration phenomenon between two consecutive censuses.

3. Results

The GBR in 2022 was 6.878653 births per 1000 inhabitants. Analyzing the time cohort between 1975 and 2022, this rate shows a significant downward trend, although with a certain rebound during the period 1999-2008, showing levels much lower than those shown at the beginning of the series. It should be noted, in line with the doctrine, the existence of a birth crisis at the end of the 1970s., marking a milestone in 1979, when the GBR began to decline, a demographic situation that would last until the end of the 1990s. From 2008 onwards, the GBR began to decline again until reaching its lowest level in 2022. Measured in absolute terms, since 2008, when, with a GBR of 11.2759% and 519,779 births, a historical maximum in 3 decades was reached, the number of births has decreased by 36.66%. In 2022, there were a total of 329,250 births, which is the lowest value recorded in the entire data series analyzed in the study (INE, 2022)
If the GBR is low for the average population resident in a territory, it is because the number of births is lower.
Figure 1. Spanish GBR (1975-2022).
Preprints 142691 g001
The annual relative variation of the GBR shows a completely oscillating behavior, with a parabolic trend line, the average annual variation of the 46 years analyzed (1976-2022) being 2.106%, as observed in Graph 2.
Figure 2. Annual relative variation of the Spanish GBR (1975-2022).
Preprints 142691 g002
As regards mortality, as can be seen in Chart 3 below, it has remained fairly stable over the period analyzed.
In 2022, the GMR rose to 9.66712 deaths per 1,000 inhabitants, a figure slightly higher than that presented in 2021 (9.466965 deaths per 1,000 inhabitants), but, in any case, at a level well below that of 2020, where the highest value of the entire series was recorded, reaching 10.401279 deaths per 1,000 inhabitants.
Analyzing the period 1975-2022, the GMR in Spain shows a fairly flat or little fluctuating evolution.
The annual relative variation in the GMR shows a completely flat trend line, with the average annual variation for the 1976-2022 period being 0.400814%. This variation, which, as can be seen, is practically zero, in the GMR together with the decrease in the GMR explains the progressive ageing of the population in Spain caused, fundamentally - although not only - by lower birth rates.
The joint study of the evolution of the two measures now studied, the GBR and the GMR, shows a drastic fall in the birth rate from 1975, when, according to the doctrine, it began to fall substantially until reaching, in 1999, the same level as the GMR indicator, which remained somewhat stable throughout the entire period. Subsequently, between 2000 and 2008, the GBR showed growth in relation to the GMR, to fall again from that moment until 2015, when the GBR was below the GMR. This means that, for the first time in the years of the analysis and since annual data became methodologically available, the difference between births and deaths is negative.
During 2022, there were 329,251 births, compared to 464,417 deaths, which means that 135,166 more people died than were born. Vegetative Growth, which indicates the increase or decrease of a population as the difference between live births to mothers residing in Spain and deaths of residents in the same country, also had a negative character in 2022 and rose, specifically, to 133,250 population members.
Figure 5. Spanish GBR and GMR evolution (1975-2022).
Preprints 142691 g005

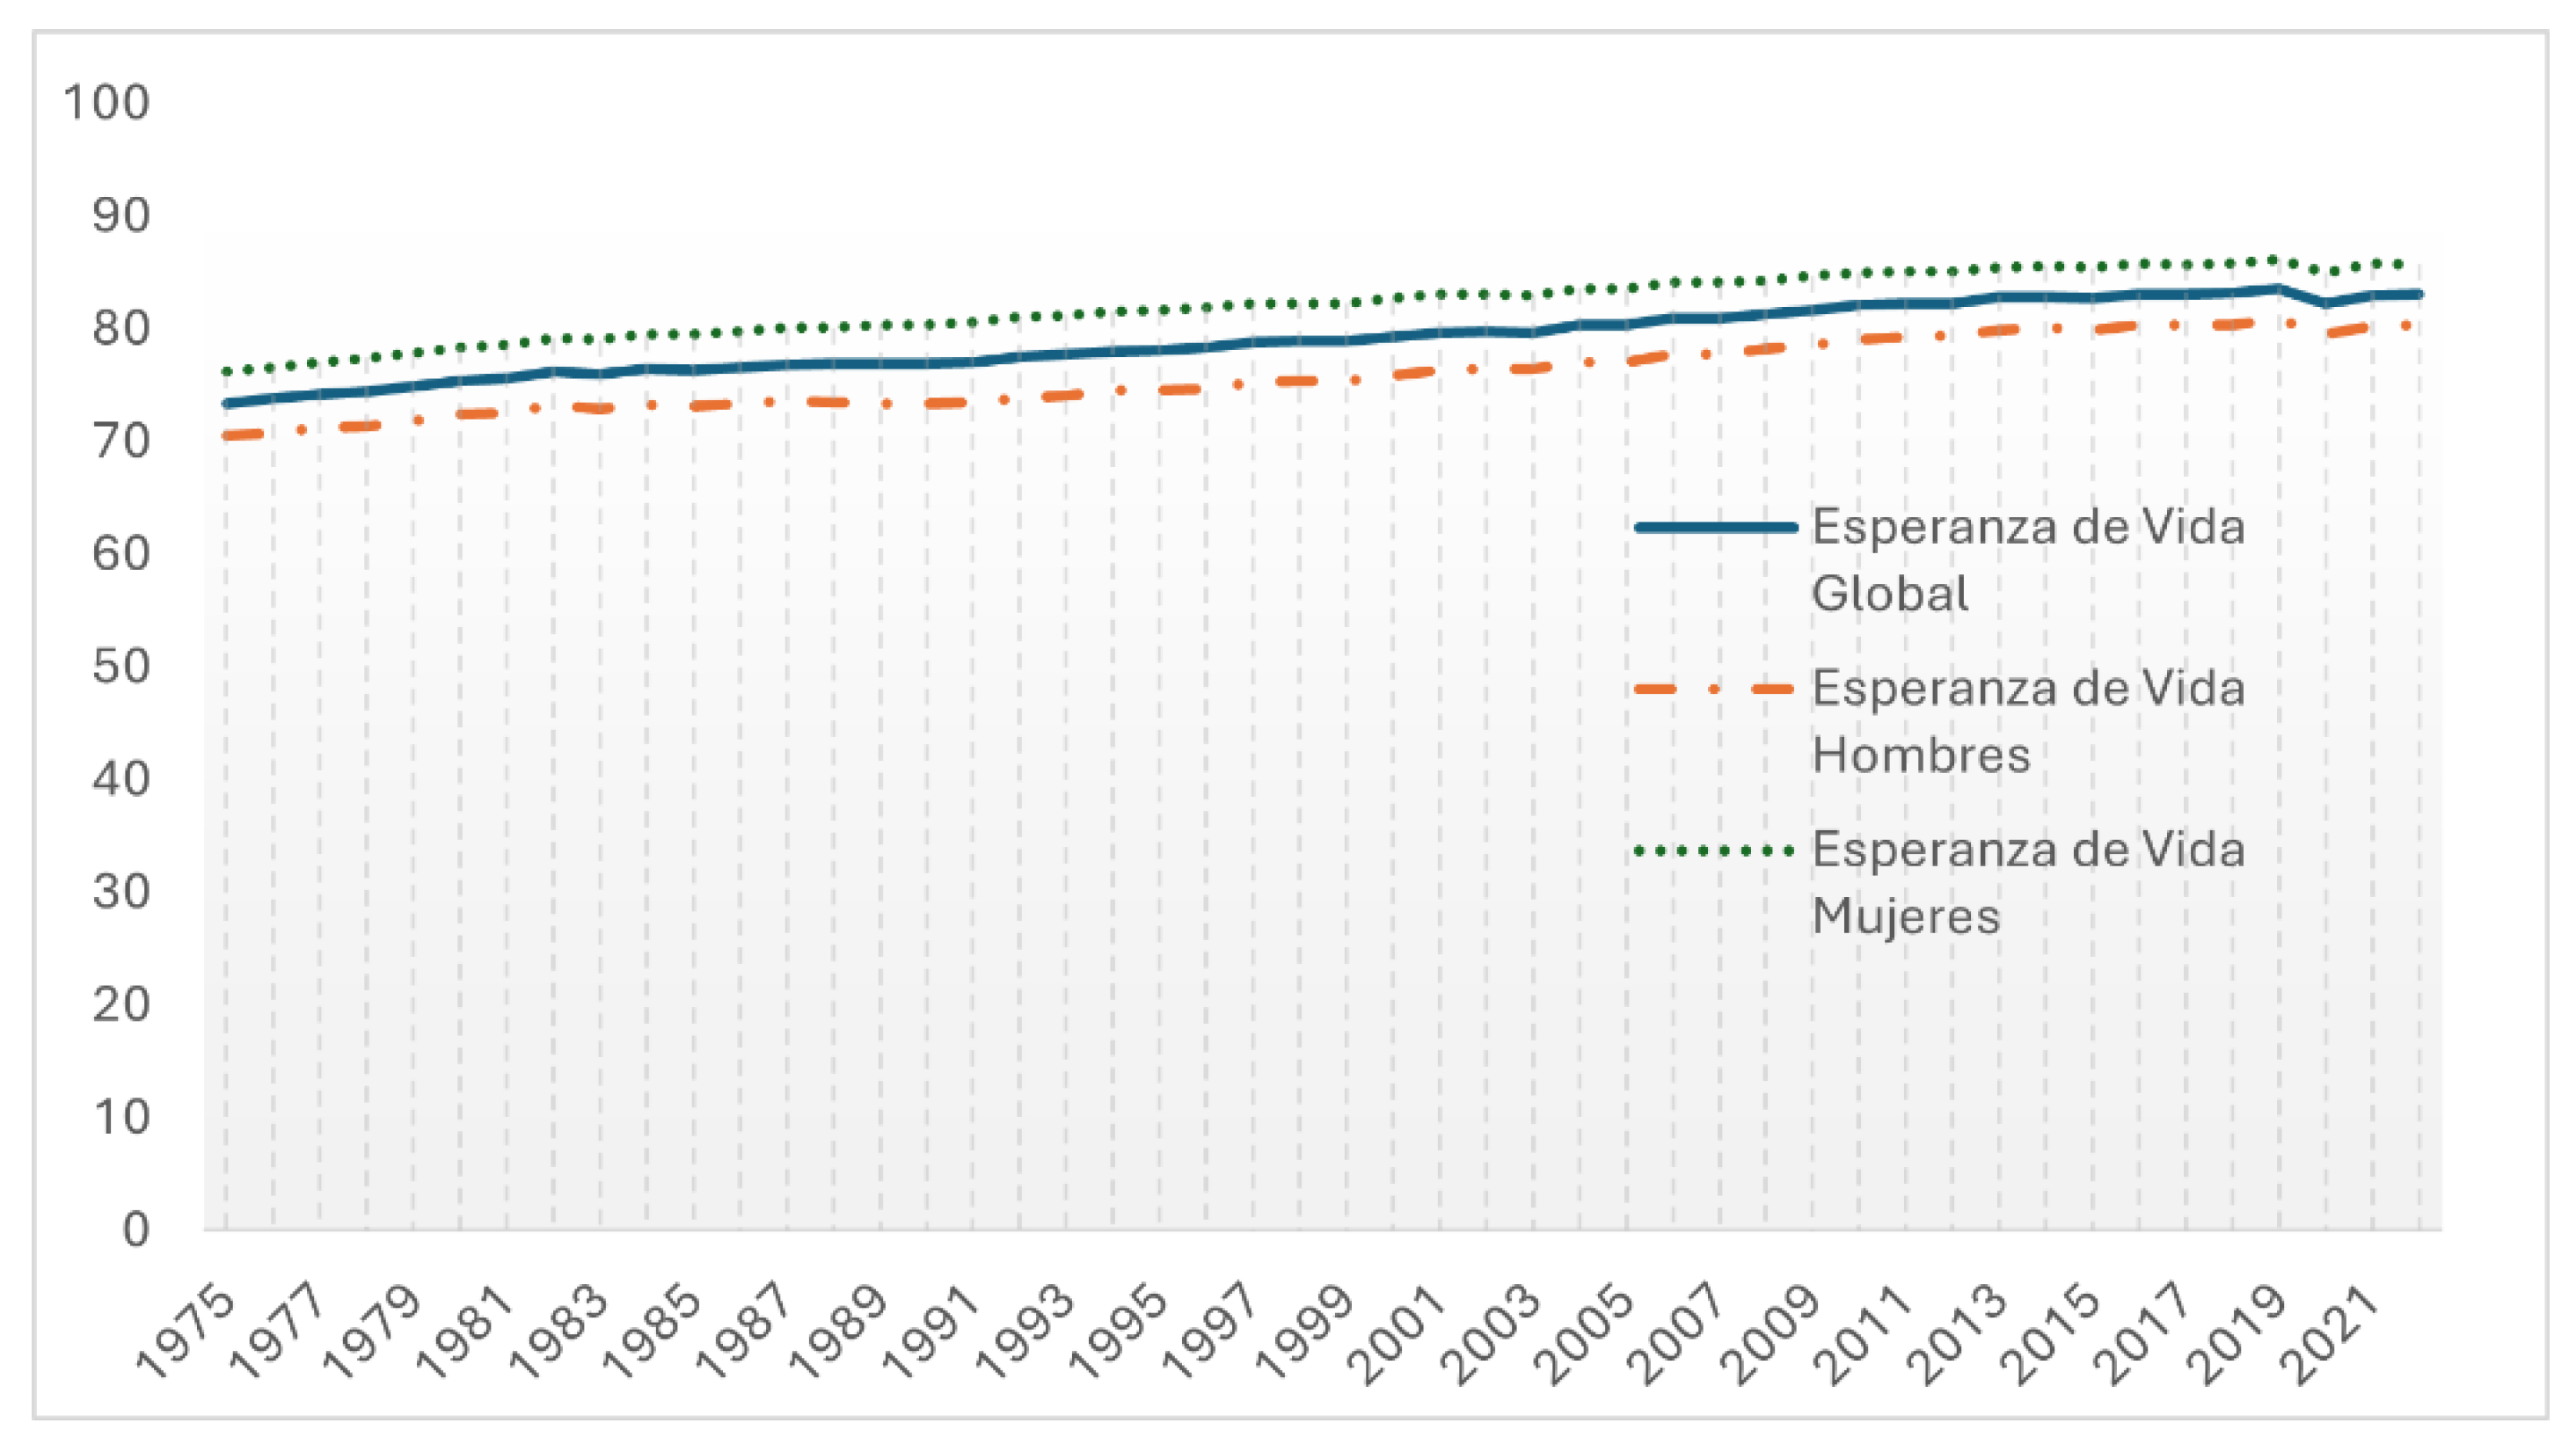
Life Expectancy at Birth

Life expectancy at birth is another indicator of mortality (I.N.E., 2023) and (Pérez Fructuoso, 2017: 179).
This measure has been growing since 1975. According to the most recent publications and studies by the INE, between 2002 and 2022, life expectancy at birth in Spain has increased from 76.4 to 80.4 for men and from 83.1 to 85.7 for women (I.N.E., 2023c).
Figure 6. Life expectancy at birth in Spain (1975-2022).
Preprints 142691 g006

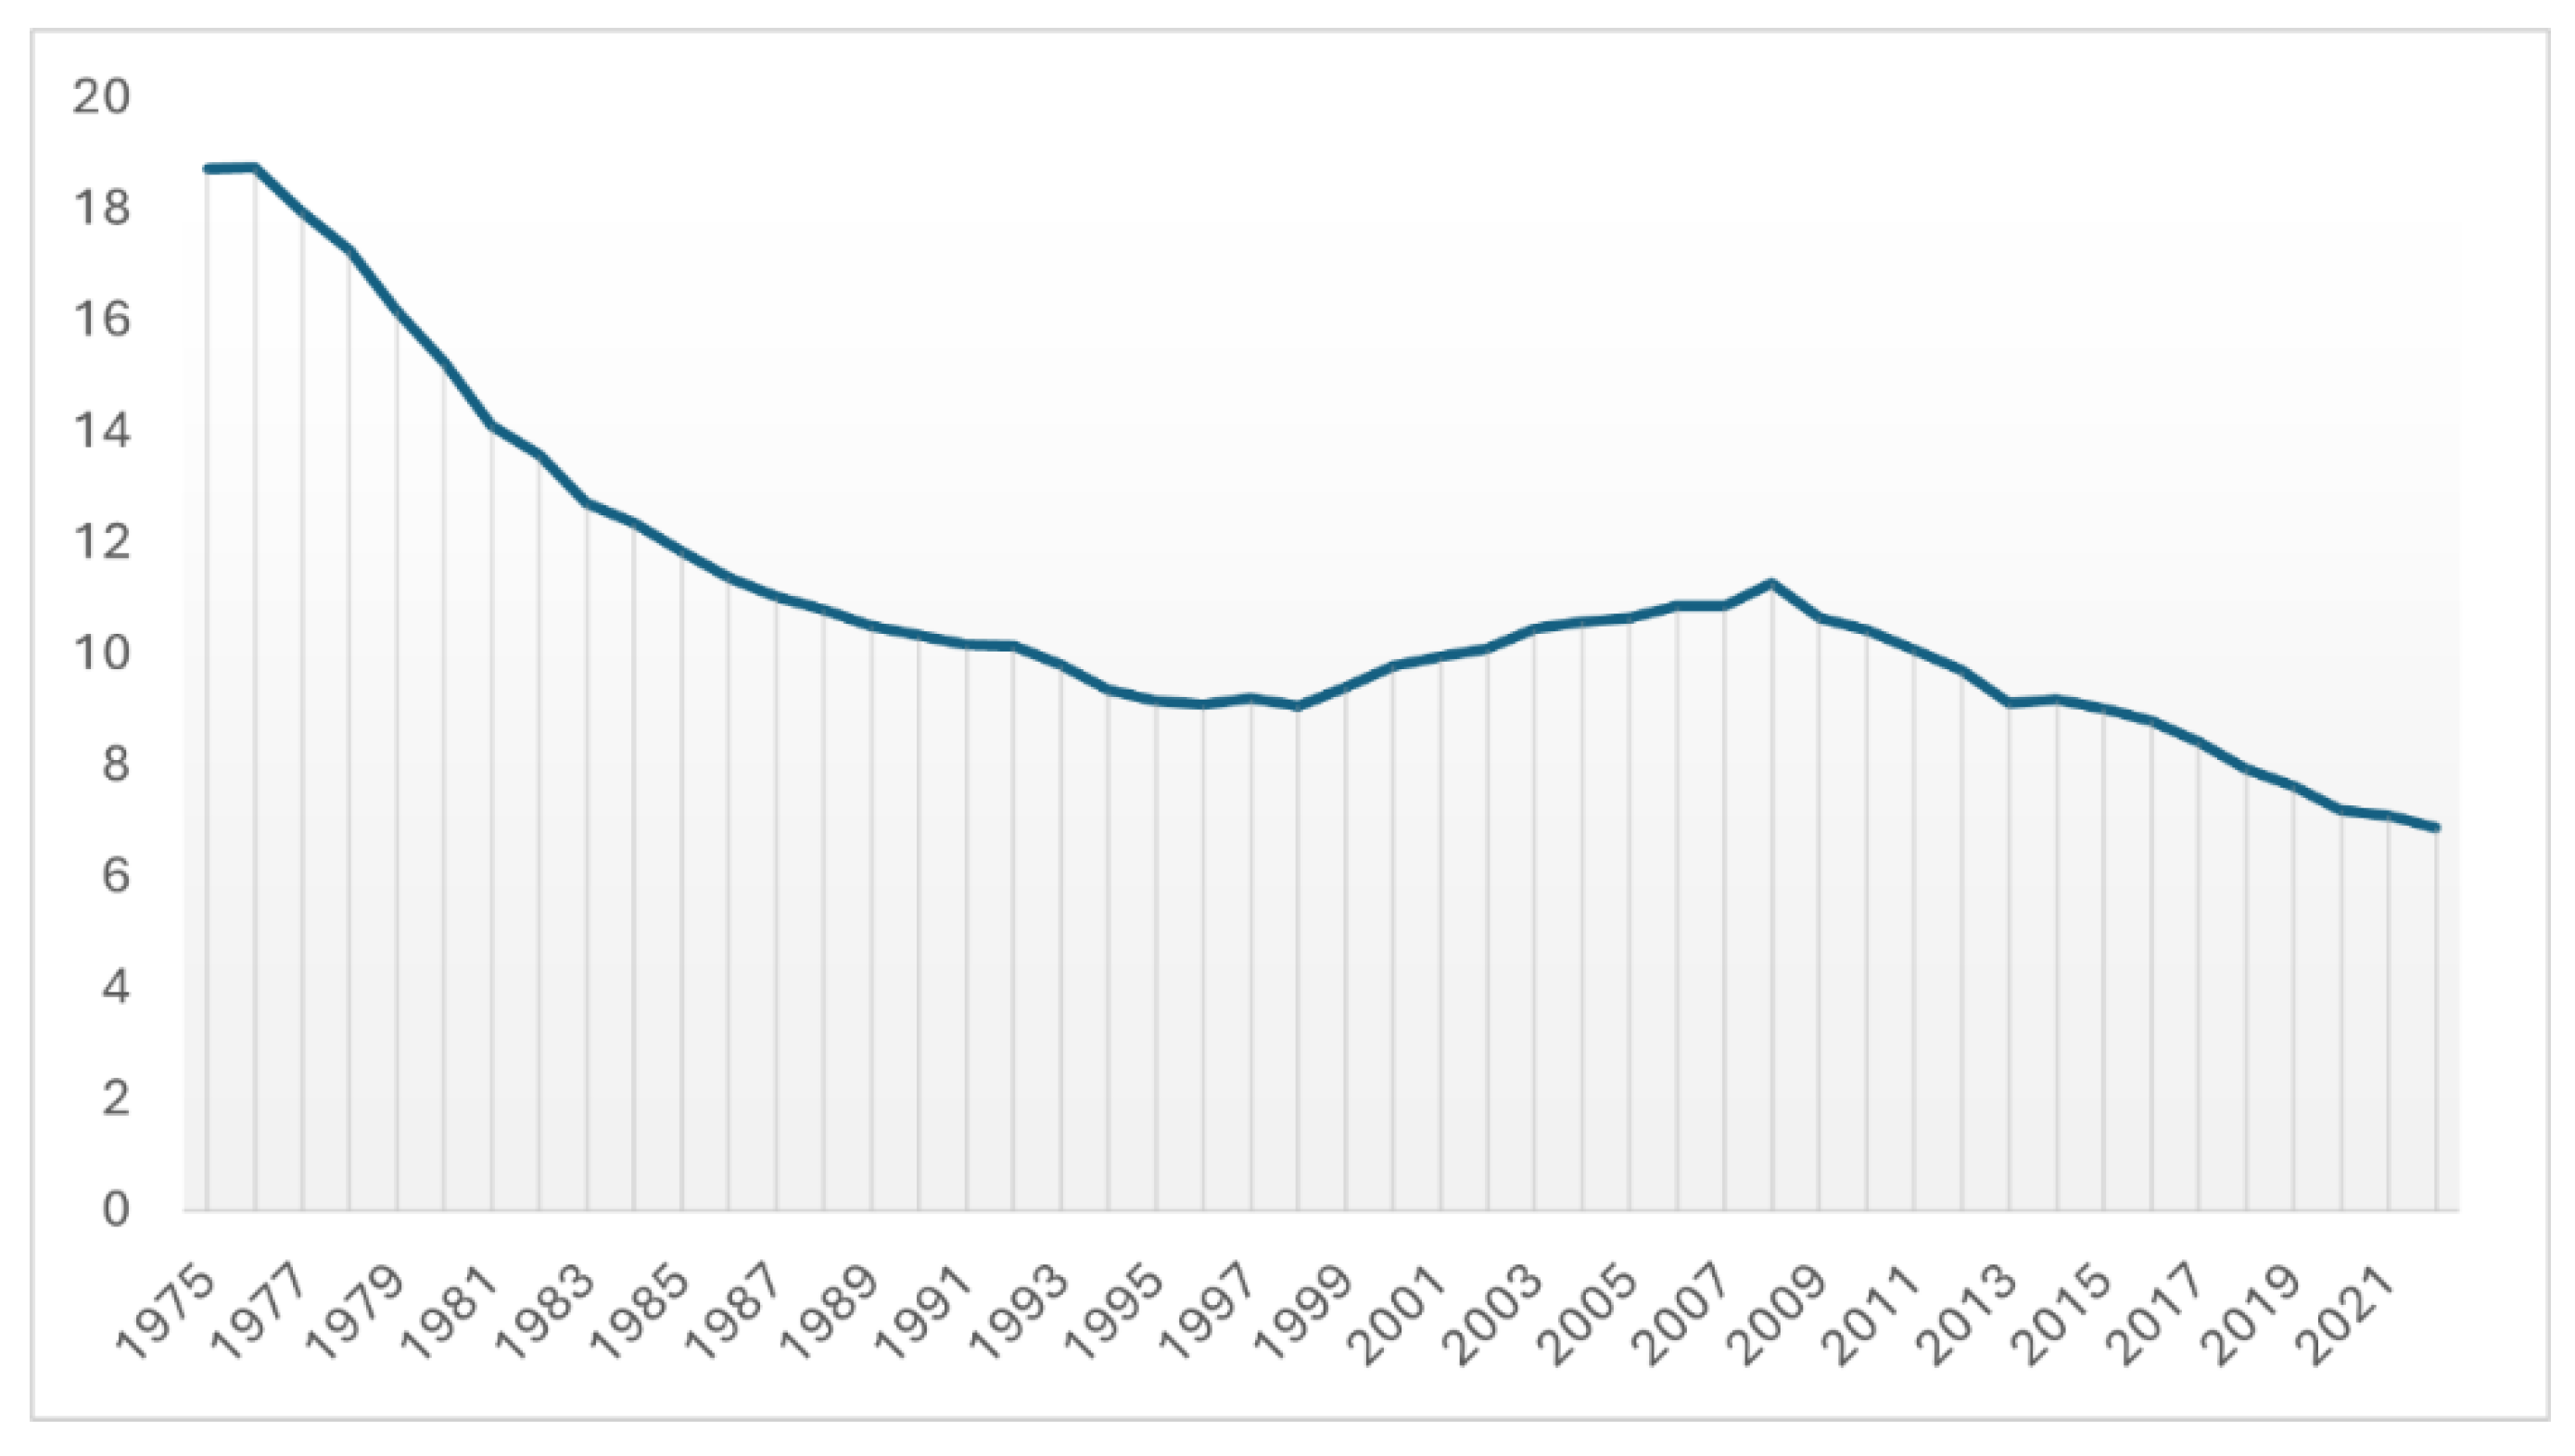
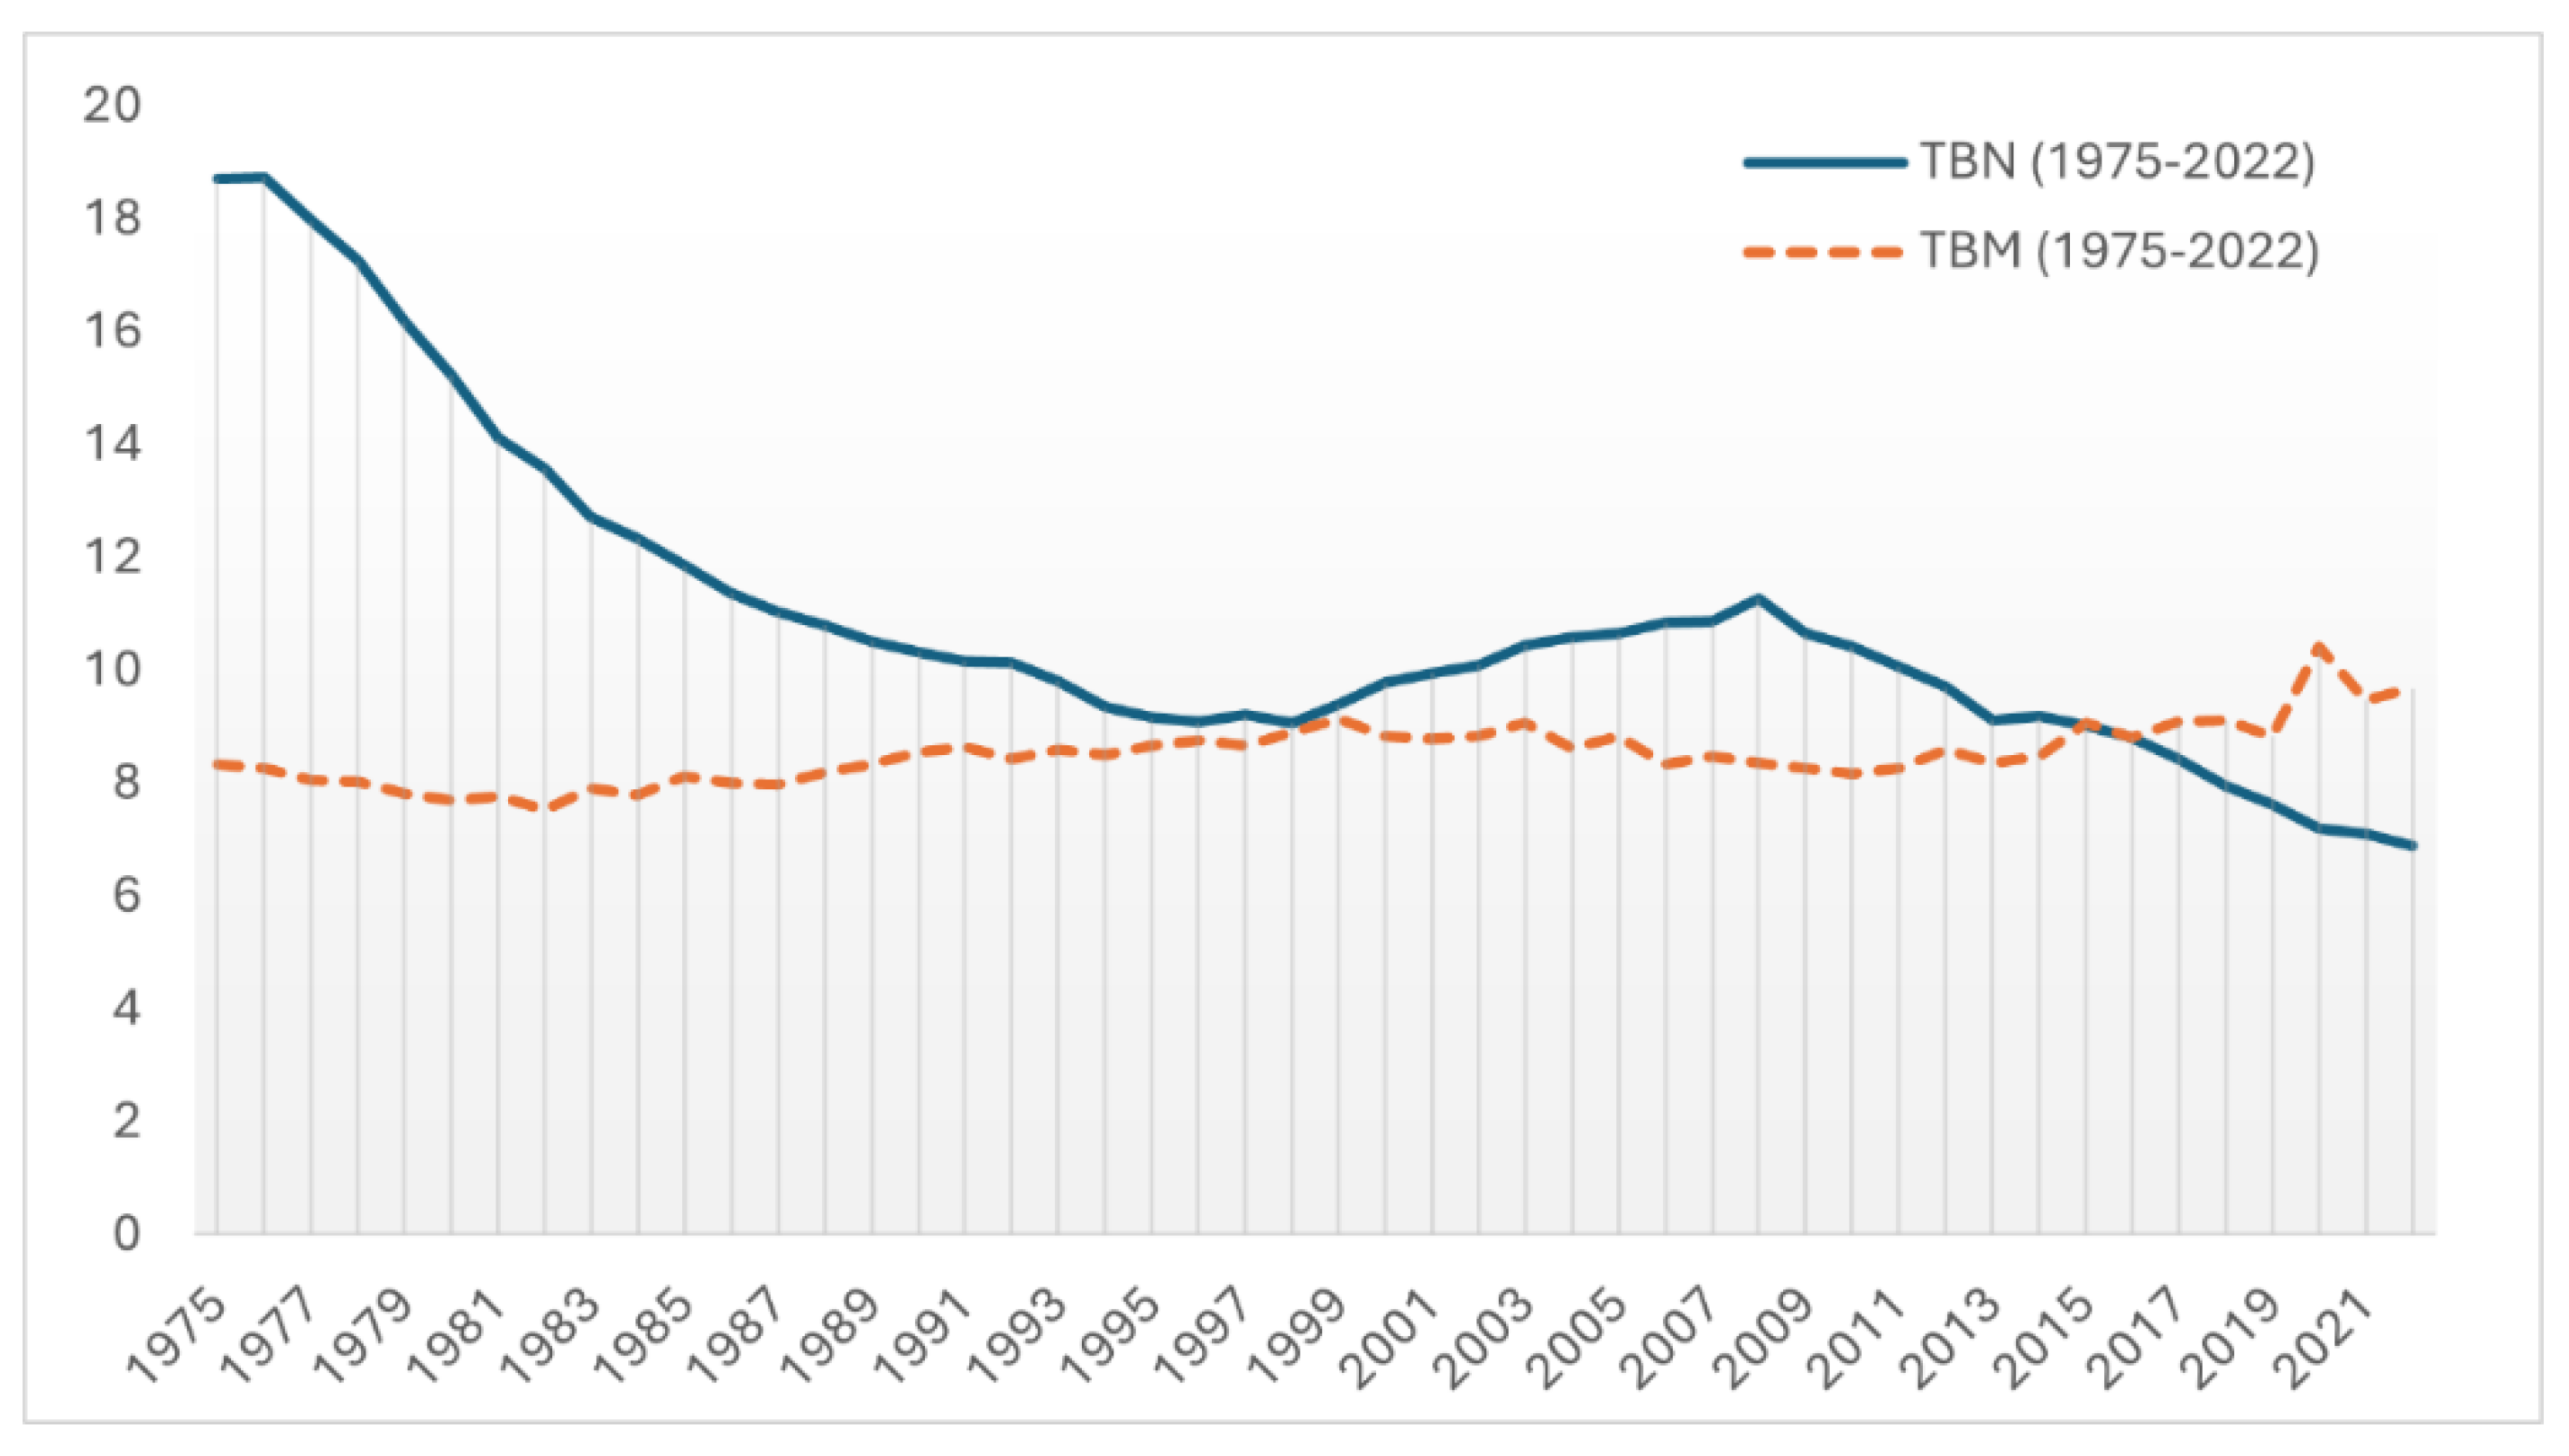
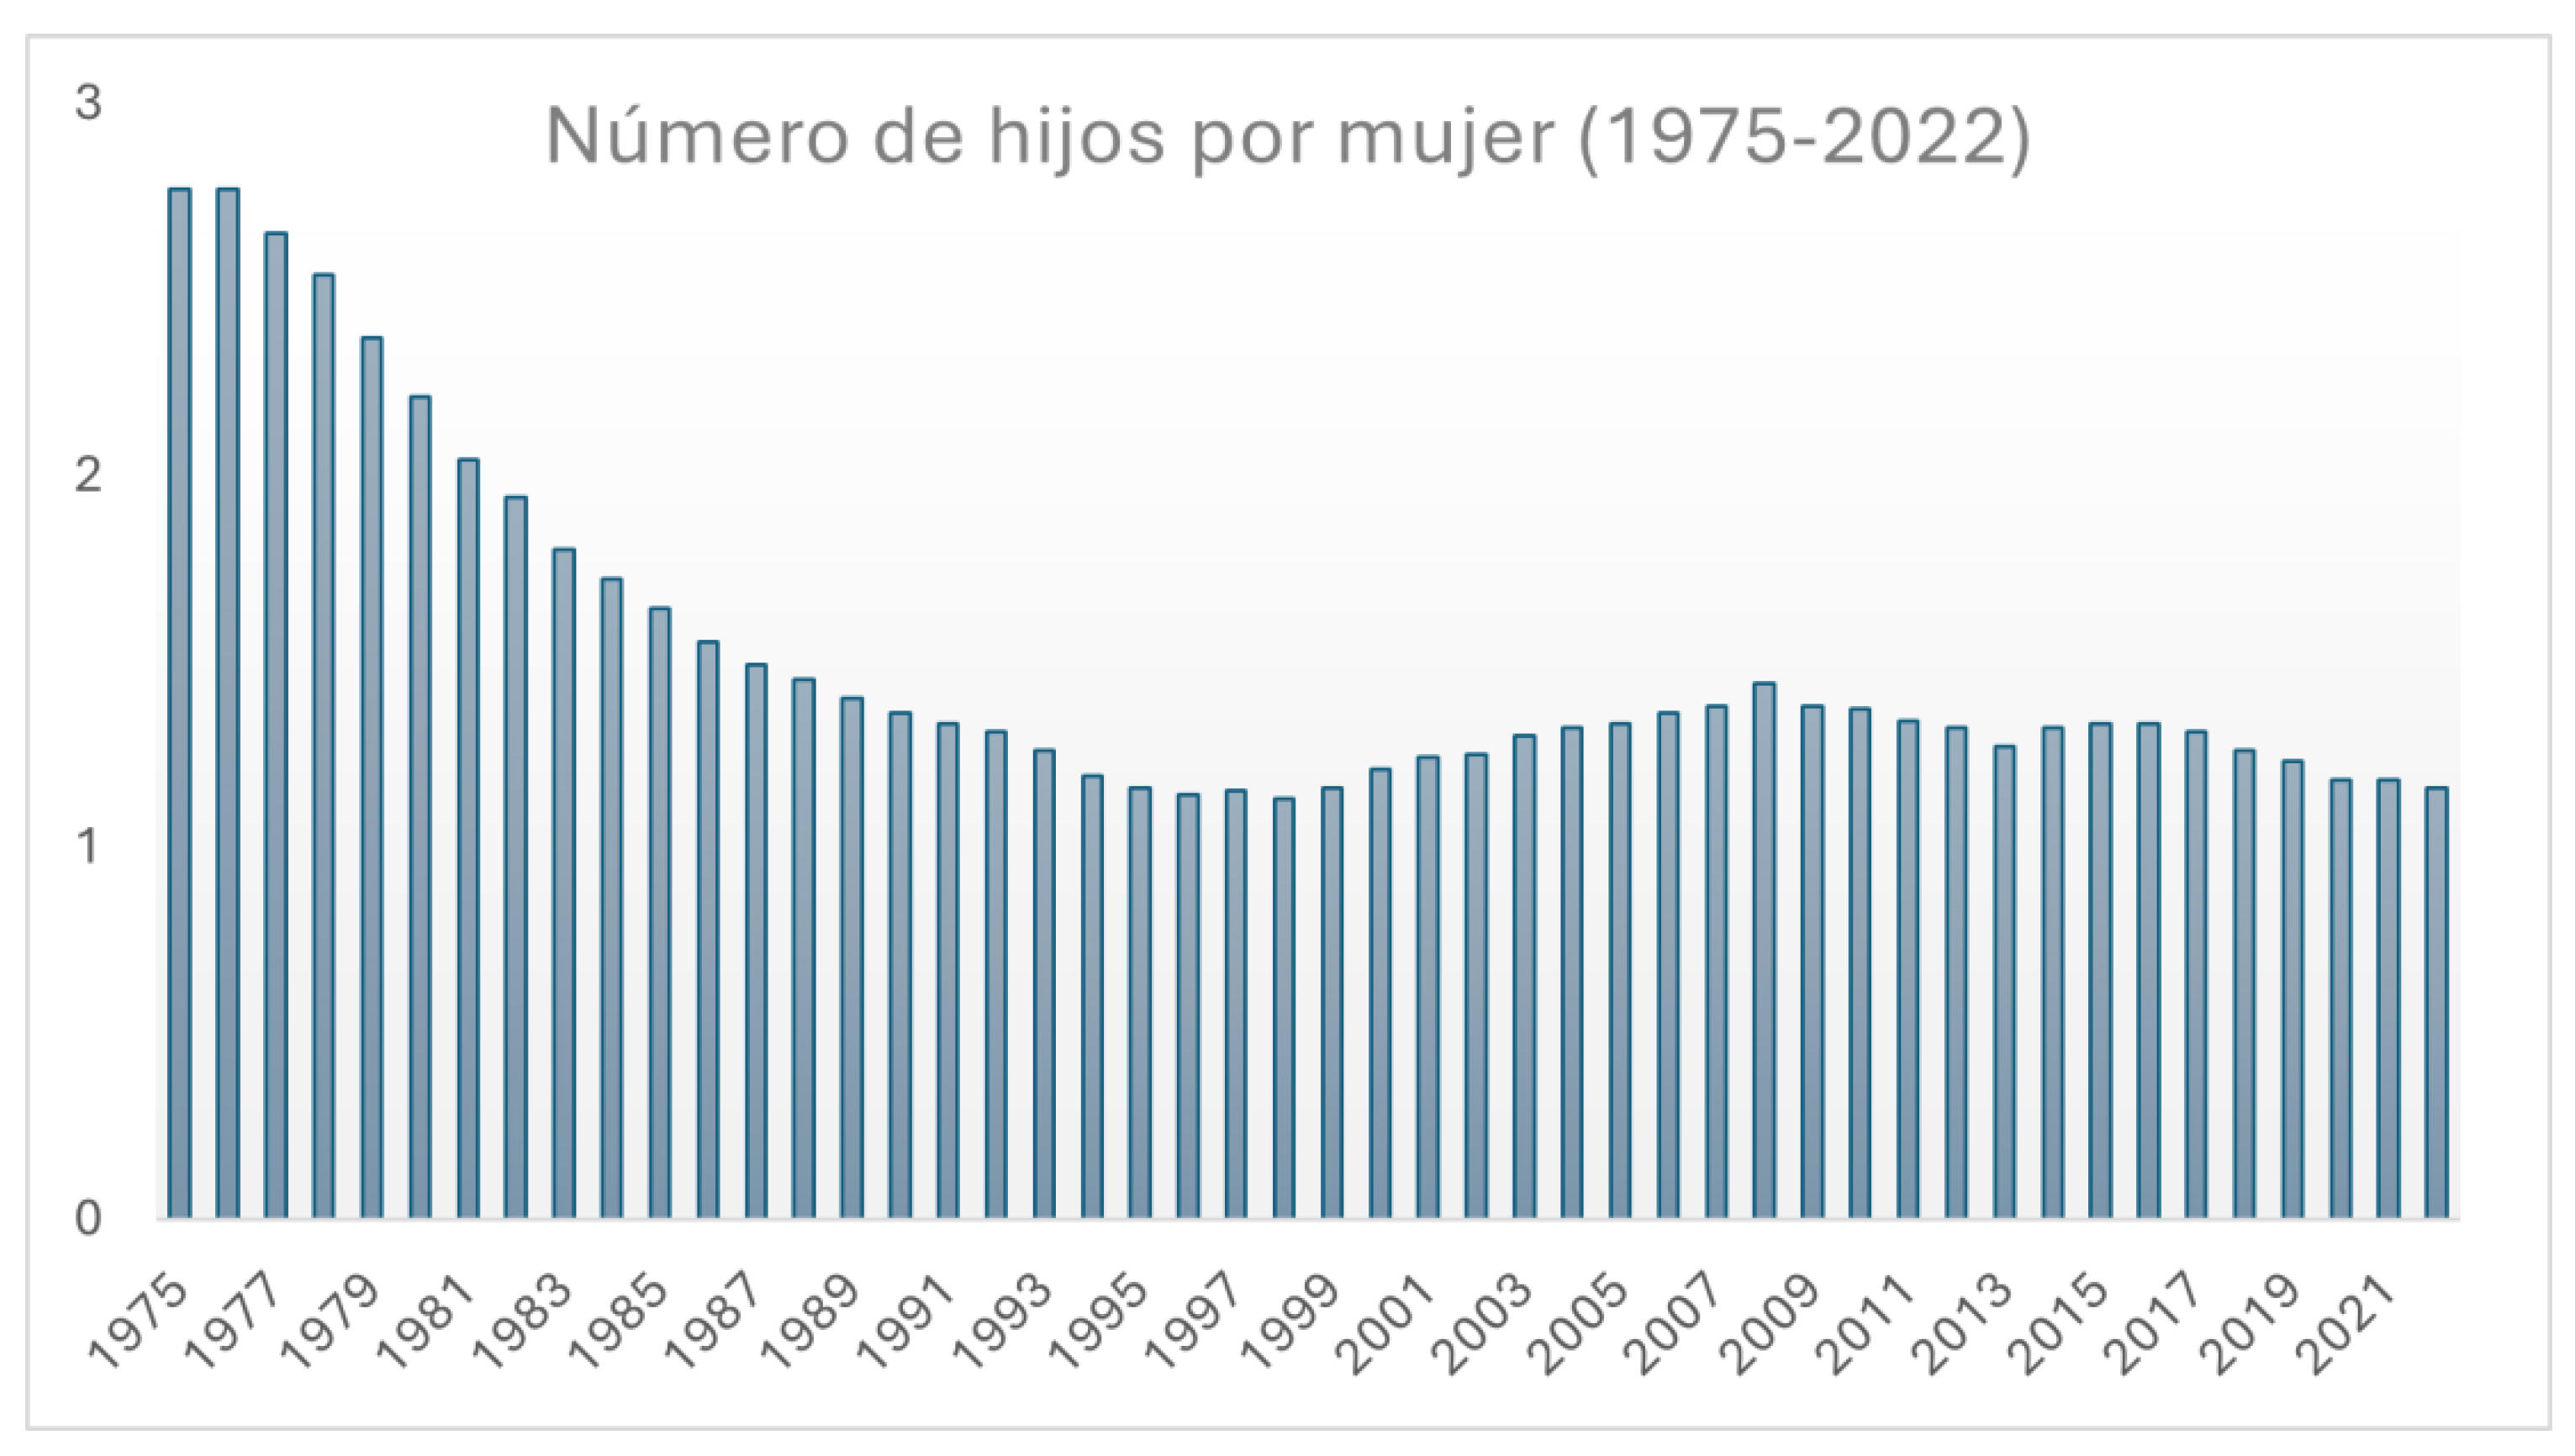
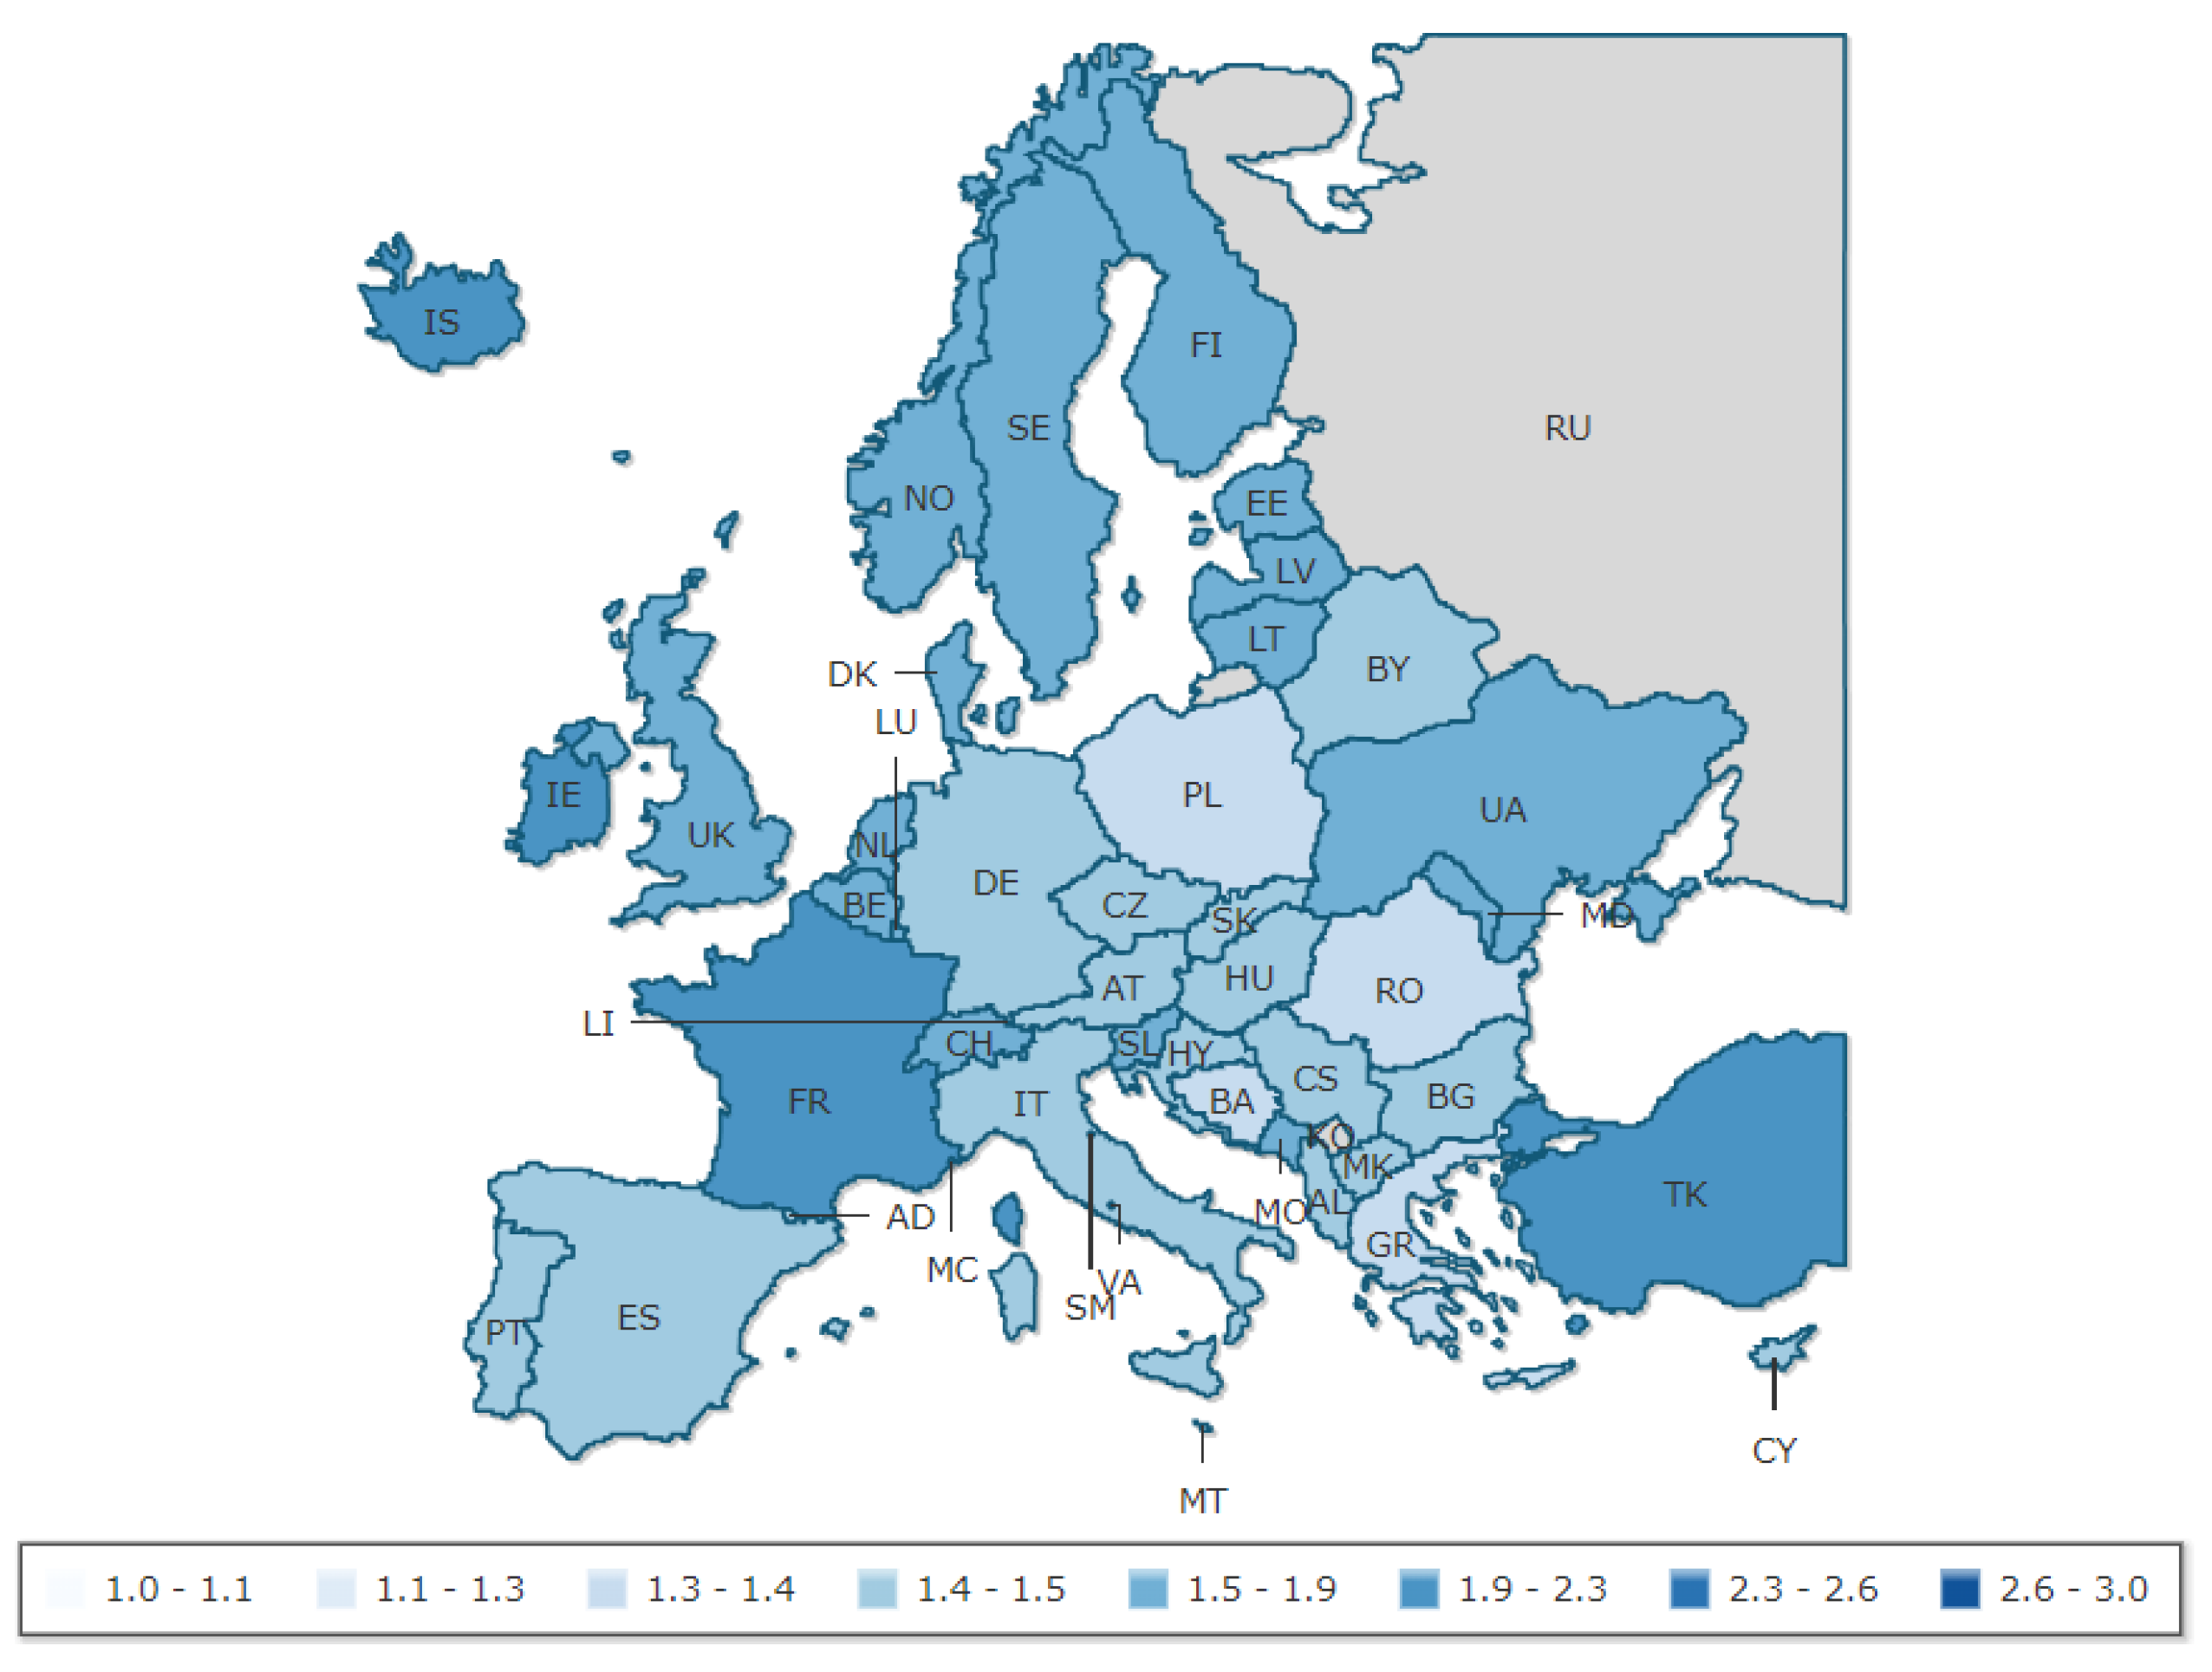
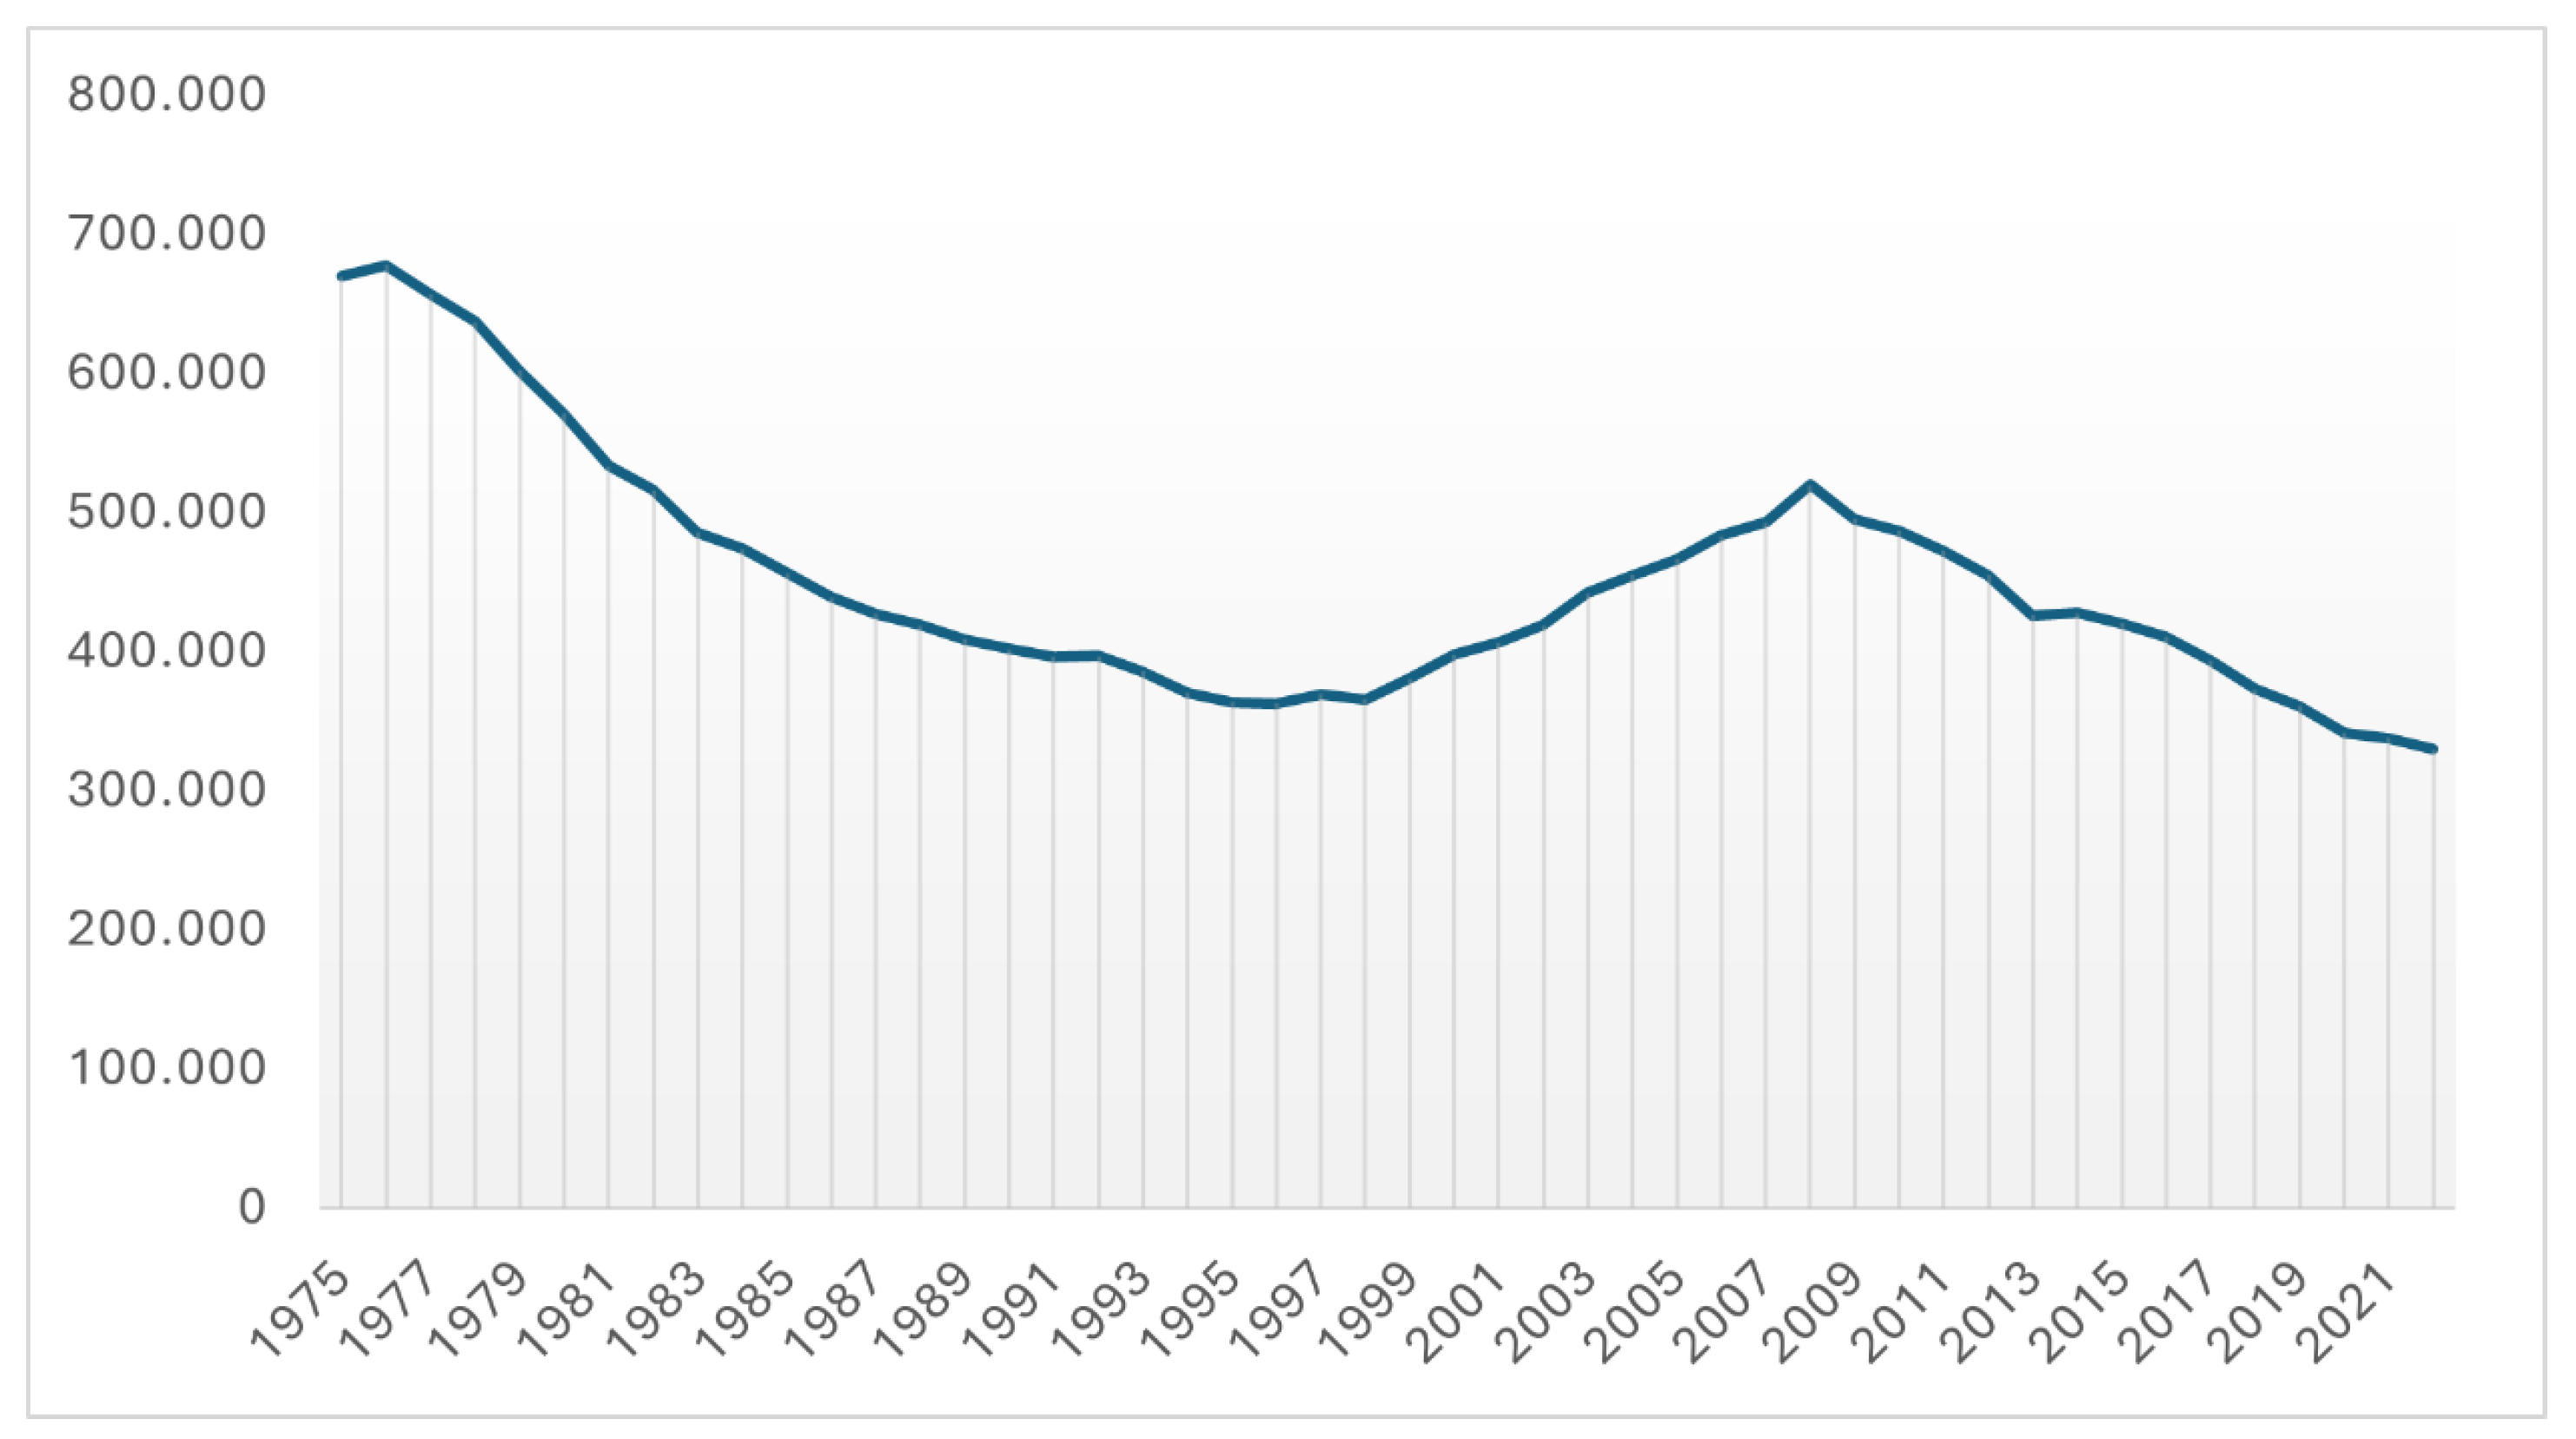
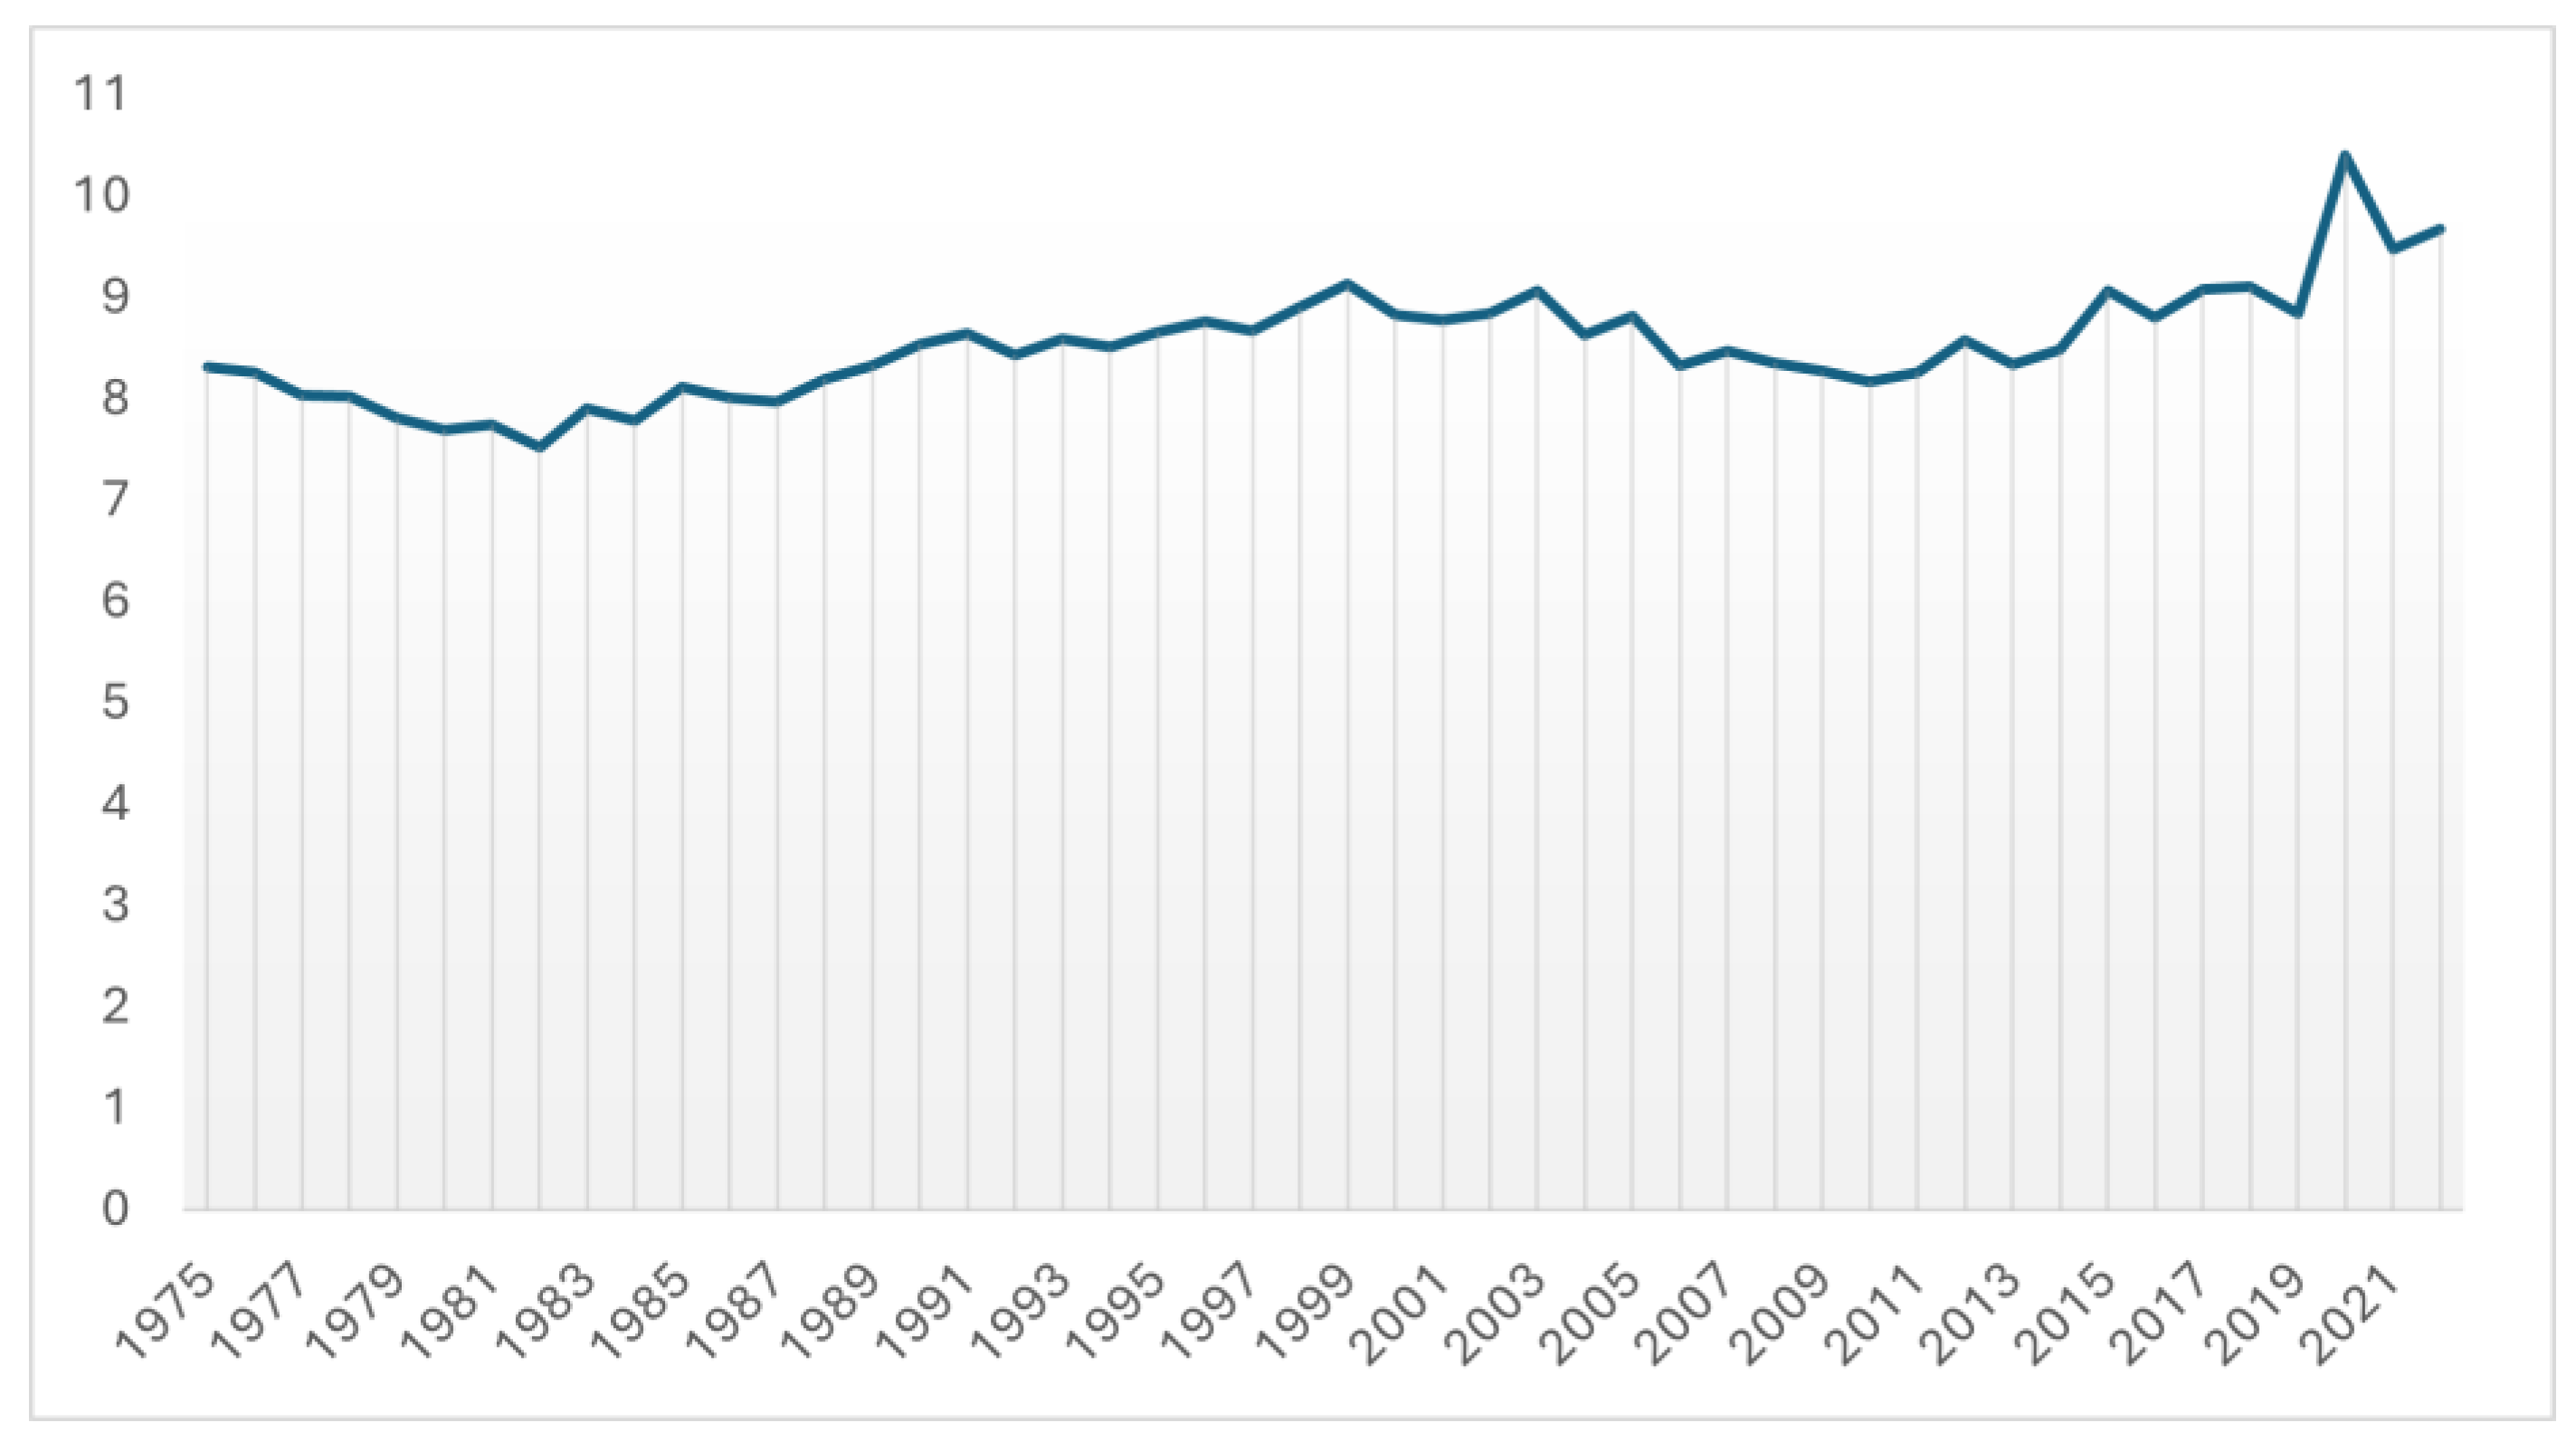
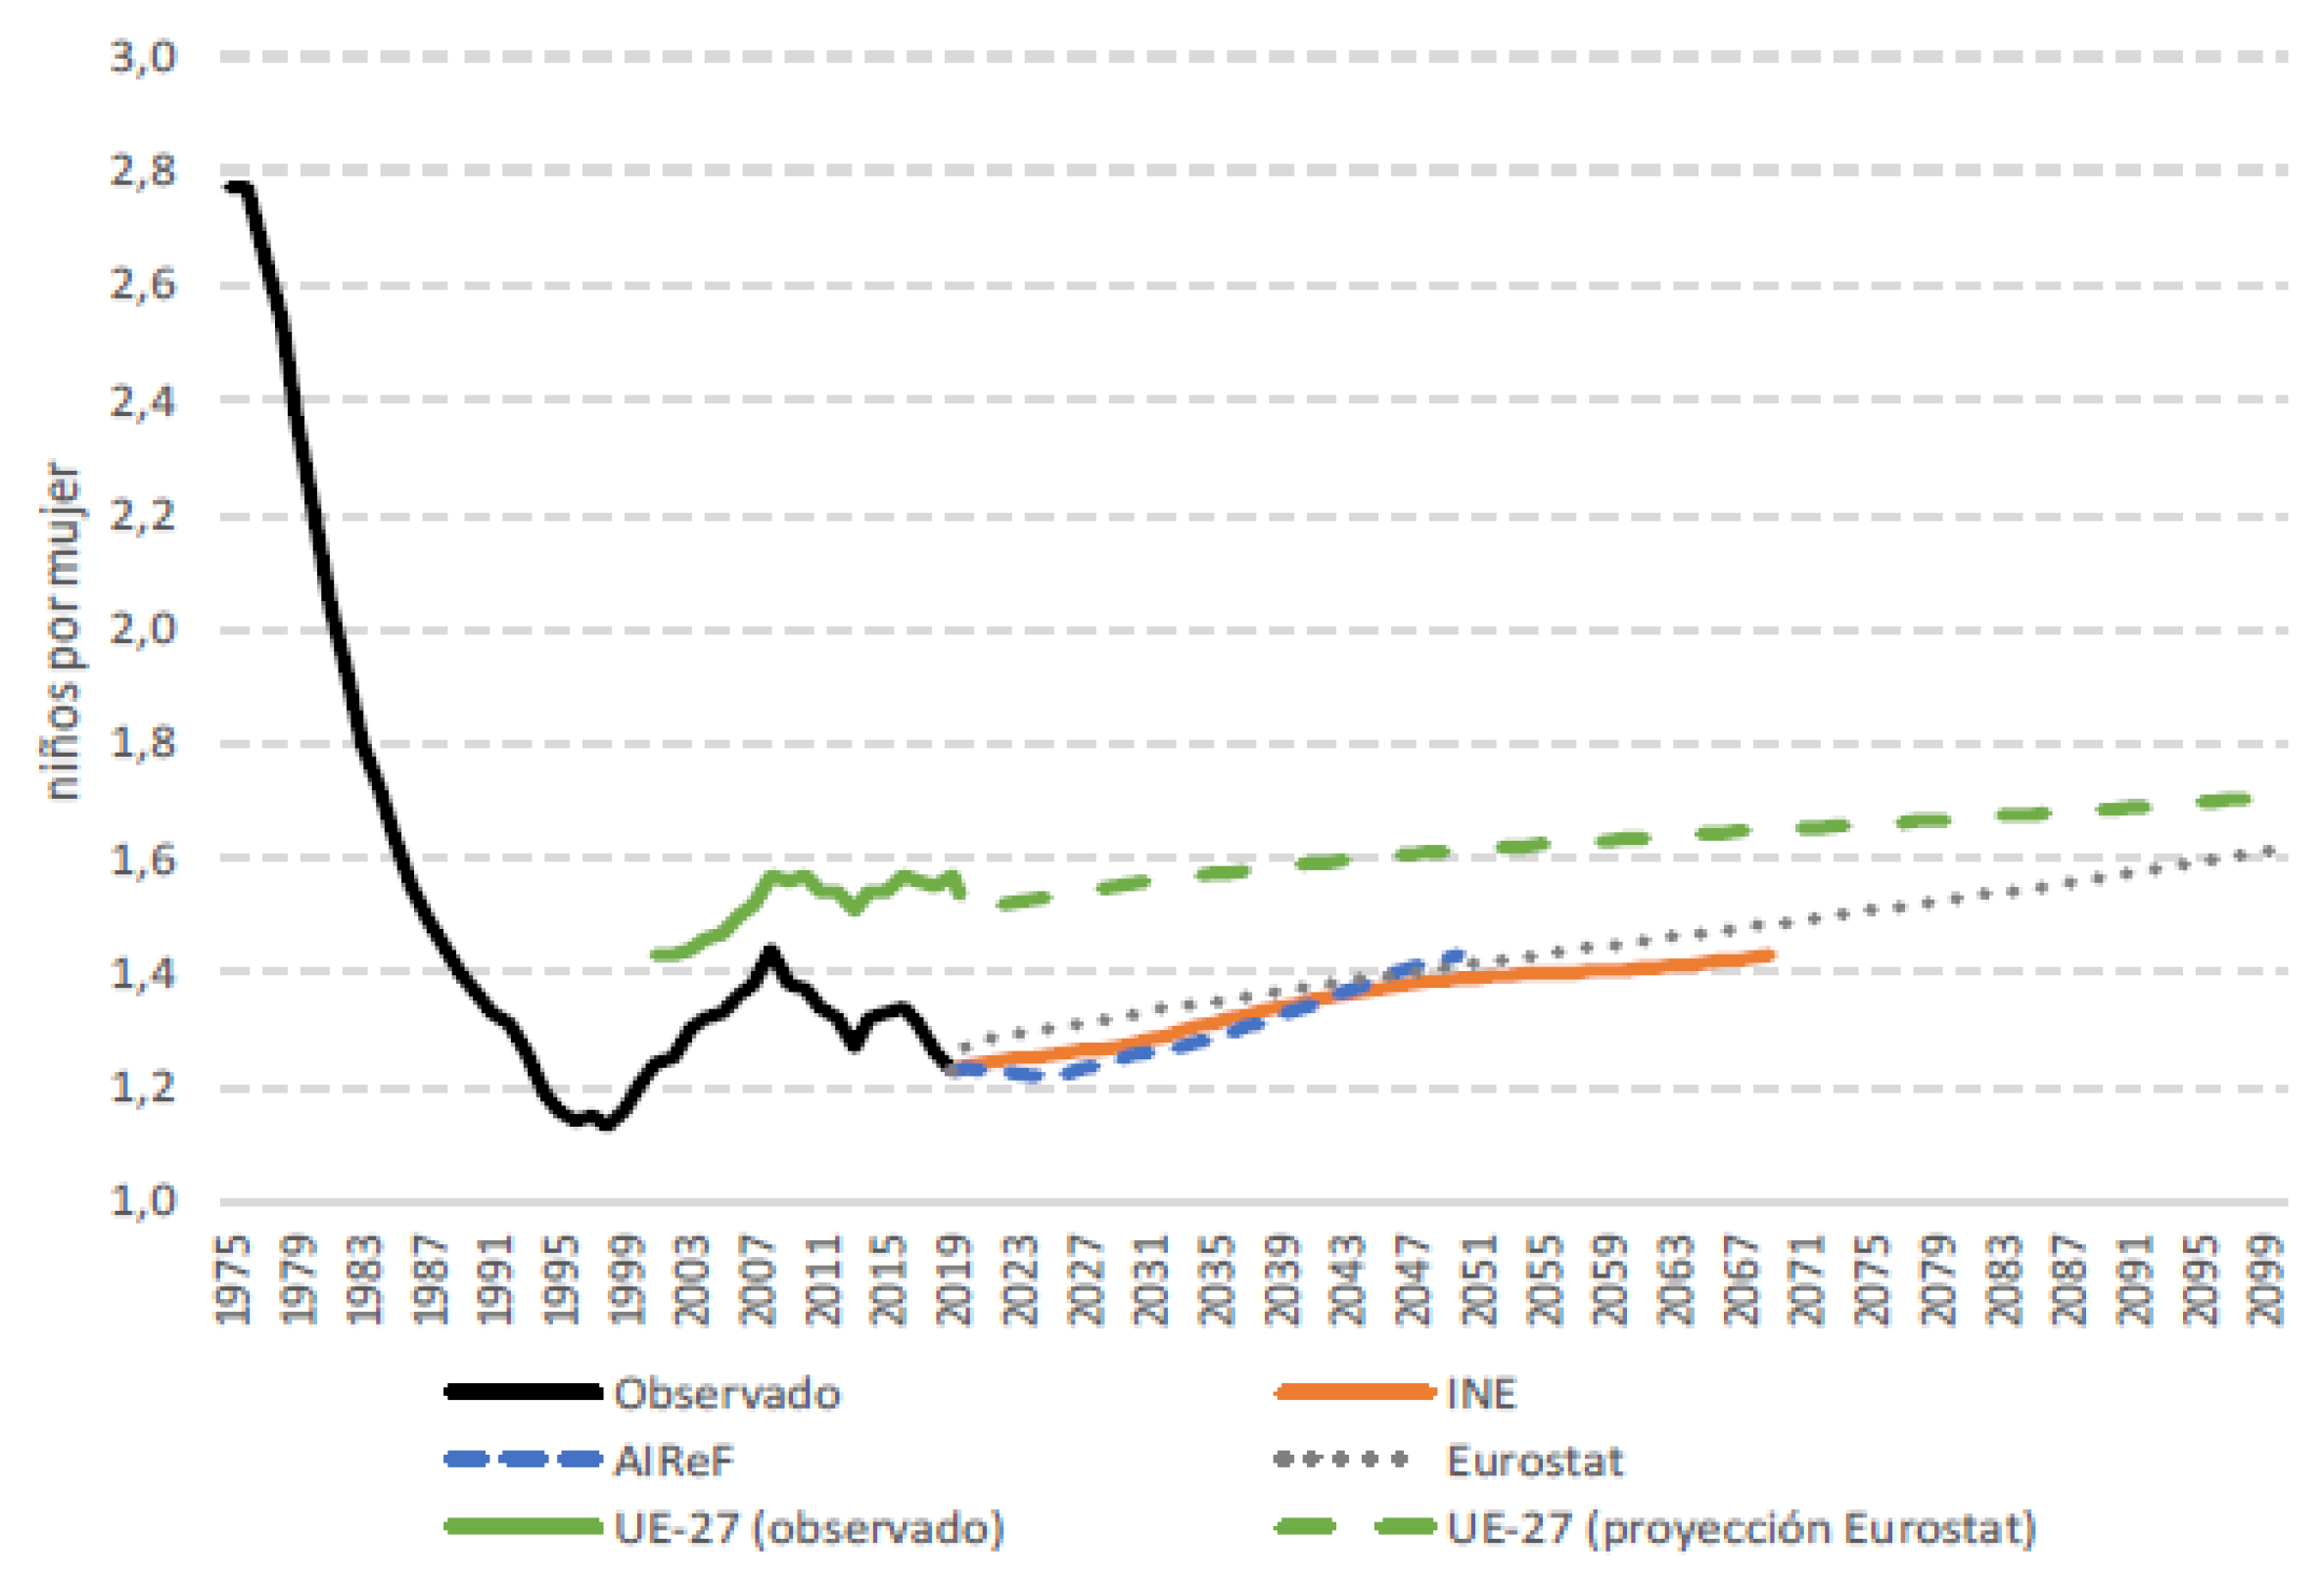
Fertility Rate and Fecundity Rate

The number of births is one of the most important input flows of a population. Its analysis is calculated through the Fertility Rate or current fecundity indicator, a measure that is defined as the average number of children that a woman between the ages of 15 and 49 would have (fertile age period in women). (Pérez, 2017).
According to the most recent studies, this number has been decreasing, from 2.77 (1975) to 1.16 (2022), a decrease that coincides with that indicated for the GBR, explained in the immediately preceding section. Despite the slight increase experienced in 2008, when the fertility indicator did indeed show an increase in figures, after more than 20 years of decline, to 1.44, the figures associated with the last years of the series show a downward trend, moving away from the value of 2.1 children. This change in behavior recorded from 2008 onwards, which coincides with the beginning of the economic crisis, is evident in the number of births and is reflected in sociological explanations for establishing detailed studies on population dynamics.
Figure 7. Spanish Fertility rate (1975-2022).
Preprints 142691 g007
Si establecemos un análisis comparativo de Tasas de Fertilidad de España con las del resto de países del continente, observamos que España es uno de los países con menores tasas de fertilidad, como se puede observar en el siguiente mapa.
Figure 8. Europe Fertility Rate.
Preprints 142691 g008
Regarding the number of births, and in accordance with what was previously indicated, a downward trend has also been observed since 1975. Since 1975, the number of births has decreased by 50.8124%, from 669,378 to 329,251, which occurred in 2022. Only the year 2008 presents a historical maximum in three decades, with 519,779 children born. From then until 2022, the registered decrease in the number of births presents the percentage of 36.6556%..
Figure 9. Number of births in Spain (1975-2022).
Preprints 142691 g009
The average age of having the first child has been increasing from 29 years (28.85) in 1975, to almost 33 (32.61) in 2022.
Figure 10. Average age at motherhood in Spain (1975-2022).
Preprints 142691 g010
The number of women in fertile cohorts has been increasing until 2009 and, since then, has shown a downward trend (10.5 million in 2022 compared to 11.6 million in 2009). In addition, there is less immigration and more emigration abroad, so the migration balance is a decisive measure in the interpretation of these figures.
Figure 11. Women of Childbearing Age in Spain (1971-2023).
Preprints 142691 g011

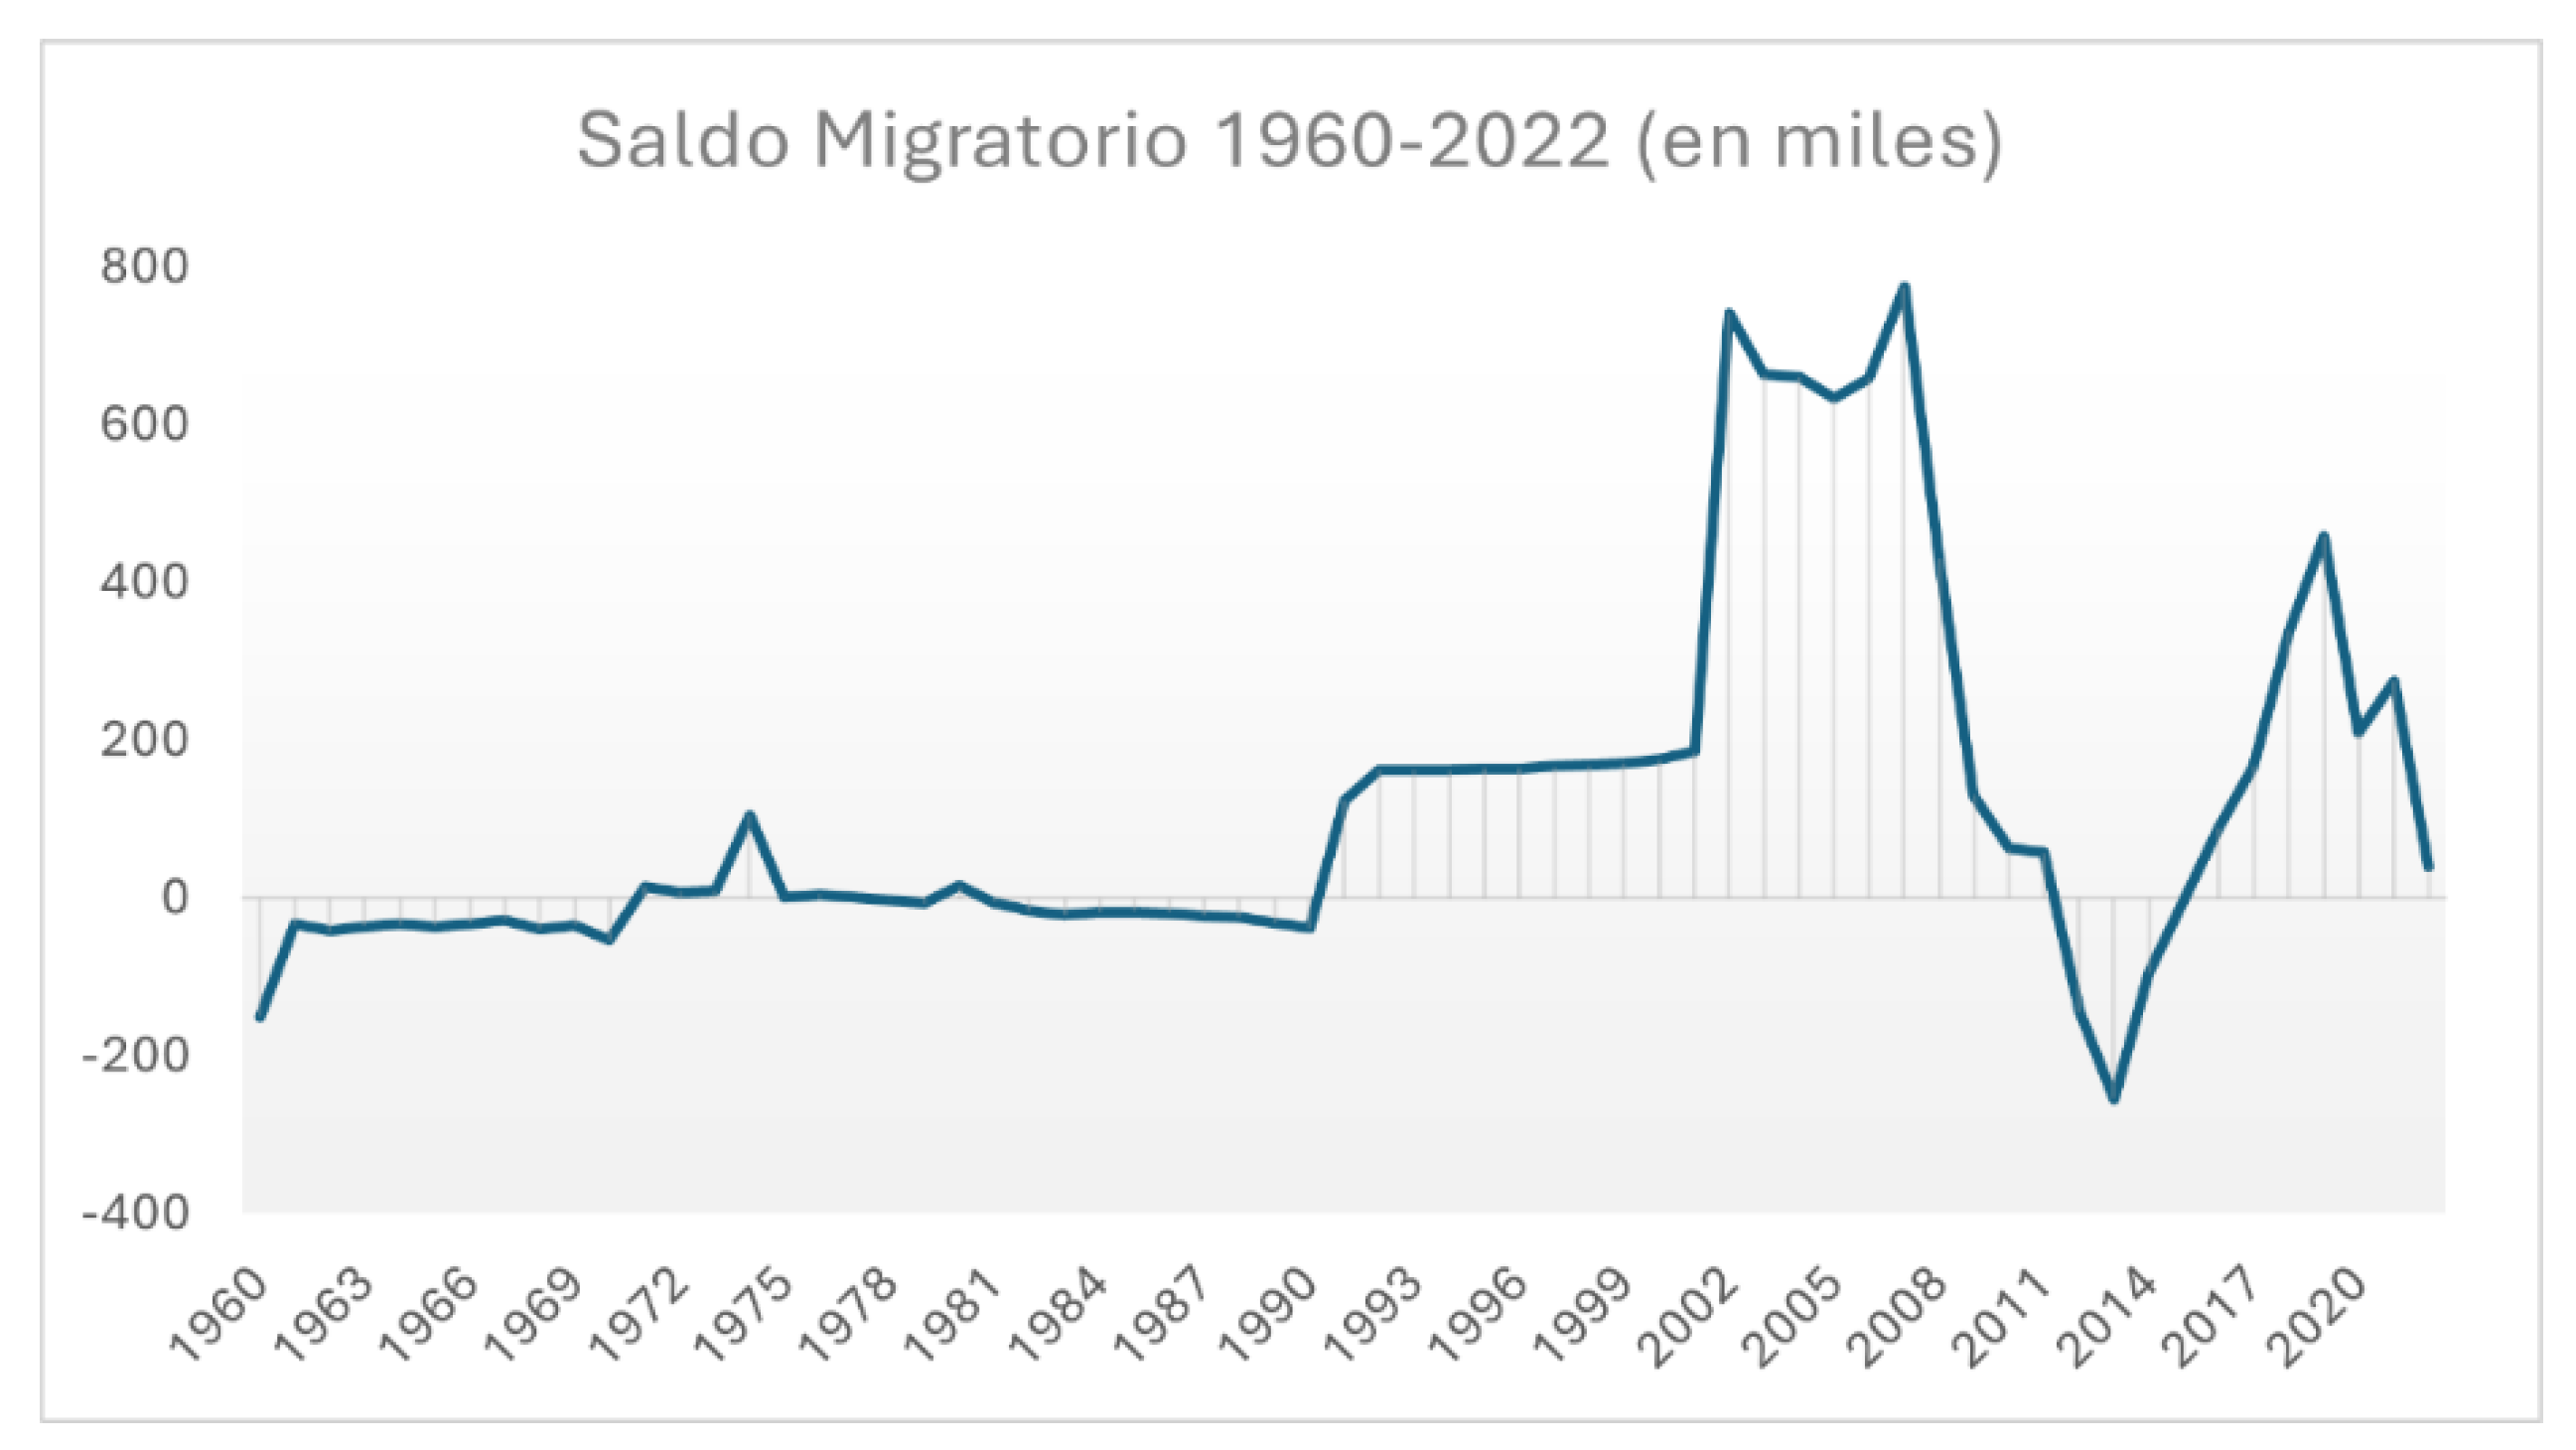
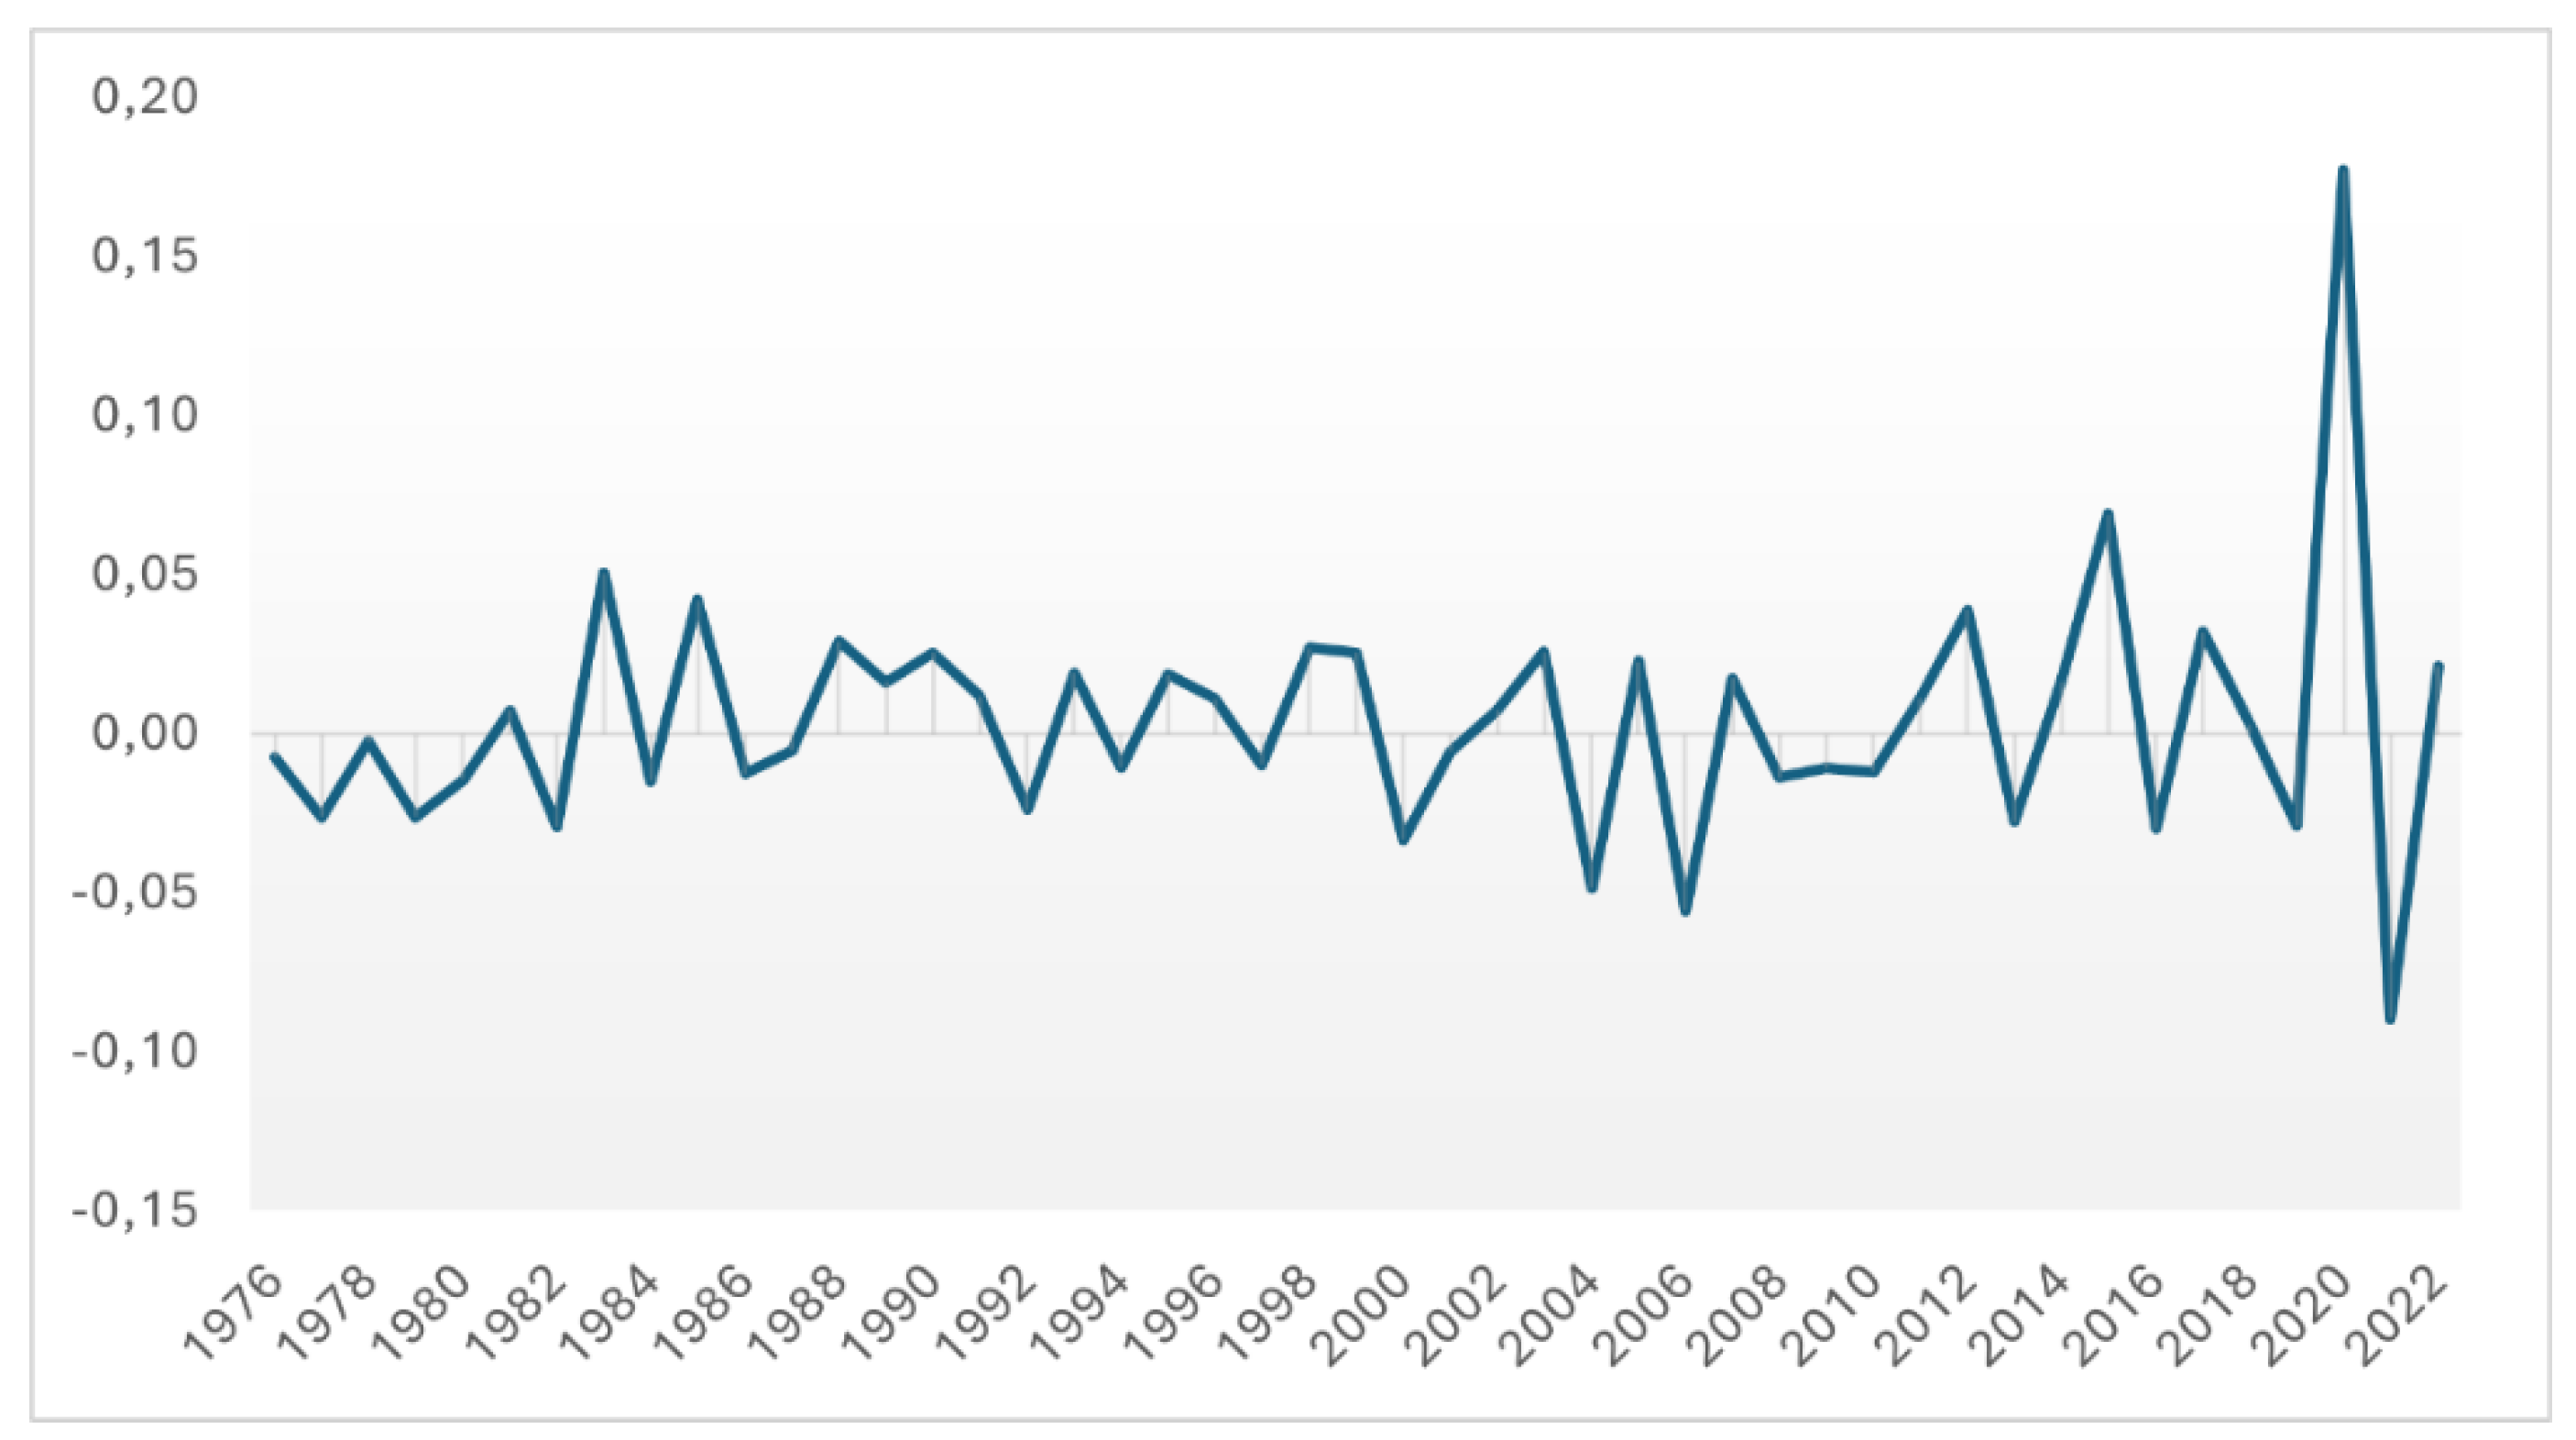
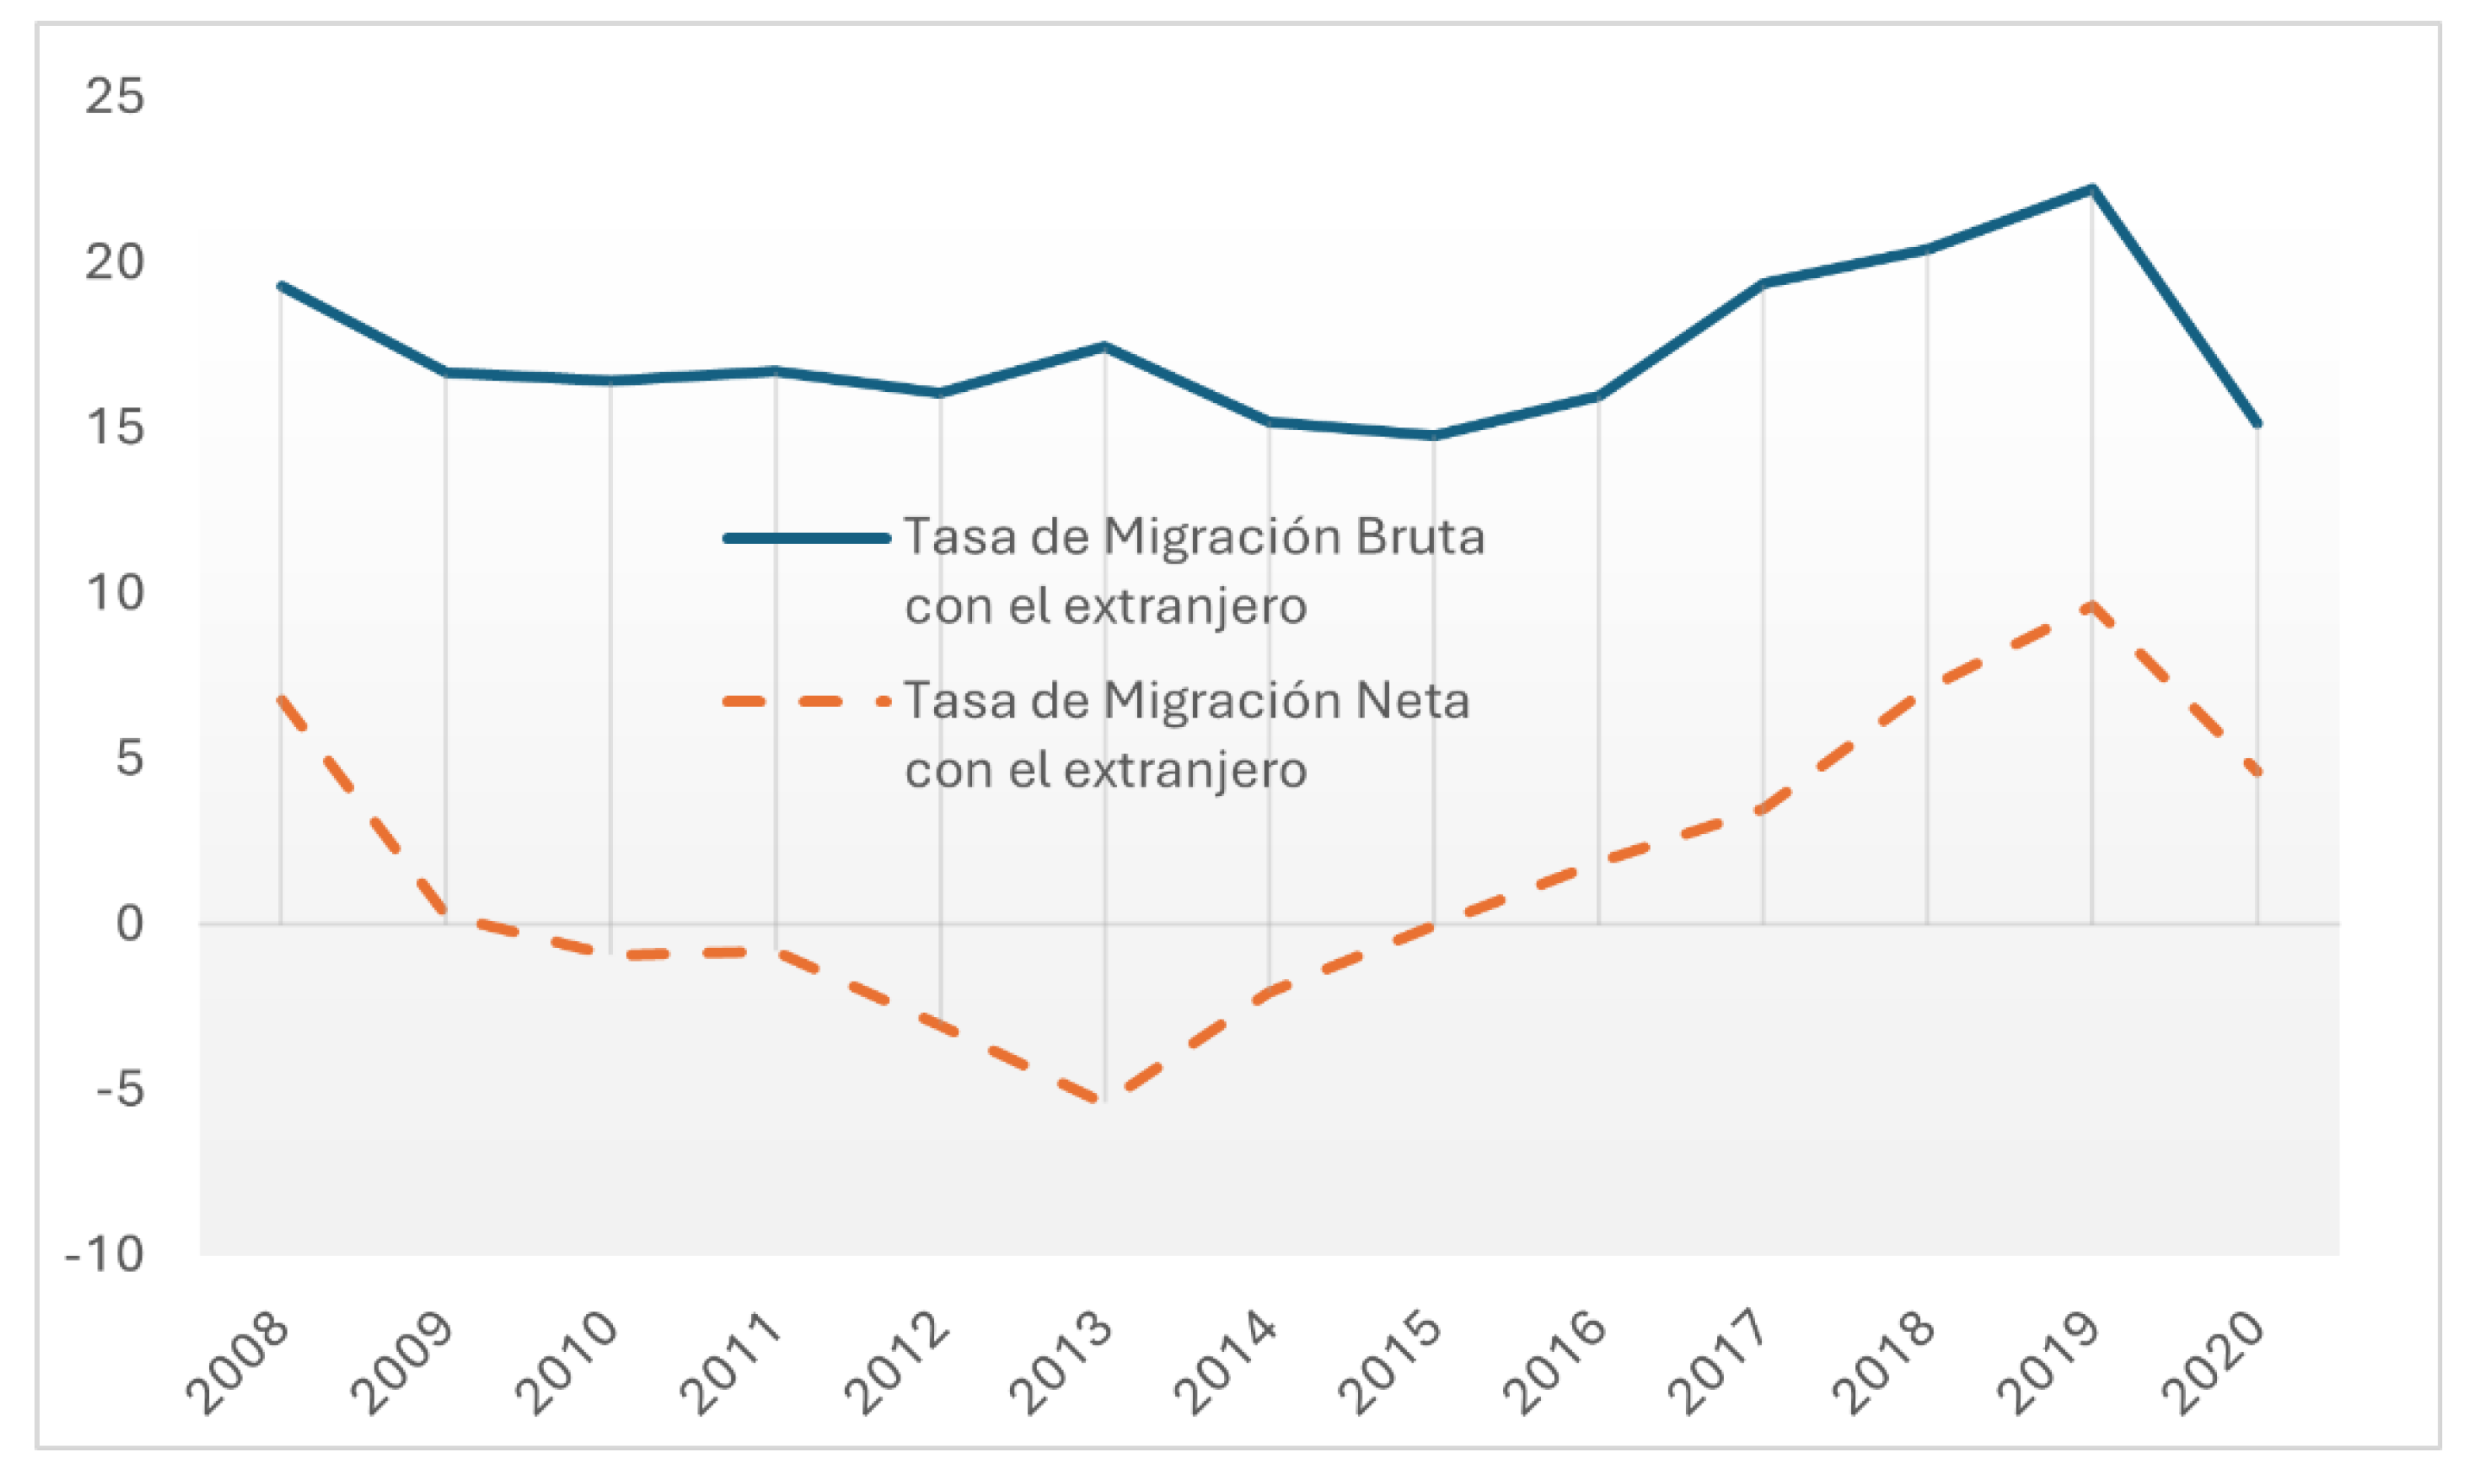
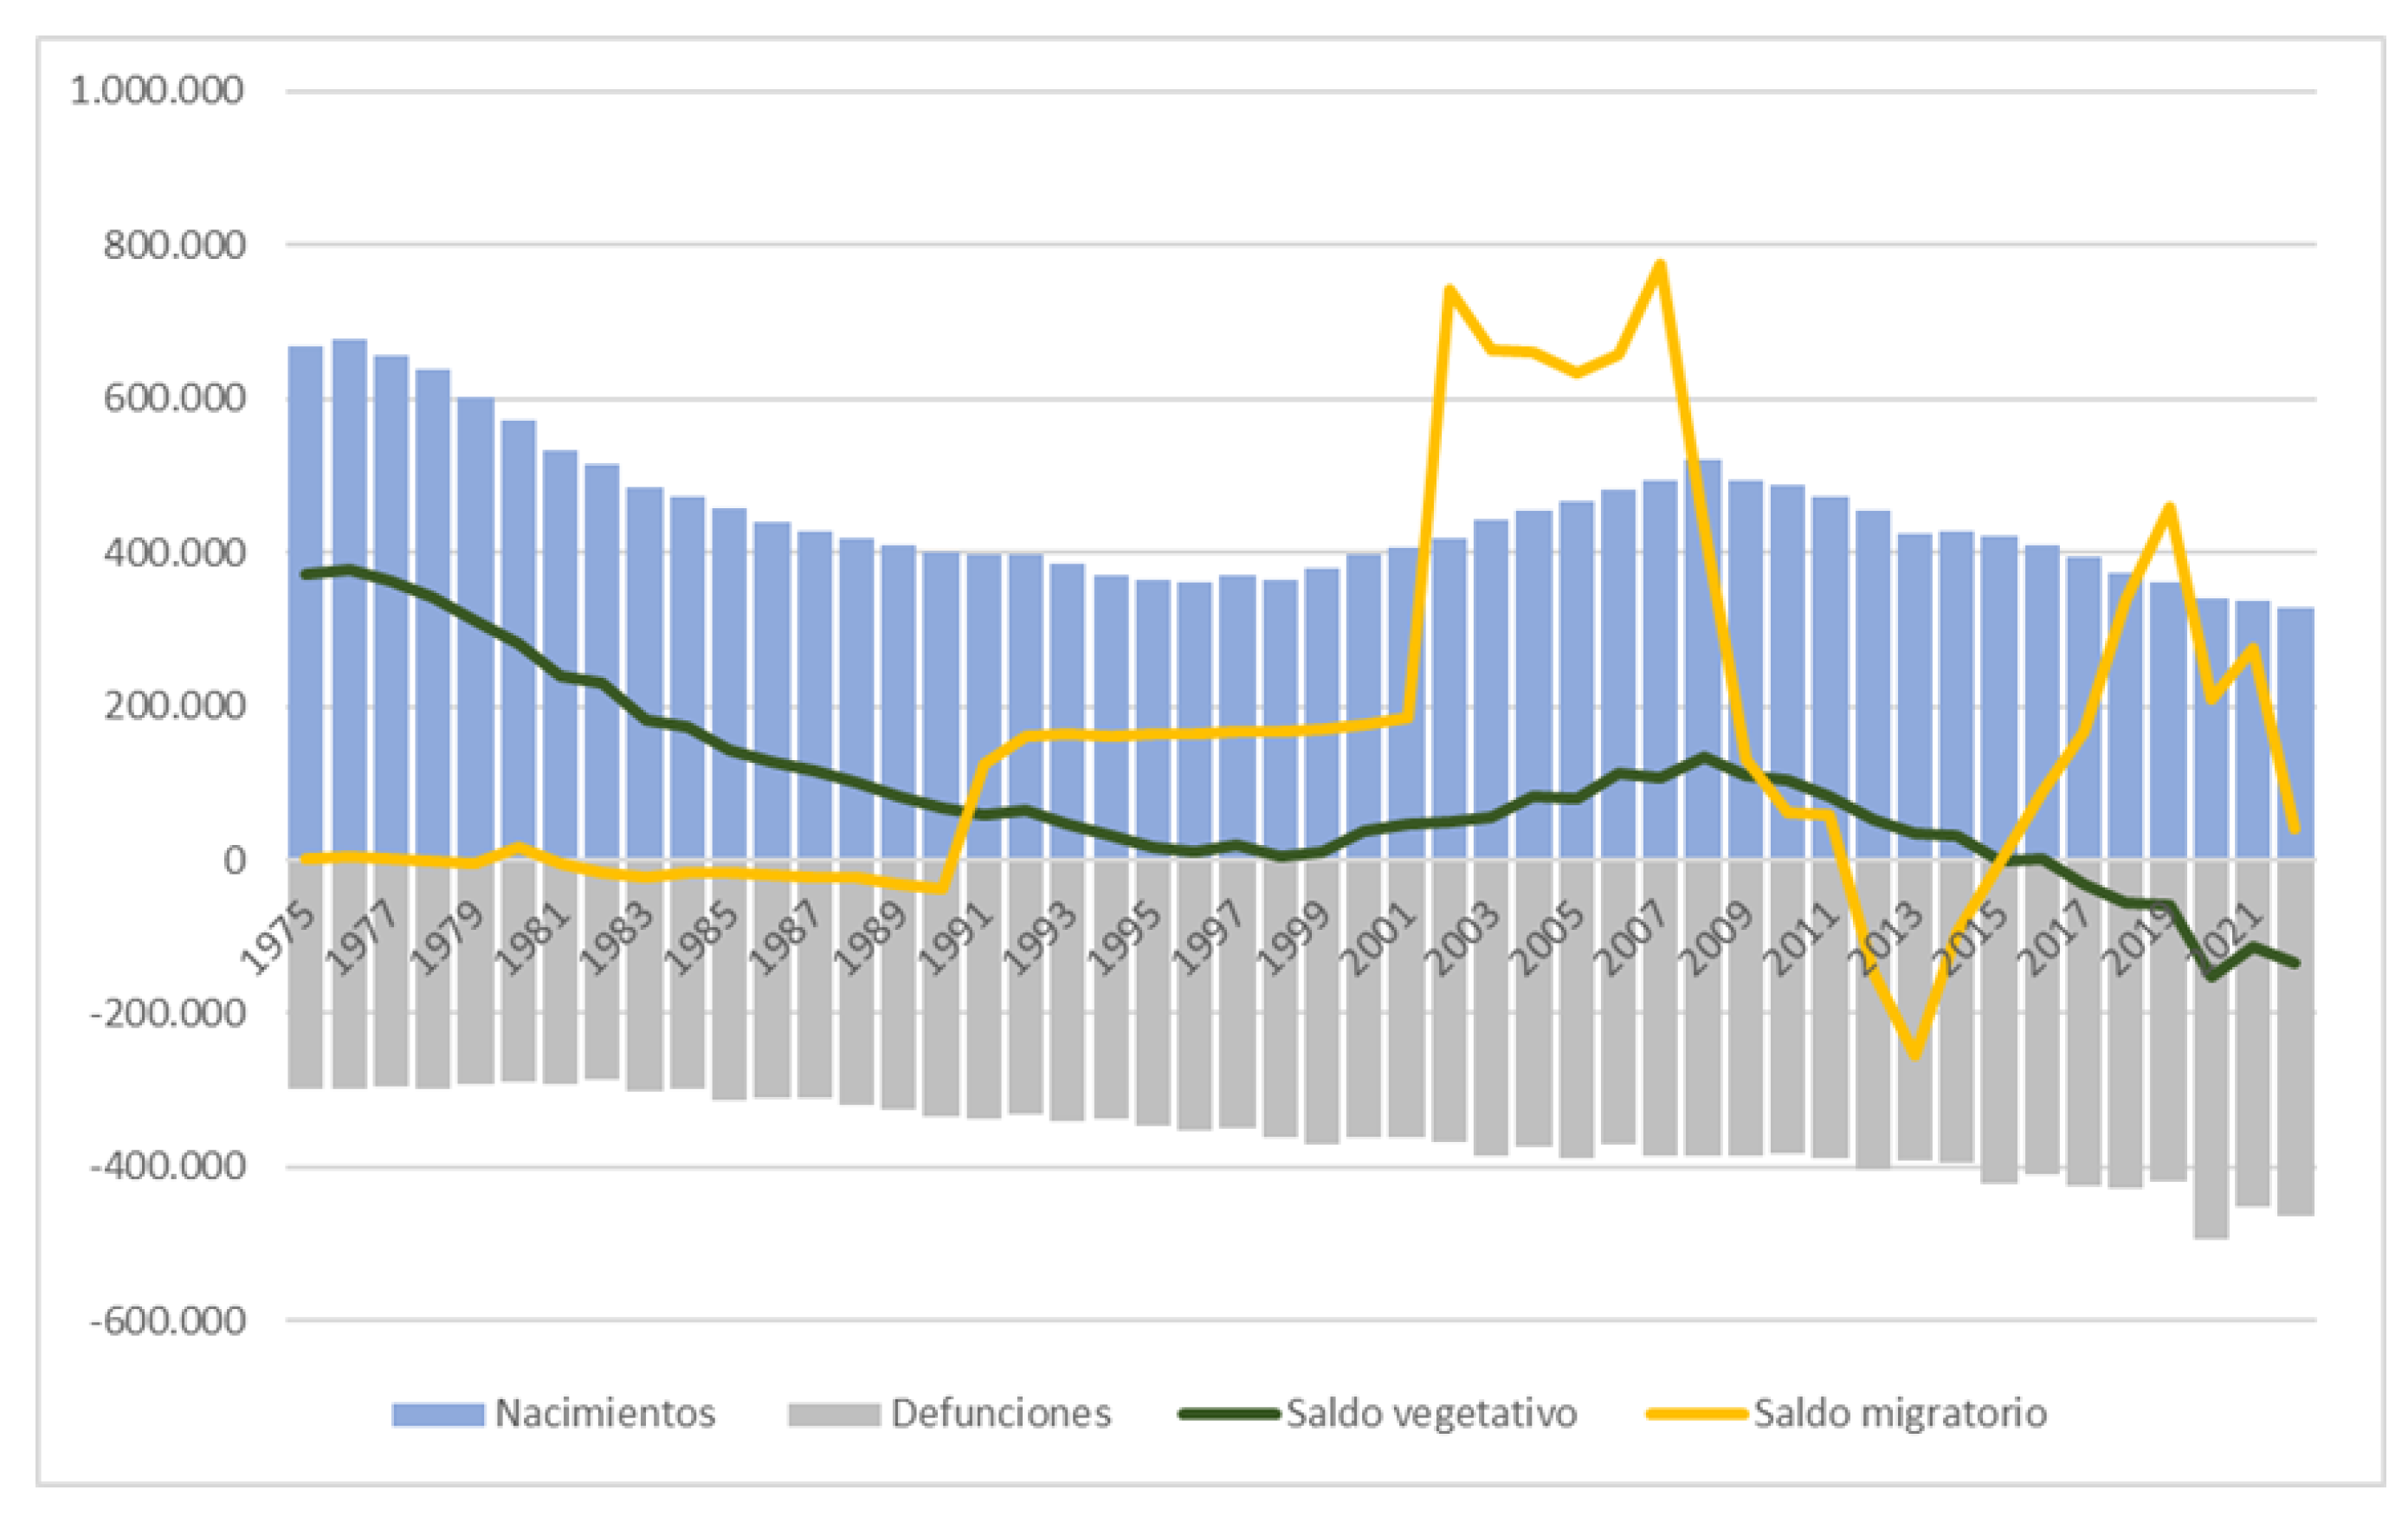
Migration Indicators

Spain went from being a country of emigrants until the 1980s to being a typical country of immigration. The Migratory Balance, defined as the difference between immigrants and emigrants, went from taking negative values to growing intensely during the period 2000-2008, and from 2014-2019.
Figure 12. Migratory Balance in Spain (1960-2022).
Preprints 142691 g012
Chart 13 shows a graphic decline in the number of immigrations and a similar increase in emigrations, starting in 2008, which show a negative SM from 2009 to 2015, an interval in which a certain economic boom occurs and the departures abroad are reduced.
On January 1, 2020, the Spanish population was made up of 47,450,795 (I.N.E., 2022) inhabitants, of which 5,434,153 were people from other regions of the world. This figure represents an increase compared to the data recorded on January 1 of the previous year.

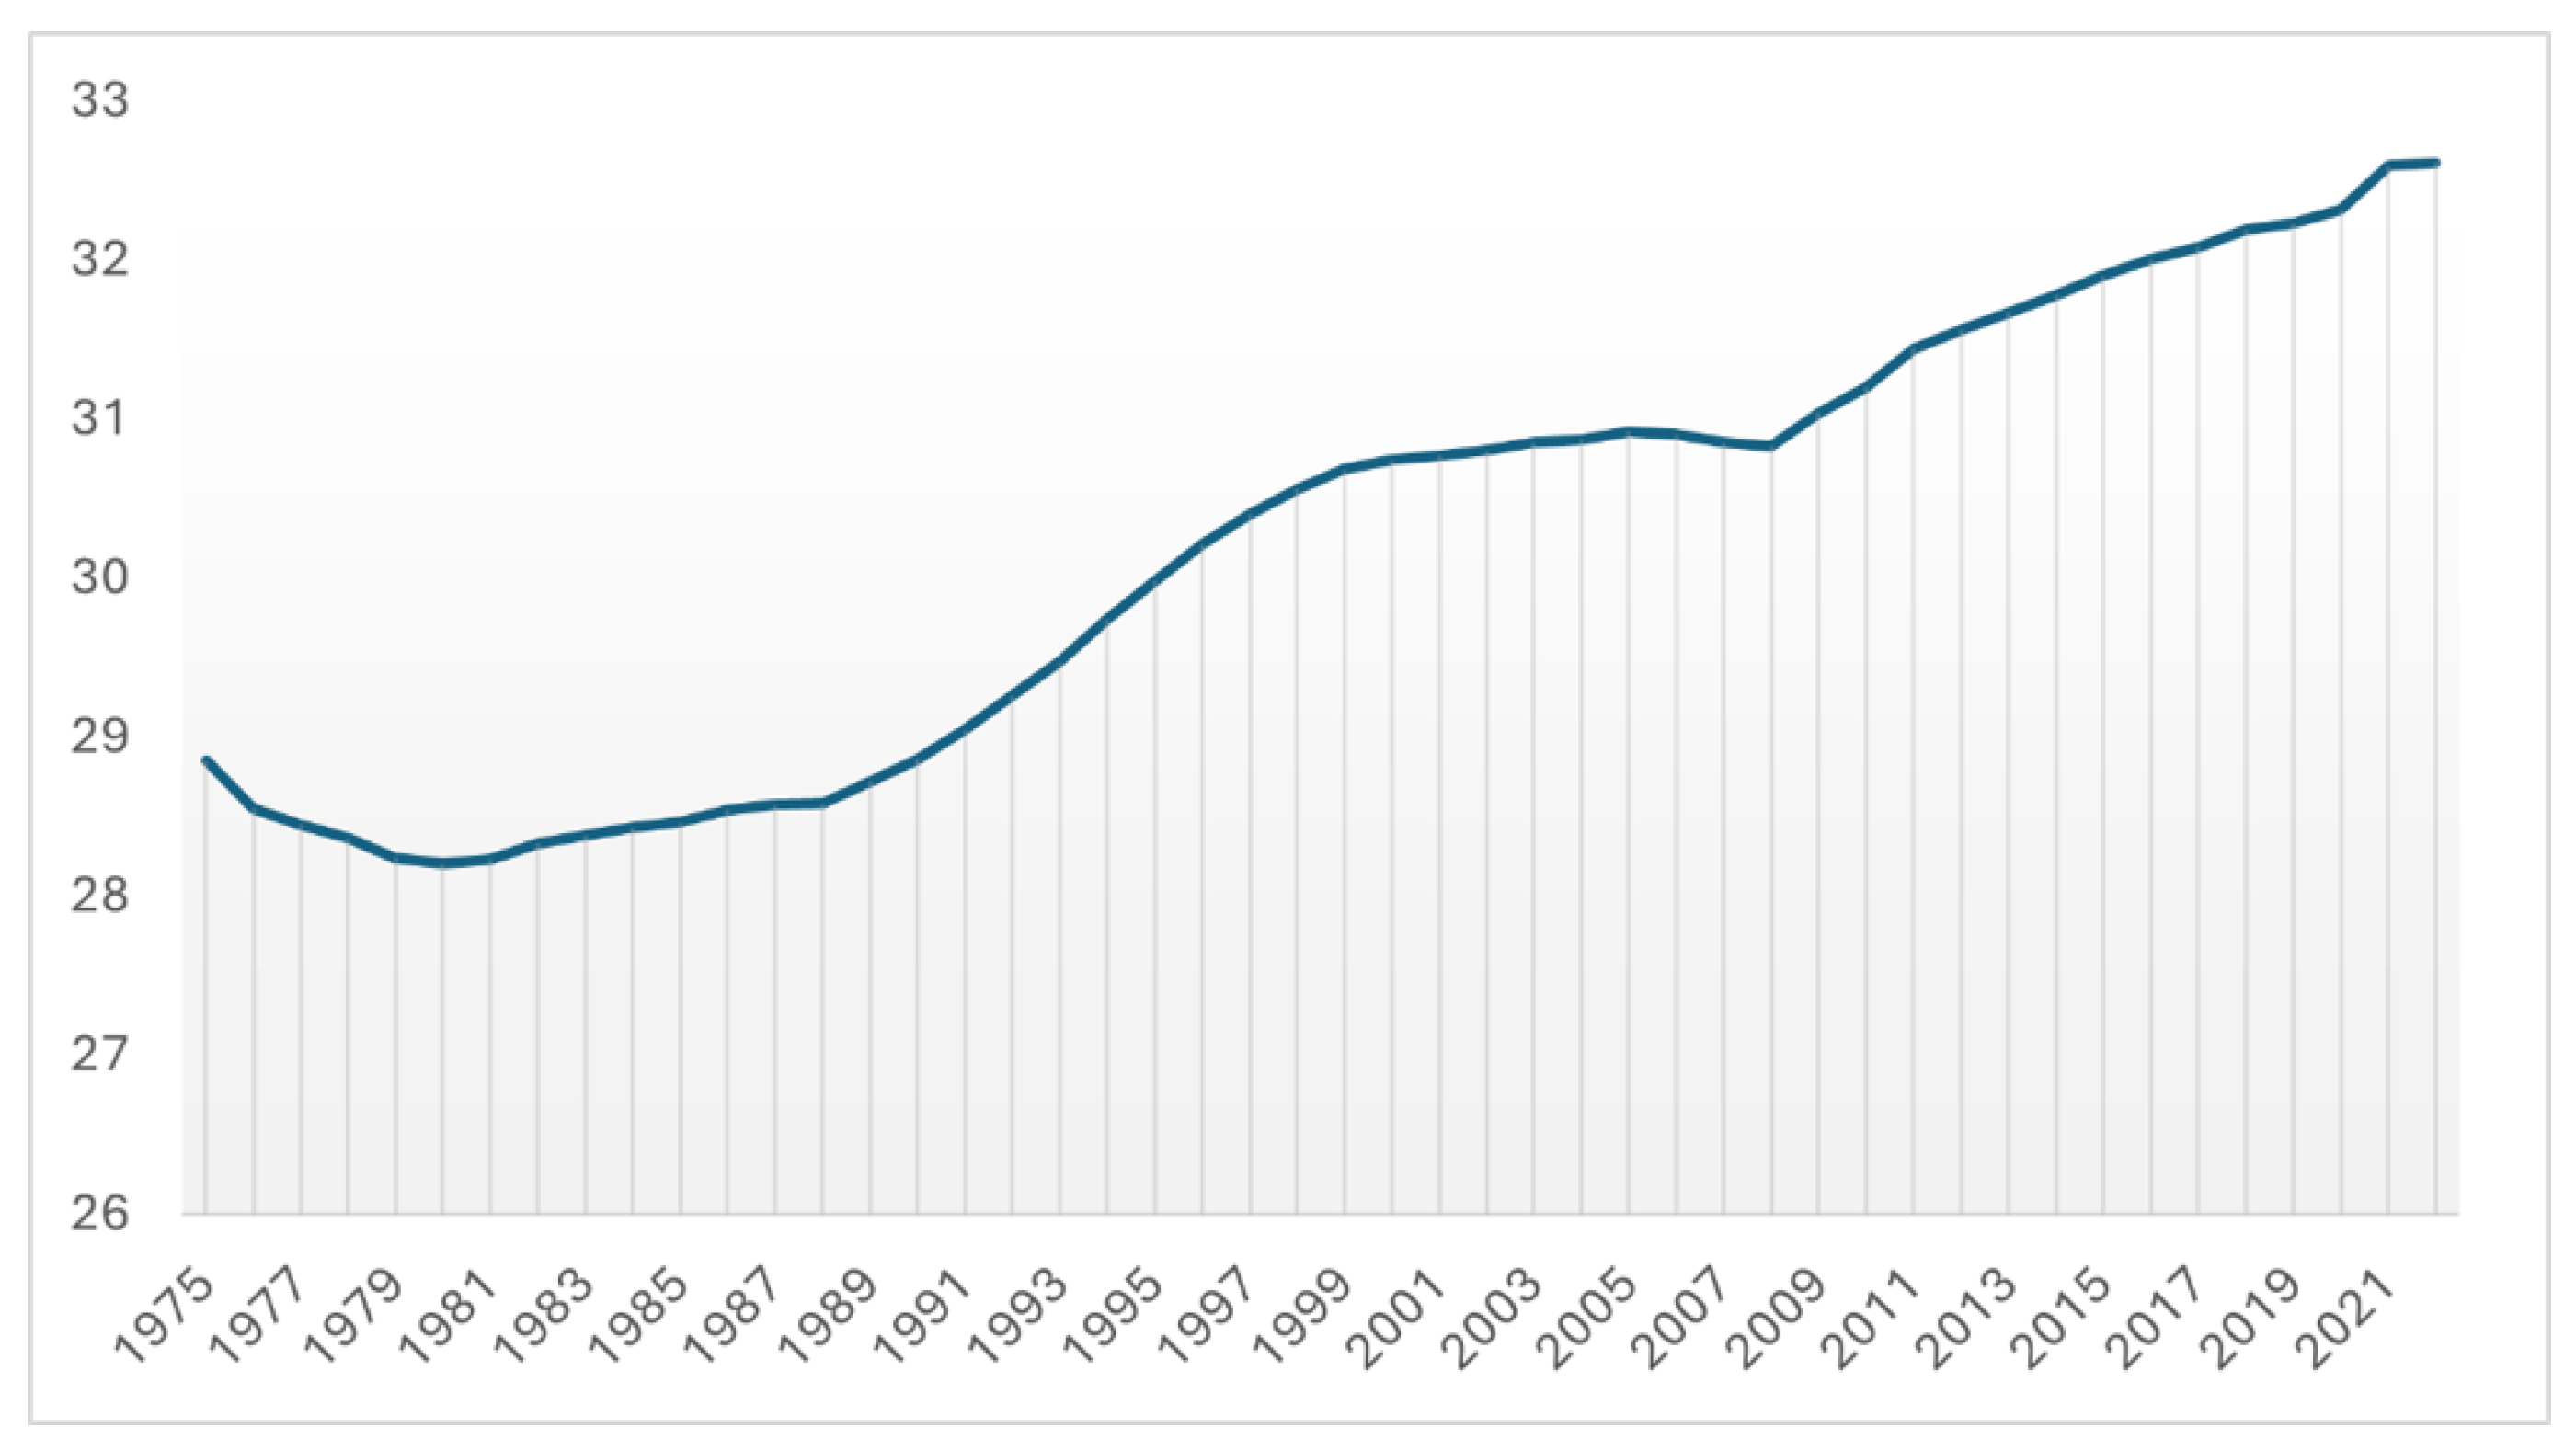
Middle Age and Median Age
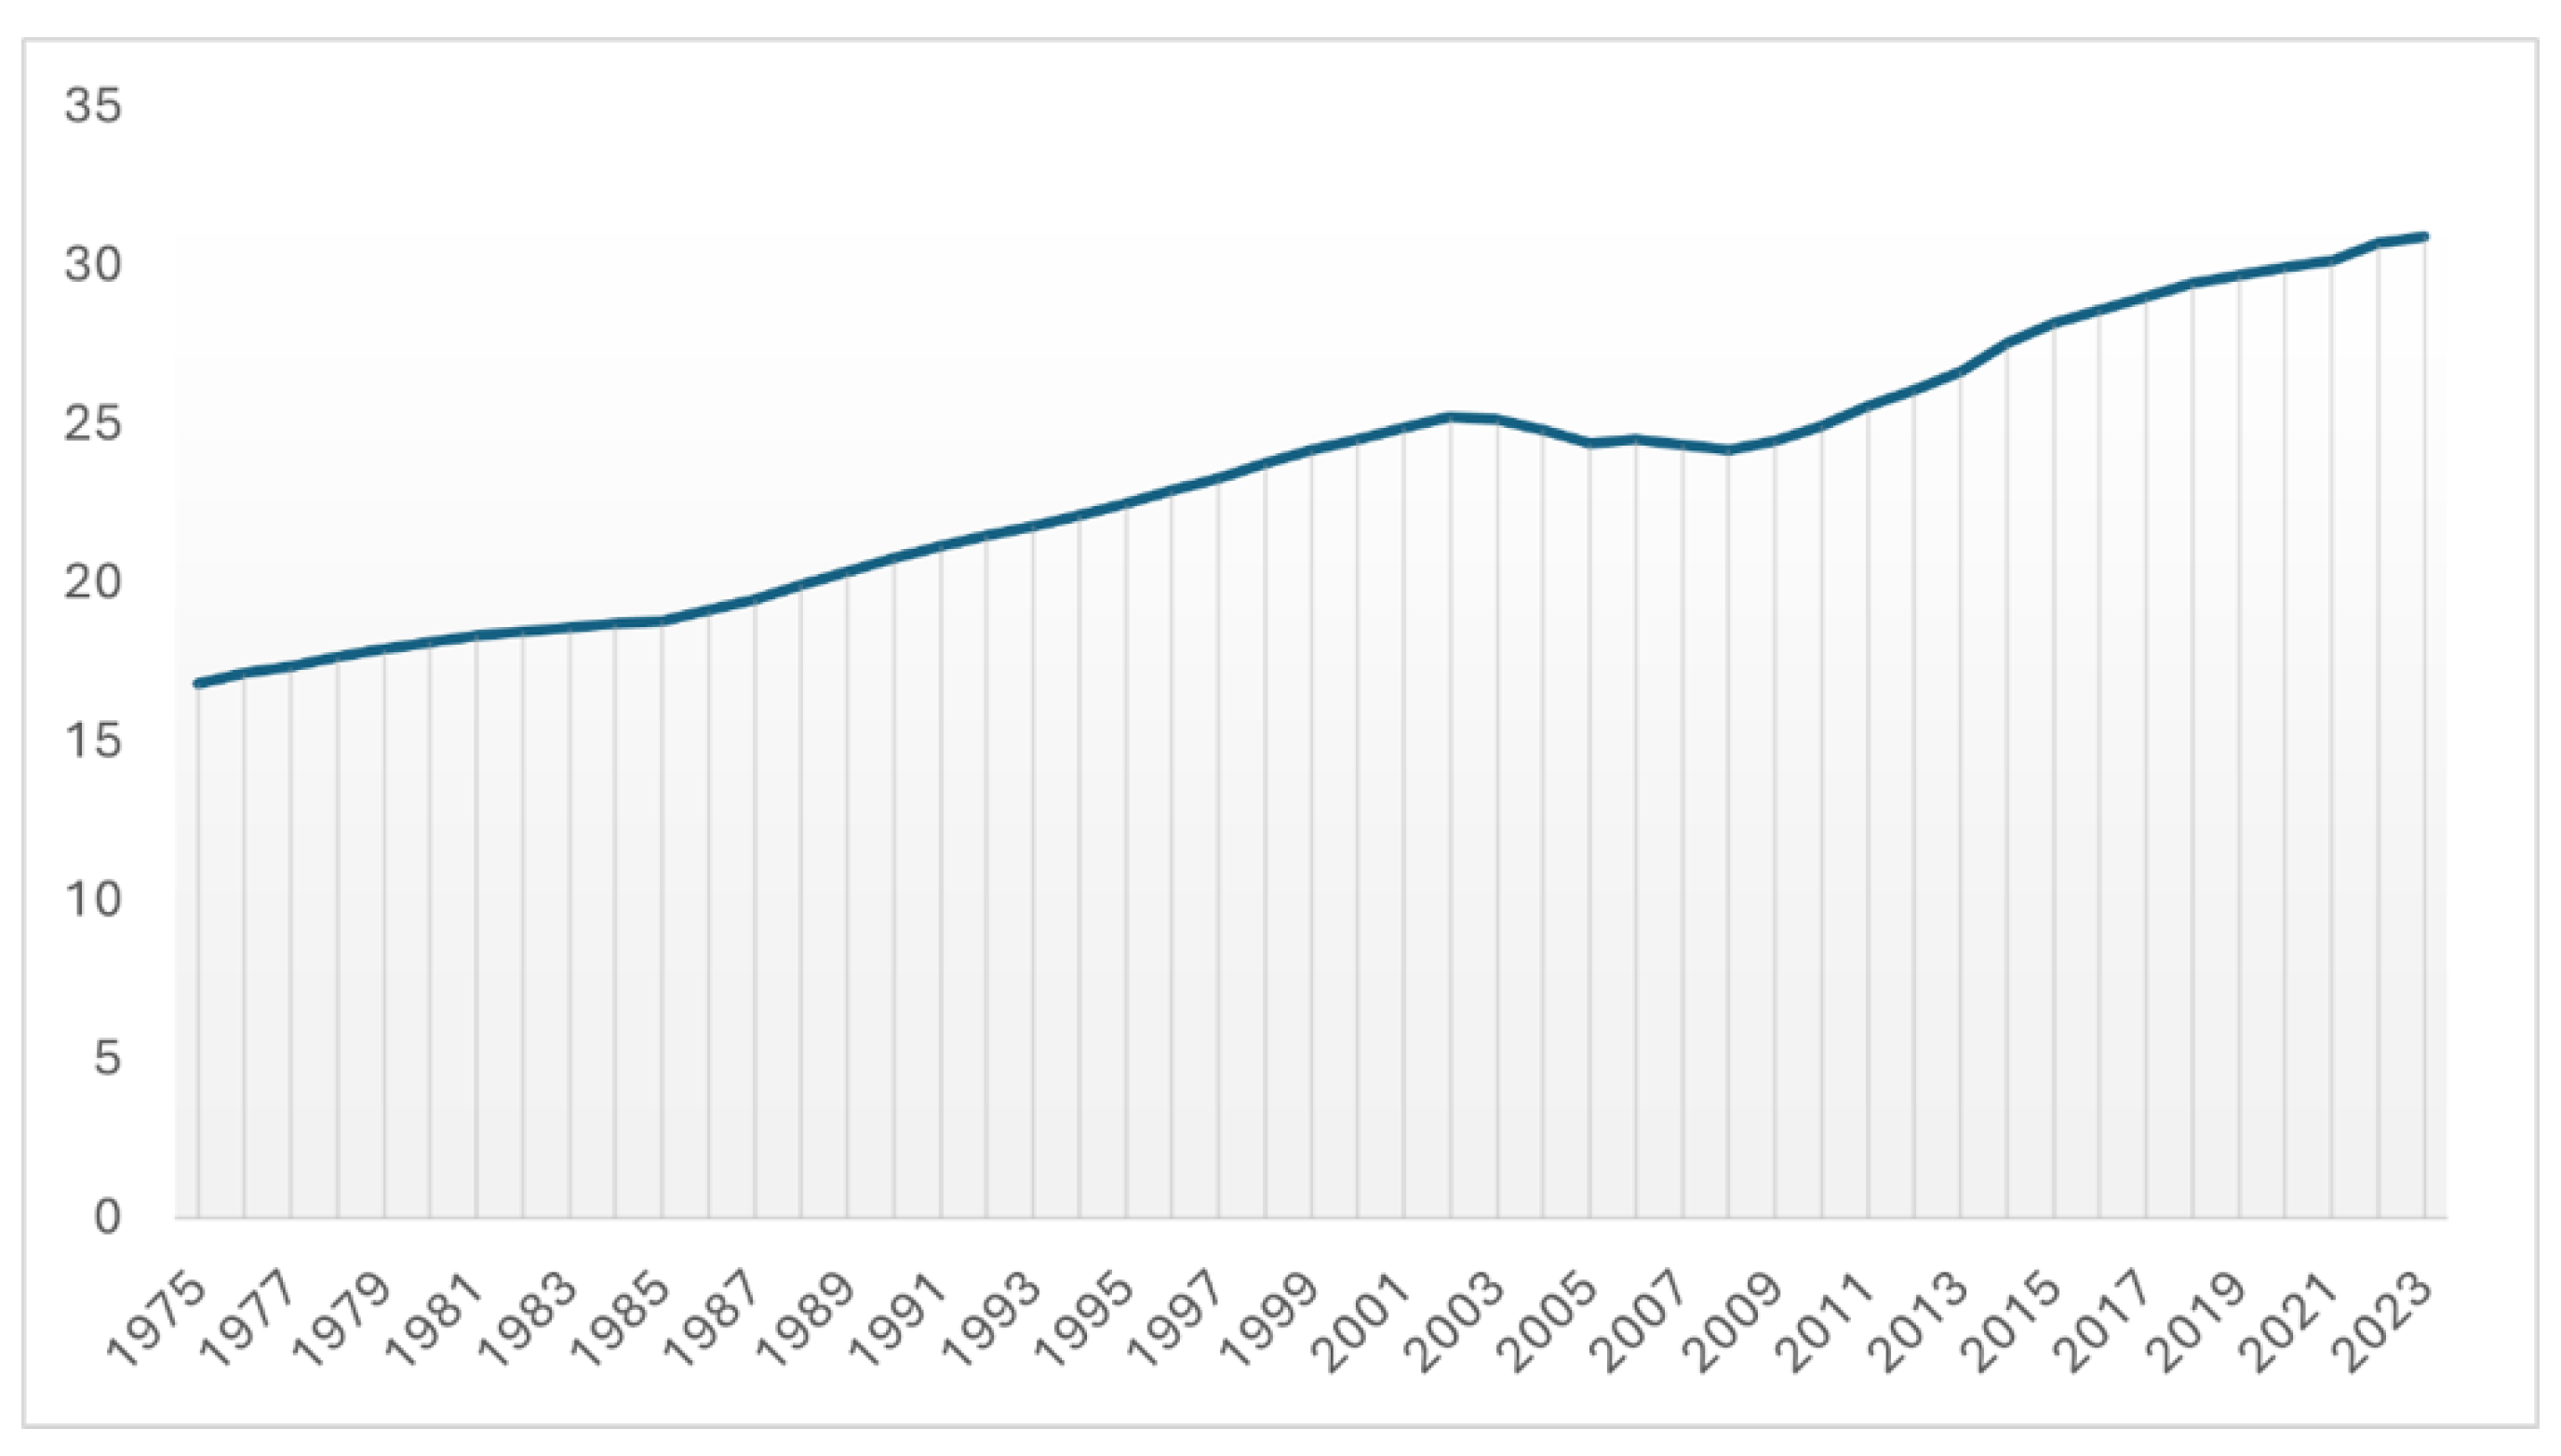
The average age of the population, together with the median age, are configured as explanatory indicators of the demographic-population structure. The average age is the average age of the members belonging to a certain geographical or territorial area as of January 1, 2020. The analysis of the evolution of this average age shows an absolute increase.
The median age is the measure that divides the age distribution of the population into two equal groups as of January 1, 2020. Its behavior has been similar to that shown by the average age. Comparing both measures for the entire time series under study, the values of the average are higher than the values given by the median, which indicates a concentration of age values to the right of the average values considered, another clear symptom of population aging (INE., 2023).

Aging Index

To obtain the ageing index, it is necessary to consider the percentage of individuals in a population over 64 years of age, since it measures the relative weight of older people in relation to the total population.
The Ageing Rate indicates the percentage that the population over 64 years of age represents in relation to the population 16 years of age and under at the beginning of t, providing information on the number of elderly people per 100 inhabitants under 16 years of age. This index or measure shows the current ageing and the future ageing of the population (Pérez, 2017: 183).
As can be clearly seen in Chart 14, this index shows a growing graphic trend over the years, mainly as a consequence of an increasingly high life expectancy, together with an improvement in the quality of life of people. Currently, the index stands at 137.33%, 102.34% higher than in 1975, when, remember; for every 100 people aged 16, there were 34.986,730 people over 64 years of age.
According to INE reports, as of January 1, 2022, there are 9,479,010 elderly people (65 years and older), which represents practically 20% (specifically, 19.96%) of the total population (47,475,420). Differentiating by gender, it should be noted that there are 4.50% more women (5,367,334) than men (4,111,676) of advanced age (INE, 2022).

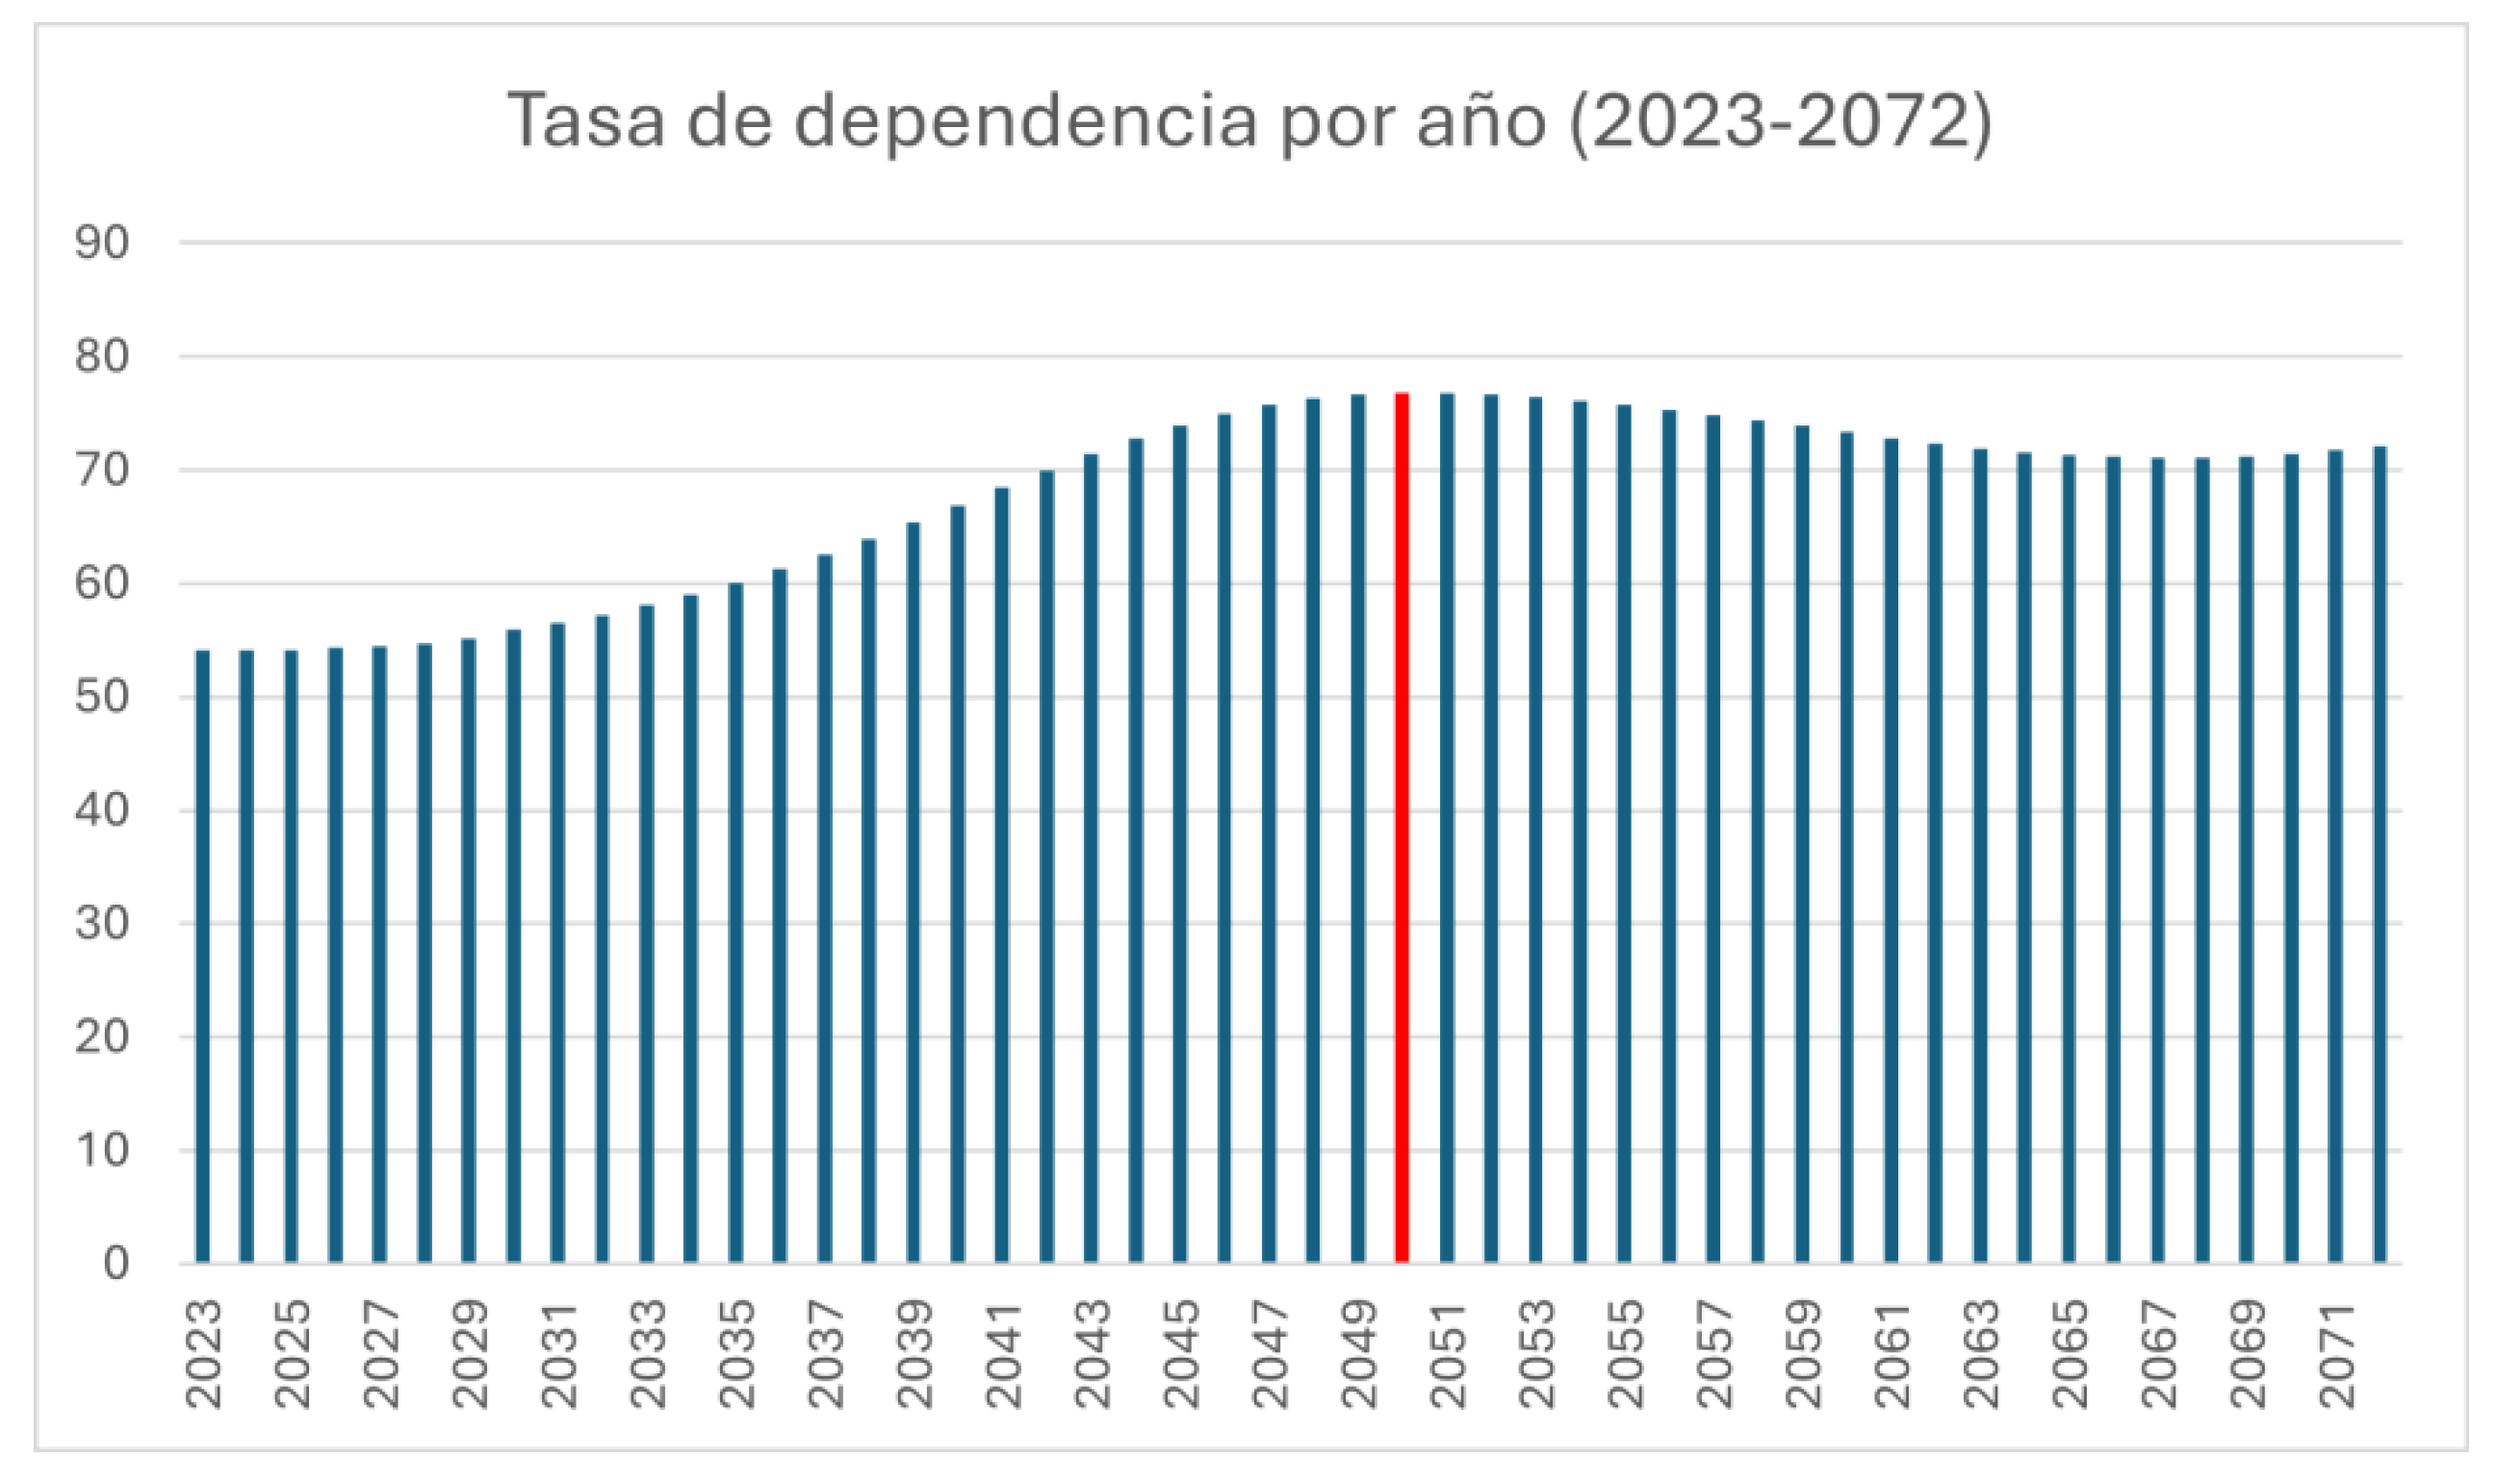
Dependency Rate of the Population over 64 Years of Age

The dependency rate of the population over 64 years of age indicates the relationship between the population over 64 years of age and the population in the cohort from 16 to 64 years of age, both magnitudes referring to a certain territory at the beginning of the 20th century. In short, this index indicates the relationship that exists between the dependent population (that is, the population under 16 years of age and the population over 64 years of age) and the productive population on which the former depends (from 16 to 64 years of age). According to the time cohorts indicated, the dependency index can be broken down into the dependency index of young people (under 16 years of age) and the elderly (over 64 years of age) (Ministry of Health, 2020). For the purposes of our work, we will focus on the dependency index of elderly people (over 64 years of age).
Age dependency rates are, sociologically, very useful for studying the level of support and public policies aimed at younger and older people. Mathematically, these rates are expressed in terms of the relative size of the populations. An illustrative figure is that the dependency rate for older people in the EU-27 was 33.4% on 1 January 2023, which is 5.7% higher than the figure for the same measure on 1 January 2013, when it was 27.7% (Eurostat, 2024). In Spain, the national dependency rate for 2018 was 54.2%, which, in sociological terms, means that there is more potentially inactive population than people of working age. This indicator has increased by almost 15% since 2008 (Ministry of Territorial Policy and Public Function, 2024).
The combination of the dependency rates of older people and young people gives rise to the statistical measure or variable known as the total age dependency rate (calculated as the ratio of dependent people, young and old, in relation to the population considered to be of working age) (Eurostat, 2017)
The Dependency Rate of those over 64 years of age shows a slight, but constant or sustained rise, only interrupted during the years 2004-2010, having risen in global magnitudes by almost 60% between the time period between 1975 and the recent year 2023. This increase indicates or confirms the existence of a larger dependent population in this age segment, derived from demographic variables, such as the reduction in the Birth Rate and the sustained increase in life expectancy, as explained at the beginning of this work. According to INE projections, in 2052 the population over 64 years of age will constitute or represent 37% of the total population and the Dependency Rate will reach 68.2% in 2051 (INE, 2016). By 2023, the dependency rate will be, as can be seen in the graph below, 30.91%.
In summary, the analysis carried out up to this point shows a clear and notable trend towards the ageing of the Spanish population, driven, among many other factors - because it is a reality with multiple implications - by the decrease in the birth rate and the stability of the mortality rate, as has been pointed out in the numerical sections of this work.
This demographic and population reality brings with it important challenges, in terms of public policies and social planning, in order to increasingly consider the demographic, economic, health and well-being implications that come with population ageing. For a detailed explanation of the public policies applied to old age, the reader is referred to the work of Pérez Ortiz (1995).
In Chart 16 we present an analysis of the data on births, deaths, natural balance and migration balance, during the period from 1975 to 2022.
This graph clearly shows the sustained decline in the natural balance over time. The migratory balance, as an important source of demographic relief, has shown great variability throughout the period studied, depending on the different socio-economic circumstances.
As for births, a very significant downward trend is observed throughout the period taken into consideration, from 669,378 births in 1975 - the illustrative year of the baby boom - to 329,251 in 2022. It should be noted that there is a slight increase between 2000 and 2008, but its figure is far from the values reached in times of boom in births. On the contrary, deaths show an upward trend.
Demographically speaking, Spain has gone through different stages in recent decades, undergoing a transformation in its demographic profiles. As mentioned, there was a move from a great "baby boom", which provides youth to a country or territory, to a demographic process of increasing hyper-ageing, even considering the demographic relief brought about by migration figures. The reader is referred to the works of Conde-Ruiz and González (2010) and González Martínez (2013) for further information on the impact of immigration in Spain. This is because immigrant families (especially those from certain origins) have a higher proportion of births at earlier ages. However, it is also true that, in times of great crisis, such as those suffered by Spanish society recently, they tend to return to their countries of origin.
Spain today has one of the lowest fertility rates in the European Union, partly due to the delay in the age of motherhood. It also has one of the highest life expectancies of the countries that make up the OECD, which has greatly transformed the structure of the Spanish population pyramid (Conde-Ruiz and González, 2021: 1-29). In addition to this reality, it should be noted that this progressive process of hyper-aging will continue until 2050, when, according to Conde-Ruiz and González (2021), the population dependency rate will double, practically.

4. Discussion

Preliminary Issues

In a sociological analysis of ageing, it is essential to consider a multiplicity of variables and also to adhere to demographic projections, which are very useful for drawing or outlining, even approximately, what the evolution of the magnitudes referring to the population of Spain will be, always taking into consideration the fulfillment of certain assumptions. These forecasts are essential because they allow, among other exercises, to simulate what issues of deep social significance will entail, such as pension expenditure or the fluctuations that the GDP could foreseeably have (González Martínez, 2019).
If we analyze, based on these projections, what will happen with the demographic magnitudes studied in this work, such as fertility, mortality and the migratory balance, we will be able to estimate what may happen with the total population and how the ageing process, the subject of this article, will be shaped.
In the case of Spain, we have the projections prepared by the National Institute of Statistics (INE, various years), EUROSTAT (EUROSTAT, various years) and AIReF (Conde Ruiz and González, 2021). Following Conde Ruiz and González (2021), the projections of these institutions cover the following periods: in the INE, the time frame goes from 2020 to 2070, in AIReF, from 2020 to 2050 and, finally, in Eurostat from 2020 to a future year. It is important to understand that these institutions make the projections with different methodologies (Conde-Ruiz and González, 2019 and 2021), an issue that must be taken into account when making possible comparisons. On the other hand, the INE (various years) and the AIReF (Conde Ruiz and González, 2021) have considered in their analysis the impact of COVID-19 on population profiles. As Conde-Ruiz and González (2021) point out, the year 2050 is the most appropriate when establishing a point of comparison since in that year the results are available for the three institutions analyzed.

Fecundity

In relation to the fecundity rate, the following graph shows a situation very far from the reference replacement value, as indicated in the previous sections of the work.

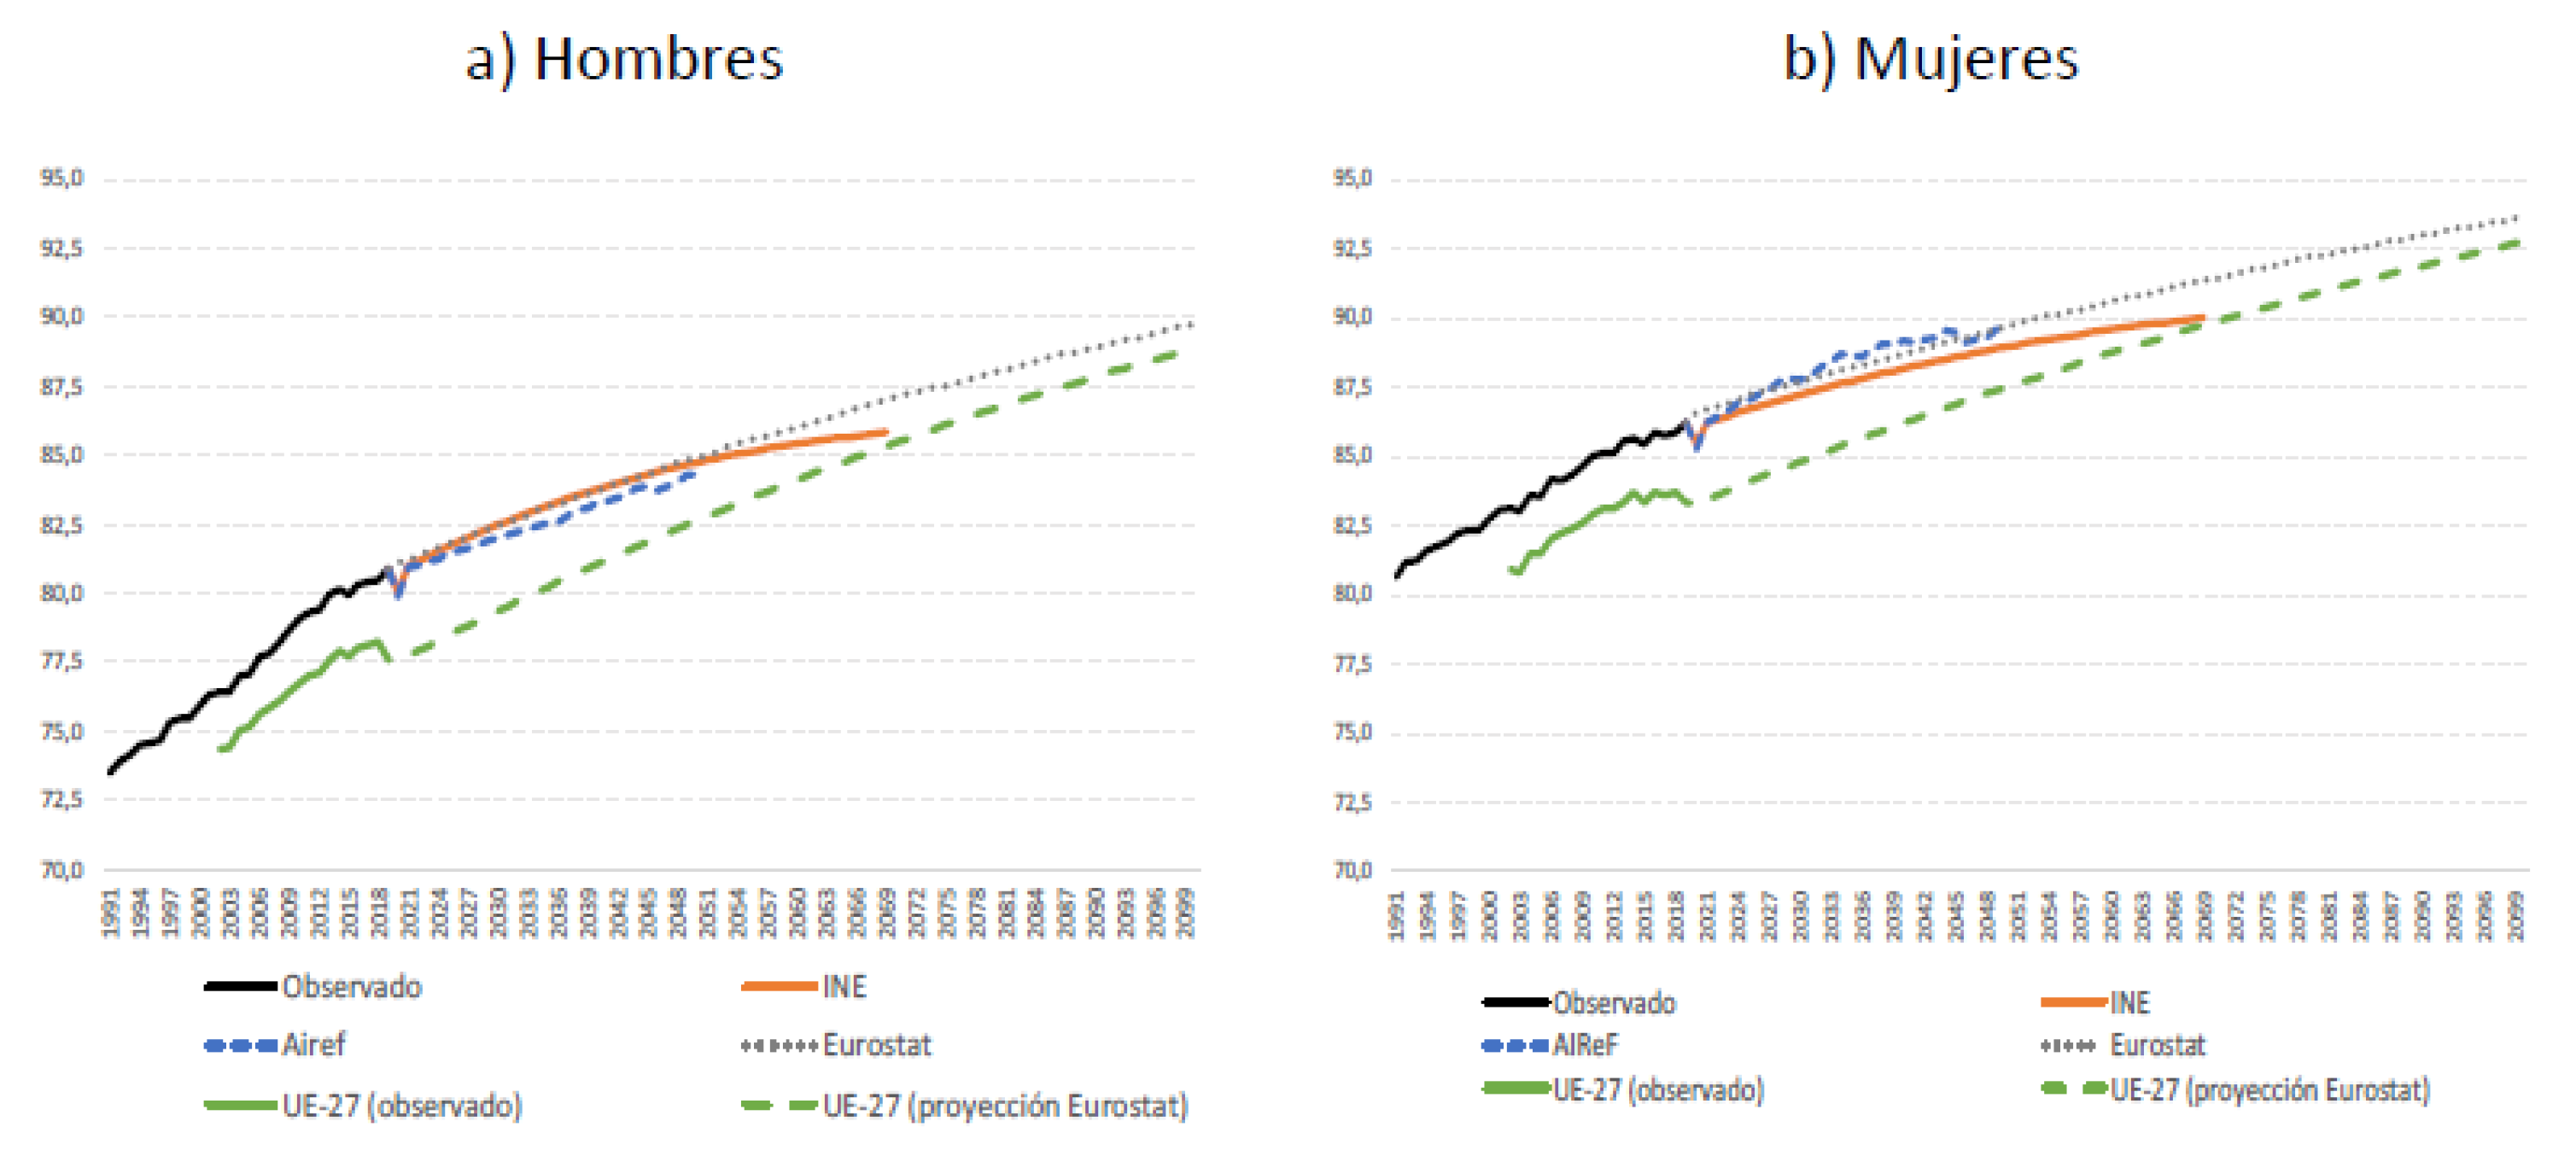
Mortality and Life Expectancy
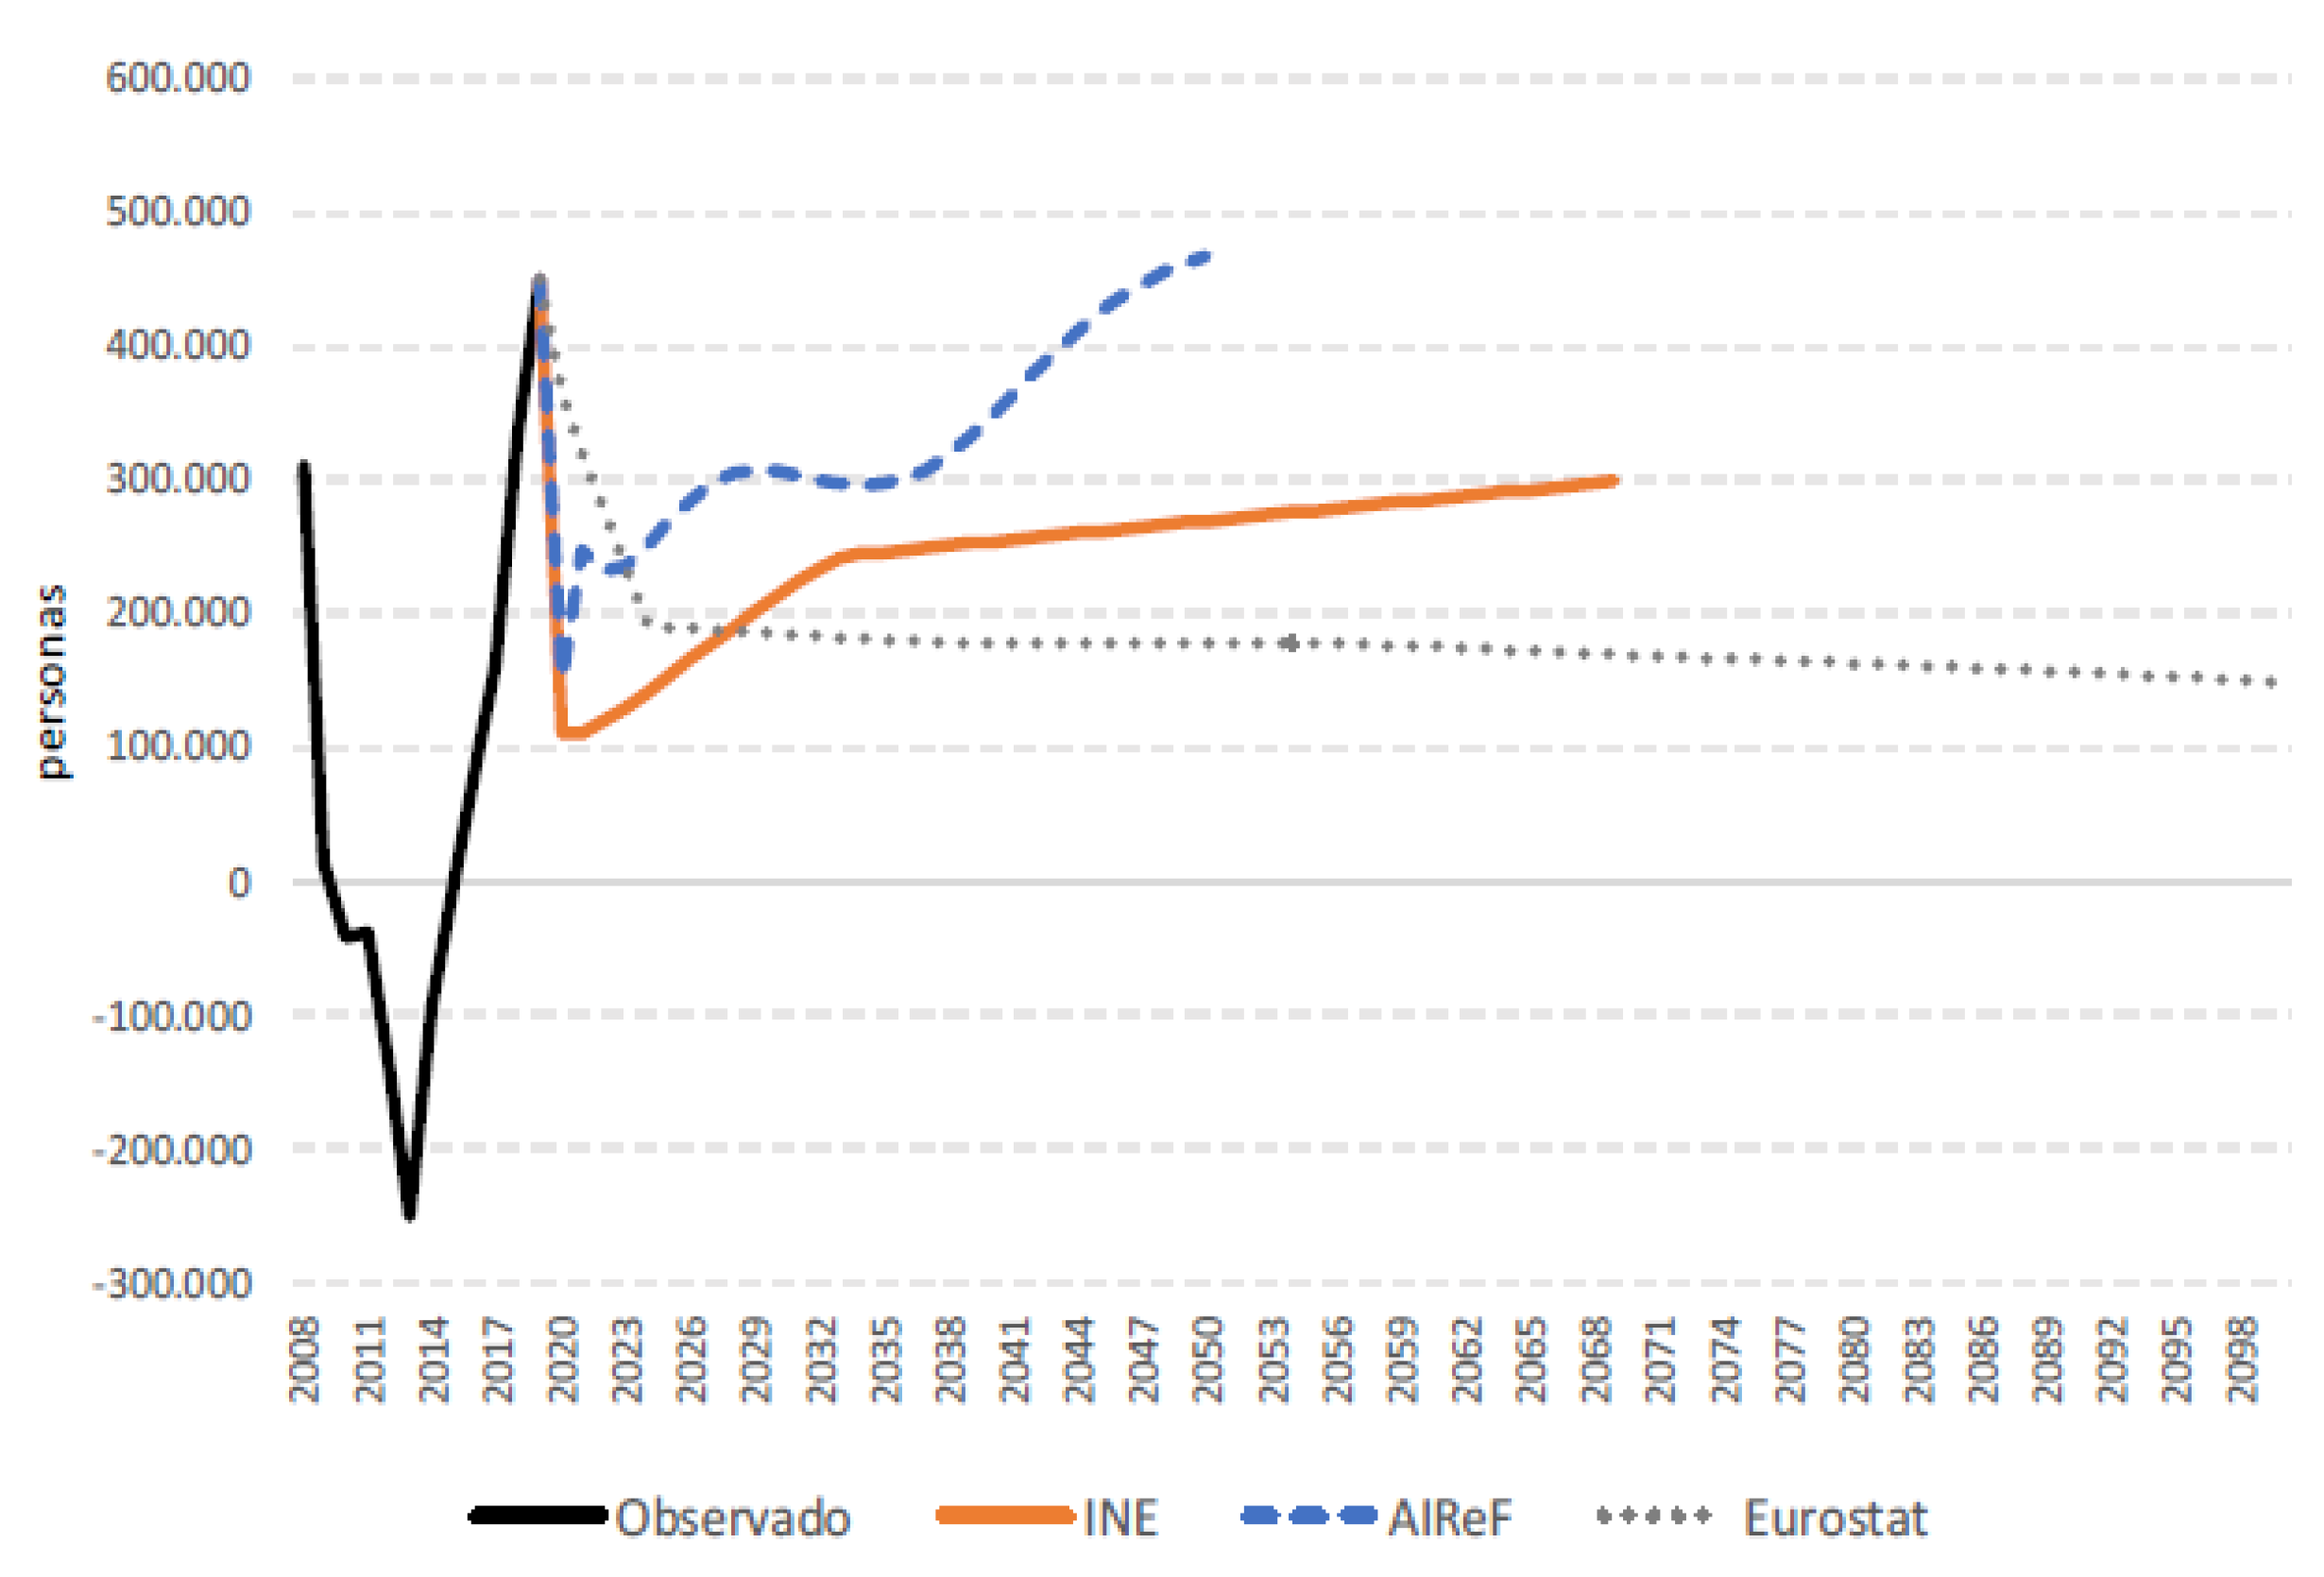
For life expectancy at birth, projections indicate a continued and sustained increase for both men and women. Both life expectancies are above the EU-27 average.
Figure 18. Projections of life expectancy at birth.
Preprints 142691 g018

Net Migration Flows

As regards net migration flows, it should be noted that this is the variable in which the most significant differences are perceived between the three scenarios projected by the different institutions. As shown in the graph below, Spain would be, compared to the rest of the European countries, among the countries with the highest and most significant share of accumulated net migration flows until 2050. (Conde-Ruiz y González, 2021).
Figure 19. Projections of net migration flows.
Preprints 142691 g019
The accumulated net migration flows for the period 2020-2050 are presented in Chart 20. (Conde-Ruiz y González, 2021).

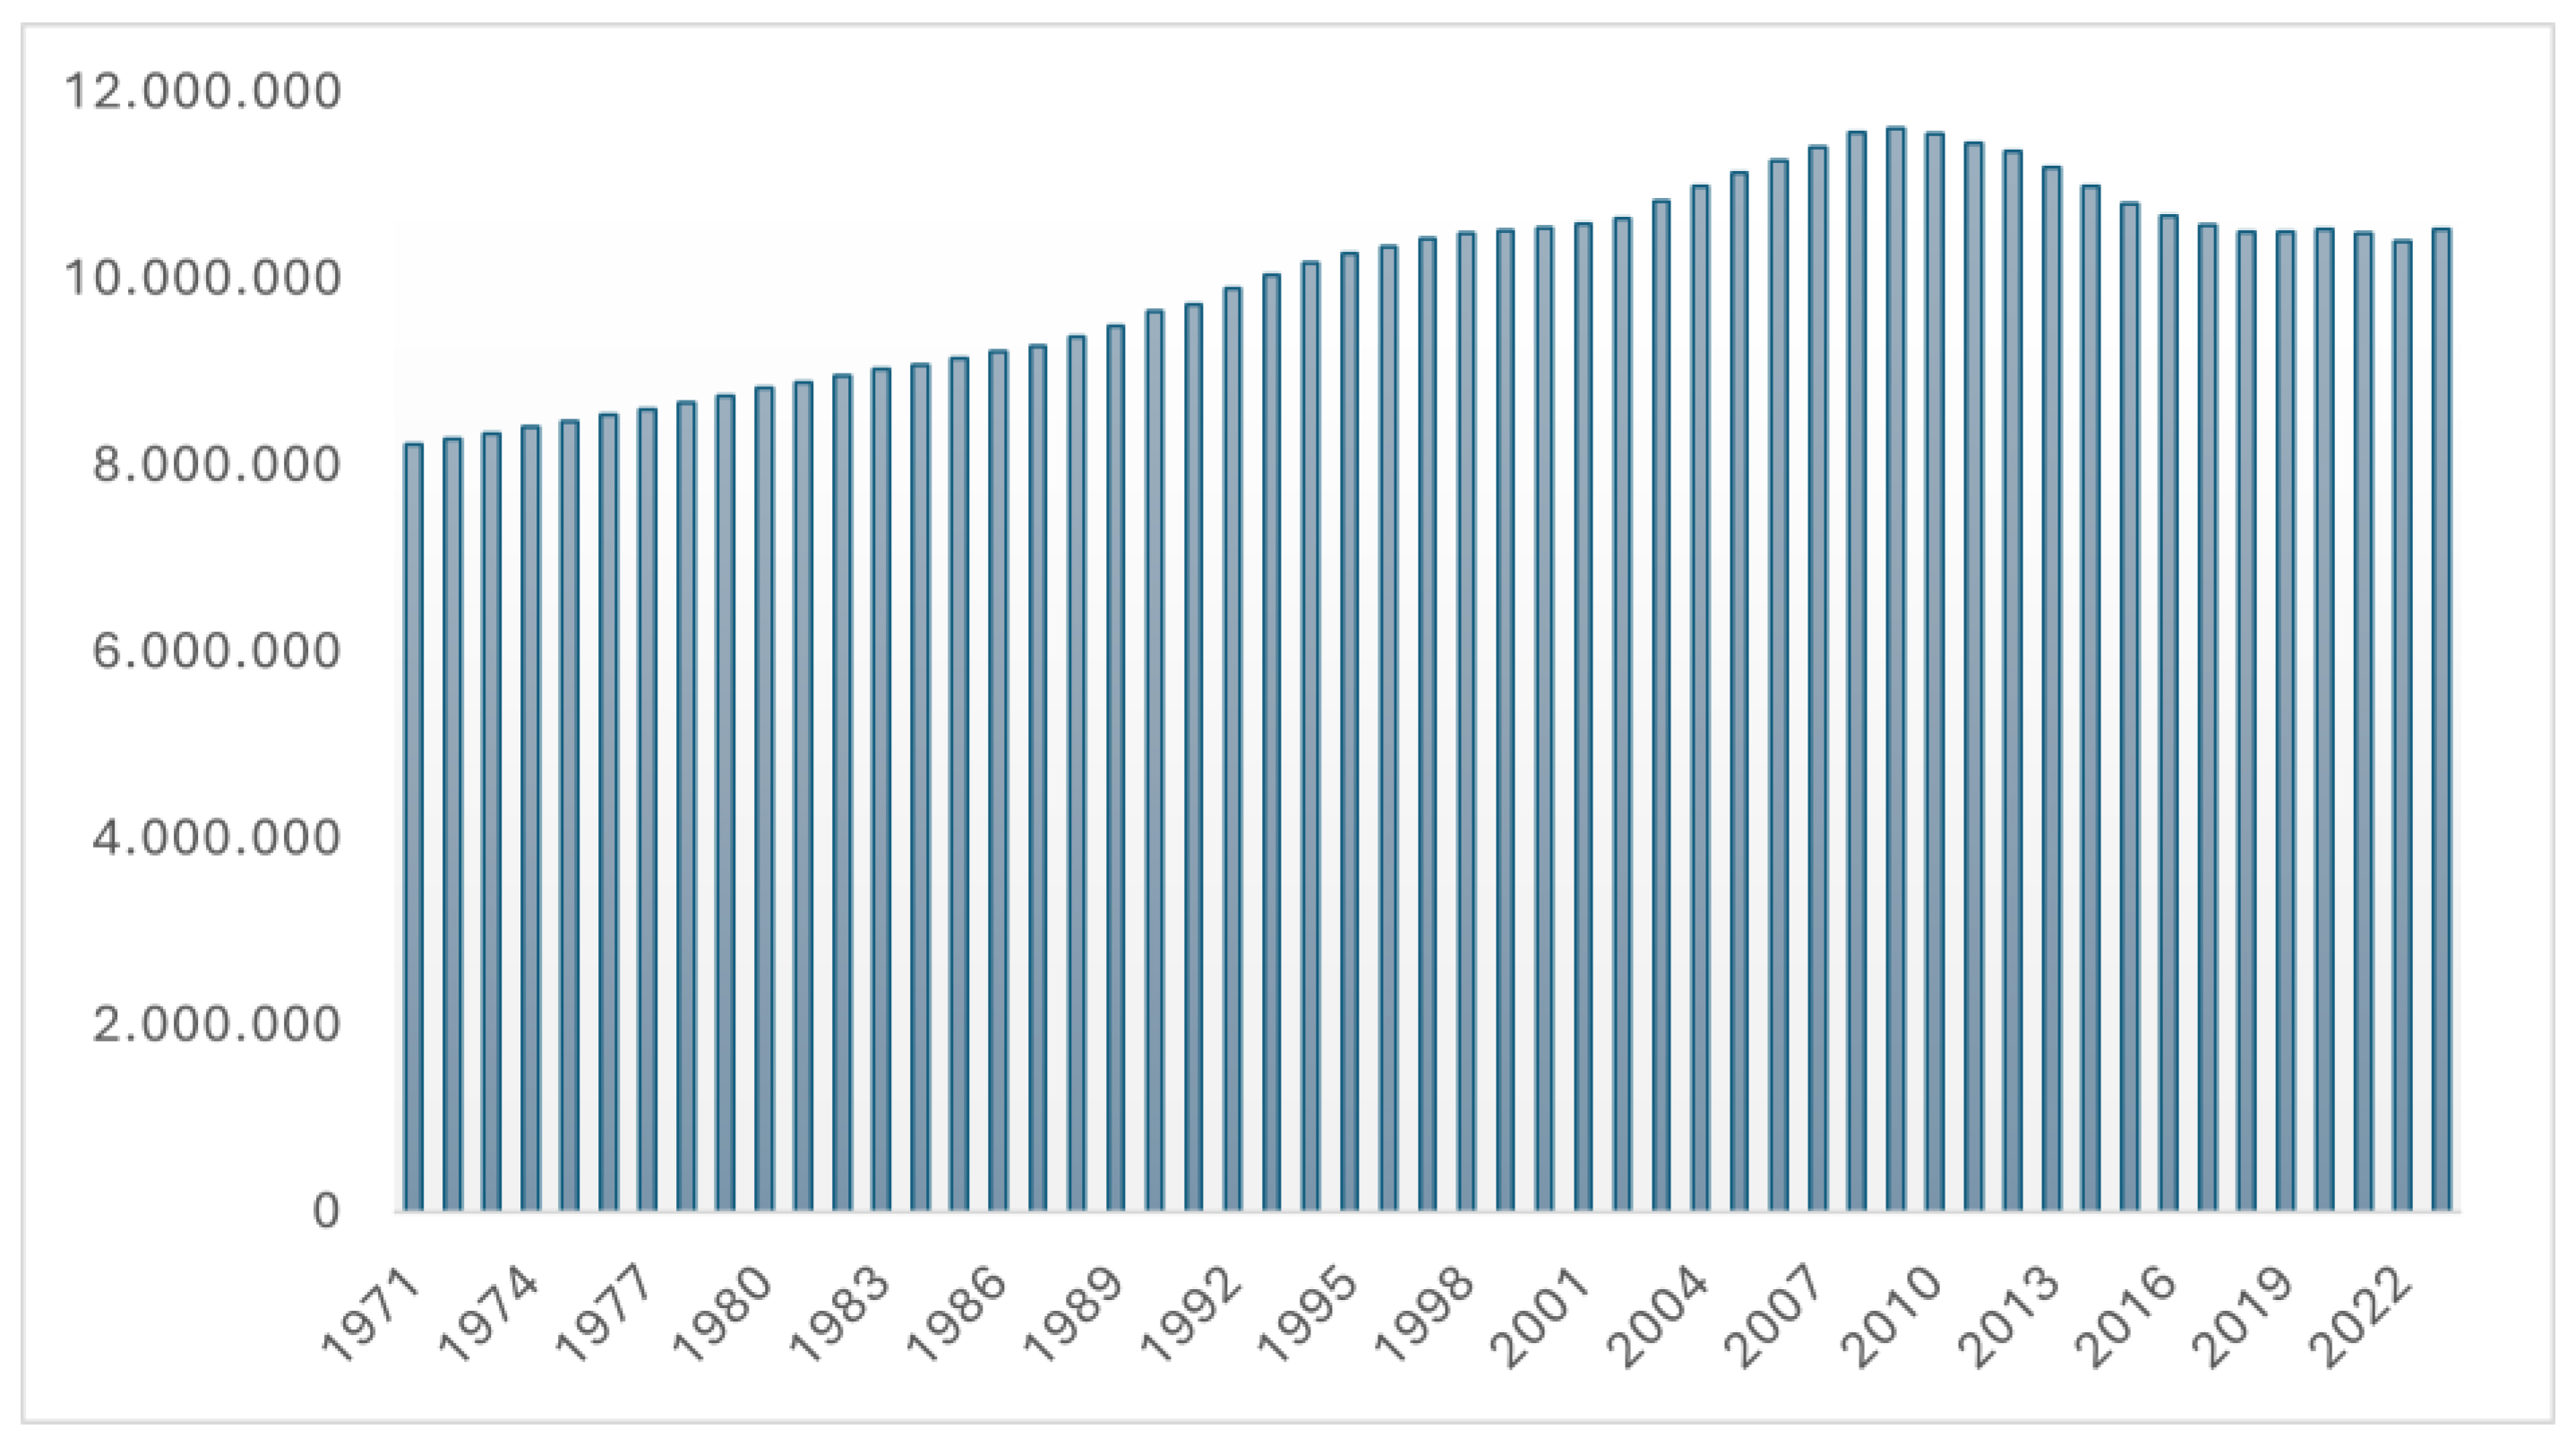
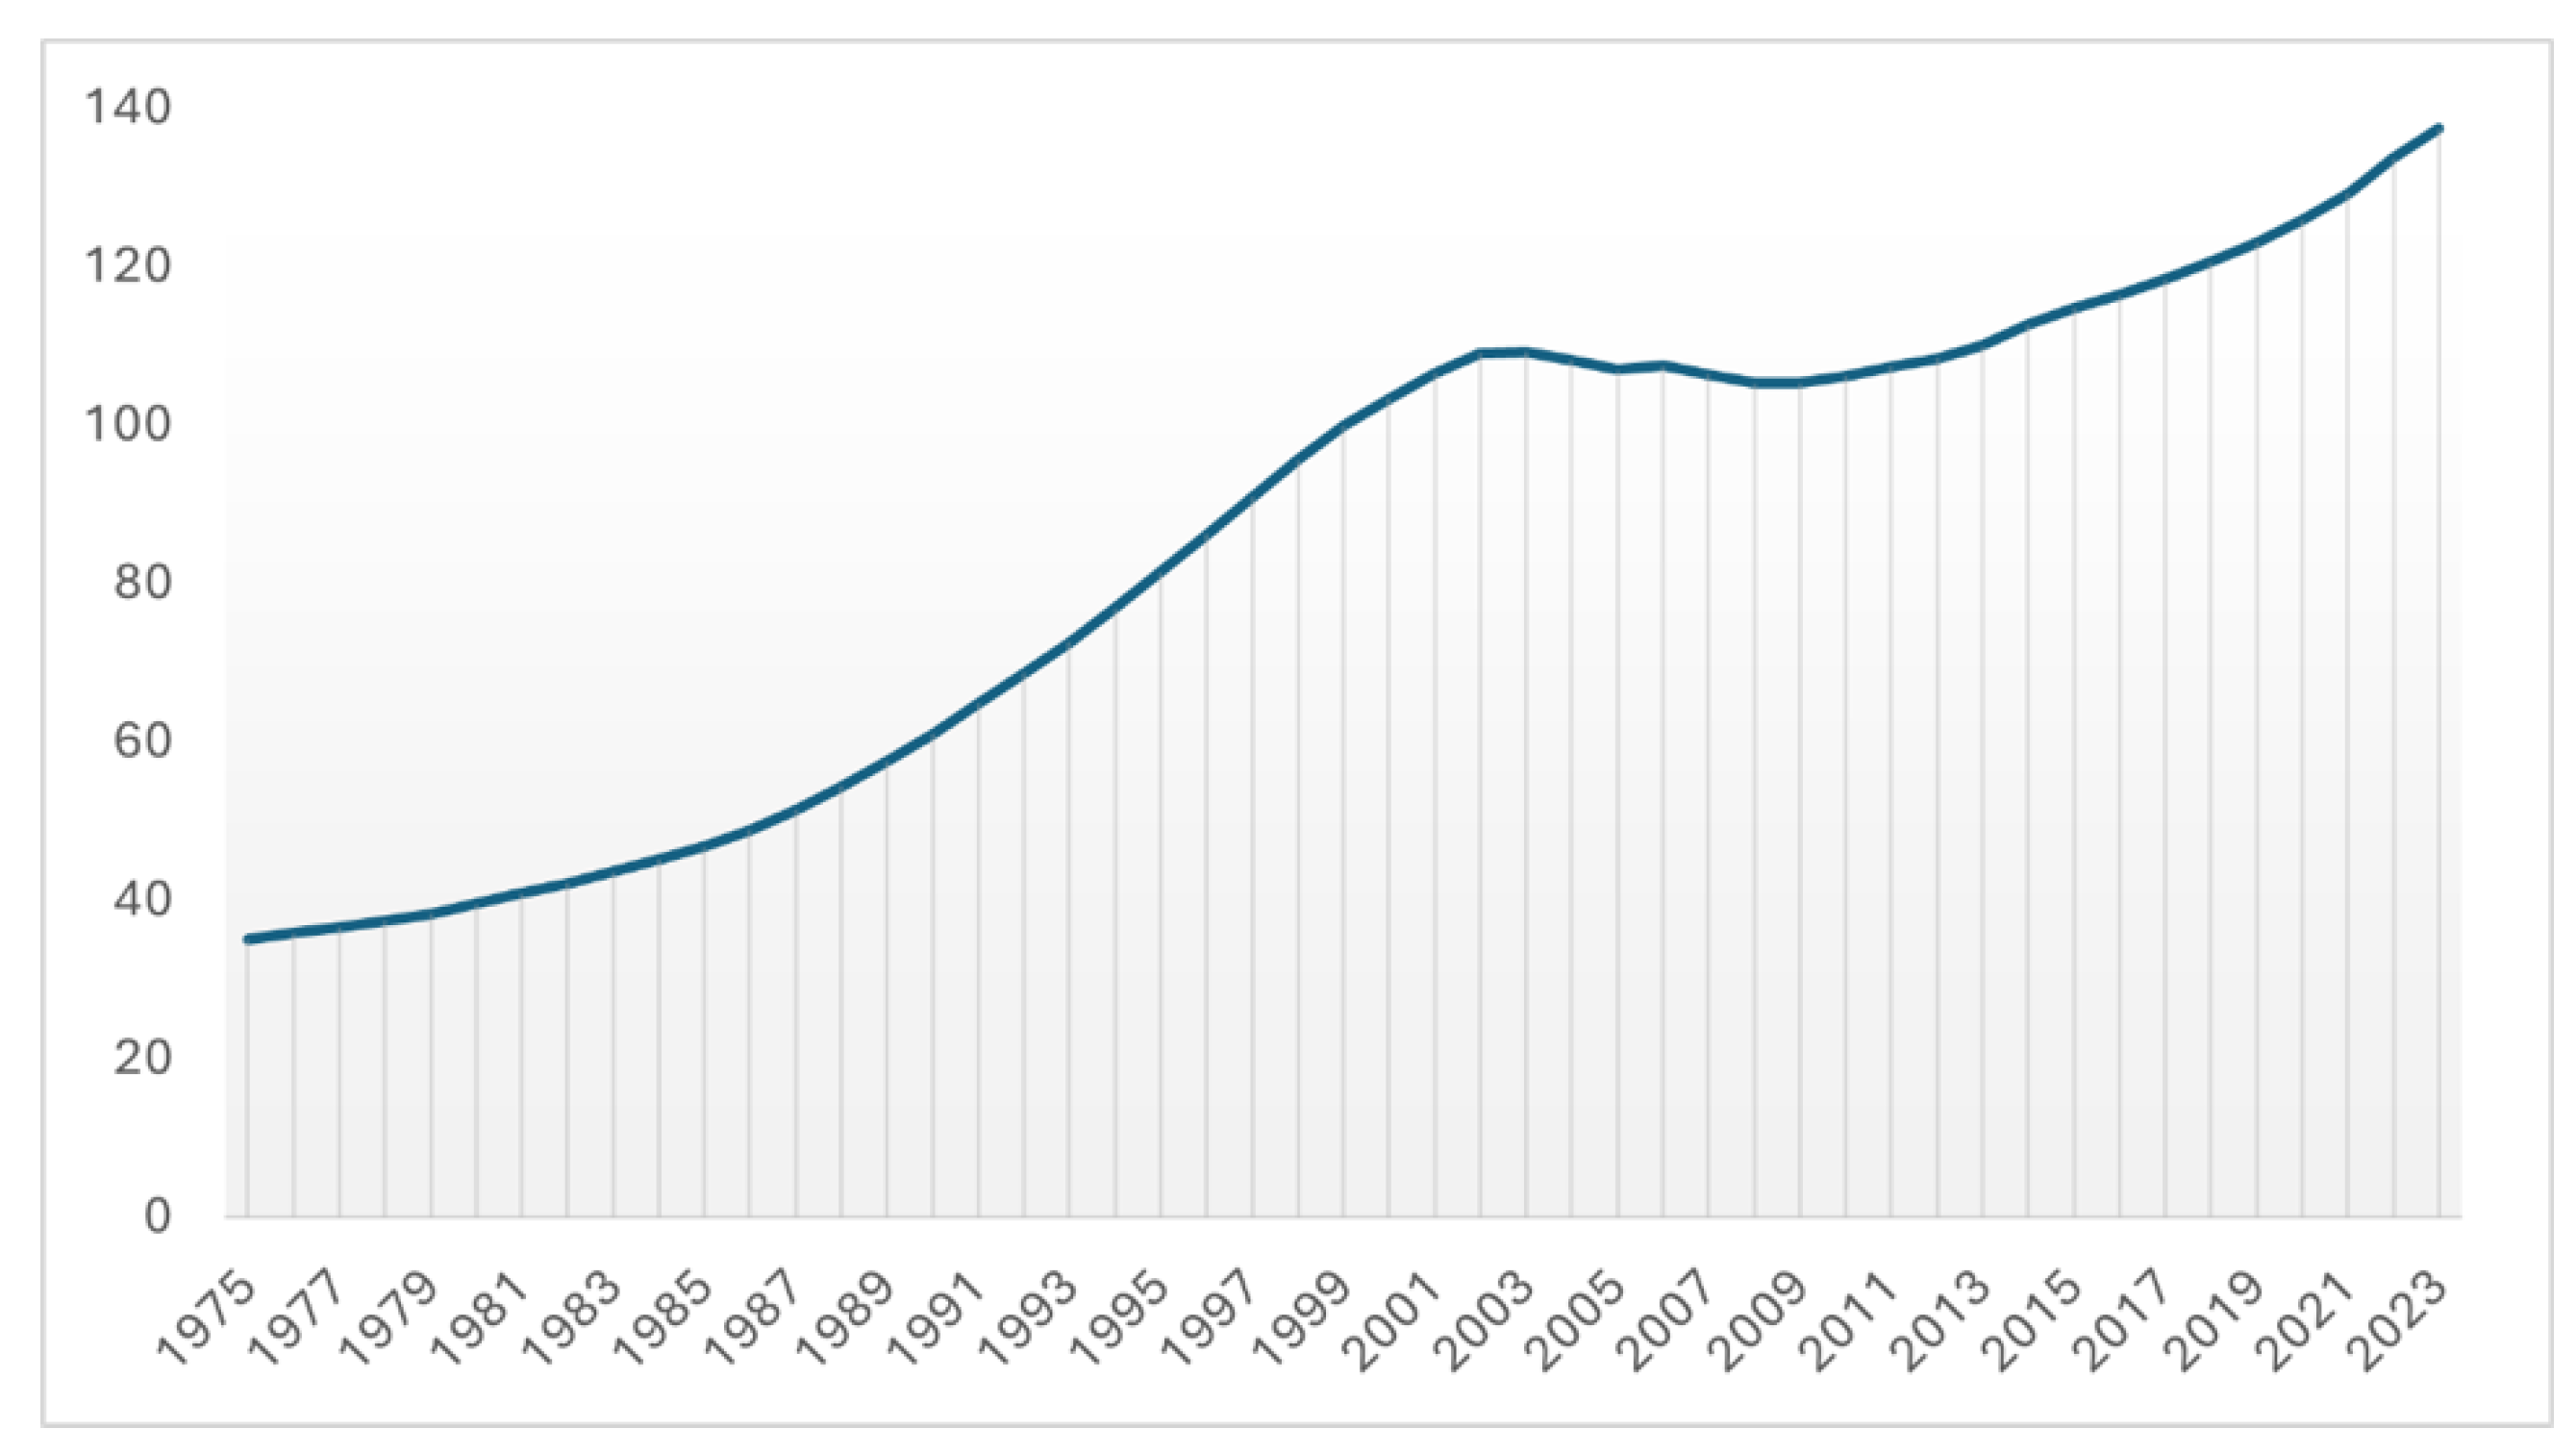
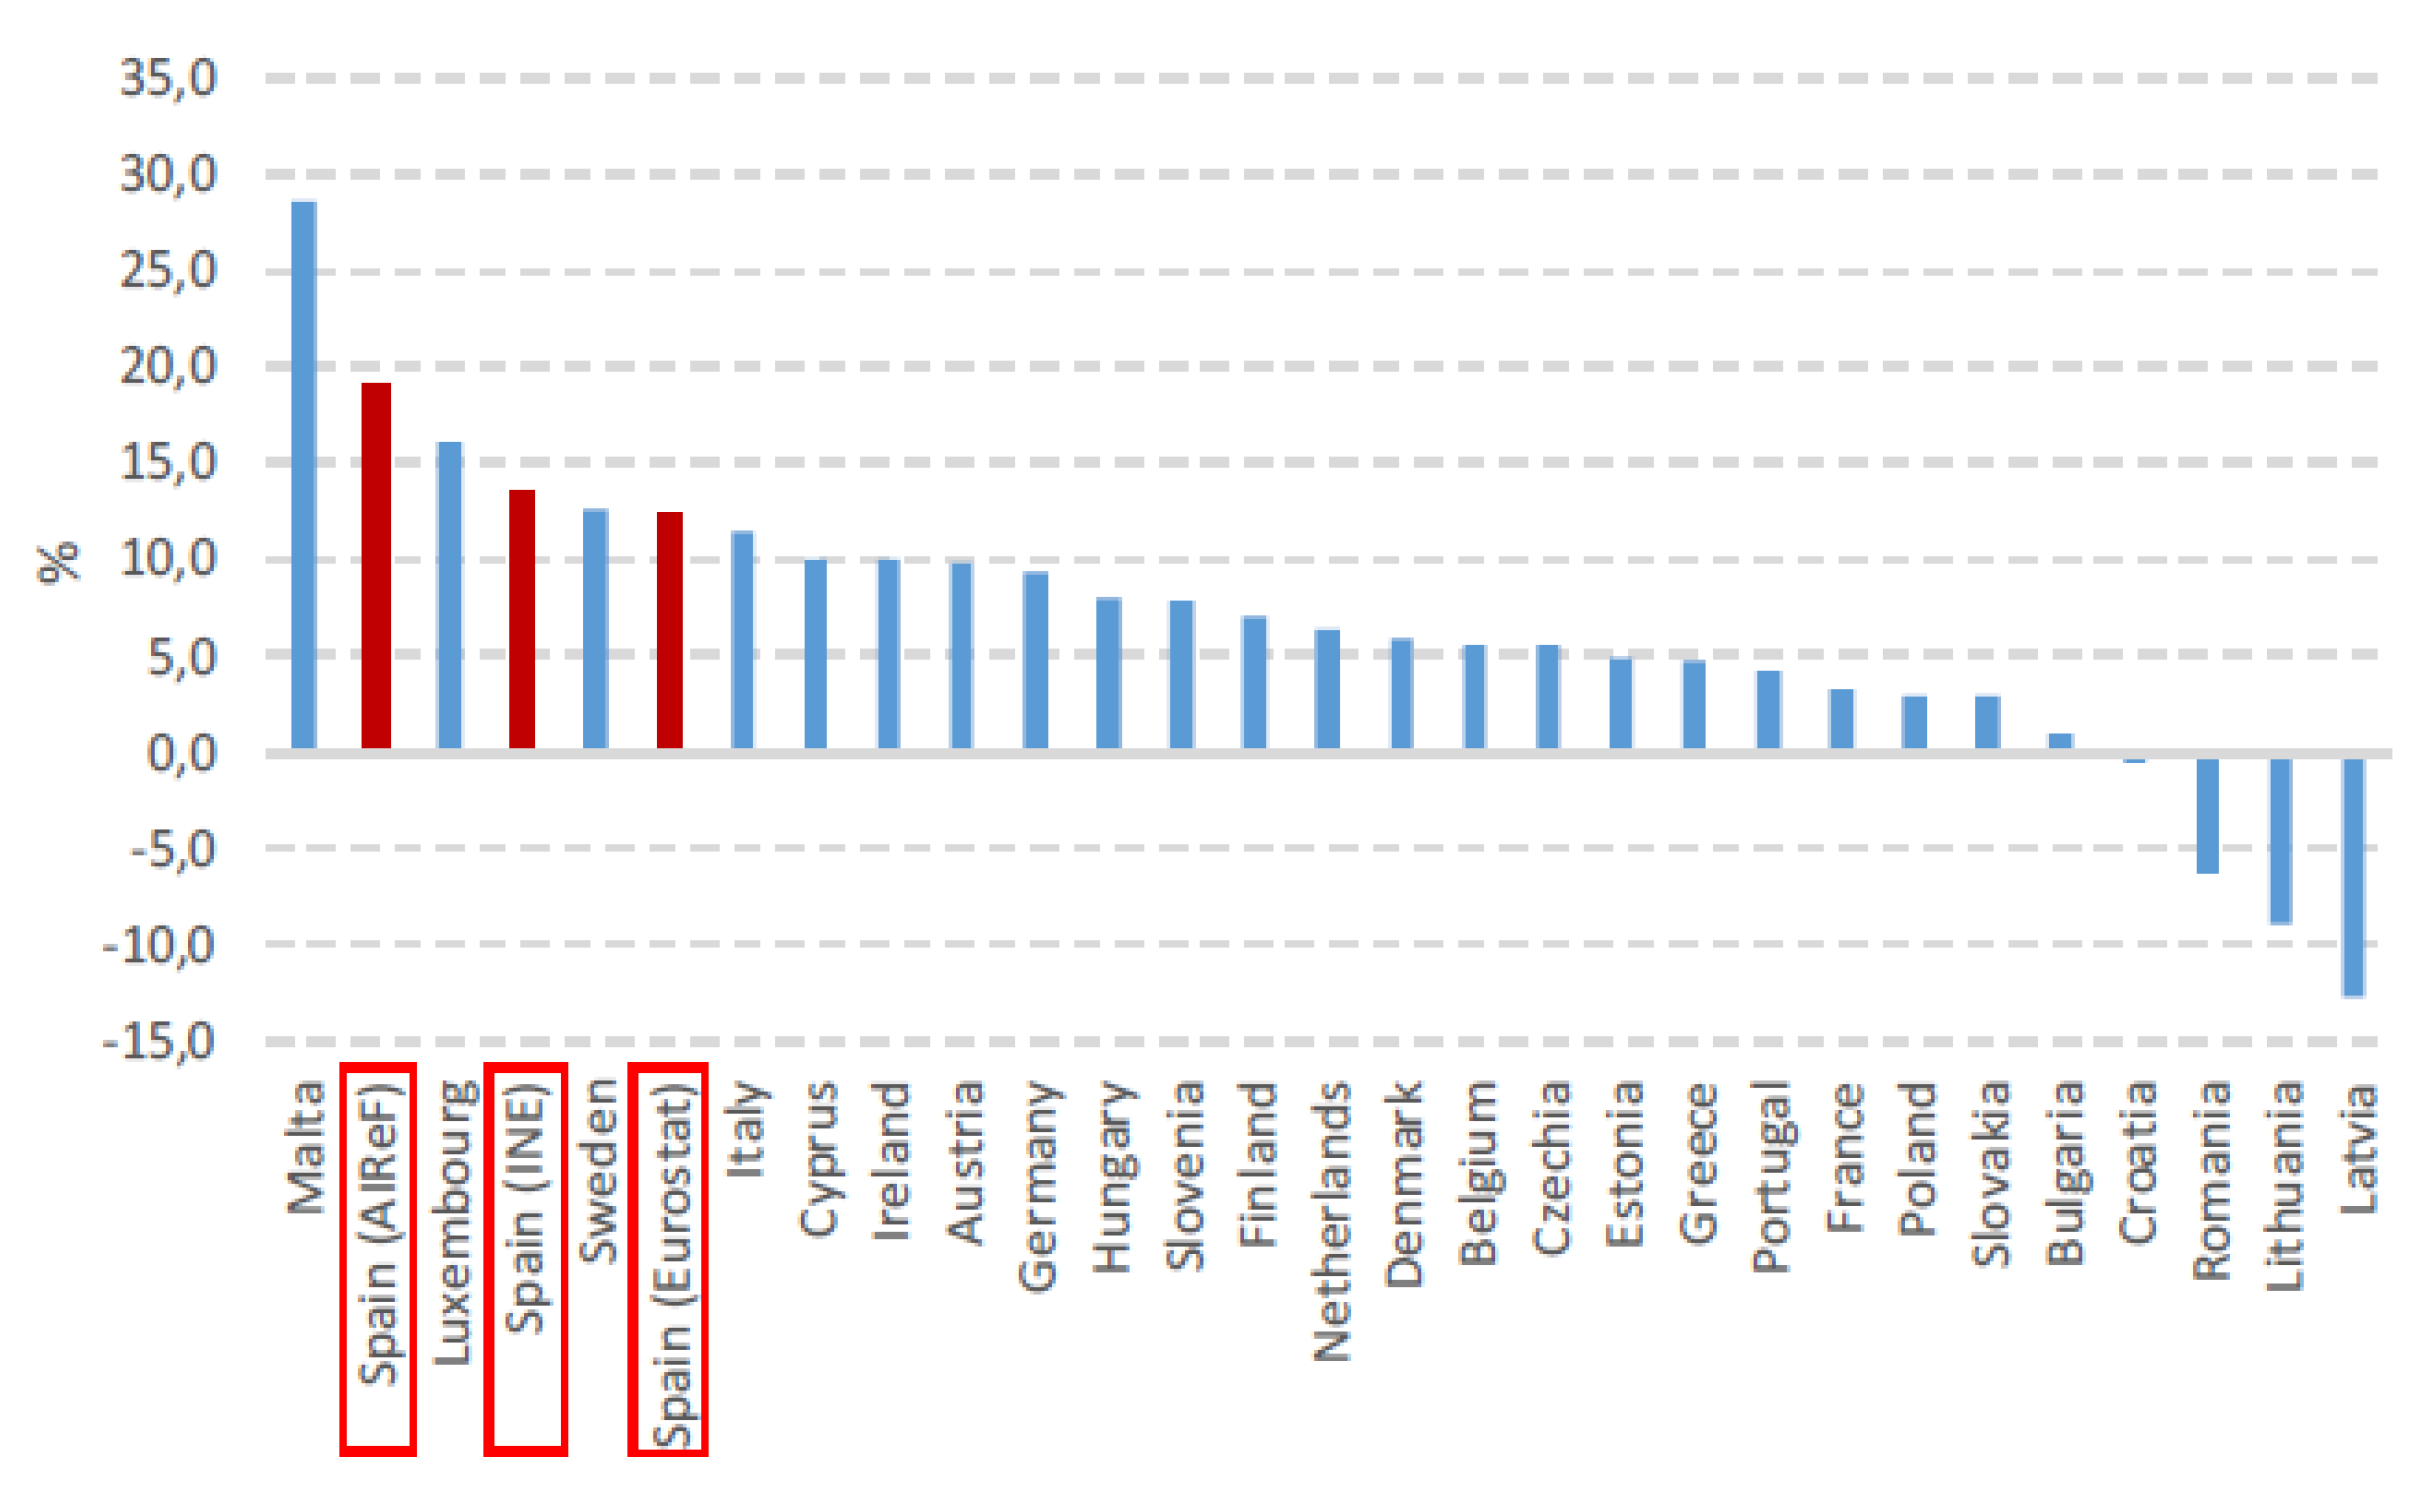
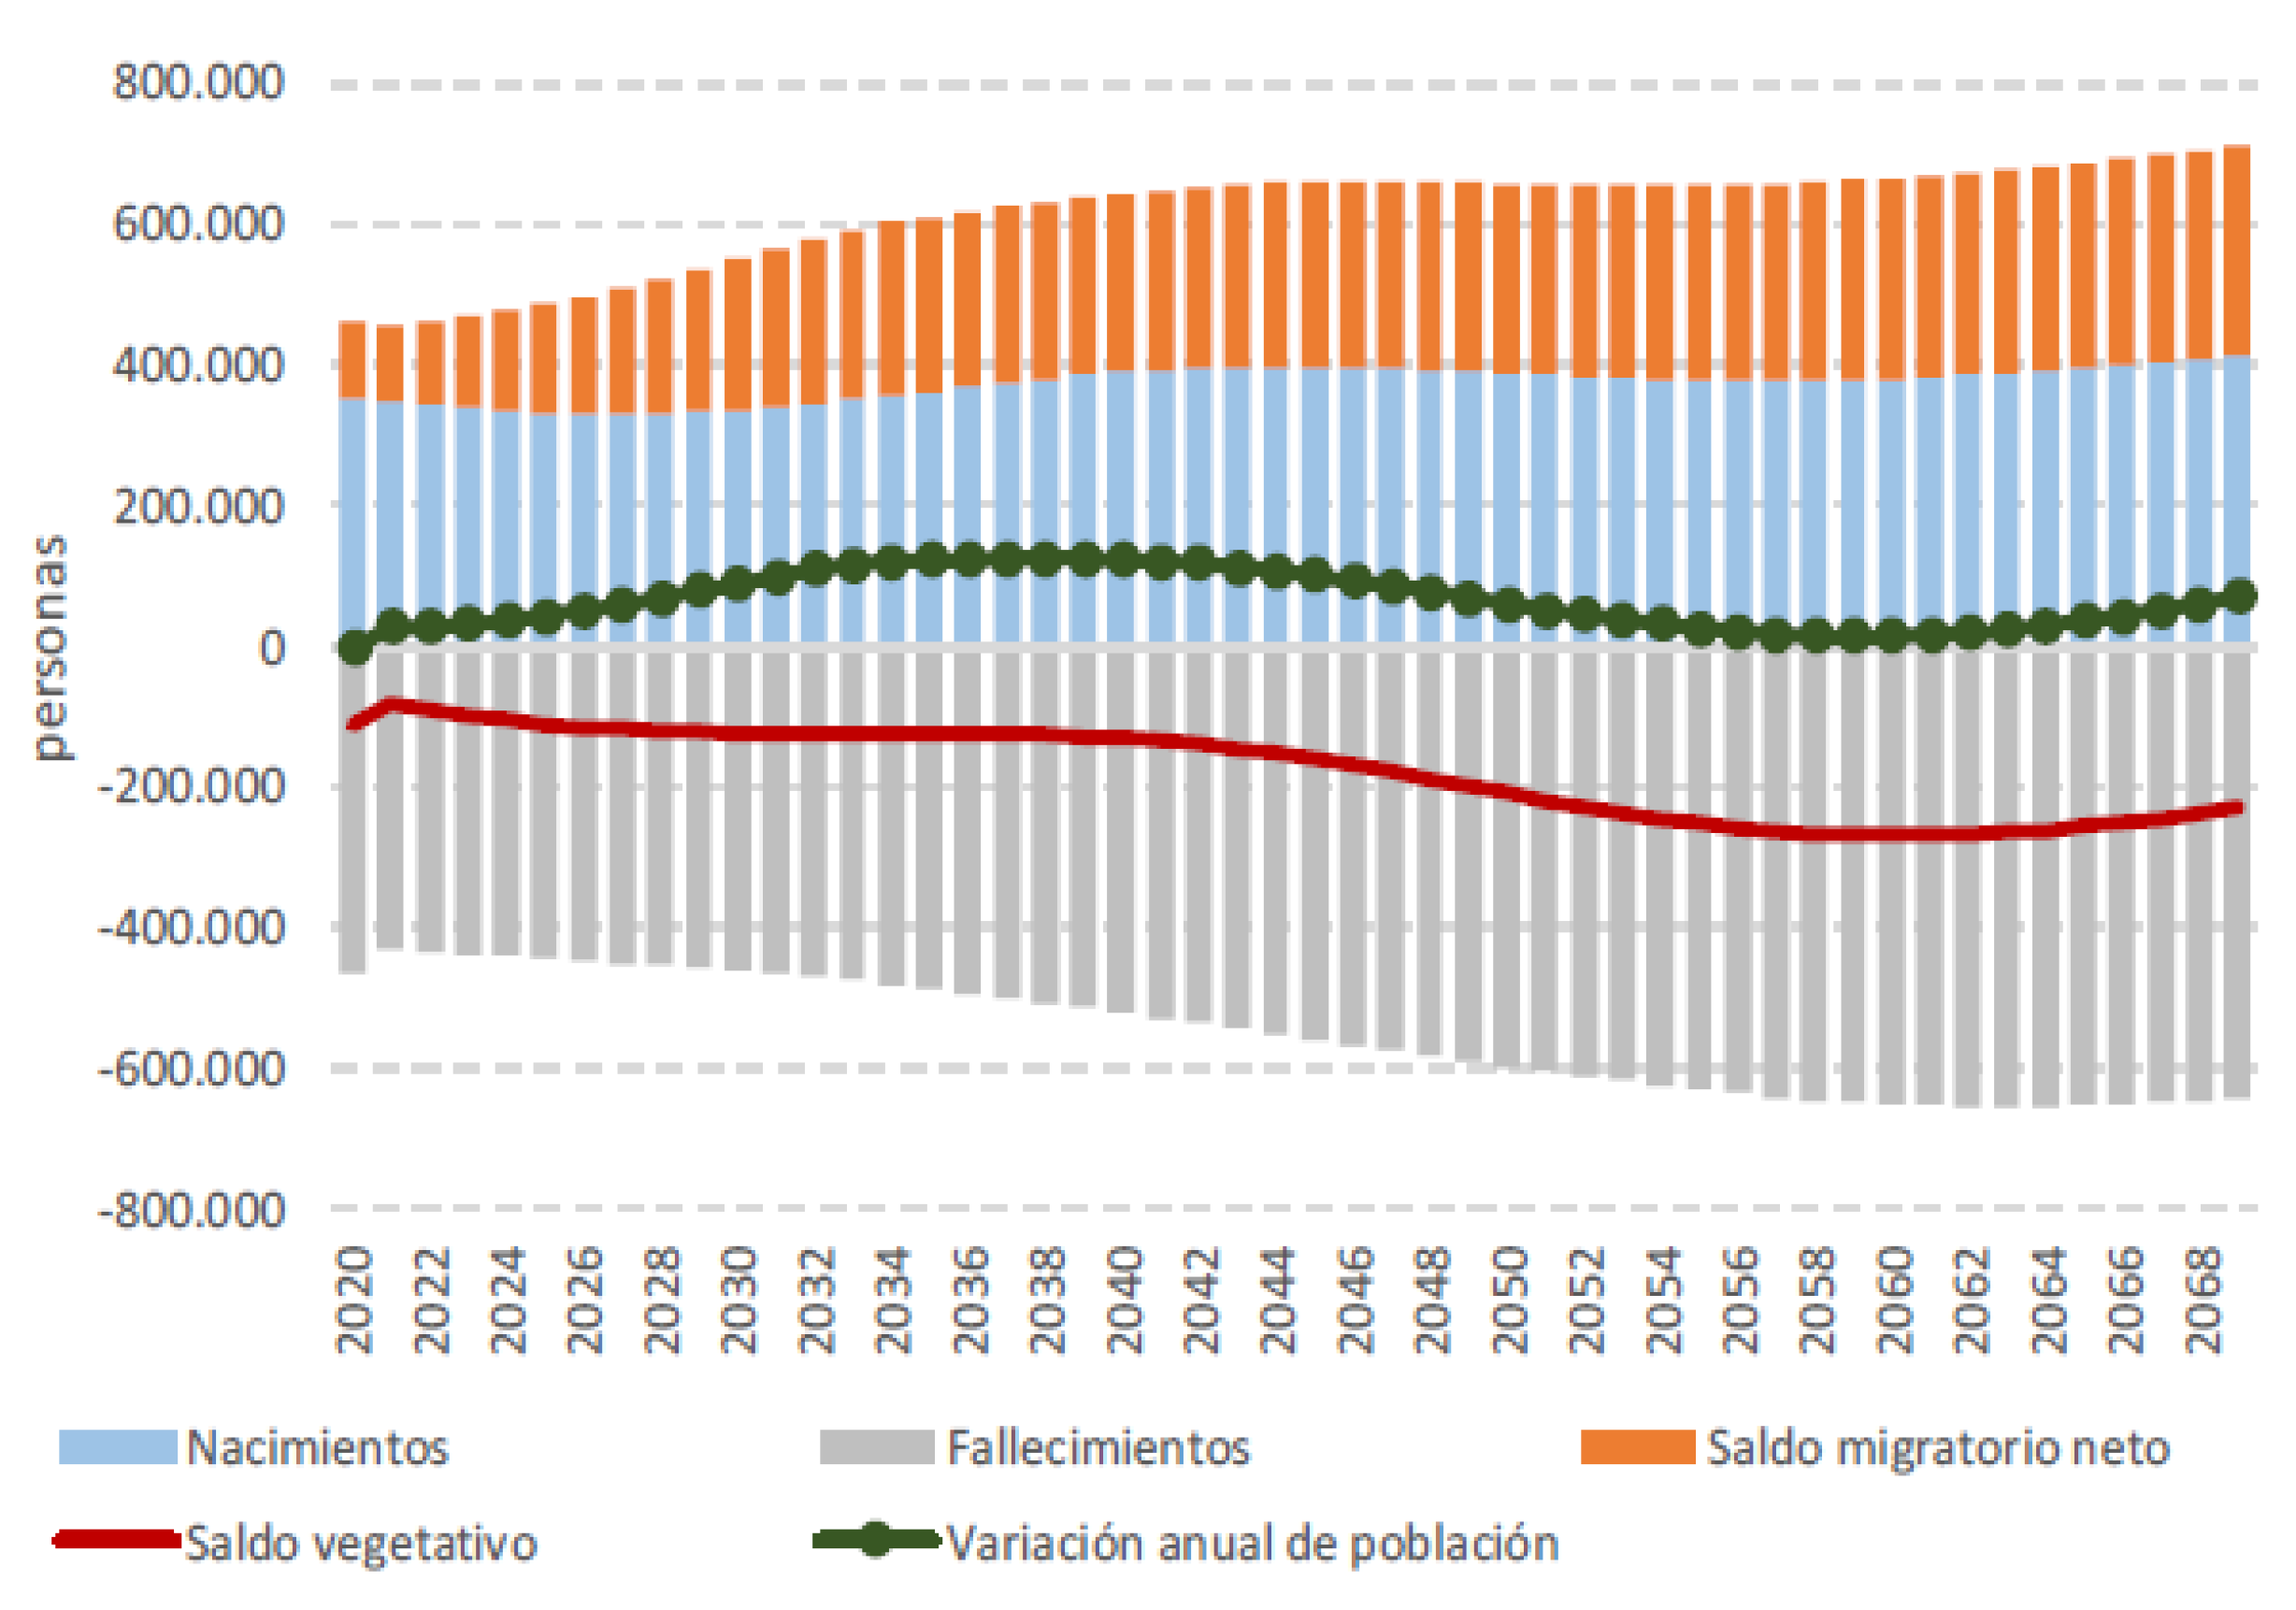
Projection of Total Population
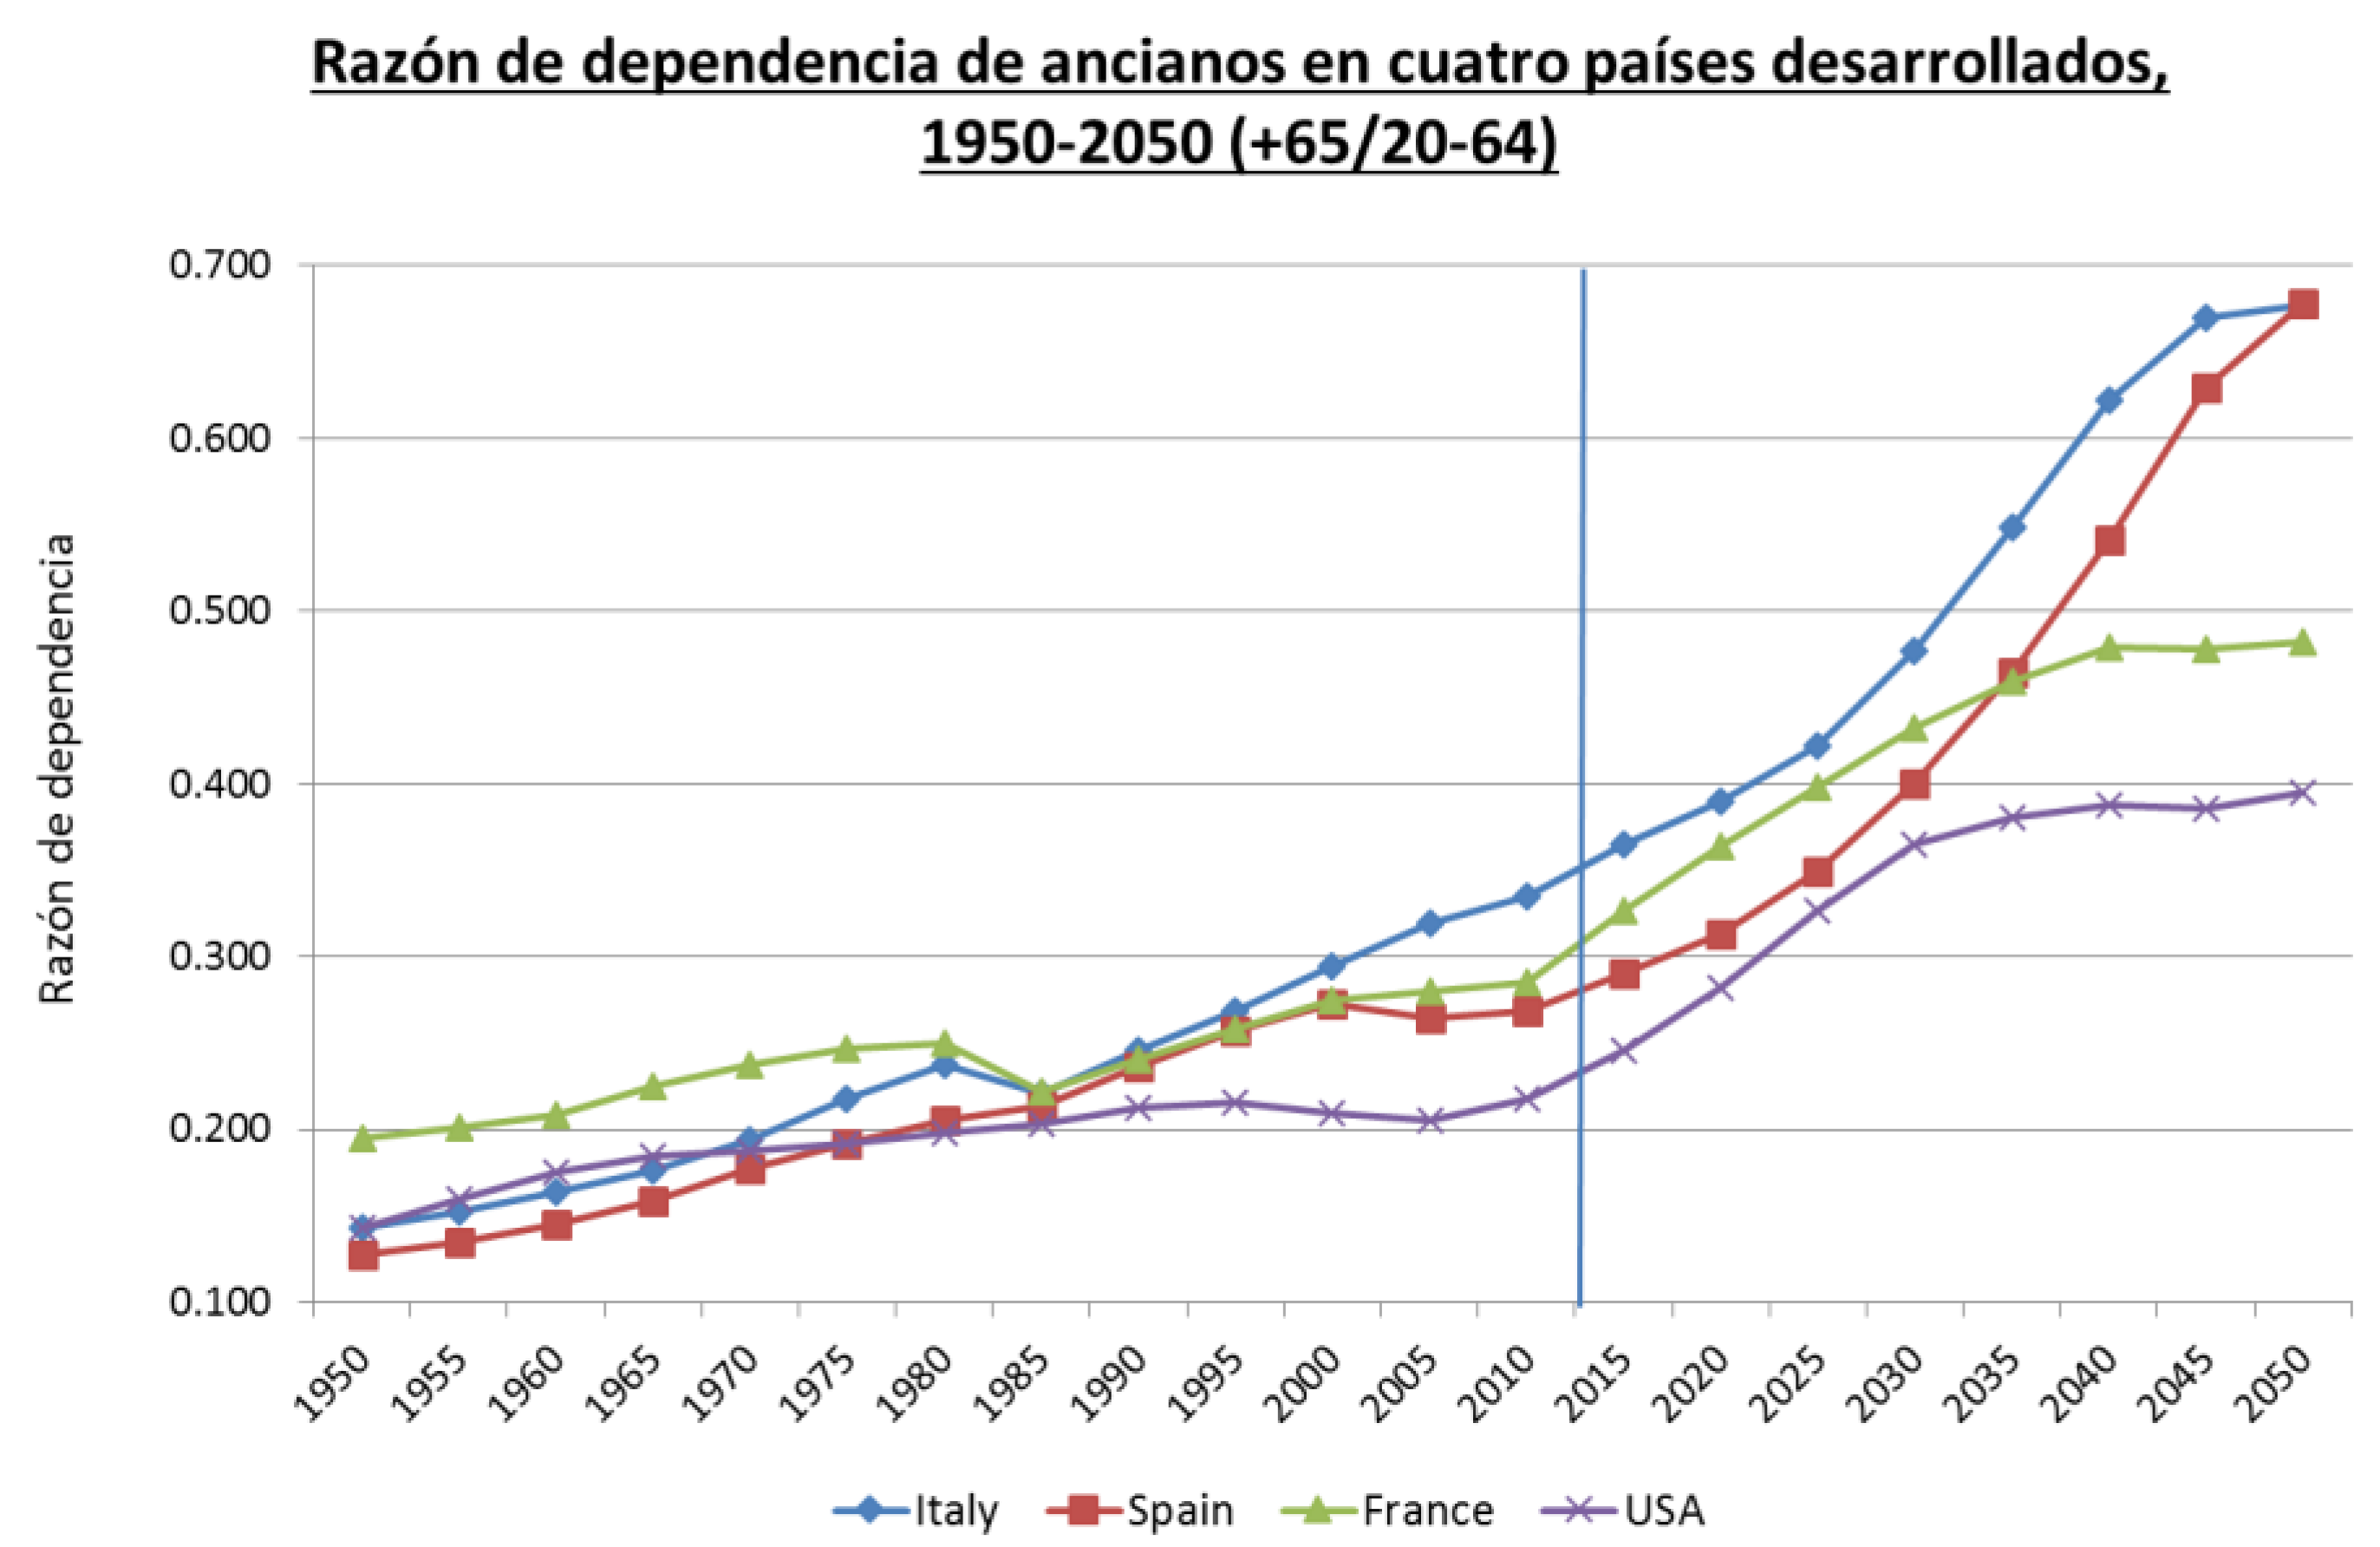
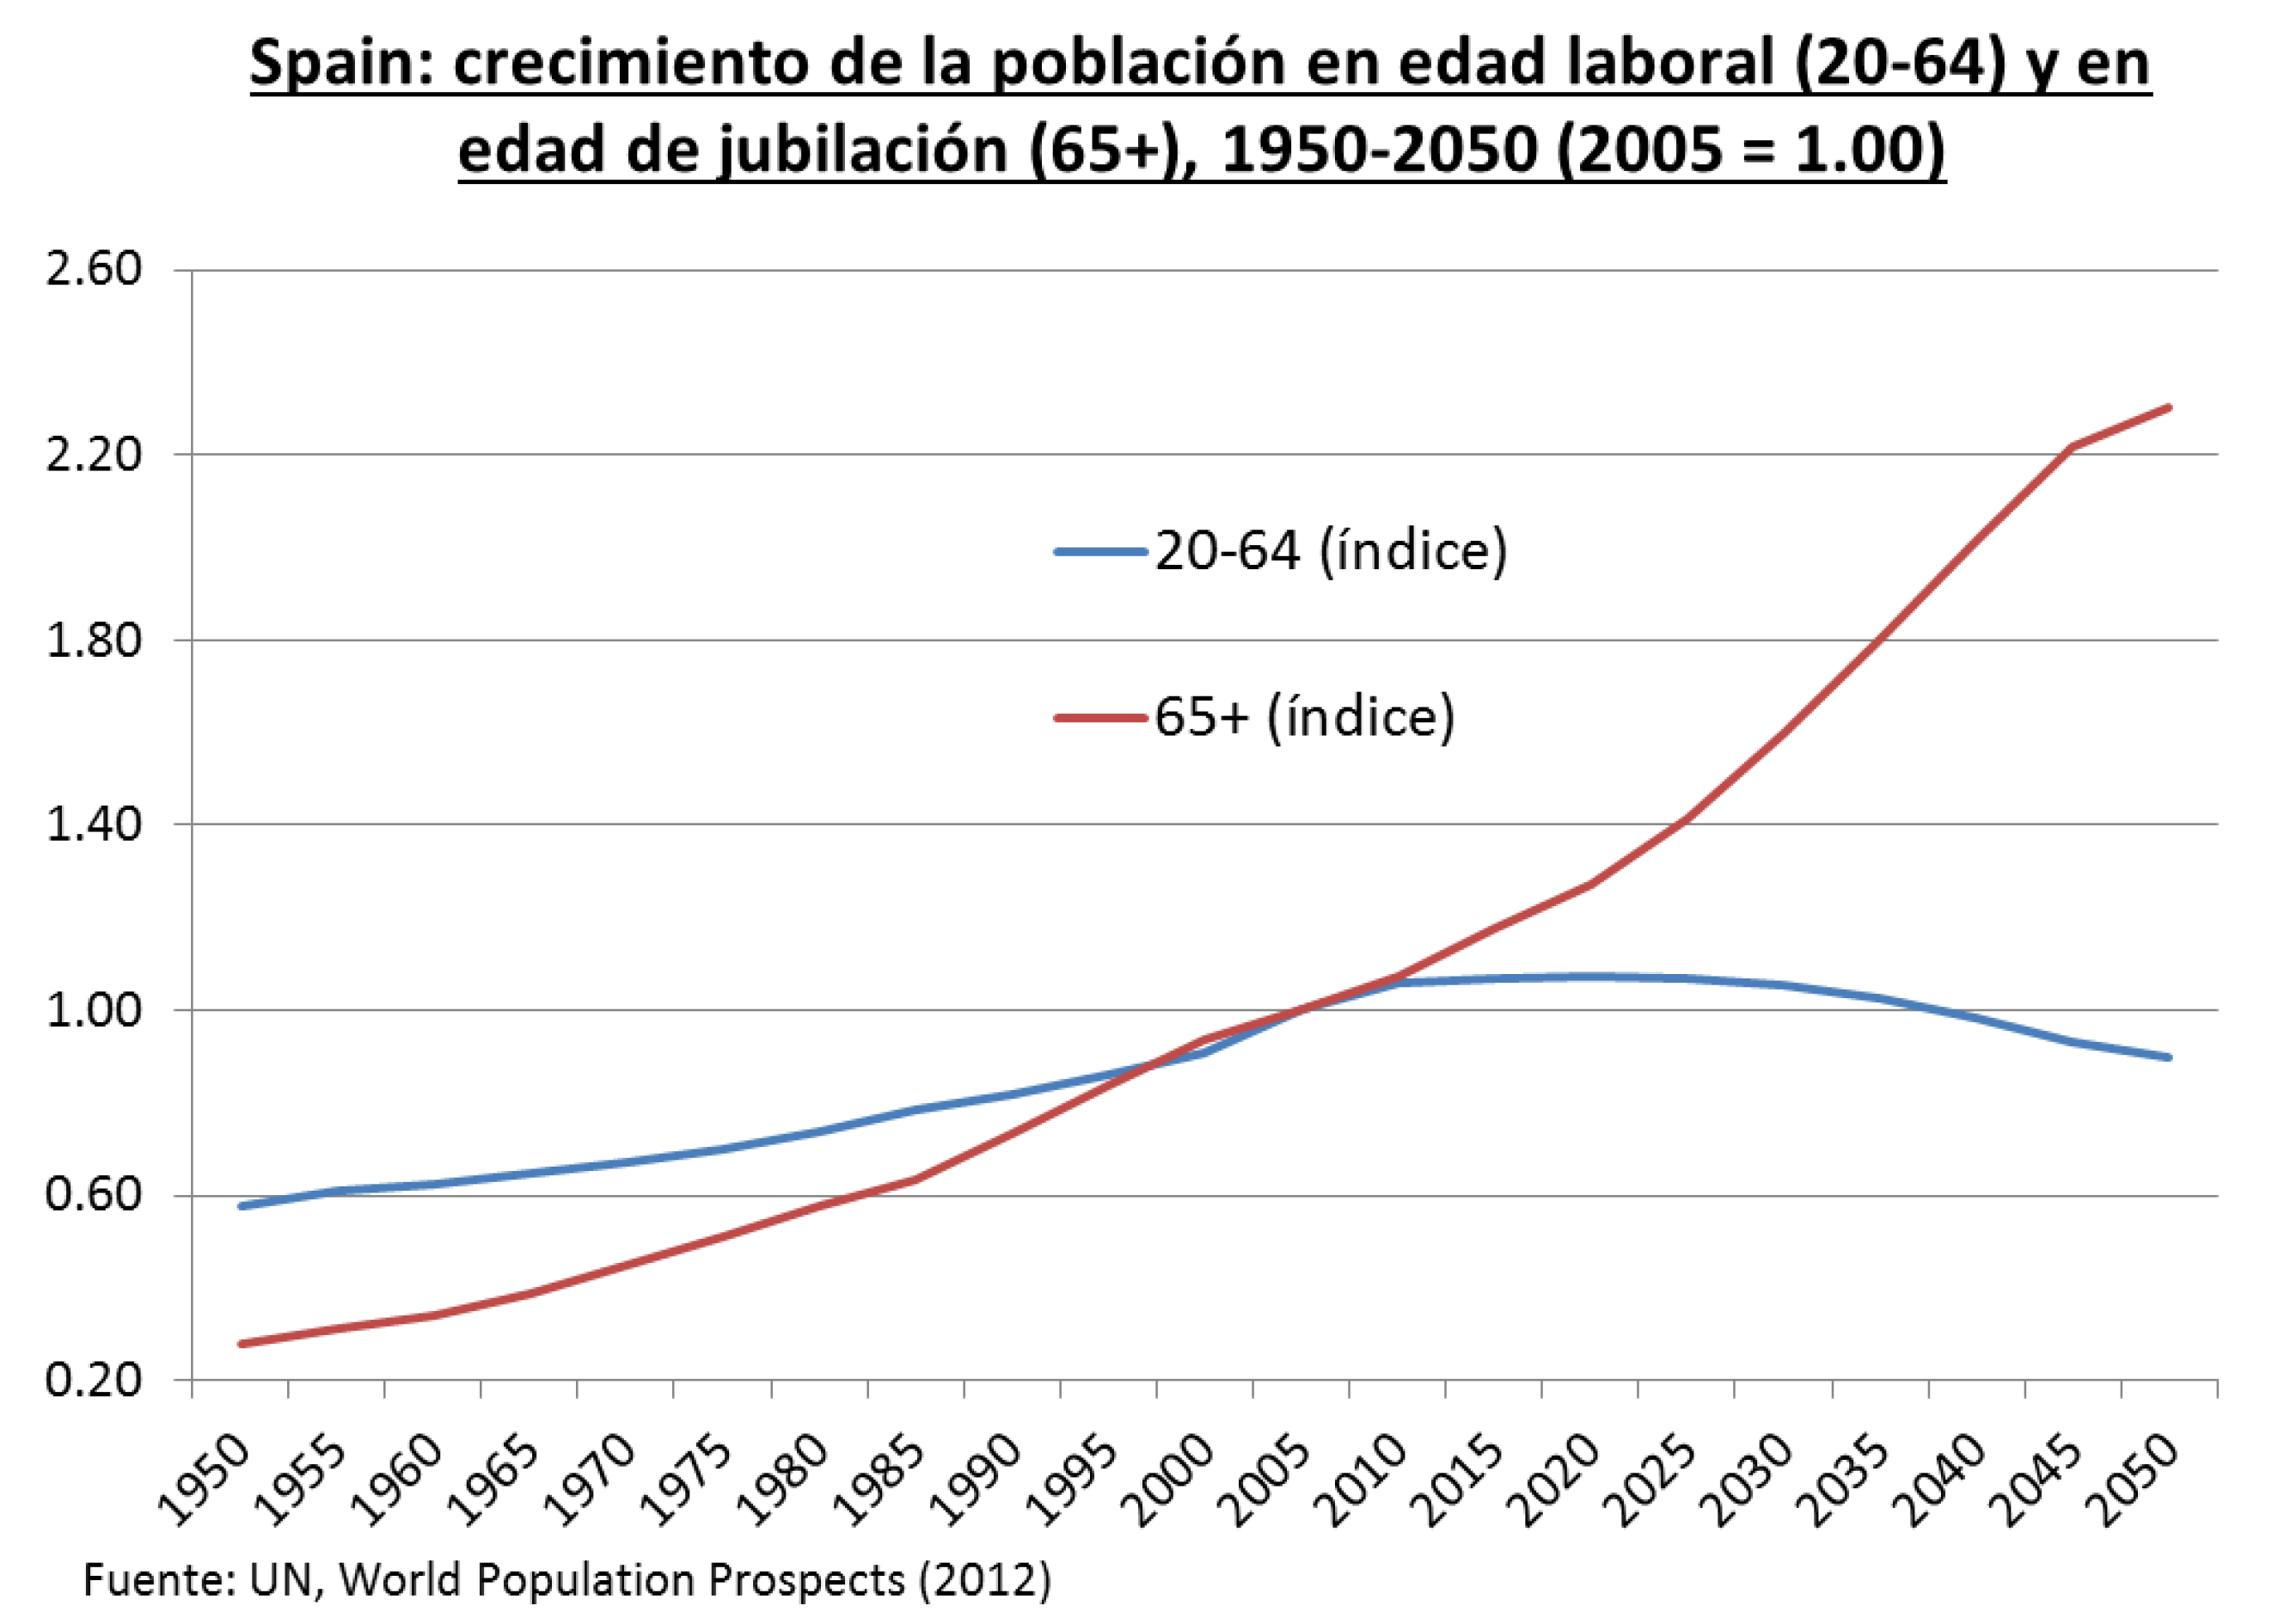
Chart 21 below shows data on the evolution of births, deaths and migration flows, in this case, according to the projections made by the National Institute of Statistics (INE, various years), observing what happens with the natural balance, taking into account that births to non-resident mothers and deaths of non-residents have been discounted for its calculation (INE, 2021).
For the past year 2023, the natural balance of the Spanish population has been negative and remains at negative values throughout the projection period. Migratory flows offset the aforementioned balance. However, around the year 2060, approximately and taking into account the prognosis studies, both balances would equalize, which would mean low population growth (Conde-Ruiz and González, 2021).

Dependency Rate

Chart 22 shows the dependency rate per year in the interval 2023-2072.
Analyzing by country, the elderly dependency ratio shows significant differences (Eurostat, 2017). Figure 23 shows the elderly dependency ratio in four developed countries, in the period 1950-2050, in the form of a demographic projection (United Nations, 2022).
In the case of Spain, the growth of the working-age population (20-64) and of retirement age (65+) for the same period shows the following image according to the source consulted: (World Population Prospects, 2012).

Sociological Analysis of the Ageing Process in Spain Today and in the Future

As sociological and demographic doctrine points out, in advanced societies we find ourselves in the presence of an important historical milestone in terms of life expectancy, and it can be seen that the fall in mortality rates is one of the most important demographic phenomena of the last century (Bazo Royo, 2005: 48 and 49). From the different demographic factors that the population ageing brings (Bazo Royo, 2005), the most important is the decrease in the birth rate, as has been shown in this paper. The increase in the birth rate must always go hand in hand with specific plans for its promotion and conciliation. It is worth mentioning the Strategy for the protection of motherhood and fatherhood and for the promotion of birth rate and conciliation. Plan 2022-2026 of the Community of Madrid with fertility figures of 1.15, very far from those that guarantee population replacement (Community of Madrid, 2022).
Once the demographic figures have been explained in the applied part of the data of this work and understanding that the aging of the population is configured as a phenomenon with economic, social and cultural implications of the first order, we will focus in this part of the discussion on carrying out an applied sociological analysis. In fact, the increase in the years lived and the progress of longevity makes it necessary to face one of the most important challenges of the so-called long-lived societies such as the Spanish one, that is, to establish the bases to achieve the quality of life of the entire population during the life cycle. This implies considering pharmaceutical expenditure and health expenditure per capita, in line with the future increase in chronic diseases and, above all, favoring the factors that promote healthy aging (Nicolau, 2005) and OECD (2019). The reader is referred to the work of Saz Peiró and Martínez Moure (2023) for a detailed explanation of the links between quality of life in older adults and active leisure.
The sociological situation of old age can be analyzed following Bazo Royo's (2005) interpretation of the Weberian analysis scheme, which distinguishes three possible spheres of influence: class, status and power (Weber, 1990).
According to Bazo Royo (2005), the evolution of social values, demographic, sociological, population and economic variables will determine the status and power that the elderly will have in the coming years (Bazo Royo, 2005: 48-49), although it is necessary to consider the economic precariousness related to housing or energy poverty of certain disadvantaged or vulnerable groups. The model established by Giddens (1996) remains very much in force.
The White Paper on Dependency (IMSERSO-CSIC, 2023) indicates that people aged 65 and over will represent 22% of the population in 2026 and, as a consequence of the increase in life expectancy, people aged 80 and over will also have a significant percentage increase (collected by Bazo Royo, 2005: 51-55).
Furthermore, this process will be accompanied, as occurs in the rest of the developed or trans-avant-garde countries, by a characteristic associated with old age, which is the process of increasing feminization (Herzog, Holden and Seltzer, 1989), which makes it essential to add the necessary gender perspective (Bazo Royo, 2005: 51) which, according to some authors, is still not sufficiently integrated (Ginn and Arber, 1995). This gender perspective, linked to essential issues such as care, values and the distribution of different family roles based on the different composition of Spanish households, is essential to face with solidarity the new changes (Aristegui Fradua et. al. 2018: 90-108) and demographic contours of societies such as the Spanish one.
When reviewing the projected population pyramid of Spanish society, Eurostat (2020) points out that Spain in the year 2100 will be the country in the European Union with the highest life expectancy, together with Iceland and Norway (countries belonging to the demographic model of northern Europe), reaching ninety years of life (Eurostat, 2020). Furthermore, Spanish women have, at birth, the highest life expectancy of all women in the European Union, a matter of great importance, as pointed out by Bazo Royo (2005). This sociological reality has important implications, especially today, such as the necessary management of the care of people aged 65 or over who live alone. If we consult the 2001 Population Census (INE, 2001) the proportion of people in this age cohort who live alone amounts to 20%, which is, in terms of figures, practically four points more than those registered in the 1991 census, a logical matter, in accordance with the demographic trends indicated in this work.
Knowing first-hand the reality of elderly people who live alone or who, at certain times, may experience unintentional loneliness, is essential for designing appropriate public policies, differentiating between healthy life expectancy, which considers, according to Puga (2001: 14-19), mortality, morbidity and factors concerning quality of life, and life expectancy in general (Bazo Royo, 2005).
One of the most important trends in today's developed societies is that "healthy life expectancy" has not increased at the same rate as total life span (Bazo Royo, 2005). This clear imbalance in trends makes one of the fundamental challenges of society to increase life expectancy free of serious or disabling disability in old age, which is why prevention is essential, both from an individual and social perspective.
According to the White Paper on Dependency (IMSERSO-CSIC, 2023), out of every 1,000 men between the ages of 75 and 79, 125 have some form of disability. And, according to data from the United Nations (2022), in 2050 Spain will be the oldest country in the world (Bazo Royo, 2005), which makes it necessary to orchestrate different welfare policies and promote intergenerational solidarity in care. For a detailed analysis of intergenerational relations within the framework of families, the reader is referred to a sociological work by Iglesias de Ussel (Iglesias de Ussel, 1995: 34-38).
These issues are sociologically very relevant and also present major national differences, since each society has different expectations and cultural patterns regarding the balance between the State and the institution of the family. When designing support structures for the elderly, these different traditions must be taken into account. Various investigations carried out by the OECD have shown that in Southern European countries, older people tend to prefer care provided within the family, while in Northern European countries, the elderly prefer care structured around formal services (OECD, 2019). In this sense, it is important to carry out large macro-surveys at European level, with a solid methodological basis, which will allow representative comparative conclusions to be drawn.
The emergence, consolidation and necessary presence of feminist values and cultural changes of various kinds, such as the emergence of a culture focused on individualism, have radically transformed the position of the female figure within the framework of the social structure, which, according to Bazo Royo (2005), is moving away from traditional models to a model full of new variables, since women, for several decades now, have begun to be more demanding in terms of care during the stage corresponding to the later years.
In any case, the unifying factor of all the issues pointed out throughout the section is to consider older people as an important and decisive social capital, which acquires great potential. In sociological and gerontological articles from the nineties there was already talk of a “new old age” (Bazo Royo, 2005), which results in the successful construction of the period corresponding to old age (Baltes and Baltes, 1993: 27). And this is where sociology makes its great contributions (Sánchez Vera, 1994a), because it focuses on the elderly person, not only from the psychological or biological perspective, but also from the value that they give to the group, which is an essential issue at all stages of life (Berger, 2016). This social value, which has been exponentially enhanced after the pandemic, can be seen with multiple examples, such as help to family members, economic support, especially important in times of great crisis or social fractures, or altruistic activities of a social nature within the framework of volunteer associations (Bazo Royo, 2001), which have gained so much prominence in Spain in recent years.
However, for this new construction of old age to be effective, intergenerational solidarity networks must be strengthened (Bazo Royo, 2005). According to Walker (1993), Silverstein et al. (1998), Bazo Royo (2002) and Bazo Royo (2005), this intergenerational solidarity must necessarily be sustained over time and is immediately exemplified in relation to public finances (González Martínez, 2019) and (González Martínez, 2013). As can be seen from the analysis of the data on dependency rates, it is a priority to adapt the pension system, productivity and the workforce to the new demographic profiles of society. Let us assume that savings rates will foreseeably tend to fall as the percentage of the retired population increases, making support for the dependent one of the great challenges. Sociology has made great contributions to gerontology, for example, through the so-called social loneliness scale (Rubio Herrera et. al., 2010), which is configured as an objective indicator of loneliness in old age (Rubio Herrera et. al., 1999). Finally, it should be noted that lifelong education is another of the challenges that must be faced in this new historical time (Moore, 2013) where the University acquires a great role.
Solid social services, the adaptation of the health system and labour regulations will be other challenges for Spanish society, as an ageing European society, which implies the revision of the jurisprudential foundation and the reinforcement of social capital and intergenerational solidarity. In the applied part of the work, dependency rates were analyzed and it was pointed out that it was necessary to eliminate the dividing line between “healthy life” or “dependent life”, so that health-related issues (Robertson, Gregory and Jabbal, 2014) are now established as a first-order factor, which must be established in correlation with the financing of care (Rodríguez Madroño and López Matus, 2018), with the growing support of the administration.
According to the most recent research, there is already talk of the emergence of a fourth age (Guerra, 2019: 10 and 11). In line with the issues raised in these pages, old age and fourth age, depending on their conditions, will have a different impact on the new composition of households (Sánchez Vera, 1996) and on the life trajectories of individuals, which also entails a series of methodological considerations that must be taken into account (Sánchez Vera, 1994b).

5. Conclusions

Plato in The Republic emphasizes critical judgment and the prudence of old age, being the great antecedent of the positive vision of this stage of life (Carbajo Vélez, 2008: 237-254). In the same way, Cicero in his work Cato Maior de senectute relates, with examples from classical antiquity, the enormous social relevance of senescence. Specifically, he explains the great events of all kinds of elderly people.
Spain is currently in a trans-avant-garde of demographic change. One of the most noteworthy factors is that, by the year 2050, demographic projections predict that our country will have the highest dependency rate in Europe and one of the highest in the world. The contours of the dependency rates reveal data on longer and more expensive retirements, numbers that already allow us to outline the challenge of the pension system or what the authors are already calling from the doctrine the “demography of pensions”.
The unifying factor of all the issues pointed out in this work is that older people are an important social capital, which makes it essential to continue addressing the issues related to the “new old age” (Bazo Royo, 2005), which results in the successful construction of the period corresponding to old age (Baltes and Baltes, 1993: 27). For this new construction of old age to be effective, networks of intergenerational solidarity must be strengthened (Bazo, 2005), to alleviate the effects of unwanted loneliness.
It should be noted that many studies on loneliness in the elderly are still missing and these are highly complex investigations, due to the subjective part of the perception of loneliness, which represents an additional methodological difficulty. The Reports carried out by the Centre for Sociological Research and by the IMSERSO should be highlighted, but all efforts are few. It should be noted that the latest data from the Continuous Household Survey -which studies households according to their composition- (INE, 2021) are from 2020. It is essential to carry out multiple studies on the composition of households, above all, to detect what situations of vulnerability may exist in single-person households inhabited by the elderly and to reinforce gerontological plans, social policies and links between the administration and the private sector.
The CIS study, published in 1998 on loneliness in the elderly, is already a classic. However, if we review the latest CIS barometer (April 2024), the category “loneliness” appears linked to “psychological problems” (CIS, 2024), but is not related to issues relating to roots or social considerations, which leaves the sociological factor very blurred.

Author Contributions

For research articles with several authors, a short paragraph specifying their individual contributions must be provided. The following statements should be used “Conceptualization, María José Pérez Fructuoso, Raquel García Revilla, Olga Martínez Moure and Jorge Alexander Mora Forero; methodology, María José Pérez Fructuoso, Raquel García Revilla, Olga Martínez Moure and Jorge Alexander Mora Forero; software, María José Pérez Fructuoso, Raquel García Revilla, Olga Martínez Moure and Jorge Alexander Mora Forero; validation, María José Pérez Fructuoso, Raquel García Revilla, Olga Martínez Moure and Jorge Alexander Mora Forero; formal analysis, María José Pérez Fructuoso, Raquel García Revilla, Olga Martínez Moure and Jorge Alexander Mora Forero; investigation, María José Pérez Fructuoso, Raquel García Revilla, Olga Martínez Moure and Jorge Alexander Mora Forero; resources, María José Pérez Fructuoso, Raquel García Revilla, Olga Martínez Moure and Jorge Alexander Mora Forero; data curation, María José Pérez Fructuoso, Raquel García Revilla, Olga Martínez Moure and Jorge Alexander Mora Forero; writing—original draft preparation, María José Pérez Fructuoso, Raquel García Revilla, Olga Martínez Moure and Jorge Alexander Mora Forero; writing—review and editing, María José Pérez Fructuoso, Raquel García Revilla, Olga Martínez Moure and Jorge Alexander Mora Forero; visualization, María José Pérez Fructuoso, Raquel García Revilla, Olga Martínez Moure and Jorge Alexander Mora Forero; supervision, María José Pérez Fructuoso, Raquel García Revilla, Olga Martínez Moure and Jorge Alexander Mora Forero; project administration, María José Pérez Fructuoso, Raquel García Revilla, Olga Martínez Moure and Jorge Alexander Mora Forero; funding acquisition, María José Pérez Fructuoso, Raquel García Revilla, Olga Martínez Moure and Jorge Alexander Mora Forero.

Funding

This research received no external funding

Institutional Review Board Statement

The study does not require ethical approval

Informed Consent Statement

Informed consent was obtained from all subjects involved in the study.

Conflicts of Interest

The authors declare that they have no conflicts of interest.

References

  1. Ayuso, M. y Holzmann, R. Condicionantes demográficos, estructuras de población y sistemas de pensiones. Documento de Trabajo nº 5/2014, Instituto BBVA de Pensiones, Madrid, 2014. https://www.jubilaciondefuturo.es/recursos/doc/pensiones/20131003/posts/2015-5-condicionantes demograficosestructuras-de-poblacion-y-sistemas-de-pensio.pdf.
  2. AIREF. Actualización de previsiones demográficas y de gasto en pensiones (Documento técnico 1/20) [Informe Demográfico] Servicio de Publicaciones de AIREF, 2014. https://www.airef.es/wp-content/uploads/2020/09/PREVIS-DEMOGRAFICAS/200928-Documento-T%C3%A9cnico-previsiones-demogr%C3%A1ficas-y-gasto-en-pensiones.pdf.
  3. Aristegui Fradua, I., Beloki Marañón, U. Royo Prieto, R. y Silvestre Cabrera, M. Cuidado, valores y género: la distribución de roles familiares en el imaginario colectivo de la sociedad española. Inguruak. (65). 2018. 90-108. Recuperado de: https://www.inguruak.eus/index.php/inguruak/article/view/65-2018-art05.
  4. Baltes, P. B. y Baltes, M. M. (eds.)., Successful Aging, 1993. Cambridge: University Press.
  5. Bazo Royo, M. T. La institución de la jubilación: de la sociedad industrial a la postmodernidad. Colección Edad y Sociedad, 1993. Valencia: Nau Llibres.
  6. Bazo Royo, M. T. Intercambios familiares entre las generaciones y ambivalencia: Una perspectiva internacional comparada. Revista Española de Sociología (R.E.I.S.) (2). 2002. 117-127. Recuperado de: https://recyt.fecyt.es/index.php/res/article/view/64869.
  7. Bazo Royo, M. T. Consecuencias del envejecimiento en la sociedad española actual. Panorama Social. Revista Panorama Social (1). 2005. 48-57. Recuperado:https://www.funcas.es/wp-content/uploads/Migracion/Articulos/FUNCAS_PS/001art05.pdf.
  8. Berger, K. S. [Kathleen Stassen]. (2016). Psicología del desarrollo: infancia y adolescencia. Editorial Médica Panamericana. https://www.medicapanamericana.com/es/libro/psicologia-del-desarrollo-berger.
  9. Bretos, A. Entrevista al demógrafo Albert Esteve. Albert Esteve, demógrafo: "Aunque todas las parejas jóvenes de Castilla y León tuvieran dos hijos, aún se perdería población durante 92 años". 2024. Periódico SER. Las Entrevistas de Aimar Bretos. https://cadenaser.com/nacional/2024/04/29/albert-esteve-demografo-aunque-todas-las-parejas-jovenes-de-castilla-y-leon-tuvieran-dos-hijos-aun-se-perderia-poblacion-durante-92-anos-cadena-ser/.
  10. Carbajo Vélez, Mª. C. La historia de la vejez. Ensayos (18), 2008. 237-254. Recuperado de: https://dialnet.unirioja.es/servlet/articulo?codigo=3003504.
  11. Centro de Investigaciones Sociológicas (C.I.S.). La soledad en las personas mayores. (Publicación, estudio nº. 2279, 1998. Servicio de Publicaciones del Centro de Investigaciones Sociológicas. https://es.scribd.com/document/606251334/CIS.
  12. Centro de Investigaciones Sociológicas (C.I.S.). Barómetro de marzo del año 2024. Avance de resultados. (Publicación, estudio nº. 3445, marzo de 2024) [Informe Sociológico]. 2024. Servicio de Publicaciones del Centro de Investigaciones Sociológicas. https://www.cis.es/documents/d/cis/es3445marMT_a.
  13. Comisión Europea. Propuesta de Reglamento del Parlamento Europeo y del Consejo, de 20 de noviembre de 2023, relativo a las estadísticas europeas sobre población y vivienda, por el que se modifica el Reglamento (CE) n.º 862/2007. Comisión Europea, 2023. https://eur-lex.europa.eu/legal-content/ES/TXT/?uri=CELEX:52023PC0031.
  14. Conde-Ruiz, J. I. y González, C.I. Envejecimiento: pesimistas, optimistas, realistas. Panorama Social. (11). 2010. 112-133. Recuperado de: https://documentos.fedea.net/pubs/ee/2010/10-2010.pdf.
  15. Conde-Ruiz, J. I. y González, C. I. Proyecciones demográficas para el Siglo XXI. Revista Actuarios, Instituto de Actuarios, (44). 2019. 10-13. Recuperado de: https://www.actuarios.org/wp-content/uploads/2019/07/Revista-ACTUARIOS-44_low.pdf.
  16. Conde-Ruiz, J. I. y González, C.I. [José Ignacio y Clara]. El proceso de envejecimiento en España (Estudios sobre la Economía Española. 2021. [informe de salud]. Fedea. https://documentos.fedea.net/pubs/eee/eee2021-07.pdf.
  17. Consejo Económico y Social de España. La inmigración en España. Retos y oportunidades. (Colección Informes. Informe Nº [Informe Demográfico]. 2019. Departamento de Publicaciones del Consejo Económico y Social de España.https://www.ces.es/documents/10180/5209150/Inf0219.pdf.
  18. Consejo Superior de Investigaciones Científicas (C.S.I.C.). Un perfil de las personas mayores en España. Indicadores estadísticos básicos. 2022. (Informes Envejecimiento en Red nº 29) [Informe de Envejecimiento]. 2022. Departamento de Población del Consejo Superior de Investigaciones Científicas. http://envejecimiento.csic.es/documentos/documentos/enred-indicadoresbasicos2022.pdf.
  19. Guash, T.; Espasa, A. y Martínez-Melo, M. The art of questioning in online learning environments: the potentialities of feedback in writing. Assessment & Evaluation in Higher Education, 44(1), 2019. 111–123. [CrossRef]
  20. EUROSTAT. EUROSTAT (Statistics explained). Archivo de datos. 2017. Estructura demográfica y envejecimiento de la población. https://ec.europa.eu/eurostat/statistics-explained/index.php?title=Population_statistics_at_regional_level/es&oldid=196176.
  21. EUROSTAT. EUROSTAT (Statistics explained). Archivo de datos. 2020. Estructura demográfica y envejecimiento de la población. https://ec.europa.eu/eurostat/statistics-explained/index.php?title=Population_structure_and_ageing/es&oldid=510186.
  22. EUROSTAT. Archivo de datos. Estructura demográfica y envejecimiento de la población. 2024. https://ec.europa.eu/eurostat/en/web/products-eurostat-news/w/ddn-20240215-1.
  23. Giddens, A. La estructura de clases en las sociedades avanzadas. 1996. Madrid. Alianza Editorial.
  24. Gilleard, C. y Higgs, P. [Chris y Paul]. The Third Age and the Baby Boomers: Two Approaches to the Social Structuring of Later Life. In L. ANDERSSON, y L. ANDERSSON (Ed.), International Journal of Ageing and Later Life (Vol. 2, pp. 13-30). 2007. Linköping University Electronic Press.
  25. Ginn, J. y Arber, S. Only connect: Gender relations and ageing. En S. Arber y J. Ginn. (eds.). Connecting Gender & Aging: A sociological Approach. Buckingham. 1995. Open University Press.
  26. Goldin-Meadow, S. Gesture and cognitive development. In L. S. Liben & U. Mueller (Eds.), Handbook of child psychology and developmental science: Vol. 2. Cognitive processes (7ª ed., 2015. pp.339-380). John Wiley & Sons. [CrossRef]
  27. González Martínez, C. I. Sostenibilidad del sistema de pensiones de reparto en España y modelización de los rendimientos financieros, vol. 65 of Estudios de la Fundación. 2013. Serie Tesis. FUNCAS.
  28. González Martínez, C. I. La demografía y las pensiones – mito o realidad. En C. I. González Martínez, Pensiones del Futuro. 2019. I Libro Colaborativo en Europa sobre el futuro de la sostenibilidad de las pensiones. Instituto Santa Lucía.
  29. Guerra A., P.S. El concepto de cuarta edad; realidad demográfica y respuestas de política pública. Los casos de España, Alemania, y Uruguay. Nº SUP: 119664. [Informe Técnico Parlamentario]. 2019. Comisión Especial del Adulto Mayor, del H. Senado. https://obtienearchivo.bcn.cl/obtienearchivo?id=repositorio/10221/27100/1/BCN__cuarta_edad_concepto__realidad_y_respuestas_de_politica_publica_Final.pdf.
  30. Herzog, A. R., Holden, K.C. y Seltzer, M.M. (eds.). Health & Economic Status of Older Women. 1989. Amityville, Nueva York: Baywood Publishing Company.
  31. Iglesias de Ussel, J. Vivienda y familia. En L. Garrido y E. Gil Calvo (eds.), Estrategias familiares. 1993. (pp- 346-350). Alianza Madrid.
  32. Iglesias de Ussel, J. Las relaciones intergeneracionales en la familia. Boletín de Estudios y Documentación, CEBS (4). 1995. 35. 34-38.
  33. IMSERSO-CSIC. Libro Blanco de atención a las personas en situación de dependencia (Publicación del Instituto de Mayores y Servicios Sociales) [informe social]. Catálogo de Publicaciones de la Administración General del Estado, 2023. CPAGE. https://imserso.es/documents/20123/133745/libroblanco.pdf/77b5f39f-5e13-6de9-88ed-fd5e0b2b1386.
  34. Comunidad de Madrid. Estrategia de protección a la maternidad y paternidad y de fomento de la natalidad y la conciliación. Plan 2022-2026. [Informe]. 2022. Servicio de publicaciones de la Comunidad de Madrid. https://www.comunidad.madrid/transparencia/sites/default/files/plan/document/estrategia_natalidad_2022.final_.web_.pdf.
  35. Instituto Nacional de Estadística. Proyecciones de Población 2016-2066 (Informe de Población 1/20) [Informe Demográfico]. Servicio de Publicaciones del Instituto Nacional de Estadística. Notas de prensa del Instituto Nacional de Estadística. 2016. http://www.ine.es/prensa/np994.pdf.
  36. Instituto Nacional de Estadística. Censo de Población y Viviendas. Resultados definitivos. 2001. [Censo de Población]. Servicio de Publicaciones del Instituto Nacional de Estadística. https://www.ine.es/censo/es/inicio.jsp.
  37. Instituto Nacional de Estadística. Proyecciones de Población 2020-2070 (Informe de Población 1/19) [Informe Demográfico]. Servicio de Publicaciones del Instituto Nacional de Estadística. Notas de prensa del Instituto Nacional de Estadística. 2020. https://www.ine.es/prensa/pp_2020_2070.pdf.
  38. Instituto Nacional de Estadística. Censo de Población y Viviendas del año 2021 [Censo de Población]. 2021. Servicio de Publicaciones del Instituto Nacional de Estadística. https://www.ine.es/Censo2021/Inicio.do?L=0.
  39. Instituto Nacional de Estadística. Avance de las estadísticas del Padrón Continuo a 1 de enero de 2022 [Padrón continuo]. 2022. Servicio de Publicaciones del Instituto Nacional de Estadística. https://www.ine.es/prensa/pad_2022_p.pdf.
  40. Instituto Nacional de Estadística. Indicadores demográficos básicos. Metodología. (Informe Metodológico de Población 1/51) [Informe Demográfico]. 2023. Servicio de Publicaciones del Instituto Nacional de Estadística. https://www.ine.es/metodologia/t20/metodologia_idb.pdf.
  41. Instituto Nacional de Estadística. Estadística de migraciones y cambio de residencia. [Informe de Metodología. 2024]. 2024. Servicio de Publicaciones del Instituto Nacional de Estadística. https://www.ine.es/metodologia/meto_emcr_2023.pdf.
  42. López Carrascosa, L. Consecuencias del envejecimiento de la población: el futuro de las pensiones. 2023. Editorial del Instituto Nacional de Estadística (I.N.E.) www.ine.es/daco/daco42/sociales/infosoc_envej.pdf.
  43. Martín, A. España se va a vaciar cada vez más, pero seremos más longevos. Es el país con más territorio deshabitado en toda Europa, pero Madrid y Barcelona son las regiones con más población del continente. Periódico SER. 2024. Internacional. https://cadenaser.com/nacional/2023/03/30/espana-se-va-a-vaciar-cada-vez-mas-pero-seremos-mas-longevos-cadena-ser/.
  44. Ministerio de Política Territorial y Función Pública. Diagnóstico estrategia nacional frente al reto demográfico. Eje envejecimiento. (Publicación del Comisionado del Gobierno frente al reto demográfico) [Informe]. 2024. Departamento de Publicaciones del Ministerio de Política Territorial y Función Pública. https://www.miteco.gob.es/content/dam/miteco/es/reto-demografico/temas/analisis-cartografia/diagnostico_eje_envejecimineto_tcm30-517770.pdf.
  45. Ministerio de Sanidad. Demografía, indicadores de bienestar y determinantes sociales Informe Anual del Sistema Nacional de Salud, 2018 (Informes, Estudios de Investigación 2020) [Informe de Bienestar]. Servicio de Publicaciones del Ministerio de Sanidad. 2020. Secretaría General Técnica.
  46. Moore, M. G. (ed.). Handbook of Distance Education. 2013. Lawrence Erlbaum Associates, Inc.
  47. Moreno, A. La Cuarta Edad. Perfil Conceptual de la Vejez Avanzada. Poiesis, Revista de Psicología Social (20). 2010. 1-8. [CrossRef]
  48. Nicolau, R. Población, salud y actividad. En A. Carreras y X. Tafunell (coord.) Estadísticas históricas de España. Siglos XIX y XX. 2005. (pp. 77- 154). Fundación BBVA.
  49. OECD, Health at a Glance 2019: OECD Indicators, OECD Publishing, 2019. Paris. [CrossRef]
  50. United Nations. World Population Prospects. Department of Economic and Social Affairs Population Division. 2022. https://population.un.org/wpp/.
  51. Olcese, A. Mínimo histórico de nacimientos en España y un 55% más de madres mayores de 45 años desde que hay registros. Sólo 155.600 niños han nacido en el país de enero a junio, la mayoría en Andalucía, Cataluña y Madrid. 2023. El Mundo. https://www.elmundo.es/economia/2023/08/17/64dce396e85eceb1318b457e.html.
  52. Pérez Fructuoso, M. J. Análisis estadístico del envejecimiento en España. Principales indicadores demográficos para el periodo 1975-2016. (47). Rev.Ibero-Latinoam. Seguros, 2017. 167-190. [CrossRef]
  53. Pérez Ortiz, L. Evaluación de las políticas públicas para la vejez. SECOT. 1995. 529-534. Recuperado de: https://dialnet.unirioja.es/servlet/articulo?codigo=585636.
  54. Puga González, Mª. D. Dependencia y necesidades asistenciales de los mayores en España: Una previsión a 2010. 2001. Madrid: Fundación Pfizer.
  55. Ramiro Fariñas, D. Las personas mayores en España. Indicadores estadísticos básicos. 2022. Servicio de Publicaciones del Consejo Superior de Investigaciones Científicas.
  56. REDS (Red Española para el Desarrollo Sostenible). La dimensión rural de la Agenda 2030. Conclusiones del Foro Multiactor (Una iniciativa de la Red Española para el Desarrollo Sostenible (REDS) y Grupo Red Eléctrica en colaboración con Agirre Lehendakaria Center -ALC) [Informe]. 2021. Red Española para el Desarrollo Sostenible (REDS) y Grupo Red Eléctrica. https://reds-sdsn.es/wp-content/uploads/2021/05/Dimension-rural_memoria_impresio%E2%95%A0un-SIN-sangre.pdf.
  57. Robertson, R., Gregory, S. y Jabbal, J. The social care and health systems of nine countries. 2014. London: The King´s Found.
  58. Rodríguez-Modroño, P. y López-Matus. Tendencias a largo plazo en la financiación de los cuidados a la Infancia y la Población Dependiente en Europa. Zerbitzuan. (65). 2018. 29 - 40. Obtenido de. [CrossRef]
  59. Rubio Herrera, R. La escala “este”, un indicador objetivo de soledad en la tercera edad. Geriatrika. Revista Iberoamericana de Geriatría y Gerontología. 9/1999, Octubre. Vol. 15, año XV, 26-35. 1999. Recuperado de: http://envejecimiento.csic.es/documentos/documentos/rubio-soledad-02.pdf.
  60. Rubio Herrera, R. La soledad en los mayores. Una alternativa de medición a través de la Escala Este. [informe de salud]. 2010. Editorial de la Universidad de Granada. http://envejecimiento.csic.es/documentos/documentos/rubio-soledad-02.pdf.
  61. Sánchez Vera, P. Bases y fundamentos para una aproximación sociológica a la vejez. Papers (Revista de Sociología. (40). 1994. 99-120. https://papers.uab.cat/article/view/v40-sanchez/pdf-es.
  62. Sánchez Vera, P. Tercera y Cuarta Edad en España desde la Perspectiva de los Hogares. Revista Española de Investigaciones Sociológicas. Ejemplar dedicado a la Sociología de la Vejez. (73), 1996. 57-79. Recuperado de: https://reis.cis.es/index.php/reis/article/view/1494.
  63. Saz Peiró, P. y Martínez Moure, O. [Olga y Pablo]. La contribució del Programa de Termalisme Social de l’Imserso a l’envelliment saludable en una societat demogràficament hiperenvellida. En: C. [Carmen] Orte Socias (Ed.), Anuari de L´envelliment. Illes Balears. 2023. Vol. 1. Càtedra d’Atenció a la Dependència i Promoció de l’Autonomia Personal (1ª ed. pp. 194-215). https://catedradependencia.uib.cat/digitalAssets/736/736178_anuari-envelliment-2023-web.pdf.
  64. Silverstein, M., Burholt, V., Wenger, G.C., Bengston, V. L. Parent-child relations among very old parents in Wales and the United States: A test of modernization theory. Journal of Aging Studies, 12 (4). 1998. 387-409. Retrieved from: https://www.sciencedirect.com/science/article/abs/pii/S0890406598900263.
  65. Reques Velasco, P. [Pedro]. Los cambios de la población en el tiempo: la dinámica demográfica. En: Universidad de Cantabria (Ed.), Geodemografía. Una introducción al análisis geográfico de la población. 2014. Módulo 4. Open Course Ware (pp. 1-42).
  66. Vallin, J. (1995). La population mondiale. Madrid. Alianza.
  67. Walker A. Intergenerational relations and welfare restructuring: The social construction of an intergenerational problem. En: V. L. Bengston y L. Achenbaum (eds.), The changing contract across generations. 1993. Nueva York: Aldine de Gruyter.
  68. Weber, M. Sobre algunas categorías de la sociología comprensiva. Ensayos sobre metodología sociológica. 1990. Amorrortu.
Figure 3. Spanish GMR (1975-2022).
Preprints 142691 g003
Figure 4. Annual relative variation of the Spanish GMR (1975-2022).
Preprints 142691 g004
Figure 13. Gross and net migration rates in Spain (2008-2020).
Preprints 142691 g013
Figure 14. Spanish population ageing index (1975-2023).
Preprints 142691 g014
Figure 15. Dependency rate of the population over 64 years of age (1975-2023).
Preprints 142691 g015
Figure 16. Summary of the different sociodemographic variables.
Preprints 142691 g016
Figure 17. Fecundity rate projections.
Preprints 142691 g017
Figure 20. Cumulative net migration flow 2020-2050 in relation to population.
Preprints 142691 g020
Figure 21. Births, deaths, net migration flow and population between 2020 and 2069.
Preprints 142691 g021
Figure 22. Dependency rate per year (2023-2072).
Preprints 142691 g022
Figure 23. Dependency ratio of elderly in four developed countries, 1950-2050 (+65/20-64).
Preprints 142691 g023
Figure 24. Spain: growth of the working-age population (20-64) and of retirement age (65 +), 1590-2050 (2005=1.00).
Preprints 142691 g024
Disclaimer/Publisher’s Note: The statements, opinions and data contained in all publications are solely those of the individual author(s) and contributor(s) and not of MDPI and/or the editor(s). MDPI and/or the editor(s) disclaim responsibility for any injury to people or property resulting from any ideas, methods, instructions or products referred to in the content.
Copyright: This open access article is published under a Creative Commons CC BY 4.0 license, which permit the free download, distribution, and reuse, provided that the author and preprint are cited in any reuse.
Prerpints.org logo

Preprints.org is a free preprint server supported by MDPI in Basel, Switzerland.

Subscribe

Disclaimer

Terms of Use

Privacy Policy

Privacy Settings

© 2025 MDPI (Basel, Switzerland) unless otherwise stated