
Submitted:
02 December 2024
Posted:
03 December 2024
You are already at the latest version
Abstract
A variety of approaches and methodologies are employed for the study of HIV infection, including techniques from molecular and cellular biology. Many of these methods utilize fluorochromes to visualize the objects of interest. This article explores specific applications of a technique for detecting fluorescent signals known as imaging flow cytometry. A distinctive feature of imaging flow cytometry is its capacity to produce images of each recorded event.
Keywords:
HIV
; imaging flow cytometry
; virology
; viral reservoirs
Introduction
The human immunodeficiency virus (HIV) is a retrovirus classified within the Lentivirus genus and is responsible for causing the condition referred to as HIV infection. In the absence of therapeutic intervention, this infection advances to acquired immunodeficiency syndrome (AIDS). HIV engages in intricate interactions with the host organism. It not only integrates into the human genome, altering antigenic profiles and inducing apoptosis in immune system cells, but it also establishes latent reservoirs capable of preserving the viral genome over extended periods [1].
As of July 22, 2024, global estimates indicated that 39.9 million individuals are living with HIV, with 30.6 million of them receiving antiretroviral therapy (ART) [2]. ART has been substantiated as effective not only for managing the infection at the individual level but also as a potent strategy to first stabilize and subsequently reduce HIV transmission among individuals [3]. Nonetheless, ART results only in disease remission, necessitating lifelong administration.
As the number of individuals on ART rises, the issue of HIV drug resistance becomes increasingly significant [4,5]. Experts report that even the most advanced medications, such as lenacapavir, may lose efficacy due to viral resistance. Consequently, these drugs must be administered in combination with other treatments [6]. It remains imperative to investigate the HIV life cycle and identify novel targets for either suppressing HIV replication or achieving complete eradication of the virus from human cells. Such research endeavors require high-quality in vitro models of HIV infection. In conducting studies with these models, researchers frequently analyze extensive cell populations using flow cytometry, which offers unmatched statistical power.
Flow cytometry was first utilized for the study of HIV infection as early as 1986 [7,8]. Initially, it was applied in simple clinical assays, primarily to quantify CD4+ and CD8+ T lymphocytes. Over the years, advancements in antibodies, dyes, and equipment have augmented the capabilities of flow cytometry.
No other cellular analysis method currently employs fluorochromes as effectively as flow cytometry does. Contemporary systems can capture data for 19 parameters or more from a single sample [9]. Advanced high-sensitivity equipment facilitates the detection of particles at the resolution limits of light microscopy, such as virions [10]. A novel advancement in this field is imaging flow cytometry, now adopted by several commercial systems.
The first category includes devices that resemble enhanced cell counters more than traditional flow cytometers. These systems capture cell images through fluorescence imaging, with cells placed on a solid surface like glass or a plate. Once images are acquired, software processes them to ascertain the number of cells and the fluorescence intensity of the dye. This intensity data is then plotted on two-dimensional graphs, where each point represents the fluorescence signal intensity within a cell, thereby simulating the functionality of a flow cytometer.
This method offers benefits like rapid and straightforward analysis and reduced equipment costs compared to traditional flow cytometers. Nonetheless, it also presents limitations, such as the inability to assess intracellular heterogeneity and lower sensitivity.
The second category includes imaging flow cytometers configured similarly to classical flow cytometers. They employ objectives with magnifications ranging from 20x to 60x and specialized CCD cameras with time-delay integration technology for image acquisition. The camera "tracks" cells as they traverse its field of view, accumulating fluorescent signals; this is similar to exposure in fluorescence microscopy (Figure 1, A). To construct images, the CCD camera records the number of photons from different regions of a cell (Figure 1, B). Due to the low flow rate, cells remain under the camera's observation long enough to accumulate a discernible fluorescent signal, yielding high-resolution and clear images.
For the mitigation of signal noise in specific fluorescence channels, a spectral compensation matrix — calculated based on samples with a single fluorescent dye (compensation control) — is utilized. The software characterizes each obtained image with 86 parameters. Besides traditional flow cytometry parameters like forward and side scatter and intensity, dozens of characteristics related to the size, shape, localization, comparison, and texture of objects are incorporated. Specialized masks and their combinations are employed to accentuate specific analysis regions in images, such as membranes, nuclei, or intercellular interaction zones (Figure 1, C). The combination of 86 characteristics, 20 masks, and 12 channels allows for the identification of cell subpopulations based on an extensive range of parameters. A crucial aspect of operating such equipment is the added capability to create custom mask combinations using logical AND, OR, and NOT operators (Figure 1, C; Figure 5). The analysis software permits consideration of each parameter for individual objects, considerably enhancing the study's statistical power. Compiling this volume of information via microscopy would require weeks and would be virtually impossible when dealing with rare events (<1:10000).
In contemporary HIV research, the emphasis is increasingly transitioning from the analysis of all cell types in blood samples to the examination of individual cell populations. Notably, memory T-cells, which frequently constitute latent reservoirs of HIV proviruses, along with astrocytes, the neuronal support cells implicated in HIV replication within the central nervous system (CNS), warrant particular attention. Flow cytometry stands out as a potent technique for investigating cell populations, as it facilitates the collection of data from tens of thousands of cells. Nonetheless, this method has inherent limitations: in the absence of imaging, it is not feasible to draw definitive conclusions regarding signal specificity, ascertain fluorescence localization, or scrutinize infrequent events. For these purposes, microscopy is typically employed in conjunction with flow cytometry. Imaging flow cytometry synergistically integrates the functionalities of a flow cytometer and a microscope. This review delves into the current domains of HIV infection research wherein the evaluation of a substantial number of cells is essential and evaluates the advantages presented by imaging flow cytometry.
The Latent HIV Reservoir Evaluation
Latent reservoirs are inactive copies of the HIV provirus that can serve as templates for viral replication in the event of activation, such as during the cessation of antiretroviral therapy (ART) or in a decrease of the concentration of antiretroviral drugs (ARVs) [1]. These latent reservoirs are currently responsible for the inability to achieve a complete cure for HIV in humans [10,11]. However, there are several promising approaches.
Among these, gene therapy and strategies for blocking HIV expression are mostly discussed due to the success of these technologies in treating other diseases [12], such as spinal muscular atrophy in children (Zolgensma). However, there is currently a gap in the number of approved gene therapy drugs for infectious diseases within the industry [13]. Nonetheless, there are several registered vaccines developed using this technology [14]. For these editing systems to work correctly, they must be delivered directly into the infected cell, thus presenting challenges in determining the number of cellular reservoirs of the virus, their stability, and the accessibility of chromatin for CRISPR-Cas components.
Cellular Reservoirs
The primary target of HIV is CD4+ T-lymphocytes, with certain subpopulations within this group being long-lived cells. This contributes to the formation of a stable viral reservoir, including a latent inactive one. Memory T-lymphocytes serve as the main source of new HIV viral particles after a pause in antiretroviral therapy (ART). These cells are divided into three main subpopulations: central memory T cells (TCM), transitional memory T cells (TTM), and effector memory T cells (TEM) [15]. Recent studies have also identified immature memory T cells (TSCM) as a reservoir for HIV proviruses [16]. There are various opinions regarding the most suitable memory T-cell subpopulation for maintaining the viral reservoir; however, all described populations can harbor HIV DNA and are the focus of research as objects for flow cytometry.
Another cellular reservoir of hematopoietic origin is constituted by tissue-resident macrophages, such as those found in bone tissue, lungs, and the central nervous system (CNS) [17]. These cells are infected while in the monocyte stage in peripheral blood and subsequently migrate into various tissues throughout the body, making it challenging to pinpoint an anatomical location for this reservoir. The positive aspect is that macrophages are not long-lived cells, with an average lifespan of 90 days, although in exceptional cases (such as CNS microglia), they may persist for 2-4 years [18]. However, they actively move and can disseminate both free HIV viral particles and transmit the virus through intercellular contacts, including to macrophages that have recently migrated into the tissue. The issue of cell-to-cell HIV transmission during antiretroviral therapy (ART) is not fully resolved, but it appears to occur [19]. It is known that tenofovir, the nucleoside reverse transcriptase inhibitor (NRTI), and efavirenz, the non-nucleoside reverse transcriptase inhibitor (NNRTI), which effectively block the reverse transcription process, thereby preventing the development of infection after a virion enters a cell, have a reduced efficacy in blocking the infection process when viral material is transmitted through virological synapses [20]. Thus, a vicious cycle arises: an infected monocyte transitions from peripheral blood to tissues, becomes a macrophage, and subsequently infects other macrophages, perpetuating the process. It remains to be determined how stable this depot of HIV quasispecies is, but it should be noted that a macrophage reservoir of HIV may be present in virtually any tissue at any time.
One of the most unusual reservoirs of HIV is macroglial cells, specifically astrocytes [21]. These cells are located in the central nervous system (CNS) and are a component of the blood-brain barrier (BBB), providing both protective and trophic functions for neurons. Several studies have demonstrated the potential of astrocytes to become infected with HIV and their ability to facilitate cell-to-cell spread of the virus [22]. To date, there is no definitive information regarding the capacity of astrocytes to sustain productive HIV infection; however, some studies affirm this capability [23]. Furthermore, astrocytes are long-lived cells capable of maintaining a latent reservoir of HIV for extended periods [24]. As a result, the CNS serves as a major source of viral particles in peripheral blood during ART interruption [25].
The latent reservoir of HIV can be identified, for instance, using the method of fluorescent in situ hybridization (FISH) [10,11,26,27,28,29,30]. The essence of the method involves the use of probes, which are oligonucleotide DNA fragments that bind to the target DNA based on the principle of complementarity. This technology is widely employed for diagnosing viral infections, such as hepatitis B and animal viruses [31,32], researching viral replication [33], analyzing the localization and transport of viral nucleic acids in the cytoplasm [34], and studying HIV reservoirs. In this context, while FISH may be less precise than sequencing methods, it reliably identifies the localization and quantity of hidden viral reservoirs [35].
In addition to the previously mentioned applications of FISH staining, this technique assists in quantifying the number of HIV proviruses within the cellular genome, determining the potential for HIV integration into various cell types, such as lymphocytes, spermatozoa, and astrocytes, and conducting highly sensitive analyses of HIV presence in patients with discordant diagnostic test results. Furthermore, this method can be combined with immunocytochemical staining. For example, the visualization of modified histones can indicate the level of transcriptional activity, including in regions where HIV proviruses have integrated.
HIV transcripts serve as crucial markers for the progression of HIV infection within the cell. RNA-FISH is employed to determine the activity level of the HIV provirus [36], to investigate cellular responses to therapy (such as the identification of HIV RNA and Gag gene products) [37], and to assess the qualitative and quantitative composition of mRNA required to mediate different HIV phenotypes (rapid/high or slow/low). Beyond identifying HIV transcripts, the FISH methodology can also be used to label host cell RNA, thereby facilitating the study of antiviral responses at the onset of infection and the reprogramming of cellular metabolism to accommodate the synthesis of viral proteins. This is reflected in the qualitative and quantitative changes in the transcripts of host genes (such as PD-1, CTLA-4, CD160, TIGIT, among others) [38,39,40]. Similarly to DNA detection, flow cytometry coupled with imaging is an excellent tool for the detection of RNA-FISH when quantitative assessment of the target molecules of interest is required.
There are numerous methods and protocols for performing DNA-FISH [28,29,41,42] and RNA-FISH [37,43,44] on HIV nucleic acids. However, the capabilities of classical flow cytometry are significantly limited; it allows for only semi-quantitative measurement of HIV provirus based on fluorescence measurement, as it cannot localize the signal (nucleus or cytoplasm) or assess the specificity of probe hybridization with the target. Imaging flow cytometry, on the other hand, enables comprehensive quantitative measurement by allowing visualization of images and determining the number of hybridization spots. The gating strategy for quantitative measurement of hybridization spots using imaging flow cytometry is presented in Figure 2; IDEAS 6.2 software and rif files from Amnis FlowSight's FlowSight software were used as examples for recording flow cytometry events.
It is noteworthy that Amnis allows the use of software for automated analysis, specifically the built-in assistant for counting fluorescence spots (Spot, Figure 2, B). When selected, IDEAS will guide the user step-by-step to isolate the desired subpopulations until the final result is achieved, such as the number of cells with varying numbers of HIV proviruses. In addition, there are machine learning methods compatible with newer versions of IDEAS (Amnis data analysis software) that expedite result acquisition [45,46].
IDEAS 6.2 possesses another tool to assist in identifying and analyzing positive events based on FISH staining. This feature is a wizard known as Nuclear localization. The algorithm aids in isolating events with fluorescent signals localized within the cell nucleus. When utilizing DNA-DNA FISH, this assistant enables the isolation of a pure subpopulation of cells without erroneous or background staining in the cell cytoplasm (Figure 3).
Cellular Cytoskeleton During HIV Infection
The cytoskeleton is a dynamic cellular structure consisting of three primary components: microtubules, intermediate filaments, and actin microfilaments [42]. Actin microfilaments are the smallest of the cytoskeletal filaments, with a diameter of 6-8 nm. They support the cell's shape and have the ability to attach to the inner side of the cytoplasmic membrane, which enables the displacement of segments of the cytoplasmic membrane relative to one another. Microtubules, the largest of the cytoskeletal structures with a diameter of 25 nm, are comprised of two main proteins: alpha and beta tubulin. This cytoskeletal component is involved in intracellular transport facilitated by ATP-dependent motor proteins; transport occurs bidirectionally, towards both the plus and minus ends. Notably, this system is used to transport HIV capsid proteins [47].
During HIV infection, the cellular cytoskeleton undergoes alterations as a result of both the antiviral response and the action of early HIV regulatory proteins (Nef, Rev, Tat, and Vif). On one hand, actin microfilaments serve as a barrier to HIV entry into the cell due to their role in maintaining the physical structure of the cytoplasmic membrane [48]. Conversely, they are also responsible for the clustering of CD4 receptors with coreceptors CCR5 or CXCR4 on the cell membrane, which are crucial for the entry of HIV virions into the cell. Microtubules play a significant role in intracellular transport and are responsible for transporting HIV proteins and potentially the pre-integration complex during its transit to the nucleus. Moreover, the cytoskeleton is a key structural element for the interaction of the virus with other cells and for the cell-to-cell transmission of HIV, which may represent the predominant mode of HIV transmission in vivo [49].
Actin Microfilaments
The primary function of this component of the cytoskeleton is contraction, through which they maintain cell shape and participate in the formation of intercellular interactions. Additionally, actin microfilaments can facilitate the local concentration of surface receptors, which plays a significant role in the entry of HIV virions and the cell-to-cell transmission of HIV [48].
During the binding phase of the HIV protein gp120 with the cellular CD4 receptor, a signaling cascade is initiated that triggers actin-dependent clustering of the CD4 receptor and co-receptor to reduce their lateral mobility and stabilize fusion pores [50]. As the cytoplasmic membrane of the cell undergoes structural rearrangement, HIV seeks an optimized entry point, a process referred to as "viral surfing" [51].
The time required for the reorganization of the actin cytoskeleton is a limiting factor in this process, as the rate of CD4 and CCR5/CXCR4 clustering will determine the average time necessary for viral surfing prior to cell entry.
The capabilities of traditional flow cytometry in studying this issue are limited. Measuring fluorescence without microphotography visualization cannot provide a comprehensive picture of the events occurring, as the number of receptors and actin microfilaments may remain unchanged, and thus the overall fluorescence signal level upon staining may not be altered. Flow cytometry with visualization allows for the delineation of the area of intercellular interaction using masks and facilitates the analysis of fluorescence intensity alterations specifically in this region (Figure 4).
HIV induces remodeling of actin microfilaments not only during the entry stage into the cell but also later, after the initiation of expression of early (regulatory) HIV proteins. For instance, Nef utilizes the protein PAK2 to modulate the actin dynamics of the host cell; the SH3 domain of Nef can bind with PAK2, forming the Nef-PAK2 complex [52]. This complex inhibits the formation of F-actin microfilaments at the cell periphery without reducing the overall quantity of actin. As a result, the infected cell exhibits decreased mobility and reduced capacity for the formation of immunological synapses. However, Nef does not affect the F-actin present in filopodia and nanotubes, thus maintaining the cell's motility and its ability to transmit HIV to other cells [53].
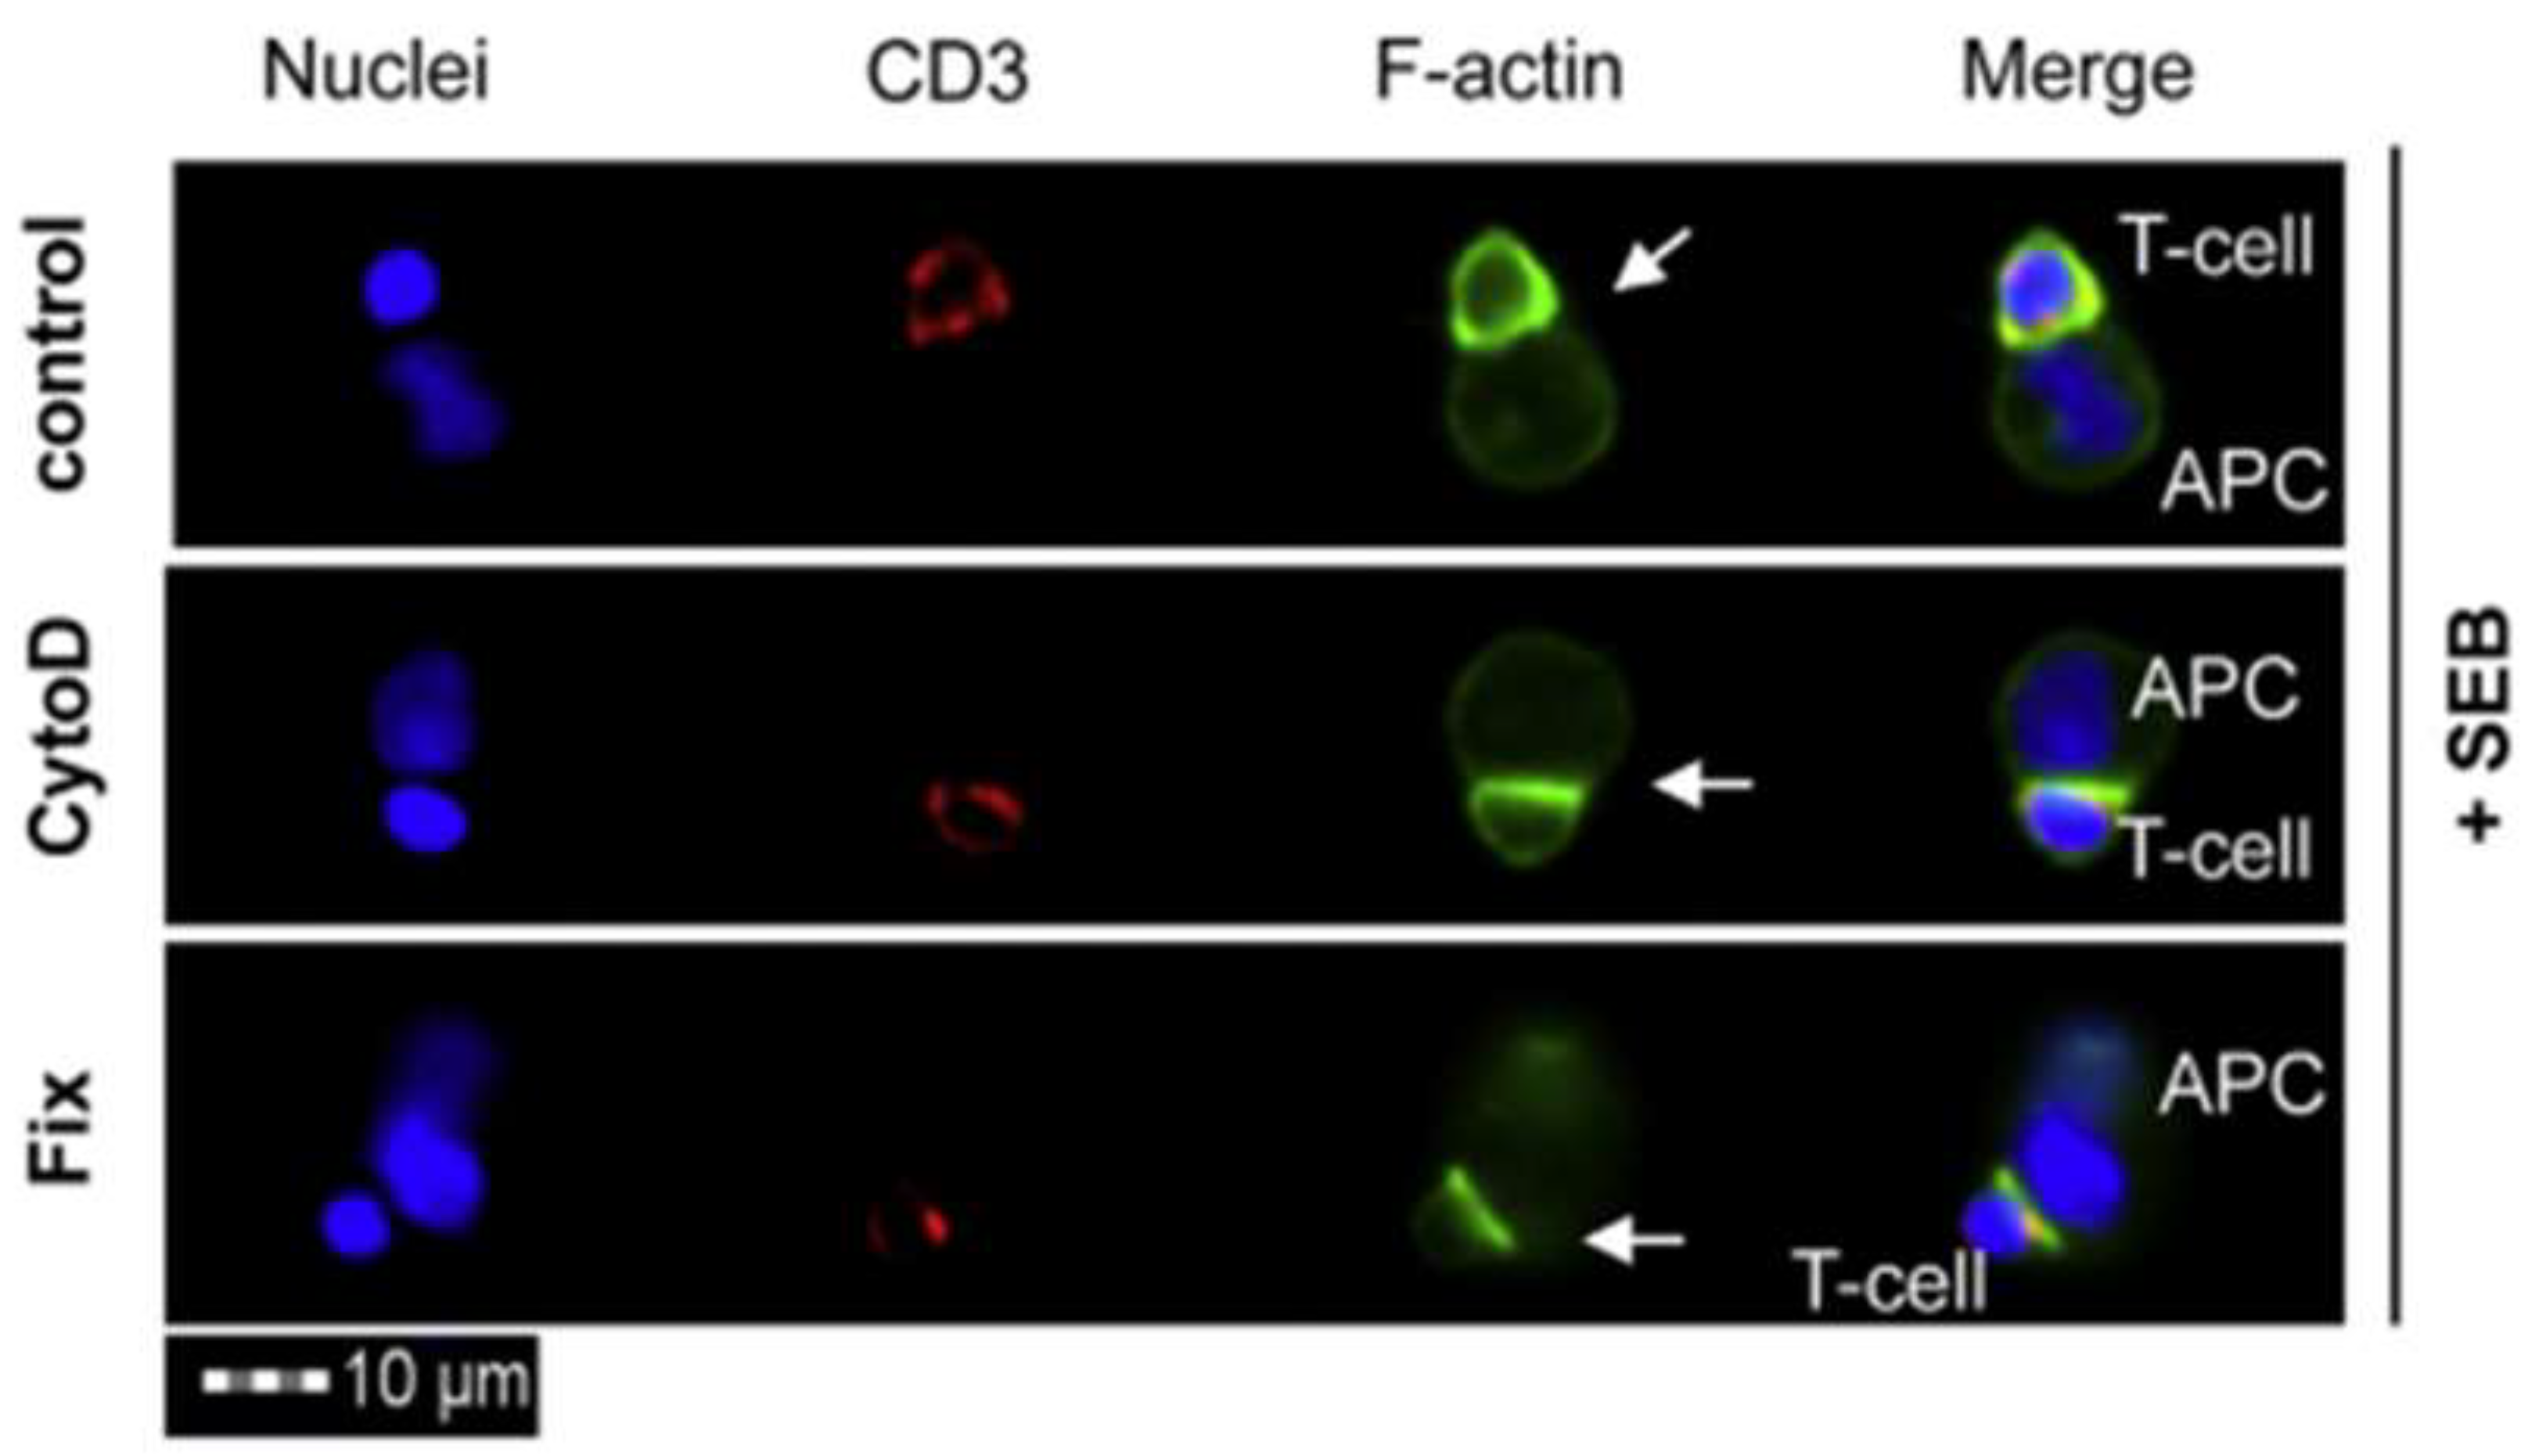
Figure 4.
Actin rearrangement during the formation of the immunological synapse between a CD4+ cell and an antigen-presenting cell (APC). The arrow indicates the localization of the immunological synapse. Receptors for intercellular interactions are concentrated on the cytoplasmic membrane due to actin filaments of the cytoskeleton; Guido H. Wabnitz et al., 2015.
Imaging flow cytometry offers numerous opportunities to assess the remodeling of the actin cytoskeleton component during HIV infection. Its high statistical power — achieved by analyzing a multitude of events combined with process visualization — enables a reliable evaluation of actin microfilament remodeling before and after HIV enters the cell. Meanwhile, standard flow cytometry does not provide information on structural changes, and microscopy falls short of the aforementioned method in terms of statistical power.
Certain software programs — for example, IDEAS 6.2 (Figure 5) — can highlight regions of the cell's cytoplasmic membrane and measure fluorescence specifically at those locations. For a contrasted visualization of CD4 receptor distribution on the cytoplasmic membrane surface, a mask can be created which includes peak fluorescence values from the receptor-targeting antibodies (Peak parameter) in the dye channel, and then subtracts the cell mask value (Morphology parameter) from this mask. Ultimately, the custom mask—termed "receptor localization"—indicates the region where receptor clusters are located. As shown in Figure 5, C cells can exhibit either a uniform distribution of the CD4 receptor (left) or discrete clusters caused by developing HIV infection (right). These clusters facilitate the intercellular transmission of HIV.
Certain software programs provide the capability to highlight regions of the cell's cytoplasmic membrane and measure fluorescence specifically at these locations. An example of such a program is IDEAS 6.2 (Figure 5). For a contrasted visualization of CD4 receptor distribution on the surface of the cytoplasmic membrane, one can create a mask that includes peak fluorescence values from the receptor-targeting antibodies (Peak parameter) in the dye channel, and then subtract the cell mask value (Morphology parameter) from this mask. Ultimately, the custom mask, termed "receptor localization", will indicate the region where receptor clusters are located. As shown in Figure 5, C cells can exhibit either a uniform distribution of the CD4 receptor (left) or discrete clusters, which may arise due to developing HIV infection (right). These clusters facilitate the intercellular transmission of HIV.
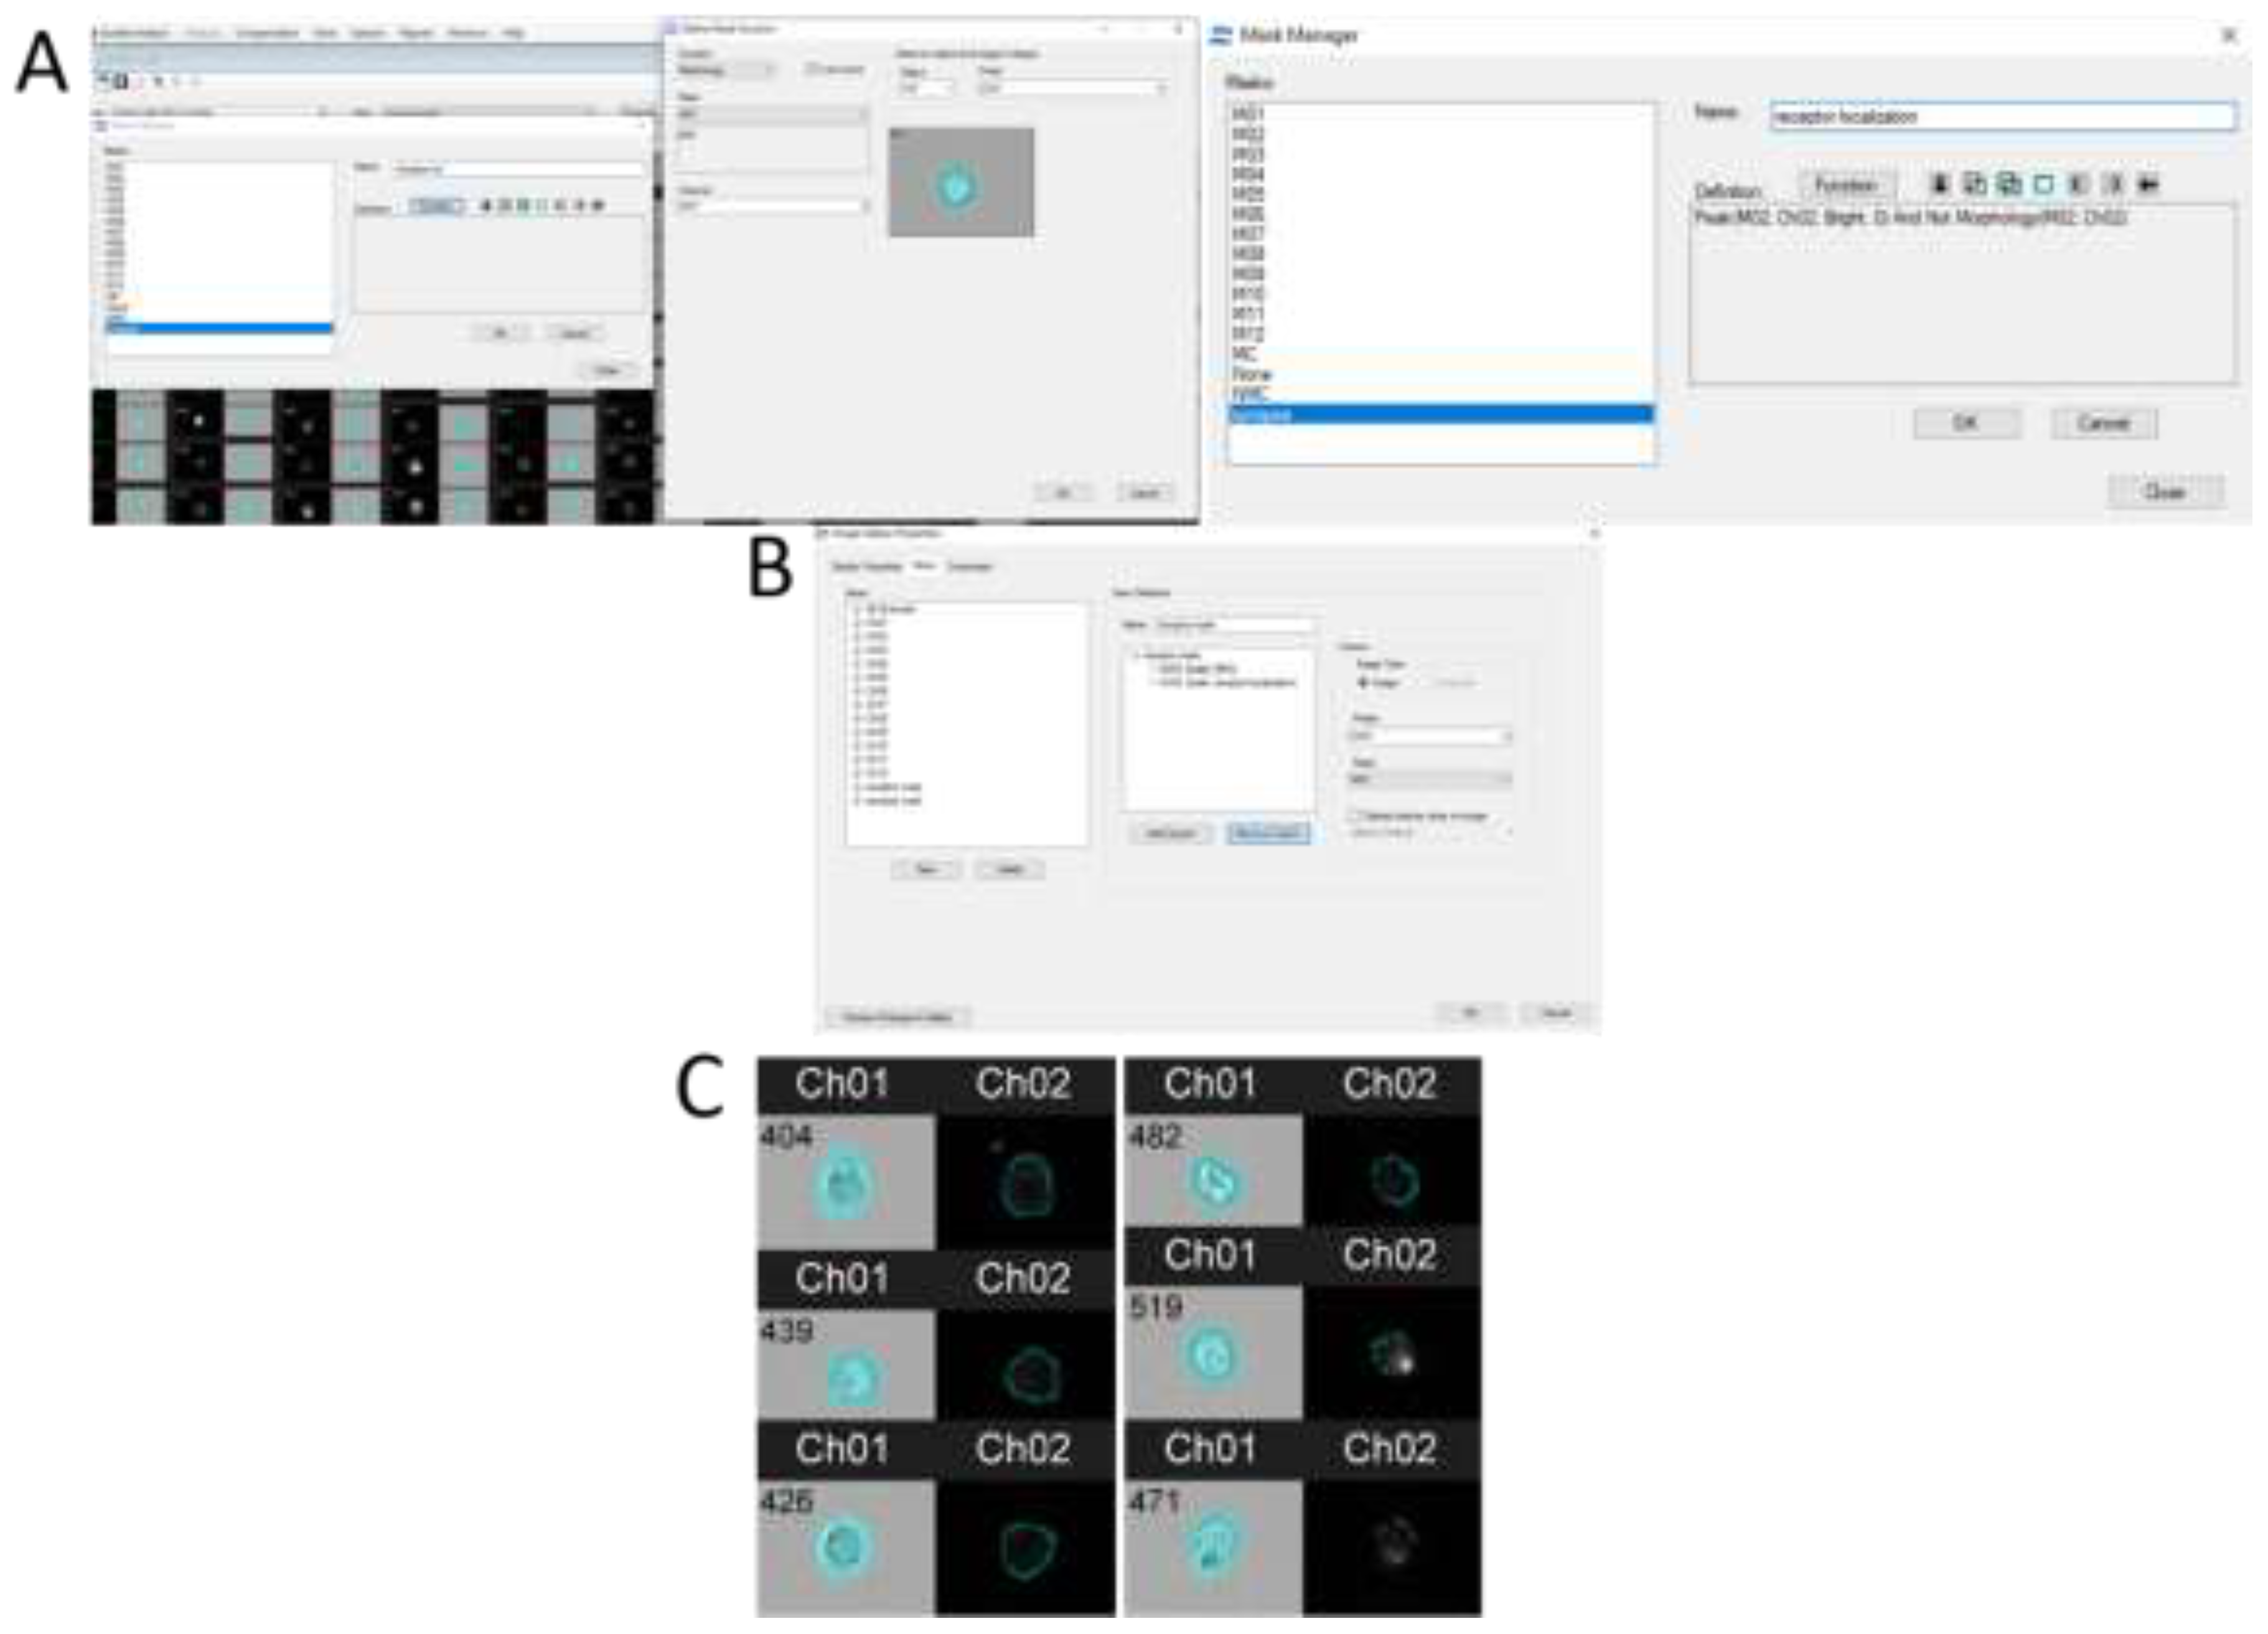
Figure 5.
Creation of a mask in IDEAS 6.2 software for visualizing the localization of CD4 receptors on the surface of the cytoplasmic membrane. Immunostaining, 40x magnification.
Figure 5.
Creation of a mask in IDEAS 6.2 software for visualizing the localization of CD4 receptors on the surface of the cytoplasmic membrane. Immunostaining, 40x magnification.
When examining events of interest, they can be isolated into a separate subpopulation for analysis (Figure 6).
Microtubules
Microtubules are the largest components of the cytoskeleton. The filaments of microtubules play a crucial role in intracellular transport; kinesin proteins are responsible for movement towards the plus end, while dyneins facilitate movement towards the minus end. HIV exploits both types of transport, initially for transporting the preintegration complex to the nucleus [54], and at later stages of infection for moving structural proteins [55] to the cytoplasmic membrane [55].
HIV regulatory proteins (Tat, Vpu, Vpr) influence microtubule-associated proteins (MAP1A, MAP1S, etc.), stabilizing their structure to meet its transport needs [56]. However, the role of microtubules in the development of productive HIV infection remains not fully elucidated. Some studies have indicated that the absence of microtubules is not critical for the productive course of HIV infection [50].
However, it is most likely that they are indeed necessary, as there is an alternative perspective supported by a series of experiments [57,58,59,60,61].
Microtubule proteins are popular targets for immunostaining for research purposes or for cellular contrast enhancement. Capturing the dynamics of microtubule assembly and disassembly in vivo is challenging due to the intricacies involved in staining intracellular targets — requiring that the cell be fixed and permeabilized. On a single specimen, cells may be at various stages of infection, so the stages of cytoskeletal dynamics during HIV infection are typically assessed within a single culture. This necessitates taking a series of microphotographs and then attempting to identify cells with different cytoskeletal states. However, this process is labor-intensive and time-consuming, as reliable statistical data collection requires examining no fewer than 100 fields of view on one specimen.
Imaging flow cytometry offers several advantages over other methods for studying microtubule rearrangement during HIV infection. In addition to the previously mentioned increase in statistical power of experiments and reduction in time spent analyzing samples under a microscope, the IDEAS 6.2 software for the Amnis series flow cytometers provides a specialized mask for visualizing the cellular cytoskeleton (Figure 7).
Since microtubules are the largest proteins within this group of organelles, they will be prioritized and most likely to be identified within the mask's field of view.
Direct Detection of HIV Gene Expression and HIV Protein Interactions With Host Cell Proteins
Molecular cloning and genetic engineering techniques enable the construction of reporter gene systems to evaluate the expression of HIV genes [62] or to modify existing gene sequences for fluorescent visualization of HIV proteins via the mechanism of FRET (fluorescence resonance energy transfer) [63,64].
A reporter gene is a gene encoding a fluorescent protein linked to the existing promoter of another gene [65]. Upon promoter activation, the fluorescent protein is expressed alongside the HIV gene or genes, allowing for the monitoring of their transcription. This model system offers several advantages: it eliminates the need for additional staining and preparation steps, allows for the acquisition of rapid and reproducible results, and enables the assessment of gene expression in live cells.
FRET microscopy, or Förster Resonance Energy Transfer, is based on the interaction between two fluorochromes: one serves as a photon acceptor and an energy donor for the other fluorochrome. This effect occurs when two molecules are in close proximity and the emission spectrum of one molecule overlaps with the emission spectrum of the other [66,67]. Such a system is employed for studying protein interactions, as the donor and acceptor will only function in close contact (distance <10 nm). Fragments of specific fluorochromes are attached to the protein genes. If the two molecules do not interact with each other, the fluorescence detector records the emissions of the two molecules separately. However, if the donor and acceptor are within 10 nm of each other, their combined emission will fall within an intermediate range between the emission peaks of the two molecules. The value of detecting such construction is significantly enhanced when combined with data on the spatial distribution of the signal. Therefore, imaging flow cytometry is a powerful method for assessing FRET, allowing researchers to obtain information on fluorescence levels along with the localization of luminescent spots within the cell.
The Amnis flow cytometers software of features a specialized tool for analyzing dye co-localization – the Co-localization wizard. This function simplifies the analysis of experimental results by providing a series of two-dimensional graphs with prompts on which specific population should be gated at each step. Initially, the software will prompt the user to identify the fluorescence channels of the samples, followed by the selection of focused and singular cells, and finally, the population of cells exhibiting fluorescence. The outcome of the wizard's function is an emerging population of cells with co-localization of the two fluorescent samples.
Conclusions
Imaging flow cytometry represents a significant advancement in integrating the foundational techniques of cell biology: flow cytometry and microscopy. This method combines the best features of its classical predecessors, specifically the high statistical power due to the analysis of a large number of events and the visualization of results through microphotographs of all analyzed events. It is important to highlight the additional capability of flow cytometry instruments equipped with imaging to work with masks. High-quality visualization and contrast of individual cell components require the use of masks in image processing.
Besides these advantages, imaging flow cytometry platforms are equipped with highly capable software, offering features such as the delineation of individual cell compartments and virtual sorting of events for further analysis of subpopulations.
For all these reasons, imaging flow cytometry is a convenient tool for investigating HIV infection. HIV has a complex life cycle and a wide array of regulatory proteins for interactions with the host cell. Its impact on the human cell life cycle and metabolism remains a subject of study and debate, particularly concerning the mechanisms involved in cell-to-cell transmission.
The main types of masks used for the discussed applications of flow cytometry in HIV infection research are presented in Table 1.
Imaging flow cytometry currently lags behind traditional flow cytometry in terms of the flow rate and the ability to physically sort cells. Microscopy can achieve superior resolution compared to imaging flow cytometers, particularly when specific equipment models are used. Imaging flow cytometers serve as a supplementary tool rather than a complete replacement for certain laboratory equipment. Nonetheless, as technology continues to progress, there is potential for an emergent generation of instruments that will incorporate physical cell sorting capabilities and improved resolution. This advancement will likely stem from the integration of novel technologies in the fabrication of electronic components and optics.
Funding
This research was supported by the Ministry of Science and Higher Education of the Russian Federation (Agreement No. 075-15-2019-1665).
References
- Ho, Y.-C.; Shan, L.; Hosmane, N.N.; Wang, J.; Laskey, S.B.; Rosenbloom, D.I.S.; Lai, J.; Blankson, J.N.; Siliciano, J.D.; Siliciano, R.F. Replication-Competent Noninduced Proviruses in the Latent Reservoir Increase Barrier to HIV-1 Cure. Cell 2013, 155, 540–551. [Google Scholar] [CrossRef] [PubMed]
- The Urgency of Now: AIDS at a Crossroads. Geneva: Joint United Nations Programme on HIV/AIDS; 2024. Licence: CC BY-NC-SA 3.0 IGO.
- UNAIDS In Danger: UNAIDS Global AIDS Update 2022; United Nations, 2022; ISBN 978-92-1-001979-8.
- McClung, R.P.; Oster, A.M.; Ocfemia, M.C.B.; Saduvala, N.; Heneine, W.; Johnson, J.A.; Hernandez, A.L. Transmitted Drug Resistance Among Human Immunodeficiency Virus (HIV)-1 Diagnoses in the United States, 2014–2018. Clin. Infect. Dis. 2022, 74, 1055–1062. [Google Scholar] [CrossRef] [PubMed]
- Ngo-Giang-Huong, N.; Huynh, T.H.K.; Dagnra, A.Y.; Toni, T.; Maiga, A.I.; Kania, D.; Eymard-Duvernay, S.; Peeters, M.; Soulie, C.; Peytavin, G.; et al. Prevalence of Pretreatment HIV Drug Resistance in West African and Southeast Asian Countries. J. Antimicrob. Chemother. 2019, 74, 462–467. [Google Scholar] [CrossRef]
- Segal-Maurer, S.; DeJesus, E.; Stellbrink, H.-J.; Castagna, A.; Richmond, G.J.; Sinclair, G.I.; Siripassorn, K.; Ruane, P.J.; Berhe, M.; Wang, H.; et al. Capsid Inhibition with Lenacapavir in Multidrug-Resistant HIV-1 Infection. N. Engl. J. Med. 2022, 386, 1793–1803. [Google Scholar] [CrossRef]
- Achour, A.; Hazan, U.; Nugeyre, M.T.; Barré-Sinoussi, F.; Metezeau, P.; Gachelin, H.; Chapuis, F.; Klatzman, D.; Gluckman, J.C.; Goldberg, M.; et al. A Binding Assay to Identify HIV (LAV) Target Cells. Ann. Inst. Pasteur Virol. 1986, 137, 291–302. [Google Scholar] [CrossRef]
- Black, C.B.; Duensing, T.D.; Trinkle, L.S.; Dunlay, R.T. Cell-Based Screening Using High-Throughput Flow Cytometry. ASSAY Drug Dev. Technol. 2011, 9, 13–20. [Google Scholar] [CrossRef]
- Zamora, J.L.R.; Aguilar, H.C. Flow Virometry as a Tool to Study Viruses. Methods 2018, 134–135, 87–97. [Google Scholar] [CrossRef]
- Bell, P.; Montaner, L.J.; Maul, G.G. Accumulation and Intranuclear Distribution of Unintegrated Human Immunodeficiency Virus Type 1 DNA. J. Virol. 2001, 75, 7683–7691. [Google Scholar] [CrossRef]
- Belmonti, S.; Di Giambenedetto, S.; Lombardi, F. Quantification of Total HIV DNA as a Marker to Measure Viral Reservoir: Methods and Potential Implications for Clinical Practice. Diagnostics 2021, 12, 39. [Google Scholar] [CrossRef]
- Arabi, F.; Mansouri, V.; Ahmadbeigi, N. Gene Therapy Clinical Trials, Where Do We Go? An Overview. Biomed. Pharmacother. 2022, 153, 113324. [Google Scholar] [CrossRef]
- Dubey, A.K.; Kumar Gupta, V.; Kujawska, M.; Orive, G.; Kim, N.-Y.; Li, C.; Kumar Mishra, Y.; Kaushik, A. Exploring Nano-Enabled CRISPR-Cas-Powered Strategies for Efficient Diagnostics and Treatment of Infectious Diseases. J. Nanostructure Chem. 2022, 12, 833–864. [Google Scholar] [CrossRef] [PubMed]
- Zhao, Z.; Anselmo, A.C.; Mitragotri, S. Viral VECTOR‐BASED Gene Therapies in the Clinic. Bioeng. Transl. Med. 2022, 7, e10258. [Google Scholar] [CrossRef] [PubMed]
- Chattopadhyay, P.K.; Roederer, M. Good Cell, Bad Cell: Flow Cytometry Reveals T-cell Subsets Important in HIV Disease. Cytometry A 2010, 77A, 614–622. [Google Scholar] [CrossRef] [PubMed]
- Pallikkuth, S.; Sharkey, M.; Babic, D.Z.; Gupta, S.; Stone, G.W.; Fischl, M.A.; Stevenson, M.; Pahwa, S. Peripheral T Follicular Helper Cells Are the Major HIV Reservoir within Central Memory CD4 T Cells in Peripheral Blood from Chronically HIV-Infected Individuals on Combination Antiretroviral Therapy. J. Virol. 2016, 90, 2718–2728. [Google Scholar] [CrossRef]
- Chaillon, A.; Gianella, S.; Dellicour, S.; Rawlings, S.A.; Schlub, T.E.; De Oliveira, M.F.; Ignacio, C.; Porrachia, M.; Vrancken, B.; Smith, D.M. HIV Persists throughout Deep Tissues with Repopulation from Multiple Anatomical Sources. J. Clin. Invest. 2020, 130, 1699–1712. [Google Scholar] [CrossRef]
- Patel, A.A.; Ginhoux, F.; Yona, S. Monocytes, Macrophages, Dendritic Cells and Neutrophils: An Update on Lifespan Kinetics in Health and Disease. Immunology 2021, 163, 250–261. [Google Scholar] [CrossRef]
- Kruize, Z.; Kootstra, N.A. The Role of Macrophages in HIV-1 Persistence and Pathogenesis. Front. Microbiol. 2019, 10, 2828. [Google Scholar] [CrossRef]
- Agosto, L.M.; Uchil, P.D.; Mothes, W. HIV Cell-to-Cell Transmission: Effects on Pathogenesis and Antiretroviral Therapy. Trends Microbiol. 2015, 23, 289–295. [Google Scholar] [CrossRef]
- Valdebenito, S.; Castellano, P.; Ajasin, D.; Eugenin, E.A. Astrocytes Are HIV Reservoirs in the Brain: A Cell Type with Poor HIV Infectivity and Replication but Efficient Cell-to-cell Viral Transfer. J. Neurochem. 2021, 158, 429–443. [Google Scholar] [CrossRef]
- Lutgen, V.; Narasipura, S.D.; Barbian, H.J.; Richards, M.; Wallace, J.; Razmpour, R.; Buzhdygan, T.; Ramirez, S.H.; Prevedel, L.; Eugenin, E.A.; et al. HIV Infects Astrocytes in Vivo and Egresses from the Brain to the Periphery. PLOS Pathog. 2020, 16, e1008381. [Google Scholar] [CrossRef]
- Pandey, H.S.; Seth, P. Friends Turn Foe—Astrocytes Contribute to Neuronal Damage in NeuroAIDS. J. Mol. Neurosci. 2019, 69, 286–297. [Google Scholar] [CrossRef] [PubMed]
- Ash, M.K.; Al-Harthi, L.; Schneider, J.R. HIV in the Brain: Identifying Viral Reservoirs and Addressing the Challenges of an HIV Cure. Vaccines 2021, 9, 867. [Google Scholar] [CrossRef] [PubMed]
- Riggs, P.K.; Chaillon, A.; Jiang, G.; Letendre, S.L.; Tang, Y.; Taylor, J.; Kaytes, A.; Smith, D.M.; Dubé, K.; Gianella, S. Lessons for Understanding Central Nervous System HIV Reservoirs from the Last Gift Program. Curr. HIV/AIDS Rep. 2022, 19, 566–579. [Google Scholar] [CrossRef]
- Freen-van Heeren, J.J. Flow-FISH as a Tool for Studying Bacteria, Fungi and Viruses. BioTech 2021, 10, 21. [Google Scholar] [CrossRef] [PubMed]
- Lucic, B.; Chen, H.-C.; Kuzman, M.; Zorita, E.; Wegner, J.; Minneker, V.; Wang, W.; Fronza, R.; Laufs, S.; Schmidt, M.; et al. Spatially Clustered Loci with Multiple Enhancers Are Frequent Targets of HIV-1 Integration. Nat. Commun. 2019, 10, 4059. [Google Scholar] [CrossRef]
- Marini, B.; Kertesz-Farkas, A.; Ali, H.; Lucic, B.; Lisek, K.; Manganaro, L.; Pongor, S.; Luzzati, R.; Recchia, A.; Mavilio, F.; et al. Nuclear Architecture Dictates HIV-1 Integration Site Selection. Nature 2015, 521, 227–231. [Google Scholar] [CrossRef]
- Puray-Chavez, M. Multiplex Single-Cell Visualization of Nucleic Acids and Protein during HIV Infection. Nat. Commun.
- Wang, D.; Li, L.-B.; Hou, Z.-W.; Kang, X.-J.; Xie, Q.-D.; Yu, X.; Ma, M.-F.; Ma, B.-L.; Wang, Z.-S.; Lei, Y.; et al. The Integrated HIV-1 Provirus in Patient Sperm Chromosome and Its Transfer into the Early Embryo by Fertilization. PLoS ONE 2011, 6, e28586. [Google Scholar] [CrossRef]
- Zhang, X.; Yue, L.; Zhang, Z.; Yuan, Z. Establishment of a Fluorescent in Situ Hybridization Assay for Imaging Hepatitis B Virus Nucleic Acids in Cell Culture Models. Emerg. Microbes Infect. 2017, 6, 1–6. [Google Scholar] [CrossRef]
- Pfankuche, V.M.; Hahn, K.; Bodewes, R.; Hansmann, F.; Habierski, A.; Haverkamp, A.-K.; Pfaender, S.; Walter, S.; Baechlein, C.; Postel, A.; et al. Comparison of Different In Situ Hybridization Techniques for the Detection of Various RNA and DNA Viruses. Viruses 2018, 10, 384. [Google Scholar] [CrossRef]
- Majarian, T.D.; Murphy, R.F.; Lakdawala, S.S. Learning the Sequence of Influenza A Genome Assembly during Viral Replication Using Point Process Models and Fluorescence in Situ Hybridization. PLOS Comput. Biol. 2019, 15, e1006199. [Google Scholar] [CrossRef]
- Chou, Y. Single-Molecule Sensitivity RNA FISH Analysis of Influenza Virus Genome Trafficking.
- Deleage, C.; Chan, C.N.; Busman-Sahay, K.; Estes, J.D. Next-Generation in Situ Hybridization Approaches to Define and Quantify HIV and SIV Reservoirs in Tissue Microenvironments. Retrovirology 2018, 15, 4. [Google Scholar] [CrossRef] [PubMed]
- Sannier, G. Combined Single-Cell Transcriptional, Translational, and Genomic Profiling Reveals HIV-1 Reservoir Diversity. OPEN ACCESS.
- Grau-Expósito, J.; Serra-Peinado, C.; Miguel, L.; Navarro, J.; Curran, A.; Burgos, J.; Ocaña, I.; Ribera, E.; Torrella, A.; Planas, B.; et al. A Novel Single-Cell FISH-Flow Assay Identifies Effector Memory CD4+ T Cells as a Major Niche for HIV-1 Transcription in HIV-Infected Patients. mBio 2017, 8, e00876–17. [Google Scholar] [CrossRef] [PubMed]
- Wang, X.; Ao, Z.; Chen, L.; Kobinger, G.; Peng, J.; Yao, X. The Cellular Antiviral Protein APOBEC3G Interacts with HIV-1 Reverse Transcriptase and Inhibits Its Function during Viral Replication. J. Virol. 2012, 86, 3777–3786. [Google Scholar] [CrossRef] [PubMed]
- Banga, R.; Rebecchini, C.; Procopio, F.A.; Noto, A.; Munoz, O.; Ioannidou, K.; Fenwick, C.; Ohmiti, K.; Cavassini, M.; Corpataux, J.-M.; et al. Lymph Node Migratory Dendritic Cells Modulate HIV-1 Transcription through PD-1 Engagement. PLOS Pathog. 2019, 15, e1007918. [Google Scholar] [CrossRef]
- Wang, S.; Zhang, Q.; Hui, H.; Agrawal, K.; Karris, M.A.Y.; Rana, T.M. An Atlas of Immune Cell Exhaustion in HIV-Infected Individuals Revealed by Single-Cell Transcriptomics. Emerg. Microbes Infect. 2020, 9, 2333–2347. [Google Scholar] [CrossRef]
- Ganor, Y.; Real, F.; Sennepin, A.; Dutertre, C.-A.; Prevedel, L.; Xu, L.; Tudor, D.; Charmeteau, B.; Couedel-Courteille, A.; Marion, S.; et al. HIV-1 Reservoirs in Urethral Macrophages of Patients under Suppressive Antiretroviral Therapy. Nat. Microbiol. 2019, 4, 633–644. [Google Scholar] [CrossRef]
- Fletcher, D.A.; Mullins, R.D. Cell Mechanics and the Cytoskeleton. Nature 2010, 463, 485–492. [Google Scholar] [CrossRef]
- Baxter, A.E.; Niessl, J.; Fromentin, R.; Richard, J.; Porichis, F.; Massanella, M.; Brassard, N.; Alsahafi, N.; Routy, J.-P.; Finzi, A.; et al. Multiparametric Characterization of Rare HIV-Infected Cells Using an RNA-Flow FISH Technique. Nat. Protoc. 2017, 12, 2029–2049. [Google Scholar] [CrossRef]
- Wilburn, K.M. Heterogeneous Loss of HIV Transcription and Proviral DNA from 8E5/LAV Lymphoblastic Leukemia Cells Revealed by RNA FISH:FLOW Analyses. 2016. [Google Scholar]
- Nassar, M.; Doan, M.; Filby, A.; Wolkenhauer, O.; Fogg, D.K.; Piasecka, J.; Thornton, C.A.; Carpenter, A.E.; Summers, H.D.; Rees, P.; et al. Label-Free Identification of White Blood Cells Using Machine Learning. Cytometry A 2019, 95, 836–842. [Google Scholar] [CrossRef]
- Hennig, H.; Rees, P.; Blasi, T.; Kamentsky, L.; Hung, J.; Dao, D.; Carpenter, A.E.; Filby, A. An Open-Source Solution for Advanced Imaging Flow Cytometry Data Analysis Using Machine Learning. Methods 2017, 112, 201–210. [Google Scholar] [CrossRef]
- Stolp, B.; Fackler, O.T. How HIV Takes Advantage of the Cytoskeleton in Entry and Replication. Viruses 2011, 3, 293–311. [Google Scholar] [CrossRef] [PubMed]
- Naghavi, M.H. HIV-1 Capsid Exploitation of the Host Microtubule Cytoskeleton during Early Infection. Retrovirology 2021, 18, 19. [Google Scholar] [CrossRef] [PubMed]
- Bracq, L.; Xie, M.; Benichou, S.; Bouchet, J. Mechanisms for Cell-to-Cell Transmission of HIV-1. Front. Immunol. 2018, 9, 260. [Google Scholar] [CrossRef] [PubMed]
- Jiménez-Baranda, S.; Gómez-Moutón, C.; Rojas, A.; Martínez-Prats, L.; Mira, E.; Ana Lacalle, R.; Valencia, A.; Dimitrov, D.S.; Viola, A.; Delgado, R.; et al. Filamin-A Regulates Actin-Dependent Clustering of HIV Receptors. Nat. Cell Biol. 2007, 9, 838–846. [Google Scholar] [CrossRef]
- Ospina Stella, A.; Turville, S. All-Round Manipulation of the Actin Cytoskeleton by HIV. Viruses 2018, 10, 63. [Google Scholar] [CrossRef]
- Stolp, B.; Abraham, L.; Rudolph, J.M.; Fackler, O.T. Lentiviral Nef Proteins Utilize PAK2-Mediated Deregulation of Cofilin as a General Strategy To Interfere with Actin Remodeling. J. Virol. 2010, 84, 3935–3948. [Google Scholar] [CrossRef]
- Aggarwal, A.; Stella, A.O.; Henry, C.C.; Narayan, K.; Turville, S.G. Embedding of HIV Egress within Cortical F-Actin. Pathogens 2022, 11, 56. [Google Scholar] [CrossRef]
- Dharan, A.; Campbell, E.M. Role of Microtubules and Microtubule-Associated Proteins in HIV-1 Infection. J. Virol. 2018, 92, e00085–18. [Google Scholar] [CrossRef]
- Sabo, Y. HIV-1 Induces the Formation of Stable Microtubules to Enhance Early Infection.
- Yoder, A.; Guo, J.; Yu, D.; Cui, Z.; Zhang, X.-E.; Wu, Y. Effects of Microtubule Modulators on HIV-1 Infection of Transformed and Resting CD4 T Cells. J. Virol. 2011, 85, 3020–3024. [Google Scholar] [CrossRef]
- Chen, D. HIV-1 Tat Targets Microtubules to Induce Apoptosis, a Process Promoted by the pro-Apoptotic Bcl-2 Relative Bim. EMBO J. 2002, 21, 6801–6810. [Google Scholar] [CrossRef]
- De Mareuil, J.; Carre, M.; Barbier, P.; Campbell, G.R.; Lancelot, S.; Opi, S.; Esquieu, D.; Watkins, J.D.; Prevot, C.; Braguer, D.; et al. HIV-1 Tat Protein Enhances Microtubule Polymerization. Retrovirology 2005, 2, 5. [Google Scholar] [CrossRef] [PubMed]
- Handley, M.A.; Paddock, S.; Dall, A.; Panganiban, A.T. Association of Vpu-Binding Protein with Microtubules and Vpu-Dependent Redistribution of HIV-1 Gag Protein. Virology 2001, 291, 198–207. [Google Scholar] [CrossRef] [PubMed]
- Xie, W. HIV-1 Exposure Triggers Autophagic Degradation of Stathmin and Hyperstabilization of Microtubules to Disrupt Epithelial Cell Junctions.
- Laverdure, S.; Gross, A.; Arpin-André, C.; Clerc, I.; Beaumelle, B.; Barbeau, B.; Mesnard, J.-M. HIV-1 Antisense Transcription Is Preferentially Activated in Primary Monocyte-Derived Cells. J. Virol. 2012, 86, 13785–13789. [Google Scholar] [CrossRef] [PubMed]
- Takagi, S.; Momose, F.; Morikawa, Y. FRET Analysis of HIV-1 Gag and GagPol Interactions. FEBS Open Bio 2017, 7, 1815–1825. [Google Scholar] [CrossRef]
- Sarca, A.D.; Sardo, L.; Fukuda, H.; Matsui, H.; Shirakawa, K.; Horikawa, K.; Takaori-Kondo, A.; Izumi, T. FRET-Based Detection and Quantification of HIV-1 Virion Maturation. Front. Microbiol. 2021, 12, 647452. [Google Scholar] [CrossRef]
- Bourdeau, R.W.; Lee-Gosselin, A.; Lakshmanan, A.; Farhadi, A.; Kumar, S.R.; Nety, S.P.; Shapiro, M.G. Acoustic Reporter Genes for Noninvasive Imaging of Microorganisms in Mammalian Hosts. Nature 2018, 553, 86–90. [Google Scholar] [CrossRef]
- Algar, W.R.; Hildebrandt, N.; Vogel, S.S.; Medintz, I.L. FRET as a Biomolecular Research Tool — Understanding Its Potential While Avoiding Pitfalls. Nat. Methods 2019, 16, 815–829. [Google Scholar] [CrossRef]
- Shrestha, D.; Jenei, A.; Nagy, P.; Vereb, G.; Szöllősi, J. Understanding FRET as a Research Tool for Cellular Studies. Int. J. Mol. Sci. 2015, 16, 6718–6756. [Google Scholar] [CrossRef]
- Imaging Flow Cytometry: Methods and Protocols; Barteneva, N. S., Vorobjev, I.A., Eds.; Methods in Molecular Biology; Springer New York: New York, NY, 2016; Vol. 1389; ISBN 978-1-4939-3300-6. [Google Scholar]
Figure 1.
illustrates the image and mask construction principle in Amnis flow cytometers: A – signal accumulation from charge pixels on the CCD camera; along the Z-axis is the fluorescence intensity scale, while the X and Y axes denote the cell's coordinates on a plane, with each square between X and Y axes representing a section of the CCD matrix (pixel) accumulating the fluorescent signal; B – the formation of a two-dimensional image based on signals from the CCD camera, depending on photon count from various cell areas (X and Y axes); C – an example of creating a new mask by combining basic masks using the logical NOT operator, Venina Dominical et al., 2016.
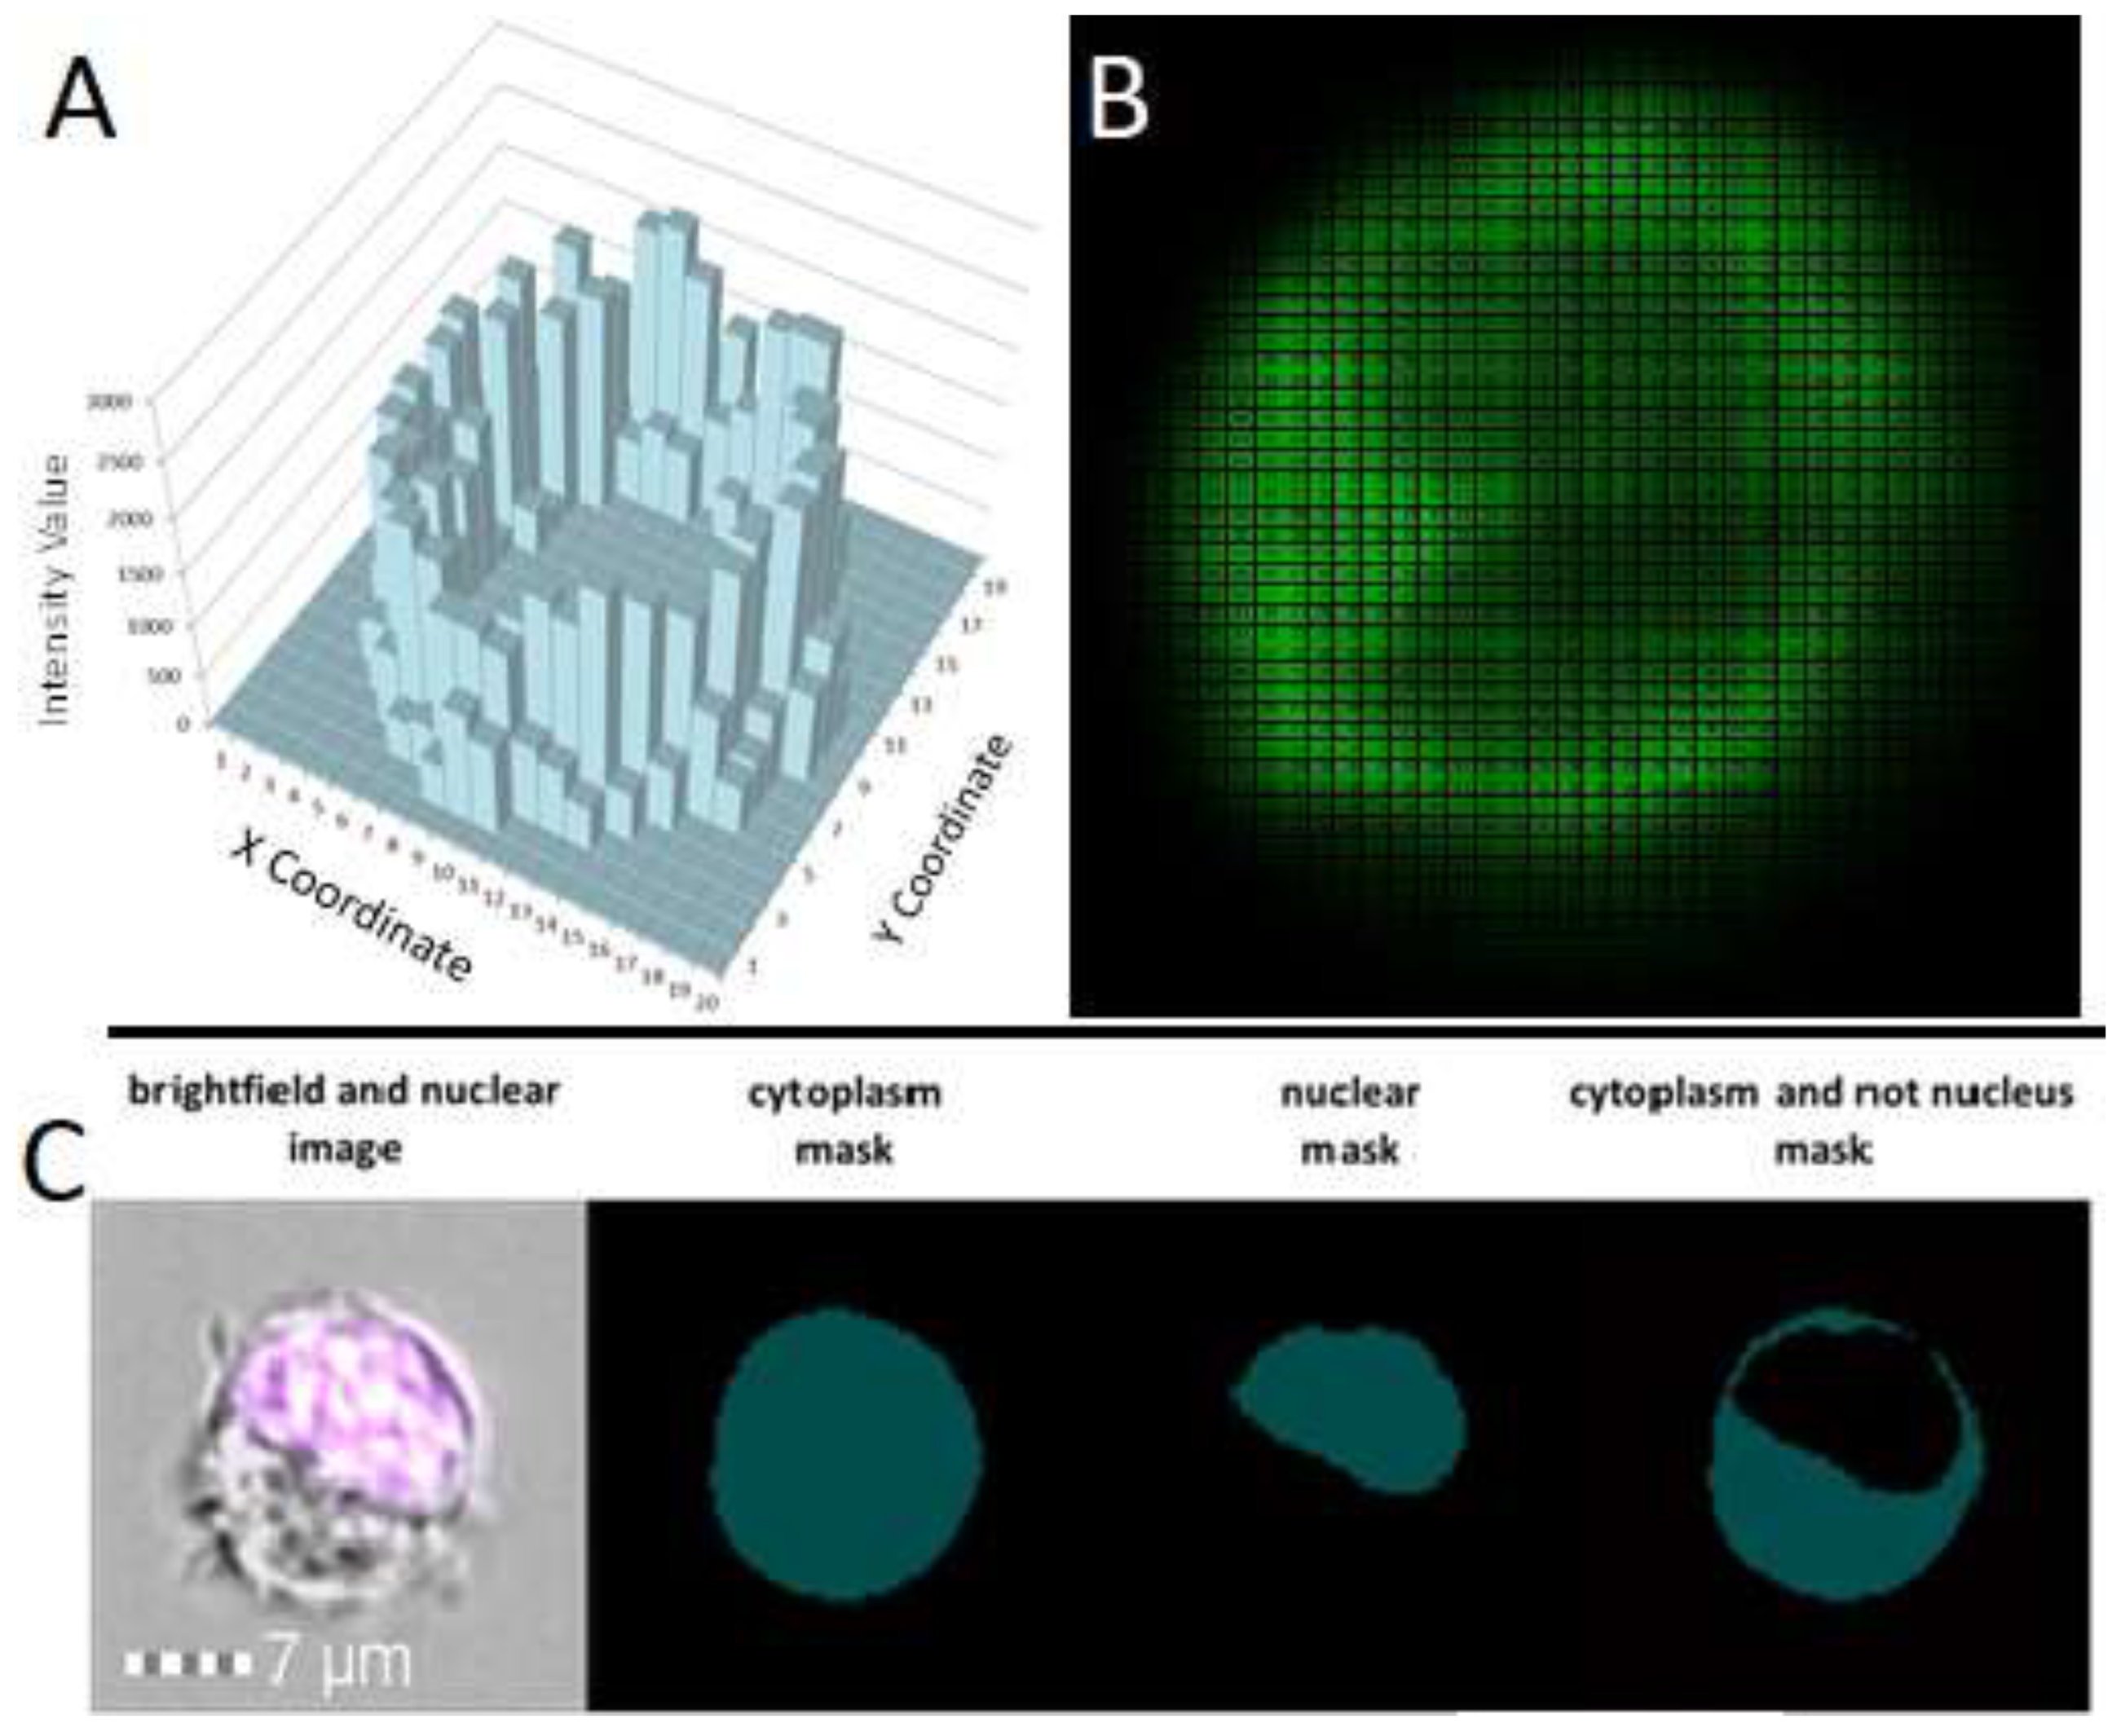
Figure 2.
Hybridization spot detection using imaging flow cytometry:.A – Gating strategy for isolating a population of single cells; B – Segregation of populations with a low number of hybridization spots (left) and a high number of hybridization spots (right); C – Distribution plot of events based on the number of hybridization signals, generated using IDEAS 6.2 software for flow cytometers with the Amnis imaging system.
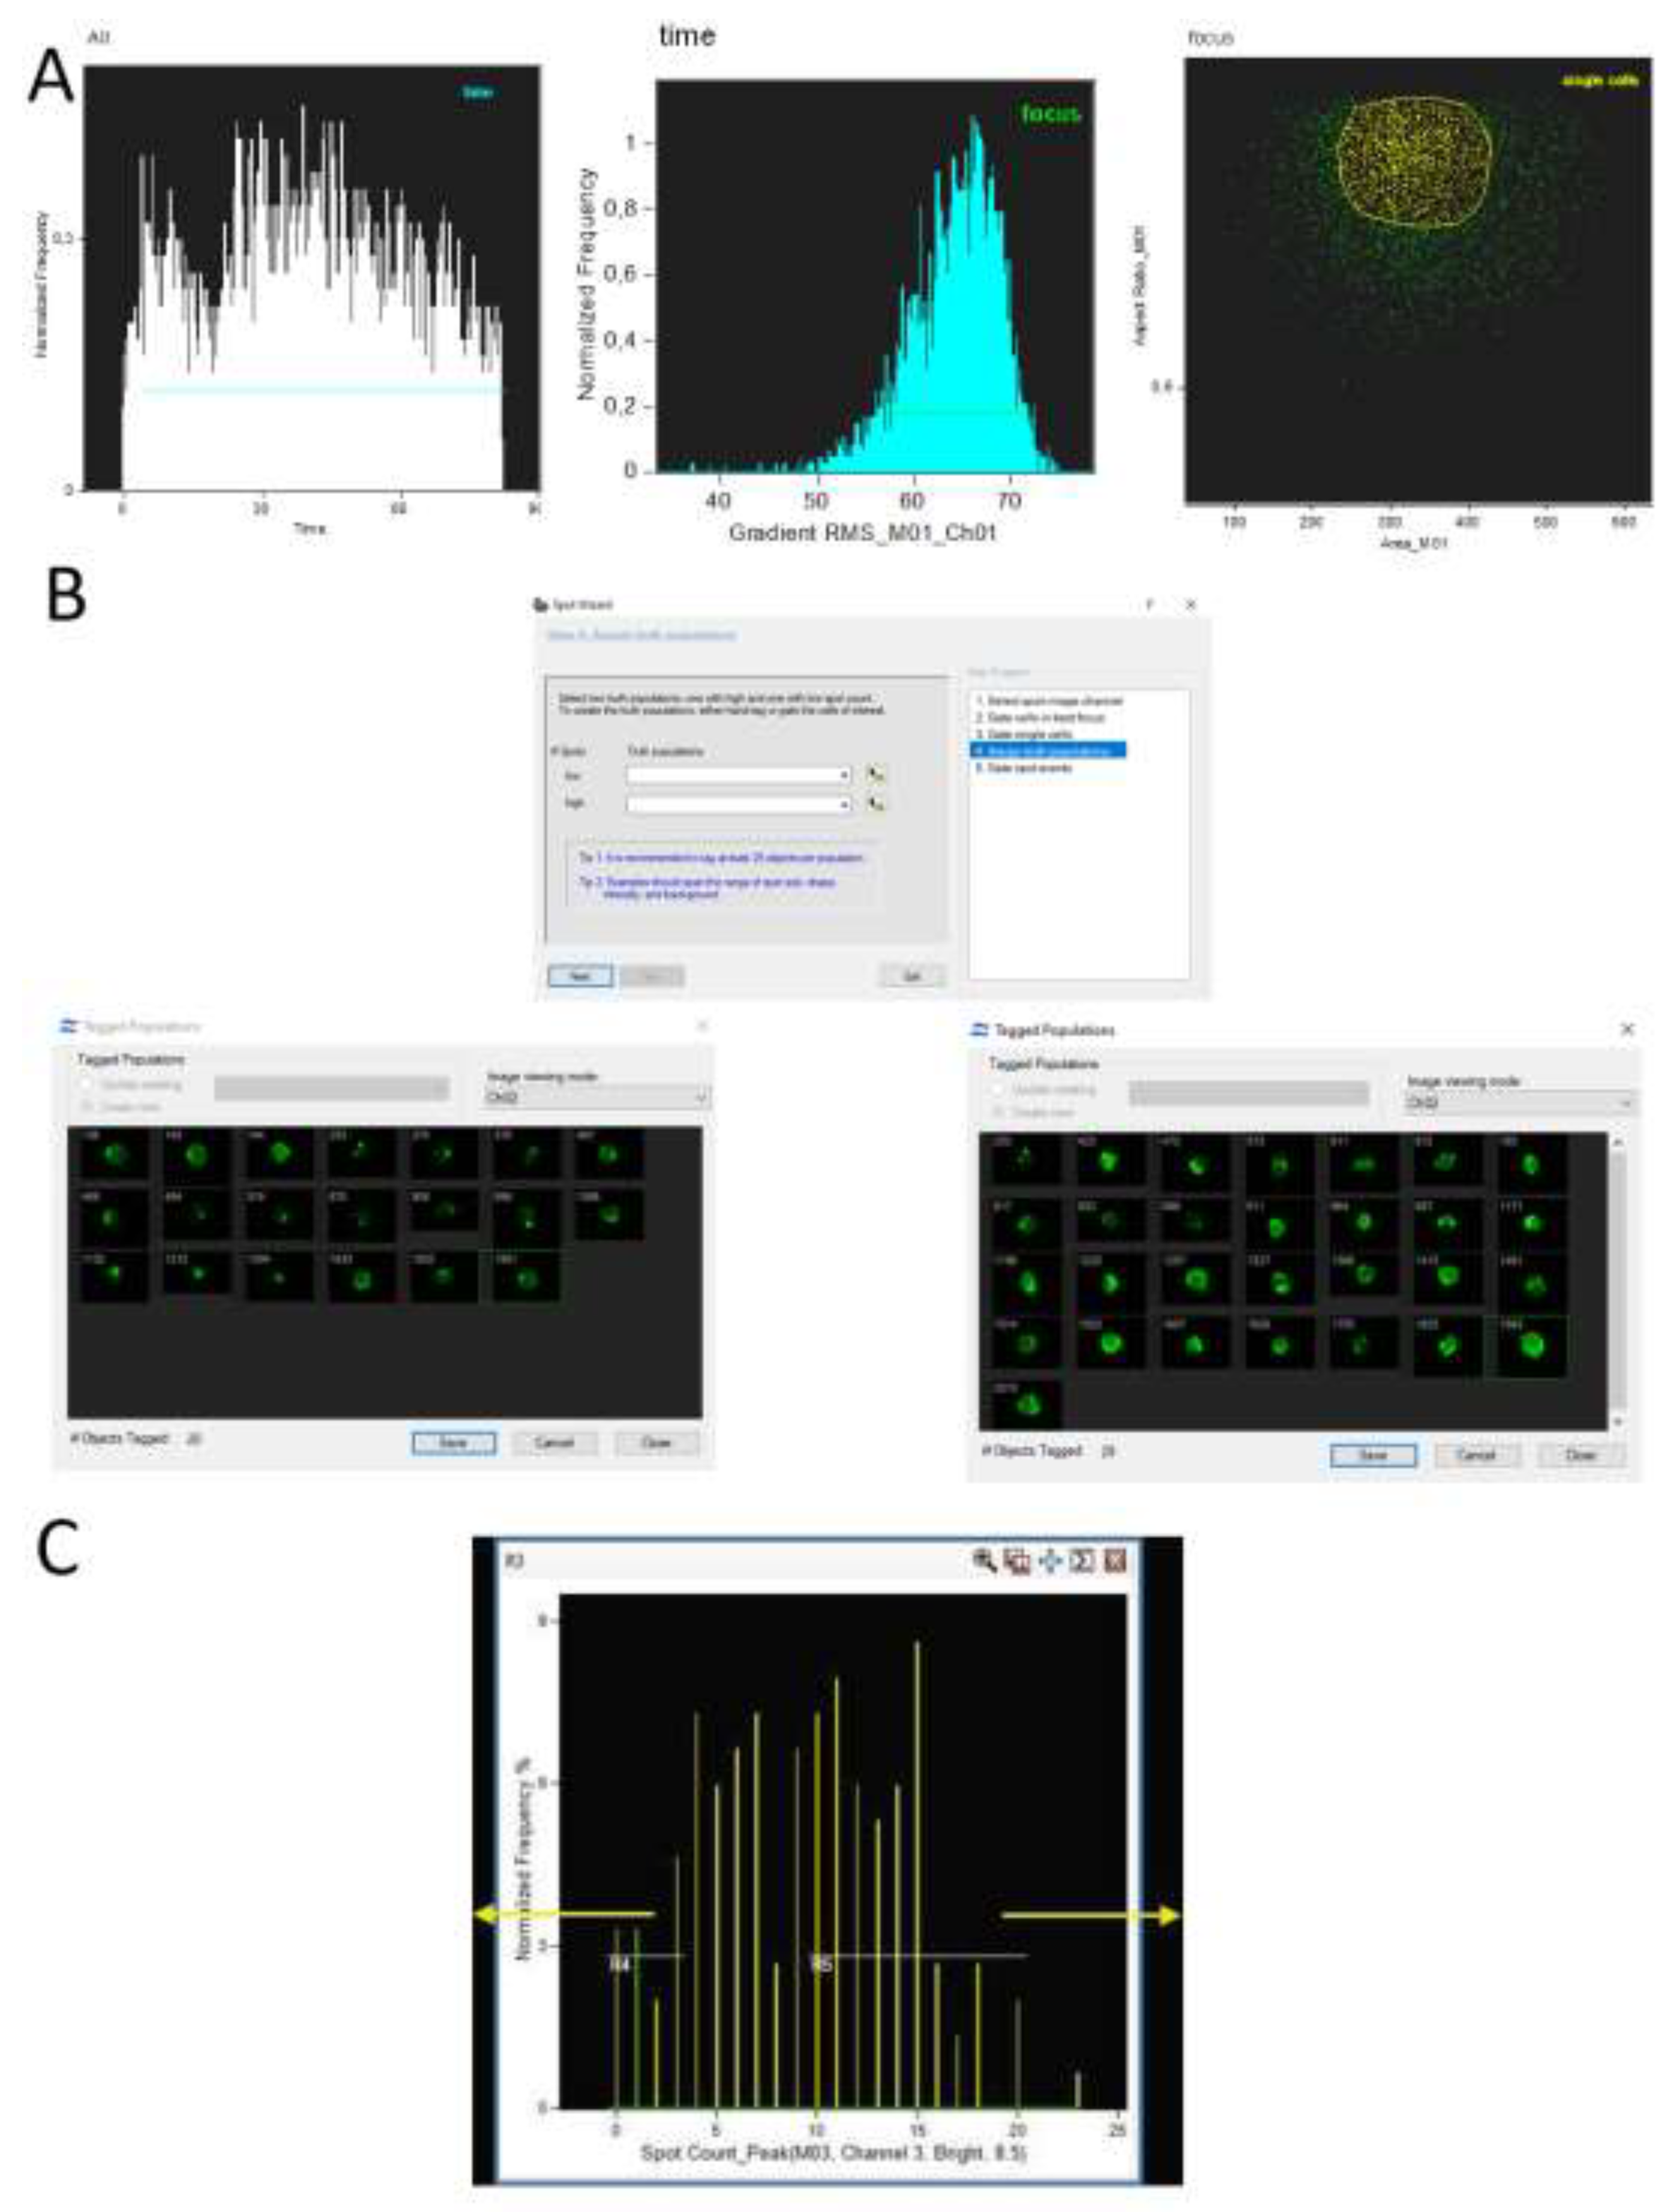
Figure 3.
Algorithm for using the Nuclear Localization wizard in IDEAS 6.2 software: A – Selecting the channel for whole cell images and the probe channel, identifying events positive for fluorescent signals; B – The algorithm's output, distinguishing between a population with nuclear signal localization and one with extranuclear localization; C – A segment from the image gallery of cells with nuclear signal localization; D – A segment from the image gallery of cells with extranuclear signal localization.
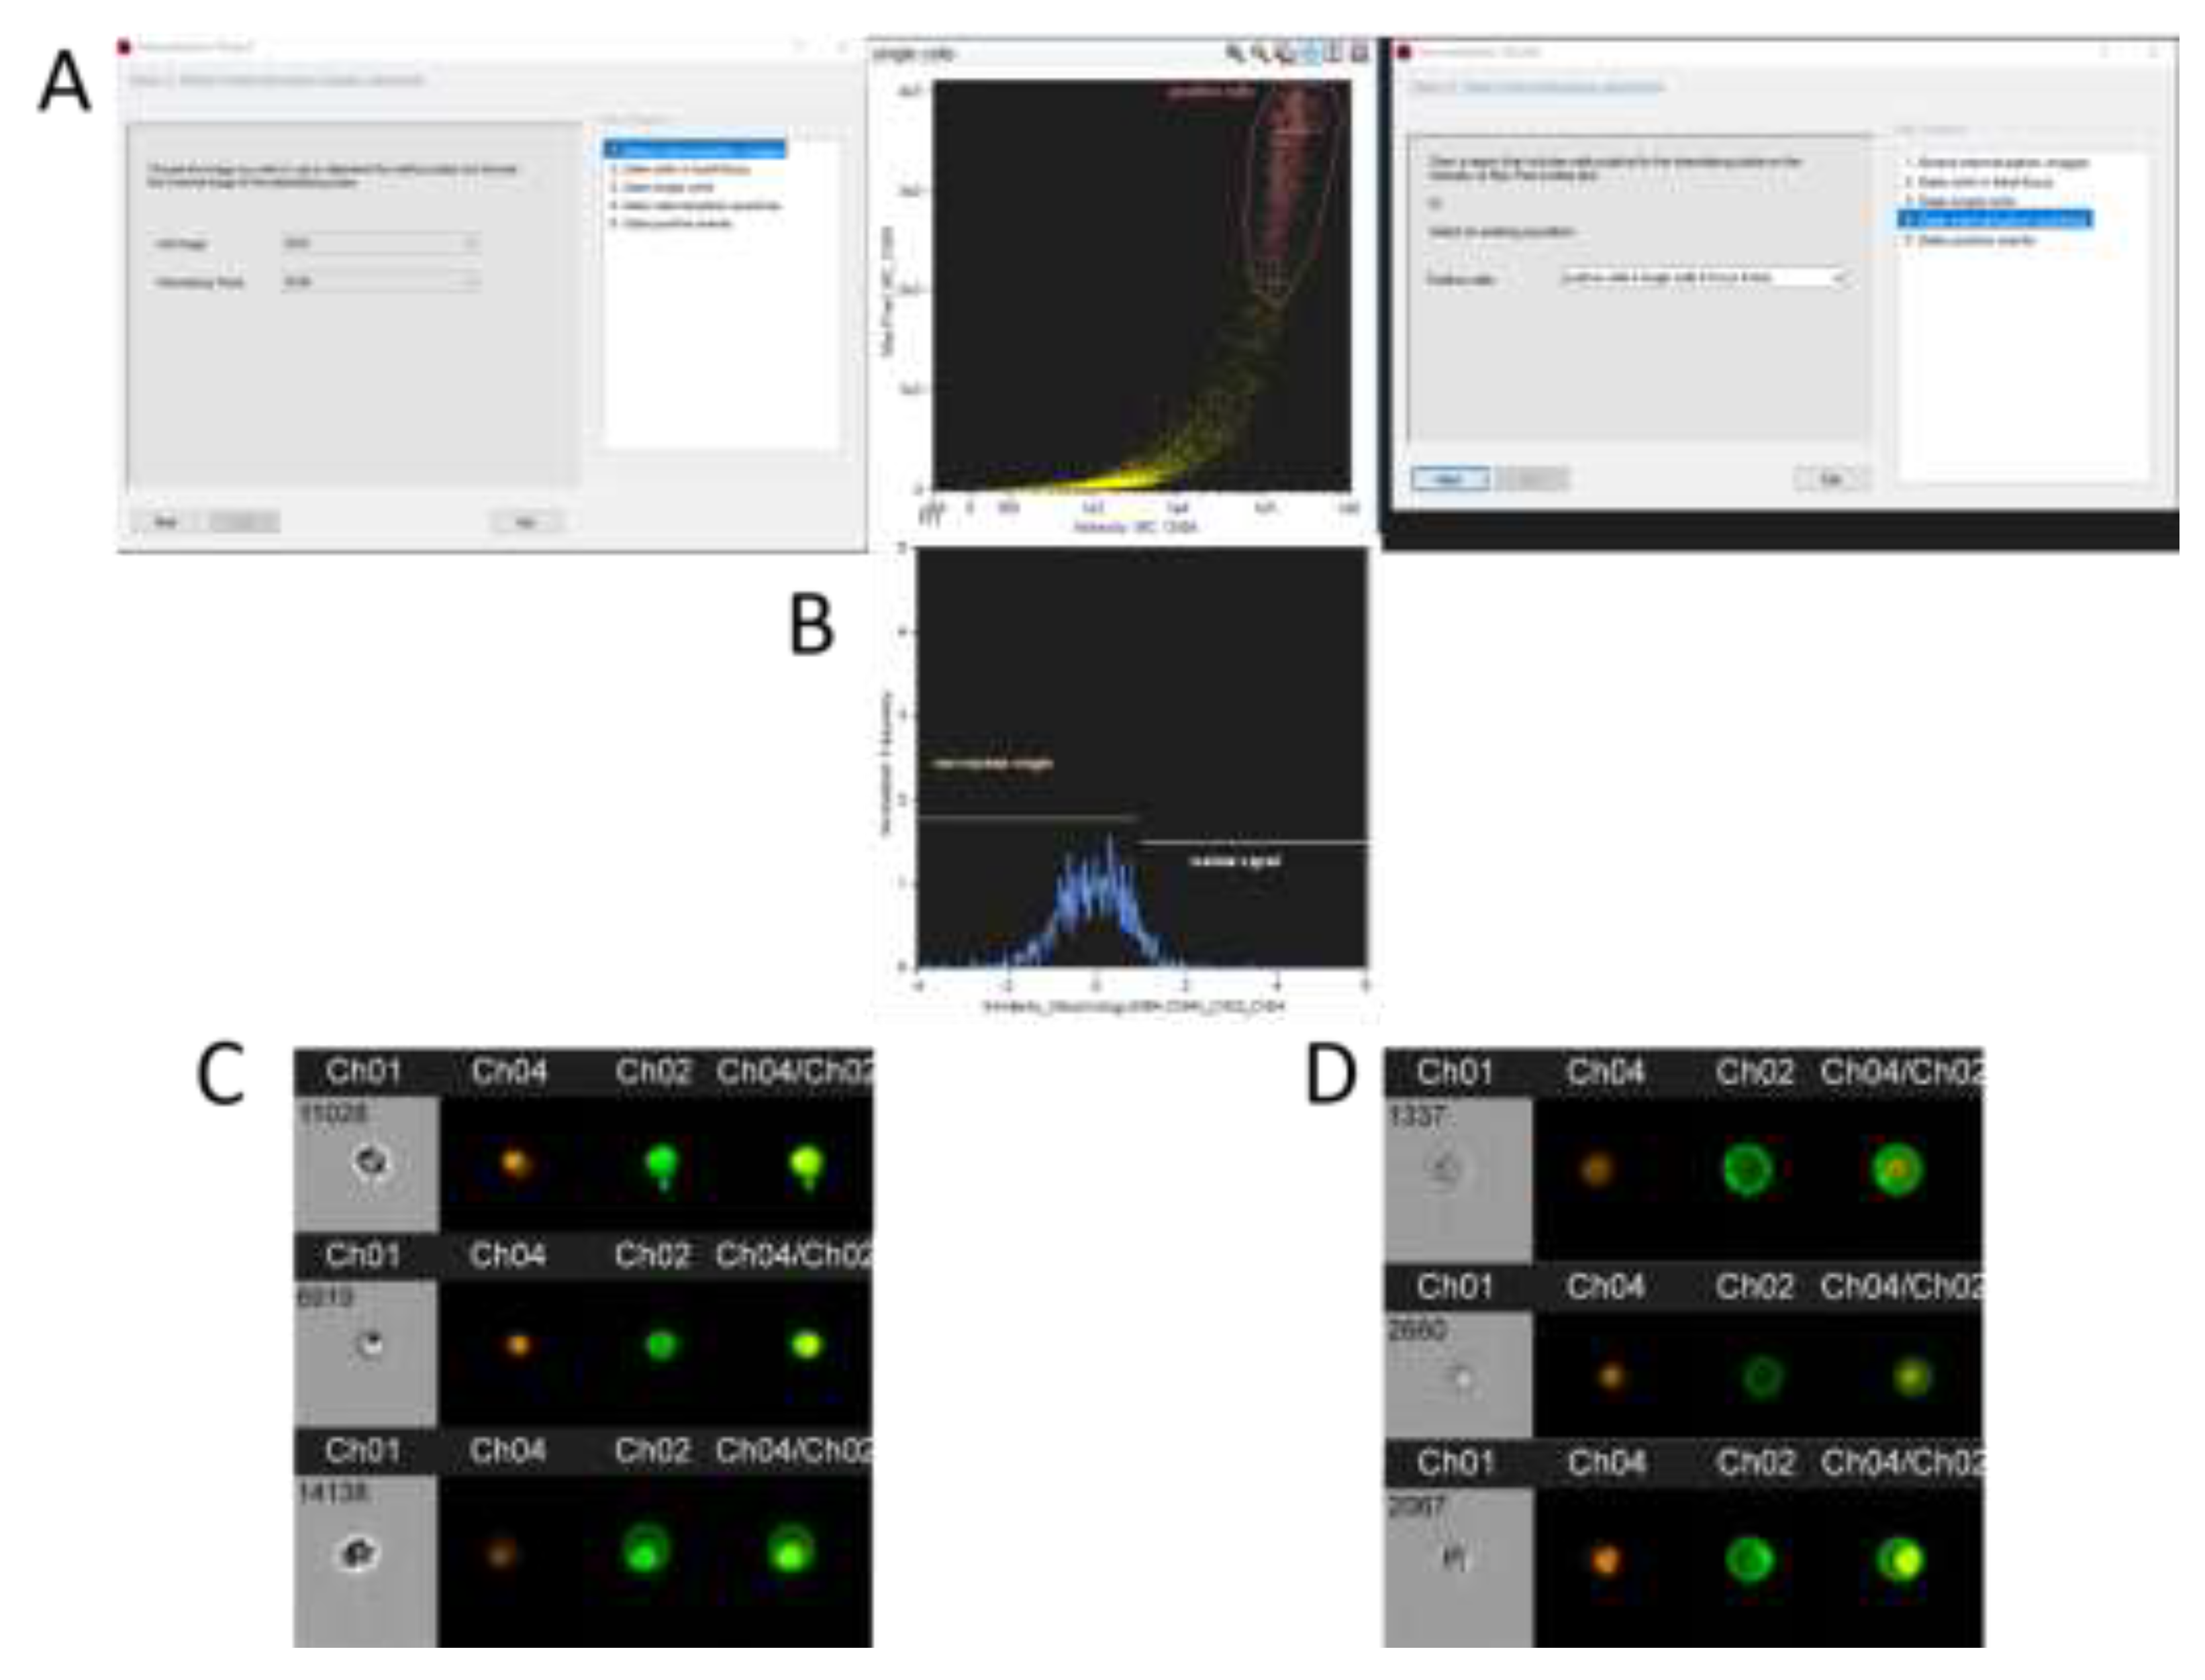
Figure 6.
Selection of individual events in the IDEAS 6.2 software image gallery for subsequent analysis of subpopulations: A – transition to manual event selection mode; B – images of user-selected events, in this example, cells with uneven distribution of CD4 receptors on the cytoplasmic membrane.
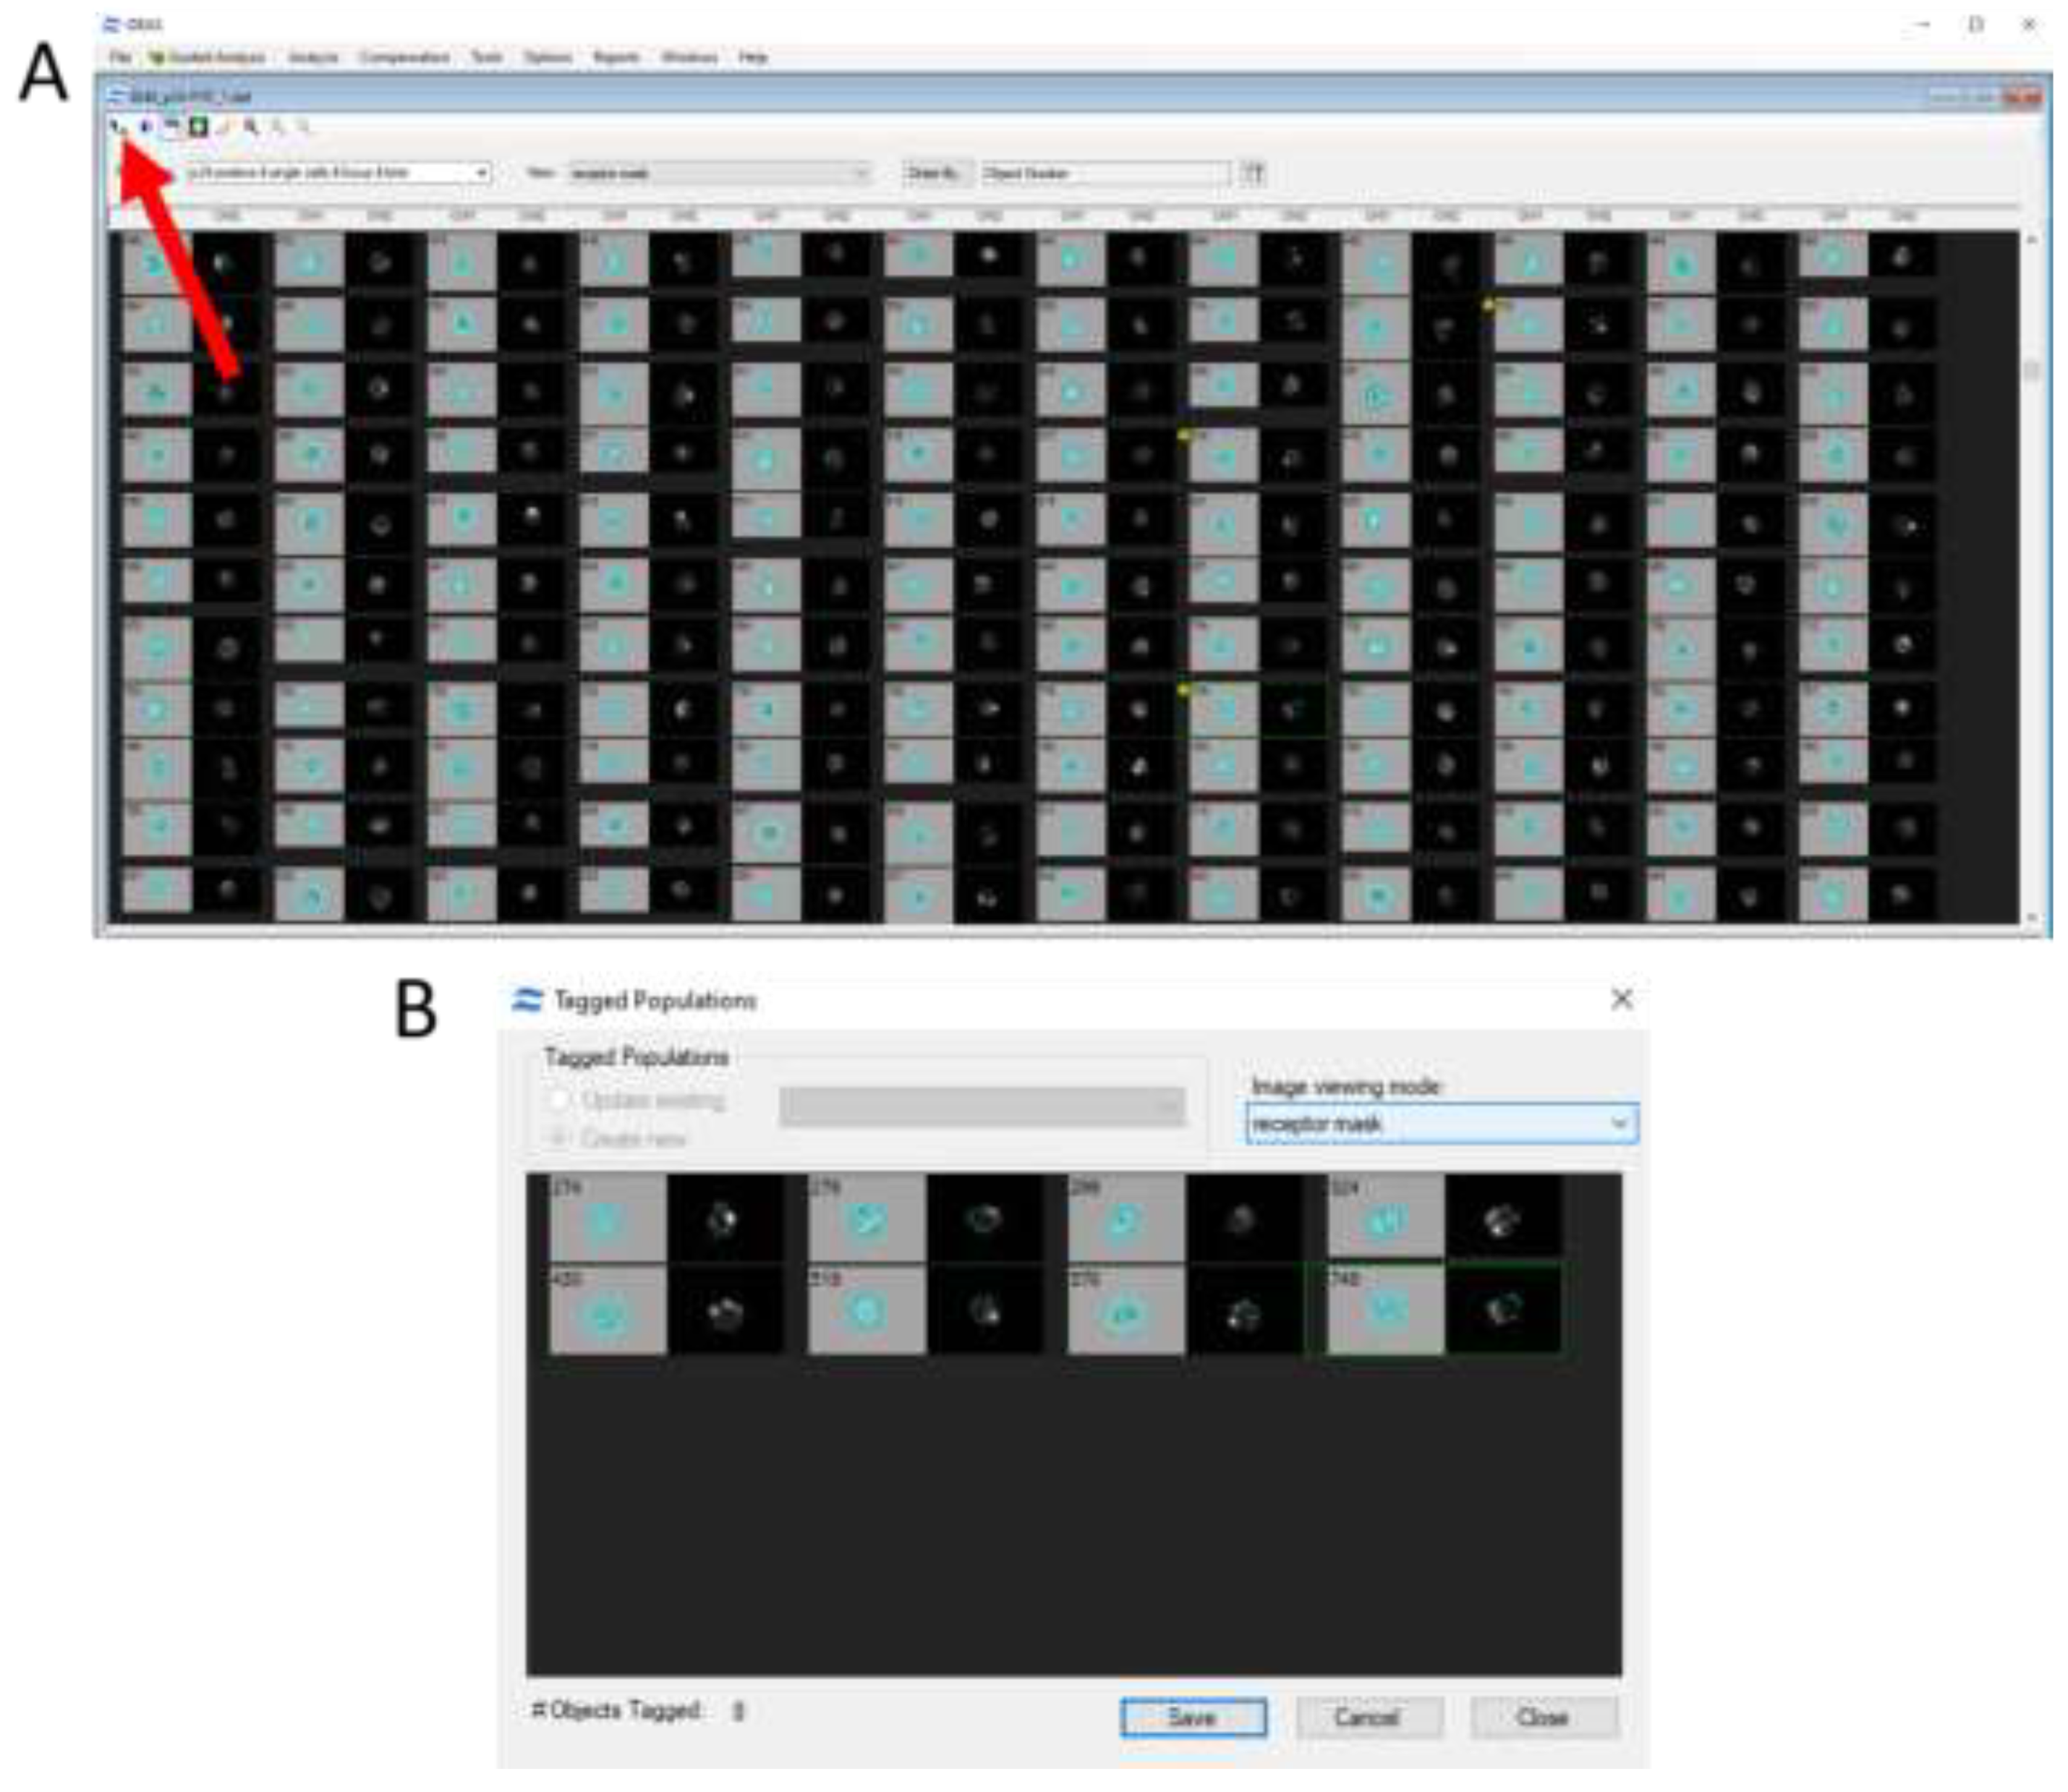
Figure 7.
Selection of a mask in the IDEAS 6.2 software designed to highlight cytoskeletal proteins (primarily microtubules due to their size).
Figure 7.
Selection of a mask in the IDEAS 6.2 software designed to highlight cytoskeletal proteins (primarily microtubules due to their size).
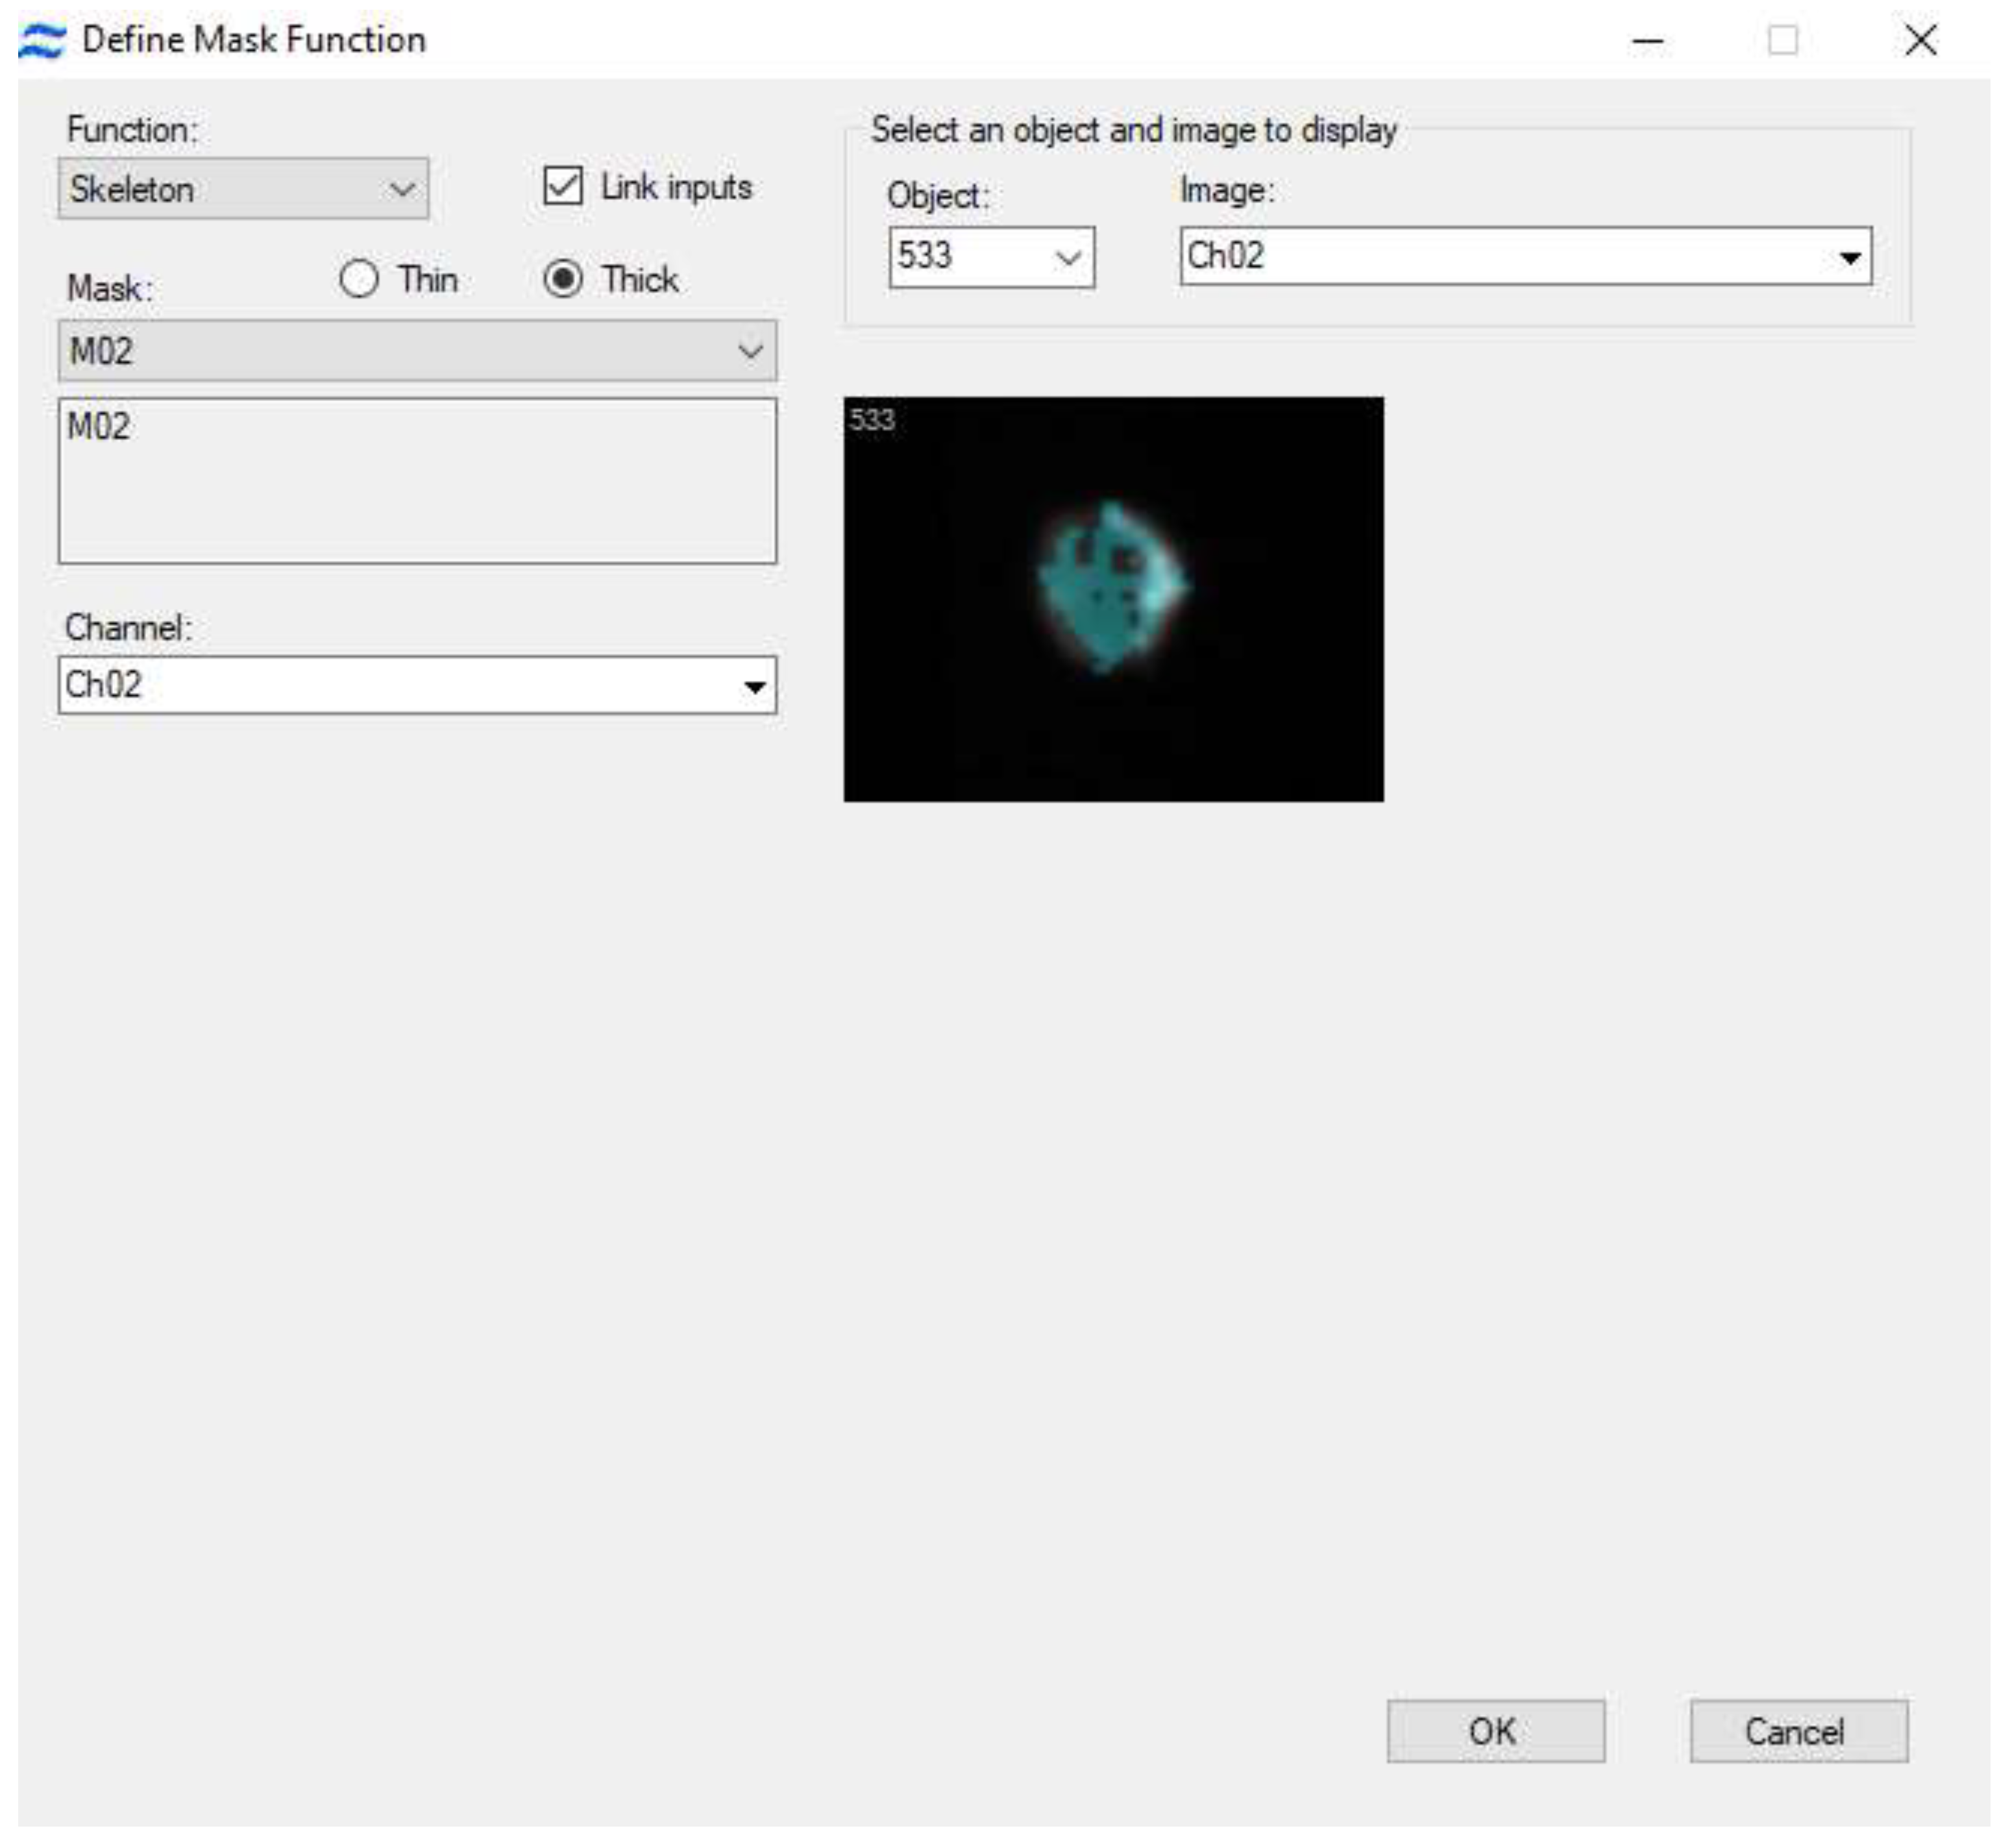

Table 1.
Tools for image analysis in imaging flow cytometry for the investigation of certain cellular processes during HIV infection.
Table 1.
Tools for image analysis in imaging flow cytometry for the investigation of certain cellular processes during HIV infection.
| Research subject | Research method | Imaging in IDEAS 6.2 |
|
Latent reservoirs of HIV |
FISH | Spot counting wizard; Nuclear localization wizard |
| Transcripts of host genes and HIV genes | FISH | Spot counting wizard |
| Clustering of cellular receptors | Immunocytochemistry | Peak mask without the signal from Morphology mask (Peak AND NOT Morphology) |
| Cytoskeletal remodeling | Immunocytochemistry | Cytoskeleton mask |
| Interactions between host cell proteins and HIV proteins | FRET | Co-localization mask |
Disclaimer/Publisher’s Note: The statements, opinions and data contained in all publications are solely those of the individual author(s) and contributor(s) and not of MDPI and/or the editor(s). MDPI and/or the editor(s) disclaim responsibility for any injury to people or property resulting from any ideas, methods, instructions or products referred to in the content. |
© 2024 by the authors. Licensee MDPI, Basel, Switzerland. This article is an open access article distributed under the terms and conditions of the Creative Commons Attribution (CC BY) license (http://creativecommons.org/licenses/by/4.0/).
Copyright: This open access article is published under a Creative Commons CC BY 4.0 license, which permit the free download, distribution, and reuse, provided that the author and preprint are cited in any reuse.


