1. Introduction
Systemic hypertension and cardiovascular pathogenesis are considered chronic and slowly evolving conditions that progress throughout life, often culminating in heart failure, stroke [
1], and most importantly, progressive kidney disease [
2].
Nitric oxide (NO) plays a key role in the blood pressure regulation [
3]. Impaired NO bioavailability is an important feature of hypertension [
4]. In addition, oxidative stress, an excessive generation of reactive oxygen species (ROS), is present in hypertension and overproduced ROS are known as NO scavengers that lead to its reduced overall bioavailability [
4]. NO is formed from L-arginine by the activity of different isoforms of the NO synthase, the endothelial (eNOS), neuronal (nNOS), and inducible NO synthase (iNOS) [
5]. Secon source of NO is organic nitrates that have long been used in clinical practice to induce vasodilation, as nitrates and nitrites are the main substrates for NO production via the NOS-independent pathway [
3], but nitrate tolerance and increased formation of peroxynitrites under oxidative stress limit their use. Nuclear factor erythroid factor 2-related factor 2 (Nrf2) is a transcriptional regulator of cellular defense against oxidative stress that has been shown to ameliorate renal damage by eliminating ROS [
6]. It does not have antioxidative function per se but exerts antioxidant effects by activating the transcription of target antioxidant genes including the enzymes superoxide dismutase and catalase [
7].
Hypertension is associated with an increase in the deposition of extracellular matrix (ECM) (especially collagen types I, III, and IV) in the renal resistance vessels, glomeruli, and interstitium [
8]. Therefore, renal fibrosis is another important complication associated with the progression of hypertension, where the abnormal accumulation of collagens contributes to vascular remodeling and the progression of renal damage [
9]. Type IV collagen is commonly used as a marker of glomerular sclerosis and interstitial fibrosis [
10], and in spontaneously hypertensive rats (SHR) remodeling of the ECM is associated with these fibrogenic responses [
8]. Although many cell types in the kidney can produce ECM, (myo)fibroblasts in the interstitium and mesangial cells in the glomeruli are thought to be the main cellular mediators of interstitial fibrosis and glomerulosclerosis [
10]. Myofibroblasts, cells expressing α-smooth muscle actin (α-SMA), share features with fibroblasts and smooth muscle cells, and are involved in wound contraction and healing [
11]. Positive immunostaining for α-SMA has been demonstrated in the glomeruli and interstitium in experimental animal models and in humans with progressive renal insufficiency [
11]. Fibronectin, the first ECM protein to be deposited during fibrogenesis, activates integrins, acts as a fibroblast chemoattractant, and colocalizes collagen formation [
10]. Another molecule that causes an increase in the ECM accumulation is plasminogen activator inhibitor 1 (PAI-1) [
12]. It is known that angiotensin II, the main effector peptide of the renin-angiotensin system, can have a profibrotic effect after binding to angiotensin II type 1 (AT1) receptor in hypertension, directly or via the induction of transforming growth factor-beta 1 (TGF-ß1) and/or PAI-1, consequently, AT1 receptor blockade reduces renal PAI-1 expression induced by angiotensin II infusion [
12,
13].
Previous studies have shown that different
Urtica dioica L. leaf extract (UE, e.g. prepared from aerial parts or roots) exhibit vasodilatory effects in vitro [
14,
15] and hypotensive and antihypertensive effects in vivo [
15,
16,
17,
18] To explain these effects, various mechanisms have been proposed [
16,
18], such as NO-dependent vasorelaxation [
15,
18]. However, there are few data on the chronic effects of UE on renal function and structure [
19,
20].
Since hypertensive nephrosclerosis is a progressive kidney damage caused by long-standing, poorly controlled high blood pressure [
21], and taking into account our previous results showing beneficial effects of chronic intake of UE on systolic and diastolic blood pressure as well as systemic oxidative stress by improving systemic antioxidant defense and antioxidant capacity in SHR [
22], here we aimed to determine whether these supplementation with UE can alter the NO and Nrf-2 signaling and prevent local oxidative stress and the deterioration of kidney function and structure in experimental model of essential hypertension.
3. Discussion
Hypertension is the main cause of kidney damage. In addition to the antihypertensive effect of UE, this study demonstrated for the first time the beneficial effects of UE on kidney function and structure in terms of reduced microalbuminuria, improved antioxidant capacity and oxidative stress in adult SHR kidney. Our findings highlight a dose-dependent stimulation of eNOS, suppression of nNOS, and modulation of profibrotic and proinflammatory markers in response to UE treatments. We also showed that Nrf-2 signaling mechanism, and its downstream mediated antioxidant proteins such as SOD and CAT, were not involved in the prevention of oxidative stress in the kidneys of UE-treated SHR. Chronic treatment with AT-1 receptor blocker (ARB) losartan reduces blood pressure, plasma NO2-, and kidney expression of nNOS, Nrf-2, SOD, CAT, collagen IV, FN, and PAI-1. Losartan increased the abundance of eNOS and 6-NO2Trp in the kidney of SHR, despite unchanged iNOS and improved kidney oxidative stress.
Previous studies from our group [
22] and others [
15,
16,
29] have shown that therapeutic benefits of UE could be attributed to its phenolic compounds. Here, the reduction of MAP in response to UE treatment follows the increase in the content of total nitrates and nitrites in plasma and urine. Until recently, food-derived nitrates and nitrites were considered as inert products of the food with potentially harmful effects on human health [
30]. However, other studies have shown that these ions are physiologically "recycled" in the blood and tissues thus represent an exogenous source of NO [
30,
31], due to mechanisms involving the reduction of nitrates to nitrites by microbiota from saliva [
30], as well as intestinal microflora [
32], and conversion of nitrites into nitric acid in the stomach [
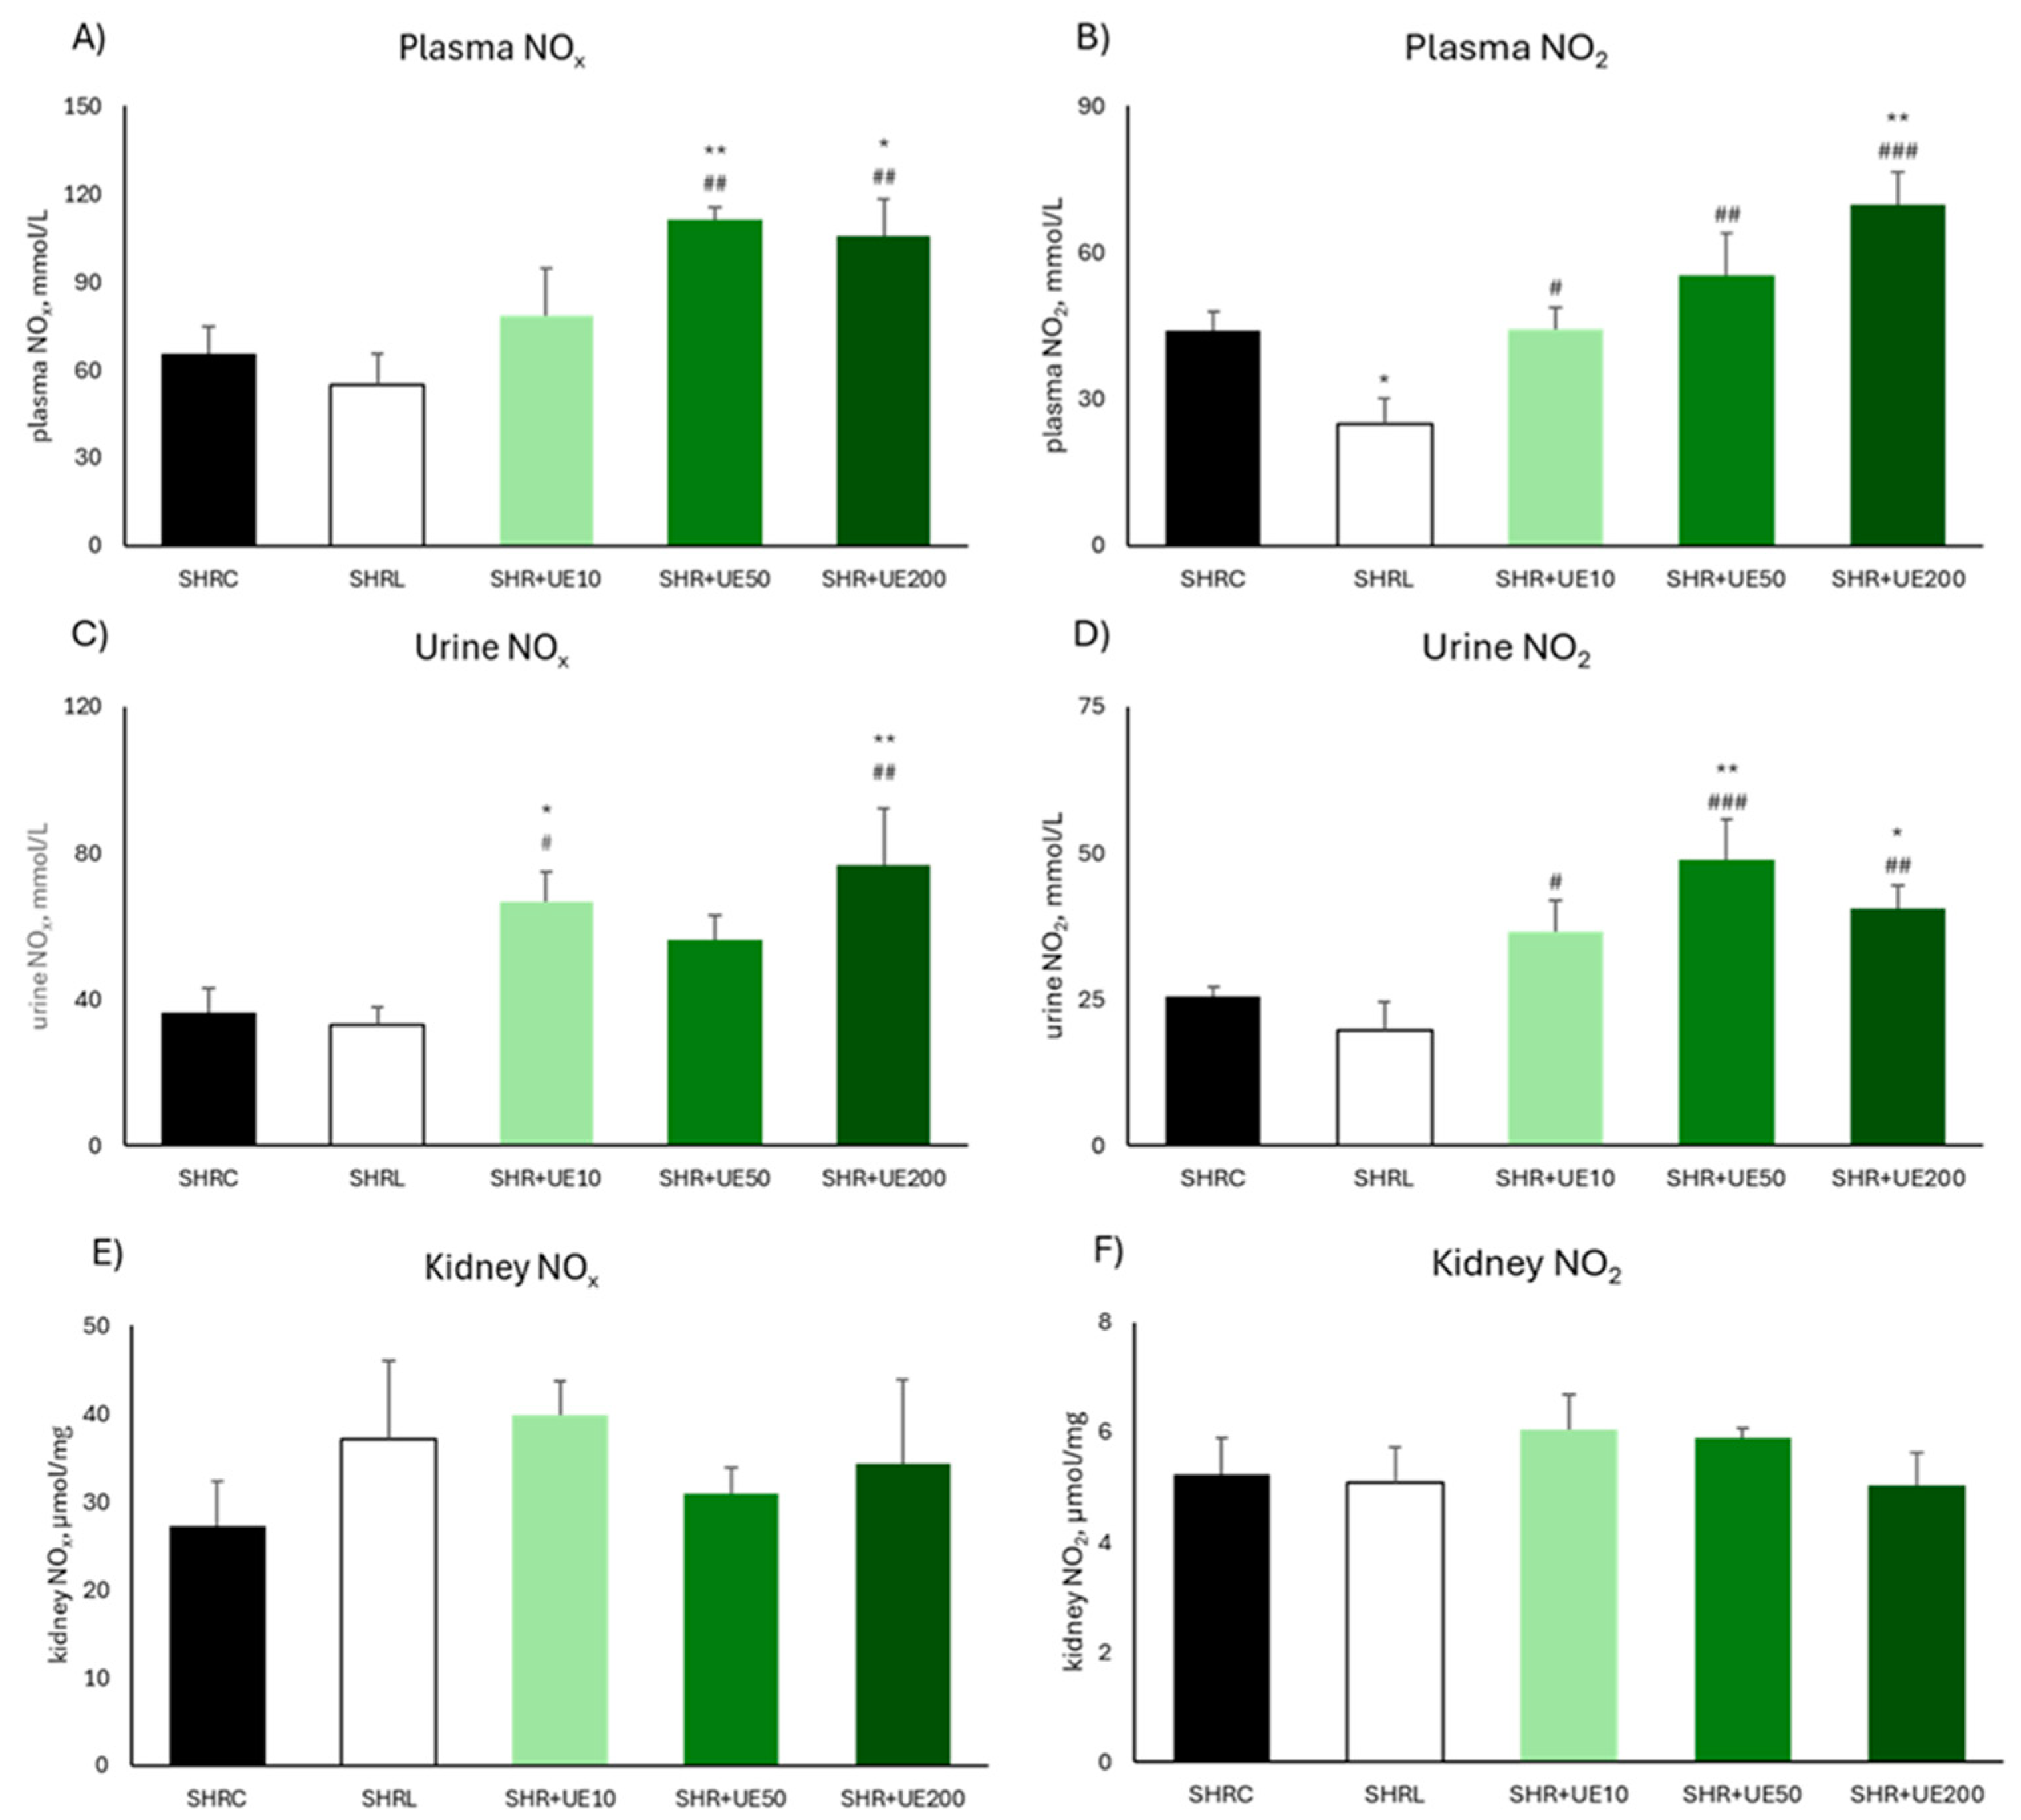
30]. The observed high nitrite content of UE in the present study (14,72 mg/g), in addition to abovementioned findings, could explain the increased concentration of NO metabolites in the plasma and urine of SHRs treated with UE.
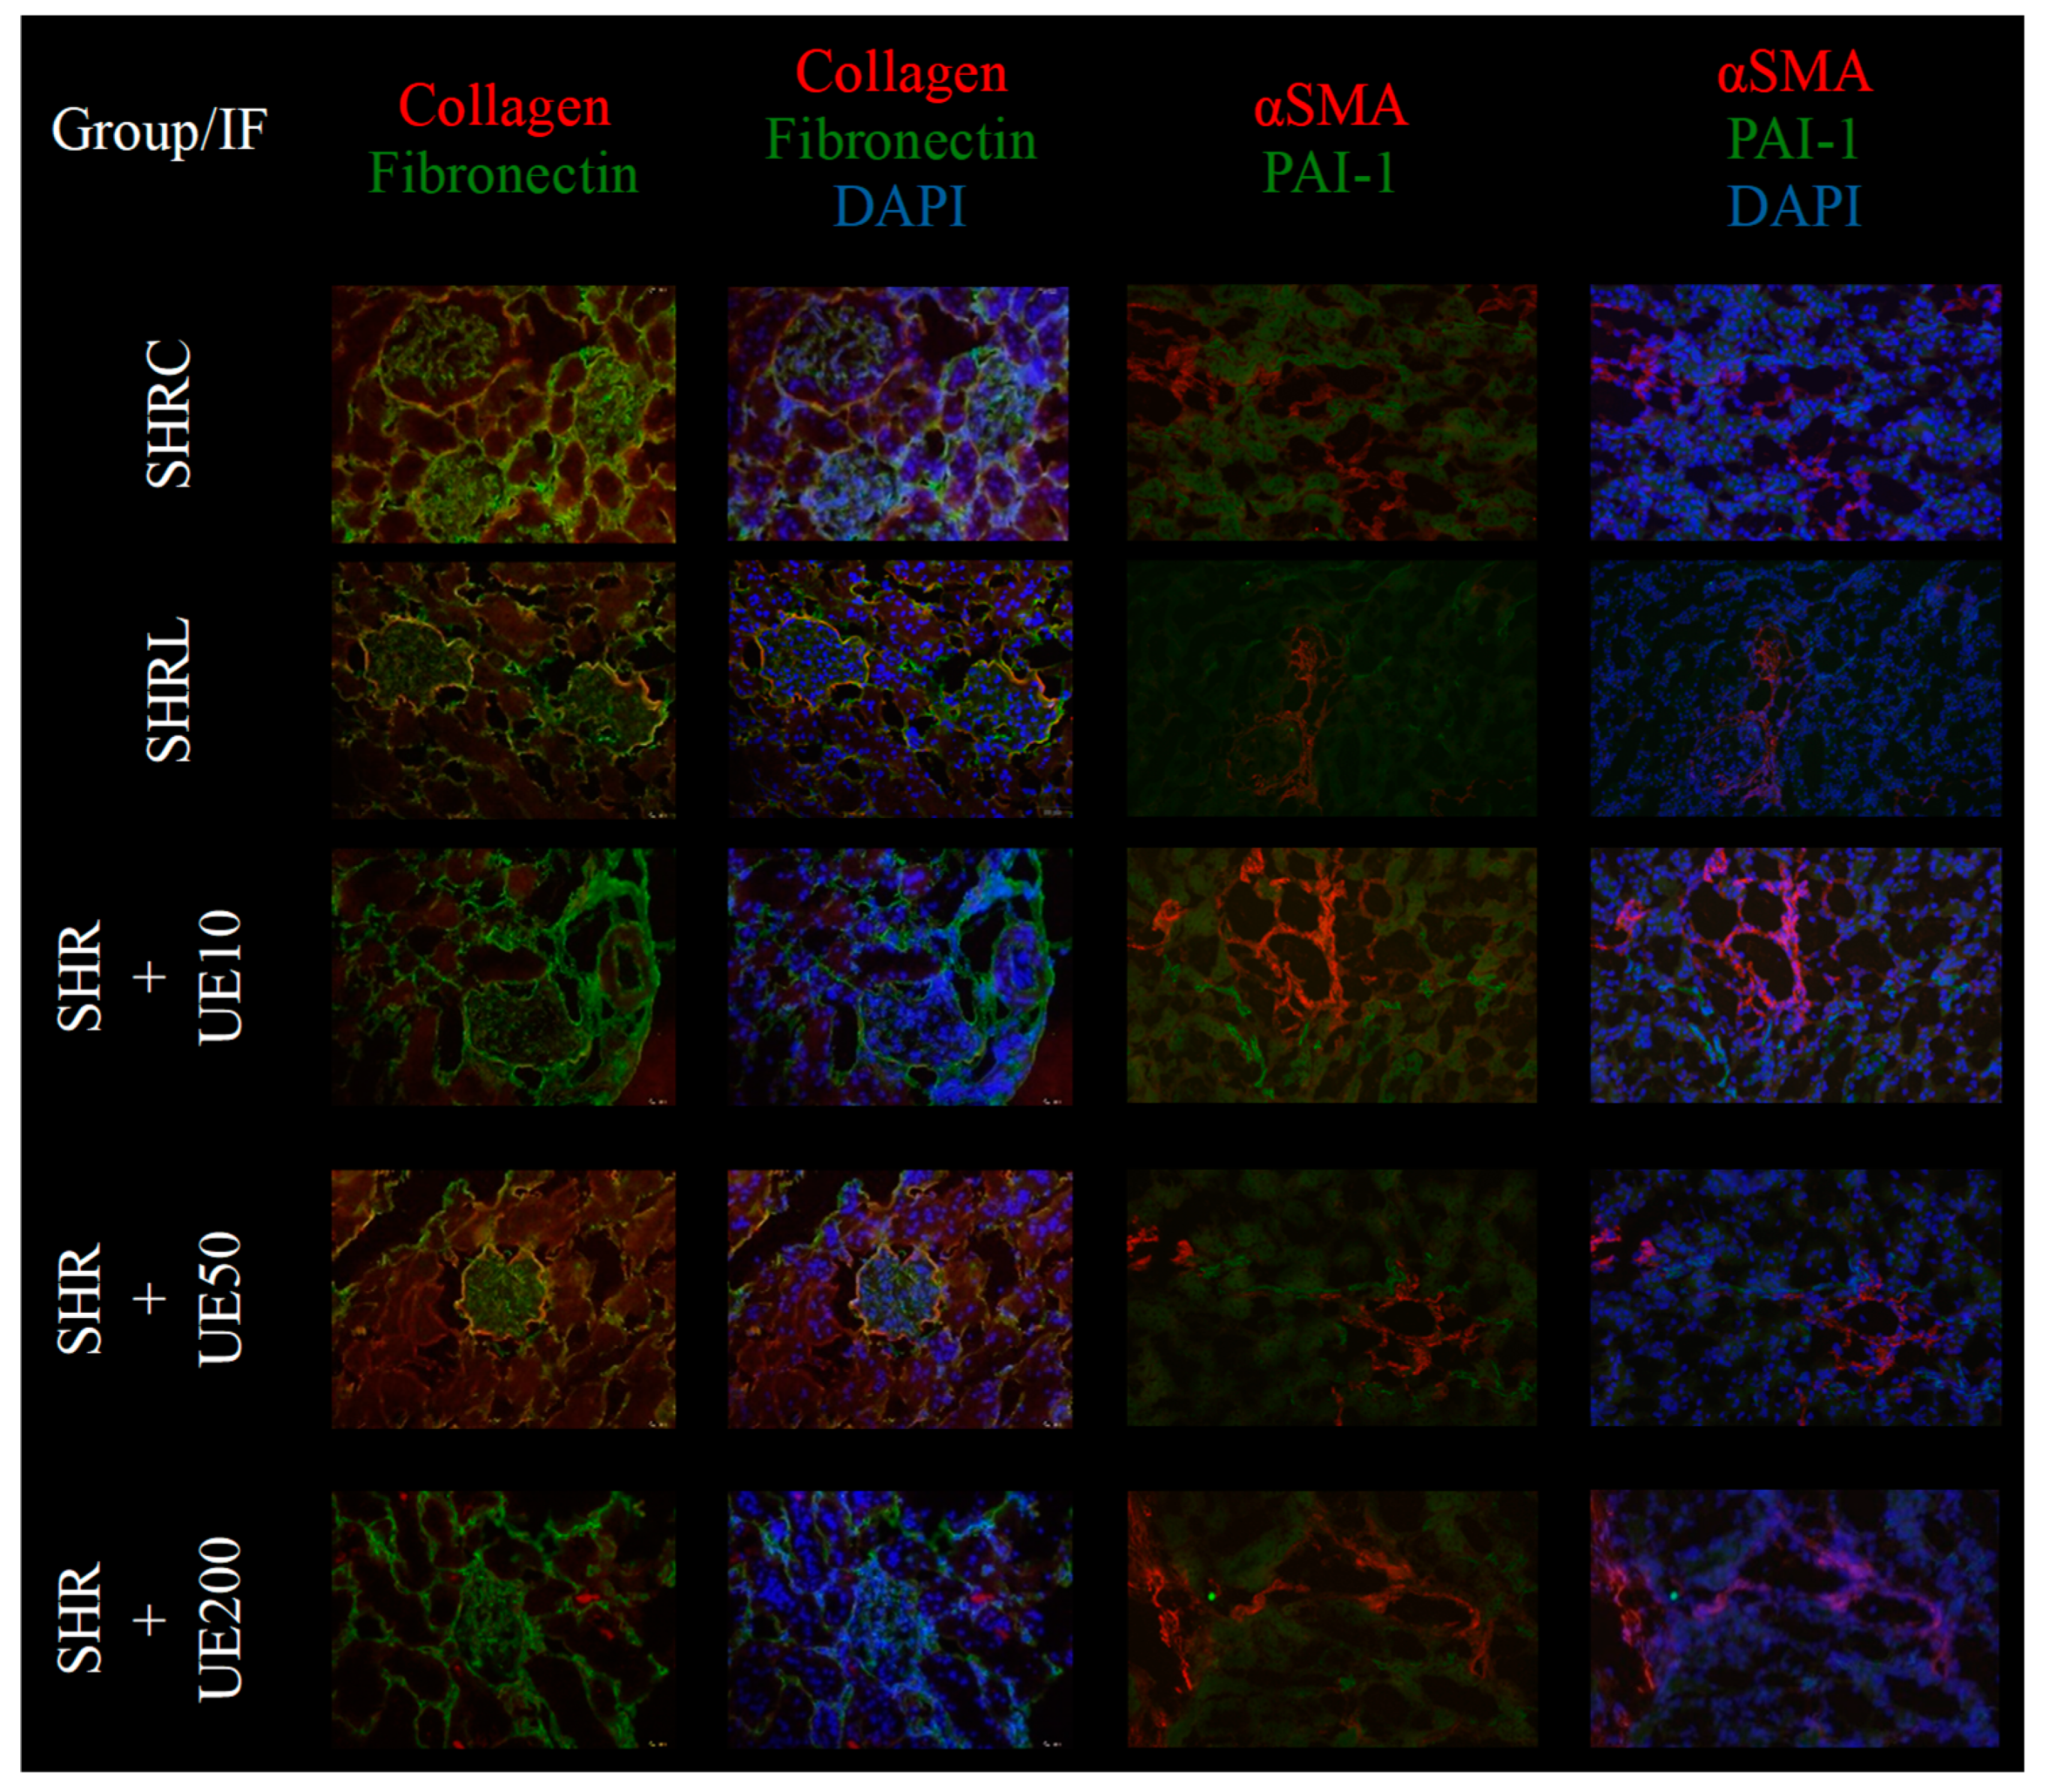
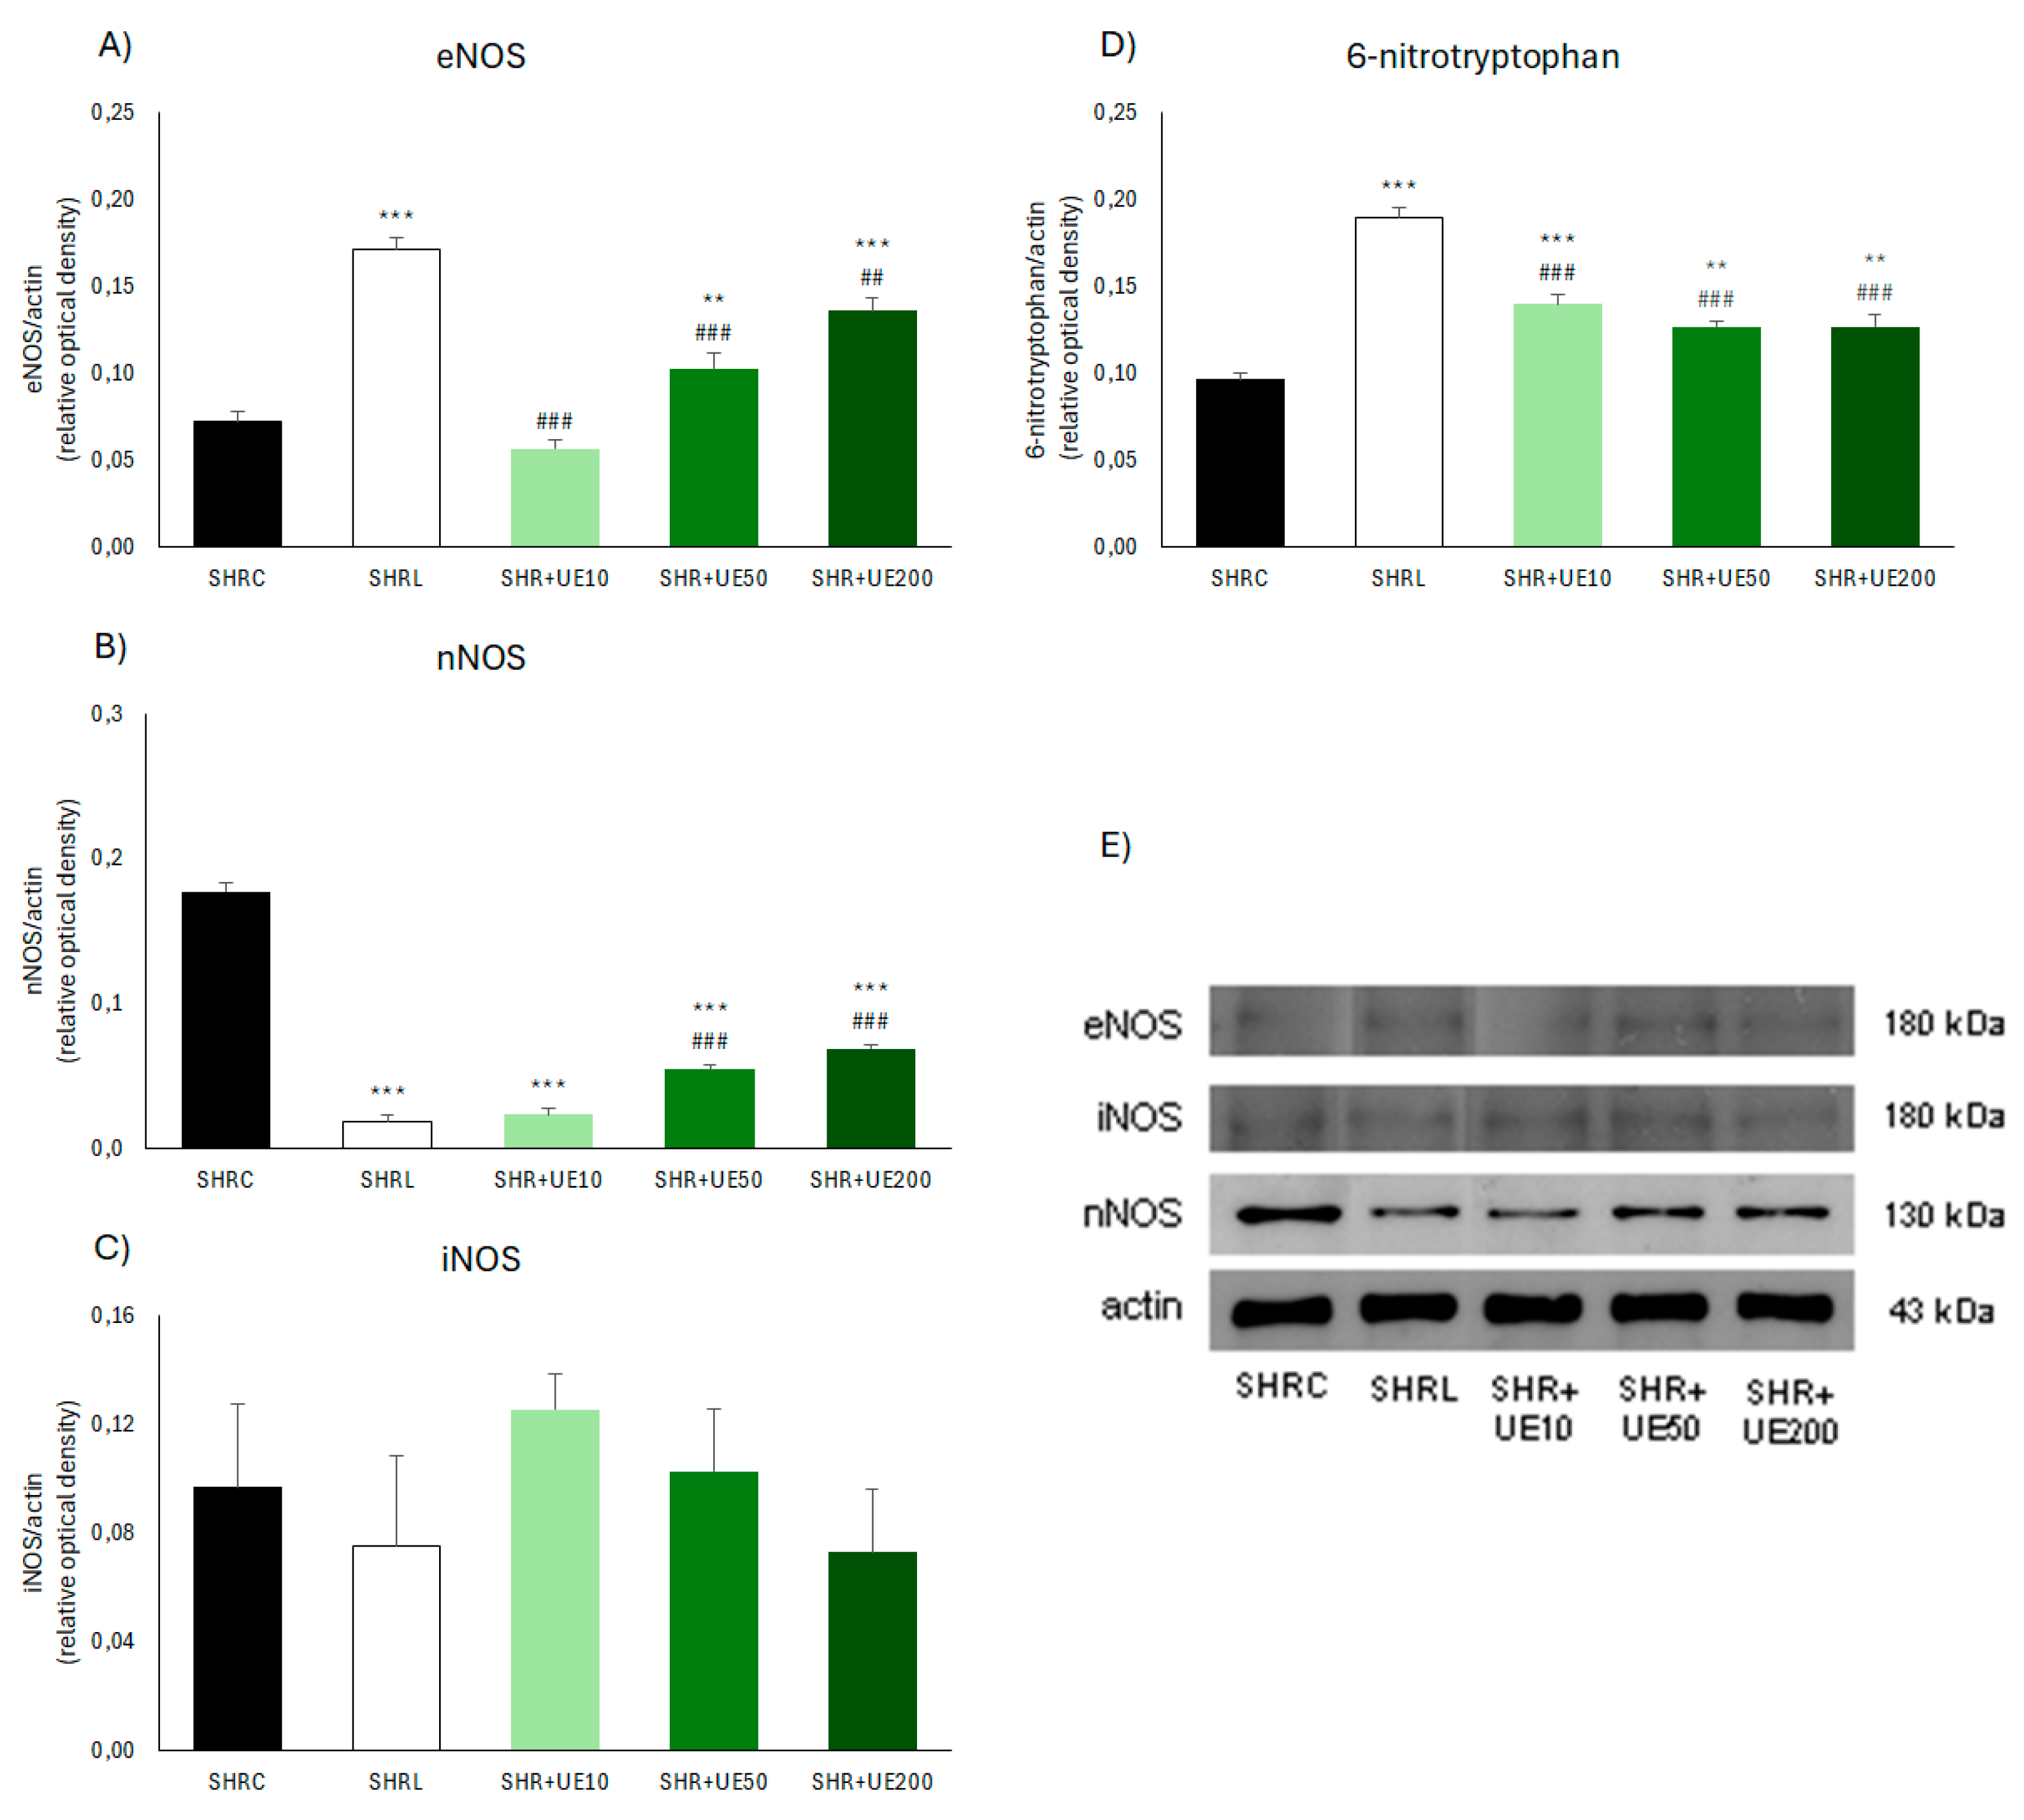
In SHR+UE50 and SHR+UE200, we found dose-dependent increase in the expression of the eNOS enzyme, followed by a decrease in the expression of the nNOS enzyme in all treated groups, while the expression of the iNOS enzyme remained unchanged. This is not surprising considering that numerous in vitro and in vivo studies have shown that various plant extracts and products, as well as individual phenolic compounds, can modulate the expression, synthesis, and activity of enzymes from the NOS family [
33,
34,
35,
36]. The expression of nNOS enzyme in SHR rats is significantly increased compared to its content in Wistar-Kyoto (WKY) strain [
37], and its overexpression is mediated by angiotensin II, i.e. by activating signaling pathways related to the AT1 receptor [
38], which the authors confirmed using losartan at the same dose as we did in the present study (10 mg/kg BW). On the other hand, the reduction of kidney nNOS enzyme expression in SHR rats treated with all three UE dosages could be attributed to the strong antioxidant effects of the extract, because oxidative stress can also lead to an increase in the expression of this enzyme in the kidney [
38].
ROS generated by oxidative stress is increased in hypertensive animals and humans [
3,
4,
7], and the plasma antioxidant capacity, a measure of non-enzymatic antioxidant activity [
22], is mostly exogenous in nature [
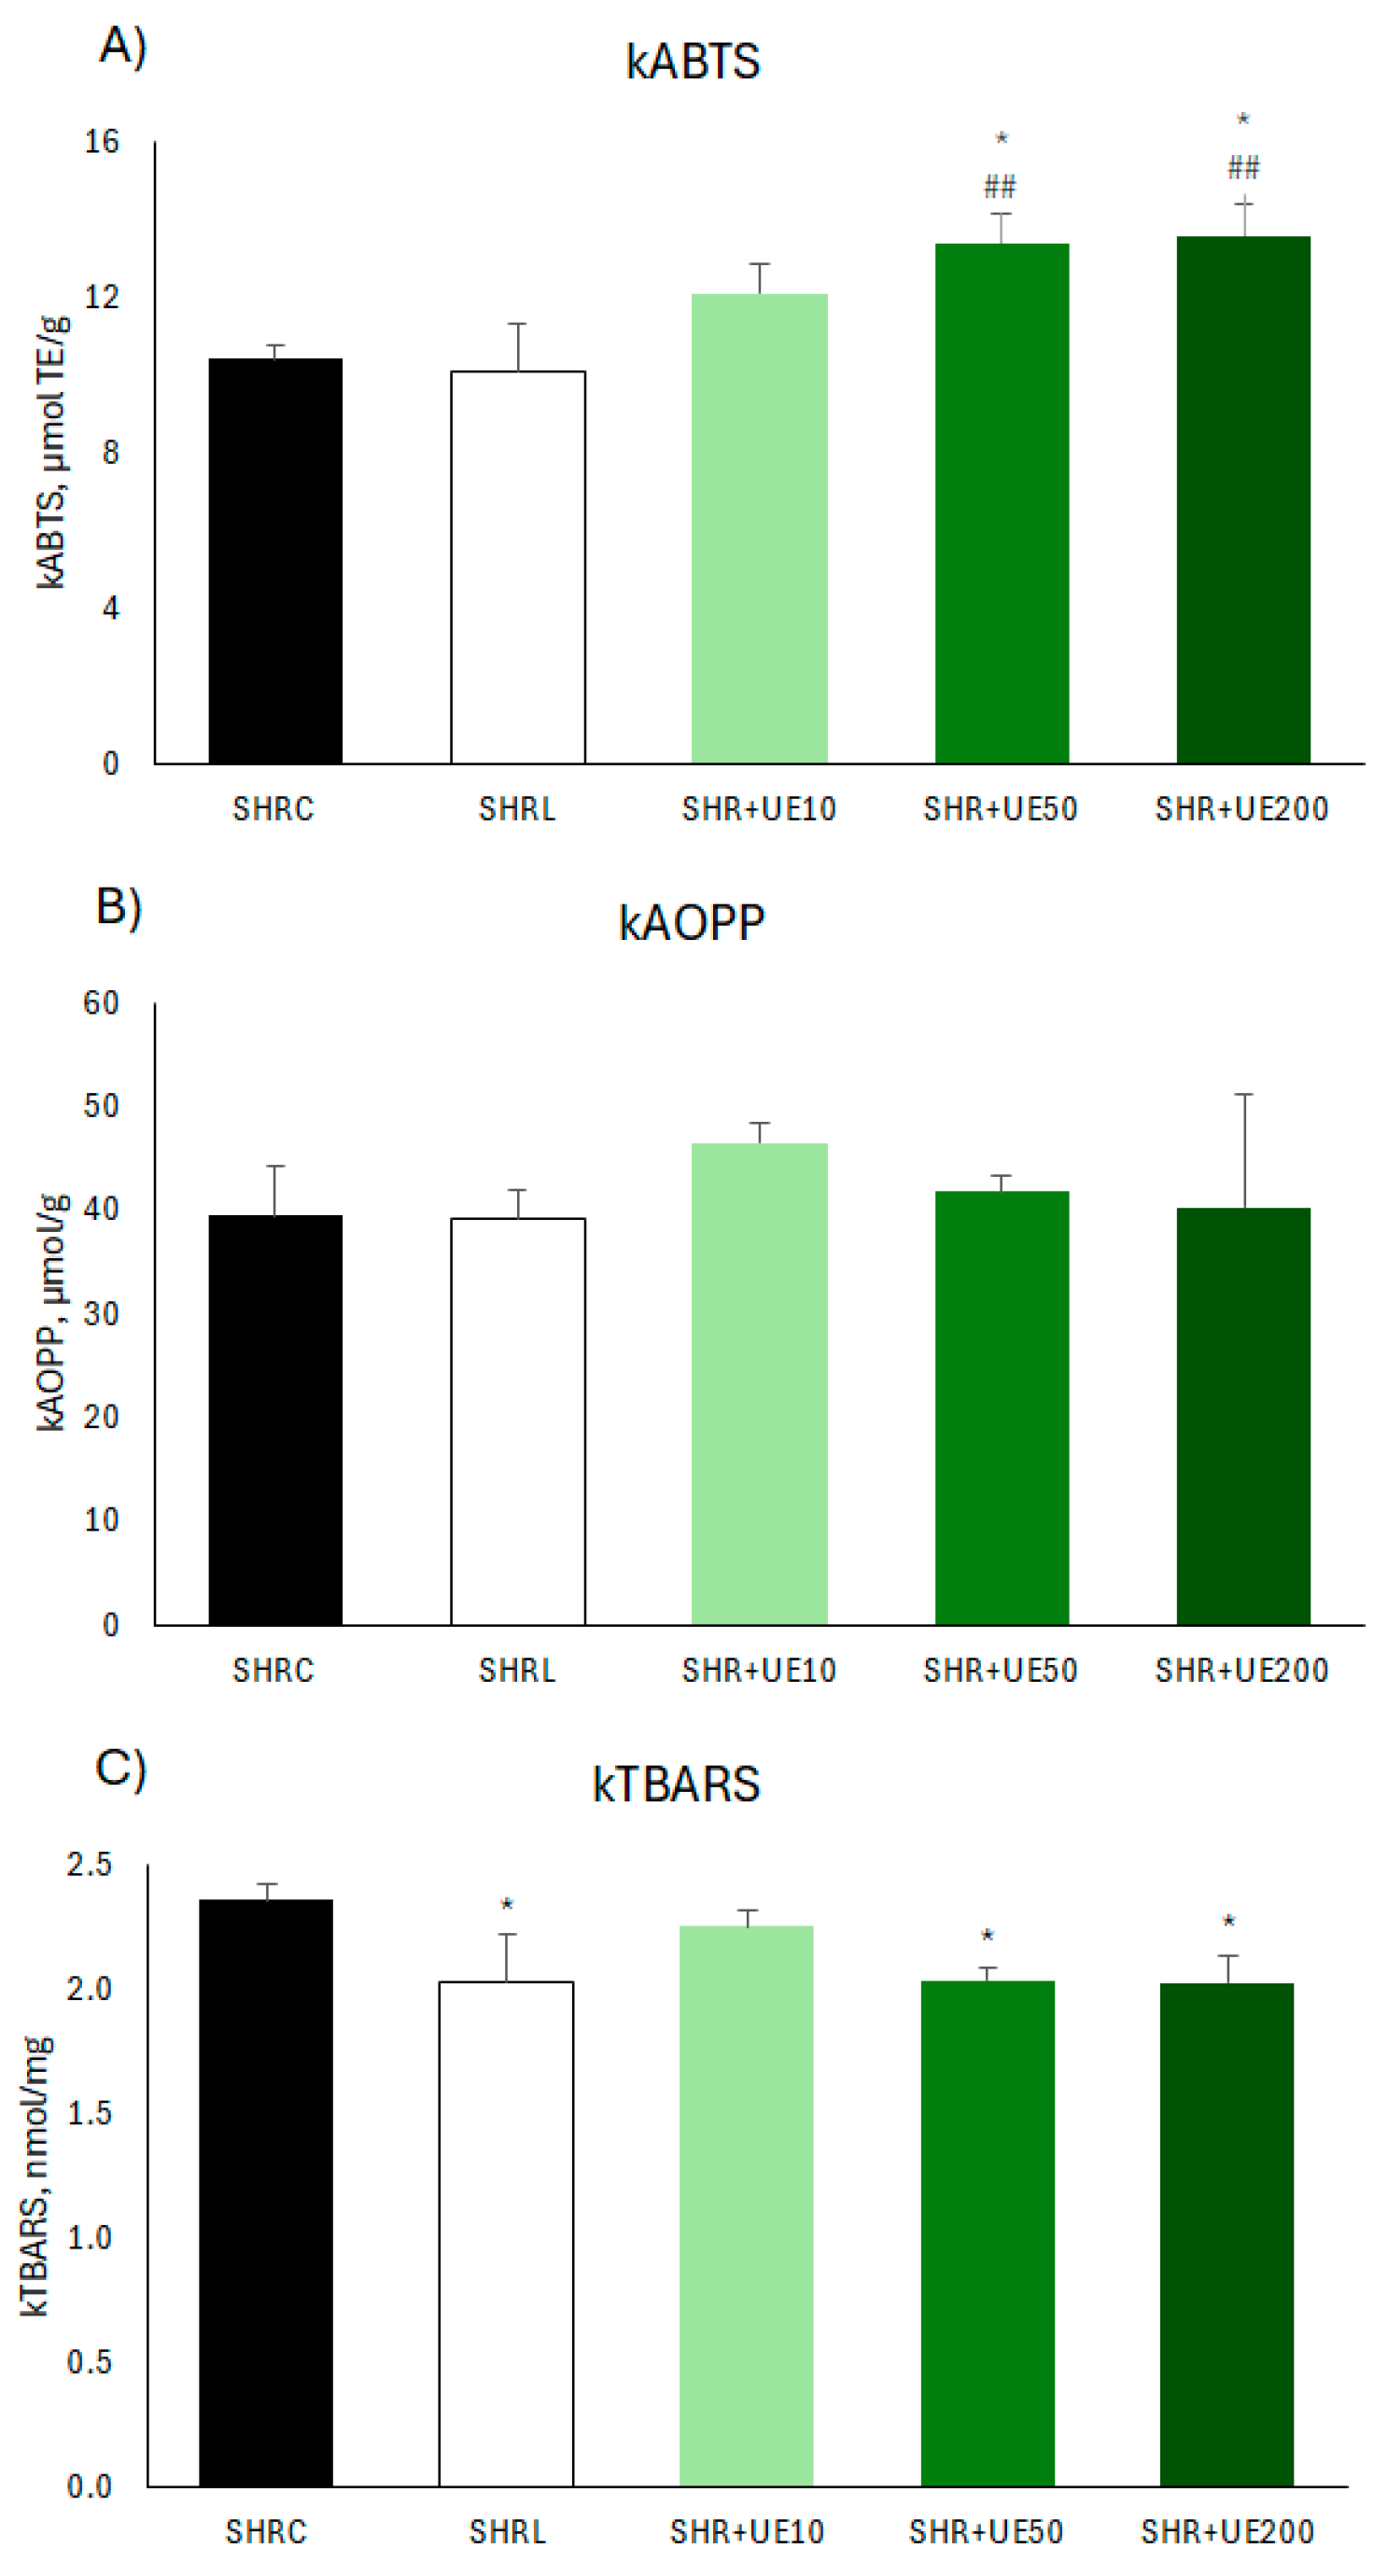
39]. In our study, the increase of kidney antioxidant capacity of SHR+UE50 and SHR+UE200, could also be the reason for the reduction of lipid peroxidation through the direct neutralization of ROS including superoxide radical, hydroxyl radical and hydrogen peroxide [
22], primarily through the activity of phenolic compounds metabolites [
40] present in our UE [
23], namely, chlorogenic acid, 2-O-caffeoyl malic acid, and rutin [
22]. This increased antioxidant capacity and reduced oxidative stress in those rats as well as in the SHRL group occurs despite the elevated 6-NO2Trp expression has been observed. To the best of our knowledge, there is no literature data about losartan, or UE-induced nitration of the protein containing tryptophan, or tryptophan alone. The modification of tryptophan residues in proteins may occur at a more limited number of sites in vivo than that of tyrosine residues and may result in modulation of the specific interaction of proteins and enzymes with other molecules [
5]. Some actions of radicals and oxidants such as oxidation are reversible, while others such as nitration, or breaking of the histidine and tryptophan rings are irreversible, resulting in altered conformation and modified turnover of targeted protein [
41]. Skorstengaard and collages showed that FN, a multiple-domain glycoprotein secreted by many cell types, is composed of two identical/nearly identical polypeptide chains, linked by two disulfide bridges near the C terminus containing tryptophan amino acid in this amino-terminal domain [
42], and that polymerization of secreted FN precedes the deposition and maturation of other ECM proteins (including collagen) [
43]. In addition, PAI-1, a member of the serine protease superfamily inhibitor (serpin) with antiprotease activity, plays a pivotal role in various acute and chronic pathophysiological processes, including cardiovascular disease, tissue fibrosis, cancer, and age-related diseases [
44]. We did not find any changes of PAI-1 expression in the UE10 treated group, while treatments with UE 50 and 200 mg/kg/day reduced both α-SMA and PAI-1 expressions. Verheyden et al. illustrated the importance of tryptophan residues for the kinetics of the conformational change of PAI-1, and that tryptophan residues 262 and 175 influence the transition from the active to the latent conformation [
45]. Considering the abovementioned, we suggested that the PAI-1 expression observed in our study after UE treatment represents a latent rather than active form. If such post-translational modifications of tryptophan residues of FN and PAI-1 occur in our study, we assume that they could affect various cellular processes thus resulting in regression of fibrogenesis and inflammation in SHR. Furthermore, renal function assessed by microalbuminuria in all UE groups was improved. Furthermore, the UE-induced decrease in PAI-1 expression was similar to that in losartan-treated SHRs, in which we noted a decrease in collagen IV, FN, and SMA, indicating an antifibrotic effect of the treatment. Porteri et al. [
46] have previously demonstrated that renal collagen type IV content is increased in SHR glomeruli compared to WKY and become normalized after ACE or ARB treatment (even at low, non-hypotensive doses) suggesting a pressure-independent protective effect of these drugs.
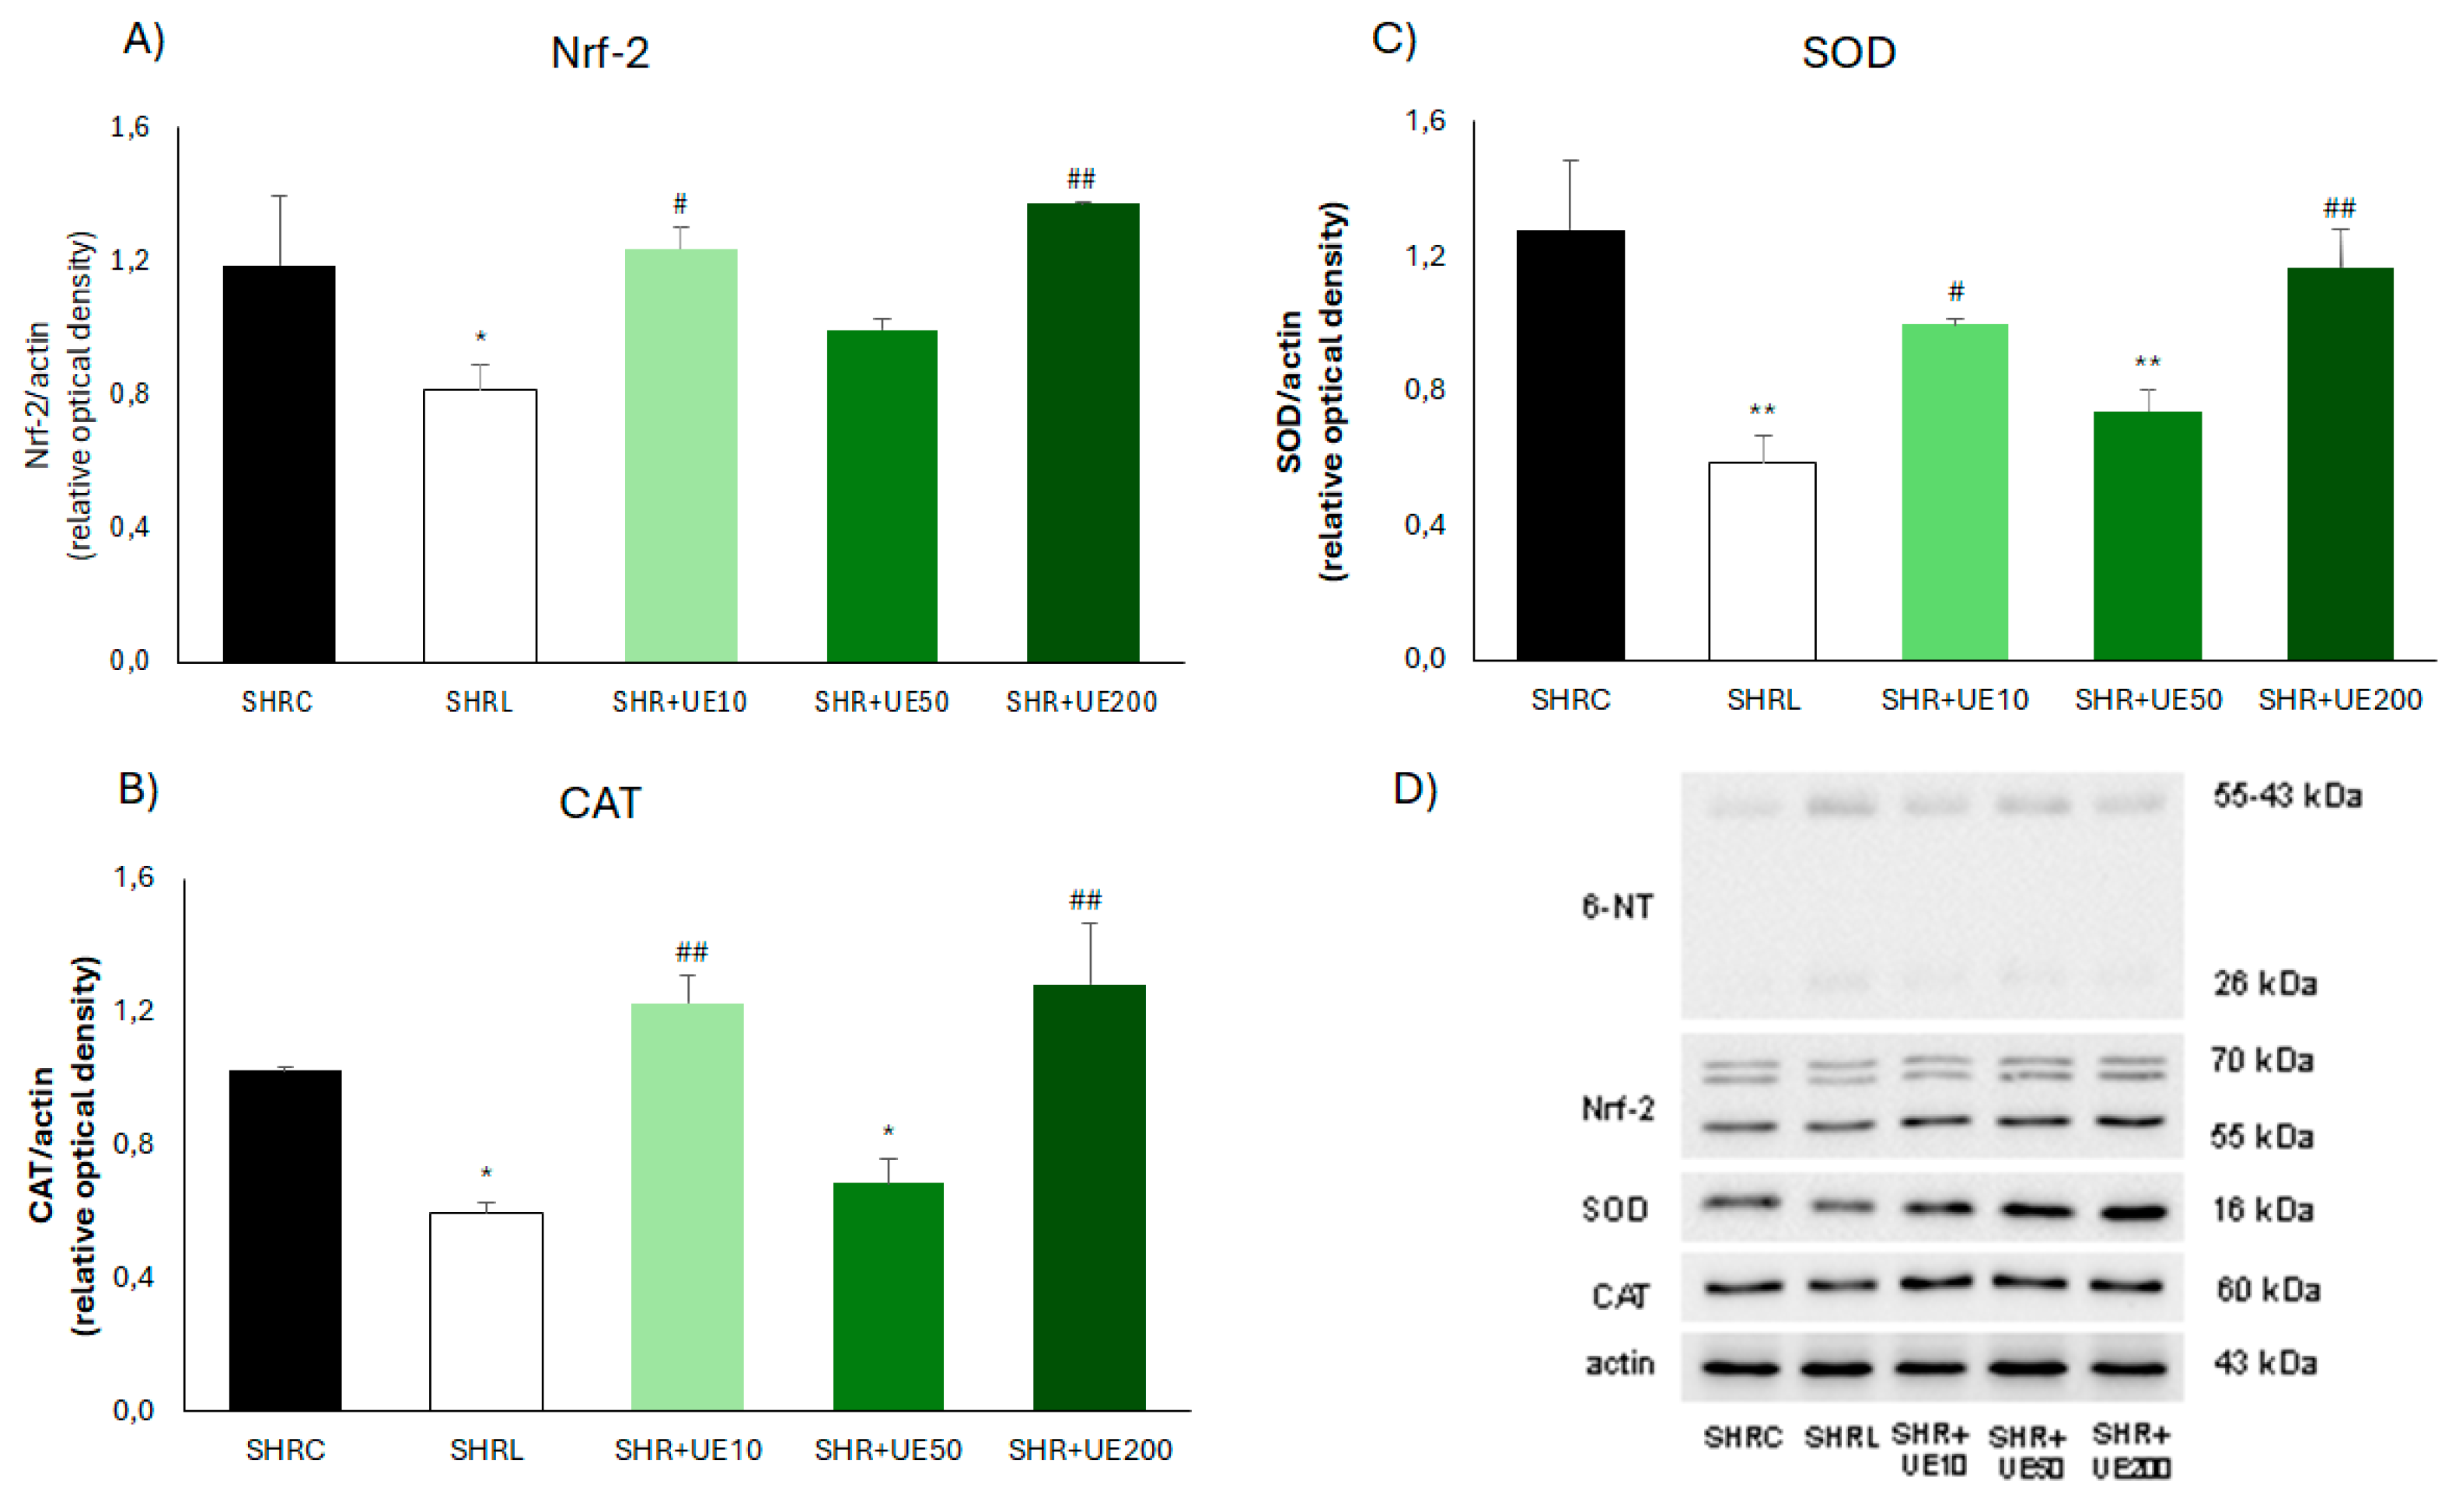
It is well known that in response to oxidative stress, Nrf2 is activated and binds to antioxidant response elements to activate the transcription and translation of antioxidant genes and proteins, respectively, while the inhibition of Nrf2 expression affected the expression level of antioxidant proteins [
47], among them SOD and CAT. Erejuwa et al. found markedly downregulated Nrf2 mRNA expression level in the kidney of SHR compared with WKY, followed by the increased malondialdehyde content, despite the elevated CAT activity [
48]. Results that we reported here showed equal reduction of Nrf-2/SOD/CAT molecule expressions in the kidney of SHR exposed to chronic losartan and UE50 treatment. However, both treatments successfully improved oxidative stress. Such discrepancy indicates a significant role of mechanisms other than Nrf2 signaling, for instance blockade of AT1 stimulated production of ROS by NADPH oxidase [
49], or direct antioxidant activity of UE [
22] in reducing ROS production under these experimental conditions.
4. Materials and Methods
4.1. Plant Material
Plant material was acquired from the Institute for Medicinal Plant Research “Dr. Josif Pančić”, Belgrade, Serbia. It was harvested at the mountain Jastrebac, Serbia (batch number 20040716, quality control number 1629).
4.2. Preparation of Extract
The UE was prepared as previously described [
23]. Briefly, dried and milled Urtica dioica L. leaves were extracted with ultrasound-assisted extraction technique under previously determined optimal conditions for maximal total phenolic content (54% v/v aqueous-methanol as solvent, 38 min extraction time, and 1:20 solid to liquid ratio). The extract was filtered, and methanol evaporated under vacuum (IKA® Werke GmbH & Co., Germany). The extract was pre-frozen in deep freeze at -80 °C for 1h, and then lyophilized. Conditions of the lyophilization were -60 °C, 0.011 bar, for 24 h, and -75 °C, 0.0012 bar, for 4 h (Beta 1-8 Freeze Dryer, Martin Christ, Osterode am Harz, Germany). Part of the extract was used for the separation, detection, and quantification of phenolic compounds present in this extract where the content of chlorogenic acid, 2-O-caffeoyl malic acid, and rutin in UE was determined to be 15.3, 12.3, and 6 mg/g UE, respectively by HPLC [
22]. The remaining dry extract (UE) was used for the present in vivo study.
4.3. Ethical Statement
The experimental protocol was approved by the Ethics Committee of the Institute for Medical Research, University of Belgrade, as well as by the Veterinary Directorate, Ministry of Agriculture and Environmental Protection, Republic of Serbia (323-07-02449/2014-05) according to the National Law on Animal Welfare (‘Službeni Glasnik’ No. 41/09, 39/10) which is consistent with guidelines for animal research and principles of the European Convention for the Protection of Vertebrate Animals Used for Experimental and Other Purposes (Official Daily N. L 358/1-358/6, 18, December 1986), and Directive on the protection of animals used for scientific purposes (Directive 2010/63/EU of the European Parliament and of the Council, 22 September 2010).
4.4. Animal Studies
In this study, fifty male spontaneously hypertensive rats (SHR), six months old and weighing approximately 300 g, were used. The animals were bred at the Institute for Medical Research, University of Belgrade, Serbia, and were fed with standard chow for laboratory rats (AGRO-FIRM doo Požarevac, Serbia) with food and water at disposal ad libitum. Animals were kept in groups of four rats per cage with 12 h light/dark cycles at room temperature. Animals were divided into 5 experimental groups which in the course of four weeks received orally: 0.5 mL/day of water (control group SHRC), conventional antihypertensive drug – losartan (DUP 153, Du Pont, Wilmington, DE, USA) 10 mg/kg/day in the volume of 0.5 mL of water (SHRL), and 10, 50, and 200 mg/kg/day of UE (SHR+UE10, SHR+UE50, and SHR+UE200, respectively) dissolved in 0.5 mL of water.
4.5. Body Weight, Urine Flow, and Blood Pressure Measurement
At the end of the treatment period, the body weight of all rats was measured, and rats were placed in metabolic cages for 24-hour urine collection. Urine flow (Uf, ml/24h) was calculated from urine volume normalized to body weight (BW). Next, rats were anesthetized with 35 mg/kg BW sodium pentobarbital intraperitoneally. For mean arterial blood pressure (MAP) measurements, the left femoral artery was cannulated with PE-50 catheters (Clay-Adams Parsippany, NY, USA) and connected to the physiological data acquisition system (9800TCR Cardiomax III-TCR, Columbus, OH, USA).
4.6. Sample Collection and Preparation
Blood samples were collected using lithium-heparin as an anticoagulant. Blood was centrifuged at 4000 min-1 for 20 min, and plasma was kept at -20 °C until further analysis. Kidneys were removed, washed in ice-cold saline (0.9 % m/w NaCl), and weighed (kidney weight, KW). KW/BW ratio was calculated and expressed as g/kg. One part of the longitudinally dissected kidney was stored at -80 °C until assaying.
4.7. Assessment of Kidney Function
Plasma creatinine (pCr) and urine albumin concentrations (uAlb) were measured by an automatic COBAS INTEGRA 400 plus analyzer (Hoffmann-La Roche, Leitch Diagnostic, Germany). Urinary albumin excretion (Albexc) was calculated from the Uf and urine albumin concentration and expressed as mg/24h.
4.8. Determination of Plasma, Urine, and Kidney NO Metabolites
Total nitrate/nitrite (NOx) and nitrite (NO2-) concentrations were measured in plasma, urine, and kidney homogenate by the Griess reagent method [
24]. Briefly, diluted samples were deproteinized by adding 5 μL 15 g/L of ZnSO4. For the determination of NOx, 50 μL of each sample was added to a microplate with 30 μL 8 μM of FAD (flavin adenine dinucleotide), 10 μL 1mM of NADPH (β-Nicotinamide adenine dinucleotide phosphate), and 10 μL of nitrate reductase (10 U/mL). After the reduction of nitrate to nitrite, 100 μL of Griess reagent (120 mM of sulfanilamide, 2.5% phosphoric acid, and 8 mM of N-1-naphthylethylenediamine) was added to these samples, as well as to non-reductase treated samples. The absorbance of all samples was measured at 540 nm after 10 min of incubation in the dark and at room temperature, and results were expressed as micromoles per liter (μmol/L) for plasma and urine, and micromole per milligram of kidney tissue (μmol/mg).
4.9. Determination of NO2-Content in UE
Griess reagent was also used for the determination of NO2- content in UE, and the result was expressed as milligrams per gram of UE (mg/g).
4.10. Lipid Peroxidation
Thiobarbituric acid-reactive substance (TBARS) assay was used for the estimation of lipid peroxidation in the kidney (kTBARS) [
25]. It was done by mixing 0.4 mL of the sample with 0.2 mL of 28% trichloroacetic acid and centrifuging the mixture for 4 min at 15000 RPM. The supernatant was collected and mixed with 0.1 mL 694 mM of thiobarbituric acid and incubated at 100 °C for 15 min. Readings were performed at 540 nm. Results were expressed as nanomoles per milligram of kidney tissue (nmol/mg).
4.11. Advanced Oxidation Protein Products
Advanced oxidation protein products in the kidney (kAOPP) were measured according to the previously described method [
26]. In brief, two hundred microliters of sample were placed in a well of a 96-well microtiter plate, followed by 20 µl of acetic acid. Then, 10 µL of 1.16 M KI was added, as well as 20 µL of acetic acid. The absorbance was measured at 340 nm. Results were expressed as micromoles of chloramine-T equivalents per gram of kidney tissue (µmol/g).
4.12. Antioxidant Status
Antioxidant status in the kidney (kABTS) was measured using the Trolox Equivalent Antioxidant Capacity method [
27]. Briefly, 5 mL of 7 mM ABTS solution was mixed with 0.1 mL of 125 mM K2S2O8 solution and left in the dark for 12-16 hours. The absorbance of the ABTS•+ solution was adjusted to 0.70 at 734 nm with 50 mM PBS (pH 7.4). After the addition of 2.0 mL of diluted ABTS•+ reagent to 20 μL of kidney homogenate, the reaction mixture was incubated for 6 min at 30 °C and the absorbance was recorded at 734 nm. Results were expressed as micromoles of Trolox equivalents per gram of kidney tissue (µmol TE/g).
4.13. Western Blot Analysis
Kidney tissue samples (6 animals per group) were homogenized in RIPA buffer, as previously described [
28]. Briefly, cold RIPA lysis buffer (50 mM Tris-HCl pH 7.5, 150 mM NaCl, 1% Triton x-100, 1% sodium deoxycholate, 0.1% sodium dodecyl sulfate, 2 mM EDTA, and 50 mM NaF) with added protease inhibitor cocktail (Pierce, Thermo Fisher Scientific) and sodium orthovanadate (sample: buffer = 1: 10 m/w), was used for kidney homogenization. Lysates of the kidneys were incubated at 4 °C for 20 min, and then centrifuged for 20 min at 15,000 x g, 4 °C. Protein concentration in samples was determined by the BCA Protein Assay Kit (Pierce, Thermo Fisher Scientific). Equal amounts of protein were separated by SDS-PAGE and transferred to nitrocellulose membranes (Appli-Chem GmbH, Darmstadt, Germany). Membranes were then probed with primary antibodies: eNOS (1:1000, Sigma-Aldrich SAB4502016), iNOS (1:1000, Sigma-Aldrich SAB4502011), nNOS (1:1000, Millipore AB5380), and Actin (1:1000, Sigma-Aldrich A5060). Peroxidase-conjugated goat anti-rabbit immunoglobulin (1:40000, Sigma-Aldrich A0545) was used as a secondary antibody. oThe eNOS, iNOS, and nNOS protein bands were visualized using an enhanced chemiluminescence reagent system (GE Healthcare, Amersham, UK) and quantified by the Image Master Total Lab (GE Healthcare) densitometry software. Next set of membranes were tested with primary antibodies against 6-nitrotryptophan (6-NO2Trp, 1:1000, Abcam ab243072), Nrf-2 (1:500, Novusbio NBP1-32822), SOD (1:1000, Abcam ab16831), CAT (1:1000, Abcam ab16731), and normalized to actin (1:1000, Sigma-Aldrich A5060). Incubation with horseradish peroxidase-conjugated secondary antibodies followed (anti-rabbit IgG, 1:40000, Sigma-Aldrich A0545 for SOD, CAT, and Nrf-2; anti-mouse IgG, 1:2500, Sigma-Aldrich A5278 for 6-NO2Trp), after which a chemiluminescence reagent was applied. Bands were visualized using the ChemiDoc Imaging system (Bio-Rad Laboratories, Inc., Hercules, CA, USA), and analyzed in Image Lab v6.0.1. software. At least three independent immunoblot experiments were carried out for each examined protein expression.
4.14. Immunofluorescent Staining
Immediately after removal, kidney tissue was snap-frozen in liquid nitrogen for consequent use for routine immunofluorescent analysis, and the rest of the tissue was stored at -80oC for further immunostaining. Five μm-thick cryostat sections were dried for 1h at room temperature, and fixed in acetone for 10 min. To obtain double fluorescent labeling of collagen IV/fibronectin and SMA/PAI-1, we applied the following primary antibodies: collagen IV clone CIV22 (mouse monoclonal, 1:50, Bio SB), fibronectin ab2413 (rabbit polyclonal, 1:100, Abcam), SMA clone 1 A4 (mouse monoclonal, 1:400, DAKO) and PAI-1 cat. no NBP119773 (rabbit polyclonal, 1:20 Novus Biologicals). Secondary antibodies were the following goat anti-rabbit IgG (H+L) Alexa Flor 488 (1:500, Life Technologies) and goat anti-mouse IgG (H+L) Alexa Flor 647 (1:100, Abcam). Nuclei were identified by 4,6-diamino-2-phenylindolyl-dihydrochloride (DAPI; 1 μg/ml). Sections were mounted with Fluoro Preserve Reagent (Calboichem, Germany). Slides were analyzed on fluorescence microscopy (Olympus AX70 (Olympus, Japan) with digital camera Olympus DP74 (20.7 Mpx, 1/1.2 inch) and computer-supported imaging system cellSens Standard (CS-ST-V2).
4.15. Statistical Analysis
The results are presented as the mean values with standard error of the mean (SEM). All measurements were performed in triplicate. For comparison between different groups, we used a One-way ANOVA omnibus test with Fisher Least Significant Difference (LSD) post hoc test (Statistica 8, StatSoft Inc. Tulsa, OK). A p-value of less than 0.05 was considered statistically significant.
Author Contributions
Conceptualization, N.M.S. and UJ.V.; methodology, N.M.S., Z.M., M.I., UJ.V., M.Z., D.K., and J.G.M; software, UJ.V., D.K., M.Z., and M.I.; validation, Dj.J., N.M.S. and Z.M.; formal analysis, UJ.V., D.K., M.Z., J.G.M., and M.I.; investigation, N.M.S., UJ.V., and D.K.; resources, Dj.J., and Z.M.; data curation, UJ.V., D.K., and M.Z.; writing—original draft preparation, UJ.V., and N.M.S.; writing—review and editing, UJ.V., N.M.S.; visualization, UJ.V., D.K., M.Z.; supervision, Dj.J., and Z.M.; project administration, N.M.S., Z.M., and Dj.J.; funding acquisition, Dj.J., and Z.M. All authors have read and agreed to the published version of the manuscript.
Figure 1.
Total A) nitrate/nitrite (NOx) and B) nitrite (NO2) concentrations in plasma of SHR; Total C) nitrate/nitrite (NOx) and D) nitrite (NO2) concentrations in urine of SHR; Total E) nitrate/nitrite (NOx) and F) nitrite (NO2) concentrations in the kidney of SHR. SHRC received 0.5 mL/day of water, SHR+L received 10 mg/kg/day of losartan, SHR+UE10, SHR+UE50, and SHR+UE200 received 10, 50, and 200 mg/kg/day of Urtica dioica L. leaf extract (UE), respectively. *p<0.05 and **p<0.01 compared to SHRC, #p<0.05, ##p<0.01 and ###p<0.001 compared to SHRL. Data presented as mean ± SEM (One-way ANOVA omnibus test with Fisher Least Significant Difference (LSD) post hoc test, Sta-tistica 8, StatSoft Inc. Tulsa, OK).
Figure 2.
Kidney A) eNOS, B) nNOS, C) iNOS, and D) 6-NO2Trp protein expressions in SHR with E) the representative western blots of NOS isoforms. SHRC received 0.5 mL/day of water, SHR+L received 10 mg/kg/day of losartan, SHR+UE10, SHR+UE50, and SHR+UE200 received 10, 50, and 200 mg/kg/day of Urtica dioica L. leaf extract (UE), respectively**p < 0.01 and ***p < 0.001 compared to SHRC, ##p < 0.01 and ###p < 0.001 compared to SHRL. Data presented as mean ± SEM from three independent experiments (One-way ANOVA omnibus test with Fisher Least Significant Difference (LSD) post hoc test, Statistica 8, StatSoft Inc. Tulsa, OK).
Figure 3.
Kidney A) Nrf-2, B) CAT, and C) SOD expressions in SHR with D) representative western blots. SHRC received 0.5 mL/day of water, SHR+L received 10 mg/kg/day of losartan, SHR+UE10, SHR+UE50, and SHR+UE200 received 10, 50, and 200 mg/kg/day of Urtica dioica L. leaf extract (UE), respectively. *p < 0.05 and **p < 0.01 compared to SHRC, #p < 0.05 and ##p < 0.01 compared to SHRL. Data presented as mean ± SEM from three independent experiments (One-way ANOVA omnibus test with Fisher Least Significant Difference (LSD) post hoc test, Statistica 8, StatSoft Inc. Tulsa, OK).
Figure 4.
A) antioxidant capacity (kABTS), B) advanced oxidation protein products (kAOPP), and C) lipid peroxidation level (kTBARS) in the kidney of SHR. SHRC received 0.5 mL/day of water, SHR+L received 10 mg/kg/day of losartan, SHR+UE10, SHR+UE50, and SHR+UE200 received 10, 50, and 200 mg/kg/day of Urtica dioica L. leaf extract (UE), respectively. *p < 0.05 compared to SHRC, , ##p < 0.01 compared to SHRL. Data presented as mean ± SEM (One-way ANOVA omnibus test with Fisher Least Significant Difference (LSD) post hoc test, Sta-tistica 8, StatSoft Inc. Tulsa, OK).
Table 1.
Body weight (BW), urine flow (Uf), kidney weight (KW), kidney weight to body weight ratio (KW/BW), plasma creatinine concentration (pCr), albumin excretion (Albexc), and mean arterial pressure in SHR. SHRC received 0.5 mL/day of water, SHR+L received 10 mg/kg/day of losartan, SHR+UE10, SHR+UE50, and SHR+UE200 received 10, 50, and 200 mg/kg/day of Urtica dioica L. leaf extract (UE), respectively.
| |
SHRC |
SHRL |
SHR+UE10 |
SHR+UE50 |
SHR+UE200 |
| BW, g |
304±5 |
301±6 |
321±6#
|
304±5 |
312±4 |
| Uf, ml/24h |
10.0±1.1 |
12.2±0.9 |
7.5±0.6##
|
10.7±1.1 |
8.6±0.6 |
| KW, g |
1.05±0.03 |
1.06±0.03 |
1.07±0.02 |
1.06±0.01 |
1.09±0.03 |
| KW/BW |
0.348±0.006 |
0.351±0.007#
|
0.329±0.006 |
0.349±0.005 |
0.350±0.009 |
| pCr, µmol/mL |
43.7±1.7 |
49.6±1.8**
|
46.3±1.6 |
42.9±1.3 |
45.5±1.2 |
| Albexc, mg/24h |
0.422±0.046 |
0.450±0.041 |
0.194±0.030***, ###
|
0.317±0.033*, #
|
0.267±0.024**, ##
|
| MAP, mmHg |
162±4 |
135±5**
|
150±9 |
143±8*
|
141±8*
|

