Preprint
Article

Tailoring Photoluminescence and X-ray Storage Properties in Mechanochemically Prepared Nanocrystalline CaF₂:Sm3+

Altmetrics

Downloads

21

Views

21

Comments

0

This version is not peer-reviewed

Submitted:

28 November 2024

Posted:

29 November 2024

You are already at the latest version

Alerts
Abstract
The mechanochemical preparation of nanocrystalline CaF2:Sm3+ by ball milling calcium acetate hydrate, samarium (III) acetate hydrate, and ammonium fluoride is reported. The photoluminescence of the as-prepared CaF2:Sm3+ shows predominantly Sm3+ 4G5/2 → 6HJ (J = 5/2, 7/2, 9/2, and 11/2) f-f luminescence, but electric dipole allowed 4f55d (T1u) → 4f6 7F1 (T1g) luminescence by Sm2+ was generated upon X-irradiation. In comparison with the co-precipitated CaF2:Sm3+, the conversion of Sm3+ "→" Sm2+ in the ball milling-sample upon X-irradiation is significantly lower. Importantly, the present results indicate that the crystallite size and X-ray storage phosphor properties of the lanthanide-doped nanocrystalline CaF2 can be modified by adjusting the ball milling time, dopant concentration, and post-annealing treatment, and crystallite sizes as low as 6 nm resulted under specific experimental conditions.
Keywords: 
Subject: Chemistry and Materials Science  -   Physical Chemistry

1. Introduction

CaF2 belongs to the alkaline earth metal fluoride (MF2) compounds which crystallize in the cubic structure with the Fm 3 ¯ m space group.[1,2] The Ca2+ ions lie at the nodes in the face-centered lattice, while the F- lie at the center of the octants.[3,4] There has been growing interest in studying the optical properties of lanthanide (Ln) doped CaF2 due to the high transmittance from the far UV to the mid IR range, high chemical resistance, and low refractive index of this host.[5]
Nanocrystalline CaF2:Ln has been prepared by a wide variety of methods such as co-precipitation,[6,7] sol-gel process,[8] hydrothermal synthesis,[9,10] and thermal decomposition of precursors.[11] In recent years, high-energy ball milling has increasingly been applied to synthesize stoichiometric and non-stoichiometric solid solutions with minimal or solvent free routes.[12,13,14,15] In this process, the mechanical energy caused by the high speed collision of balls in the ball milling jar forces the reagents to react and turn into fine powders that can be on the nanoscale.[16] This method has advantages in increasing the material reactivity, uniform spatial distribution of elements, and reducing the possibility of multi-phase formation.[17,18] Heise et al. [19] successfully synthesized Eu3+ doped MF2 (M = Ca, Sr, and Ba) powders by ball milling M(OAc)2, Eu(OAc)3, and NH4F, and crystallite sizes in the range of 12 to 18 nm were obtained. Molaiyan and Witter also reported the preparation of the CaF2:Sm3+ electrolyte by ball milling anhydrous CaF2 and SmF3 in stoichiometric compositions of Sm1-yCayF3-y (0  y  0.15) using a Tanchen planetary ball mill.[14] Although ball milling is a facile method in preparing nanocrystalline powders, this method has still not been widely applied to the preparation of MF2:Ln materials for optical applications.
We have previously reported that nanocrystalline CaF2:Sm3+ prepared by a co-precipitation method can serve as a relatively efficient photoluminescent X-ray storage phosphor, with the storage mechanism based on the reduction of Sm3+ to Sm2+ upon exposure to X-irradiation.[20] In the present study, we report the mechanochemical synthesis of nanocrystalline CaF2:Sm3+ by ball milling Ca(OAc)2, Sm(OAc)3, and NH4F at room temperature. The synthesized powders were characterized by XRD, electron microscopy, and luminescence spectroscopy. The effects of the ball milling time, Sm concentration, and post-annealing on the generation of Sm2+ by X-ray was investigated in detail using photoluminescence measurements.

2. Experimental Methods

Nanocrystalline CaF2:ySm3+ (y = mol%) was prepared by ball milling Ca(OAc)2·H2O (May & Baker Ltd), Sm(OAc)3.xH2O (Sigma Aldrich), and NH4F (Sigma Aldrich) according to the following solid-state reaction:
1 y Ca OAc 2 · H 2 O + y Sm OAc 3 · x H 2 O + 2 + y NH 4 F Ca 1 - y Sm y F 2 + y + 2 + y NH 3 + ( 2 + y ) HOAc + ( 1 y + xy ) H 2 O
Reagents (with y = 0.1%) were premixed and ground using a mortar and pestle before being transferred into a 12 ml zirconia ball mill jar with six 5 mm diameter zirconia balls. The mixtures were then ball milled for 1, 3, 5 or 8 h to investigate the dependence of physical properties on ball milling time. The ball milling was performed using a Fritsch Planetary Mill (Pulverisette 7) at 10 Hz. The obtained mixture was dried overnight in an oven (Labec, Model H323) at 60 °C. The final product was then ground using a mortar and pestle to yield a homogenous nanocrystalline powder. Nanocrystalline CaF2:ySm3+ powders with different Sm concentrations (y = 0, 0.05, 0.1, 0.3, 0.5, 1, 3, and 5 %) were also prepared with a ball milling time of 8 h. Post-annealing by using a muffle furnace (Labec, CEMLS-SD) was conducted at temperatures of 200, 300, and 400 °C in air.
The phase purity of samples was characterized by powder X-ray diffraction (XRD) on a Rigaku MiniFlex-600 benchtop diffractometer with Cu-Kα radiation (λ = 0.154 nm, 40 kV and 15 mA) with a scanning step and speed of 0.01° and 0.5°/min, respectively. Data was collected in the 2θ range of 10 to 100°. TEM imaging was undertaken by a FEI Tecnai G2 Spirit transmission electron microscope.
Photoluminescence (PL) spectra of Sm3+ were measured by using a Horiba Jobin-Yvon Spex FluoroMax-3 fluorometer at room temperature with 405 nm excitation. Sm2+ luminescence spectra were recorded on a Spex 500 M monochromator (150 grooves/mm grating), equipped with an Andor iDus camera (DV401A-BV Si CCD). A closed-cycle cryostat (CTI-Cryogenics Cryodyne model 22) was used to cool the sample to 27 K. In this case, the samples were excited by a focused 635 nm laser diode. The powders were manually pressed into a counterbore of 5 mm diameter and 0.5 mm depth on an aluminium holder.
The X-ray based reduction of Sm3+ to Sm2+ was undertaken on the Rigaku Miniflex-600 benchtop powder XRD diffractometer at a 2θ angle of 30° (dose rate ~15 mGy s-1). The X-ray dose was cross-calibrated against a Sirona HELIODENT Plus dental X-ray source.

3. Results and Discussions

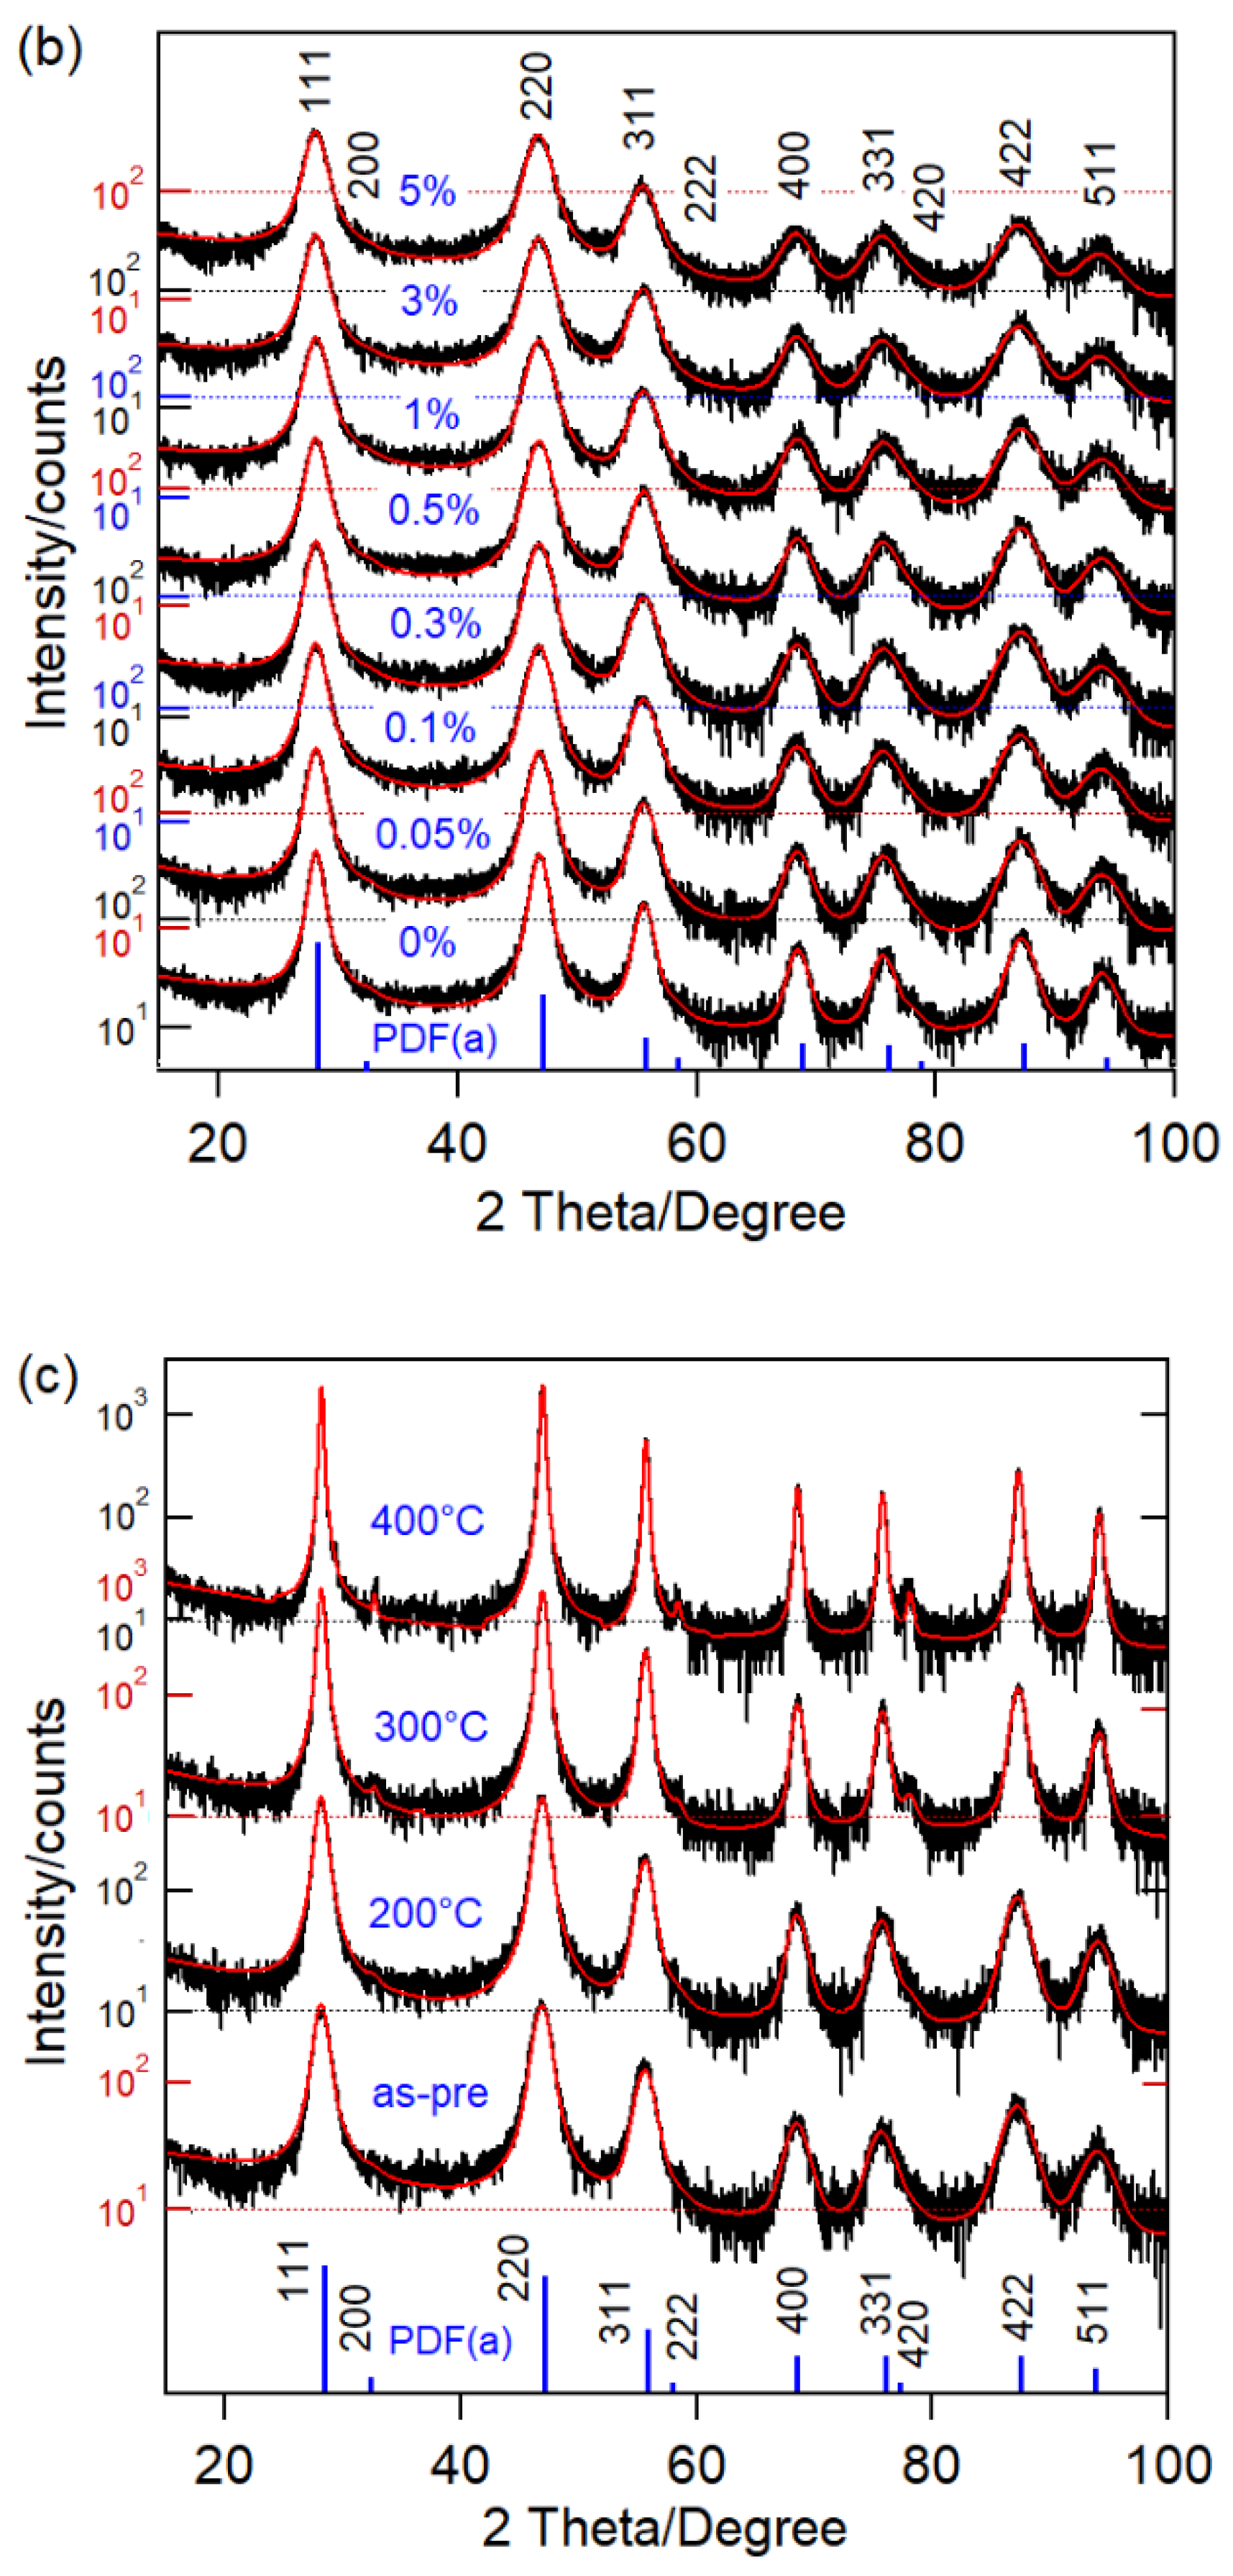
The XRD patterns of nanocrystalline CaF2:0.1%Sm3+ prepared by ball milling with periods of 1, 3, 5 and 8 h are shown in Figure1a. In Figure 1b the XRD patterns of CaF2:ySm3+ ball milled for 8 h with different concentrations of Sm3+ (0 ≤ y ≤ 5 %) are illustrated. Finally, in Figure 1c the XRD patterns of CaF2:0.1%Sm3+ (8 h ball milling period) annealed at temperatures of 200, 300, and 400 °C are shown. The patterns were compared with the standard CaF2 data (PDF-1000043) taken from the Crystallography Open Database.[21] Results from Rietveld refinements obtained by the MAUD[22] software package are summarized in Table 1. The goodness of fit G = Rwp/Rexp is < 1.5 for all refinements, i.e. implying good fits.[23] As follows from the figures, all the prominent peaks could be indexed to the cubic CaF2 structure with the Fm 3 ¯ m space group.[1,2]
As seen in Figure 1a, impurity peaks are still visible after 1 h of milling. A more complete phase formation of nanocrystalline CaF2 can be observed after 3 h. Importantly, prolonged ball milling broadened the diffractions peaks, and this was caused by the decrease of the average crystallite size of CaF2:0.1%Sm3+ from 12 ± 1 to 8 ± 1 nm for ball milling times of 1 to 8 h (Table 1a). A 0.14% expansion of the lattice parameter was also observed with this decrease in the crystallite size. It is noted here that the use of hydrated salts in ball milling may accelerate the formation of CaF2:ySm3+ due to the higher mobility of ions and this was also observed in the preparation of nanocrystalline BaFCl.[24]
Interestingly, a reduction of the average crystallite size of CaF2:ySm3+ from 12 ± 1 to 6 ± 1 nm (Table 1b) was observed when the Sm3+ concentration was increased from 0 to 5 %. The lattice parameter also increased by 0.17 % in this case. The latter is most likely caused by the mechanism of charge compensation as Sm3+ substitutes Ca2+. The excess positive charge must be compensated by defects such as O2- impurity ions, substituting F- in the lattice, and/or interstitial F-. Also, the electronic repulsion of the ions may increase the lattice parameter.[25,26] Importantly, Sm3+ can easily substitute Ca2+ in the Oh symmetry with eightfold (bcc) coordination, due to their similar ionic radii (Sm3+ = 1.08 Å, compared to Ca2+ = 1.12 Å) [27] and, importantly, phase purity is retained for Sm3+ concentrations up to 5%.
As follows from Figure 1c, the annealing of CaF2:0.1% Sm3+ at 200, 300, and 400 °C significantly narrowed the diffraction peaks. From the Rietveld refinements average crystallite sizes of 12, 22, and 46 ± 1 nm, respectively, were obtained for these annealing temperatures (Table 1c). The crystallite size appeared to grow by ~T3.4 upon annealing up to 400 °C.
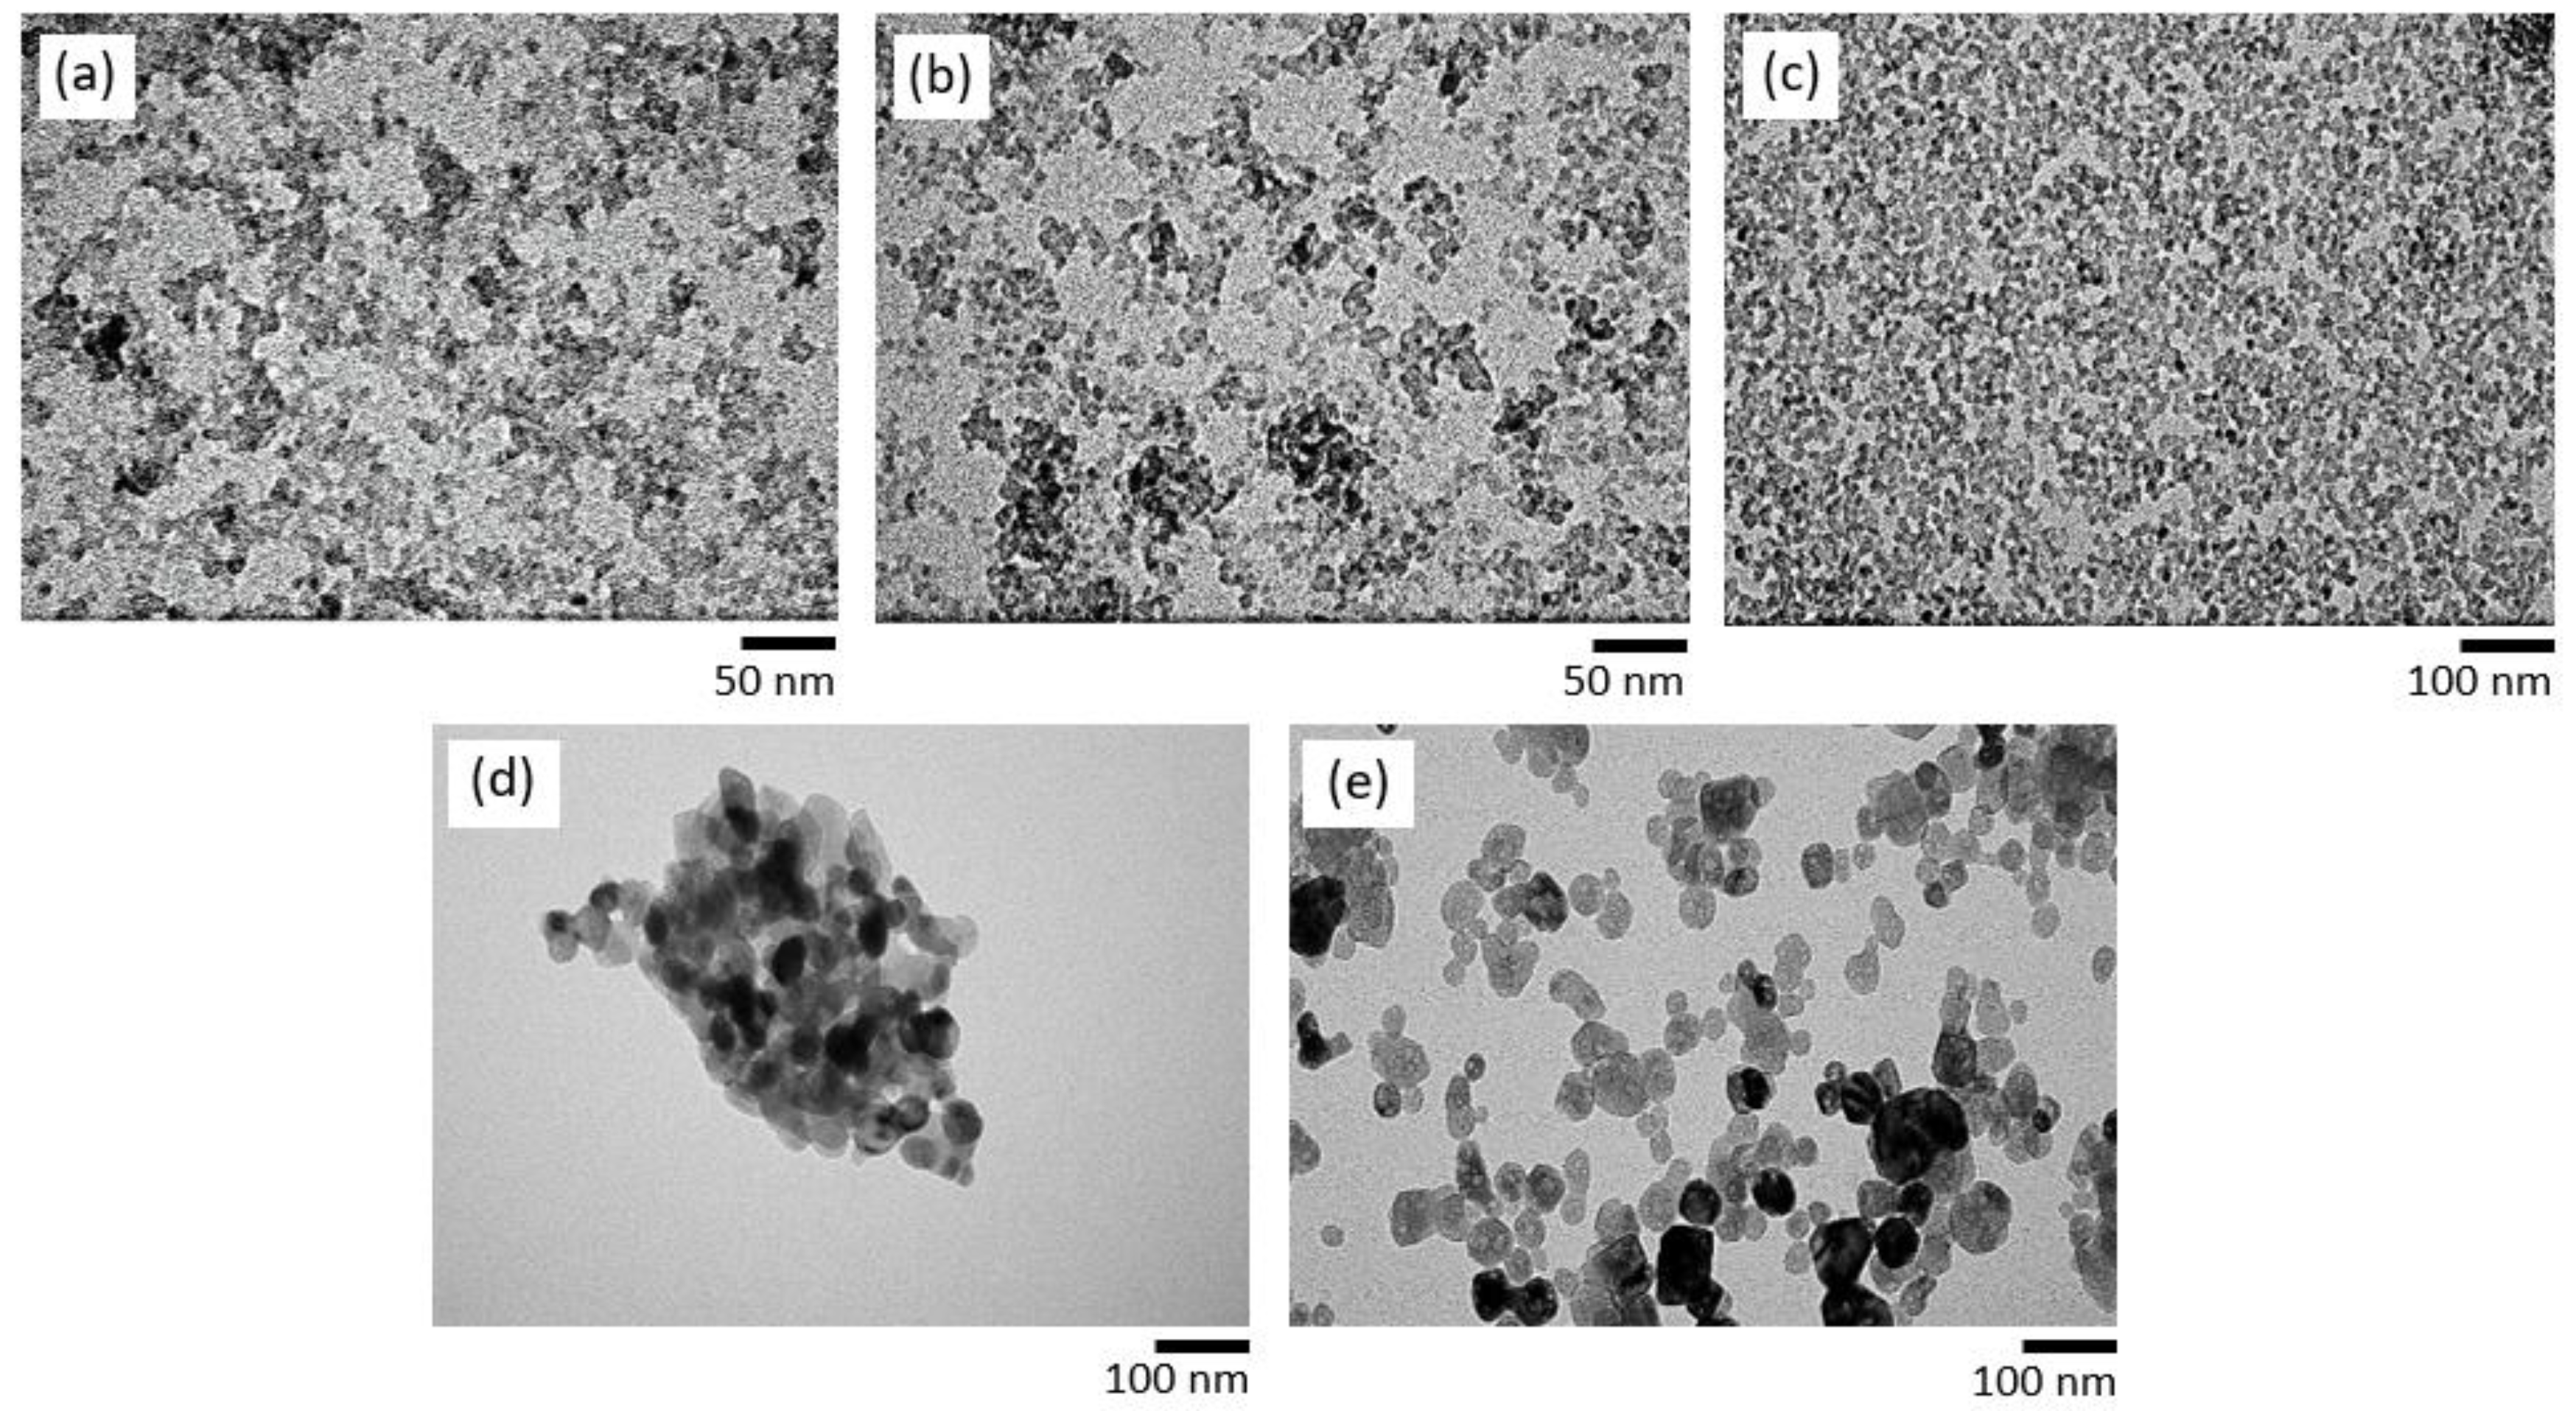
Typical TEM micrographs of CaF2:0.1%Sm3+ prepared by ball milling are displayed in Figure 2. The observed crystallite/particle size distribution was in good agreement with the average crystallite sizes obtained from the Rietveld refinements. In particular, annealing the sample to 400 °C significantly increased the particle size. A micrograph of CaF2:0.5%Sm3+ prepared by co-precipitation[20] with an average crystallite size of 46 ± 1 nm is shown in Figure 2e for comparison.
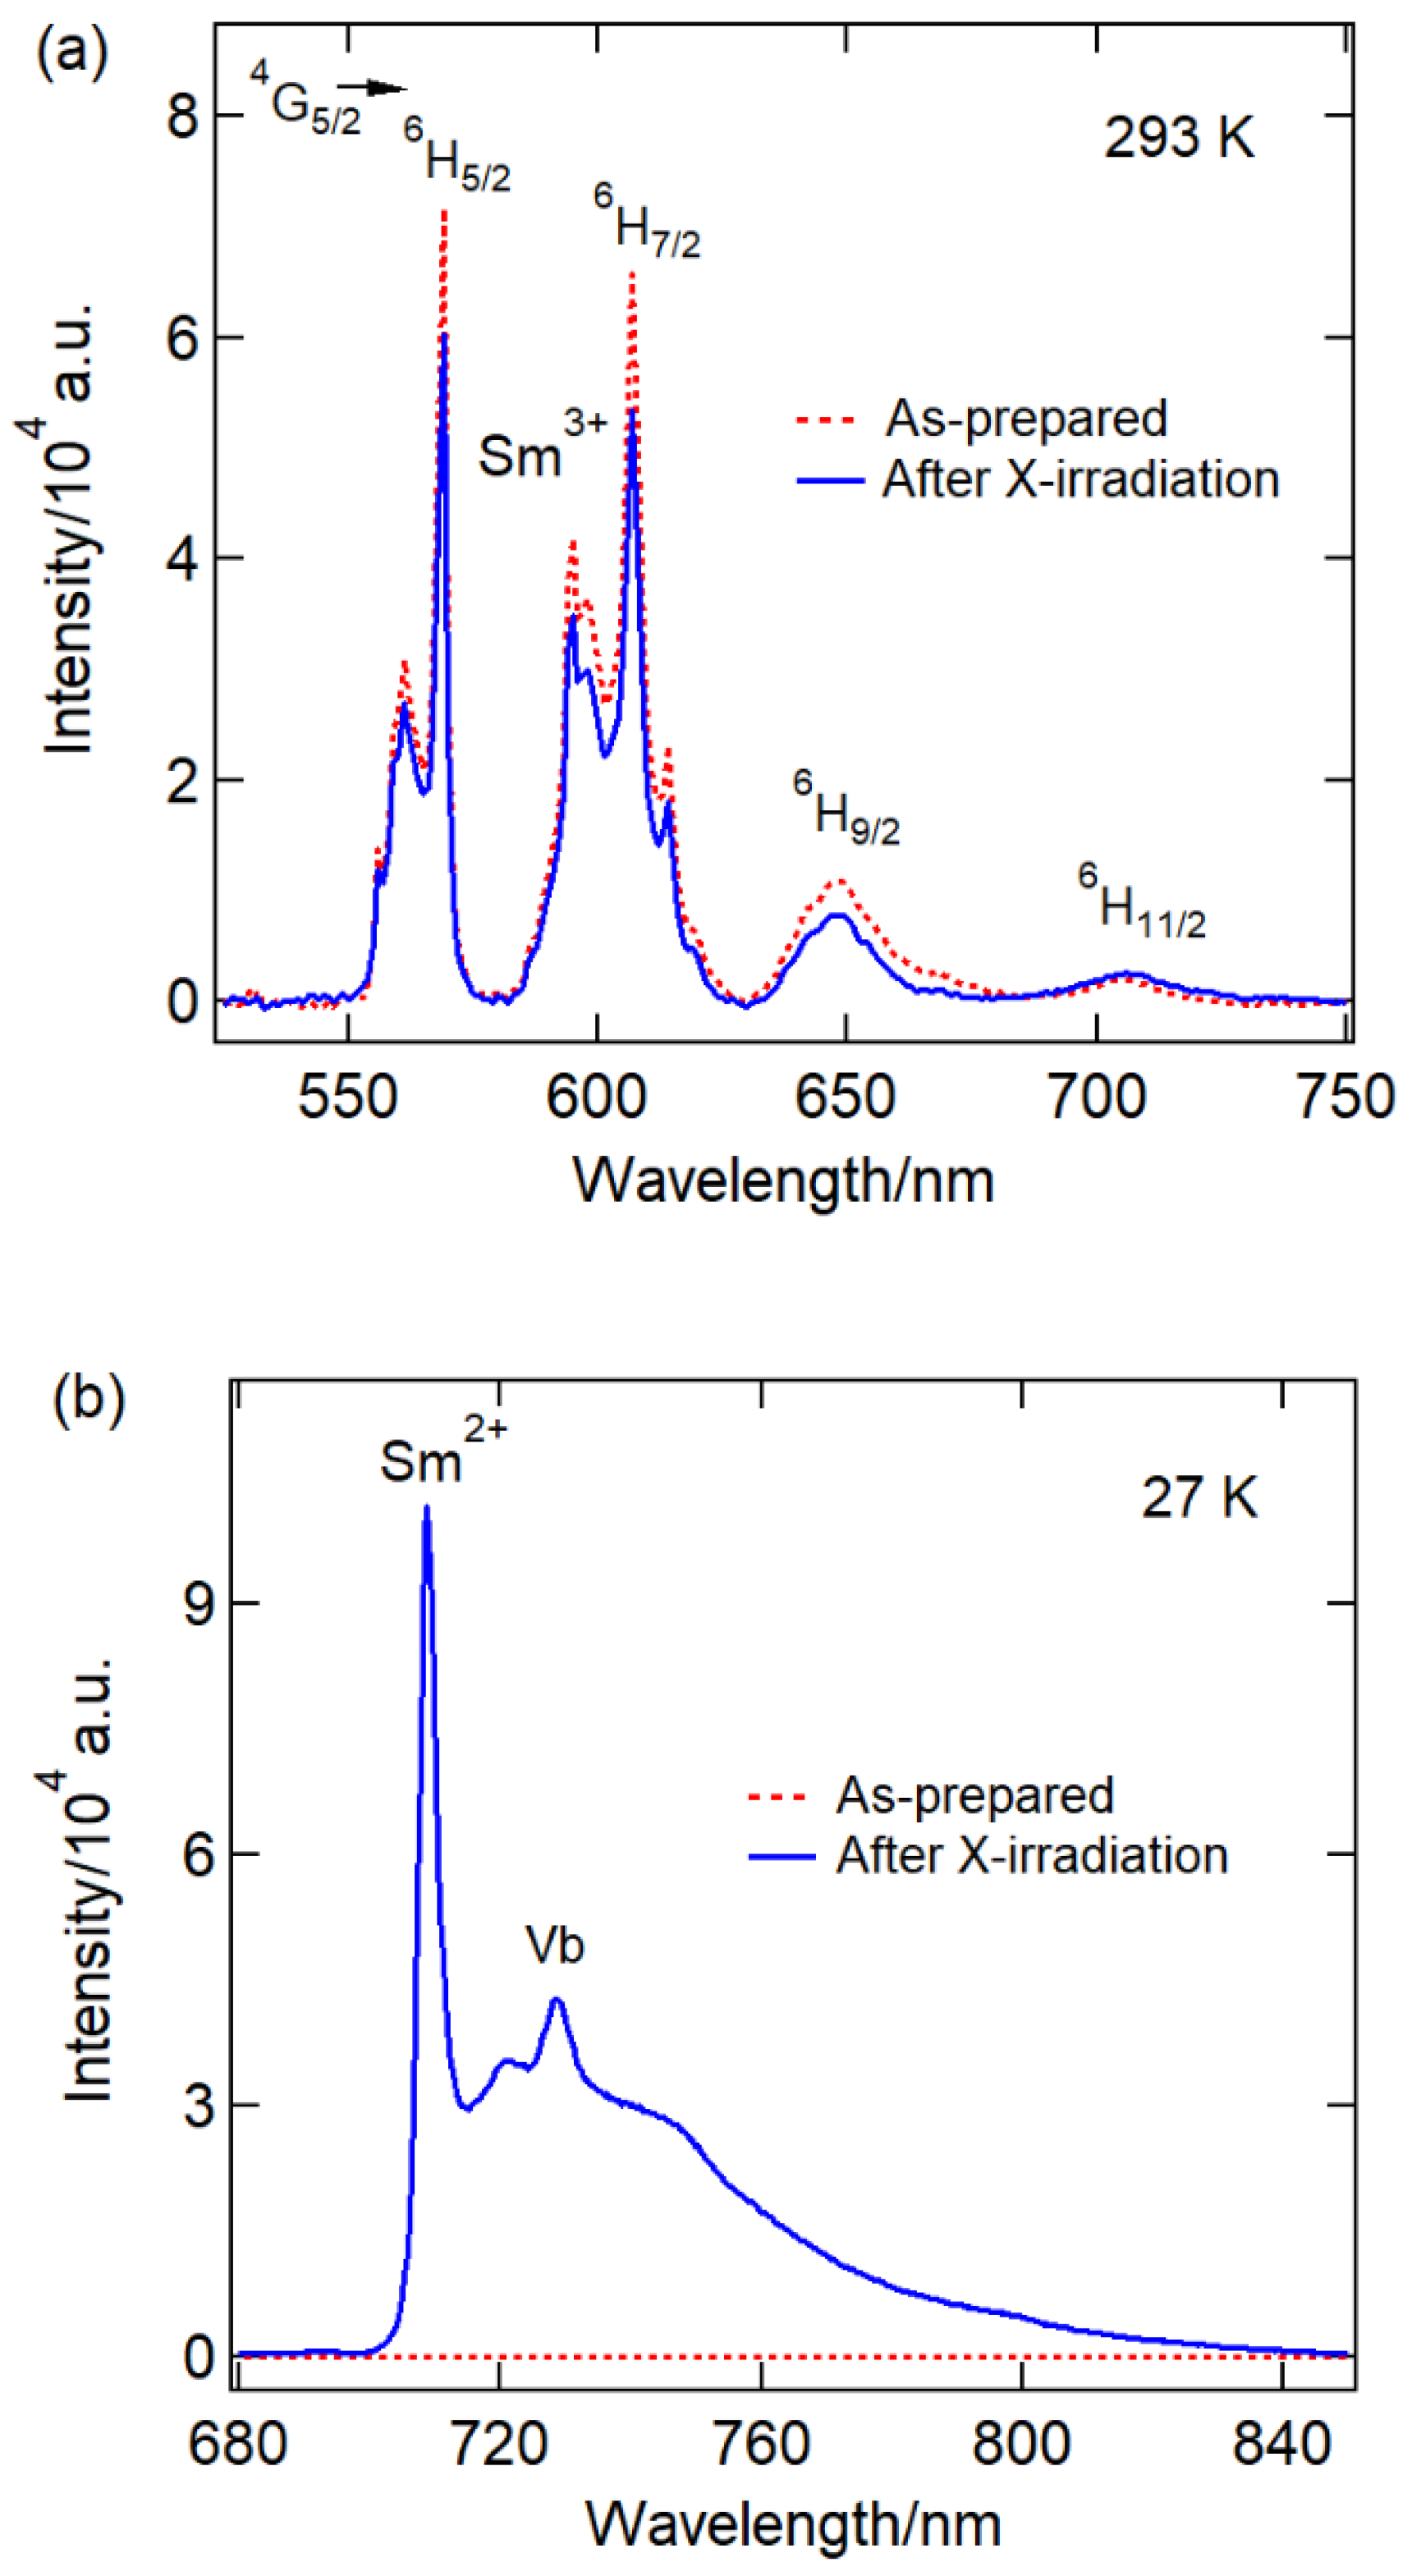
Photoluminescence spectra of nanocrystalline CaF2:0.1%Sm3+ prepared by ball milling for 8 h before and after 360 Gy X-irradiation (Cu-Kα) are shown in Figure 3. Sm3+ emission lines centered at 566, 604, 645 and 704 nm (Figure 3a) correspond to 4G5/26HJ (J = 5/2, 7/2, 9/2, and 11/2) f-f transitions, respectively.[28,29,30] Sm3+ 4G5/26H5/2 and 6H7/2 transitions contain magnetic and electric dipole contributions that obey the selection rules J = 0, ± 1, while the other two transitions 4G5/26H9/2 and 6H11/2 are purely electric dipole transitions ( J ≤ 6).[31] The symmetry of the local environment of the trivalent 4f ions can be identified by the relative intensity ratio of electric dipole to magnetic dipole transitions (IR = 4G5/26H9/2 / 4G5/26H5/2).[32] The present work indicated that most of the Sm3+ ions occupied the inversion symmetry sites of the CaF2 host lattice since the IR is < 1.[32,33,34] Note, however, that charge compensation will in principle lower the site symmetry.
Upon 360 Gy X-irradiation, the luminescence of Sm3+ decreased as is seen in Figure 3a accompanied by the rise of the electric dipole allowed Sm2+ 4f55d (T1u) → 4f6 7F1 (T1g) transition at 708.2 nm with vibronic side bands (transverse optical phonon mode of CaF2 due to the Oh5 group symmetry) (Figure 3b).[35,36,37] We stress here that no Sm2+ luminescence was observed before X-irradiation indicating that the Sm ions entered the CaF2 host lattice in their +3 oxidation state. In contrast, Liu et al. reported the presence of Sm2+ emission lines in the absence of X-irradiation in nanocrystalline BaFCl:Sm3+ prepared by ball milling.[24].
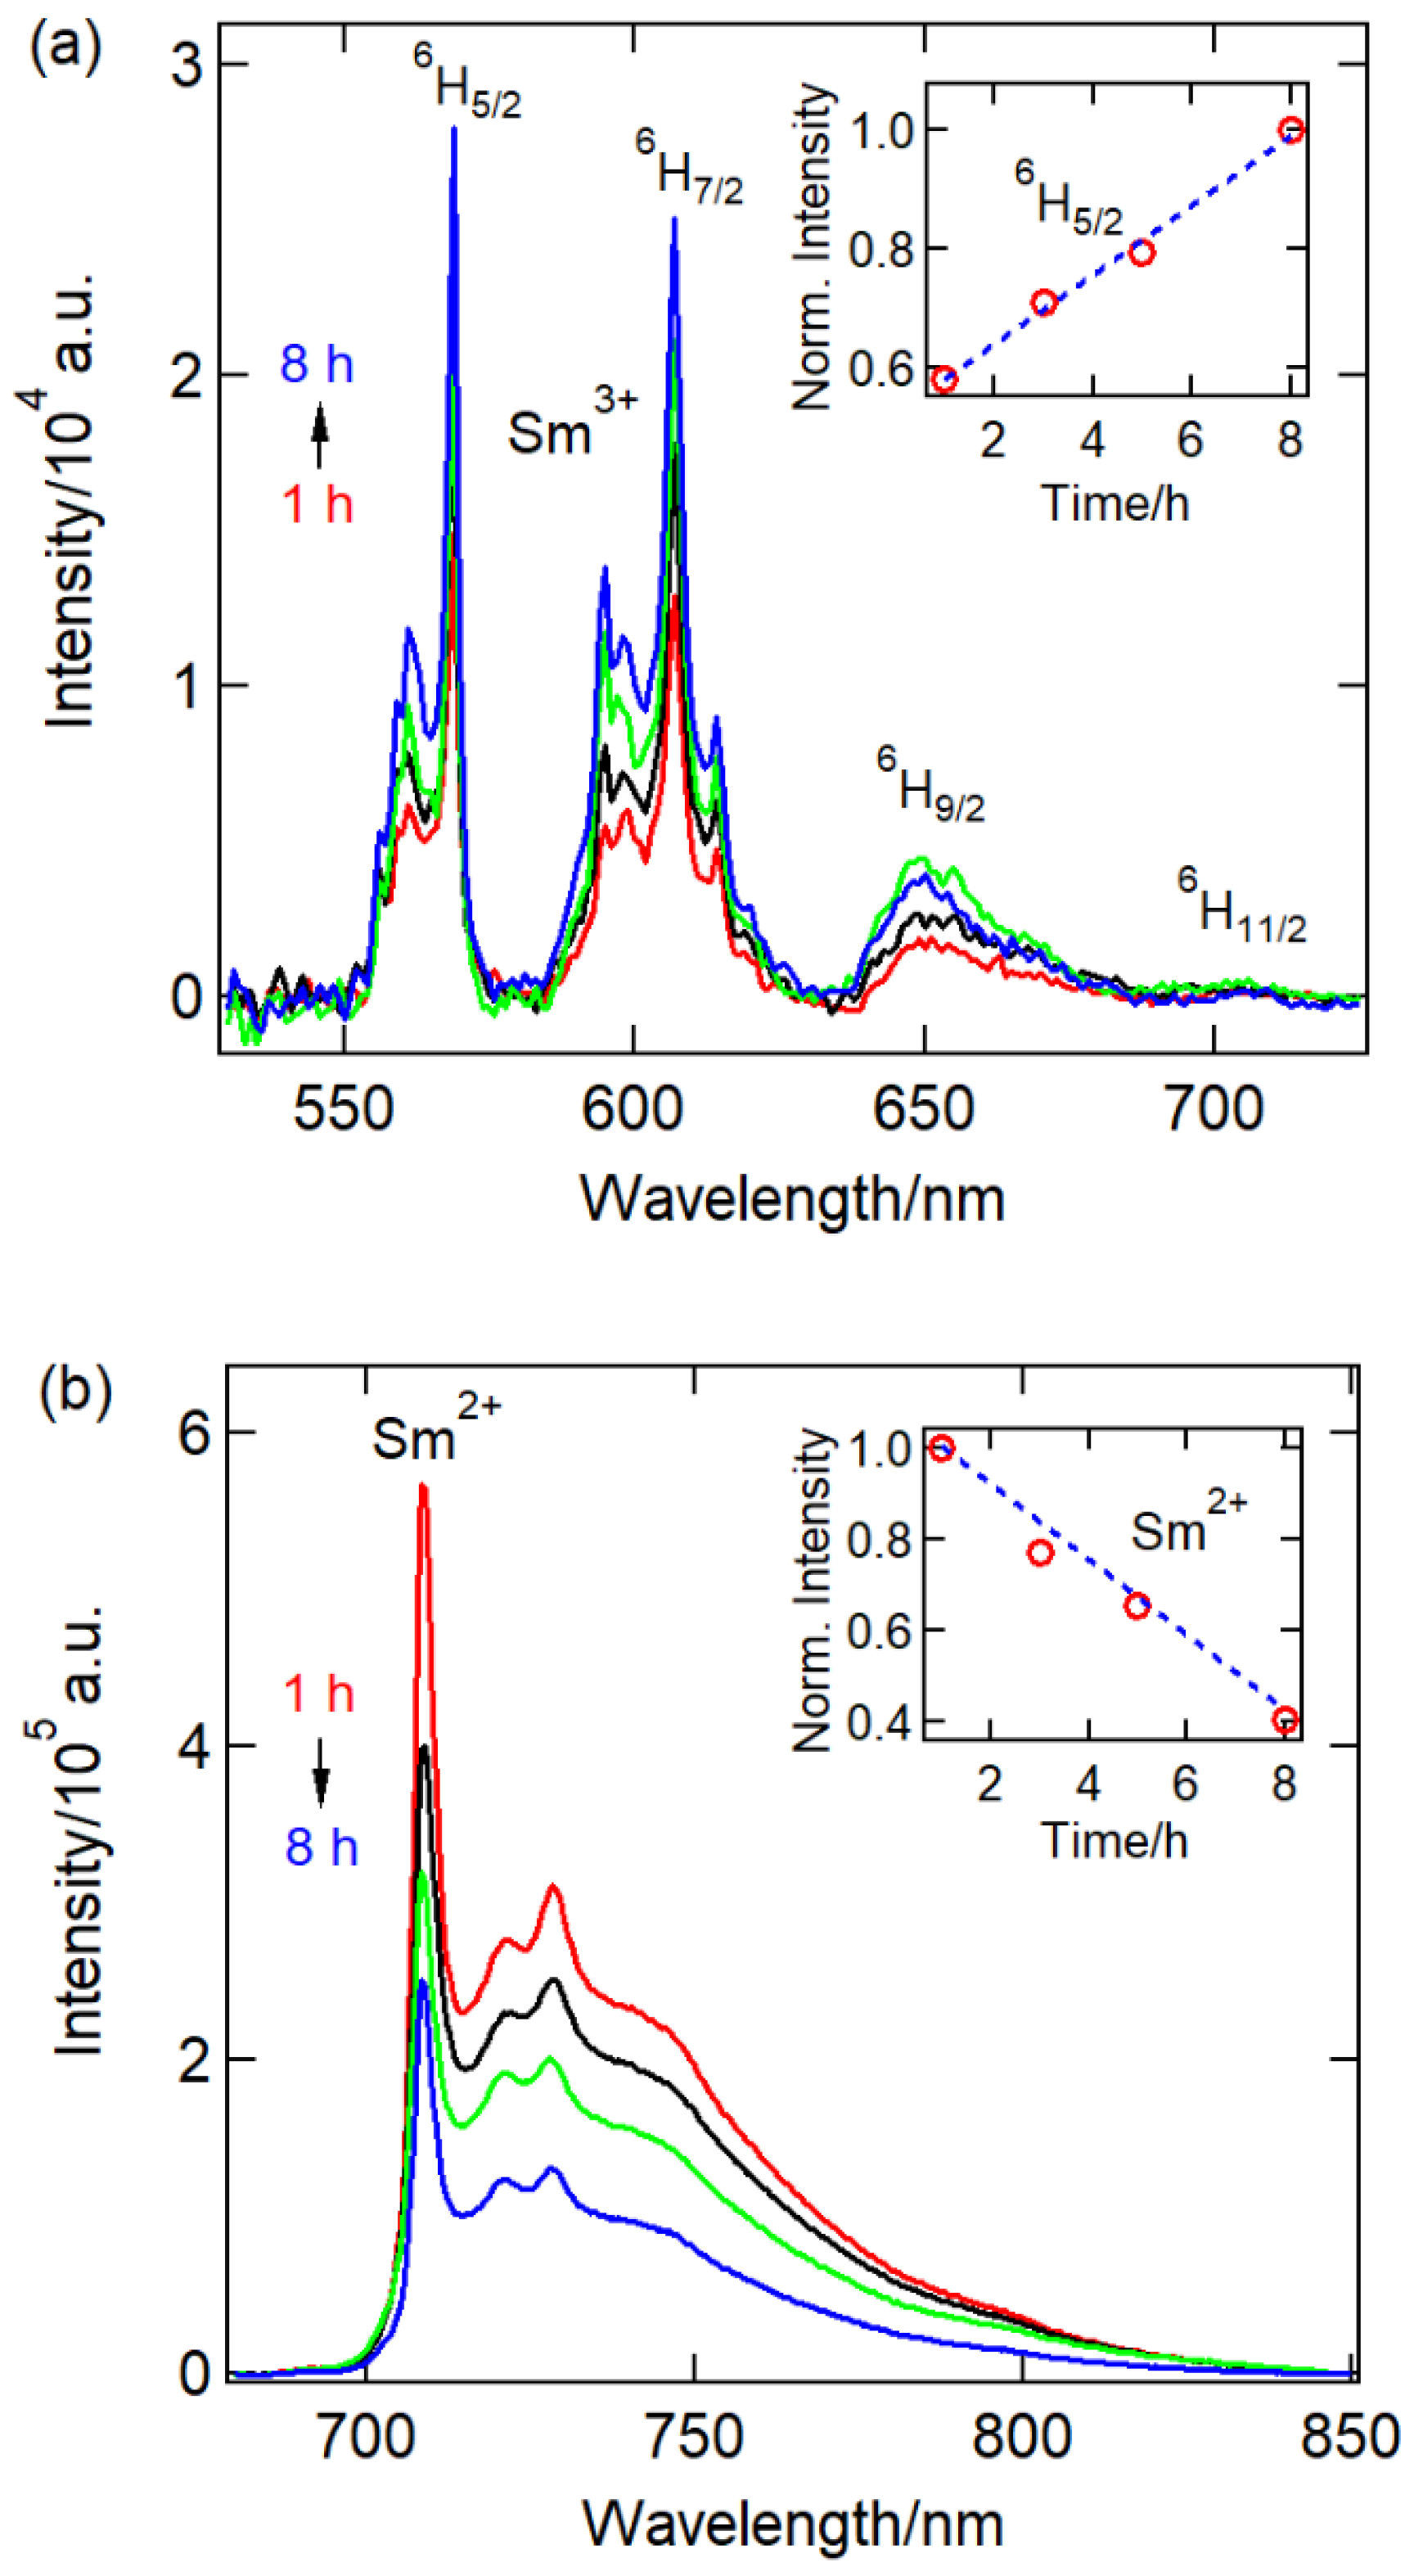
In Figure 4 the photoluminescence spectra of nanocrystalline CaF2:0.1%Sm3+ as a function of ball milling time are depicted. As follows from Figure 4a, the luminescence of Sm3+ increased with longer ball milling time. In contrast, the generation of Sm2+ upon X-irradiation gradually decreased with the ball milling time (Figure 4b). This may be due to a better embedding and charge compensation for longer ball milling times e.g. closer proximity of the charge compensators to the Sm3+ ions. It is also possible that with longer ball milling times, more defects are generated facilitating effective non-radiative deactivation paths for the Sm2+.
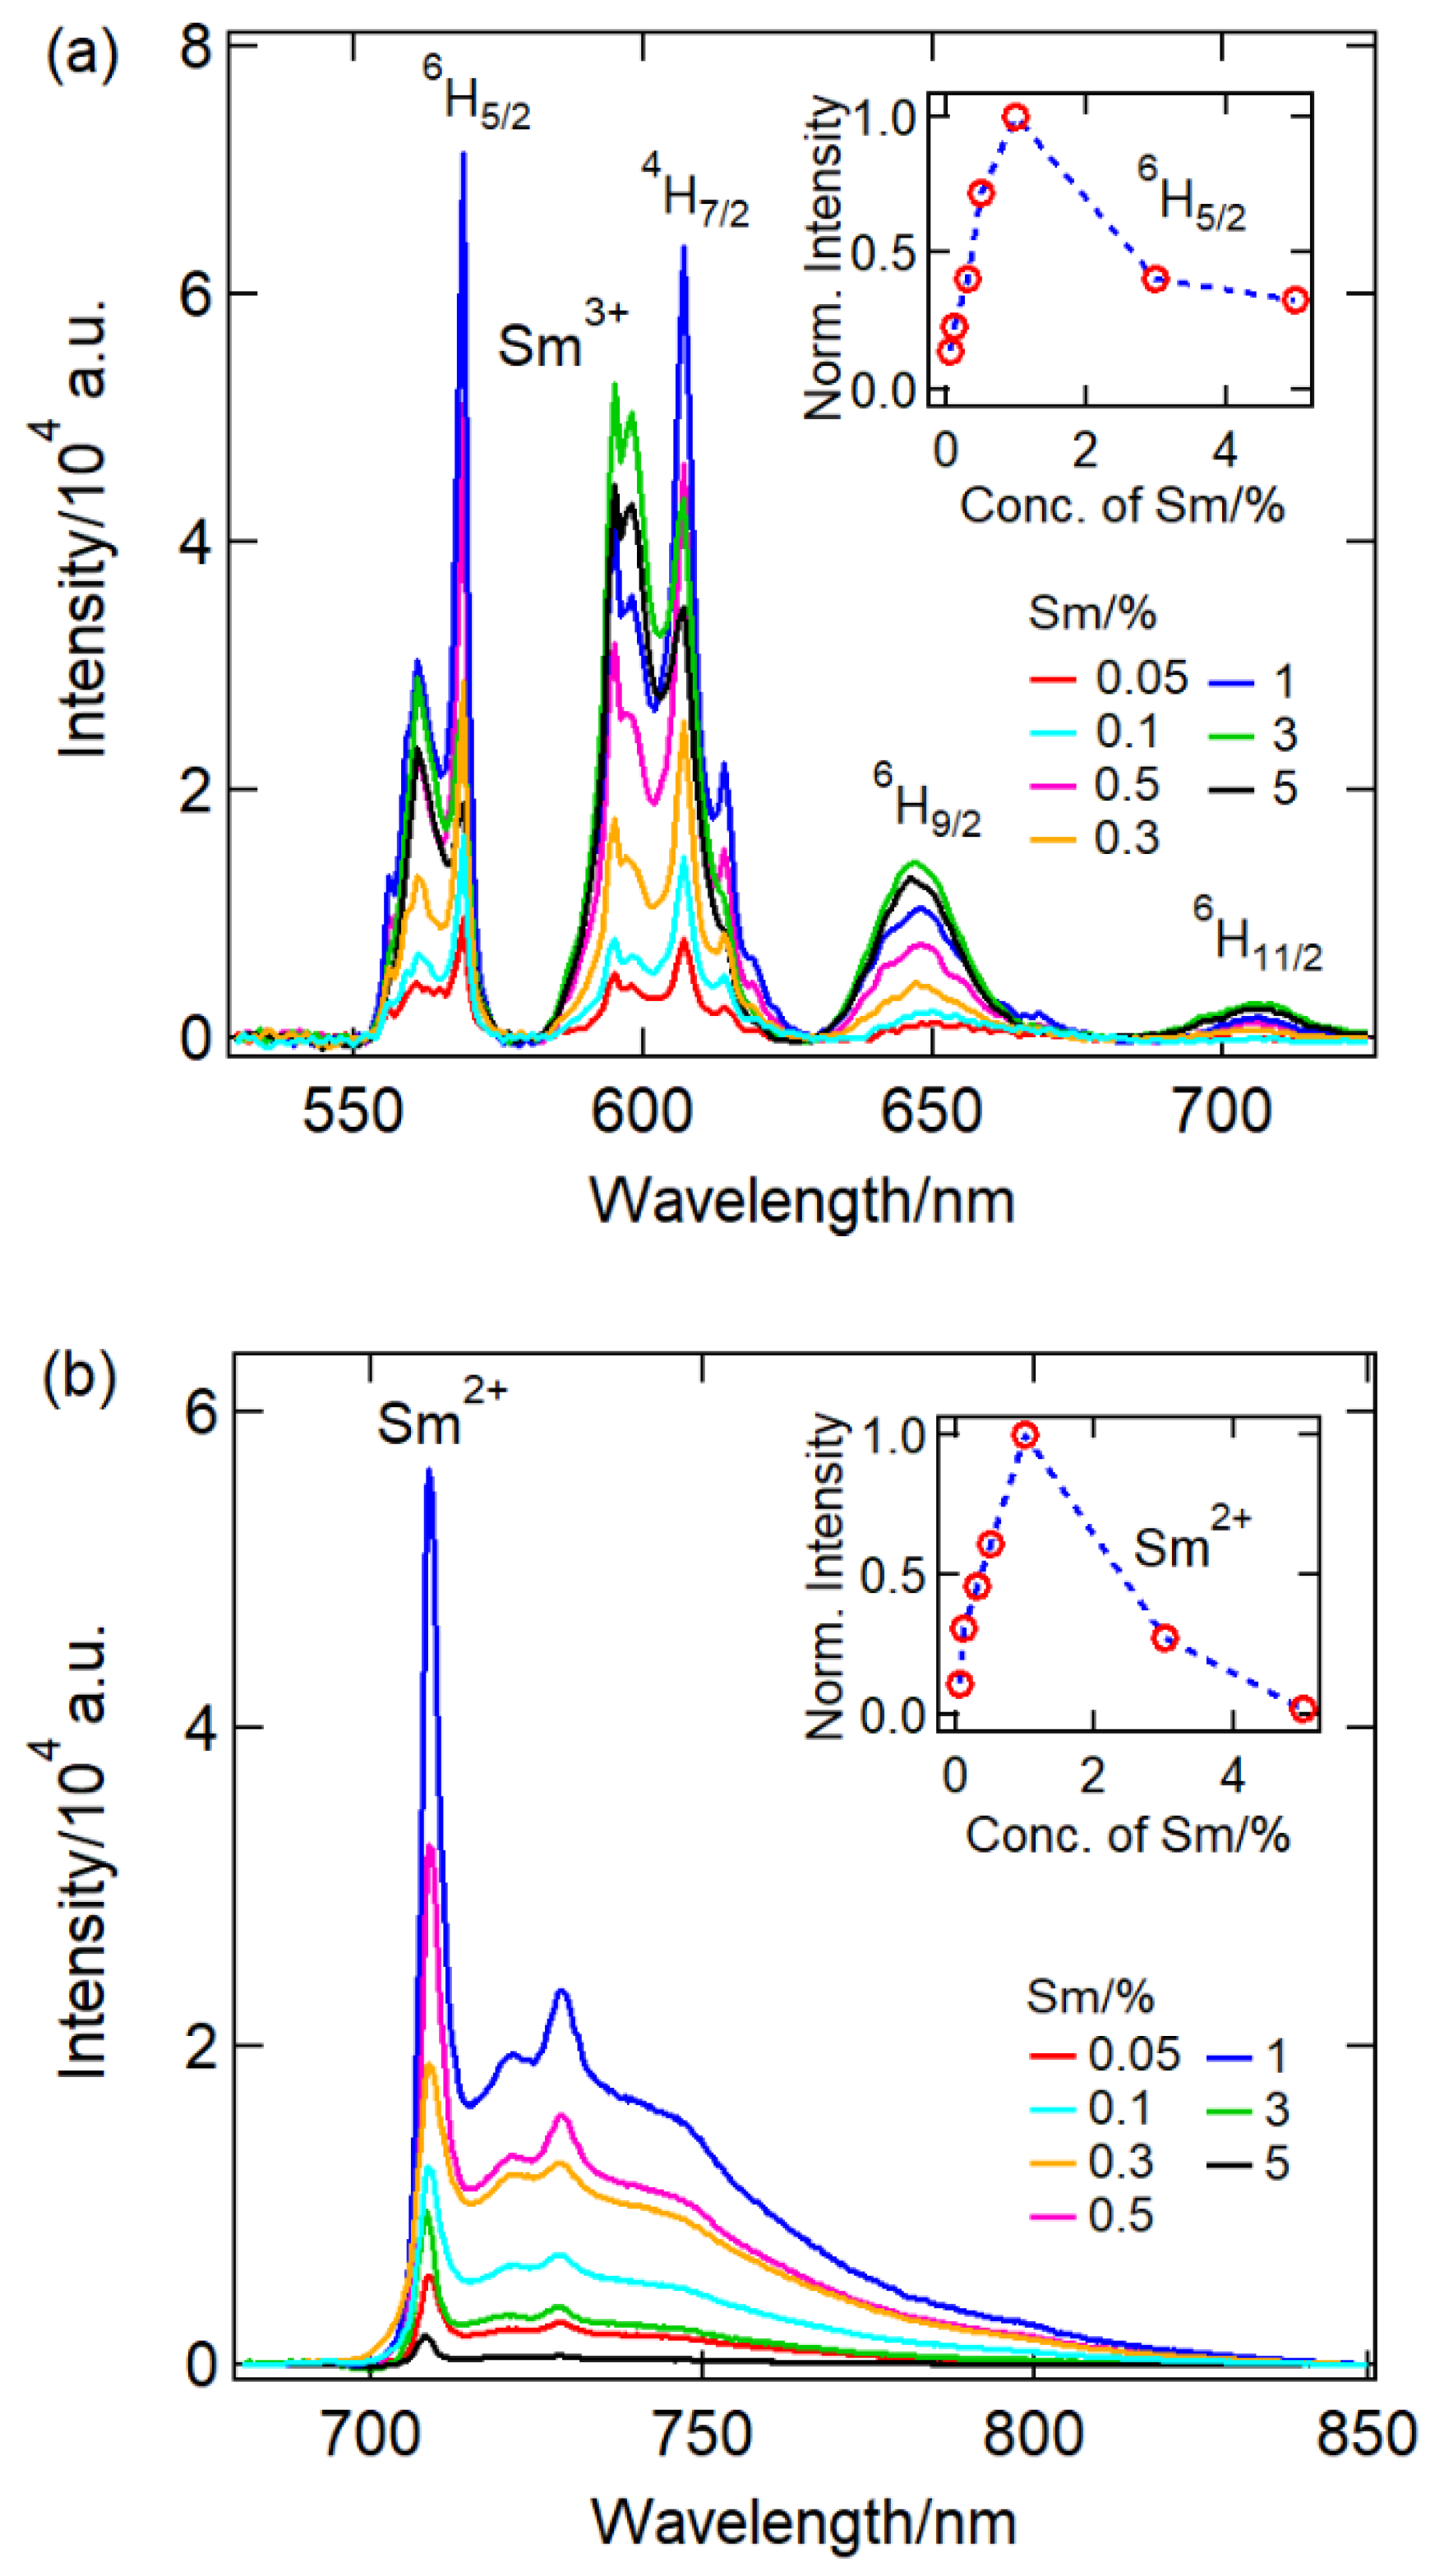
Photoluminescence spectra of nanocrystalline CaF2:ySm3+ doped with different concentrations of Sm3+ (0.05 % ≤ y ≤ 5 %), and ball milled for 8 h are shown in Figure 5. As is seen in Figure 5a the intensity of Sm3+ luminescence lines of the as-prepared sample increased with the Sm3+ concentration for up to 1%, and then decreased with higher concentrations. Interestingly, the same trend was observed for the Sm2+ luminescence (upon 135 Gy X-irradiation) (Figure 5b). This concentration dependence is most liekly due to quenching for concenrations higher than 1% induced by rapid excitation energy transfer between the Sm ions that leads to non-radiative deactivation at trap sites.[38]
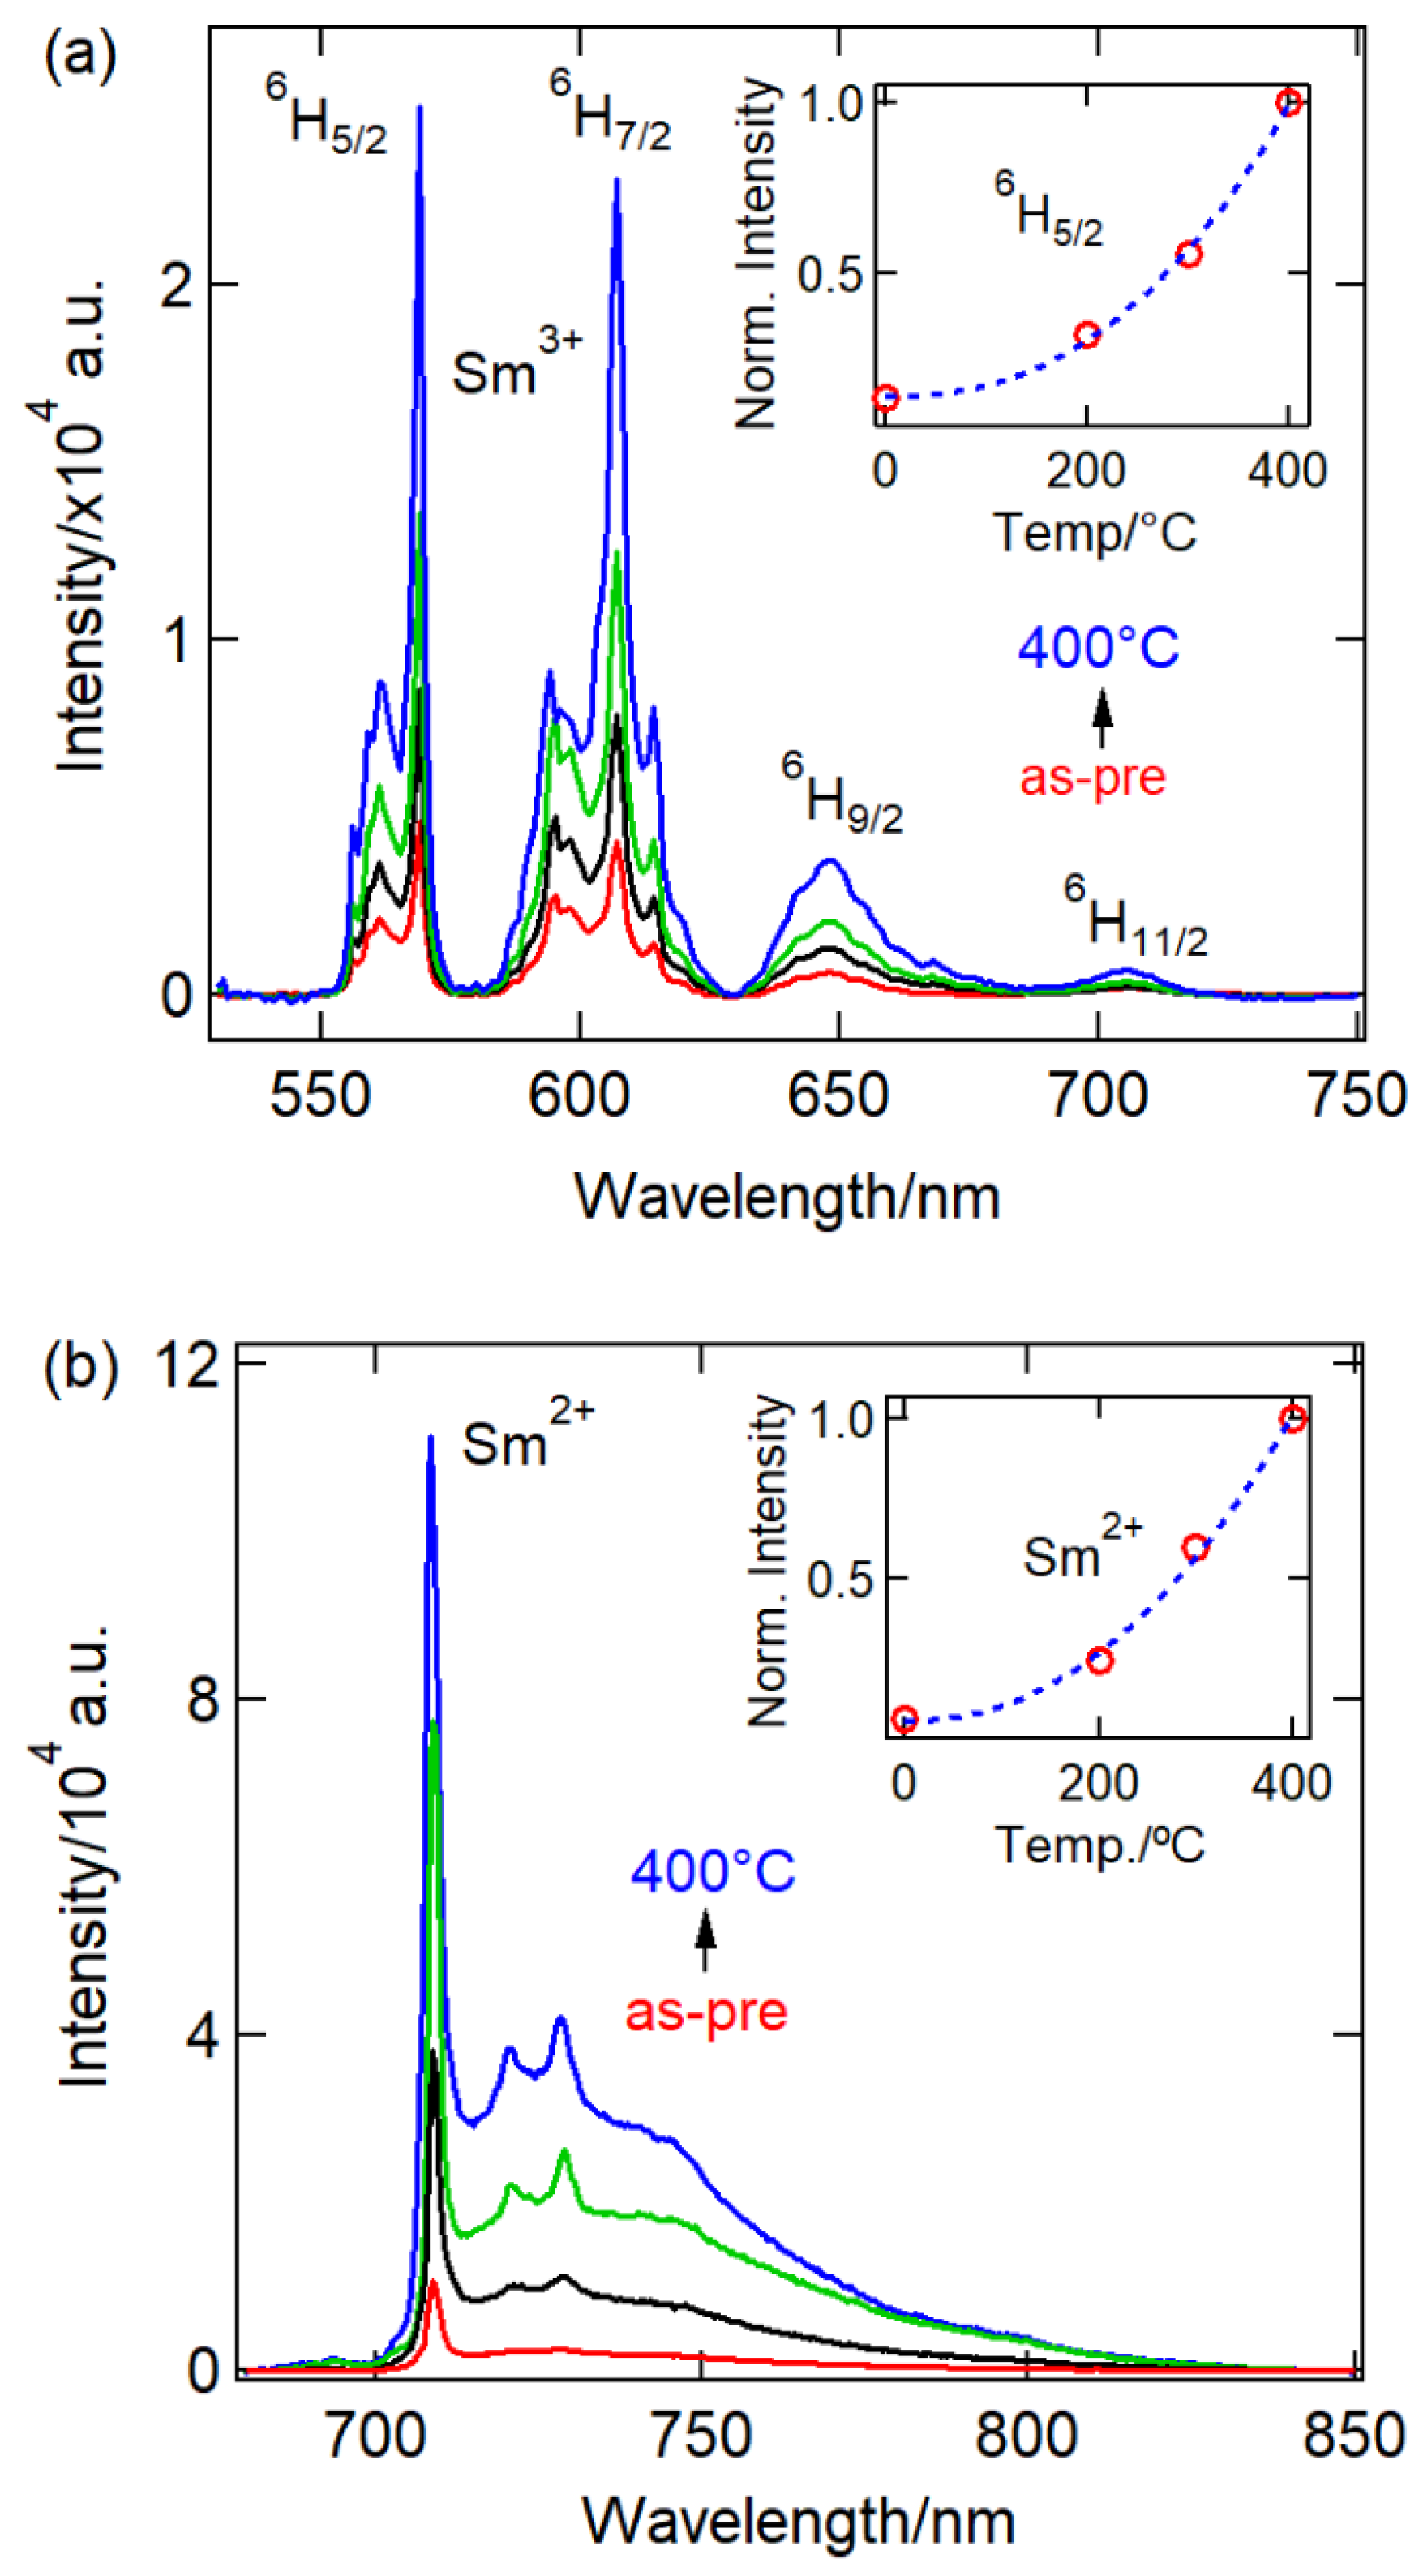
In Figure 6, the effect of post-annealing for 1 h at 200, 300, and 400 °C on the luminescence of nanocrystalline CaF2:0.1%Sm3+ (ball-milled for 8 h) is summarized. The figure shows that both the Sm3+ luminescence of the as-prepared sample (Figure 6a) and the Sm2+ luminescence of the X-irradiated samples (Figure 6b) became significantly stronger with increasing annealing temperature. The normalized photoluminescence intensity of the Sm3+ and Sm2+ emissions followed a T2.4 and T2.6 power law, respectively. An increase in photoluminescence intensity of the Sm3+/2+ with increased temperature was previously observed by Liu et al. for BaFCl:Sm3+.[39]
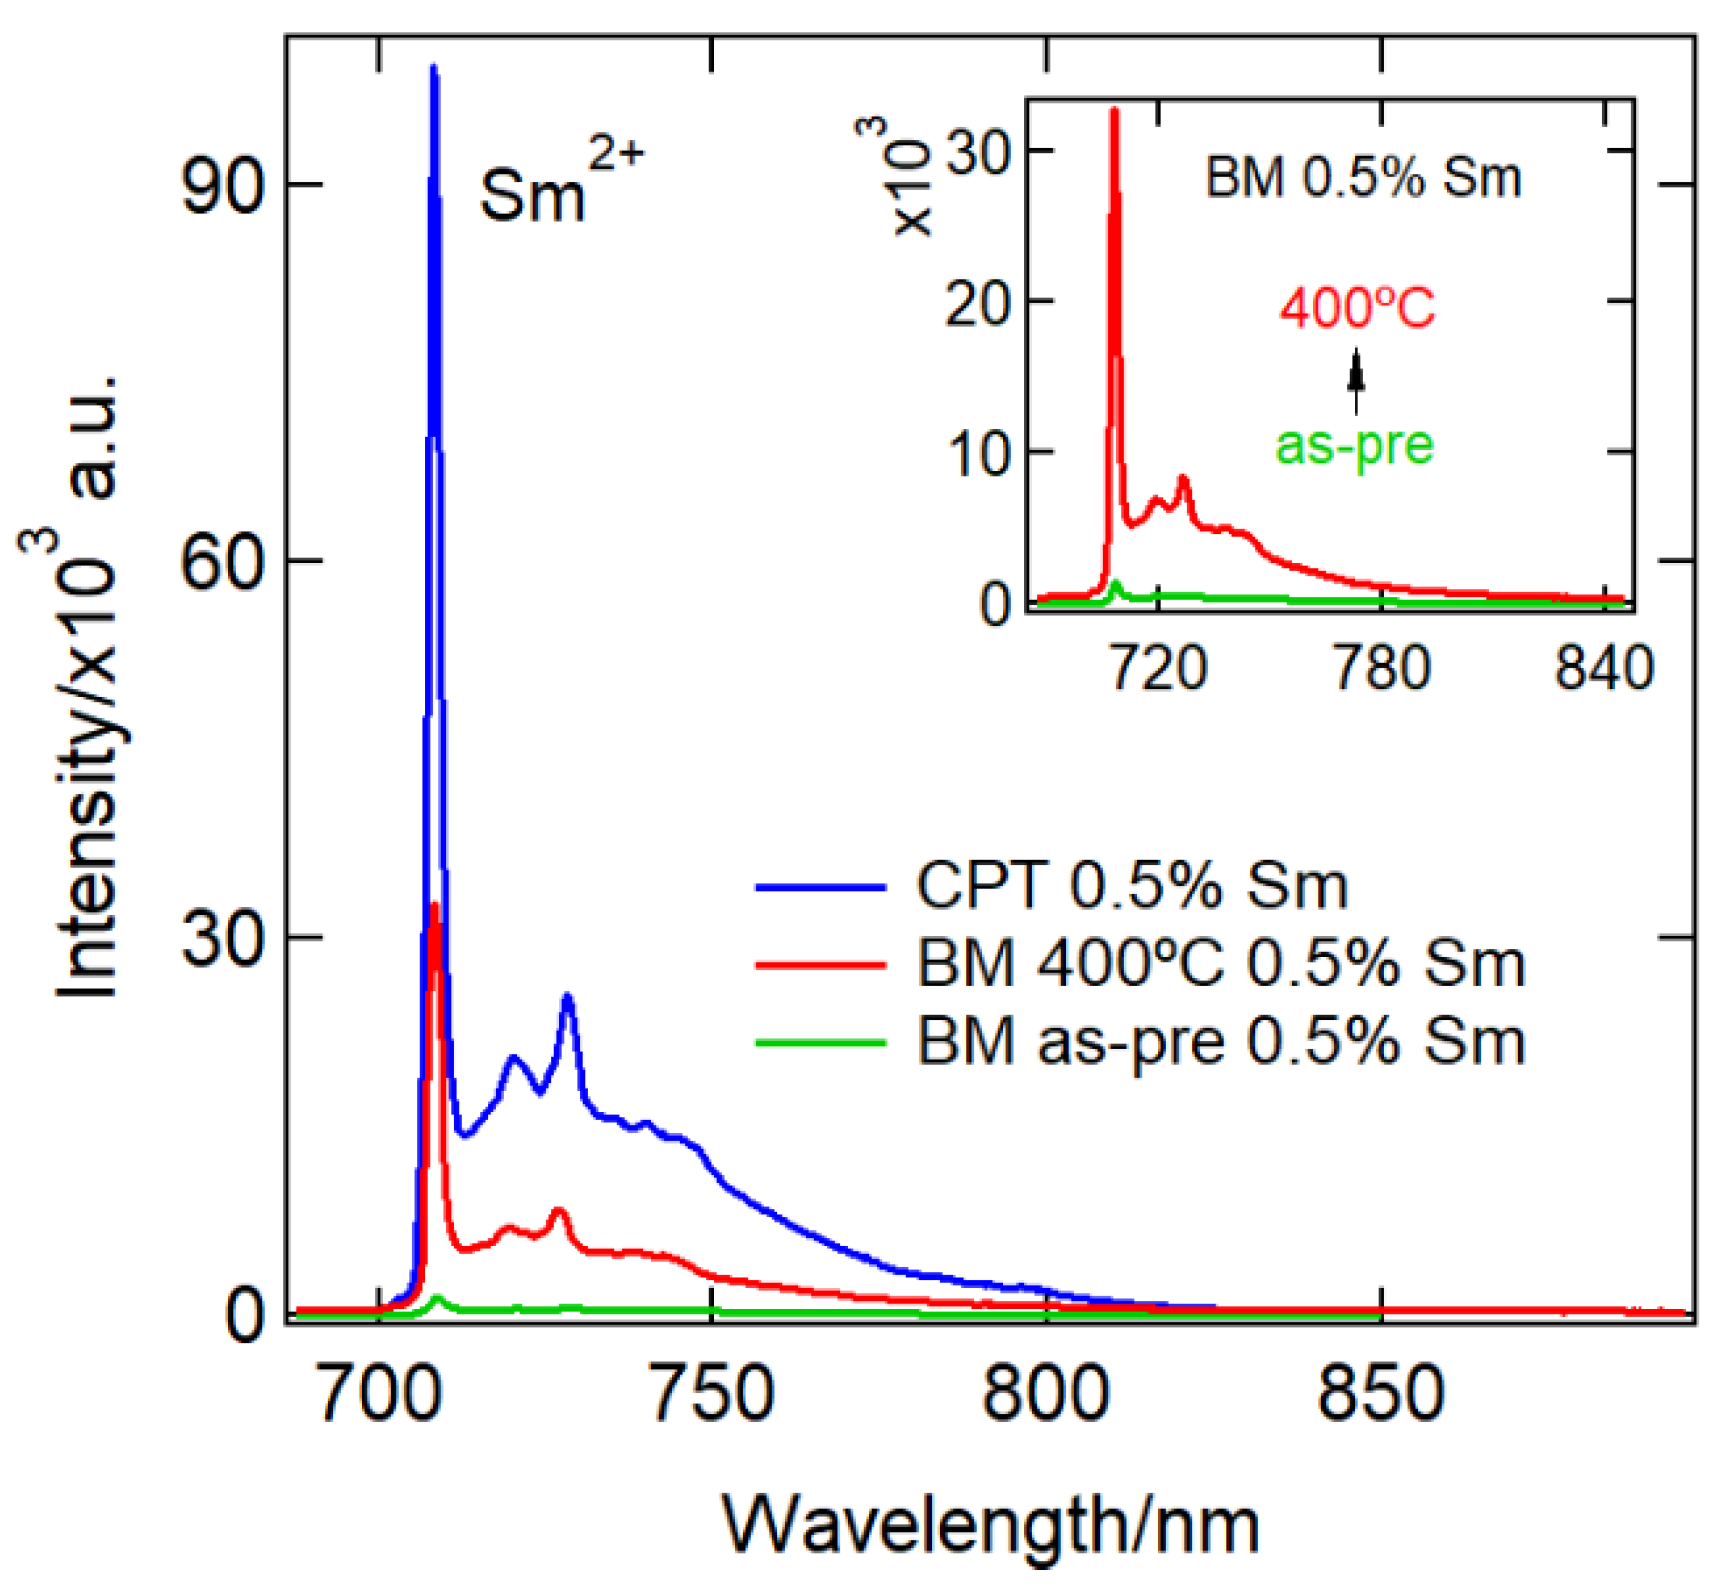
In Figure 7 a comparison is shown of the Sm2+ luminescence of X-irradiated (100 Gy) nanocrystalline CaF2:0.5%Sm3+ prepared by co-precipitation (CPT) and as-prepared as well as annealed at 400 °C of CaF2:0.5%Sm3+ prepared by 8 h of ball-milling (BM). As seen from the inset of the figure, the Sm2+ generation of BM CaF2:0.5%Sm3+ showed a significantly increased by a factor 23 after annealed at 400 °C with crystallite size increased from 8 nm to 44 nm. In addition, both CPT CaF2:0.5%Sm3+ and annealed BM CaF2:0.5%Sm3+ had similar average crystallite sizes of 46 nm and 44 nm, respectively. However, in comparison with the CPT-sample, the Sm2+ luminescence intensity of the annealed BM-sample was lower by a factor of 3 after 100 Gy X-irradiation. This indicated a faster Sm3+ → Sm2+ conversion upon X-irradiation in the CPT sample compared to the BM samples. In the BM sample the trivalent Sm3+ may be more stabilized by a charge compensator due to the prolonged milling and annealing time, that enables ionic rearrangements of the lattice.[40]

4. Conclusions

We have reported a direct and facile mechanochemical preparation route for nanocrystalline CaF2:Sm3+ by ball milling Ca(OAc), Sm(OAc)2, and NH4F at room temperature. The photoluminscence spectra of the as-prepared samples display the Sm3+ 4GJ6HJluminescence lines whereas X-irradiation generates Sm2+ with its characteristic luminescence around 708 nm at low temperatures. A ball milling period of 3 to 4 h was found to result in the best single phase whereas shorter and longer ball milling resulted in some impurity phases. A longer ball milling period such as 8 h reduced the efficacy of Sm2+ generation by X-irradiation. This is likely due to the stabilization of the trivalent state by embedding the charge compensator in the vicinity of the Sm ion as well as more effective non-radiative deactivation by the introduction of more defects. Maximum luminescence was observed for the sample with a 1 mol% Sm3+ concentration, and at higher concentration quenching was observed. Interestingly, post-annealing substantially increases the X-ray induced Sm3+ to Sm2+ conversion. It is noted here that attempts to anneal at higher temperatures such as 1100°C (in air) generated extra phases in the XRD pattern with an associated change of the Sm3+ luminescence spectrum. In comparison with the co-precipitation (CPT)-sample, the Sm3+ ion in the ball milling-sample (BM) is much more stable. The present results demonstrated that the X-ray storage efficiency of nanocrystalline CaF2 can be controlled in the preparation process by varying parameters such as ball milling time, annealing temperature and rare earth ion concentrations.

Author Contributions

Z.S.R.: Sample preparation, Investigation, Data curation, Formal Analysis, Writing - original draft. N.R.: TEM Analysis, Writing – Review & Editing. H.R.: Supervision, Conceptualization, Methodology, Writing – Review & Editing.

Funding

Institutional Review Board Statement

Informed Consent Statement

Data Availability Statement

Acknowledgments

We acknowledge the support of The University of New South Wales (UNSW) at the Australian Defence Force Academy for a University International Postgraduate Award. The authors thank Adelaide Microscopy as well as Dr Nobuyuki Kawashima of the Future Industries Institute at the University of South Australia for assistance with TEM imaging.

Conflicts of Interest

The authors declare no competing financial interests or personal relationships that could have been appeared to influence the work reported in this paper.

References

  1. Gerward, L.; Olsen, J. S.; Steenstrup, S.; Malinowski, M.; Åsbrink, S.; Waskowska, A. X-ray Diffraction Investigations of CaF2 at High Pressure. J. Appl. Crystallogr. 1992, 25, 578-581. [CrossRef]
  2. Hazen, R. M.; Finger, L. W. Calcium fluoride as an internal pressure standard in high-pressure cyrstallography. J. Appl. Crystallogr. 1981, 14, 234-236. [CrossRef]
  3. Song, K. S.; Williams, R. T. Alkaline Earth Fluorides. In Self-Trapped Excitons; Song, K. S., Williams, R. T. Ed.; Springer Berlin Heidelberg. 1993; pp 96-122.
  4. Cheetham, A.; Fender, B.; Cooper, M. Defect structure of calcium fluoride containing excess anions I. Bragg scattering. J. Phys. C: Solid State Phys. 2001, 4, 3107. [CrossRef]
  5. Ye, W.; Liu, X.; Qiying, H.; Zhou, Z.; Hu, G. Co-precipitation synthesis and self-reduction of CaF2:Eu2+ nanoparticles using different surfactants. Mater. Res. Bull. 2016, 83. [CrossRef]
  6. Cantelar, E.; Sanz-García, J. A.; Sanz-Martín, A.; Muñoz Santiuste, J. E.; Cussó, F. Structural, photoluminescent properties and Judd-Ofelt analysis of Eu3+-activated CaF2 nanocubes. J. Alloys Compd. 2020, 813, 152194. [CrossRef]
  7. Pandurangappa, C.; Lakshminarasappa, B. N. Optical studies of samarium-doped fluoride nanoparticles. Philos. Mag. 2011, 91(35), 4486-4494. [CrossRef]
  8. Ritter, B.; Krahl, T.; Rurack, K.; Kemnitz, E. Nanoscale CaF2 doped with Eu3+ and Tb3+ through fluorolytic sol–gel synthesis. J. Mater. Chem. C. 2014, 2(40), 8607-8613.
  9. Yuan, G.; Murai, S.; Tamura, S.; Tomita, K.; Tanaka, K. Enhancement of up- and downconversion photoluminescence from Yb3+, Er3+ co-doped CaF2 nanoparticles deposited on two-dimensional plasmonic arrays. In Proc. SPIE 11194, Plasmonics IV, Hangzhou, China, 18 November 2019, Eds.; 2019; Vol. 11194, pp 19.
  10. Nakhaei, O.; Shahtahmassebi, N.; Mahmood, R. Synthesis and Characterization of CaF2 NPs with Co-precipitation and Hydrothermal Method. J. Nanomed. Nanotechnol. 2011, 2(5), 116.
  11. Quan, Z.; Yang, D.; Yang, P.; Zhang, X.; Lian, H.; Liu, X.; Lin, J. Uniform Colloidal Alkaline Earth Metal Fluoride Nanocrystals: Nonhydrolytic Synthesis and Luminescence Properties. Inorg. Chem. 2008, 47(20), 9509-9517. [CrossRef]
  12. James, S.; Adams, C.; Bolm, C.; Braga, D.; Collier, P.; Friscic, T.; Grepioni, F.; Harris, K.; Hyett, G.; Jones, W., et al. Mechanochemistry: Opportunities for new and cleaner synthesis. Chem. Soc. Rev. 2011, 41, 413-447. [CrossRef]
  13. Heise, M.; Scholz, G.; Düvel, A.; Heitjans, P.; Kemnitz, E. Mechanochemical synthesis, structure, and properties of solid solutions of alkaline earth metal fluorides: Ma1−xMbxF2 (M: Ca, Sr, Ba). Solid State Sci. 2016, 60, 65-74.
  14. Molaiyan, P.; Witter, R. Mechanochemical synthesis of solid-state electrolyte Sm1−xCaxF3−x for batteries and other electrochemical devices. Mater. Lett. 2019, 244, 22-26. [CrossRef]
  15. Chowdhury, N.; Riesen, N.; Riesen, H. Yb3+ and Er3+ Codoped BaLiF3 Nanocrystals for X-ray Dosimetry and Imaging by Upconversion Luminescence. ACS Appl. Nano Mater. 2021, 4(7), 6659-6667.
  16. Do, J.-L.; Friščić, T. Mechanochemistry: A Force of Synthesis. ACS Cent. Sci. 2017, 3(1), 13-19. [CrossRef]
  17. Sadykov, V. A.; Mezentseva, N. V.; Bobrova, L. N.; Smorygo, O. L.; Eremeev, N. F.; Fedorova, Y. E.; Bespalko, Y. N.; Skriabin, P. I.; Krasnov, A. V.; Lukashevich, A. I., et al. Chapter 12 - Advanced Materials for Solid Oxide Fuel Cells and Membrane Catalytic Reactors. In Advanced Nanomaterials for Catalysis and Energy; Sadykov, V. A. Ed.; Elsevier. 2019; pp 435-514.
  18. Düvel, A.; Wilkening, M.; Uecker, R.; Wegner, S.; Sepelak, V.; Heitjans, P. Mechanosynthesized nanocrystalline BaLiF3: The impact of grain boundaries and structural disorder on ionic transport. Phys. Chem. Chem. Phys. 2010, 12, 11251-11262. [CrossRef]
  19. Heise, M.; Scholz, G.; Krahl, T.; Kemnitz, E. Luminescent properties of Eu3+ doped CaF2, SrF2, BaF2 and PbF2 powders prepared by high-energy ball milling. Solid State Sci. 2019, 91, 113-118. [CrossRef]
  20. Rozaila, Z. S.; Riesen, N.; Riesen, H. Luminescence and photoionization of X-ray generated Sm2+ in coprecipitated CaF2 nanocrystals. Dalton Trans. 2021, 50(44), 16205-16213.
  21. Crystallography Open Database. http://www.crystallography.net/cod/index.php. (accessed 2019-12-01).
  22. MAUD. http://maud.radiographema.eu/. (accessed 2019-12-02).
  23. Zhang, J.; Riesen, H. Photostimulated and persistent luminescence of samarium ions in BaFCl. J. Lumin. 2019, 207, 188-194. [CrossRef]
  24. Liu, Z.; Stevens-Kalceff, M. A.; Wang, X.; Riesen, H. Mechanochemical synthesis of nanocrystalline BaFCl:Sm3+ storage phosphor by ball milling. Chem. Phys. Lett. 2013, 588, 193-197.
  25. Bensalah, A.; Mortier, M.; Patriarche, G.; Gredin, P.; Vivien, D. Synthesis and optical characterizations of undoped and rare-earth-doped CaF2 nanoparticles. J. Solid State Chem. 2006, 179(8), 2636-2644. [CrossRef]
  26. Zhi, G.; Song, J.; Mei, B.; Weibing, Z. Synthesis and Characterization of Er3+ Doped CaF2 Nanoparticles. J. Alloys Compd. 2011, 509, 9133–9137. [CrossRef]
  27. Shannon, R. D. Revised Effective Ionic Radii and Systematic Studies of Interatomic Distances in Halides and Chalcogenides. Acta Crystallogr. A. 1976, 32(5), 751-767. [CrossRef]
  28. Wells, J.-P. R. Laser Spectroscopy of Alkaline Earth Fluoride Crystals Doped With Trivalent Samarium and Europium Ions. Ph.D. Thesis, University of Canterbury, Christchurch, New Zeland, 1996.
  29. Mikhail, P.; Ramseyer, K.; Frei, G.; Budde, F.; Hulliger, J. Bleaching of Sm2+ during photoluminescence and cathodoluminescence. Opt. Commun. 2001, 188, 111-117. [CrossRef]
  30. Rabbiner, N. Fluorescence of Sm3+ in CaF2. Phys. Rev. X. 1963, 130, 502-506.
  31. Bungala, C. J.; Kumar, M.; Gopal, K. Fluorescence properties and energy transfer mechanism of Sm3+ ion in lead telluroborate glasses. Opt. Mater. 2011, 33, 1643-1647. [CrossRef]
  32. Jamalaiah, B. C.; Rasool, S. N. Fluorescence properties of Sm3+ ions in yttrium aluminum borate phosphors for optical applications. J. Mol. Struct. 2015, 1097, 161-165. [CrossRef]
  33. Lakshminarayana, G.; Yang, R.; Mao, M.; Qiu, J.; Kityk, I. V. Photoluminescence of Sm3+, Dy3+, and Tm3+-doped transparent glass ceramics containing CaF2 nanocrystals. J. Non-Cryst. Solids. 2009, 355(52), 2668-2673. [CrossRef]
  34. Qiao, Y.-P.; Chen, P. Luminescence, energy transfer, and color adjustment of CaO-CaF2-Al2O3-B2O3-SiO2 glass co-doped with CeO2 and Sm2O3. J. Non-Cryst. Solids. 2021, 552, 120461.
  35. Wood, D. L.; Kaiser, W. Absorption and Fluorescence of Sm2+ in CaF2, SrF2, and BaF2. Phys. Rev. 1962, 126(6), 2079-2088.
  36. Kelly-Gorham, M. R. K.; DeVetter, B. M.; Brauer, C. S.; Cannon, B. D.; Burton, S. D.; Bliss, M.; Johnson, T. J.; Myers, T. L. Complex refractive index measurements for BaF2 and CaF2 via single-angle infrared reflectance spectroscopy. Opt. Mater. 2017, 72, 743-748. [CrossRef]
  37. Kaiser, W.; Spitzer, W. G.; Kaiser, R. H.; Howarth, L. E. Infrared properties of CaF2, SrF2, and BaF2. Phys. Rev. 1962, 127(6), 1950-1954.
  38. Qiao, Y.-P. Influence of Sm2O3 and CaF2 Concentration on the Enhancement of Luminescence and Red Colour in Borosilicate Glass. Trans. Indian Ceram. Soc. 2021, 80(3), 208-215.
  39. Liu, Z. Q.; Stevens-Kalceff, M. A.; Riesen, H. Effects of Postannealing on the Photoluminescence Properties of Coprecipitated Nanocrystalline BaFCl:Sm3+. J. Phys. Chem. A. 2013, 117(9), 1930-1934.
  40. Stevens-Kalceff, M. A.; Liu, Z.; Riesen, H. Cathodoluminescence Microanalysis of Irradiated Microcrystalline and Nanocrystalline Samarium Doped BaFCl. Microsc. Microanal. 2012, 18(6), 1229-1238. [CrossRef]
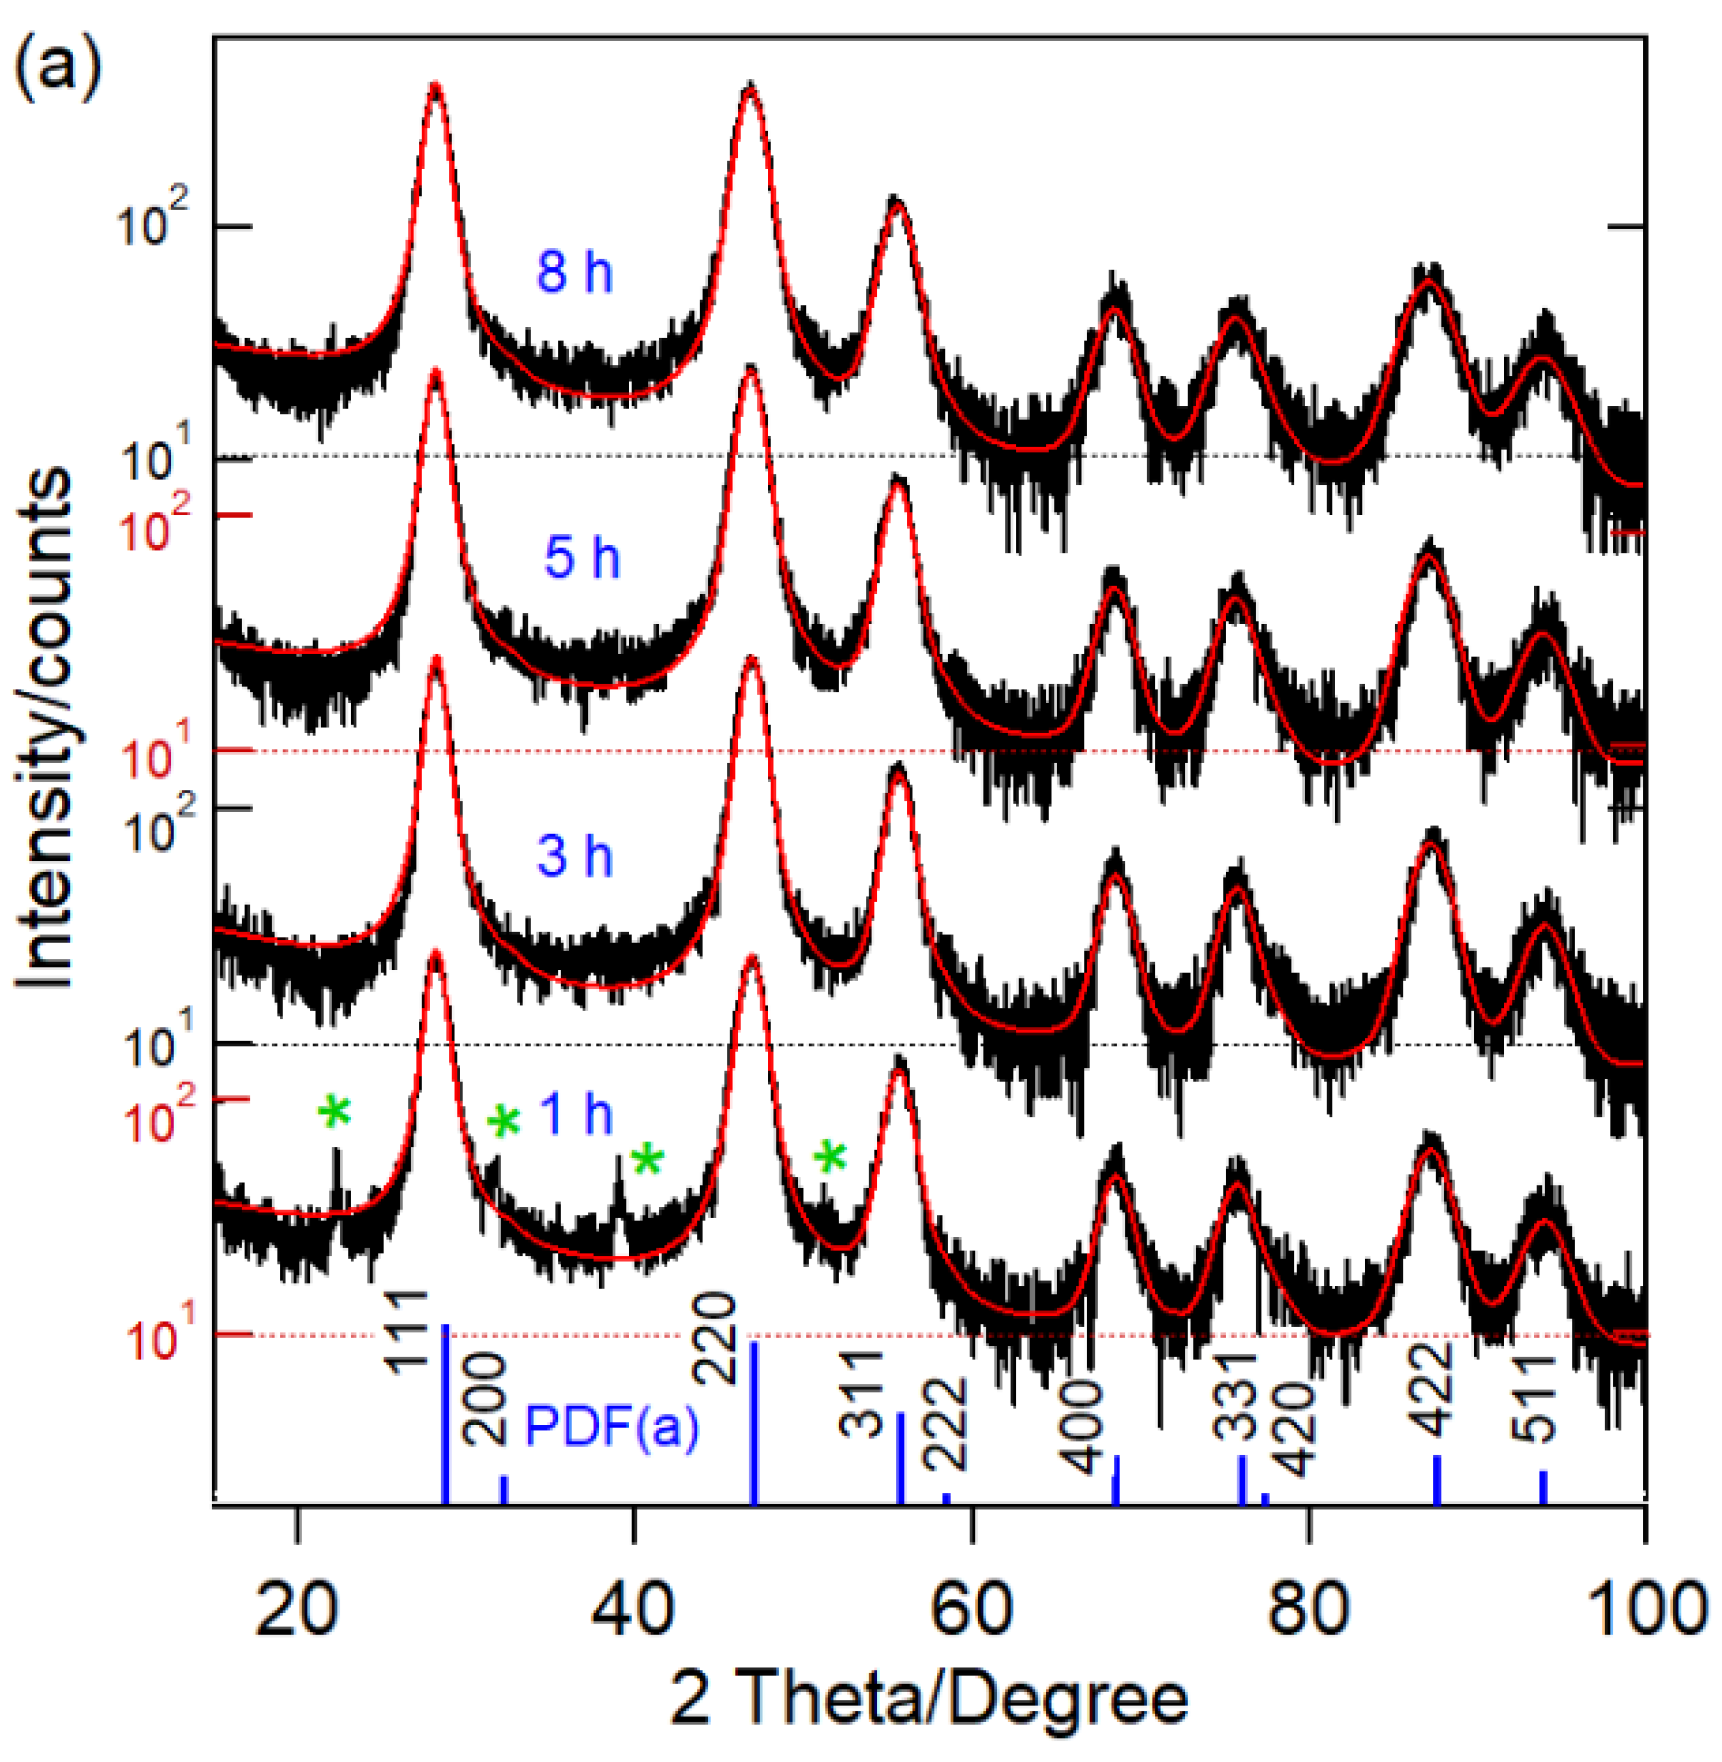
Figure 1. XRD patterns (semi-logarithmic plot) of (a) nanocrystalline CaF2:0.1% Sm3+ prepared by ball milling for 1, 3, 5 and 8 h, (b) nanocrystalline CaF2:ySm3+ with different concentration of Sm3+ (0 ≤ y ≤ 5 %) ball milled for 8 h, and (c) nanocrystalline CaF2:0.1%Sm3+ as-prepared by ball milling for 8 h and subsequently annealed at 200, 300, and 400 °C. Experimental data and Rietveld refinements are shown as black and red lines, respectively. The standard data of cubic CaF2 (PDF-1000043) is shown in blue. The green asterisks indicate impurity phases.
Preprints 141208 g001aPreprints 141208 g001b
Figure 2. TEM micrographs of nanocrystalline CaF2:0.1%Sm3+, ball milled for (a) 3 h and (b) 8 h, annealed at (c) 200 °C (d) 400 °C, and (e) nanocrystalline CaF2:0.5%Sm3+ prepared by co-precipitation.
Preprints 141208 g002
Figure 3. Photoluminescence spectra of nanocrystalline CaF2:0.1% Sm3+ prepared by ball milling for 8 h before and after 360 Gy X-irradiation. (a) Region of Sm3+ luminescence at 293 K and (b) region of the Sm2+ 4f55d (T1u) → 4f6 7F1 (T1g) emission at 27 K.
Preprints 141208 g003
Figure 4. Photoluminescence spectra of nanocrystalline CaF2:0.1% Sm3+ prepared by ball milling for 1, 3, 5 and 8 h. (a) Sm3+ region at 293 K of the as-prepared sample and (b) Sm2+ 4f55d (T1u) → 4f6 7F1 (T1g) region at 27 K after 135 Gy X-irradiation. The insets show corresponding integrated intensities as a function of ball milling time.
Preprints 141208 g004
Figure 5. Photoluminescence spectra CaF2:ySm3+ with 0.05 % ≤ y ≤ 5 % in the region of (a) Sm3+ at 293 K of the as-prepared sample and (b) Sm2+ 4f55d (T1u) → 4f6 7F1 (T1g) at 27 K upon 135 Gy X-irradiation. Integrated intensities of (a) Sm3+ 4G5/26H5/2 and (b) the Sm2+ emission band as a function of Sm concentration are shown in the insets.
Preprints 141208 g005
Figure 6. Photoluminescence spectra of CaF2:0.1%Sm3+ annealed at 200, 300, and 400 °C for 1 h in air. (a) Sm3+ region of the as-prepared sample at 293 K, (b) Sm2+ region of the 135 Gy X-irradiated sample at 27 K. The inset of (a) and (b) show normalized intensities of Sm3+ and Sm2+ luminescence, respectively.
Preprints 141208 g006
Figure 7. Comparison of photoluminescence spectra of nanocrystalline CaF2:0.5%Sm3+ prepared by co-precipitation (CPT) and as-prepared as well as annealed at 400 °C of CaF2:0.5%Sm3+ prepared by 8 h of ball-milling (BM). Inset shows 3x magnification of BM CaF2:0.5%Sm3+.
Preprints 141208 g007
Table 1. Summary of XRD results obtained from Rietveld refinements. Rwp and Rexp are the weighted-profile R-factor and expected R-factor. G is the Goodness of fit (Rwp/Rexp).
Ball-milling time
CaF2:0.1% Sm3+
time (h) average crystallite size
± 1 (nm)
lattice parameter, a (Å) Rietveld refinement
R w p
%
R e x p
%
G
1 12 5.4754 ± 0.0012 18.9 14.5 1.30
3 11 5.4763 ± 0.0010 19.0 15.1 1.26
5 9 5.4823 ± 0.0012 19.4 14.9 1.30
8 8 5.4832 ± 0.0013 18.5 14.9 1.24
Concentration of Sm3+
CaF2:ySm3+, 8 h ball-milling time
y% average crystallite size
± 1 (nm)
lattice parameter, a (Å) Rietveld refinement
R w p
%
R e x p
%
G
0 12 5.4824 ± 0.0011 15.9 13.9 1.14
0.05 11 5.4826 ± 0.0012 16.8 13.8 1.22
0.1 9 5.4832 ± 0.0013 18.5 14.9 1.24
0.3 9 5.4838 ± 0.0012 17.4 14.4 1.21
0.5 8 5.4844 ± 0.0011 17.8 15.2 1.17
1 8 5.4864 ± 0.0010 17.3 14.6 1.18
3 7 5.4880 ± 0.0014 17.1 14.5 1.18
5 6 5.4915 ± 0.0017 17.2 14.6 1.18
Annealing temperature
CaF2:0.1% Sm3+, 8 h ball-milling time
temp.
(°C)
average crystallite size
± 1 (nm)
lattice parameter, a (Å) Rietveld refinement
R w p
%
R e x p
%
G
as-pre 9 5.4774 ± 0.0011 20.9 15.0 1.39
200 12 5.4753 ± 0.0007 19.3 15.4 1.25
300 22 5.4701 ± 0.0004 18.7 15.3 1.22
400 45 5.4687 ± 0.0002 18.7 15.2 1.23
Disclaimer/Publisher’s Note: The statements, opinions and data contained in all publications are solely those of the individual author(s) and contributor(s) and not of MDPI and/or the editor(s). MDPI and/or the editor(s) disclaim responsibility for any injury to people or property resulting from any ideas, methods, instructions or products referred to in the content.
Copyright: This open access article is published under a Creative Commons CC BY 4.0 license, which permit the free download, distribution, and reuse, provided that the author and preprint are cited in any reuse.
Prerpints.org logo

Preprints.org is a free preprint server supported by MDPI in Basel, Switzerland.

Subscribe

© 2024 MDPI (Basel, Switzerland) unless otherwise stated