Submitted:
28 November 2024
Posted:
29 November 2024
You are already at the latest version
Abstract
Keywords:
1. Introduction
2. Materials and Methods
2.1. Materials
2.2. Solution preparation
2.3. Electrospinning process
2.4. Characterization
2.4.1. Viscometry study
2.4.2. Surface tension of solutions
2.4.3. Morphological evaluation – SEM
2.4.4. Chemical composition – (FTIR-ATR)
2.4.5. Thermal behavior – (TGA/DTA – DSC)
3. Results and discussion
3.1. PVA, and PVA/CMC solution characterization
3.2. Morphological Evaluation (SEM)
3.2.1. CMC spinning using PVA.1
3.2.2. CMC spinning using PVA.2
3.4. Chemical characterization
3.5. Thermal behavior
4. Conclusions
Author Contributions
Funding
Data Availability Statement
Acknowledgments
Conflicts of Interest
References
- Wang, Y.; Xiao, D.; Yu, H.; Zhong, Y.; Zhang, L.; Sui, X.; Wang, B.; Feng, X.; Xu, H.; Mao, Z. Composite hydrogel based oxidated sodium carboxymethyl cellulose and gelatin loaded carboxymethylated cotton fabric for hemostasis and infected wound treatment. Int. J. Biol. Macromol. 2023, 224, 1382–1394. [Google Scholar] [CrossRef] [PubMed]
- Pourmadadi, M.; Rahmani, E.; Shamsabadipour, A.; Samadi, A.; Esmaeili, J.; Rahdar, A.; Tavangarian, F.; Pandey, S. Novel carboxymethyl cellulose based nanocomposite: A promising biomaterial for biomedical applications. Process. Biochem. 2023, 30, 211–226. [Google Scholar] [CrossRef]
- Pessanha, F.S.; de Oliveira, B.G.R.B.; Oliveira, B.C.; Deutsch, G.; Teixeira, F.L.; Bokehi, L.C.; Calomino, M.A.; de Castilho, S.R.; Thiré, R.M.d.S.M.; Teixeira, L.A.; et al. Effectiveness of Epidermal Growth Factor Loaded Carboxymethylcellulose (EGF-CMC) Hydrogel in Biofilm Formation in Wounds of Diabetic Patients: A Randomized Clinical Trial. Gels 2023, 9, 117. [Google Scholar] [CrossRef]
- Mansur, A.A.P.; Rodrigues, M.A.; Capanema, N.S.V.; Carvalho, S.M.; Gomes, D.A.; Mansur, H.S. Functionalized bioadhesion-enhanced carboxymethyl cellulose/polyvinyl alcohol hybrid hydrogels for chronic wound dressing applications. RSC Adv. 2023, 13, 13156–13168. [Google Scholar] [CrossRef]
- Isopencu, G.; Deleanu, I.; Busuioc, C.; Oprea, O.; Surdu, V.-A.; Bacalum, M.; Stoica, R.; Stoica-Guzun, A. Bacterial Cellulose—Carboxymethylcellulose Composite Loaded with Turmeric Extract for Antimicrobial Wound Dressing Applications. Int. J. Mol. Sci. 2023, 24, 1719. [Google Scholar] [CrossRef]
- Alsahag, M.; Alisaac, A.; Al-Hazmi, G.A.; Pashameah, R.A.; Attar, R.M.; Saad, F.A.; El-Metwaly, N.M. Preparation of carboxymethyl cellulose/polyvinyl alcohol wound dressing composite immobilized with anthocyanin extract for colorimetric monitoring of wound healing and prevention of wound infection. Int. J. Biol. Macromol. 2022, 224, 233–242. [Google Scholar] [CrossRef]
- Xue, J.; Ngadi, M. Effects of methylcellulose, xanthan gum and carboxymethylcellulose on thermal properties of batter systems formulated with different flour combinations. Food Hydrocoll. 2008, 23, 286–295. [Google Scholar] [CrossRef]
- Biswal, D.; Singh, R. Characterisation of carboxymethyl cellulose and polyacrylamide graft copolymer. Carbohydr. Polym. 2004, 57, 379–387. [Google Scholar] [CrossRef]
- Lin, X.; Li, Y.; Chen, Z.; Zhang, C.; Luo, X.; Du, X.; Huang, Y. Synthesis, characterization and electrospinning of new thermoplastic carboxymethyl cellulose (TCMC). 215-216. [CrossRef]
- Yaşar, F.; Toğrul, H.; Arslan, N. Flow properties of cellulose and carboxymethyl cellulose from orange peel. J. Food Eng. 2007, 81, 187–199. [Google Scholar] [CrossRef]
- El-Newehy, M.H.; El-Naggar, M.E.; Alotaiby, S.; El-Hamshary, H.; Moydeen, M.; Al-Deyab, S. Preparation of biocompatible system based on electrospun CMC/PVA nanofibers as controlled release carrier of diclofenac sodium. J. Macromol. Sci. Part A 2016, 53, 566–573. [Google Scholar] [CrossRef]
- Kandasamy, S.; Narayanan, V.; Sumathi, S. Zinc and manganese substituted hydroxyapatite/CMC/PVP electrospun composite for bone repair applications. Int. J. Biol. Macromol. 2019, 145, 1018–1030. [Google Scholar] [CrossRef] [PubMed]
- Alsulami, Q.A.; Alorfi, H.S.; Keshk, S.M. Thermal stability augmentation of poly(vinyl chloride) by blending with carboxymethyl cellulose. Polym. Technol. Mater. 2022, 61, 1719–1727. [Google Scholar] [CrossRef]
- Basu, P.; Repanas, A.; Chatterjee, A.; Glasmacher, B.; NarendraKumar, U.; Manjubala, I. PEO–CMC blend nanofibers fabrication by electrospinning for soft tissue engineering applications. Mater. Lett. 2017, 195, 10–13. [Google Scholar] [CrossRef]
- Zhang, C.; Wang, R.; Zhang, L.; Liu, Z.; Ning, D.; Li, Q.; Gao, L.; Jiao, T. Self-assembled electrospun PVA/CMC/PEO composite fiber film material with enhanced dye adsorption performance for wastewater treatment. Colloids Surfaces A: Physicochem. Eng. Asp. 2023, 678. [Google Scholar] [CrossRef]
- Oliveira, R.N.; McGuinness, G.B.; Rouze, R.; Quilty, B.; Cahill, P.; Soares, G.D.A.; Thiré, R.M.S.M. PVA hydrogels loaded with a Brazilian propolis for burn wound healing applications. J. Appl. Polym. Sci. 2015, 132, 42129. [Google Scholar] [CrossRef]
- Chahardoli, F.; Pourmoslemi, S.; Asl, S.S.; Tamri, P.; Haddadi, R. Preparation of polyvinyl alcohol hydrogel containing chlorogenic acid microspheres and its evaluation for use in skin wound healing. J. Biomater. Appl. 2023, 37, 1667–1675. [Google Scholar] [CrossRef]
- Aranha, I.B.; Lucas, E.F. Chemical modification of poly(vinyl alcohol): Evaluation of hydrophilic/lipophilic balance. Polim. E Tecnol. 2001, 11, 174–181. [Google Scholar] [CrossRef]
- Moraes, I.C.; da Silva, G.G.D.; de Carvalho, R.A.; Habitante, A.M.Q.B.; Bergo, P.V.d.A.; Sobral, P.J.D.A. Influence of the degree of hydrolysis of poly(vinyl alcohol) on the physical properties of films based on blends of gelatin and poly(vinyil alcohol) plastized with glycerol. Food Sci. Technol. 2008, 28, 738–745. [Google Scholar] [CrossRef]
- Chiellini, E.; Corti, A.; D'Antone, S.; Solaro, R. Biodegradation of poly (vinyl alcohol) based materials. Prog. Polym. Sci. 2003, 28, 963–1014. [Google Scholar] [CrossRef]
- Jatoi, A.W.; Jo, Y.K.; Lee, H.; Oh, S.; Hwang, D.S.; Khatri, Z.; Cha, H.J.; Kim, I.S. Antibacterial efficacy of poly(vinyl alcohol) composite nanofibers embedded with silver-anchored silica nanoparticles. J. Biomed. Mater. Res. Part B: Appl. Biomater. 2017, 106, 1121–1128. [Google Scholar] [CrossRef]
- Elhaleem, M.B.A.; Farghali, A.A.; El-Shahawy, A.A.G.; El-Ela, F.I.A.; Eldine, Z.E.; Mahmoud, R.K. Chemisorption and sustained release of cefotaxime and polyvinyl alcohol nanofibers for enhanced efficacy against second degree burn wound infection. RSC Adv. 2020, 10, 13196–13214. [Google Scholar] [CrossRef] [PubMed]
- Kamoun, E.A.; Chen, X.; Eldin, M.S.M.; Kenawy, E.-R.S. Crosslinked poly(vinyl alcohol) hydrogels for wound dressing applications: A review of remarkably blended polymers. Arab. J. Chem. 2015, 8, 1–14. [Google Scholar] [CrossRef]
- de Souza, B.Z.; Facchi, D.P.; Facchi, S.P.; Teodoro, C.F.; de Almeida, D.A.; Popat, K.C.; Kipper, M.J.; Bonafé, E.G.; Martins, A.F. Electrospun Fibers of Ecovio® Polymer Blends with Antimicrobial Tea Tree Essential Oil: Enhanced Chemical and Biological Properties. Processes 2024, 12, 2330. [Google Scholar] [CrossRef]
- Oliveira, R.N.; Meleiro, L.A.d.C.; Quilty, B.; McGuinness, G.B. Release of natural extracts from PVA and PVA-CMC hydrogel wound dressings: a power law swelling/delivery. Front. Bioeng. Biotechnol. 2024, 12, 1406336. [Google Scholar] [CrossRef]
- Cacciotti, I.; Ciocci, M.; Di Giovanni, E.; Nanni, F.; Melino, S. Hydrogen Sulfide-Releasing Fibrous Membranes: Potential Patches for Stimulating Human Stem Cells Proliferation and Viability under Oxidative Stress. Int. J. Mol. Sci. 2018, 19, 2368. [Google Scholar] [CrossRef]
- Zhang, X.; Wang, Y.; Gao, Z.; Mao, X.; Cheng, J.; Huang, L.; Tang, J. Advances in wound dressing based on electrospinning nanofibers. J. Appl. Polym. Sci. 2023, 141. [Google Scholar] [CrossRef]
- Chen, Y.; Bera, H.; Si, L.; Xiu, F.; Liu, P.; Li, J.; Xu, X.; Zhu, X.; Li, Y.; Cun, D.; et al. Tailor-made curdlan based nanofibrous dressings enable diabetic wound healing. Carbohydr. Polym. 2024, 348, 122876. [Google Scholar] [CrossRef]
- Maduna, L.; Patnaik, A. Challenges Associated with the Production of Nanofibers. Processes 2024, 12, 2100. [Google Scholar] [CrossRef]
- Shi, W.; Cai, J.; Yang, Y.; Xu, C.; Lu, J.; Wu, S. Electrospun Carboxymethyl Cellulose/Polyvinyl Alcohol Nanofiber Membranes for Enhanced Metal Ion Removal. Sustainability 2023, 15, 11331. [Google Scholar] [CrossRef]
- Hashmi, M.; Ullah, S.; Ullah, A.; Akmal, M.; Saito, Y.; Hussain, N.; Ren, X.; Kim, I.S. Optimized Loading of Carboxymethyl Cellulose (CMC) in Tri-component Electrospun Nanofibers Having Uniform Morphology. Polymers 2020, 12, 2524. [Google Scholar] [CrossRef]
- Kazeminava, F.; Javanbakht, S.; Nouri, M.; Adibkia, K.; Ganbarov, K.; Yousefi, M.; Ahmadi, M.; Gholizadeh, P.; Kafil, H.S. Electrospun nanofibers based on carboxymethyl cellulose/polyvinyl alcohol as a potential antimicrobial wound dressing. Int. J. Biol. Macromol. 2022, 214, 111–119. [Google Scholar] [CrossRef] [PubMed]
- Hashmi, M.; Ullah, S.; Ullah, A.; Saito, Y.; Haider, K.; Bie, X.; Wada, K.; Kim, I.S. Carboxymethyl Cellulose (CMC) Based Electrospun Composite Nanofiber Mats for Food Packaging. Polymers 2021, 13, 302. [Google Scholar] [CrossRef] [PubMed]
- Koski, A.; Yim, K.; Shivkumar, S. Effect of molecular weight on fibrous PVA produced by electrospinning. Mater. Lett., 2004, 58(3-4), 493-497. [CrossRef]
- Teixeira, B.N.; Anaya-Mancipe, J.M.; Thiré, R.M.d.S.M. Evaluation of polycaprolactone nanofibers’ spinnability using green solvent systems by solution blow spinning (SBS). Nanotechnology 2023, 34, 505707. [Google Scholar] [CrossRef]
- Abazari, M.; Sharafi, A.; Hassan, M.; Moghimi, H.R.; Andalib, S.; Ghaffari, A. Electrospun silver chloride-loaded PVA nanofibers as a potential antibacterial and electroconductive scaffold for the management of wound infection and healing. Polym. Bull. 2024, 81, 14921–14956. [Google Scholar] [CrossRef]
- Ergashovich, Y.K.; O'G'Li, A.A.A.; Shodievich, A.N.; Ugli, M.M.M.; Sharafovna, R.S.; Jiang, G.; Wan, Y.; Yu, M. Formation, structure, and morphology of nanofiber mat on the base sodium-carboxymethylcellulose/polyvinyl-alcohol/silver nanoparticles composite. Polym. Adv. Technol. 2024, 35. [Google Scholar] [CrossRef]
- Wang, H.; Zou, L.; Wang, C.; Li, Y.V. Effect of spinning solution concentration of high DP and high S-diad PVA polymer on the structural properties of high-strength and high-modulus PVA fiber. Colloids Surfaces A: Physicochem. Eng. Asp. 2024, 701. [Google Scholar] [CrossRef]
- Anaya-Mancipe, J.M.; de Figueiredo, A.C.; Rabello, L.G.; Dias, M.L.; Thiré, R.M.d.S.M. Evaluation of the polycaprolactone hydrolytic degradation in acid solvent and its influence on the electrospinning process. J. Appl. Polym. Sci. 2024, 141. [Google Scholar] [CrossRef]
- de Figueiredo, A.C.; Anaya-Mancipe, J.M.; Barros, A.O.d.S.d.; Santos-Oliveira, R.; Dias, M.L.; Thiré, R.M.d.S.M. Nanostructured Electrospun Polycaprolactone—Propolis Mats Composed of Different Morphologies for Potential Use in Wound Healing. Molecules 2022, 27, 5351. [Google Scholar] [CrossRef] [PubMed]
- Mancipe, J.M.A.; Pereira, L.C.B.; Borchio, P.G.d.M.; Dias, M.L.; Thiré, R.M.d.S.M. Novel polycaprolactone (PCL)-type I collagen core-shell electrospun nanofibers for wound healing applications. J. Biomed. Mater. Res. Part B: Appl. Biomater. 2022, 111, 366–381. [Google Scholar] [CrossRef]
- Liu, Y.; He, J.; Yu, J.; Zeng, H. Controlling numbers and sizes of beads in electrospun nanofibers. Polym. Int. 2007, 57, 632–636. [Google Scholar] [CrossRef]
- Benchabane, A.; Bekkour, K. Rheological properties of carboxymethyl cellulose (CMC) solutions. Colloid Polym. Sci. 2008, 286, 1173–1180. [Google Scholar] [CrossRef]
- Yao, T.; Chen, H.; Samal, P.; Giselbrecht, S.; Baker, M.B.; Moroni, L. Self-assembly of electrospun nanofibers into gradient honeycomb structures. Mater. Des. 2019, 168, 107614. [Google Scholar] [CrossRef]
- Liu, Z.; Ju, K.; Wang, Z.; Li, W.; Ke, H.; He, J. Electrospun Jets Number and Nanofiber Morphology Effected by Voltage Value: Numerical Simulation and Experimental Verification. Nanoscale Res. Lett. 2019, 14, 1–9. [Google Scholar] [CrossRef] [PubMed]
- Mancipe, J.M.A.; Dias, M.L.; Thiré, R.M.D.S.M. Avaliação morfológica de fibras eletrofiadas de policaprolactona em função do tipo de solvente. Mater. De Jan. 2019, 24. [Google Scholar] [CrossRef]
- Ramos, S.d.P.; da Trindade, L.G.; Mazzo, T.M.; Longo, E.; Bonsanto, F.P.; de Rosso, V.V.; Braga, A.R.C. Electrospinning Composites as Carriers of Natural Pigment: Screening of Polymeric Blends. Processes 2022, 10, 2737. [Google Scholar] [CrossRef]
- Mancipe, J.M.A.; Dias, M.L.; Thiré, R.M.D.S.M. Type I collagen – poly(vinyl alcohol) electrospun nanofibers: FTIR study of the collagen helical structure preservation. Polym. Technol. Mater. 2022, 61, 846–860. [Google Scholar] [CrossRef]
- Viana, V.R.; Ferreira, W.H.; Azero, E.G.; Dias, M.L.; Andrade, C.T. Optimization of the Electrospinning Conditions by Box-Behnken Design to Prepare Poly(Vinyl Alcohol)/Chitosan Crosslinked Nanofibers. J. Mater. Sci. Chem. Eng. 2020, 08, 13–31. [Google Scholar] [CrossRef]
- Vu, T.H.N.; Morozkina, S.N.; Sitnikova, V.E.; Nosenko, T.N.; Olekhnovich, R.O.; Uspenskaya, M.V. The influence of acetic acid and ethanol on the fabrication and properties of poly(vinyl alcohol) nanofibers produced by electrospinning. Polym. Bull. 2024, 81, 9669–9697. [Google Scholar] [CrossRef]
- Cuba-Chiem, L.T.; Huynh, L.; Ralston, J.; Beattie, D.A. In Situ Particle Film ATR FTIR Spectroscopy of Carboxymethyl Cellulose Adsorption on Talc: Binding Mechanism, pH Effects, and Adsorption Kinetics. Langmuir 2008, 24, 8036–8044. [Google Scholar] [CrossRef]
- Sousa, J.P.L.d.M.; Oliveira, R.N.; Santos, A.M.N.; Gamallo, O.D.; Araújo, L.S.; Middea, A.; Cid, Y.P.; Castro, R.N. Superabsorbent biodegradable CMC membranes loaded with propolis: Peppas-Sahlin kinetics release. Polim. E Tecnol. 2023, 33. [Google Scholar] [CrossRef]
- Fernandes, I.S.; Saboia, L.d.C.; Gonçalves, V.S.; Neto, J.L.S.d.C.; Moreira, A.P.D.; Souza, N.D.; Nascimento, A.M.D.; Chaves, D.S.d.A.; Rosado, L.H.G.; da Silva, L.D.B.; et al. Delivery kinetics of natural active agents by PVA hydrogels intended for wound care. Mater. De Jan. 2023, 28, e20230071. [Google Scholar] [CrossRef]
- Nasibi, S.; Khoramabadi, H.N.; Arefian, M.; Hojjati, M.; Tajzad, I.; Mokhtarzade, A.; Mazhar, M.; Jamavari, A. A review of Polyvinyl alcohol / Carboxiy methyl cellulose (PVA/CMC) composites for various applications. J. Compos. Compd. 2020, 2, 68–75. [Google Scholar] [CrossRef]
- Saadiah, M.H.; Zhang, D.; Nagao, Y.; Samsudin, A.S. Molecularly Conductive Behavior of Blended Polymer Electrolyte-based CMC/PVA. Makara J. Technol. 2019, 23, 27–31. [Google Scholar] [CrossRef]
- Mohammadkhani, A.; Mohammadkhani, F.; Farhadyar, N.; Sadjadi, M.S.; Kianfar, E. Novel nanocomposite zinc phosphate/ polyvinyl alcohol / carboxymethyl cellulose: Synthesis, characterization and investigation of antibacterial and anticorrosive properties. Case Stud. Chem. Environ. Eng. 2023, 9. [Google Scholar] [CrossRef]
- El-Sayed, S.; Mahmoud, K.; Fatah, A.; Hassen, A. DSC, TGA and dielectric properties of carboxymethyl cellulose/polyvinyl alcohol blends. Physica B, 2011; 406, 4068–4076. [Google Scholar] [CrossRef]
- Fazlina, F.; Abu Hassan, N.A.; Fazita, M.R.N.; Leh, C.P.; Kosugi, A.; Arai, T.; Hassan, M.S.; Haafiz, M.K.M. Physicochemical, thermal, and mechanical properties of hemicellulose/carboxymethyl cellulose blend films: the influence of blending composition. Biomass- Convers. Biorefinery, 2024; 1–13. [Google Scholar] [CrossRef]
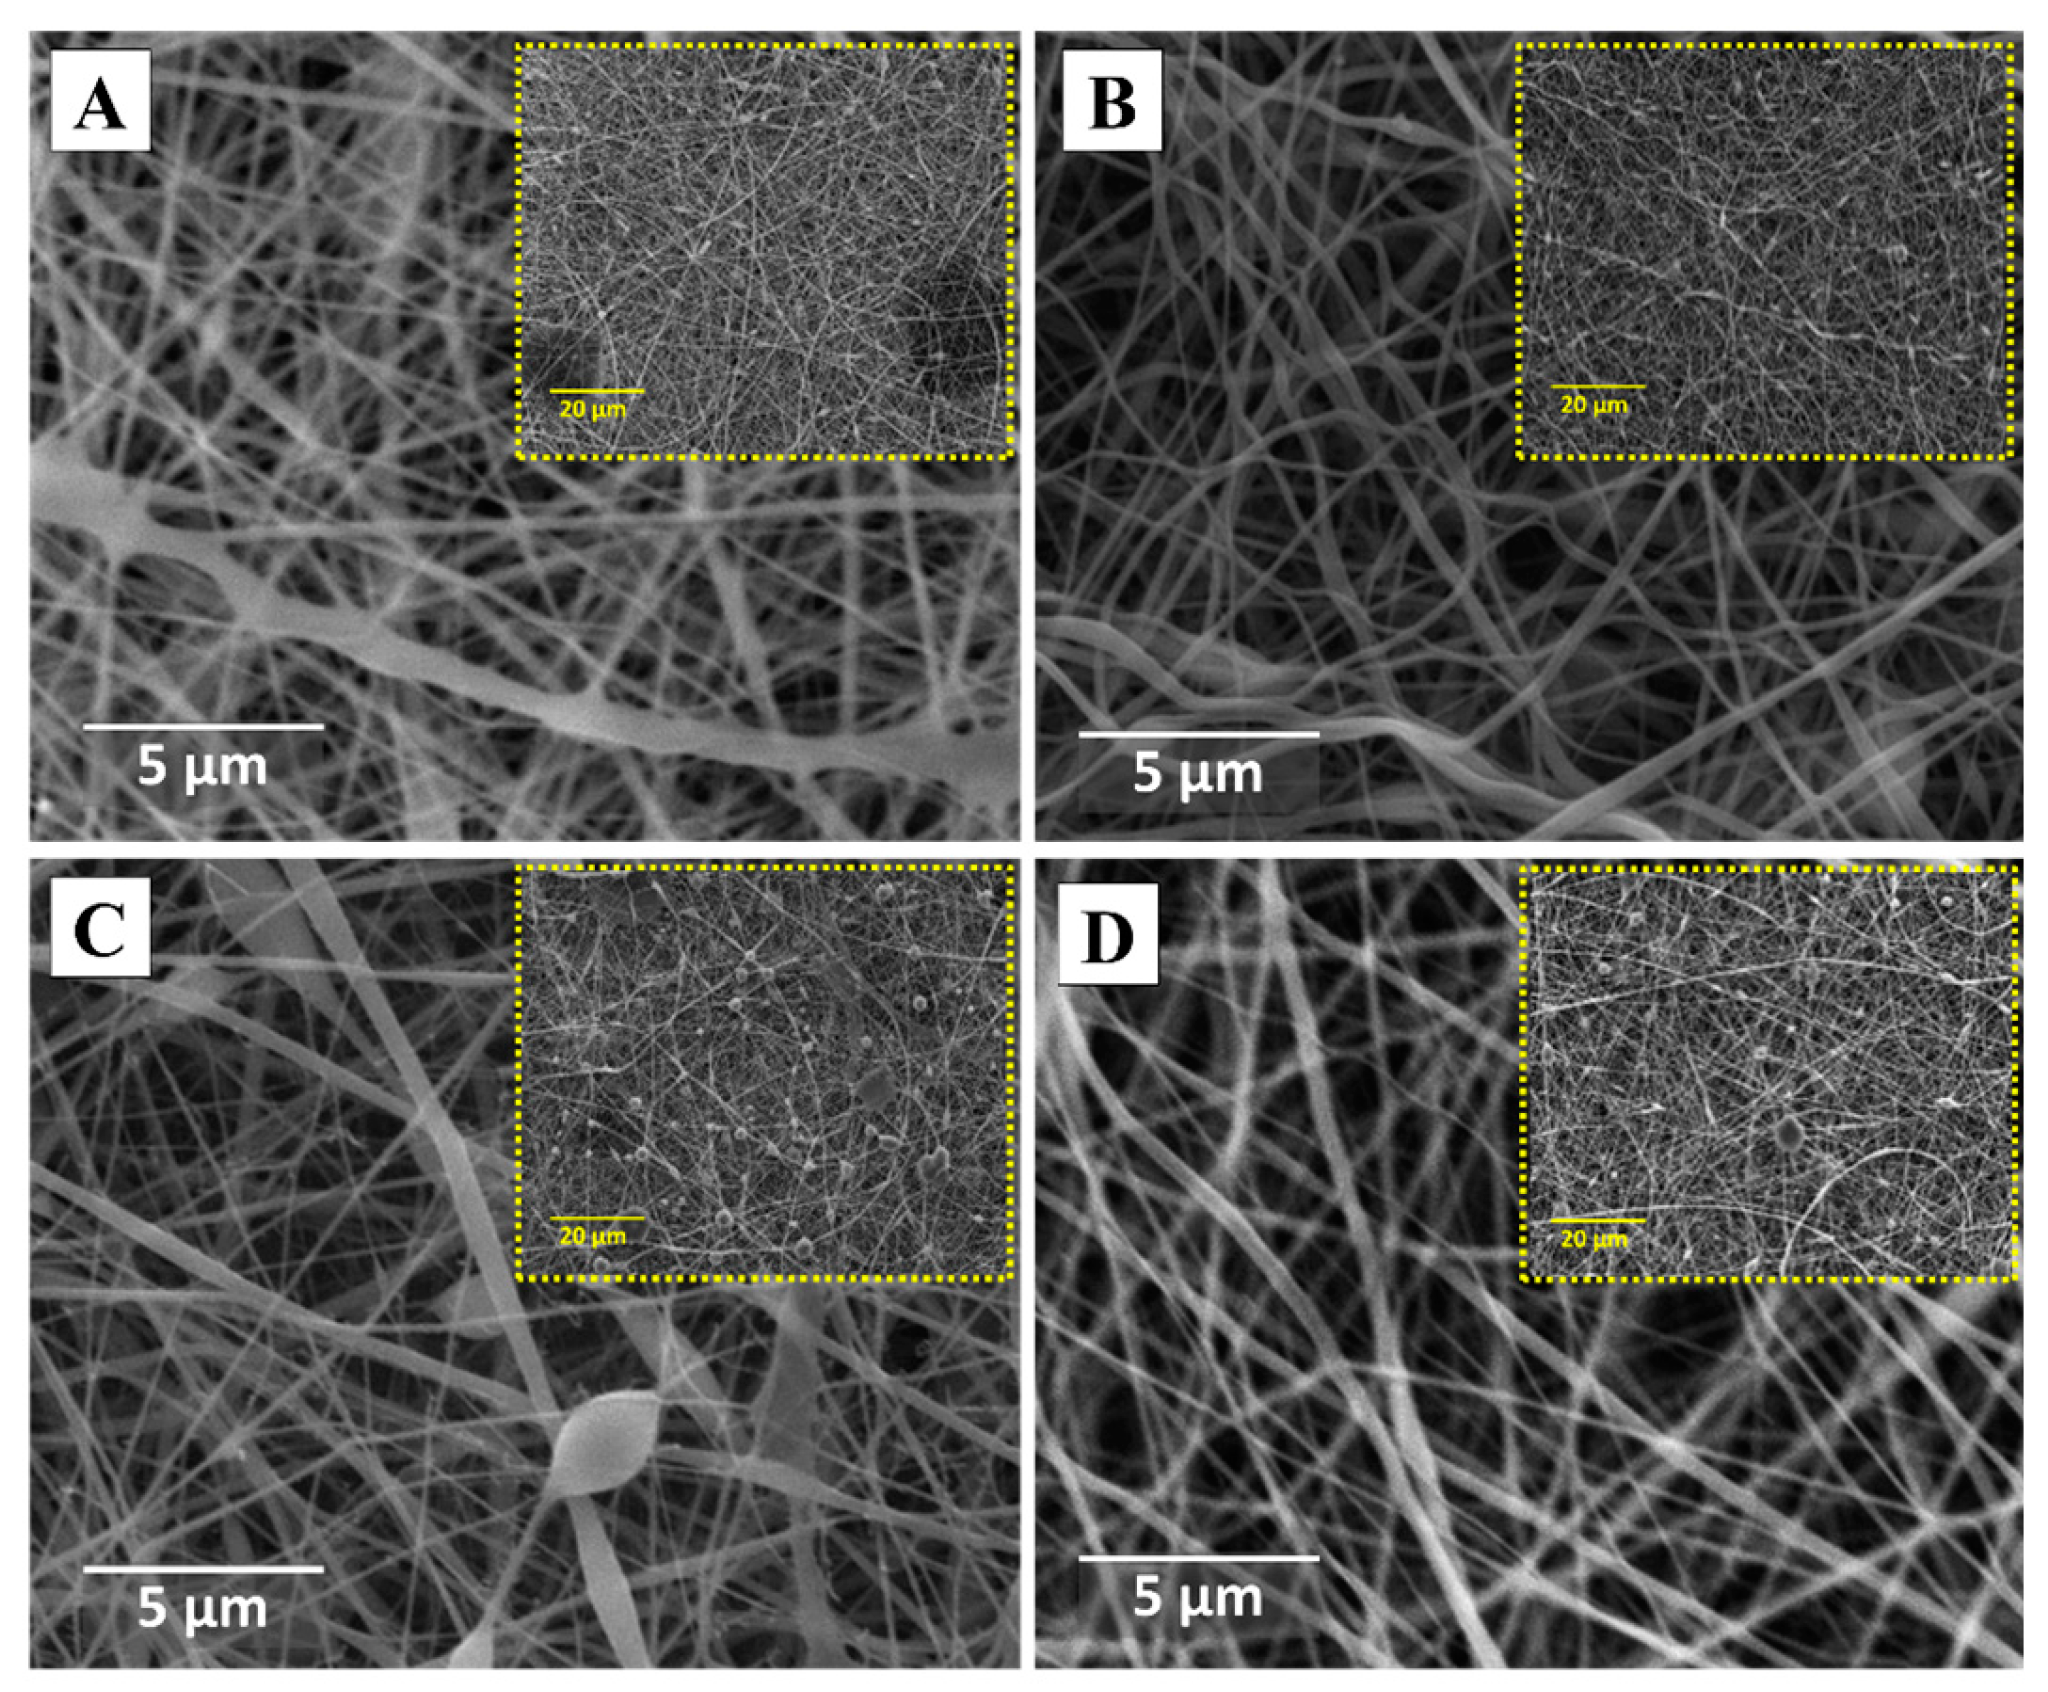
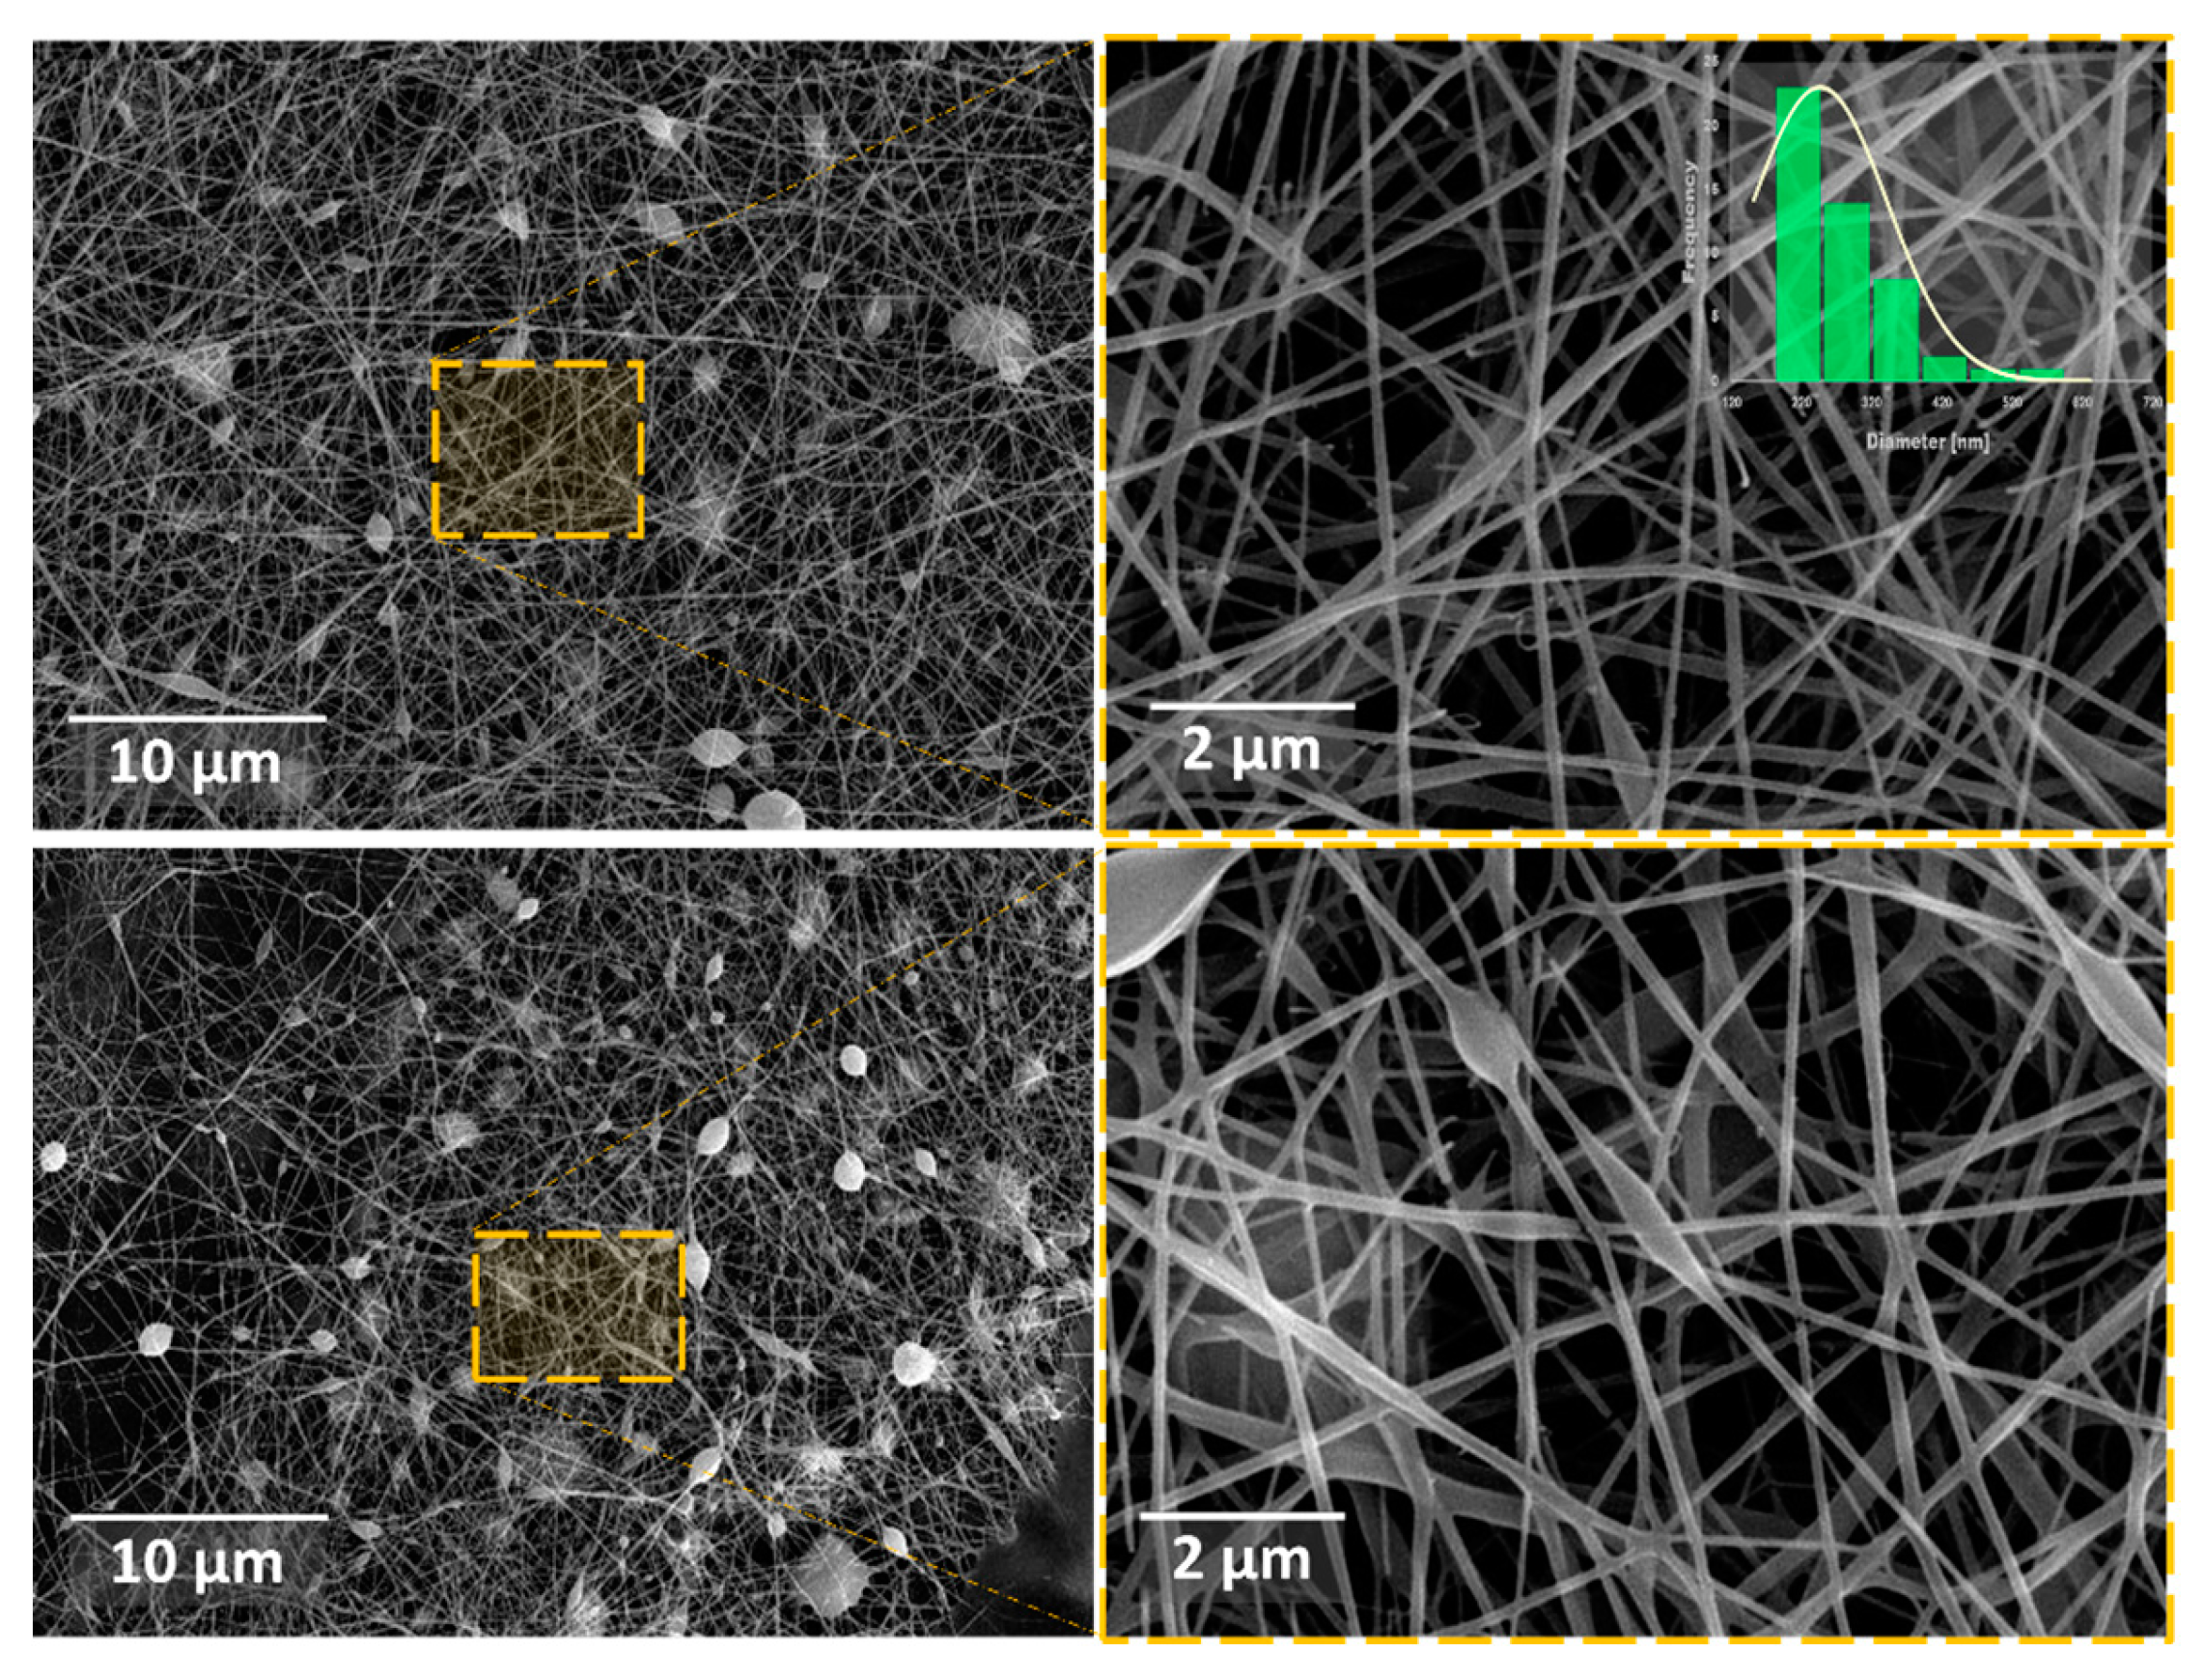
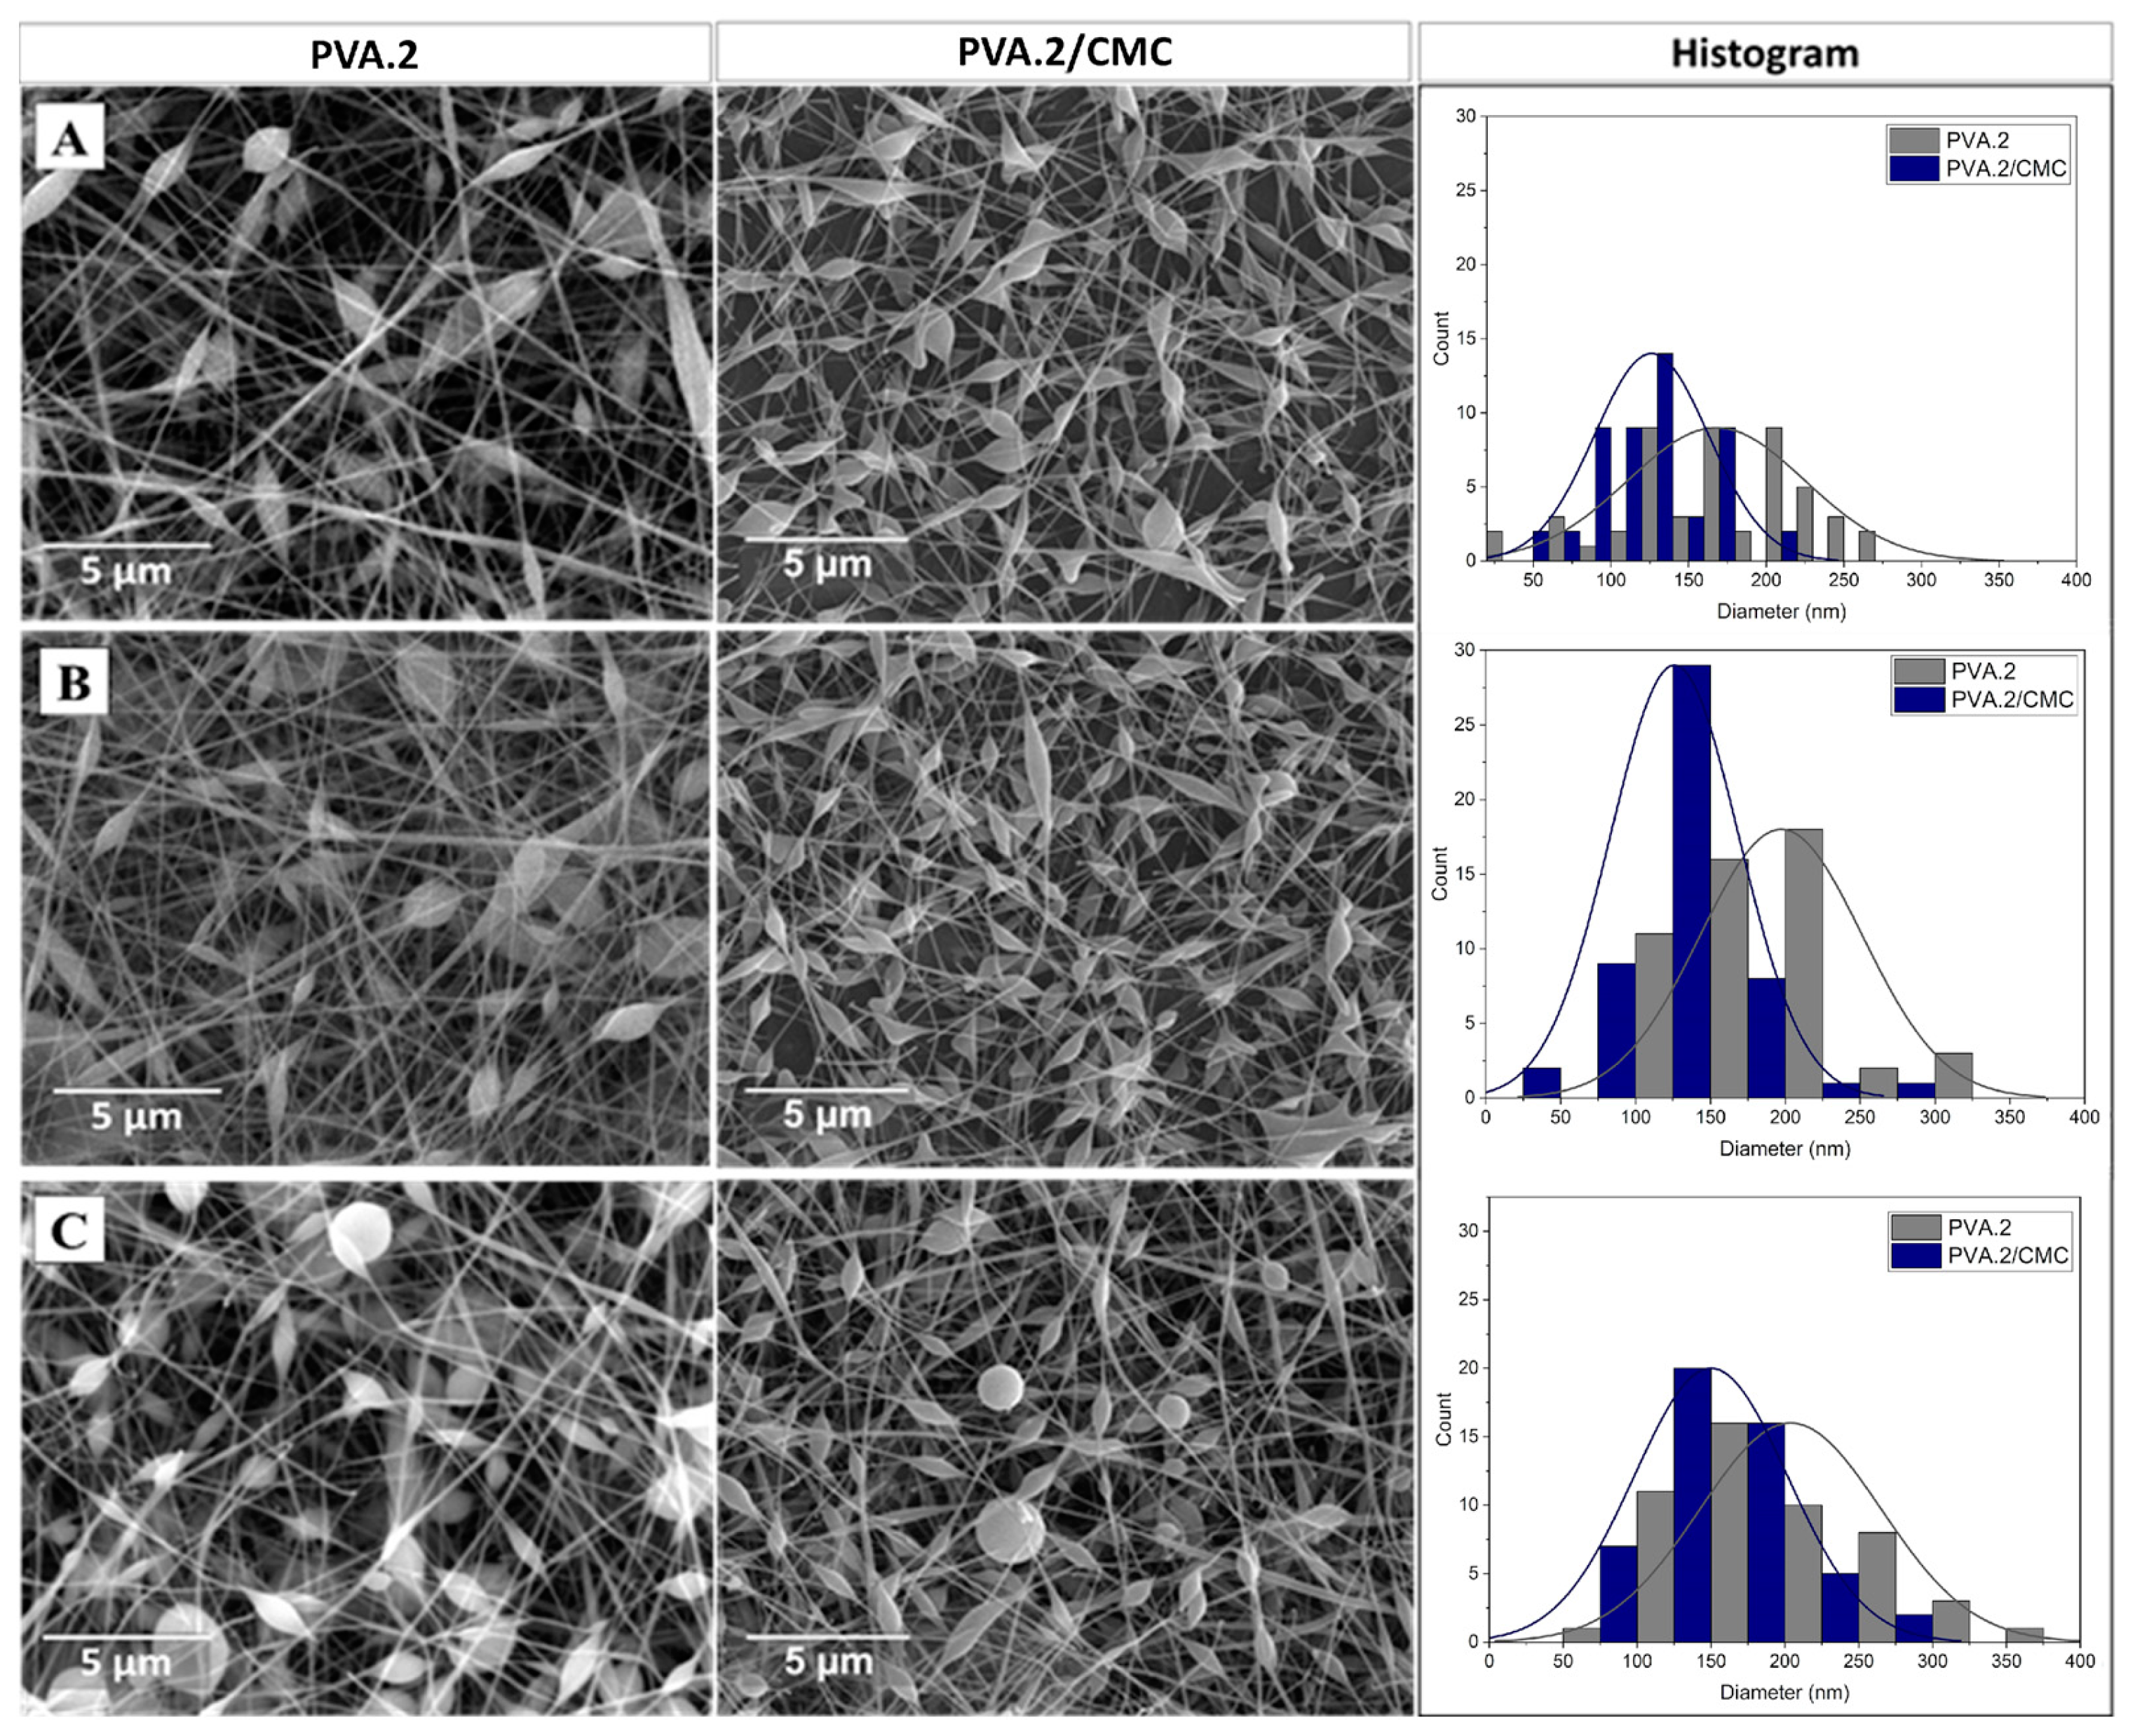
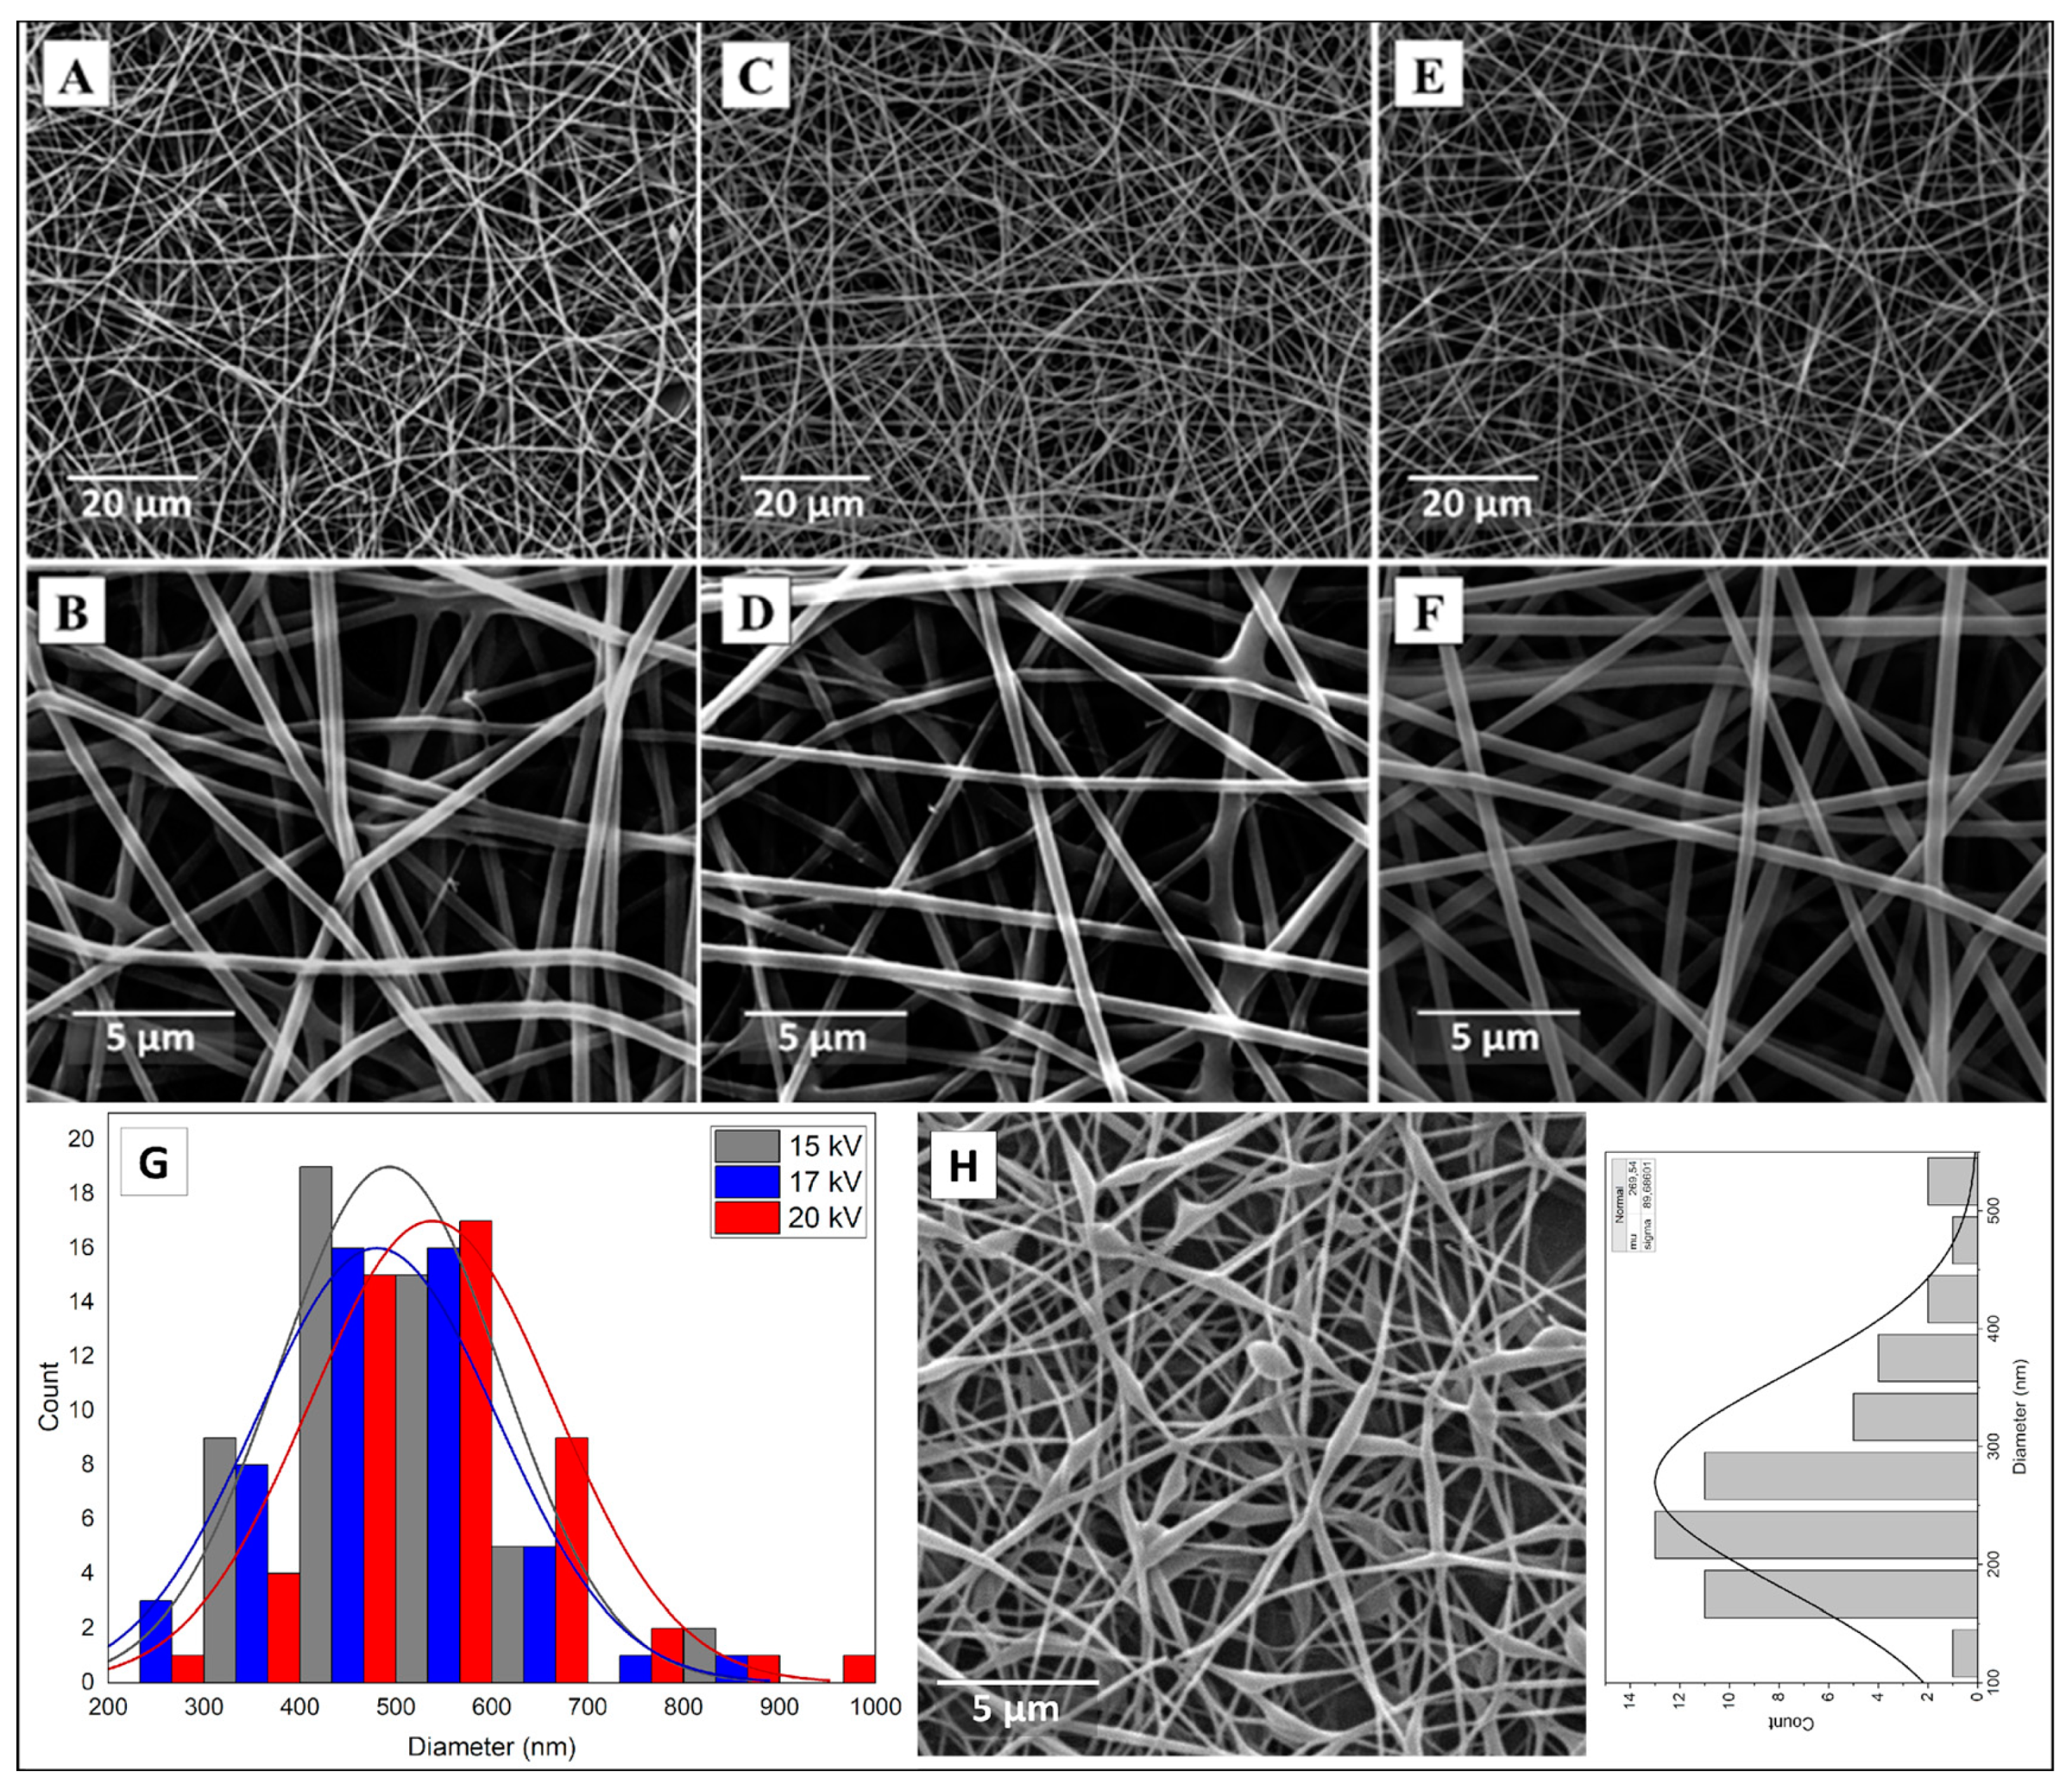
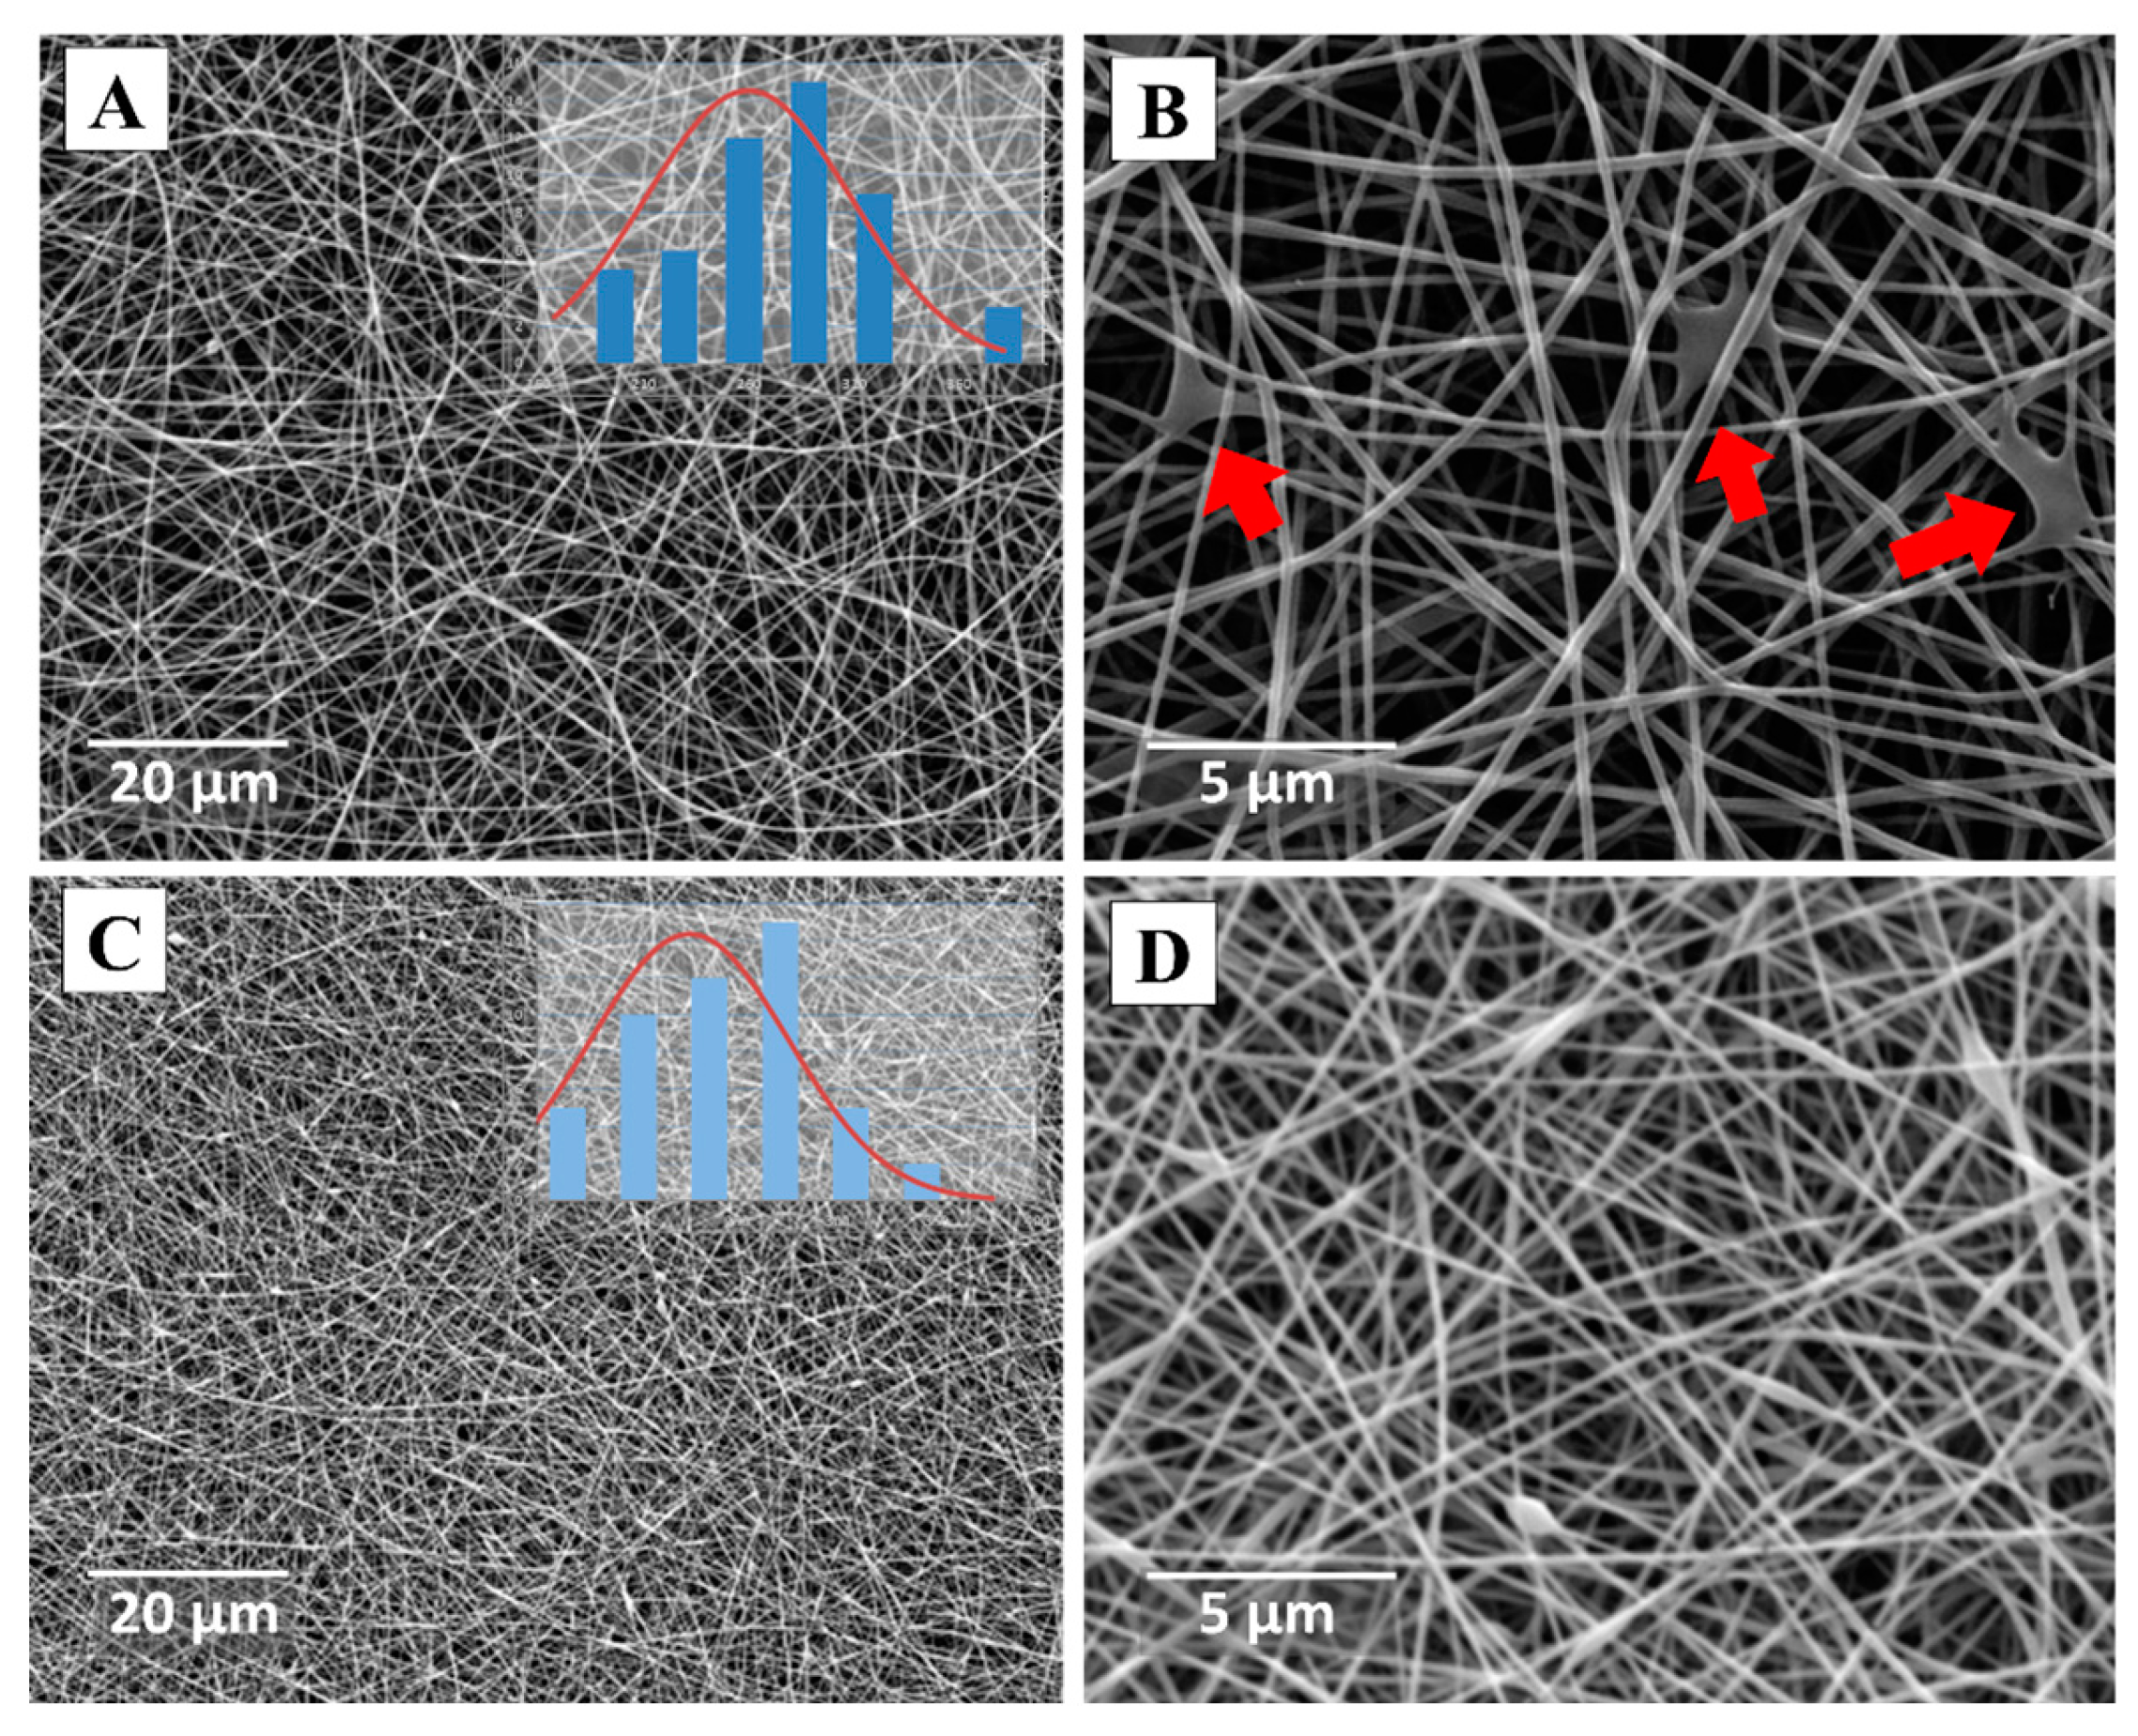
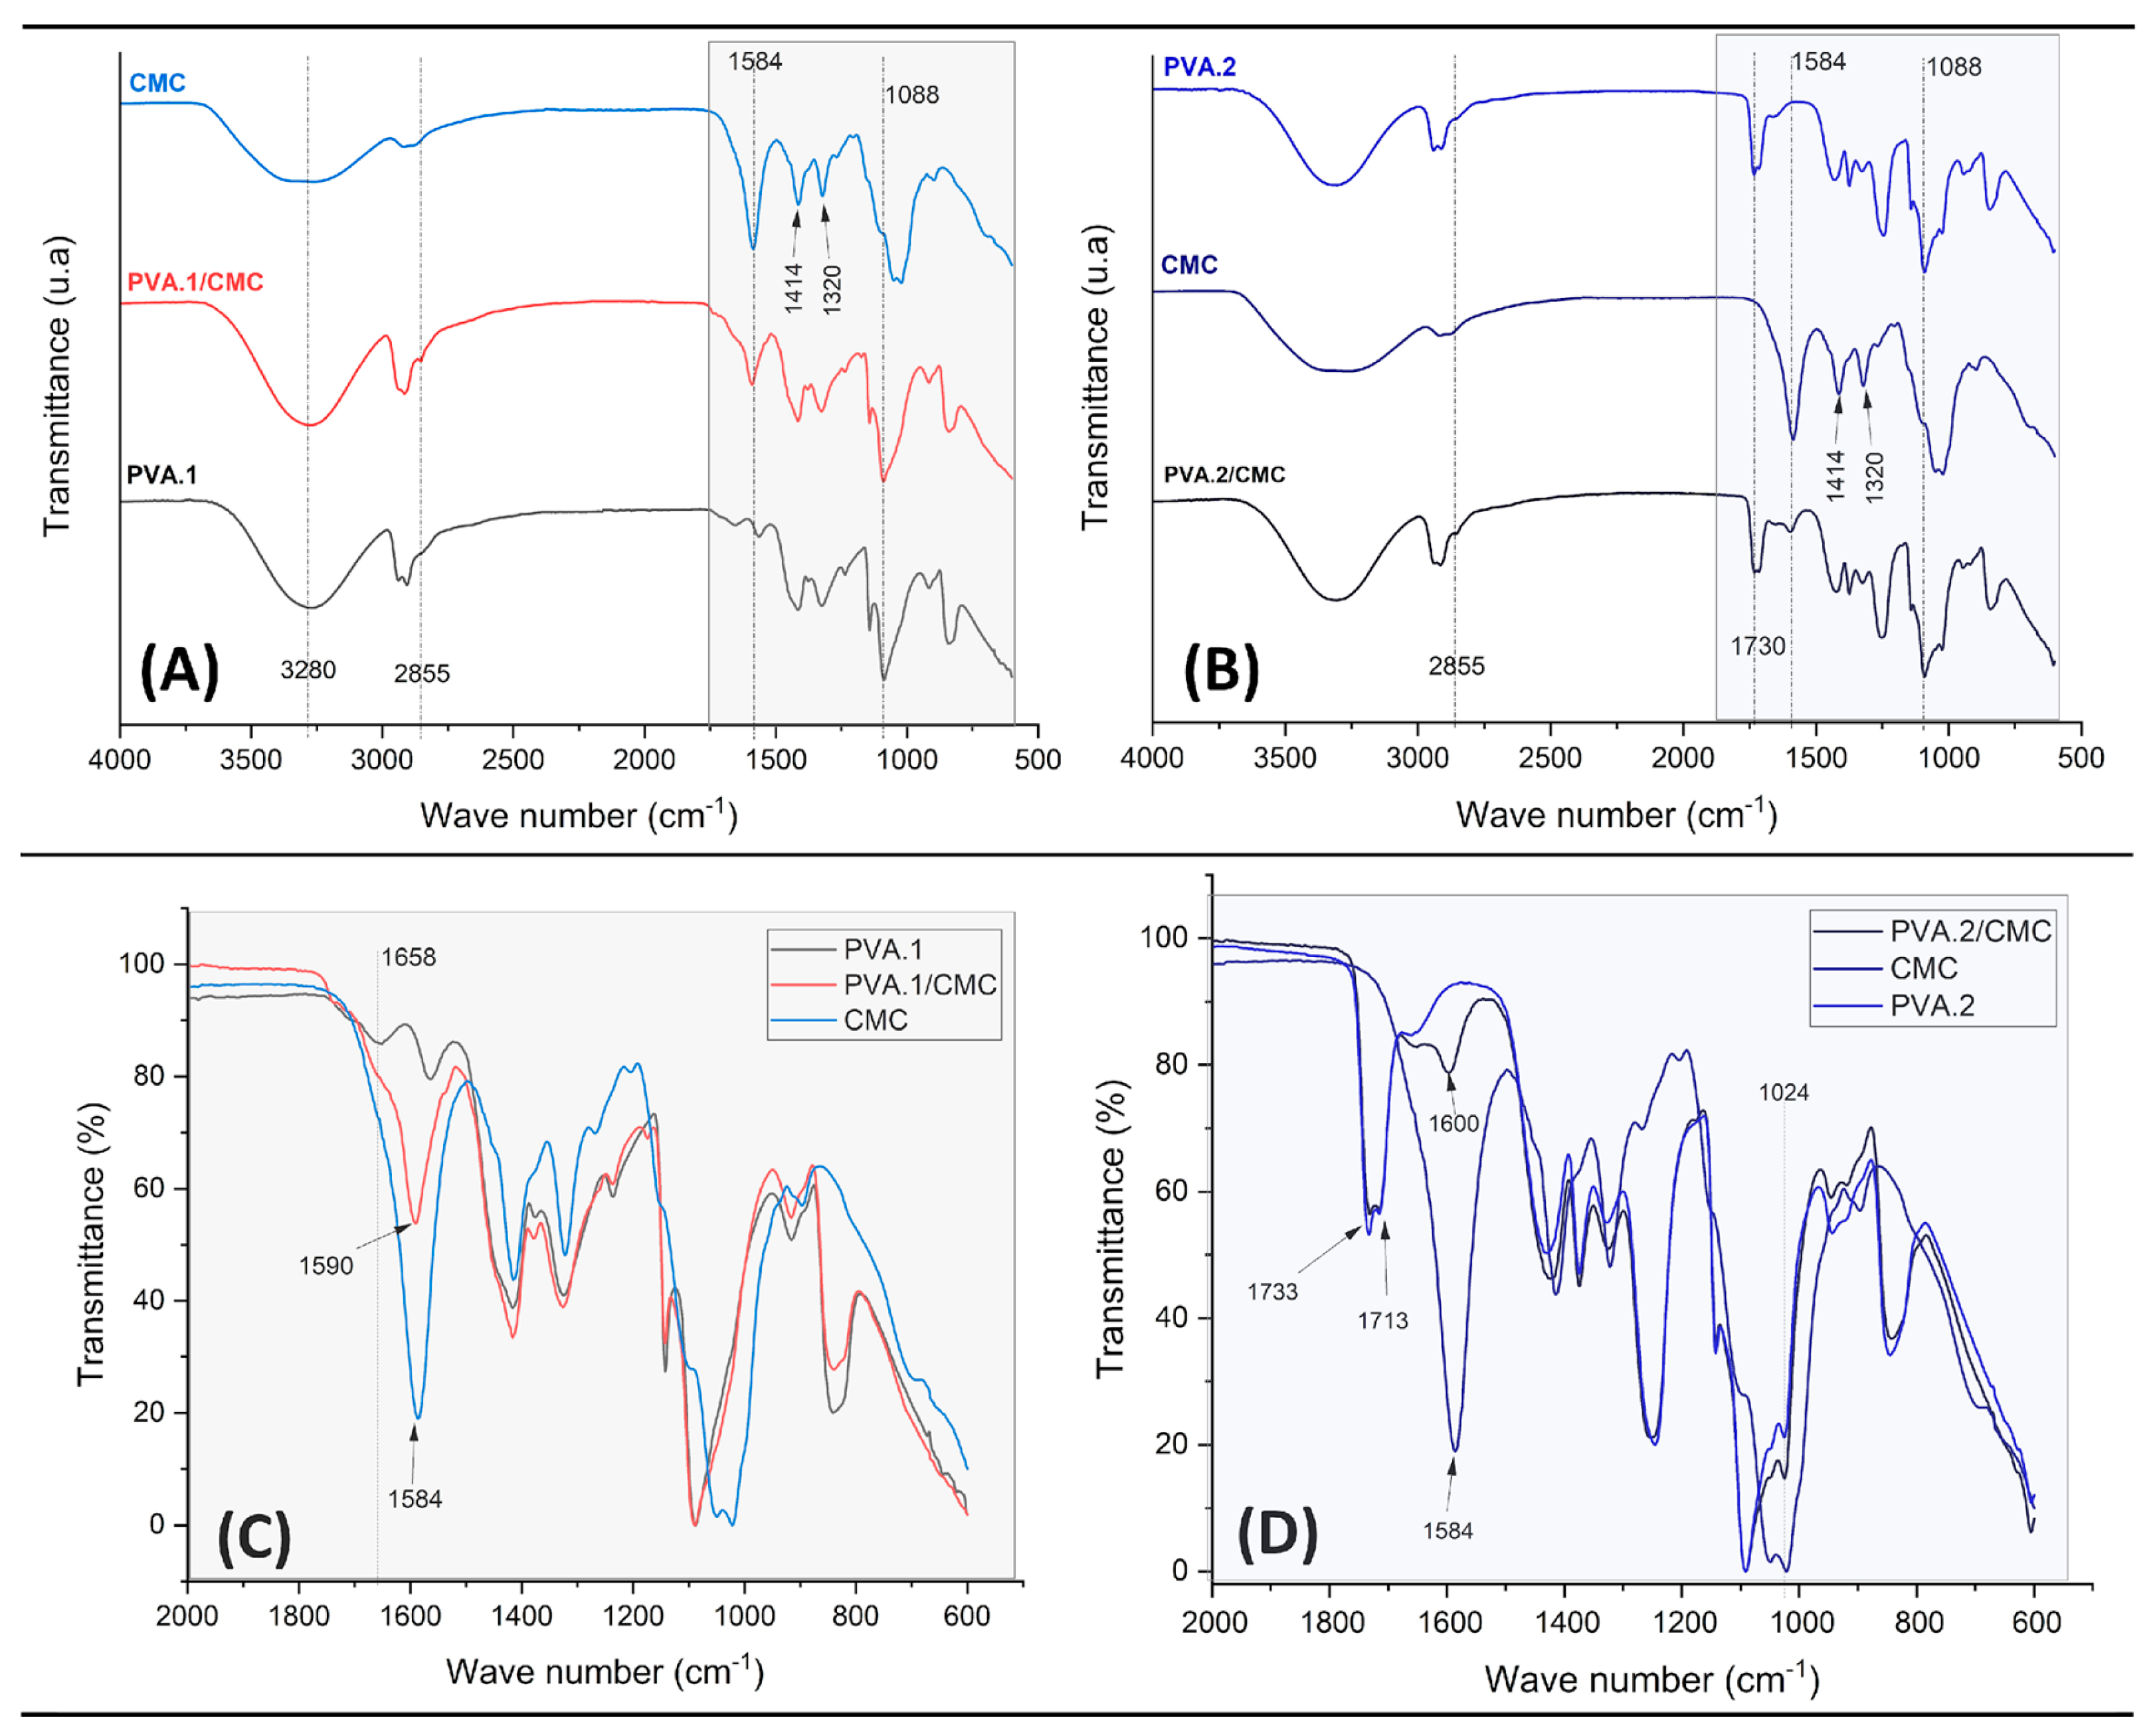
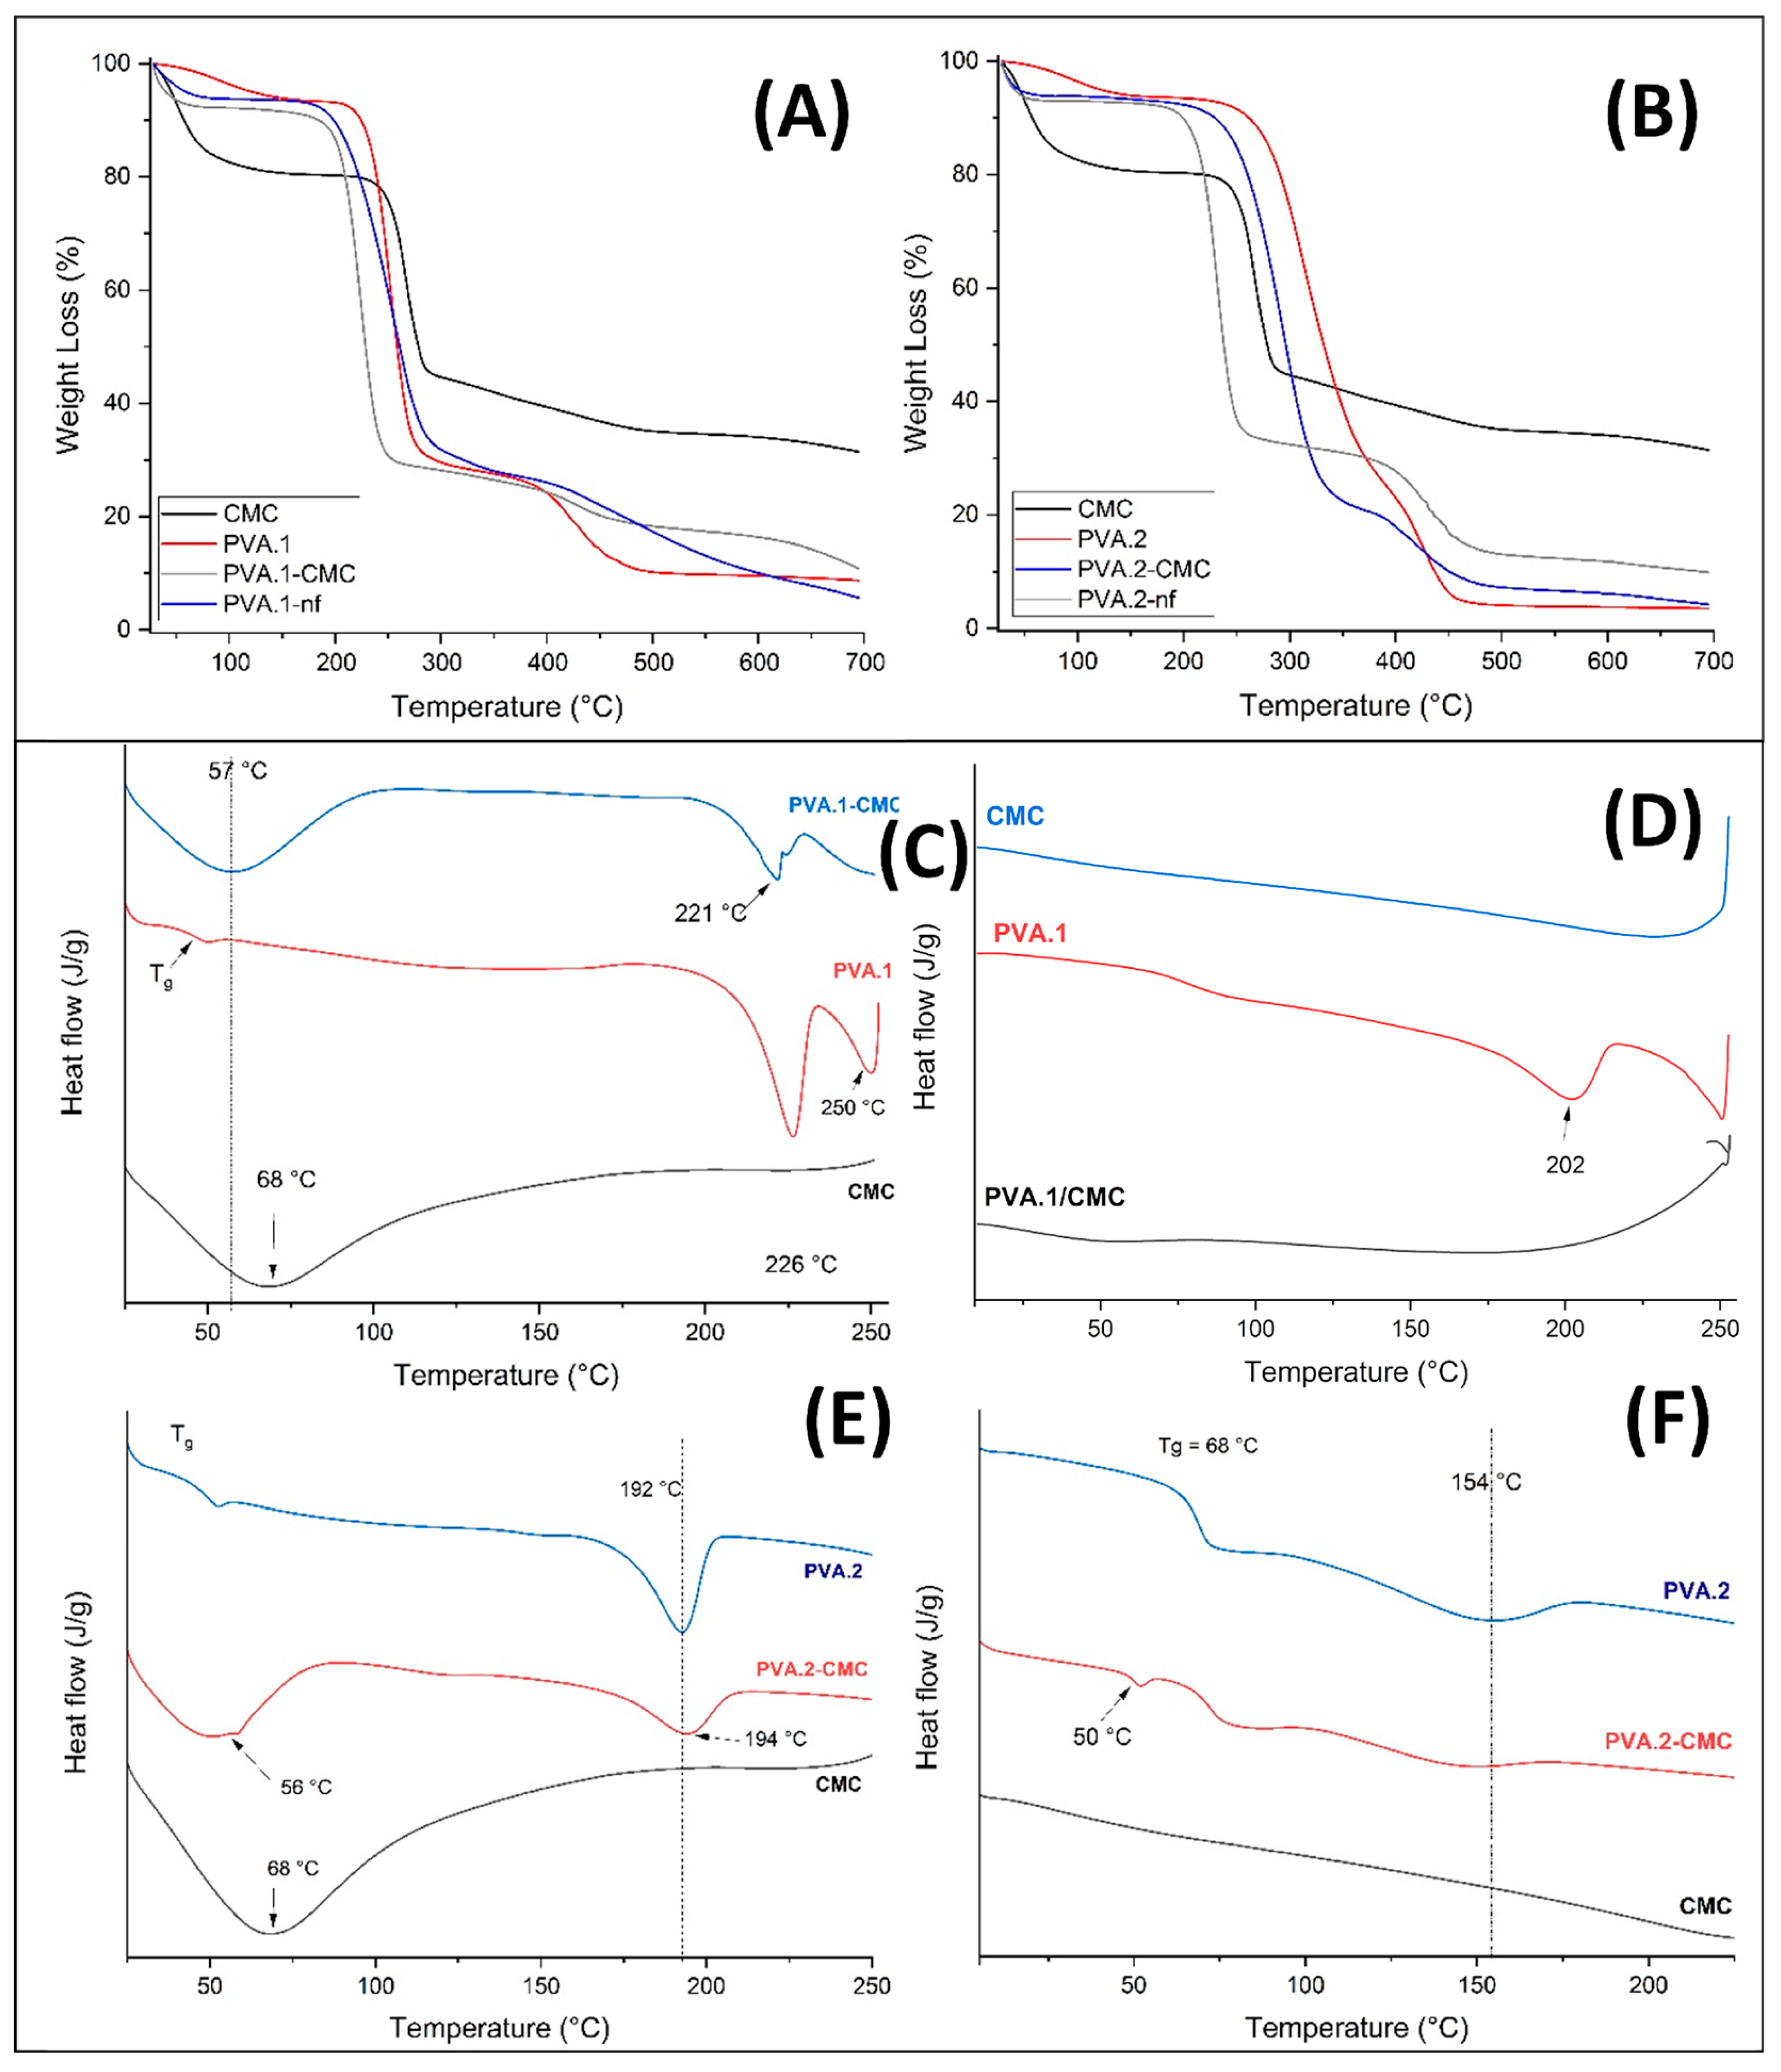
| Sample | Concentration PVA [wt. %] |
Voltage [kV] |
Flow rate [mL/h] | Diameters [nm] |
|---|---|---|---|---|
| PVA.1 | 8 | 20 | 0.5 | 217.9 ± 76.4 |
| PVA.1/CMC | 20 | 0.6 | 129.9 ± 78.7 | |
| PVA.2 | 8 | 17 | 0.5 | 448.6 ± 117.5 |
| PVA.2/CMC | 10 | 20 | 0.5 | 270.1 ± 90.6 |
| Sample and Degradation Event | Tonset (°C) |
Tmax (°C) |
Tendset (°C) |
Mass Loss (%) | ||
|---|---|---|---|---|---|---|
| CMC | 1° | 25.0 | 50.6 | 251.4 | 19.9 | |
| 2° | 251.4 | 266.6 | 349.6 | 40.0 | ||
| 3° | 349.6 | 429.5 | 550.5 | 8.7 | ||
| PVA.1 | 1° | 214.5 | 231.4 | 445.3 | 60.2 | |
| 2° | 399.6 | 430.3 | 545.1 | 29.9 | ||
| PVA.2 | 1° | 214.5 | 231.4 | 308.6 | 60.1 | |
| 2° | 399.7 | 430.3 | 524.9 | 30.1 | ||
| PVA.1/CMC | 1° | 206.1 | 224.5 | 389,8 | 62,4 | |
| 2° | 398.3 | 432.1 | 505.9 | 16.3 | ||
| PVA.2/CMC | 1° | 253.4 | 292.6 | 205.1 | 76.2 | |
| 2° | 234.8 | 254.4 | 347.2 | 17.7 | ||
| Sample | 1st cycle heat | 2nd cycle heat | ||||||||
|---|---|---|---|---|---|---|---|---|---|---|
| Tg (°C) | Tm (°C) | ΔH (J/g) | Xc (%) |
Tg (°C) | ΔHC (J/g) | Tm (°C) |
ΔHm (°C) |
Xc (%) | ||
| CMC | -- | -- | -- | -- | -- | -- | 229 | 29.8 | -- | |
| PVA.1 | 47 | 226.5 | 47.7 | 34.4 | 80 | 0.07 | 187.6 | 17.2 | 12.4 | |
| PVA.1/CMC | -- | 222.1 | 17.8 | 10.3 | 56 | 0.33 | 175.6 | 13.8 | 8.0 | |
| PVA.2 | 53 | 194.0 | 46.6 | 33.6 | 68 | 0.75 | 157.6 | 7.5 | 5.4 | |
| PVA.2/CMC | -- | 194.1 | 30.1 | 17.4 | 70 | 0.36 | 157.3 | 3.9 | 2.3 | |
Disclaimer/Publisher’s Note: The statements, opinions and data contained in all publications are solely those of the individual author(s) and contributor(s) and not of MDPI and/or the editor(s). MDPI and/or the editor(s) disclaim responsibility for any injury to people or property resulting from any ideas, methods, instructions or products referred to in the content. |
© 2024 by the authors. Licensee MDPI, Basel, Switzerland. This article is an open access article distributed under the terms and conditions of the Creative Commons Attribution (CC BY) license (https://creativecommons.org/licenses/by/4.0/).


