
Submitted:
21 November 2024
Posted:
26 November 2024
You are already at the latest version
Abstract
Background: Alzheimer's disease (AD) is a progressive brain disorder characterized by distinct stages. Although effective treatment varies based on the degree of severity, there lacks an efficient and noninvasive means of classifying stages of AD. Objectives: This work aimed to develop a clinically effective and generalizable deep-learning model that noninvasively classifies various stages of AD using magnetic resonance imaging (MRI) data. We propose a custom convolutional neural network (CNN) architecture to assess structural variations between AD stages, forming a new direction for Alzheimer's diagnostics. Methods: The dataset used to train the model consisted of MRI scans across four stages: NonDemented, VeryMildDemented, MildDemented, and ModerateDemented. We used extensive data augmentation techniques to address MRI variations and applied dropout and batch normalization layers to improve the model's generalizability. The CNN model consists of four convolutional blocks with pooling and regularization layers and dense layers for multi-class classification. We used early stopping and adaptive learning rate adjustments on a training set of 30,336 images and a validation set of 10,112 images, training the model over ten epochs. Results: The model achieved an overall test accuracy of 96.87% and a near-perfect specificity, precision, recall, and F1 score for each class. The area under the curve (AUC) values for the receiver operating characteristic (ROC) curves were 1.00 for all classes. Conclusion: The model's ideal and interpretable metrics suggest its clinical feasibility for early-stage AD monitoring, potentially improving patient outcomes.
Keywords:
Alzheimer’s disease
; deep learning
; CNN
; MRI
; classification model
1. Introduction
Alzheimer's disease (AD) is a brain disorder that accounts for approximately 60 to 70 percent of all dementia cases [1]. It affects 50 million people worldwide and is expected to reach 115 million by 2050 due to an aging population [2]. Symptoms include progressive cognitive decline and loss of language and habitual functioning, causing emotional and psychological strain on families of those with AD [3, 5]. Additionally, AD care takes financial tolls, generating $172 billion annually in the United States [3, 4].
Research suggests that AD's pathological processes occur years before clinical manifestation, making early AD detection and severity monitoring crucial for therapeutic intervention [6, 7]. Within the last decade, the integration of artificial intelligence and neuroimaging has shown promise in early AD diagnostics. Deep learning models have reported accuracies above 90% in classifying individuals as healthy or having AD [10, 11]. A deep learning framework in one study identified prodromal AD with 94.5% accuracy using structural magnetic resonance imaging (MRI) [11]. Similarly, another study utilized multi-modality cascaded CNNs and MRI and PET data to diagnose AD with 92.3% accuracy [12].
Several limitations exist, however, regarding the clinical application of such algorithms. These seemingly high accuracies usually stem from model bias in their training set. Additionally, the small and homogenous nature of datasets like the Alzheimer's Disease Neuroimaging Initiative (ADNI) prevents model generalizability to actual patient data. A study supported this by reporting a drop of 15% in deep learning model accuracy upon application to external data [13].
Furthermore, MRI quality and preprocessing significantly dictate the accuracy of deep learning models. For instance, one study showed that variations in MRI acquisition protocols result in poor model performance, as low as 70% accuracy, when trained on suboptimal data; moreover, deep learning models suffer from a lack of interpretability [10, 14, 15]. Many AD classifiers also provide minimal diagnoses; AD is a spectrum, however, necessitating different treatments depending on stage severity. Additionally, deep learning models require significant computational resources that are likely unavailable in clinical settings and extensive unlabeled data that is difficult to obtain [16, 17, 18].
To address these issues, we developed a novel convolutional neural network (CNN) framework trained upon a vast set of augmented magnetic resonance imaging data. The proposed model classifies brain MRI images into four relevant stages of AD: VeryMildDemented, MildDemented, ModeratelyDemented, and NonDemented.
2. Materials and Methods
2.1. Dataset Description
We obtained the initial AD dataset from the Kaggle website, available online: https:// www.kaggle.com/datasets/tourist55/alzheimers-dataset-4-class-of-images (accessed on 14 April 2024) [25]. It provides high-quality MRI scans organized into four classes representing distinct AD stages: VeryMildDemented, MildDemented, ModerateDemented, and NonDemented. Such structured categorization allowed us to take a multi-stage classification approach, as is required for early AD detection and progression monitoring [25]. Figure 1 shows image samples from each class, while Figure 2 shows augmented data samples and our implementation process to address class imbalances and issues with data homogeneity.
The original dataset consisted of 6410 images with the following class distributions: 896 in MildDemented, 2,240 in VeryMildDemented, 64 in ModerateDemented, and 3,210 in NonDemented. The number of ModerateDemented images in our dataset was limited, presenting a significant class imbalance that could influence the model’s performance in classifying less-represented classes. We implemented an extensive data augmentation strategy to address this, generating a balanced training dataset called AugmentedAlzheimerDataset with 34,014 images evenly distributed between classes, as shown in Figure 3 [26].
We expanded the dataset to cover a broader range of imaging variations by applying the following transformations: rotations from ±15° to ±30°, improving model applicability to multiple imaging angles; horizontal and vertical flipping, increasing spatial diversity to preserve diagnostic relevance while maintaining the brain's symmetrical properties; zooming and cropping to see features at varying scales; and brightness and contrast adjustments, mimicking natural imaging variations [27].
The final image distribution in the augmented training dataset was 6,464 in ModerateDemented, 8,960 in MildDemented, 9,630 images in NonDemented, and 8,960 in VeryMildDemented. These augmentations provided a vital balance that helped the model learn each class accurately.
2.2. Data Splitting and Balancing
In order to preserve robust model performance across all AD stages, we divided the augmented dataset into subsets for training, validation, and testing. The training set had 30,336 images, the validation set had 10,112 images, and the testing set had 1,280 images. The resulting allocation preserved a 75% to 25% ratio between the training and validation sets while setting aside the test dataset, which served as a gold standard for assessing model performance without bias. By maintaining a proportional representation of each subset's four AD classes, we ensured the model had a balanced distribution of AD stages during training and validation.
2.3. Model Architecture
Figure 4 shows the proposed architecture, having four convolutional neural network (CNN) layers designed to capture spatial hierarchies present in the MRI images of various AD stages. All convolutional layers are followed by max pooling, batch normalization, and dropout layers, helping the model converge and regularize well. At each convolutional layer, we applied batch normalization to normalize layer inputs and stabilize the learning process. We then applied dropout rates between 0.2 and 0.3 to smoothen the gradient and reduce overfitting [28].
The model architecture begins feature extraction using a Conv2D layer with 32 filters, kernel size (3, 3), ReLU activation, he_normal initialization, and L2 regularization (0.001), proceeded by a dropout layer with 0.55 probability, optimizing initial feature recognition as shown in Figure 3. As the model progresses to the second and third blocks, it increases filter counts from 64 to 128 while maintaining its kernel size, activation, and initialization strategy to increase feature extraction depth. Each block contains a max pooling operation to downsample feature maps and dropout layers of rates 0.2 or 0.3 to prevent overfitting.
To further expand the model's feature learning capacity, the final convolutional block uses 256 filters. ReLu activation flattens multi-dimensional feature maps, and the output is fed into a dense layer of 16 units, regularized with L2 regularization, and normalized using batch normalization to force training consistency. The SoftMax-activated output layer consists of four units, each producing a probability distribution over the four AD stages (NonDemented, VeryMildDemented, MildDemented, and ModerateDemented). The model has 406,868 parameters (Trainable: 405,876; Non-trainable: 992). This architecture successfully merges feature extraction, regularization, and stabilization methods to improve accuracy and generalizability in AD stage prediction using MRI data.
2.4. Training and Hyperparameters
We used an Adam optimizer for parameter optimization, combining the benefits of momentum and adaptive learning rates [29]. We used estimates of the gradients’ first and second moments to update the parameter θ. The update rule for each parameter θ is:
where η denotes the learning rate, and are bias-corrected estimates of the mean and uncentered variance of the gradients, and ε is a small constant to prevent division by zero.
Additionally, we included L2 regularization in the convolutional and dense layers to control overfitting. L2 regularization penalizes large weights by adding a regularization term to the loss function:
where λ is the regularization parameter, and represents the network’s weights. Constraining the weight values prevents the model from becoming overly complex.
We applied early stopping to monitor validation loss during training. Training stopped early when the validation loss did not improve over a set patience interval, saving the best weights. ReduceLROnPlateau dynamically reduced the learning rate by 0.2, a patience level of 3, and a minimum learning of 0.0001 once the validation loss plateaued.
2.5. Model Training and Validation Performance
We trained the model over ten epochs and evaluated its performance using validation metrics after every epoch. Effective validation monitoring ensured model generalization and enabled us to optimize learning rates and prevent data overfitting.
We analyzed model performance using accuracy, precision, recall, F1 score, specificity, ROC, and a confusion matrix. These metrics are an all-inclusive measure of the model’s capability to accurately classify each AD stage and differentiate them from other classes. Each metric is defined and computed as follows:
where TP is true positive, TN is true negative, FP is false positive, and FN is false negative.
As shown in Figure 4, the model learned robustly and generalized well over ten epochs after training on 30,336 images and being validated on 10,112 images. The model’s training accuracy drastically increased from 56.71%% to 88.69%%, showing evidence of feature extraction optimization in each phase. The steadily declining initial training loss of 1.7950 to 0.7889 demonstrates the model’s ability to minimize classification errors across AD stages, as shown in Figure 5 (A) and (B).
We further confirmed the model’s optimization using validation accuracy, which improved from 68.22% in the first epoch to 94.32% in the last, and validation loss, going down from 1.3656 to 0.6496, as shown in Figure 6. This inverse trend indicates that the model’s parameters were optimally tuned while also reflecting the model’s robustness in multi-class classification.
3. Results
The model demonstrated a robust test accuracy of 96.87%, effectively distinguishing MRI data across the four diagnostic categories: VeryMildDemented, MildDemented, ModerateDemented, and NonDemented. The model exhibited specificities of 100%, 100%, 95%, and 100% for each of the MildDemented, ModerateDemented, NonDemented, and VeryMildDemented classes, respectively.
The classification report in Figure 7 comprehensively analyzes the model's performance with a precision, recall, and F1 score for each class. For MildDemented, the model obtained a precision, recall, and F1-score of 99%. ModerateDemented obtained a precision, recall, and F1-score of 100%. For NonDemented, the model's precision, recall, and F1-score were 95%, 100%, and 97%, respectively. For VeryMildDemented, the model obtained a precision, recall, and F1-score of 99%, 92%, and 95%, respectively.
The confusion matrix in Figure 8 shows how true and predicted classification labels were distributed, providing insight into the model’s error pattern. The model misclassified three cases of NonDemented as VeryMildDemented and a few VeryMildDemented as NonDemented.
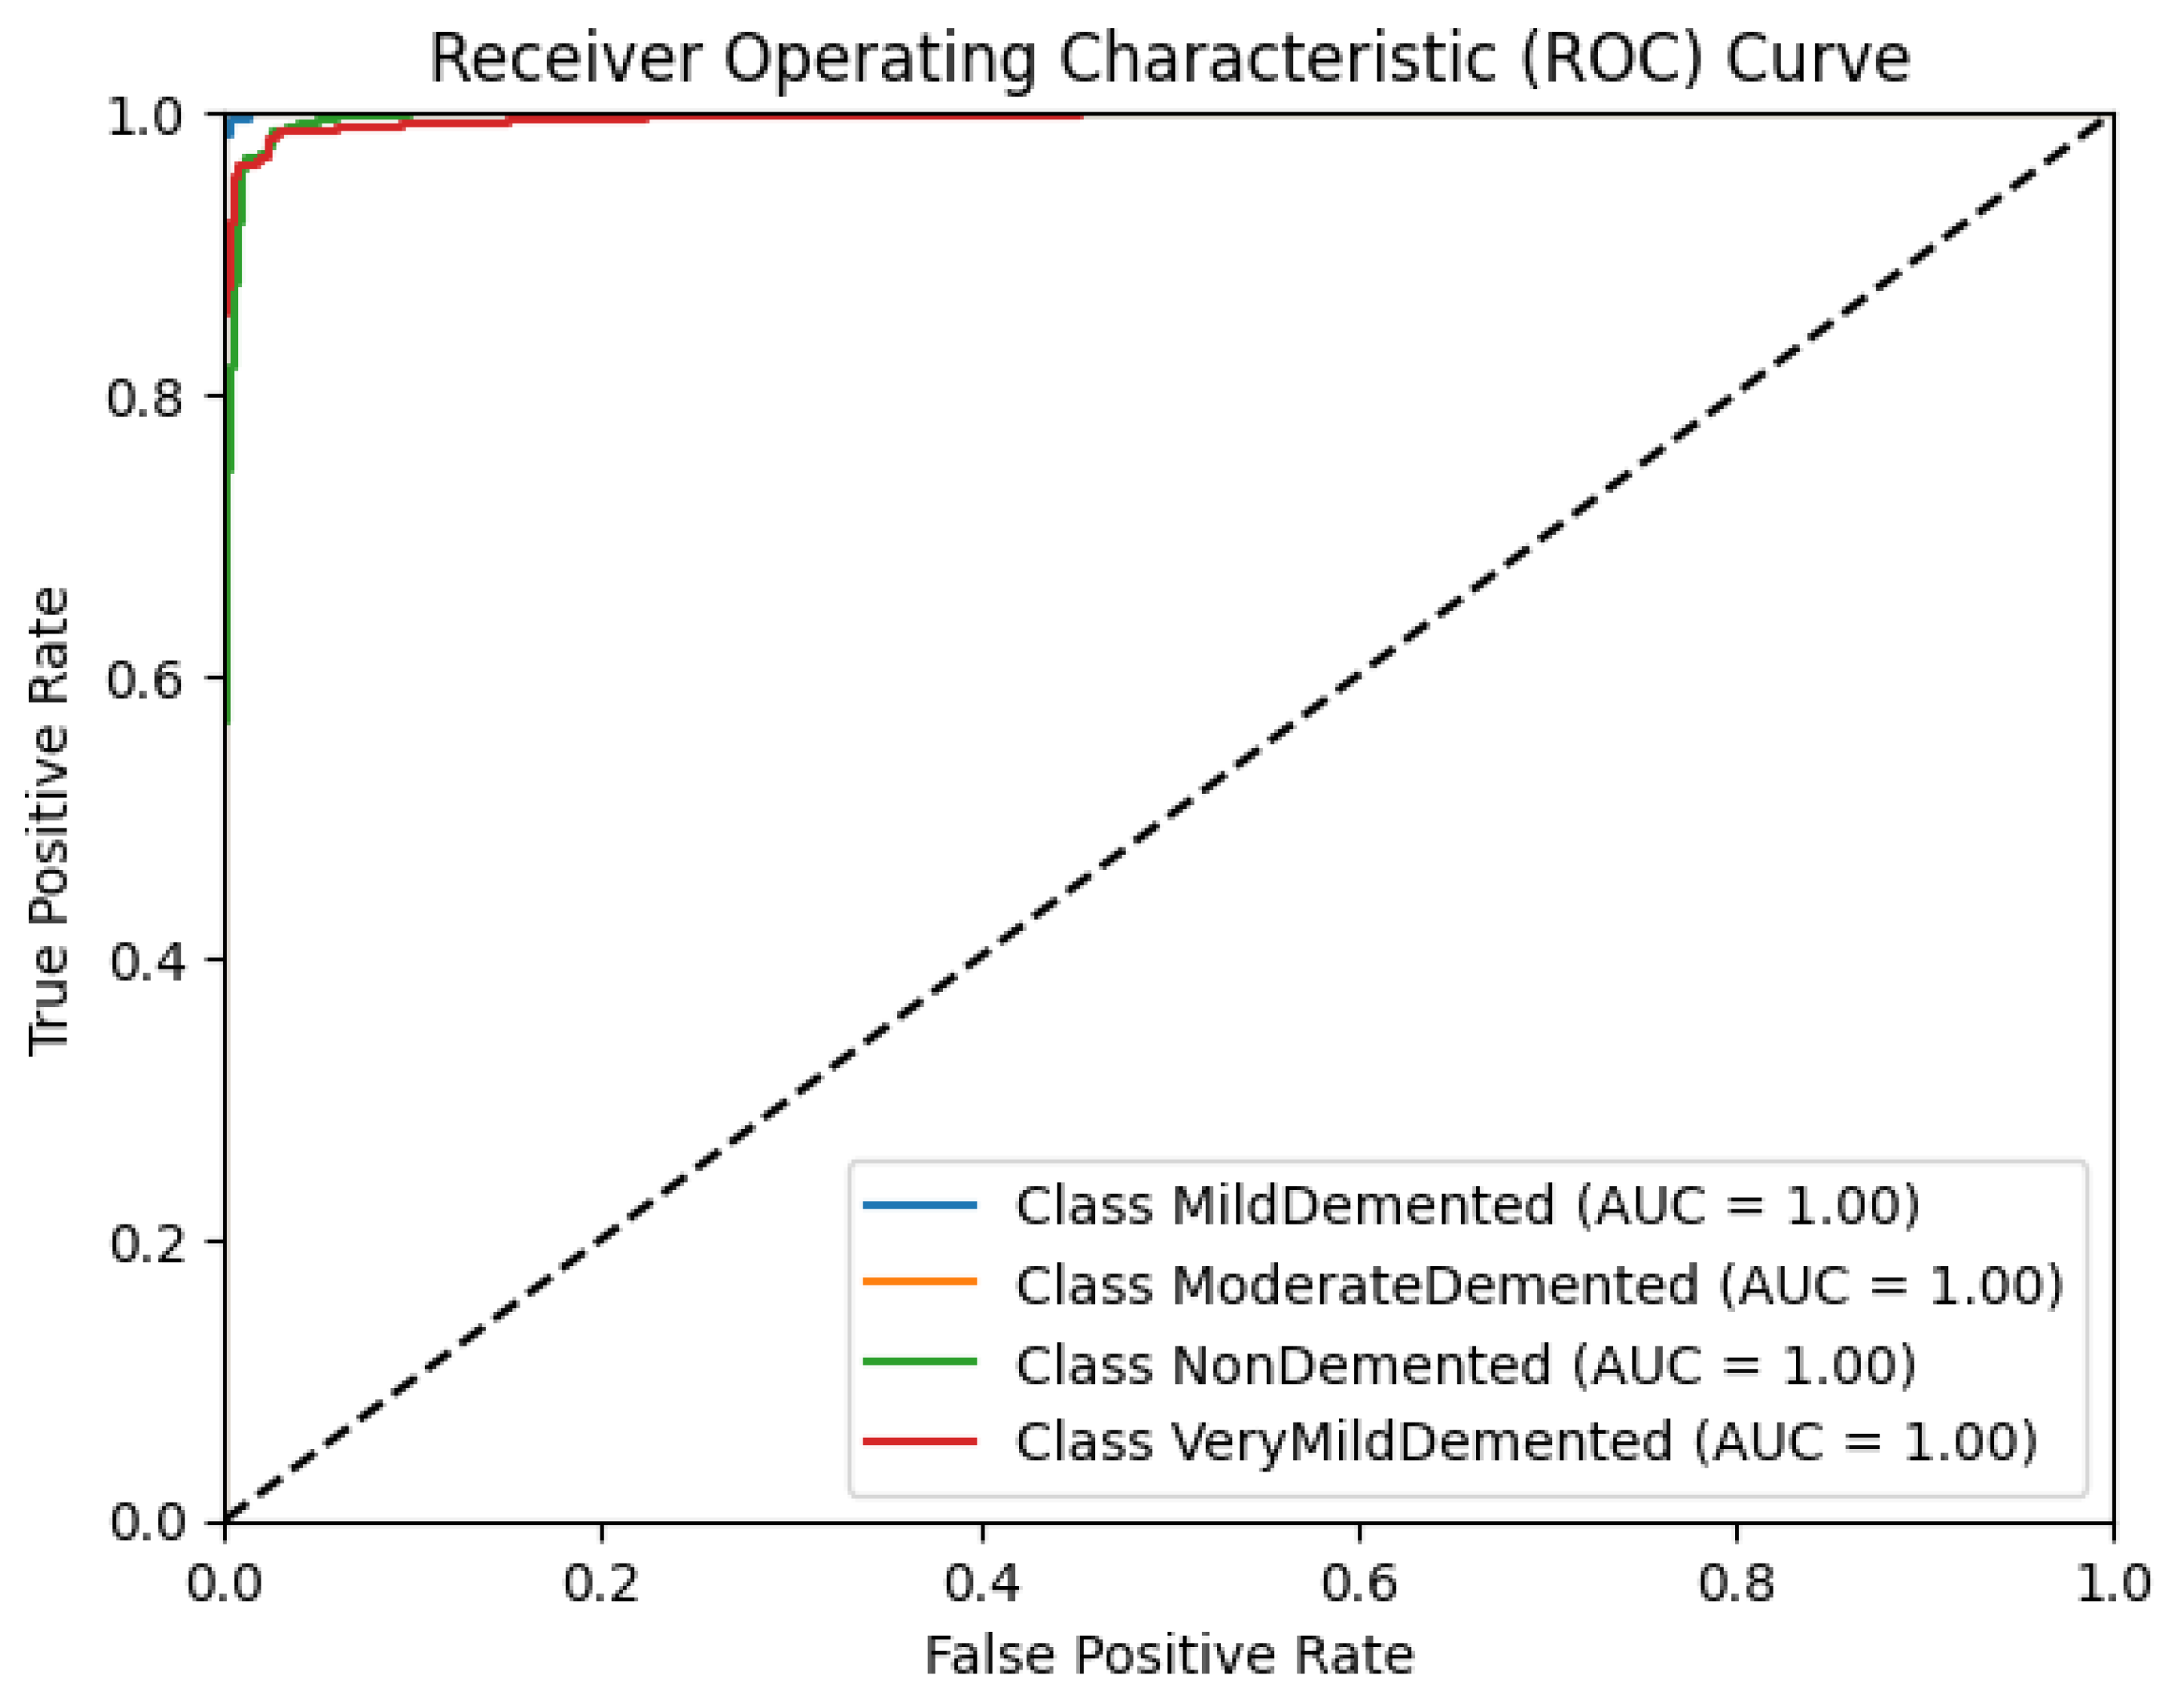
Figure 9 shows the model's receiver operating characteristic (ROC) curves. The area under the ROC curve (AUC) values obtained for this model were 1.00 for all classes.
4. Discussion
Early detection of AD is becoming increasingly imperative within an aging population to help develop effective intervention strategies that are low-cost, noninvasive, and feasible based on stage and severity. Over the past decade, researchers have explored deep-learning methods to achieve this. However, many stay theoretical due to low-performance metrics and a lack of vast and diverse data that make such models clinically unfeasible. Additionally, it seems that model accuracy is often sacrificed when it comes to multi-class classification. Our study addresses these concerns and proposes a novel, robust, and highly accurate model that can be clinically applied to guide Alzheimer's treatment and intervention.
Our model achieved a test accuracy of 96.87%, suggesting that it is excellent at classifying MRI scans into the four essential diagnostic categories: VeryMildDemented, MildDemented, ModerateDemented, and NonDemented. To ensure clinical feasibility, we holistically assessed the model using precision, recall, and F1 scores at the class level, as nuances often detract from the significance of testing accuracy. Precision scores in each class were all within 5% of 100% (99% for MildDemented, 100% for ModerateDemented, 95% for NonDemented, and 99% for VeryMildDemented), suggesting that the ratio of true positives to the total positives the model predicted within each class was near perfect and that the model performed exceptionally well at correctly differentiating AD stages within each class. Recalls of MildDemented, ModerateDemented, and NonDemented classes were 99%, 100%, and 100%, respectively, indicating that the model rarely mislabeled an MRI scan of a particular AD stage outside of its accurate categorization, as recall represents the ratio of true positives to true positives and false negatives. This value was slightly lower for the VeryMildDemented class at 92%; however, metric scores above 90% typically yield clinical significance.
These deviations were consolidated by extremely high F1 scores for each class, being 99%, 100%, 97%, and 95% for MildDemented, ModerateDemented, NonDemented, and VeryMildDemented, respectively. The F1 score represents the harmonic mean of precision and recall; in other words, a high F1 score indicates high precision and recall. F1 scores within 5% of 100% indicate that the model suffered no imbalance classification problems, which we dealt with through extensive data augmentation accounting for MRI variations, and thus can generalize to new patient data outside the training dataset, increasing its clinical applicability. Regarding the model’s error pattern, the confusion matrix displays relatively low misclassification rates, indicative of the model’s robust distinguishing power between stages. AUC values for each class's ROC graph were 1.00, with a steep ascent towards the top left corner, showing the model’s ability to capture true positives with a minimum number of false positives at all thresholds. Specificities for MildDemented, ModerateDemented, NonDemented, and VeryMildDemented classes were 100%, 100%, 95%, and 100%, respectively, indicating the model’s ability to predict near perfectly when a particular stage did not belong to another category. This is imperative when categorizing new patient MRI data and determining effective treatments and interventions based on resultant classification.
Furthermore, due to MRI's noninvasive nature, the model proves to be a low-cost AD screening tool in at-risk populations.
One limitation of the model regards its need for more diversity. Brain structure is influenced by age, genetic predisposition, and environmental variables, among other factors. Although we may have accounted for MRI acquisition variation, a model trained on a single population may exhibit a bias toward the population it was trained upon, preventing it from generalizing to others [30]. Researchers can implement data from demographically disparate populations to address this, although that may be difficult to obtain. Additionally, although brain changes visible on MRI may help determine AD severity, other biomarkers in blood, cerebrospinal fluid (CSF), and electroencephalography may add helpful context, especially in early stages where MRI changes can be minimal [31, 32, 33, 34].
Future work can combine this model with other diagnostic methods, such as MRI with blood proteins and CSF measurements, to improve diagnostic accuracy and application in early-stage AD detection [33]. Researchers can achieve model generalizability to diverse populations by using various datasets, tuning hyperparameters accordingly [36, 37, 38]. In addition, they may improve the model’s clinical value by introducing explainable AI (XAI) techniques (Lin et al., 2022). Knowing which brain regions or features are most important to a classification decision would guide clinician understanding and would help increase confidence in model outputs [39], [40].
5. Conclusions
In this study, we developed a highly accurate, multi-class deep learning model to classify stages of AD on MRI data. The model achieved a test accuracy above 96.87 % and high sensitivity, specificity, precision, and F1 scores across all classes, proving to be one of the most accurate and reliable multi-class classification models to date. The model's robust design and convolutional layers with dropout and batch normalization made it possible to train despite significant class imbalances. Additionally, our data augmentation technique allowed us to extensively address MRI variations, vastly increasing the model's generalizability and, thus, its clinical applicability. These advancements imply that the model’s potential to act as an early AD detection and monitoring tool, given that diagnosing and monitoring can be of paramount importance to establish better patient outcomes.
Additionally, including MRI, a readily available, non-invasive imaging modality, suggests that the model may be feasibly adopted into routine screening of at-risk populations. Future research should validate this approach with independent, cross-population data and combine other diagnostic modalities, e.g., EEG and fluid biomarkers, to increase diagnostic relevance. Implications for longitudinal care and the design of stage-specific interventions in managing AD can be established through clinical trials testing our model's predictive power in real-world settings.
Supplementary Materials
The following supporting information can be downloaded at the website of this paper posted on Preprints.org, Code used for data preprocessing, model training, and evaluation may be sent upon request to promote transparency and reproducibility according to institutional and ethical permissions. This includes scripts for augmenting the MRI dataset, configuring the architecture of the convolutional neural network, and applying performance metrics for classification: classification reports, confusion matrices, ROC, and precision-recall curve generation.
Author Contributions
Conceptualization, Pavan Nathani; Data curation, Anikait Bharadwaj; Formal analysis, Anikait Bharadwaj; Investigation, Pavan Nathani; Methodology, Pavan Nathani; Validation, Pavan Nathani; Writing – original draft, Pavan Nathani; Writing – review & editing, Anikait Bharadwaj.
Funding
This research received no external funding.
Institutional Review Board Statement
Not applicable.
Informed Consent Statement
Not applicable.
Data Availability Statement
The data presented in this study is available upon request from the corresponding author.
Acknowledgments
We acknowledge “tourist55” on Kaggle for providing the "Alzheimer's Dataset - 4 Class of Images," which was a valuable resource for our research on Alzheimer's disease classification.
Conflicts of Interest
The authors declare no conflicts of interest.
References
- J. Cummings, R. Reynders, and K. Zhong, “Globalization of Alzheimer’s disease clinical trials,” Alzheimer’s Res. Amp Ther., vol. 3, no. 4, p. 24, 2011. [CrossRef]
- M. Ramadan, “Temporal patterns of the burden of Alzheimer’s disease and their association with <scp>Sociodemographic</scp> Index in countries with varying rates of aging 1990–2019,” AGING Med., vol. 6, no. 3, pp. 281–289, 2023. [CrossRef]
- M. Vu, R. Mangal, T. Stead, C. Lopez-Ortiz, and L. Ganti, “Impact of Alzheimer’s Disease on Caregivers in the United States,” Health Psychol. Res., vol. 10, no. 3, 2022. [CrossRef]
- P. Lewczuk, M. Łukaszewicz-Zając, P. Mroczko, and J. Kornhuber, “Clinical significance of fluid biomarkers in Alzheimer’s Disease,” Pharmacol. Rep., vol. 72, no. 3, pp. 528–542, 2020. [CrossRef]
- D. C. Matthews et al., “Racial and ethnic estimates of Alzheimer’s disease and related dementias in the United States (2015–2060) in adults aged ≥65 years,” Alzheimers Dement., vol. 14, no. 10, pp. 1–10, 2018. [CrossRef]
- P. Porsteinsson, R. S. Isaacson, S. Knox, M. N. Sabbagh, and I. Rubino, “Diagnosis of early Alzheimer’s disease: Clinical practice in 2021,” J. Prev. Alzheimer’s Dis., vol. 8, no. 1, pp. 1–10, 2021. [CrossRef]
- R. A. Sperling et al., “Toward defining the preclinical stages of Alzheimer’s disease: Recommendations from the National Institute on Aging-Alzheimer’s Association workgroups on diagnostic guidelines for Alzheimer’s disease,” Alzheimers Dement., vol. 7, no. 3, pp. 1–10, 2011. [CrossRef]
- Y. Li, Y. Wang, A. C. Stokes, and D. J. Lundberg, “Global, regional, and national burden of Alzheimer’s disease and other dementias, 1990–2019,” Front. Aging Neurosci., vol. 14, pp. 1–10, 2022. [CrossRef]
- B. Winblad et al., “Defeating Alzheimer’s disease and other dementias: A priority for European science and society,” Lancet Neurol., vol. 15, no. 5, pp. 1–10, 2016. [CrossRef]
- J. Qiu, L. Li, Y. Liu, Y. Ou, and Y. Lin, “The Diagnosis of Alzheimer’s Disease: An Ensemble Approach,” in Fuzzy Systems and Data Mining VI, IOS Press, 2020, pp. 93–100.
- X. Feng, F. A. Provenzano, and S. A. Small, “Detecting prodromal Alzheimer’s disease with MRI through deep learning.” 2019. [CrossRef]
- M. Liu, D. Cheng, K. Wang, and Y. Wang, “Multi-Modality Cascaded Convolutional Neural Networks for Alzheimer’s Disease Diagnosis,” Neuroinformatics, vol. 16, no. 3–4, pp. 295–308, 2018. [CrossRef]
- D. Arya et al., “A systematic review on machine learning and deep learning techniques in the effective diagnosis of Alzheimer’s disease,” Brain Inform., vol. 10, no. 1, 2023. [CrossRef]
- Y. Lim et al., “Deep Learning Model for Prediction of Progressive Mild Cognitive Impairment to Alzheimer’s Disease Using Structural MRI,” Front. Aging Neurosci., vol. 14, 2022. [CrossRef]
- Aghaei, M. Ebrahimi Moghaddam, and H. Malek, “Interpretable ensemble deep learning model for early detection of Alzheimer’s disease using local interpretable model-agnostic explanations,” Int. J. Imaging Syst. Technol., vol. 32, no. 6, pp. 1889–1902, 2022. [CrossRef]
- S. Ahmed et al., “Ensembles of Patch-Based Classifiers for Diagnosis of Alzheimer Diseases,” IEEE Access, vol. 7, pp. 73373–73383, 2019. [CrossRef]
- Mohammed et al., “Multi-Method Analysis of Medical Records and MRI Images for Early Diagnosis of Dementia and Alzheimer’s Disease Based on Deep Learning and Hybrid Methods,” Electronics, vol. 10, no. 22, p. 2860, 2021. [CrossRef]
- Y. Jiang, “Application of Deep Learning and Brain Images in Diagnosis of Alzheimer’s Patients,” Trait. Signal, vol. 38, no. 5, pp. 1431–1438, 2021. [CrossRef]
- T. Jo, K. Nho, S. L. Risacher, and A. J. Saykin, “Deep learning detection of informative features in tau PET for Alzheimer’s disease classification,” BMC Bioinformatics, vol. 21, no. S21, 2020. [CrossRef]
- K. A. Kadhim, F. Mohamed, A. A. Sakran, M. M. Adnan, and G. A. Salman, “Early Diagnosis of Alzheimer’s Disease using Convolutional Neural Network-based MRI,” Malays. J. Fundam. Appl. Sci., vol. 19, no. 3, pp. 362–368, 2023. [CrossRef]
- G. Folego, M. Weiler, R. F. Casseb, R. Pires, and A. Rocha, “Alzheimer’s Disease Detection Through Whole-Brain 3D-CNN MRI,” Front. Bioeng. Biotechnol., vol. 8, 2020. [CrossRef]
- J. Hu, “Convolutional Neural Networks for Alzheimer’s Disease.” 2023. [CrossRef]
- E. Ocasio and T. Q. Duong, “Deep learning prediction of mild cognitive impairment conversion to Alzheimer’s disease at 3 years after diagnosis using longitudinal and whole-brain 3D MRI,” PeerJ Comput. Sci., vol. 7, p. 560, 2021. [CrossRef]
- M. Böhle, F. Eitel, M. Weygandt, and K. Ritter, “Layer-Wise Relevance Propagation for Explaining Deep Neural Network Decisions in MRI-Based Alzheimer’s Disease Classification,” Front. Aging Neurosci., vol. 11, 2019. [CrossRef]
- Dubey, “Alzheimer’s Dataset (4 Class of Images).” Kaggle. https://www.kaggle.com/datasets/tourist55/alzheimers-dataset-4-class-of-images, 2023. Accessed: Apr. 14, 2024. [Online]. Available: https://www.kaggle.com/datasets/tourist55/alzheimers-dataset-4-class-of-images.
- G. Ahmed et al., “DAD-Net: Classification of Alzheimer’s Disease Using ADASYN Oversampling Technique and Optimized Neural Network,” Molecules, vol. 27, no. 20, p. 7085, 2022. [CrossRef]
- Shorten and T. M. Khoshgoftaar, “A survey on Image Data Augmentation for Deep Learning,” J. Big Data, vol. 6, no. 1, 2019. [CrossRef]
- B. Tufail et al., “On Disharmony in Batch Normalization and Dropout Methods for Early Categorization of Alzheimer’s Disease,” Sustainability, vol. 14, no. 22, p. 14695, 2022. [CrossRef]
- P. Kingma, “Adam: A method for stochastic optimization.” 2014.
- M. Howard et al., “The impact of site-specific digital histology signatures on deep learning model accuracy and bias,” Nat. Commun., vol. 12, no. 1, 2021. [CrossRef]
- M. Waser et al., “Neuroimaging markers of global cognition in early Alzheimer’s disease: A magnetic resonance imaging–electroencephalography study,” Brain Behav., vol. 9, no. 1, 2018. [CrossRef]
- P. M. Rossini et al., “Early diagnosis of Alzheimer’s disease: the role of biomarkers including advanced EEG signal analysis. Report from the IFCN-sponsored panel of experts,” Clin. Neurophysiol., vol. 131, no. 6, pp. 1287–1310, 2020. [CrossRef]
- Wang and Z. Xiao, “Current Progress on Assessing the Prognosis for Anti-N-Methyl-D-Aspartate Receptor (NMDAR) Encephalitis,” BioMed Res. Int., pp. 1–8, 2020. [CrossRef]
- C. Lei, X. Chang, H. Li, and L. Zhong, “Abnormal Brain MRI Findings in Anti-N-Methyl-D-Aspartate Receptor Encephalitis and Correlation With Outcomes,” Front. Neurol., vol. 13, 2022. [CrossRef]
- E. W. Steyerberg, “Validation in prediction research: the waste by data splitting,” J. Clin. Epidemiol., vol. 103, pp. 131–133, 2018. [CrossRef]
- Ahmed, T. P. Debray, K. G. Moons, and R. D. Riley, “Developing and validating risk prediction models in an individual participant data meta-analysis,” BMC Med. Res. Methodol., vol. 14, no. 1, 2014. [CrossRef]
- T. Takada et al., “Internal-external cross-validation helped to evaluate the generalizability of prediction models in large clustered datasets,” J. Clin. Epidemiol., vol. 137, pp. 83–91, 2021. [CrossRef]
- Diaz, S. M. Ruff, and T. M. Pawlik, “Racial, ethnic, and socioeconomic differences in hepatocellular carcinoma across the United States,” Hepatoma Res., 2024. [CrossRef]
- Q. Zhang, Y. N. Wu, and S.-C. Zhu, “Interpretable Convolutional Neural Networks,” in 2018 IEEE/CVF Conference on Computer Vision and Pattern Recognition, 2018. [CrossRef]
- Chaddad, J. Peng, J. Xu, and A. Bouridane, “Survey of Explainable AI Techniques in Healthcare,” Sensors, vol. 23, no. 2, p. 634, 2023. [CrossRef]
Figure 1.
(A) MildDemented brain MRI samples. (B) VeryMildDemented brain MRI samples. (C) ModerateDemented brain MRI samples. (D) NonDemented brain MRI samples.
Figure 1.
(A) MildDemented brain MRI samples. (B) VeryMildDemented brain MRI samples. (C) ModerateDemented brain MRI samples. (D) NonDemented brain MRI samples.
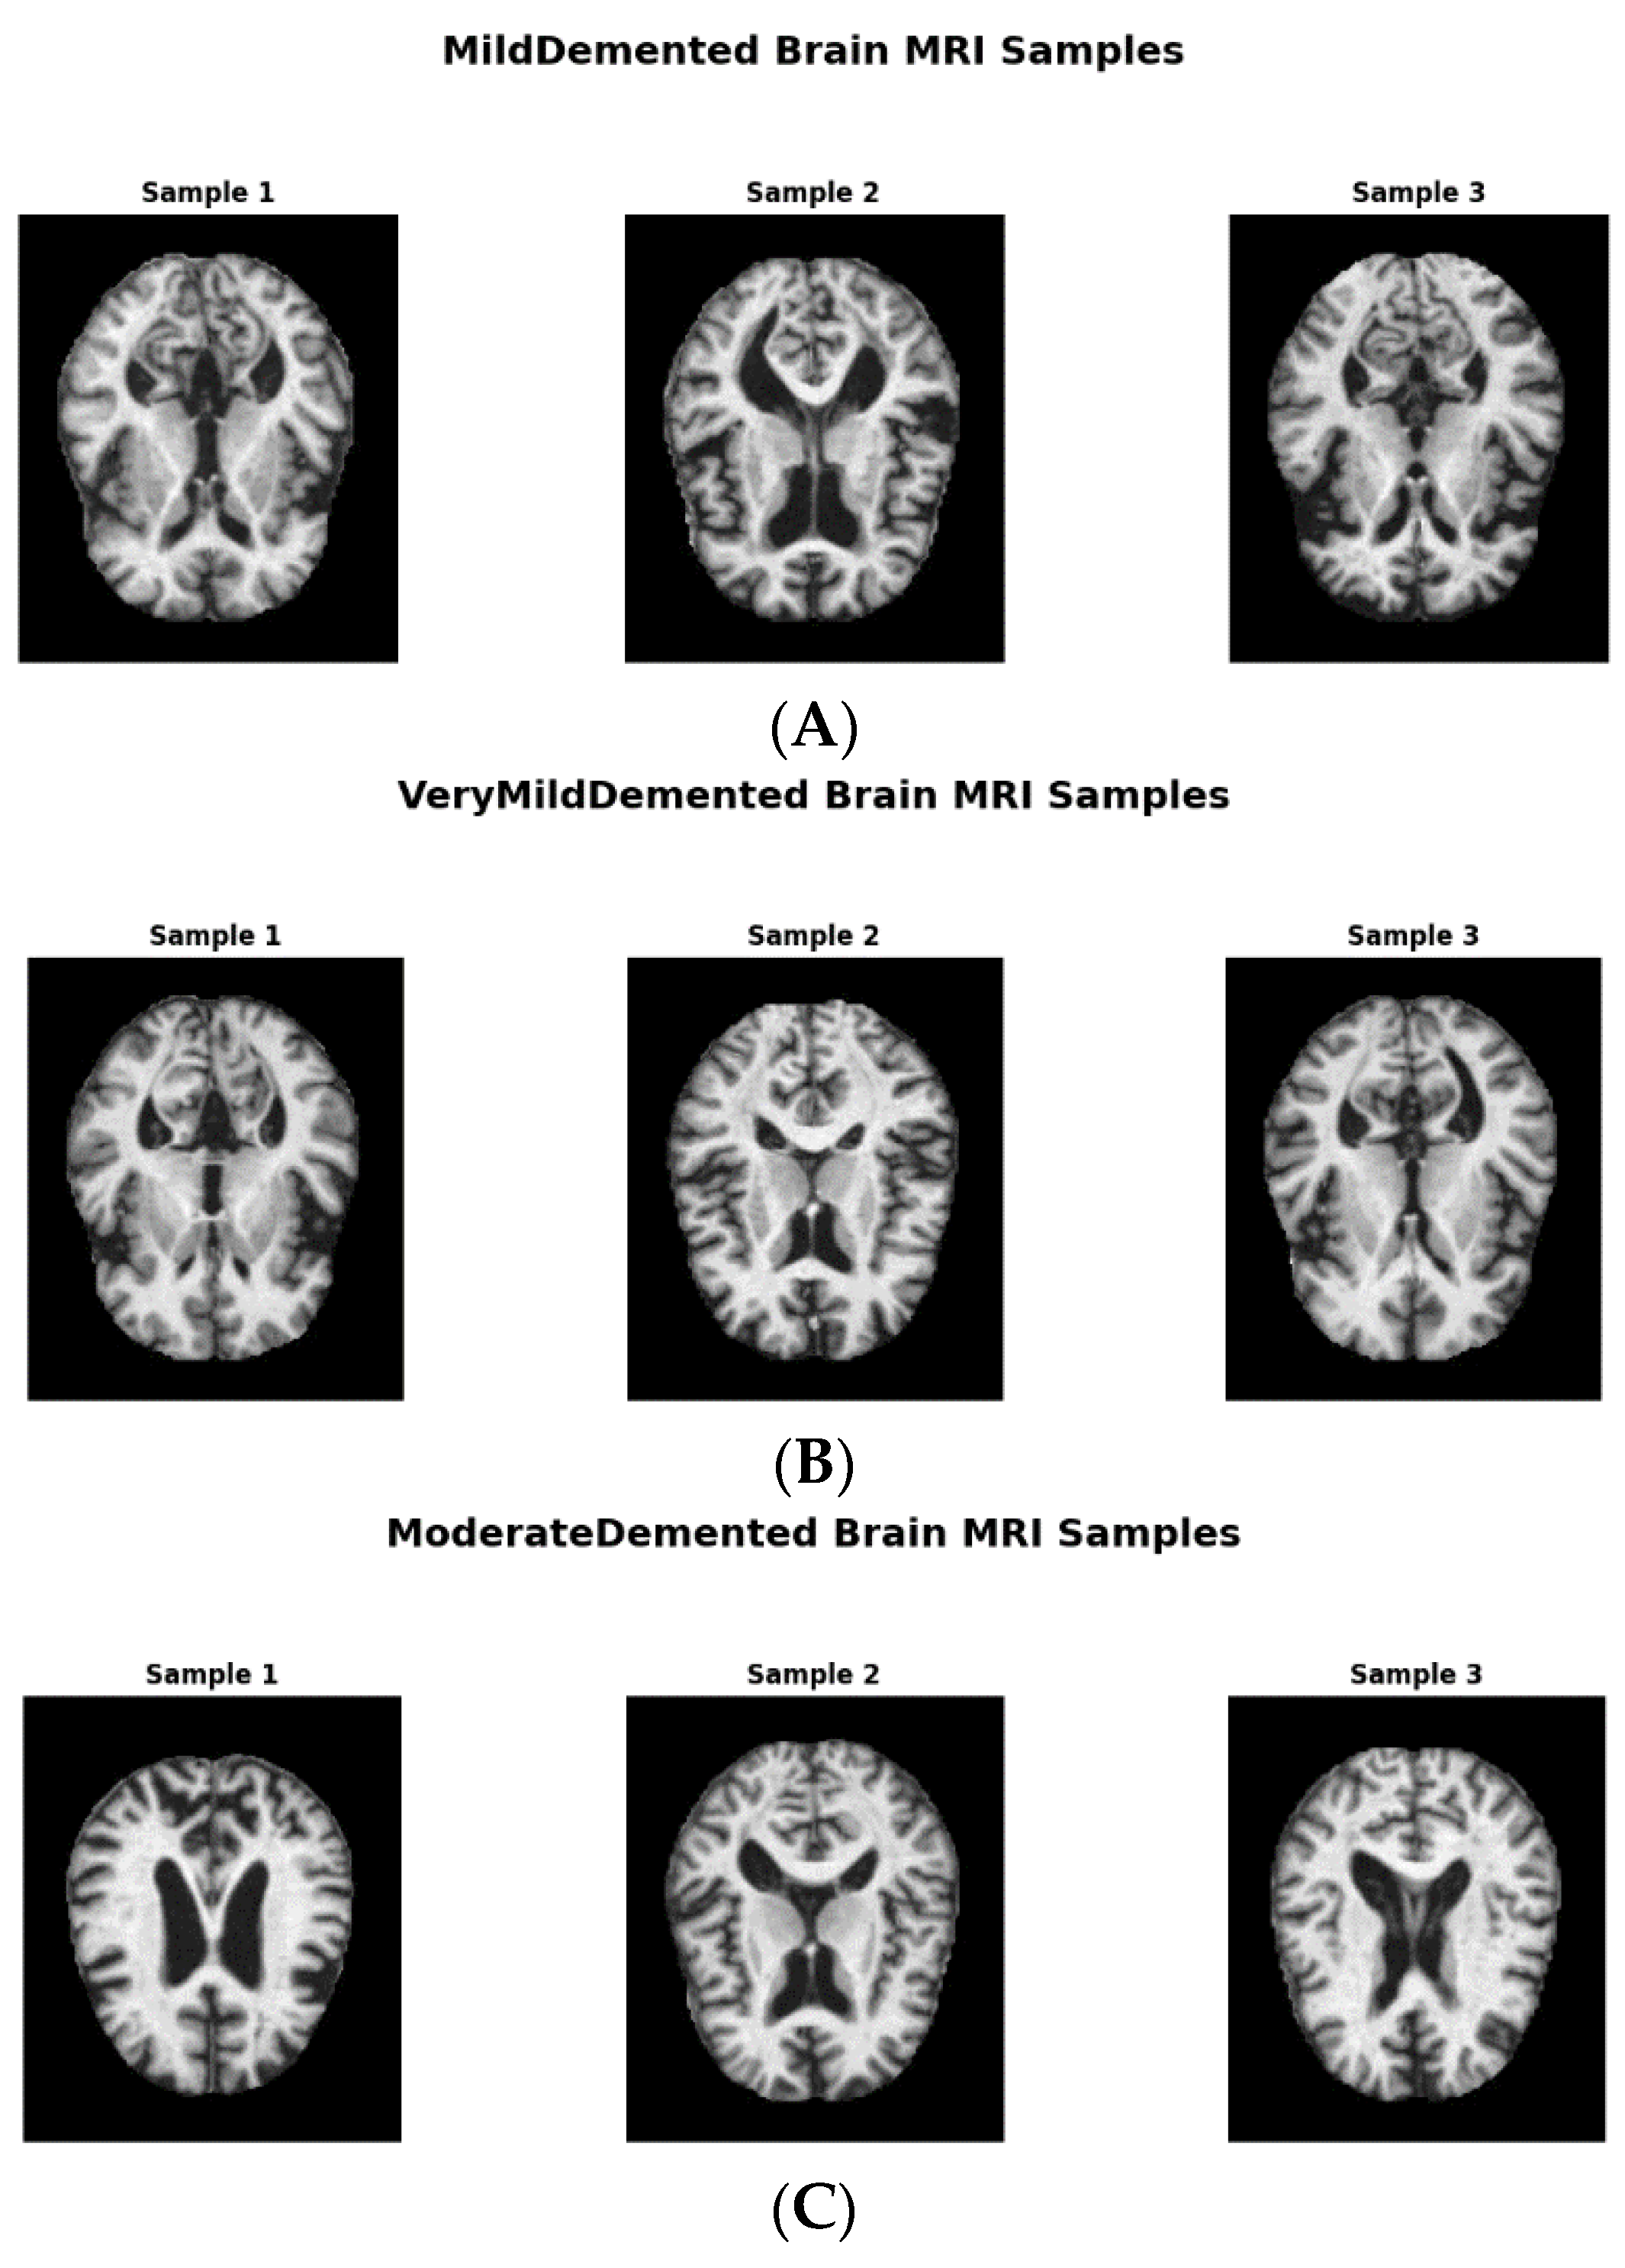
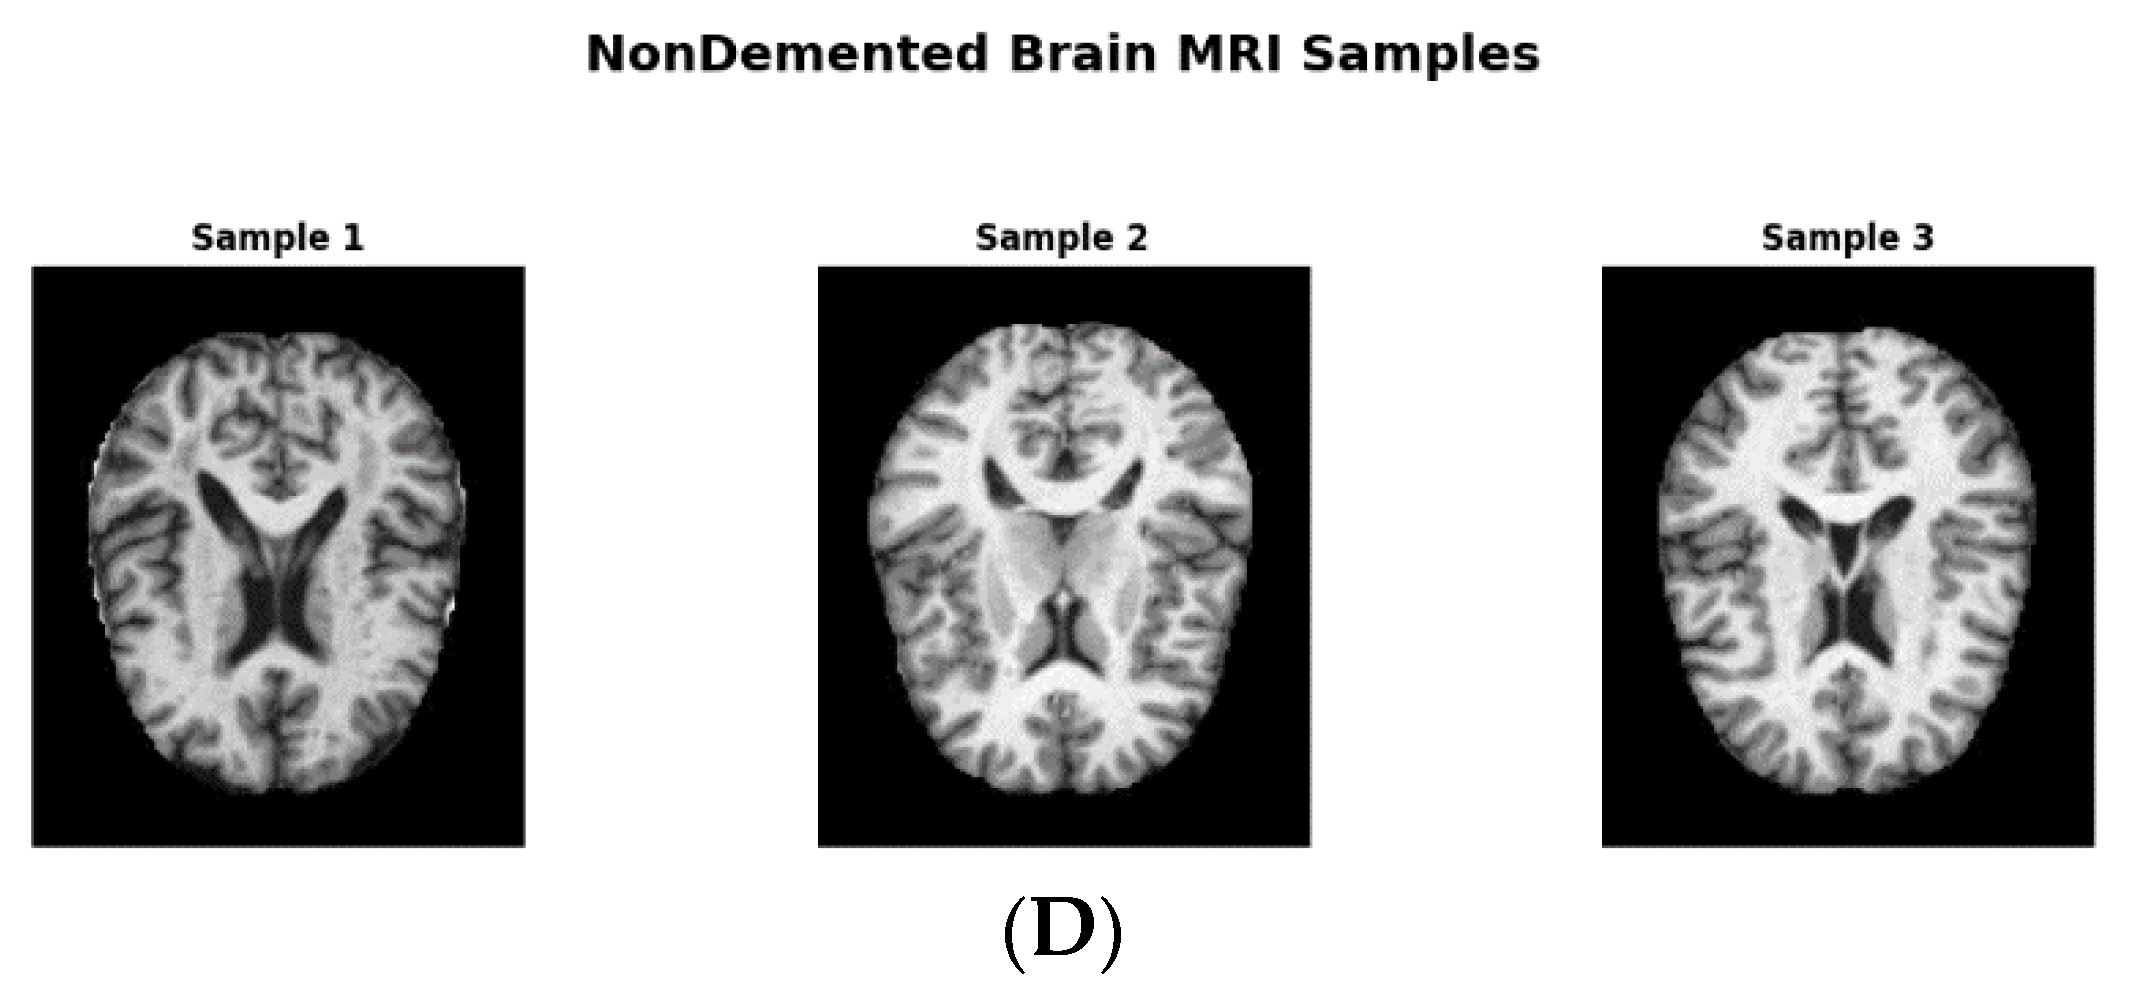
Figure 2.
(A) AugmentedMildDemented (B) AugmentedVeryMildDemented (C) AugmentedModerateDemented, (D) AugmentedNonDemented, and (E) implementation process.
Figure 2.
(A) AugmentedMildDemented (B) AugmentedVeryMildDemented (C) AugmentedModerateDemented, (D) AugmentedNonDemented, and (E) implementation process.
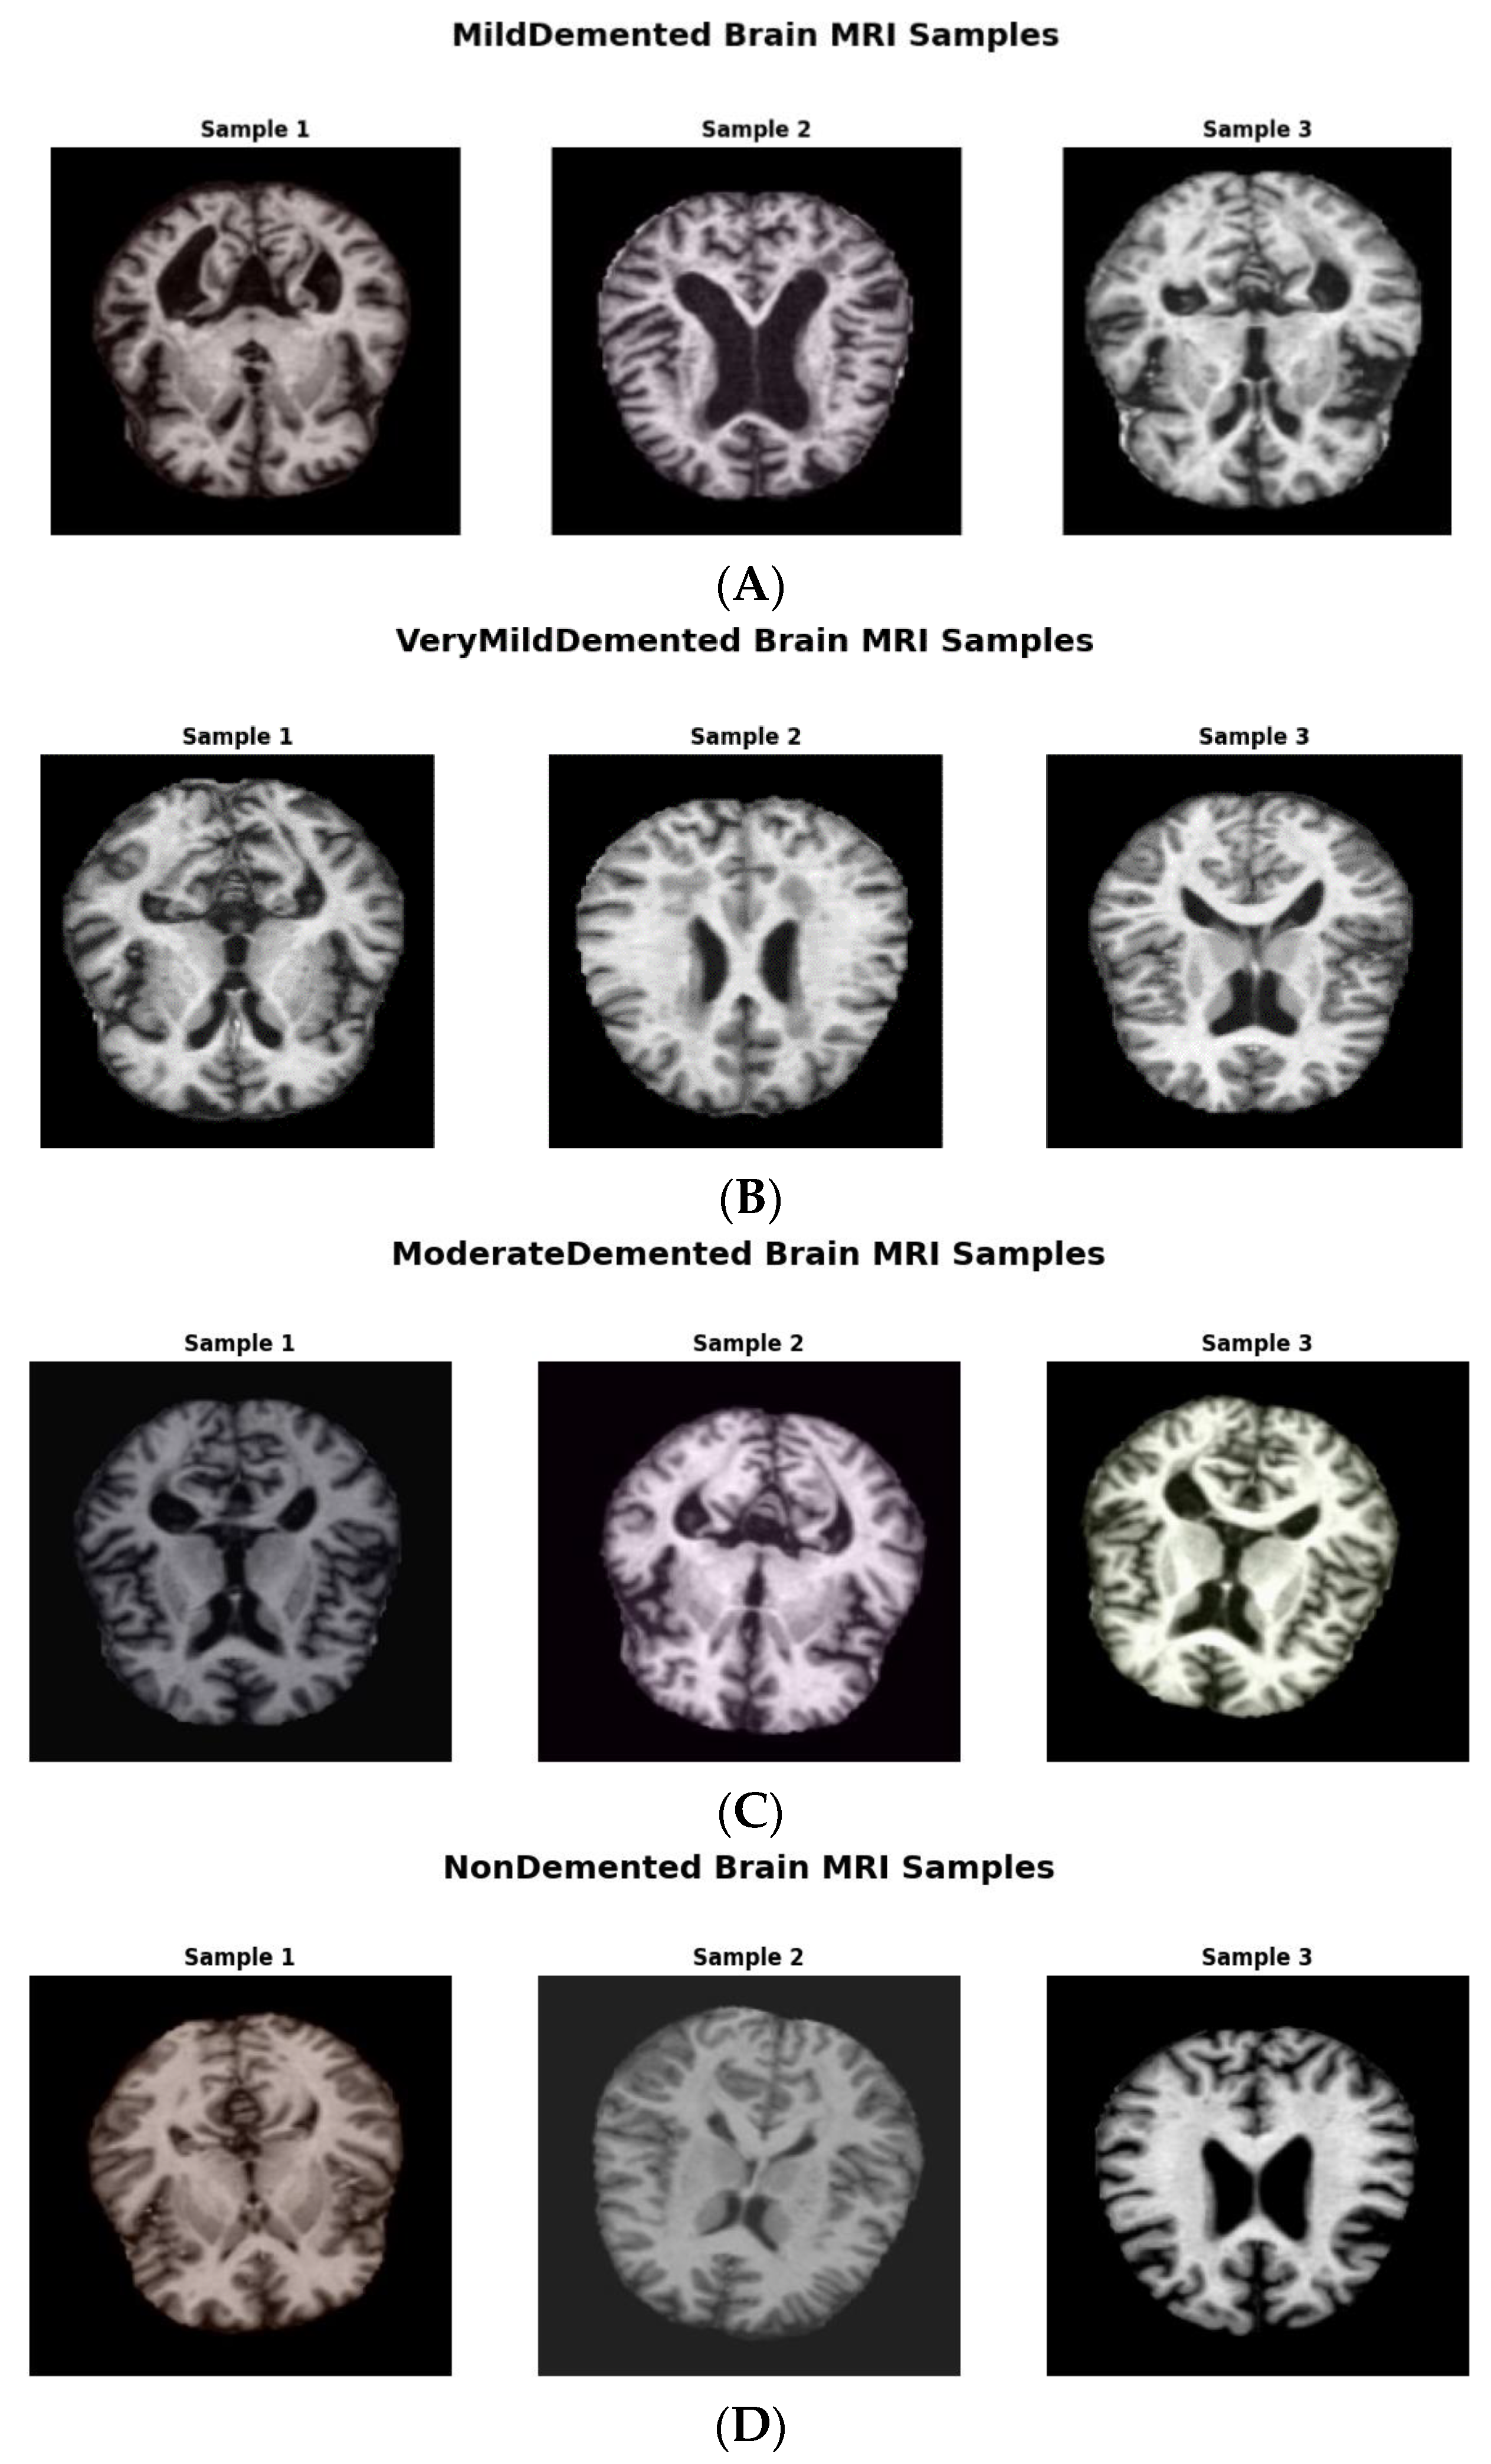
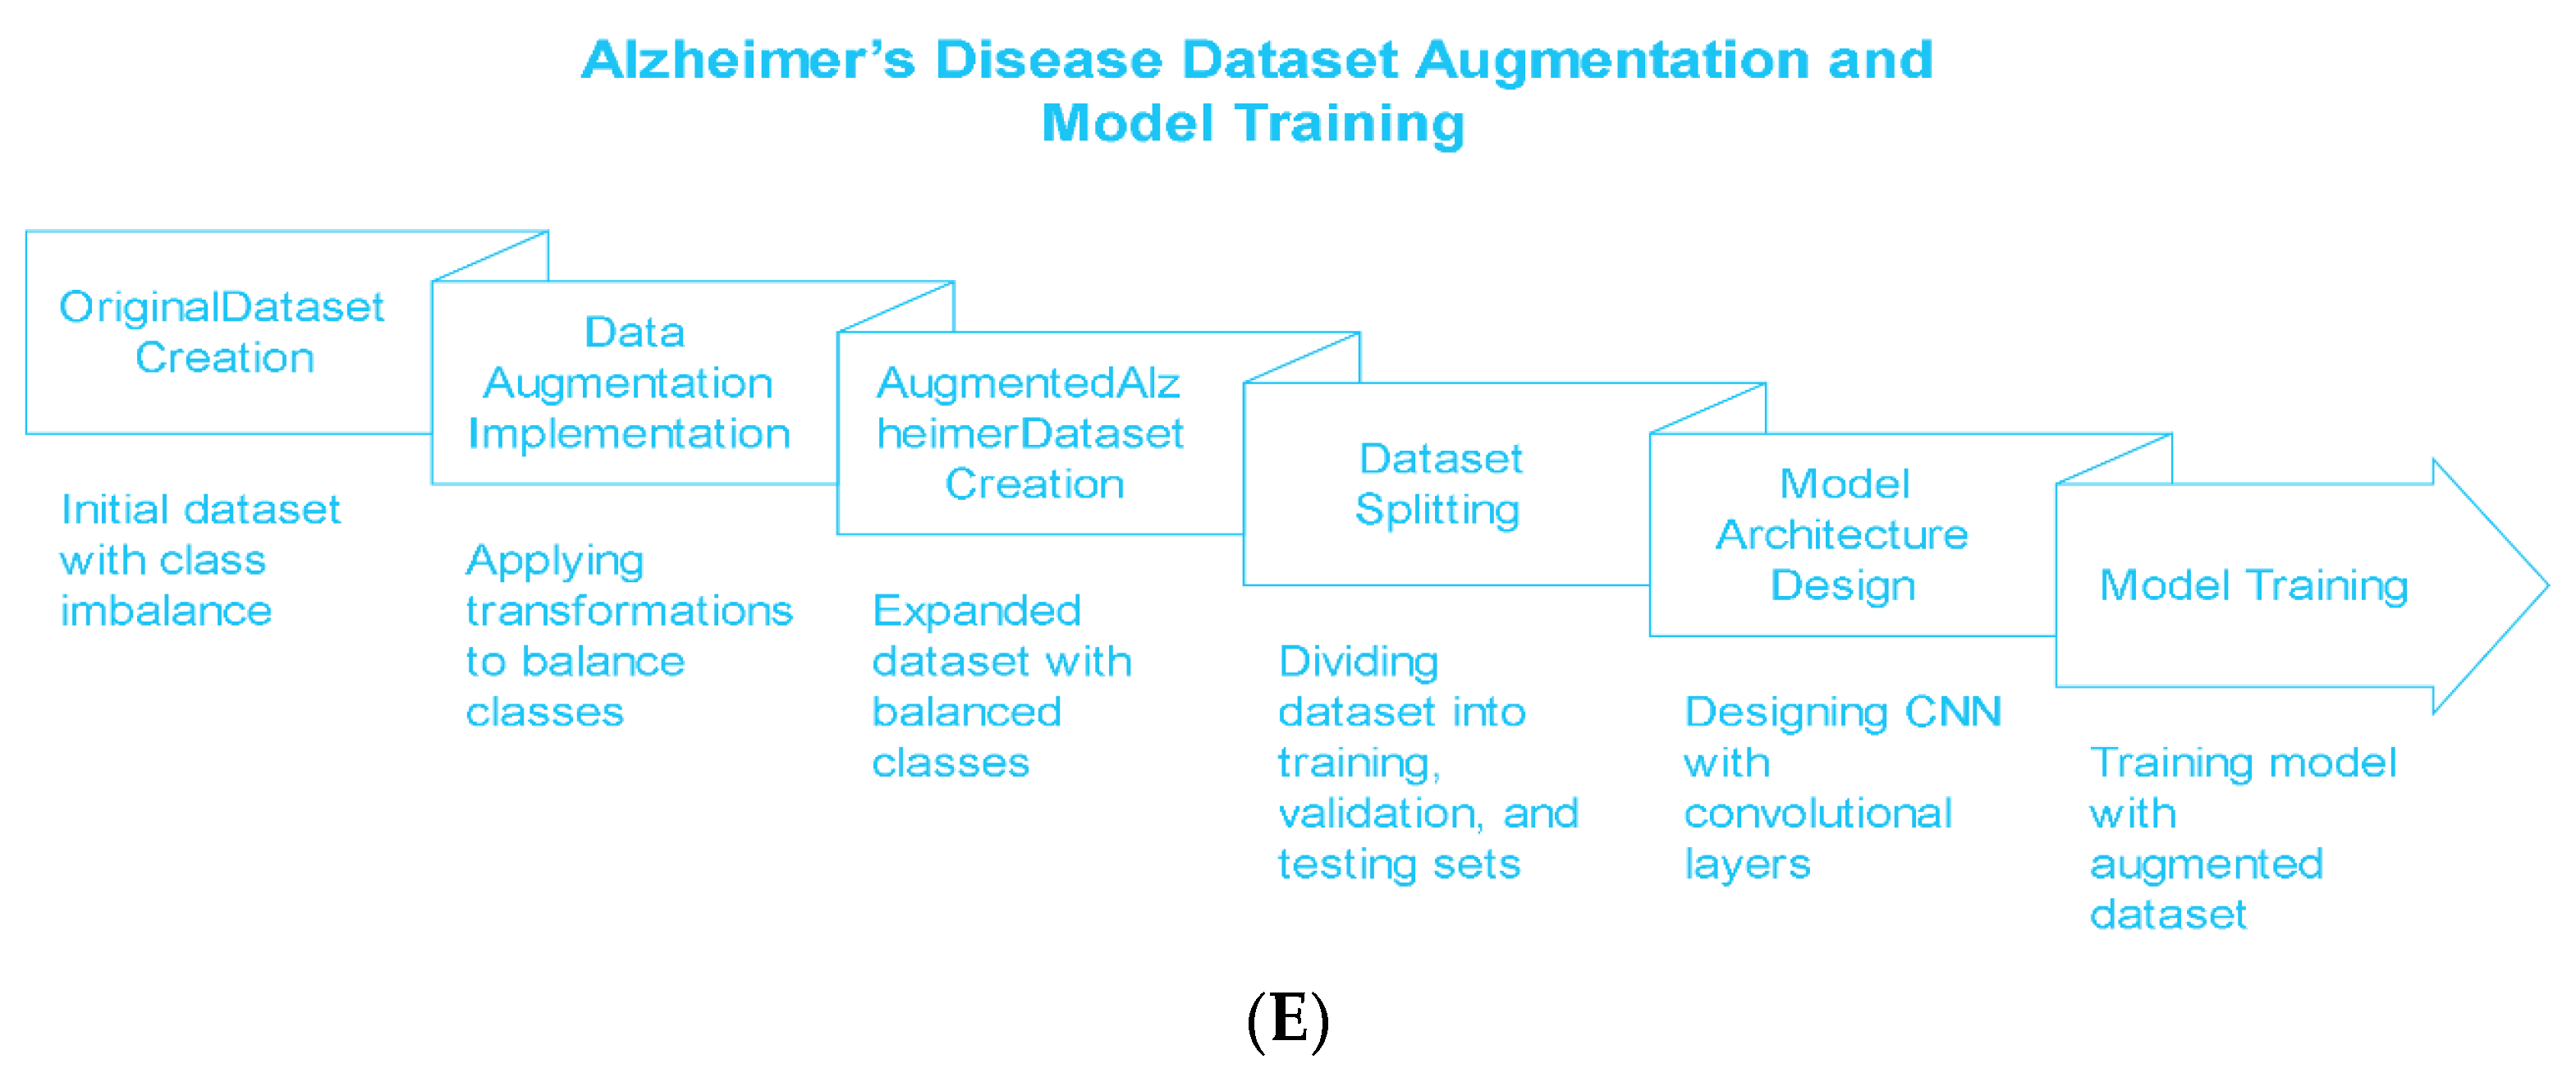
Figure 3.
Class distribution across train and test sets for AugmentedAlzheimerDataset.
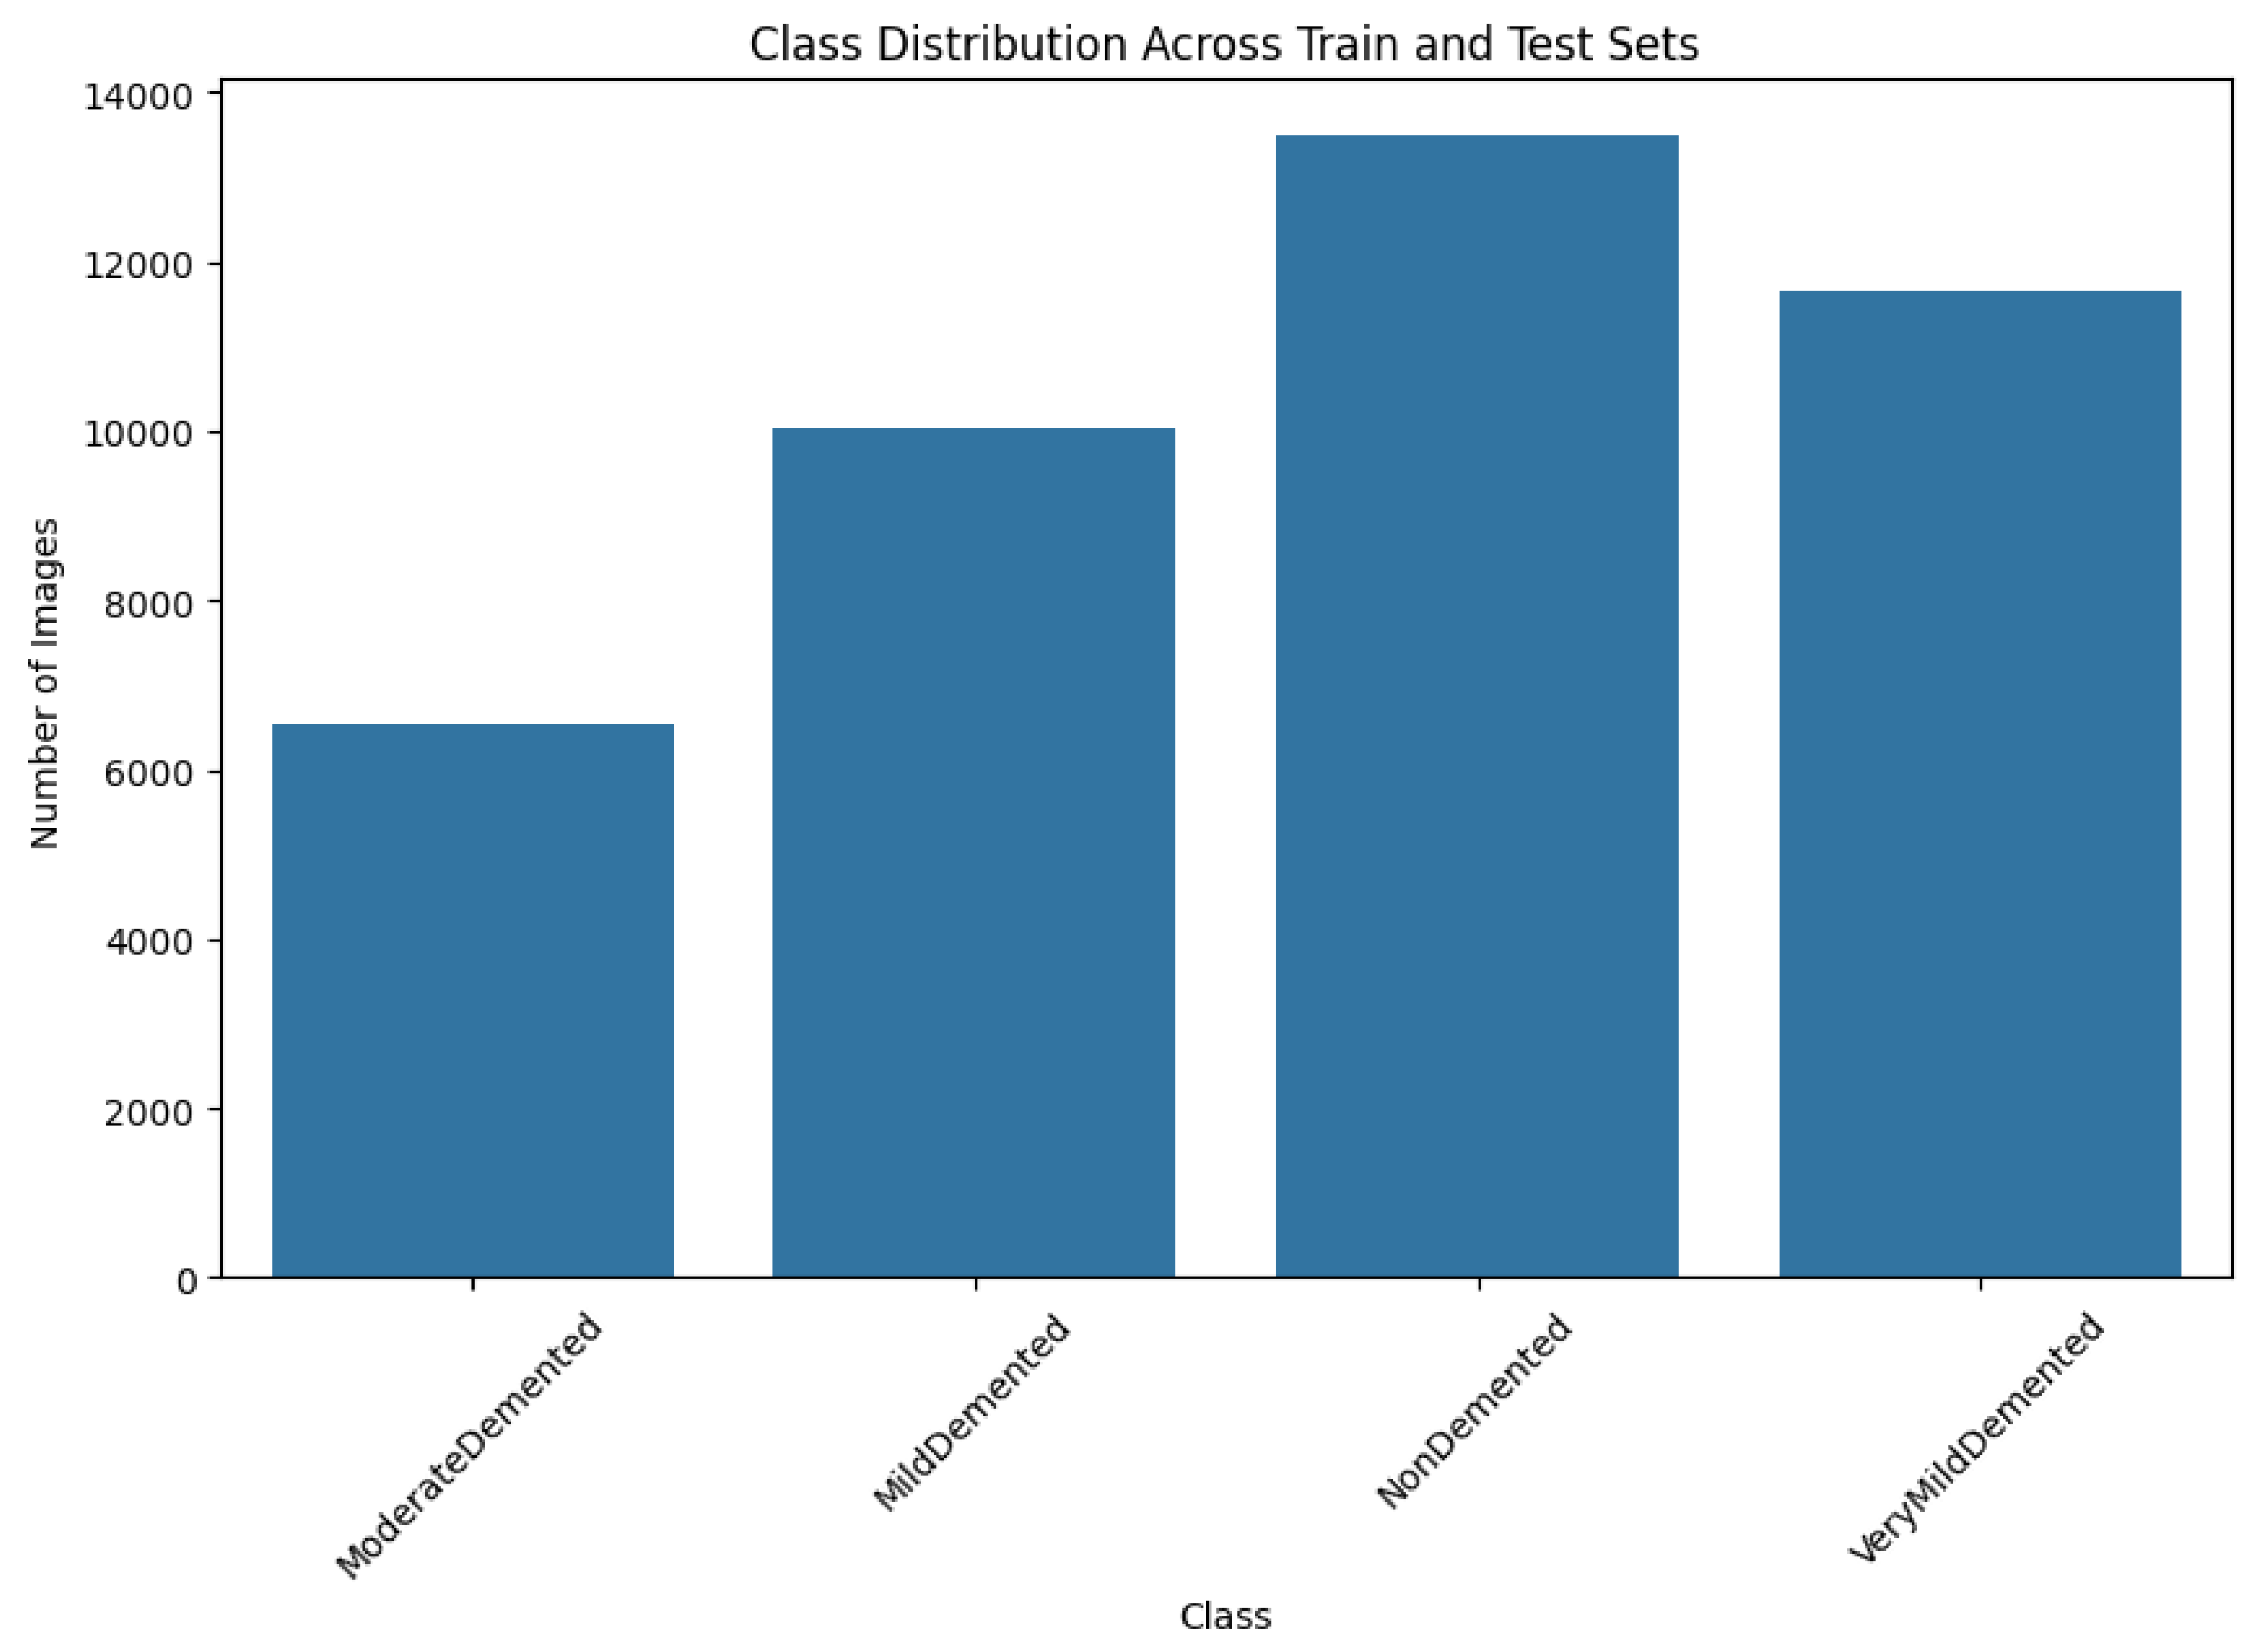
Figure 4.
(A) The architecture of the proposed model with all the layers. (B) The architecture of the proposed model with all the layers and their parameters.
Figure 4.
(A) The architecture of the proposed model with all the layers. (B) The architecture of the proposed model with all the layers and their parameters.
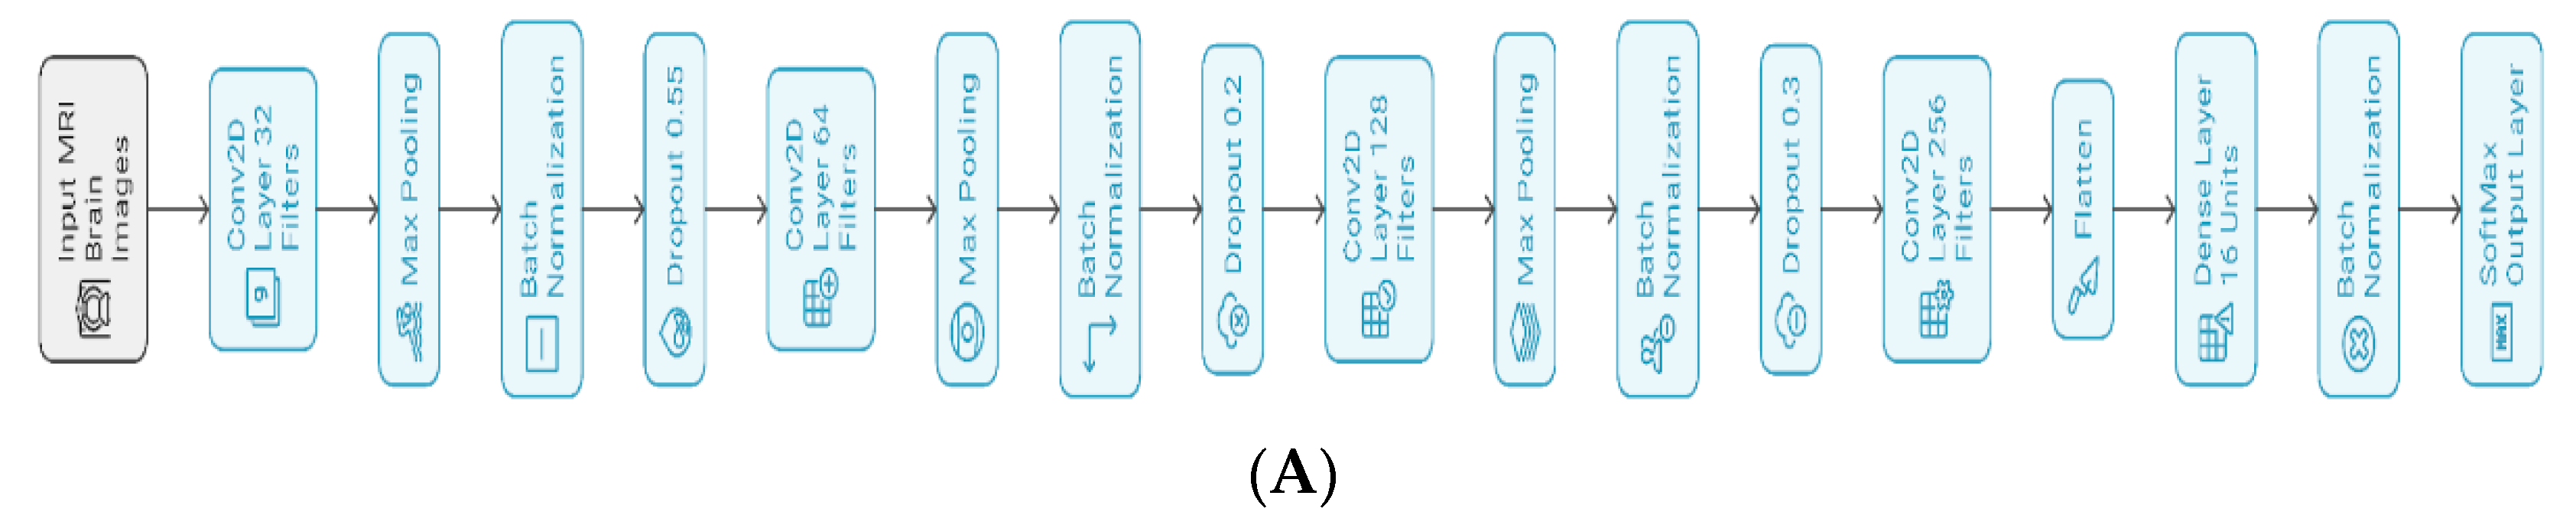
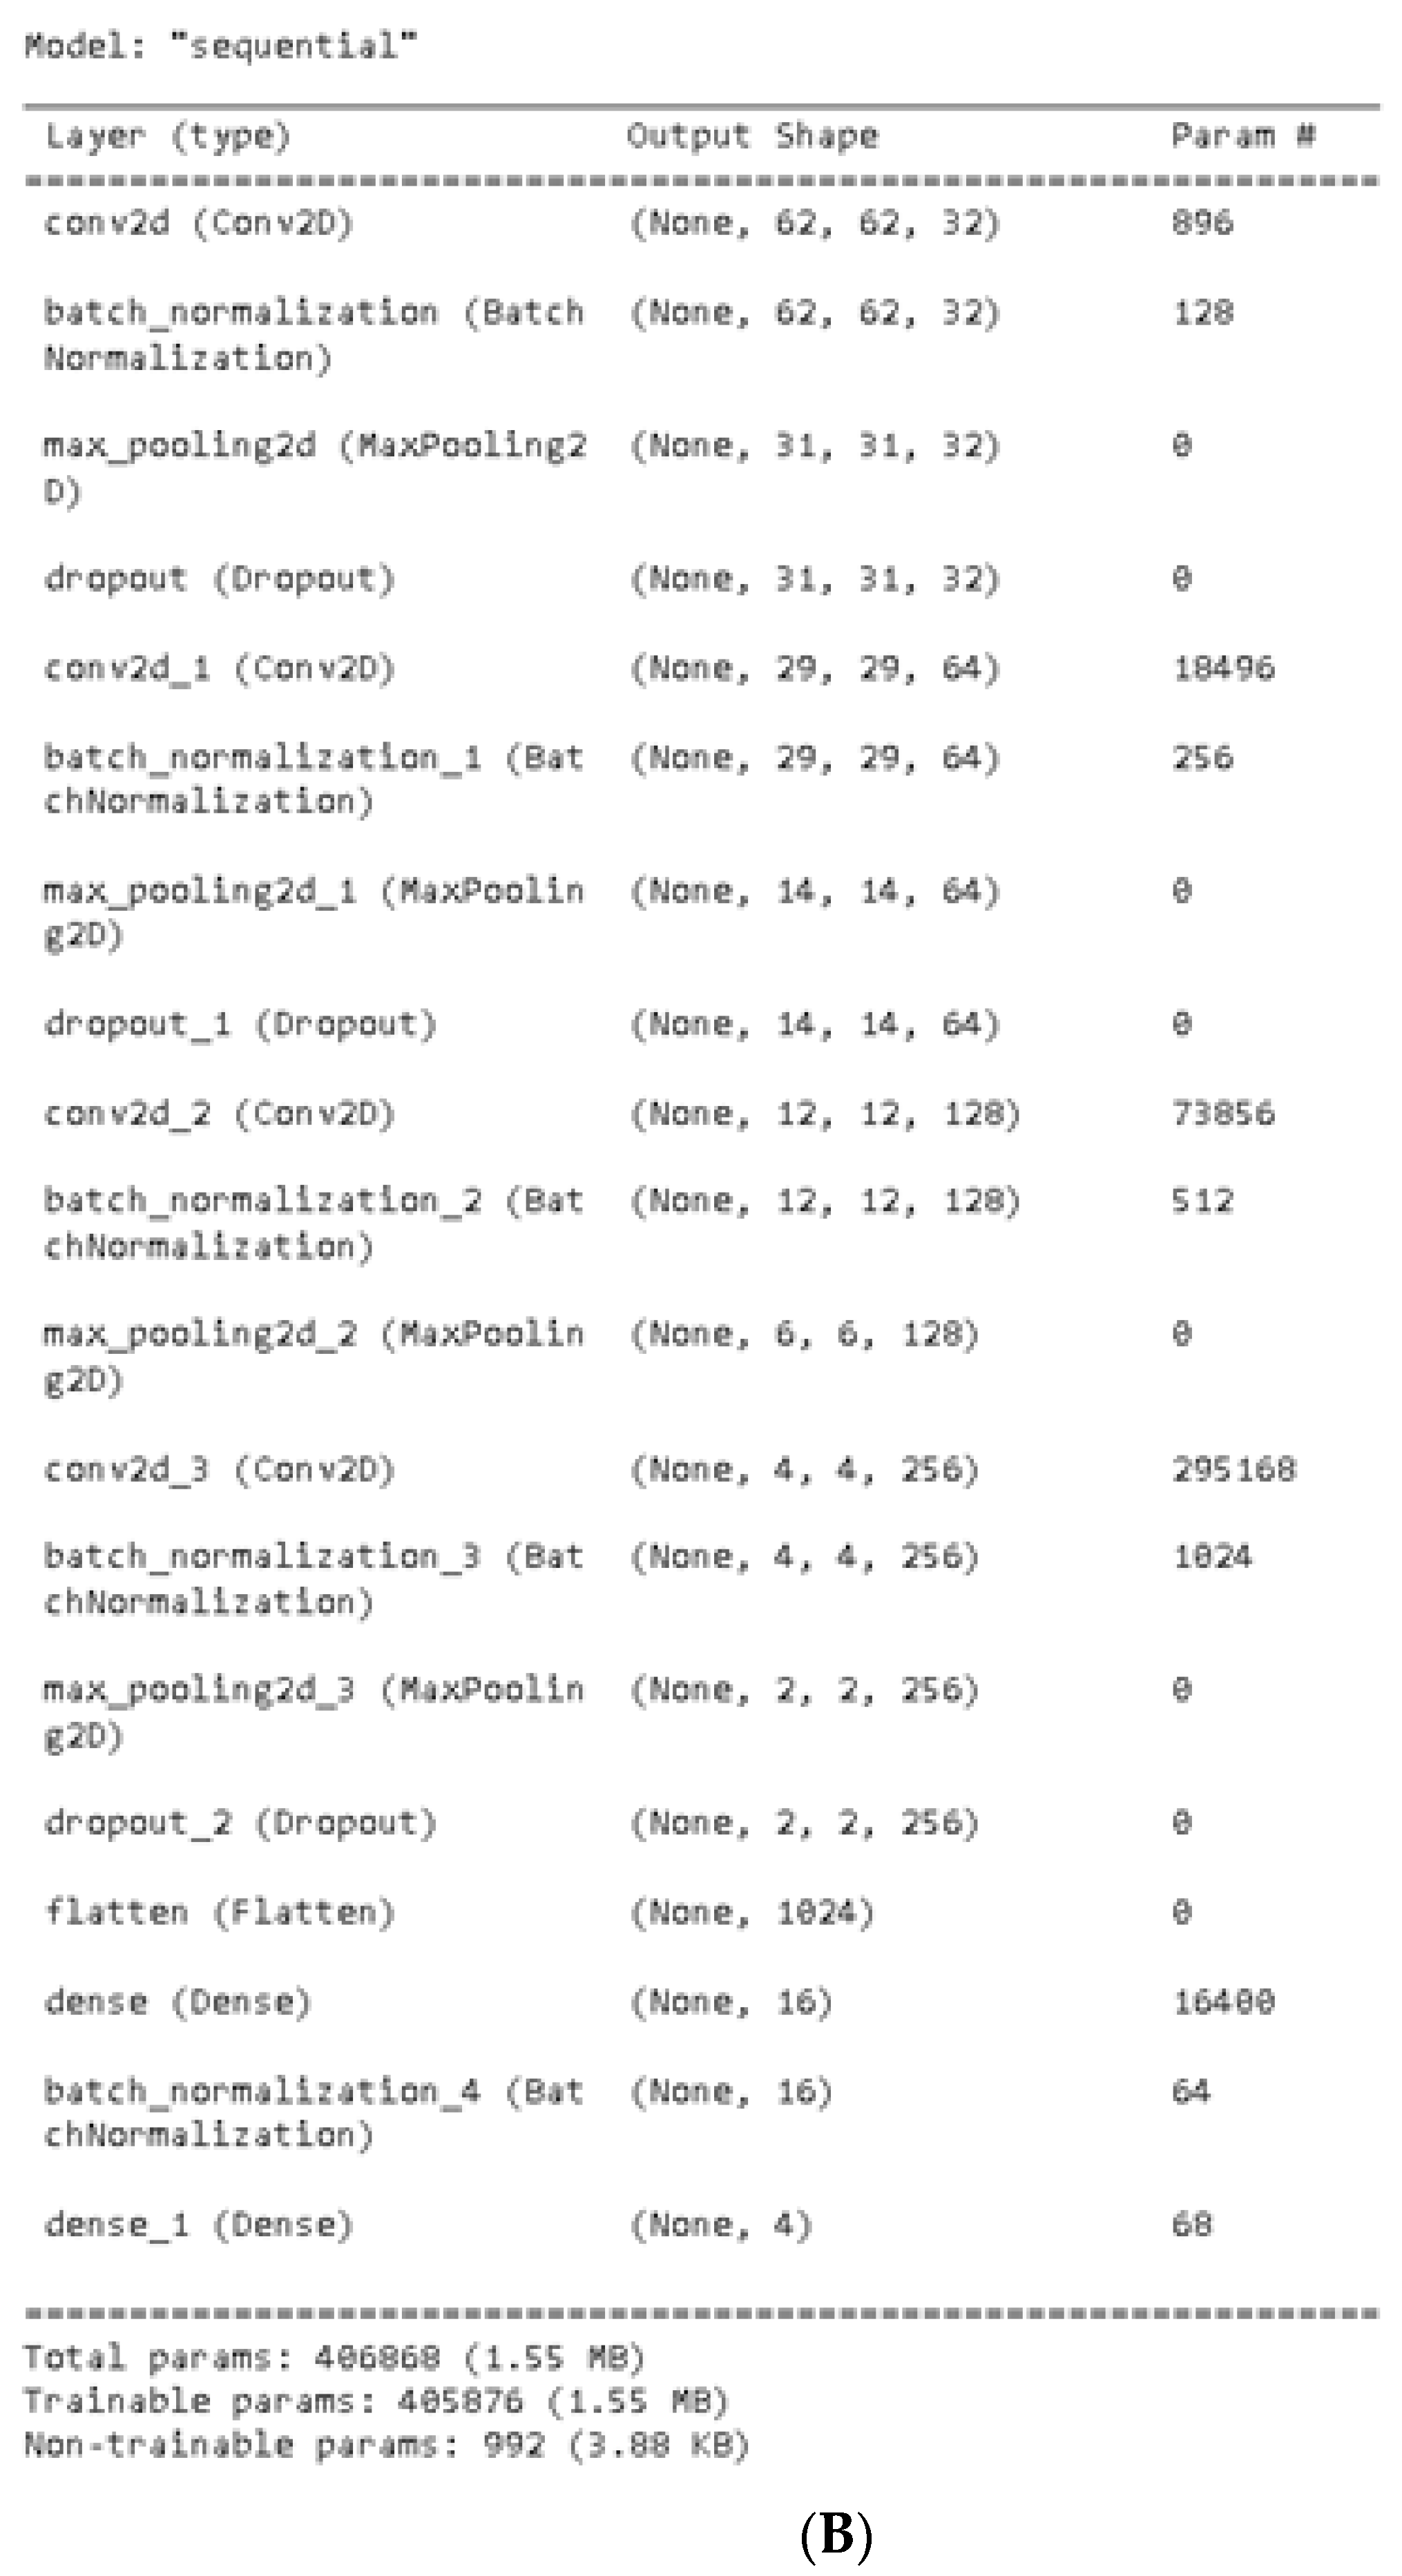
Figure 5.
(A)Training and validation accuracy. (B) Training and validation loss.
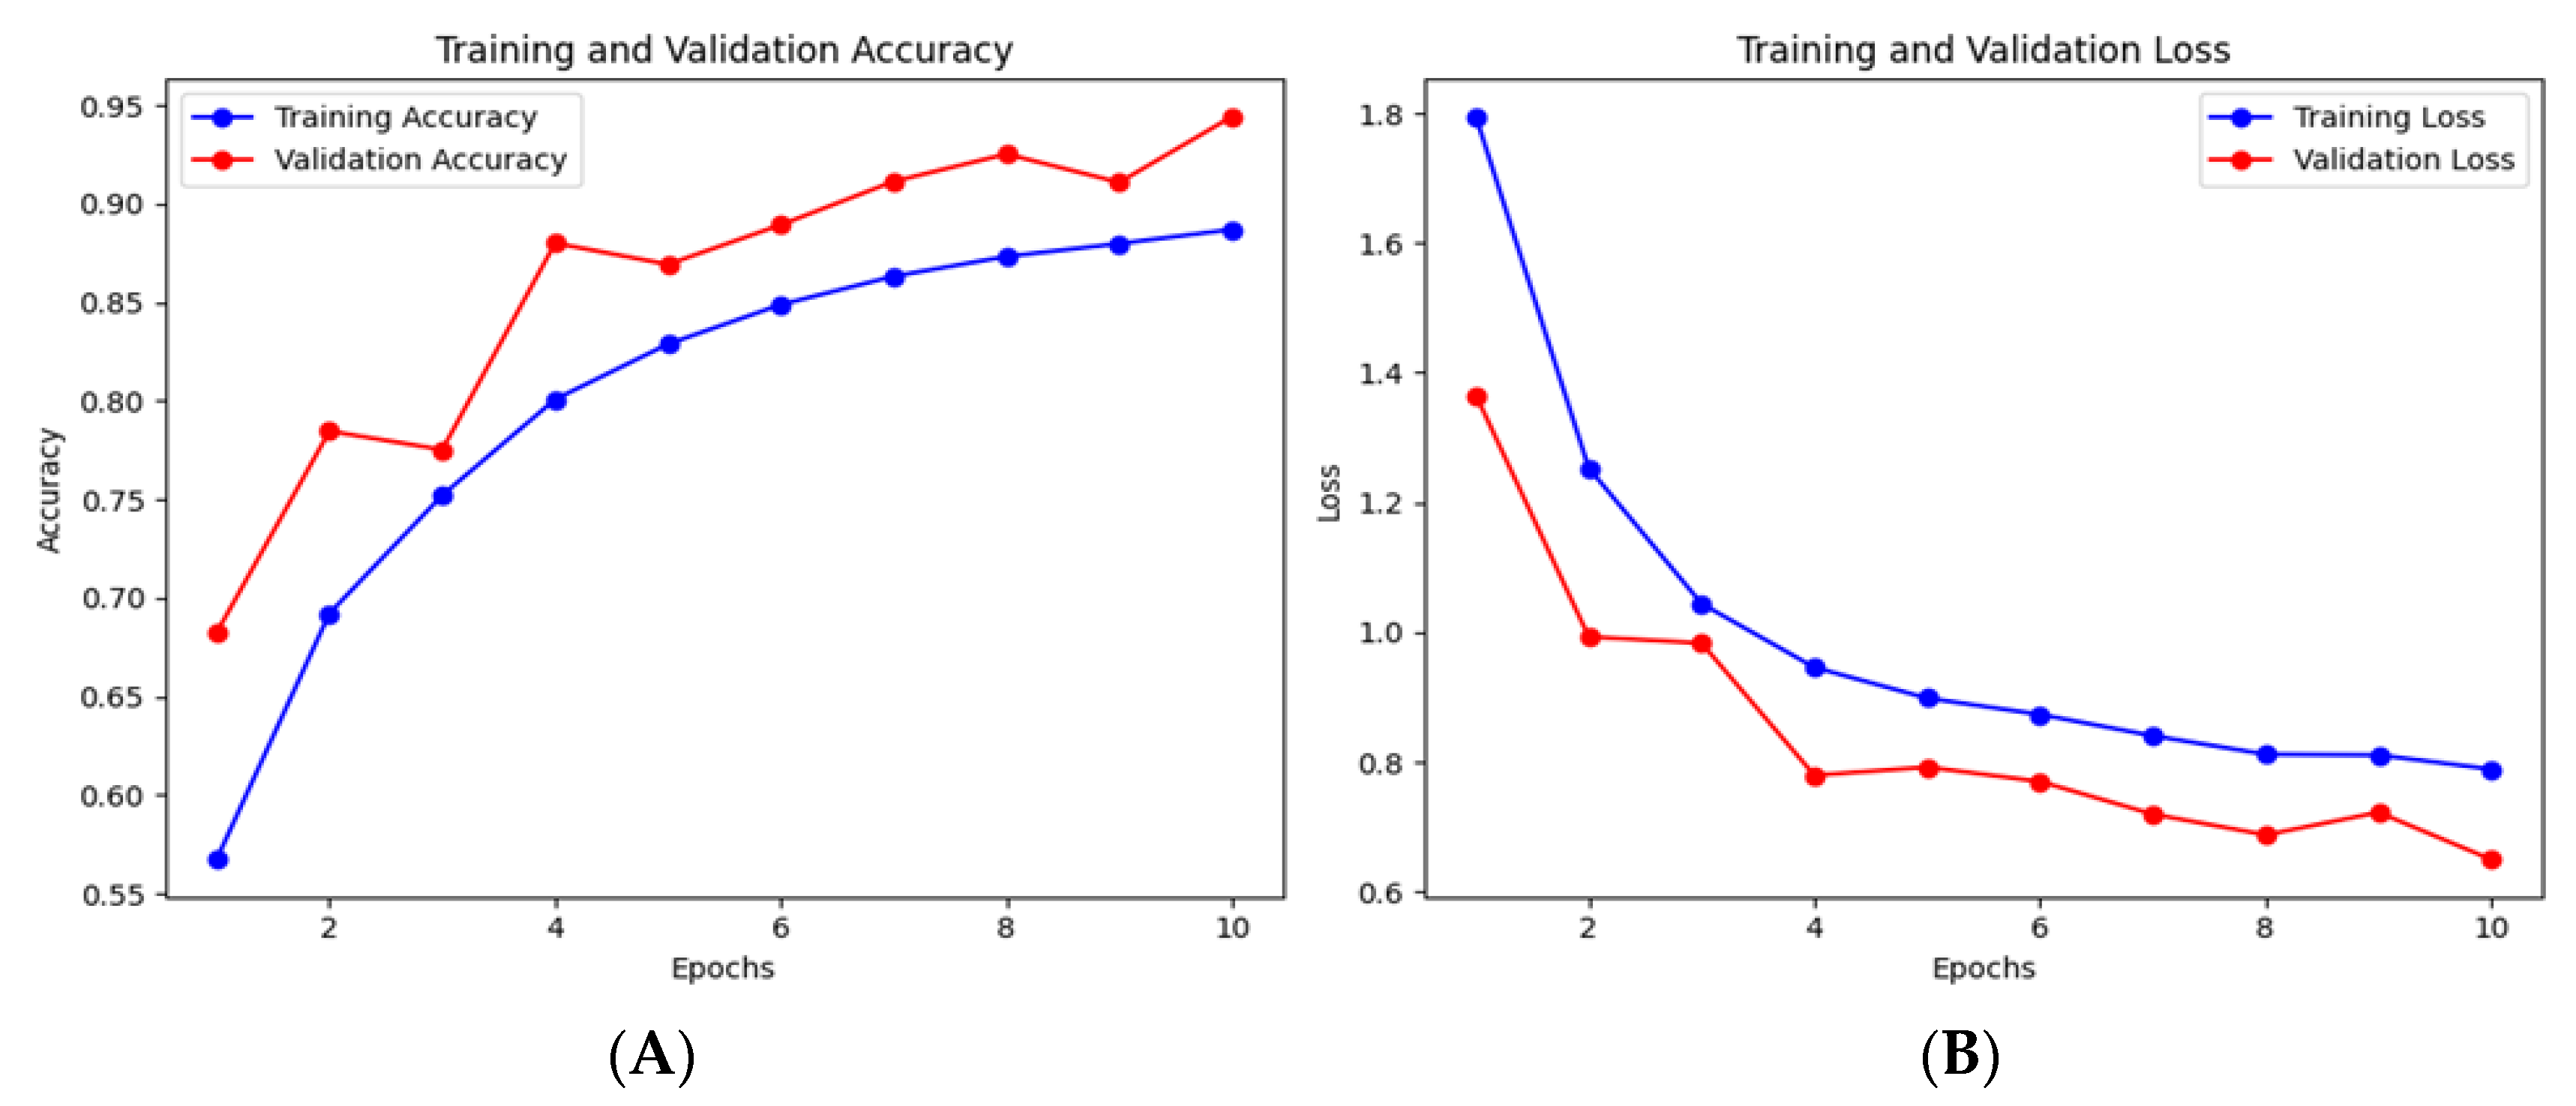
Figure 6.
Output of the model training and validation.
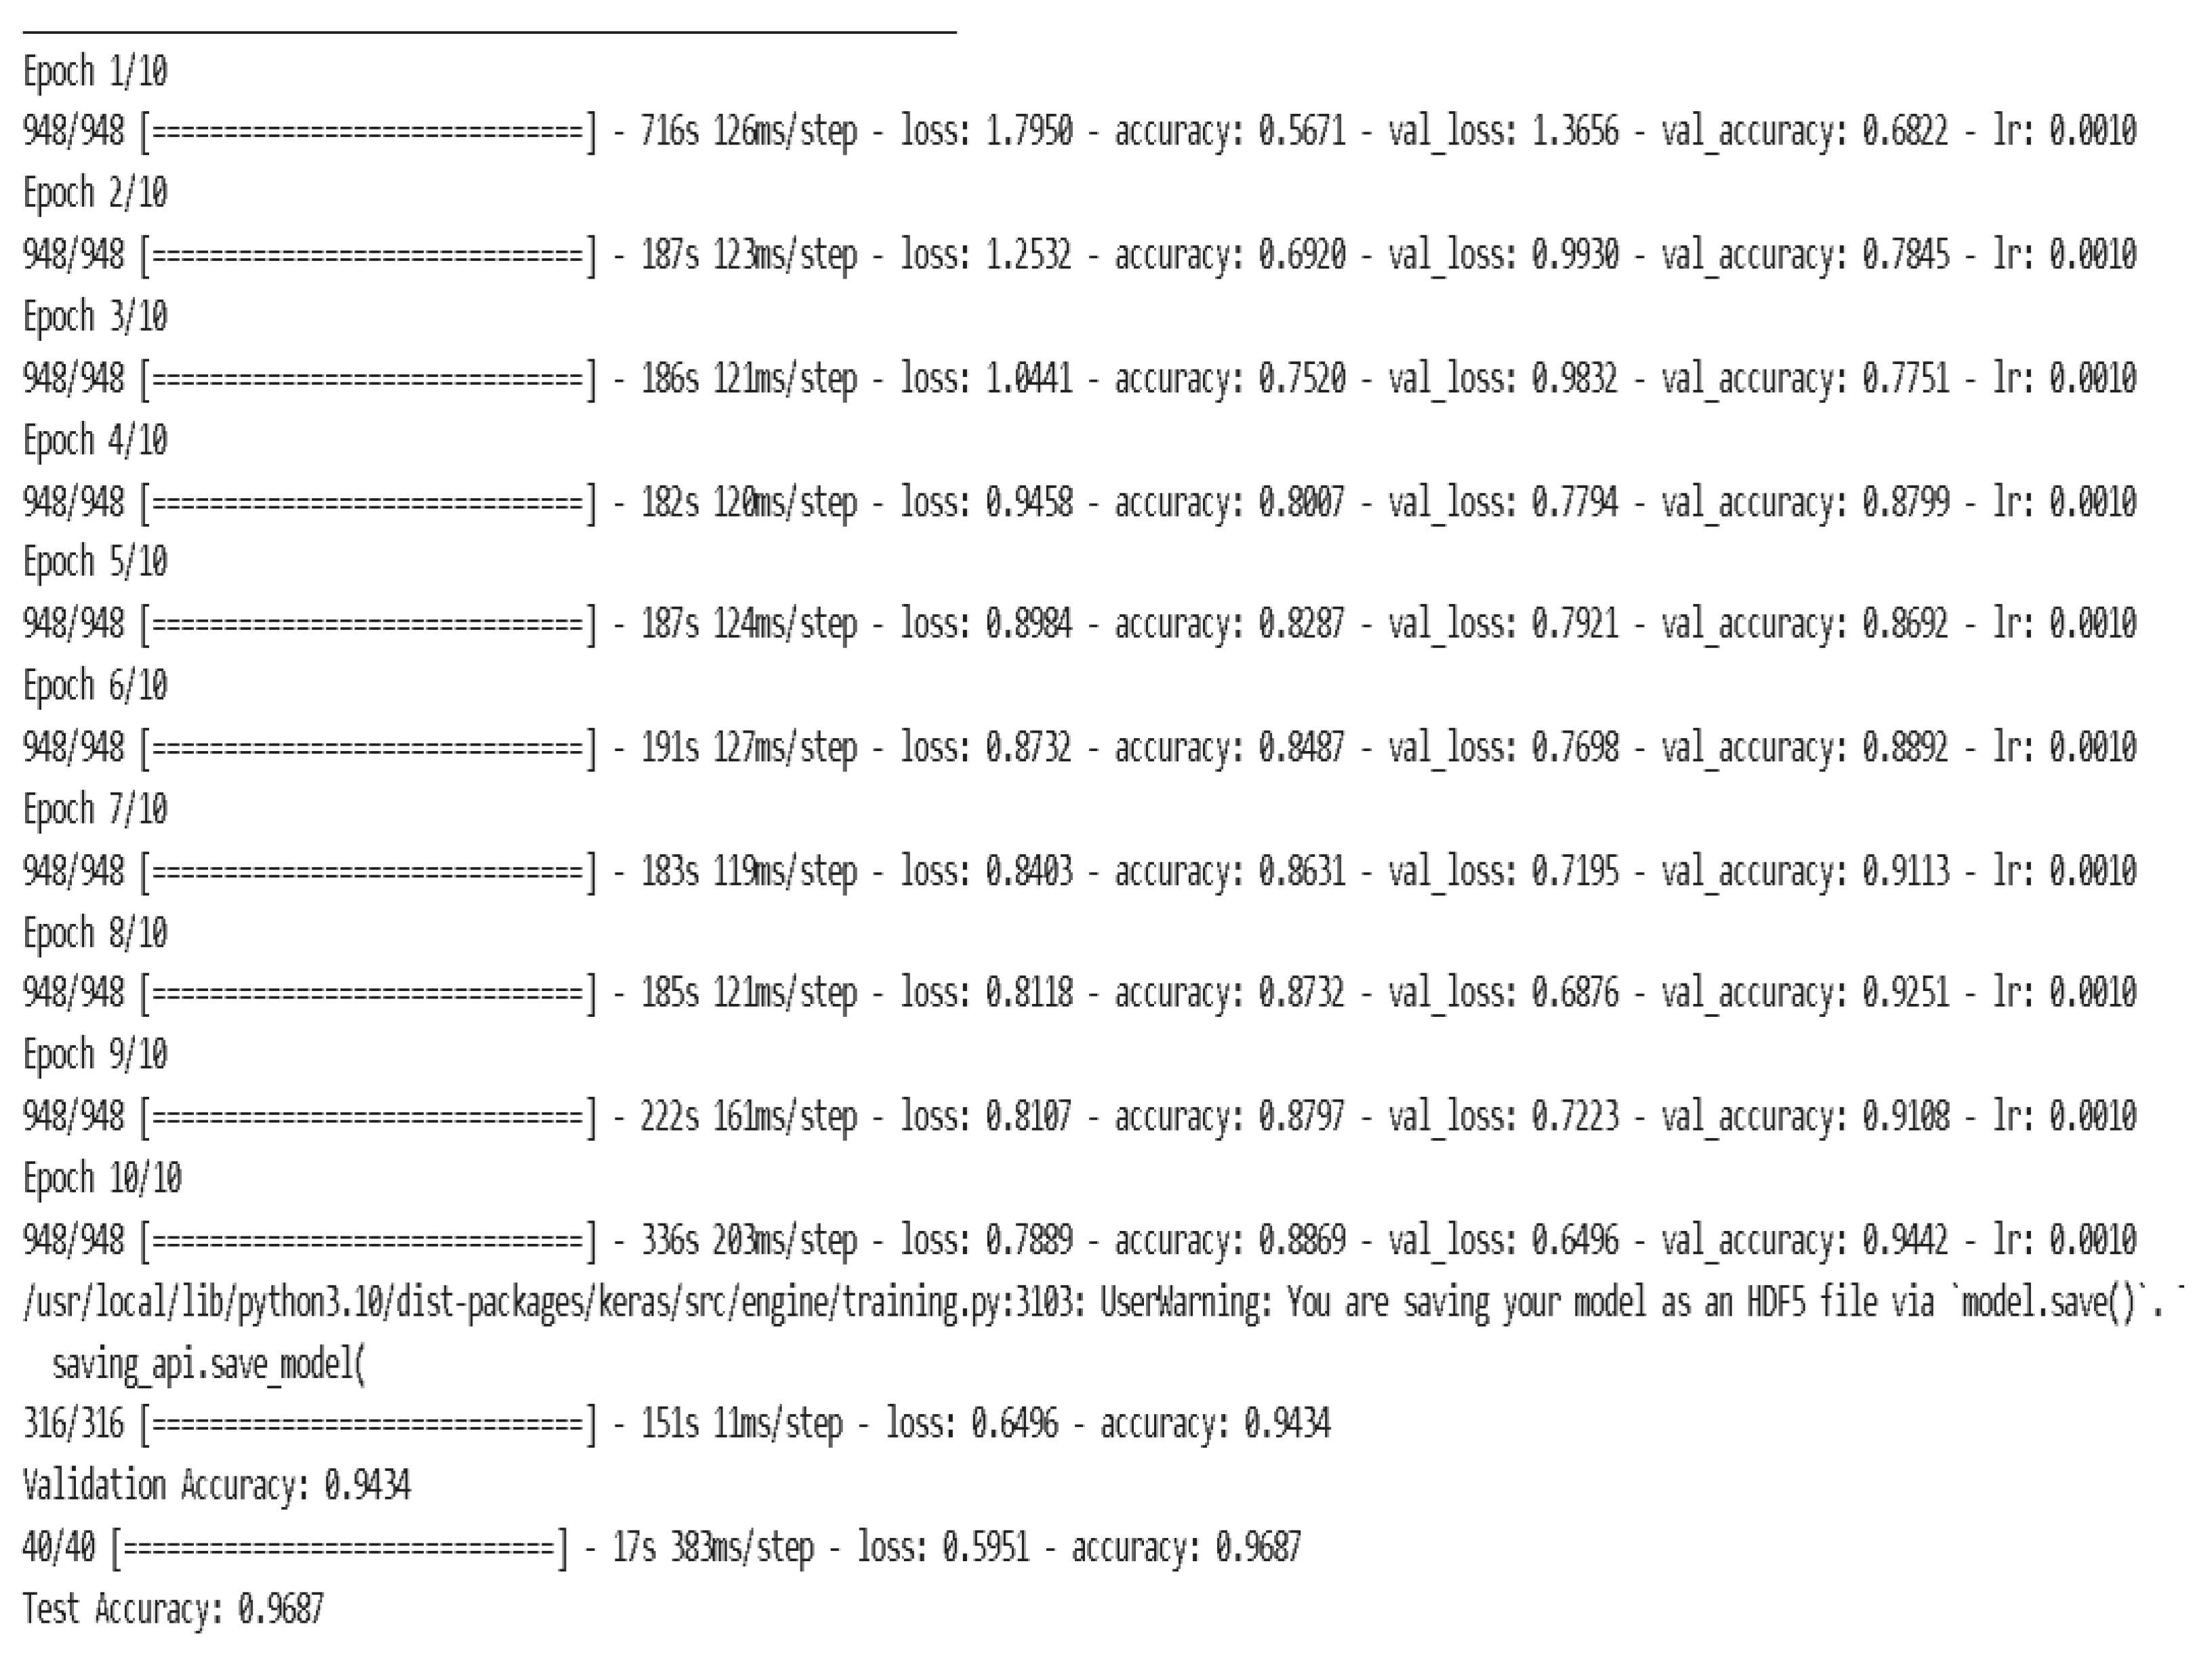
Figure 7.
Classification report.
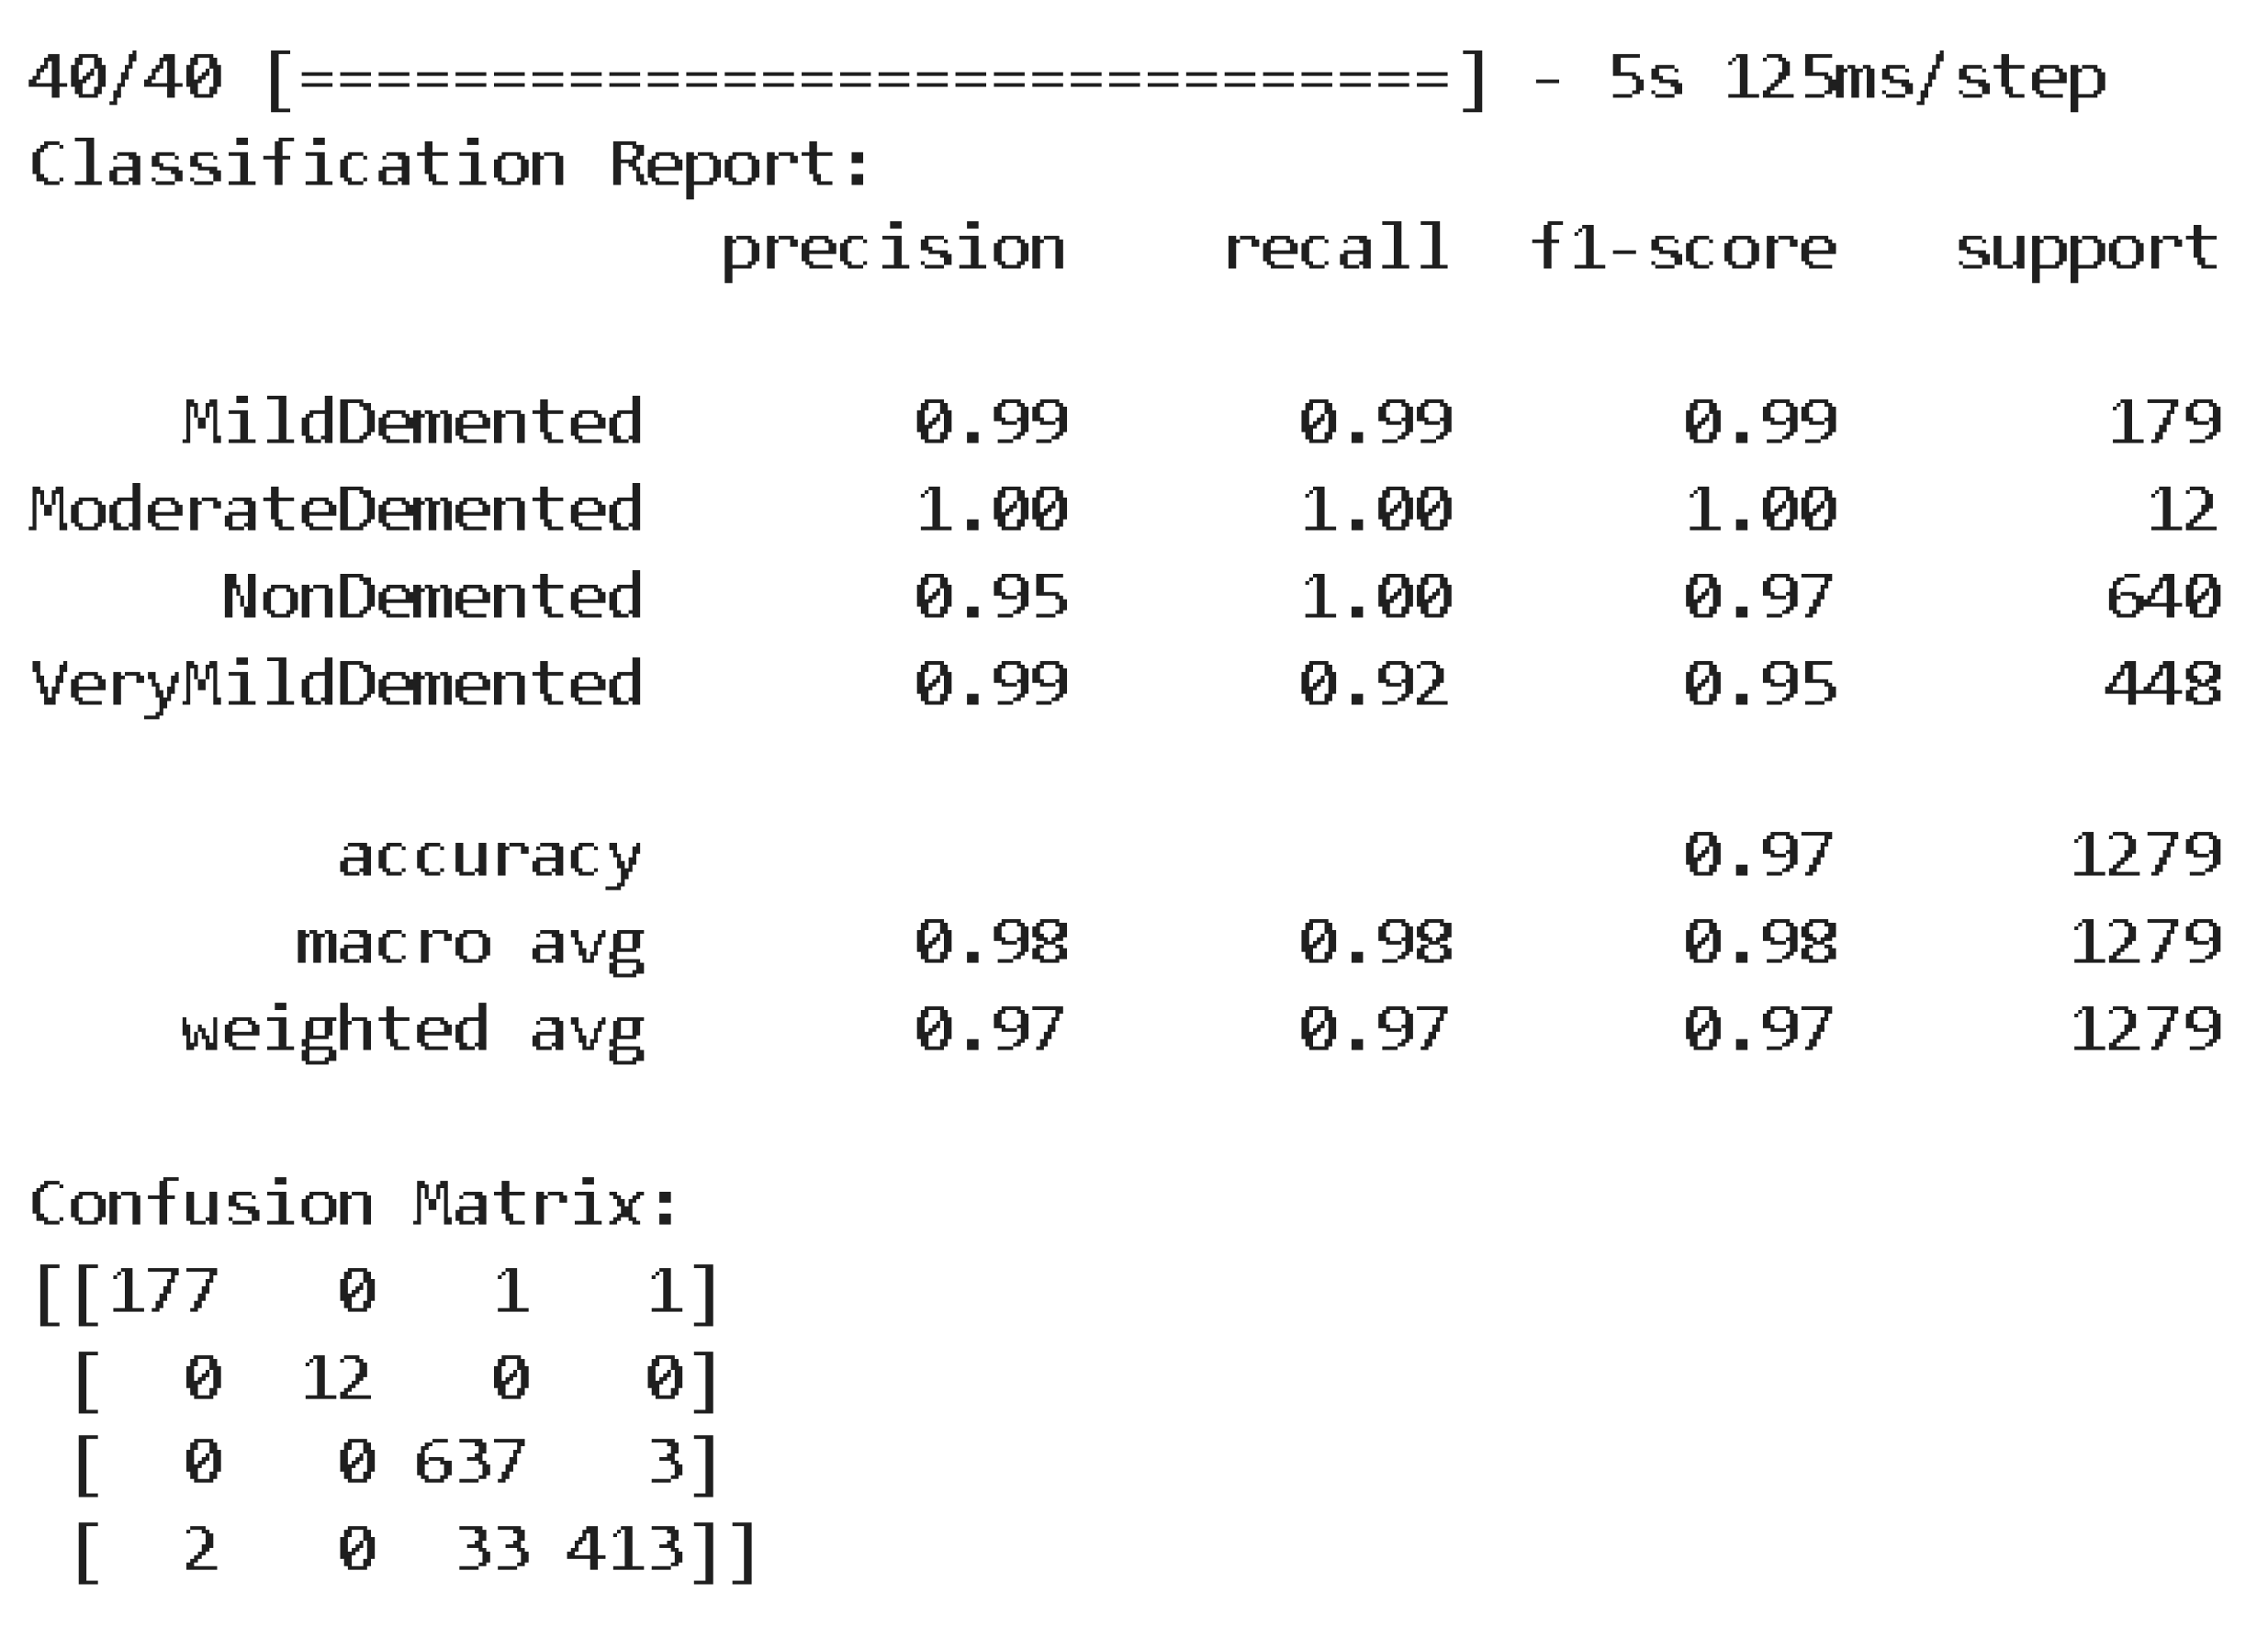
Figure 8.
The confusion matrix shows the True Labels and the Predicted Labels.
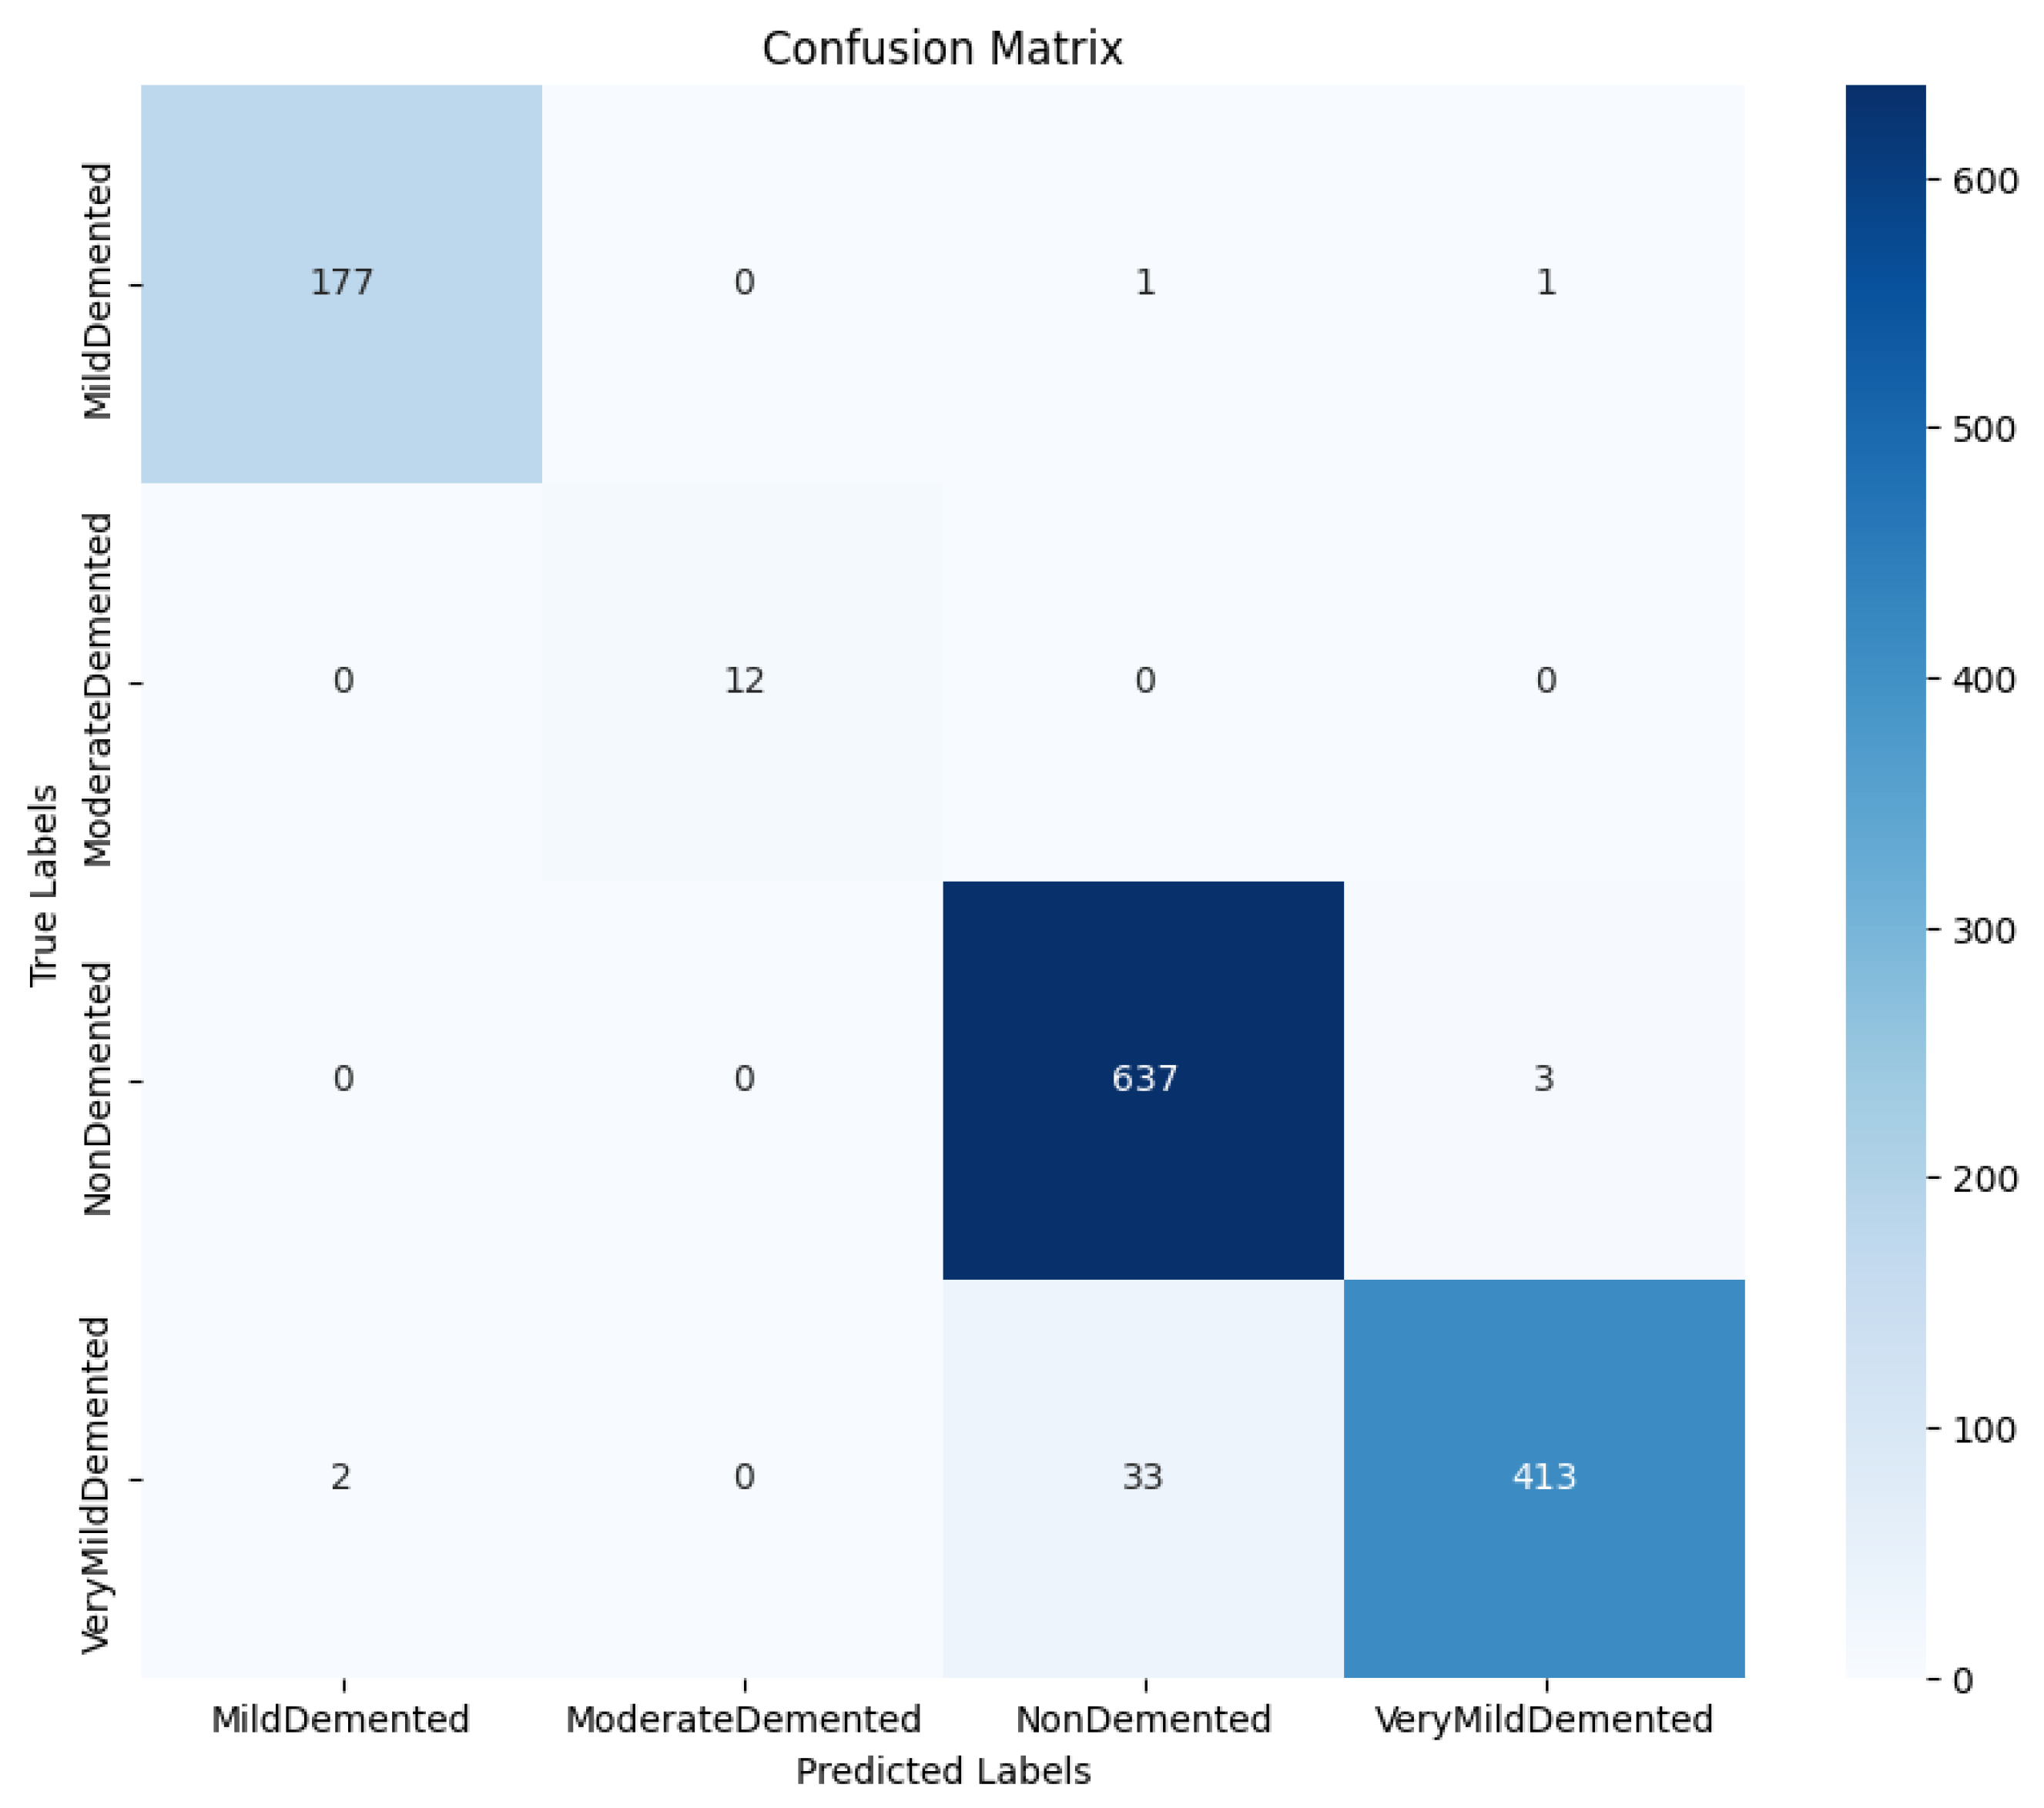
Figure 9.
Receiver Operating Characteristics (ROC) Curve.
Disclaimer/Publisher’s Note: The statements, opinions and data contained in all publications are solely those of the individual author(s) and contributor(s) and not of MDPI and/or the editor(s). MDPI and/or the editor(s) disclaim responsibility for any injury to people or property resulting from any ideas, methods, instructions or products referred to in the content. |
© 2024 by the authors. Licensee MDPI, Basel, Switzerland. This article is an open access article distributed under the terms and conditions of the Creative Commons Attribution (CC BY) license (http://creativecommons.org/licenses/by/4.0/).
Copyright: This open access article is published under a Creative Commons CC BY 4.0 license, which permit the free download, distribution, and reuse, provided that the author and preprint are cited in any reuse.


