
Submitted:
21 November 2024
Posted:
22 November 2024
You are already at the latest version
Abstract
Permafrost thawing is potentially a crucial but poorly investigated factor that influences vegetation dynamics in the Arctic. We studied permafrost thaw rate beyond the Polar Circle in Siberia and analyzed its influence on the larch (Larix spp.) growth and the Arctic vegetation (sparse larch forests, tundra, and forest-tundra communities) productivity (NPP and GPP). We checked the hypothesis: (1) satellite gravimetry is valid for permafrost melt analysis; (2) melt water runoff stimulated trees’ growth and vegetation NPP. We used dendrochronology, field studies, and satellite (GRACE, Terra/MODIS) data. We found a stable decreasing trend (r2 = 0.67) of the water content in the permafrost soils in the Siberian Arctic. Melt water runoff is about 7.7 ± 4.4 kg/m2/yr (with maximal values 9.7 ± 2.9 in West and Mid Siberian Arctic sectors and negative ones (-2.9 ± 3.2) in the Chukotka Peninsula sector). Permafrost meld led to an increase in vegetation productivity. We found that larch radial growth index (GI) and vegetation NPP correlated with melt water runoff (r = –0.7 and r = 0.55, respectively). The VPD (vapor pressure deficit), air and soil temperatures increase stimulated larch growth and vegetation NPP (r = 0.7…0.9 and r = 0.6, respectively). With warming, permafrost degradation leads to improving hydrothermal conditions for trees and vegetation growth and by that contributes to the preservation of the Arctic as a carbon sink territory despite the burning rate increase.
Keywords:
permafrost thawing
; permafrost melt water runoff
; gravimetric measurement
; cryolithozone
; larch forests
; forest-tundra
; tundra
; Arctic vegetation productivity
1. Introduction
In the Siberian Arctic, air temperature increase is about four times higher in comparison with southern areas. That may lead to significant changes in the permafrost stability, melt water runoff, and hydrothermal regime within the cryolithozone [1,2]. Warming- driving permafrost melt is an important factor that may influence trees’ growth and vegetation productivity (NPP). Potentially, permafrost degradation may improve the soils’ hydrology regime and lead to an increase in the active layer depth. However, data on this problem are scarce [3,4,5,6]. Outside the Arctic, on the southern edge of cryolithozone, permafrost melting is considered as an additional water source during seasonal water stress [7]. Air temperature increase by +1 °C, according to prognostic estimates, may lead to a decrease in 25% of the permafrost within the upper 3-meter soil layer [8]. Alongside continuous permafrost melting, melting of the ice-reach soils accompanied by thermokarst, including lake formation. However, in spite of documented permafrost melting, within some parts of the cryolithozone, including the northeast Arctic, carbon- and ice-reach soils will be stable even after 2100 yr even under a pessimistic scenario [2].
Warming at high latitudes accompanied by vegetation GPP/NPP increase, including the “greening tundra” phenomenon [9,10]. However, warming leads to an increase in wildfires’ frequency and intensity [11]. On the whole, permafrost melting, alongside elevating air temperature, is considered a primary driver of vegetation dynamics within the permafrost area [9].
Estimates of warming influence on the permafrost melting and soil moisture are based mostly on the on-ground data or satellite microwave data [3,4]. Alongside that, satellite (GRACE) gravimetry also contained information related to the permafrost melting [12]. Gravimetric data are sensitive to all variables that influence local mass anomalies, including water mass anomalies. Namely, water mass anomalies are the primary variable that influenced GRACE-derived measurements. The most important results obtained based on gravimetry are the ice sheets melting in Greenland and the Arctic [13,14]. There are also indications that gravimetry is useful in the analysis of moisture regime changes influence on the tree (Larix spp.) growth in the Arctic [10,15].
Geographically, studies of permafrost melting are located mostly within the western part of the permafrost zone in North America, whereas vast permafrost areas in Siberia and Canada are poorly studied [9]. The goals of this study: (1) permafrost melt water runoff estimation beyond the Polar Circle in Siberia; (2) water anomalies and melt water runoff influence on the larch (Larix spp.) growth and vegetation GPP/NPP in the Siberian Arctic.
Checked hypothesis: warming-driven permafrost melt promotes (a) trees’ growth increase (Larix sibirica, L. gmelinii), the dominant tree species in the Arctic, and (b) promotes vegetation productivity (GPP/NPP) increase.
2. Materials and Methods
2.1. Study Area
The study area, the Siberian Arctic, included sparse larch stands, tundra, and forest-tundra communities and is located within the continuous permafrost zone (Figure 1). The area is beyond the Arctic Circle (66.6°N–78.0°N; 60°E–180°E, 168°W–180°W). The islands and coastline were removed from the analysis. The total analyzed is ~ 3×10⁶ sq. km. All the data were transformed to the Albers equal area conic projection and the nominal 463 m pixel size corresponding to the MODIS-based NPP data.
The climate of the region is characterized by its harshness, with subarctic and sharply continental features. Long winters and brief summers are the norm, accompanied by frequent occurrences of cyclones and anticyclones. The polar night brings with it low temperatures and blizzards, while the polar day is marked by intense insolation. Additionally, cloudy weather and extended periods of drizzle are common. Precipitation is distributed extremely unevenly throughout the year, with the majority falling between late May and late September. A stable snow cover begins to form in the third week of September and melts away in the first half of June. At higher elevations, the snow depth ranges from 0.4 to 0.8 meters. In contrast, at the foothills and in flat areas, it can reach up to 8–9 m. The permafrost extends up to a depth of 1 km. Taliks (melted soils) occur under the beds of major rivers. During the summer months, an active layer up to 2 meters thick develops. The depth of seasonal freezing in soil depends on factors such as slope exposure, vegetation cover, moisture content, and soil type. The lowland tundra ecosystems are marked by a high-water content, a paucity of soil fertility, the presence of marine and accretive sediments, polygonal wetlands, as well as “baijarakhs” (permafrost-caused “hills”). In the far north, the distribution of arboreal and shrub vegetation has been observed to be particularly sparse [16,17].
The majority of tree species are presented by larch (Larix gmelinii, L. sibirica) with a small proportion of birch (Betula spp.). Within the southwest part of the area Siberian pine (Pinus sibirica Du Tour) и spruce (Picea obovata Ledeb.) occurred along the creeks and rivers mostly.
2.2. Methods
We used satellite (GRACE, MODIS) gravimetry and NPP index data, dendrochronology-derived trees’ radial growth index (GI), and field data.
2.2.1. GRACE Data
We used monthly mass grid (land) products based on GRACE and GRACE-FO remote sensing data (https://grace.jpl.nasa.gov/data/get-data/monthly-mass-grids-land) [19]. GRACE mission is supported by the NASA MEaSUREs Program. The results of GRACE measurement given in EWTA (Equivalent of Water Thickness Anomalies), extracted from the TELLUS_GRAC_L3_GFZ_RL06_LND_v04 and TELLUS_GRFO_L3_GFZ_RL06.1_LND_v04 products [20]. The data were downloaded from the EarthData geoportal (https://search.earthdata.nasa.gov) in GeoTIFF format. The monthly land mass grids contain water mass anomalies given as EWTA in meters derived from GRACE and GRACE-FO time-variable gravity observations during the specified timespan (monthly), and relative to the specified time-mean reference period (2004–2009 years).
The EWTA represents the total terrestrial water storage anomalies from soil moisture, snow, surface water (incl. rivers, lakes, reservoirs, etc.), as well as groundwater and aquifers. The spatial sampling of all grids is 1 degree (above the Arctic Circle cell is ~94×40 km2) in both latitude and longitude [19]. The time coverage of the data is 2003–2023. EWTA values are presented in meters. In this study, alongside with EWTA term, we use the terms “water anomalies” and “water runoff”, where applicable.
Gravimetric data were calculated both for a hydrological year (from September of the previous year to August of the current year inclusively) and for the vegetation growth period (JJA).
2.2.2. MODIS Data
We analyzed changes in primary productivity based on the MODIS MOD17A3HGF [21]. The annual Net Primary Productivity (NPP) data were extracted from the MOD17A3HGF from 2007 to 2023 with 463 m spatial resolution [22].
The fires were mapped using a geospatial database created by the Forest Institute of the Siberian Branch of the Russian Academy of Sciences. The database uses satellite data obtained from the NOAA/AVHRR, TERRA/AQUA/MODIS, and SNPP/NOAA-20/VIIRS platforms. To exclude anthropogenic thermal anomalies, data about settlements were used (Open Street Map, https://www.openstreetmap.org/). Using high-resolution Google Earth data, thermal anomalies associated with oil and gas fields were excluded from the analysis. To estimate pyrogenic carbon emissions in the tundra, a value of 1.13 kg C / m2 described in literature concerning northeastern Siberia was used [23].
2.2.3. Climate Data Processing
We used climate data extracted from the ERA5 Land database. The ERA5 Land was created by the European Centre for Medium-Range Weather Forecasts with a spatial resolution of 0.1 degrees (~9 km). ERA5 Land data are calculated based on a reanalysis of ground measurements, satellite imagery, and land cover and relief maps [24]. Monthly data on air temperature (T2m; °C), precipitation (TP; m) and evaporation (E; m), and soil temperatures (ST; m; at a depth of 0-100 cm) were downloaded using Copernicus Climate Change Service [24]. Soil temperature was considered for a layer of 0–100 cm corresponding mainly to the rooted zone. The data were preprocessed using R-Studio (v. 23.12.01; https://posit.co/download/rstudio-desktop). To estimate the influence of climate on the EWTA and vegetation cover dynamics, we calculated maps of Spearman’s correlation coefficients (p < 0.05). These maps showed spatial heterogeneity of the climate impact on changes in EWTA and NPP during 2007–2023. VPD (vapor pressure deficit) was calculated using the DewtoVPD function realized in the plantecophys Python library, and based on the air and dew temperatures, and barometric surface pressure [25].
2.2.4. Test Sites Description and Dendrochronology Analysis
Within on-ground study sites, the dominant tree species were larch (Larix sibirica Ledeb., Larix gmelinii Rupr.) with an admixture of birch (Betula pendula Roth) and, to a lesser extent, spruce (Picea obovata Ledeb.). Shrubs represented by alder (Dushekia fruticosa Rupr.), willow (Salix spp.), dwarf birch (Betula nana L.) and Vaccinium sp. The mean forest closure was about 0.2–0.3, although in some areas it may exceed 0.5. On-ground vegetation is presented mainly by lichens, moss, and sedges.
Dendrochronological analysis was carried out at four test sites: Ary-Mas (3 sample plots, 60 model trees); Kotuy (2 sample plots, 66 model trees), Pyasino (10 sample plots, 242 model trees) and Embechime (7 sample plots, 67 model trees) (Figure 1). Wood samples were measured using the LINTAB-6 platform with an accuracy of 0.01 mm [26]. As a result, a series of radial increments for each tree (in mm) were determined. The TSAP and COFECHA programs were used to check the quality of dating [27]. We applied a detrending procedure to account for the age trend by transforming the time series of tree-ring widths to a series of unitless indices with a mean of 1.0 and relatively constant variance [28]. We averaged tree-ring chronologies of individual trees to calculate generalized indexed tree-ring chronologies. For each test site, an indexed tree-ring chronology was constructed using the ARSTAN program; detrending was performed based on the linear regression or negative exponential curve [29]
2.2.5. Assessment of the Water Mass Runoff
We used GRACE EWTA, MODIS NPP, MODIS-based fire carbon emissions, and ERA5-Land total precipitation and evaporation data to assess water mass runoff (ΔSm). We estimated changes in total water (ΔGm) during 2007–2023 using the following equation:
where Gm(2007-2009) and Gm(2021-2023) are the mean EWTA during the 2007–2009 and 2021–2023, respectively. A positive value of ΔGm means water mass runoff and negative – water accumulation. In equation (1), the beginning year 2007 was chosen since that year is a stable decreasing trend of the water anomalies (WA or EWTA) occurred (Figure 2). To smooth variability, we averaged three years of data at the beginning (2007–2009) and the end (2021–2023) of the study period.
ΔGm = Gm(2007-2009) – Gm(2021-2023),
The total gravimetry mass influenced by vegetation cover mass () changes, mass loss caused by wildfires (carbon emissions, ∑F), and differences (P-E) between precipitation (P) and evaporation (E) changes. To account for mass changes caused by vegetation growth, we used NPP estimations extracted from the MODIS MOD17A2HGF product [21]. The sum of annual NPP (∑NPP) during 2007–2023 years was calculated. Alongside the biomass accumulation, the produced NPP was partly decayed due to biological decomposition. To estimate loss caused by decomposition, a first-order exponential decay function was applied, which estimates the percent mass remaining at a certain time elapsed since the beginning of litter decomposition (Figure 3) [30,31,32]:
where t – time (2007–2023); k – is the decomposition rate, which for arctic tundra is about ~0.03 g g-1 yr-1 [31,33,34].
We used function (2) to assess the remained biomass by the following equation:
We estimated wildfires-caused carbon loss by the following procedure. We mapped fire events by using the geospatial fire database created by the Sukachev Institute of Forest, SB RAS. This database uses satellite fire detections obtained from the NOAA/AVHRR, TERRA/AQUA/MODIS, and SNPP/NOAA-20/VIIRS platforms. We used settlement data from Open Street Map (https://www.openstreetmap.org/) to exclude thermal anomalies of anthropogenic origin. We also excluded from further analysis thermal anomalies related to gas flares in oil and gas fields using high-resolution data from Google Earth. In the case of larch forest stands in northern Siberia, emission estimates ranged between 3 and 3.44 kgC m-2 [35,36,37]. The final estimate of carbon emissions was based on the data of Tsvetkov [35]. To estimate pyrogenic emissions in tundra, a value of 1.13 kgC m-2 obtained for northeastern Siberia was used [23].
We applied linear regressions to account for annual changes in differences (α) between annual precipitation (P) and evapotranspiration (P-E):
where t is time (yrs), and β is the intercept coefficient.
Finally, the corrected water mass runoff (WR) was estimated by equation (5):
where WR is the water runoff; ∑F – carbon emissions caused by fires; – the remained biomass; is delta between (P-E); l is the analyzed period length (2007–2023).
2.2.6. Statistical Analysis
We applied ISODATA unsupervised classification realized in the ERDAS Imagine software (https://hexagon.com/products/erdas-imagine) to merge pixels to clusters (zones) with similar EWTA dynamics. In total, five zones were identified.
Statistical calculations were realized using StatSoft Statistica (http://statsoft.ru), (https://www.r-project.org), and R-Studio (https://posit.co/download/rstudio-desktop/) software.
We used Pearson’s and Spearman’s correlation coefficients and linear regressions to estimate the relationship between the estimated variables. The significance of correlation coefficients and regression equations was assessed using the t-test and F-test.
The Theil-Sen estimator was applied to calculate maps of EWTA, climate, and productivity (GPP) trends. Theil-Sen estimator is a non-parametric method that fits a regression line through the median of the slopes determined by all pairs of sample points [38], and it is more robust than simple linear regressions [39]. This estimator is less sensitive to outliers, and it is more accurate than simple linear regression [40]. We used the Theil–Sen estimator realized in the Python library pymannkendall 1.4.2 (https://pypi.org/project/pymannkendall (accessed on December 01, 2022)) imported into ESRI ArcGIS Desktop 10.8.1 (https://www.esri-cis.com/ru-ru/arcgis/products/arcgis-desktop/overview). As a result, a set of raster trend maps was generated, and p-levels were estimated.
3. Results
3.1. Melting Water Runoff Raw Data (WRr)
Water runoff dominated within the Siberian Arctic with the exception of the eastern part (the Chukotka peninsula, Figure 4).
Throughout the Arctic, the values of WRr formed five main clusters: West and Mid Siberian (WestSib and MidSib), the Lena River (LenaRiver), East Siberian (EastSib), and Chukotka Peninsula (ChukotkaPen) (Figure 5).
Water accumulation was observed within the ChukotkaPen cluster only. On average, during 2007–2023, the mean water runoff rate (row data) was about ~3 kg/m2/y (r2 = 0.67) (Figure 6).
3.2. Data used for the Water Runoff Corrections: Mapped Data of NPP, and Fire-Caused Carbon Loss
We corrected WR raw data based on mapped values of NPP, , and fire-caused carbon loss (Figure 6 and Figure 7).
Figure 6.
(a) The accumulated NPP (∑NPP) during 2007–2023. Mean ∑NPP is 2.6 kg/m2 (σ = 1.1; min = 0, max = 8.5). (b) Map of the remained biomass (). Mean ( is 2.1 kg/m2 (σ = 0.8; min = 0.1, max = 6.6).
Figure 6.
(a) The accumulated NPP (∑NPP) during 2007–2023. Mean ∑NPP is 2.6 kg/m2 (σ = 1.1; min = 0, max = 8.5). (b) Map of the remained biomass (). Mean ( is 2.1 kg/m2 (σ = 0.8; min = 0.1, max = 6.6).
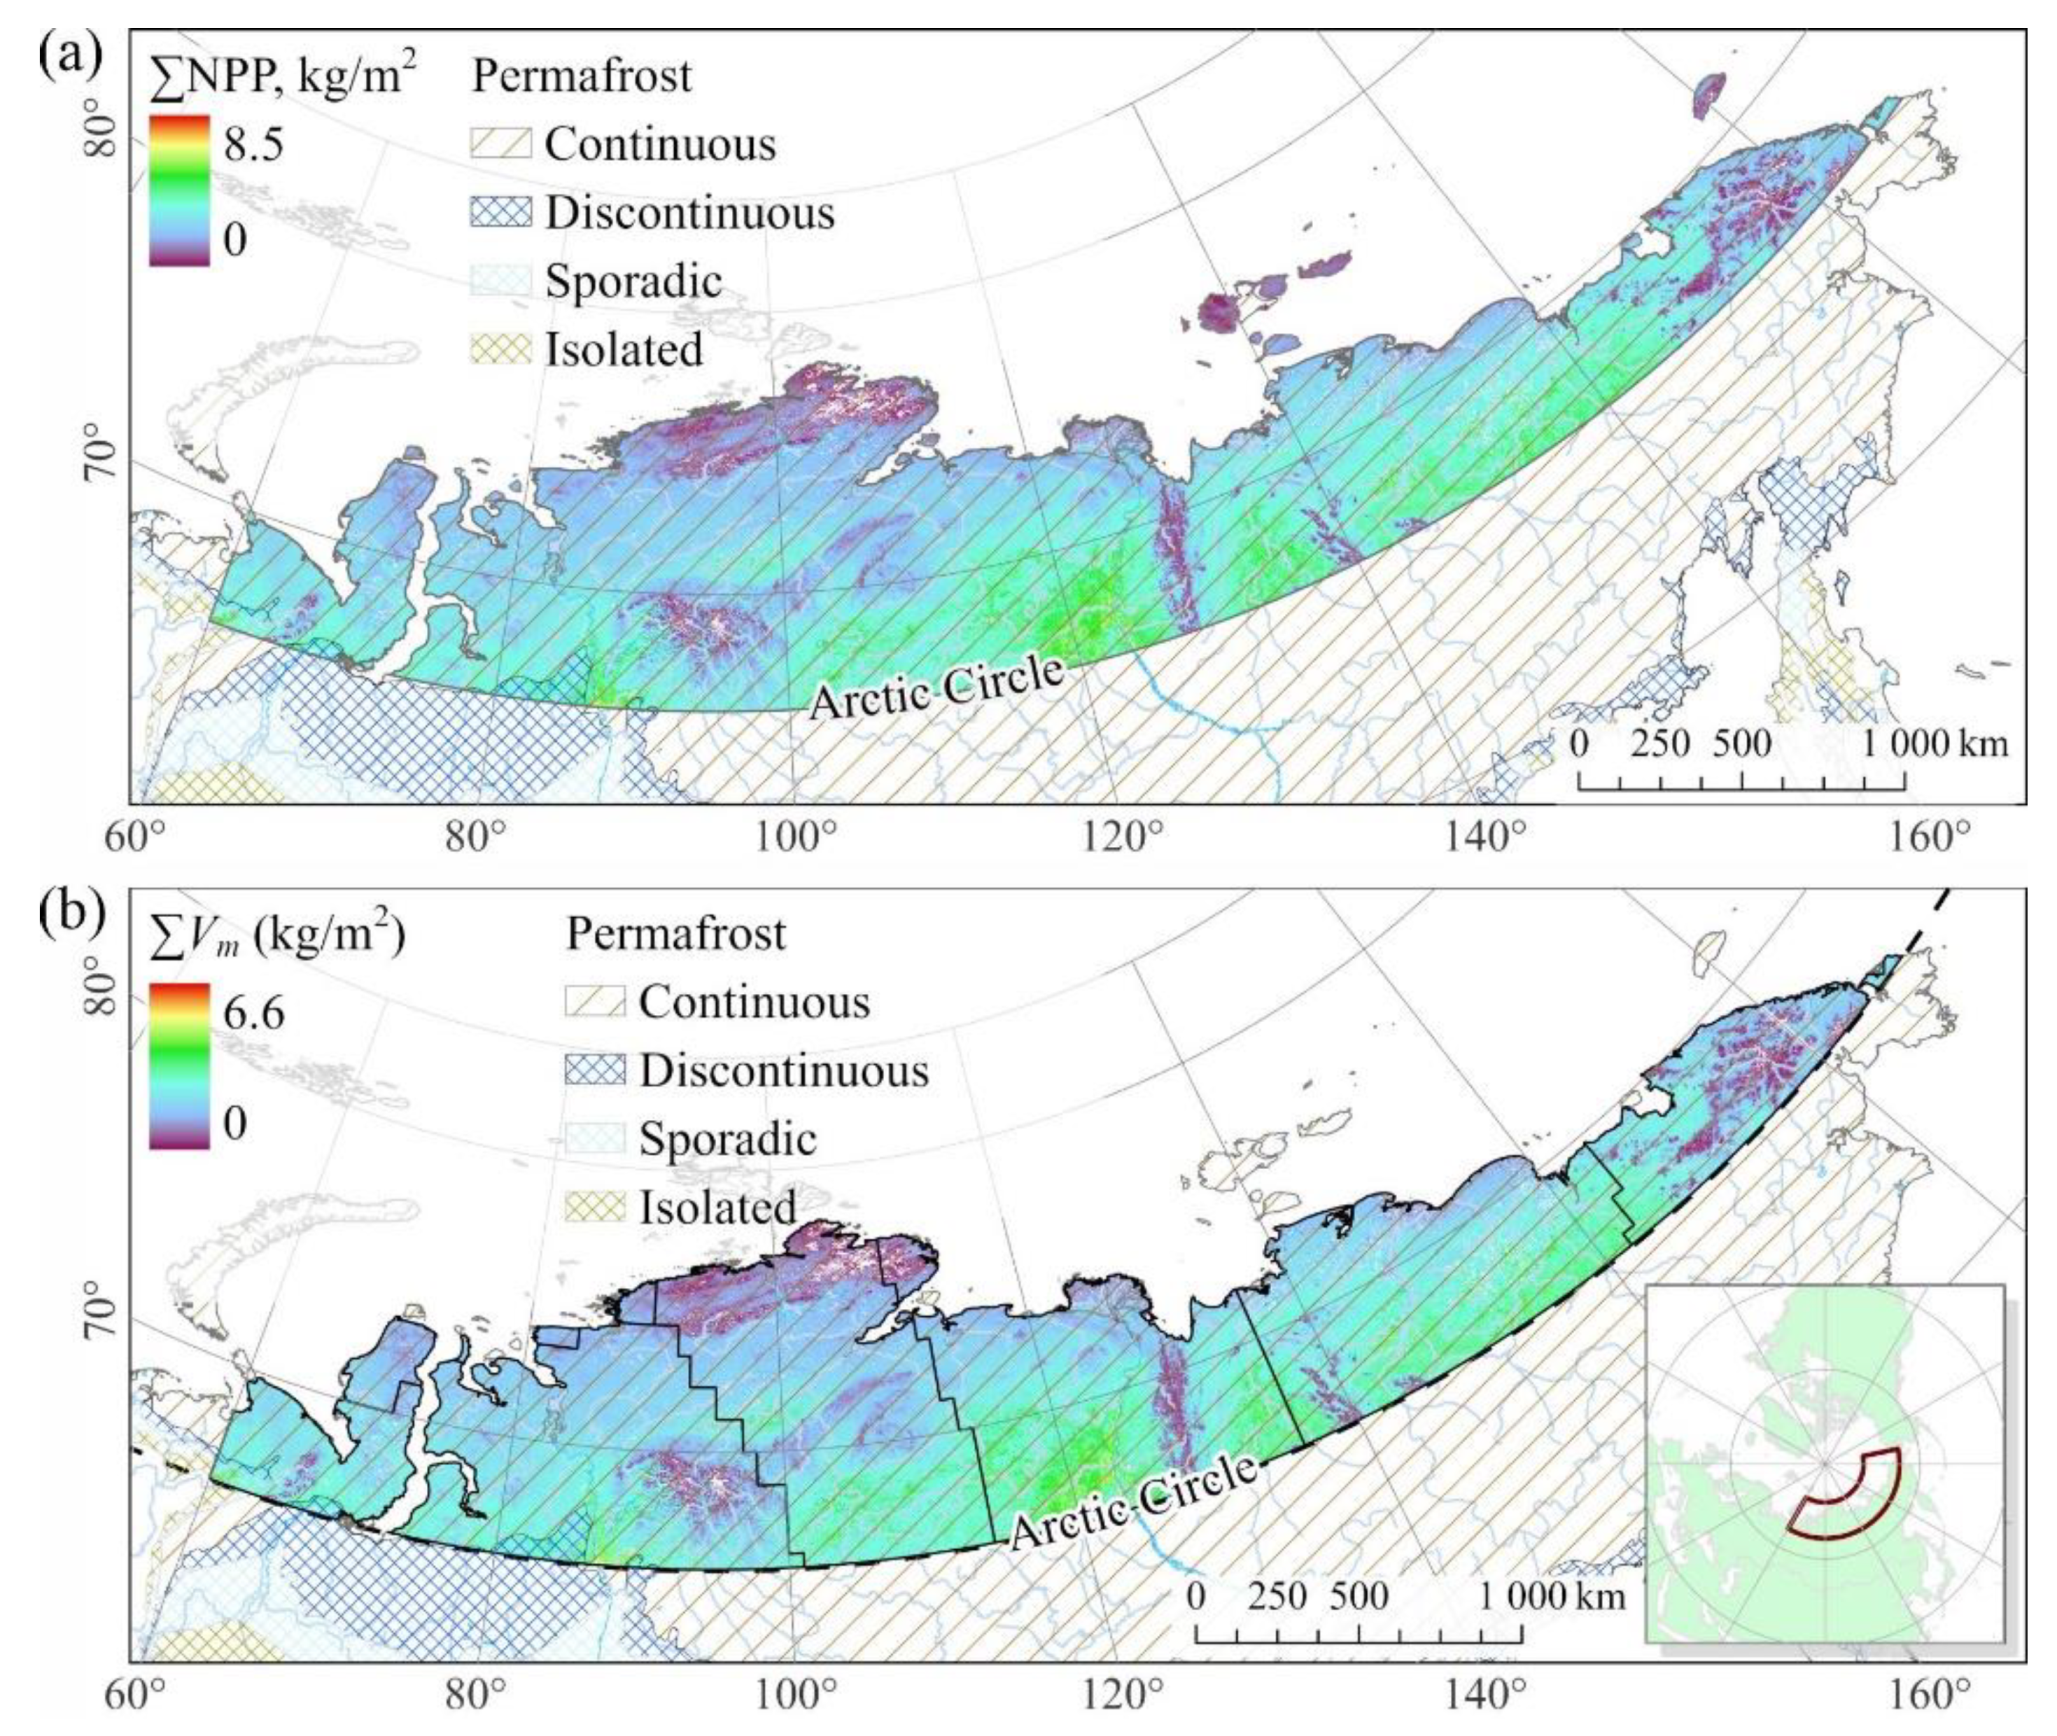
The mean annual fire-caused carbon loss was 8.6 (σ = 17.5) Mt C/year or 0.08 kg C/m2/year.
The percentage of the annual burned area is about 0.17±0.34 %/year (Figure 7).
3.3. Corrected Melting Water Runoff (WR)
The map of corrected melting water runoff within the total study area is presented in Figure 8a. Water runoff within given Arctic sectors is given in Figure 8b and in Table 1. Thus, the mean annual WR within the Siberian Arctic is 7.7 ± 4.4 kg/m2/yr. Maximal values occurred in the West and Mid Siberian sectors (about 9.7 kg/m2/yr), and negative ones (i.e., water accumulation) were observed in the Chukotka Peninsula sector (-2.9 ± 3.2 kg/m2/yr) (Table 1).
3.4. Melting Water Influence on the Vegetation Productivity
Within the Arctic, positive NPP trends prevailed (~15%, whereas negative trends were observed in about ~1% of the area). Positive were trends observed mostly within the western Arctic (Figure 9a). Generally, NPP within the Arctic showed a strong increasing trend (Figure 9b).
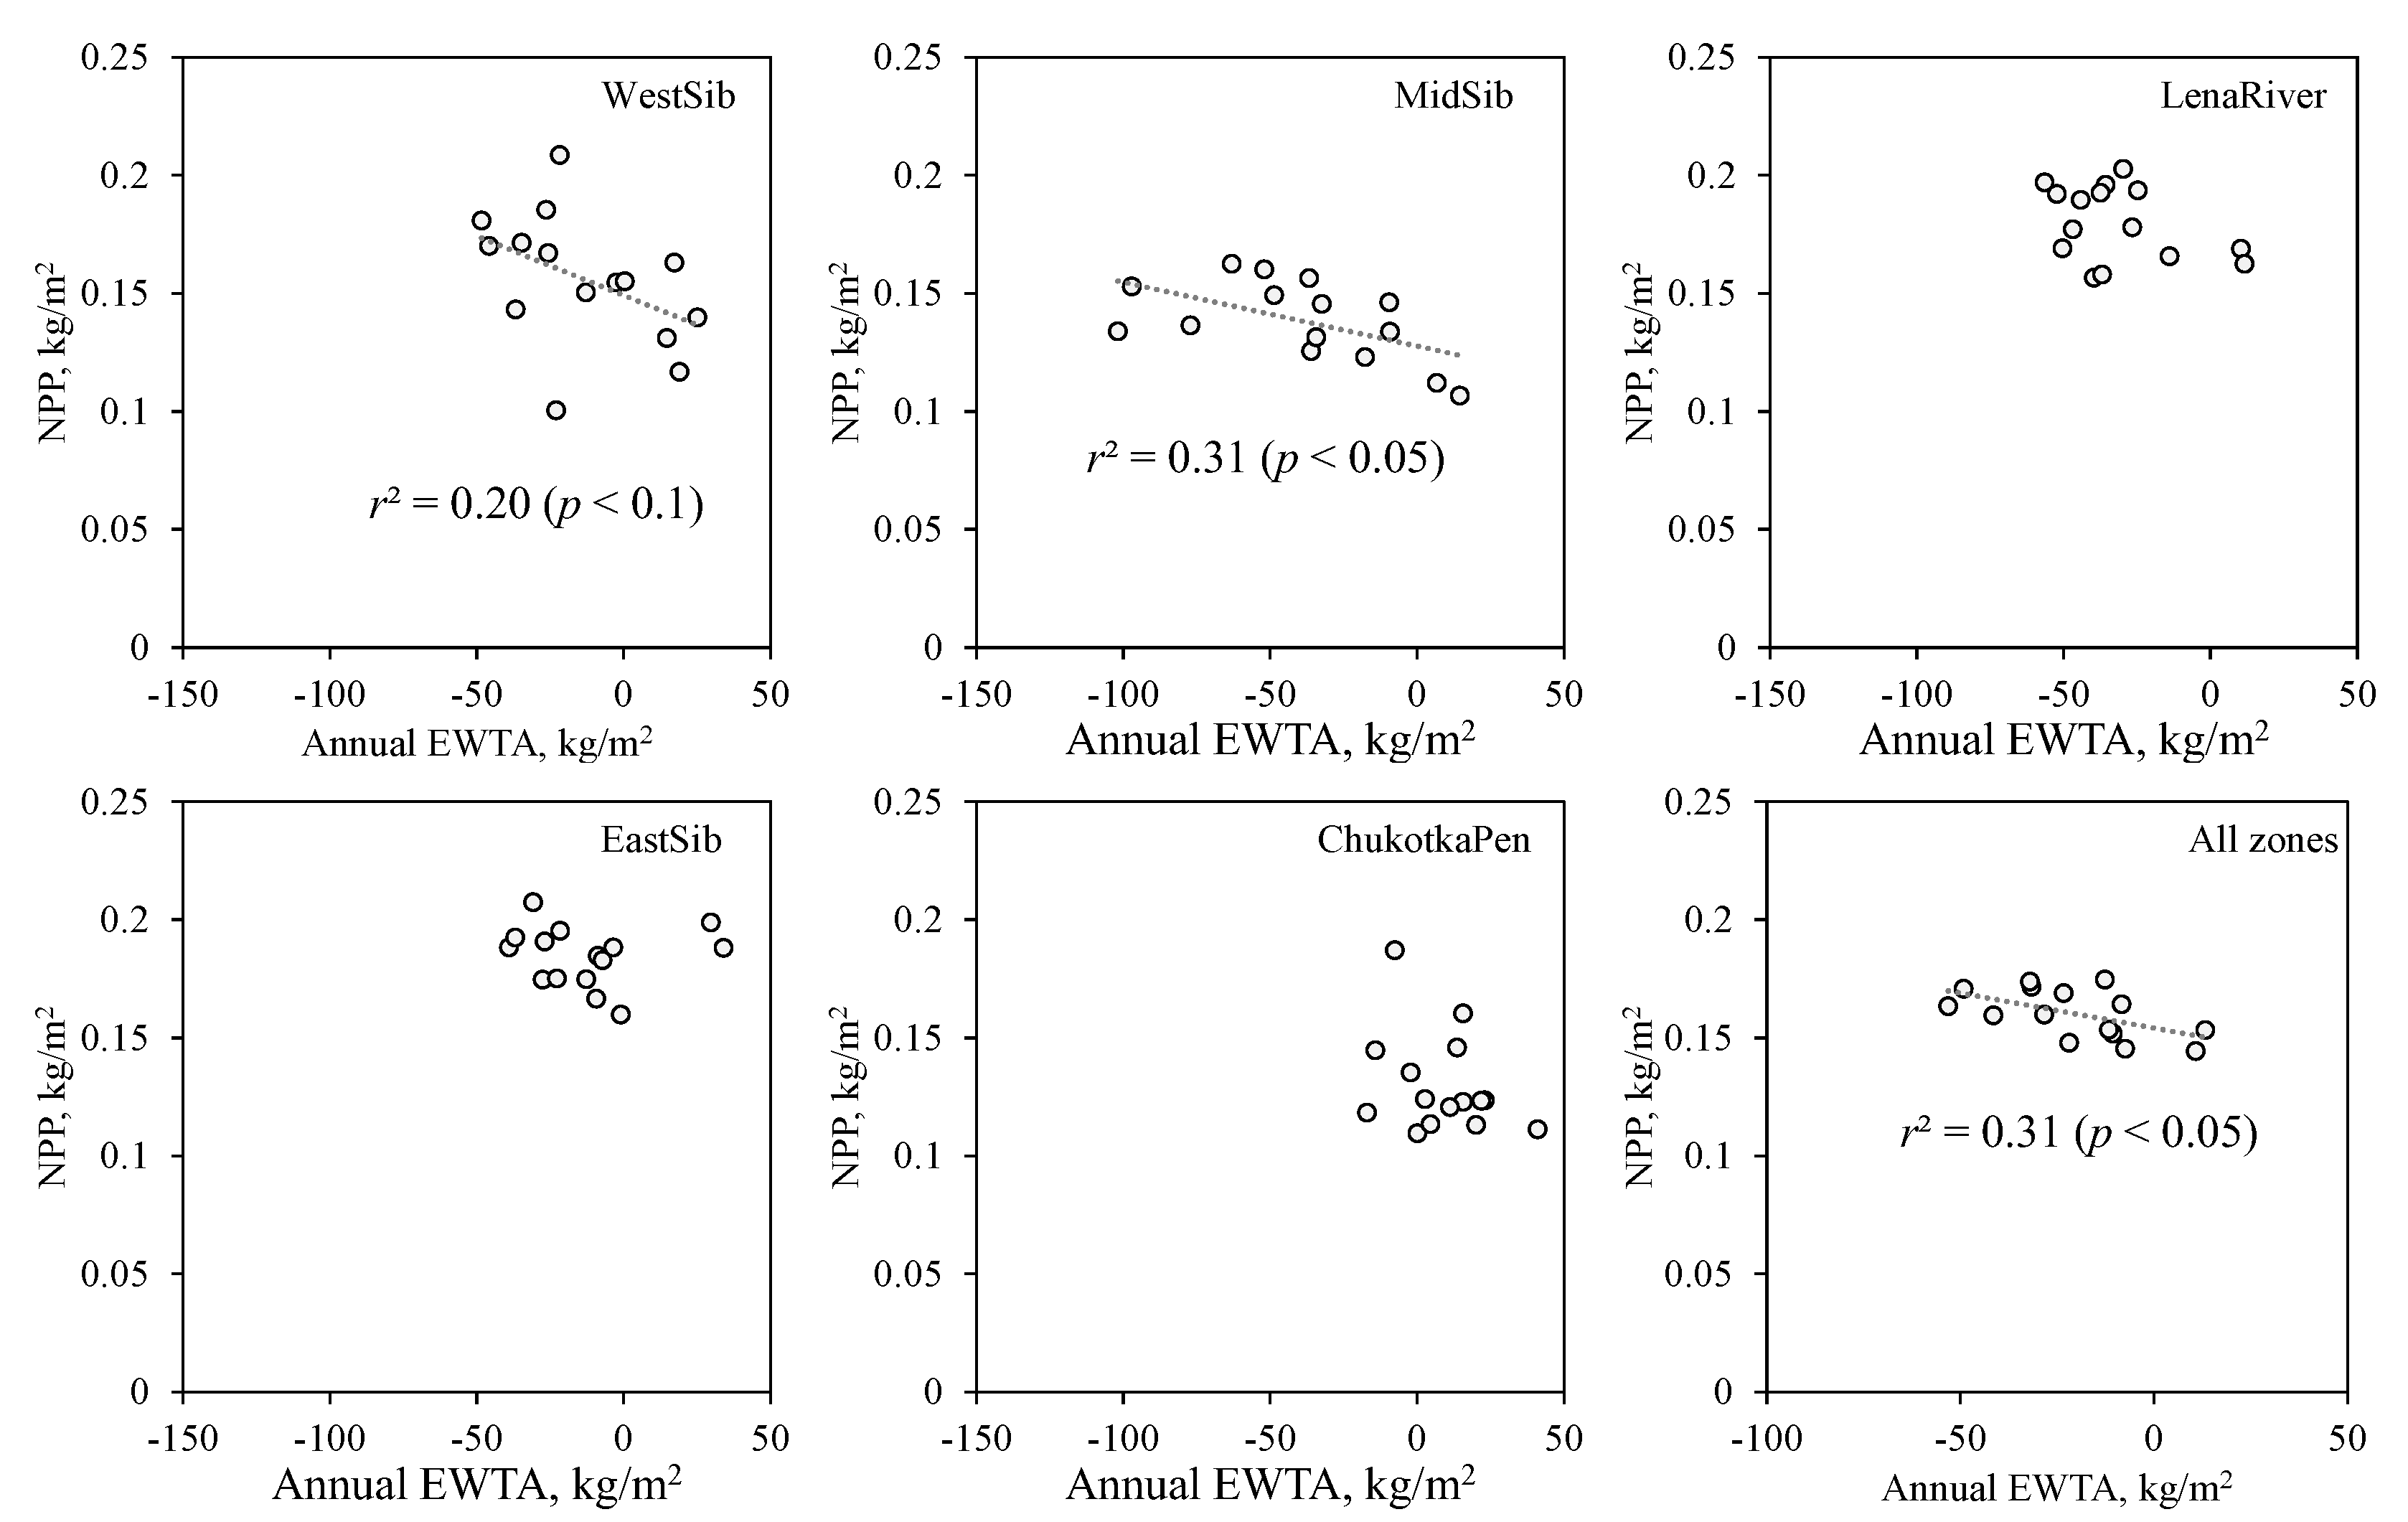
The NPP correlated with WR mostly within northern and central parts of the western Arctic sectors (WestSib and MidSib; Figure 10a). Throughout the Arctic, positive correlations were observed within 4.5% of the analyzed area, negative and insignificant ones on the 1% and 94%, respectively (p < 0.1). Although within the WestSib sector, NPP significantly correlated with water runoff (Figure 10b; r = 0.49; p < 0.05). The latter referred to the higher permafrost melting in the West Siberian plain [41]. Meanwhile, NPP correlations with WA were observed throughout the Arctic (r = 0.55, p < 0.05) (Figure A1).
Alongside melting water runoff, NPP negatively correlated with precipitation and positively with air temperature (Figures 11a,b).
3.5. Melting Water Runoff Influence on the Larch Trees Growth
Larch trees’ growth index (GI) significantly correlated with water anomalies during the growth period (JJA) (with the exception of the Pyasino site): the less water content in permafrost, the higher GI of larch trees (r = –0.64…–0.85). For the hydrological year, correlations were significant for all sites (r = –0.57…–0.76; Figure 12a). Similarly, the more water runoff (i.e., less water content in soils), the higher tree’s growth (r = –0.51…0.57).
Alongside that, larch GI positively correlated with air and soil temperature and vapor pressure deficit (VPD) whereas negatively with precipitation (Figure 12b). Note: although, for the Embechime site, correlations were insignificant due to a shorter interval of observations (until 2012 only).
4. Discussion
In the Siberian Arctic, a long-term continuous trend of water content decrease in permafrost is observed, whereas an annual melt water runoff is increasing throughout the Arctic with the exception of the Chukotka Peninsula sector (Figure 2, Figure 8). Melt water runoff (with a mean rate of 7.7 ± 4.4 kg/m-2/yr.) entailed soil moisture decrease (and, evidently, an active layer depth increase) that leads to an increase in vegetation cover productivity and trees’ growth index (GI) (Figure 10, 1Figure 12). A similar relationship has been established for larch trees (r = 0.55). Positive correlations between NPP and melt water runoff dominated in the western part of the Arctic (over 10% of the area), which is relevant to higher permafrost melting in that area [41]. Earlier larch growth and vegetation GPP positive correlations with soil moisture decrease were reported for the Mid-Siberian Arctic [10,15]. Larch trees’ (L. gmelinii) growth stimulation by permafrost melting is found also in the mountains of northeastern China. However, that was referred to moisture deficit in that area [7,42]. Meanwhile, seasonal water stress in spring also occurred in the permafrost zone while the water supply was blocked [7,43].
Arctic soils are typically waterlogging so-called "cold wet soils". Thus, root zone temperature, along with the air temperature, limits the vegetation growth. Soil temperature is determined also by soil moisture due to the high heat capacity of water. The found trends of water runoff and, in general, a water contend decrease indicated an improvement in the hydrothermal regime in the Arctic soils. In general, a water content decrease in permafrost soils resulted in an increase of NPP (r2 = –0.31; Figure A1).
The hydrothermal regime improvement, together with warming, are triggers of larch tree growth and an increase in vegetation NPP. Meanwhile, vegetation productivity increase caused negative feedback since ground cover is a thermal insulator that decreases permafrost melting [9]. Along with meltwater runoff, water "conservation" is observed in forming bogs and ponds due to thermokarst, especially in the case of ice-enriched soils [2]. Warming also stimulates solifluction, i.e., the flow of waterlogged soils on slopes [9,44]. Thus, in the Taimyr Peninsula, the frequency of landslides has increased by more than ten times in the last decade. Notably, that was accompanied by a sharp (>20 times) increase in carbon fixation [45]. In some regions, the melting of permafrost soils was stimulated by an increase in "warm rains" [9]. However, within the studied area, we found a negative precipitation influence on the larch trees and vegetation growth (Figures 11p,q,r,t, 12b).
Primarily, permafrost melting reduces waterlogging of soils, increases soil drainage and active layer depth, and enriches the root layer with oxygen and biogenic elements. Thus, in the zone of non-continuous permafrost, the thawing depth reached 2–8 m [41]. However, the estimation of the melting water runoff influence on the active layer depth needs more studies.
The main factors determining the dynamics of gravitational mass (i.e., satellite GRACE data) include, along with the mass of water (in solid and liquid state), the NPP, precipitation, and wildfires’ variations. To consider NPP decay, we used the decay coefficient (k = 0.03 g g-1 yr-1; equation (3)) [31,33,34]. That coefficient may differ in different phytocenoses, but relevant data is not available in the literature. The precipitation and evapotranspiration influences are taken into account by equation (5). The estimated fire-caused carbon loss was surprisingly low compared to NPP (about two orders; Table 1). However, the majority of carbon emissions occurred southward of the Arctic Circle [46].
In general, warming-driven permafrost melt stimulated trees’ growth and vegetation productivity in the Arctic which, despite elevating the burning rate, still keeps the status of the carbon sink.
5. Conclusions
Based on the satellite gravimetry, we revealed a continuous decrease in water content in the permafrost and an increase (with the exception of the Chukotka Peninsula sector) of melt water runoff (with a rate of about 7.4 kg/m-2/yr). A warming-driven permafrost degradation promoted larch trees’ growth and an increase in vegetation NPP. In the warming climate, permafrost melt leads to improvement of the soils’ hydrothermal regime that, in turn, stimulates vegetation growth and supports the Arctic as a carbon sink despite the burning rate increase.
Author Contributions
Conceptualization, V.I.K.; Methodology, V.I.K., S.T.I., I.A.P., E.G.S.; Validation, V.I.K., S.T.I.; I.A.P., E.G.S.; Formal Analysis, S.T.I., I.A.P., E.G.S.; Investigation, V.I.K.; S.T.I., I.A.P., E.G.S.; Resources, S.T.I., E.G.S.; Data Curation, S.T.I., I.A.P., E.G.S.; Writing—Original Draft Preparation, V.I.K., S.T.I., I.A.P.; Visualization, S.T.I., I.A.P., E.G.S.; Supervision, V.I.K.; Project Administration, V.I.K.; Funding Acquisition, V.I.K. All authors have read and agreed to the published version of the manuscript.
Funding
This research was funded by the Tomsk State University Development Program «Priority-2030».
Data Availability Statement
The data presented in this study are openly available: climate data in https://cds.climate.copernicus.eu (accessed on 6 November 2024); EWTA in https://podaac-opendap.jpl.nasa.gov/opendap/hyrax/allData/tellus/L3 (accessed on 15 May 2024), reference number [19]; NPP in https://lpdaac.usgs.gov/products/mod17a3hgfv006/ (accessed on 15 May 2024) reference number [22]. Wildfires-caused carbon loss data available from E.G.S.
Conflicts of Interest
The authors declare no conflict of interest.
Appendix A
Figure A1.
Correlations between NPP and EWTA (or water anomalies) within the Arctic sectors. Significant correlations were observed in the WestSib and MidSib sectors.
Figure A1.
Correlations between NPP and EWTA (or water anomalies) within the Arctic sectors. Significant correlations were observed in the WestSib and MidSib sectors.
References
- Liljedahl, A. K.; Boike, J.; Daanen, R.P.; Fedorov, A.N.; Frost, G.V.; Grosse, G.; Hinzman, L.D.; Iijma, Y.; Jorgenson, J.C.; Matveyeva, N.; Necsoiu, M.; Raynolds, M.K.; Romanovsky, V.E.; Schulla, J.; Tape, K.D.; Walker, D.A.; Wilson, C.J.; Yabuki, H.; Zona, D. Pan-Arctic ice-wedge degradation in warming permafrost and its influence on tundra hydrology. Nat. Geosci. 2016, 9, 312–318. [Google Scholar] [CrossRef]
- Nitzbon, J.; Westermann, S.; Langer, M.; Martin, L.C.P.; Strauss, J.; Laboor, S.; Boike, J. Fast response of cold ice-rich permafrost in northeast Siberia to a warming climate. Nat. Commun. 2020, 11, 2201. [Google Scholar] [CrossRef] [PubMed]
- Anisimov, O.; Kokorev, V.; Zhil’tsova, Y. Temporal and spatial patterns of modern climatic warming: case study of Northern Eurasia. Clim. Change. 2013, 118, 871–883. [Google Scholar] [CrossRef]
- Romanovsky. V.; Isaksen., K., Drozdov., D., Anisimov., O., Instanes., A., Leibman., M., McGuire., A., Shiklomanov., N., Smith., S., Walker. D. Chapter 4: Changing permafrost and its impacts. In Snow, Water, Ice and Permafrost in the Arctic (SWIPA): Climate Change and The Cryosphere, Symon, C., Eds.; Arctic Monitoring and Assessment Programme (AMAP): Oslo, Norway, 2017; pp. 65–102. [Google Scholar]
- Hu, G.; Zhao, L.; Wu, T.; Wu, X.; Park, H.; Fedorov, A.; Wei, Y.; Li, R.; Zhu, X.; Sun, Z.; Ni, J.; Zou, D. Spatiotemporal variations and regional differences in air temperature in the permafrost regions in the Northern Hemisphere during 1980–2018. Sci. Total. Environ. 2021, 791, 148358. [Google Scholar] [CrossRef] [PubMed]
- Rantanen. M.; Karpechko. A.Yu.; Lipponen. A.; Nordling. K.; Hyvärinen. O.; Ruosteenoja. K.; Vihma. T. The Arctic has warmed nearly four times faster than the globe since 1979. Commun. Earth Environ. 2022, 3, 168. [CrossRef]
- Zhang, X.; Ba, X.; Chang, Y.; Chen, Z. Increased sensitivity of Dahurian larch radial growth to summer temperature with the rapid warming in Northeast China. Trees. 2016, 30, 1799–1806. [Google Scholar] [CrossRef]
- Fox-Kemper, B., Hewitt, H.T., Xiao, C., et al, Chapter 9: Ocean, Cryosphere and Sea Level Change. In Climate Change 2021: The Physical Science Basis. Contribution of Working Group I to the Sixth Assessment Report of the Intergovernmental Panel on Climate Change; Masson-Delmotte, V., P. Zhai, A. Pirani, S.L et al., Eds.; Cambridge University Press, Cambridge, United Kingdom and New York, NY, USA, 2021; pp. 1211–1362. [CrossRef]
- Heijmans, M.M.P.D.; Magnússon, R.Í.; Lara, M.J.; Frost, G.V.; Myers-Smith, I.H.; van Huissteden, J.; Jorgenson, M.T.; Fedorov, A.N.; Epstein, H.E.; Lawrence, D.M.; Limpens, J. Tundra vegetation change and impacts on permafrost. Nat. Rev. Earth. Environ. 2022, 3, 68–84. [Google Scholar] [CrossRef]
- Kharuk, V.I.; Petrov, I.A.; Im, S.T.; Golyukov, A.S.; Dvinskaya, M.L.; Shushpanov, A.S.; Savchenko, A.P.; Temerova, V.L. Subarctic Vegetation under the Mixed Warming and Air Pollution Influence. Forests 2023, 14, 615. [Google Scholar] [CrossRef]
- Kharuk, V.I.; Dvinskaya, M.L.; Im, S.T.; Golyukov, A.S.; Smith, K.T. Wildfires in the Siberian Arctic. Fire 2022, 5, 106. [Google Scholar] [CrossRef]
- Kharuk, V.I., Golyukov, A.S.; Dvinskaya, M.L.; Im S. T.; Petrov I.A.; Shvetsov E.G. Satellite gravimetry in studies of permafrost melting and vegetation productivity in the cryolithozone. Contemp. Probl. Ecol. 2024, 6. (In Press).
- Barletta, V.R.; Sørensen, L.S.; Forsberg, R. Scatter of mass changes estimates at basin scale for Greenland and Antarctica. The Cryosphere. 2013, 7, 1411–1432. [Google Scholar] [CrossRef]
- Wang, Z.; Zhang, B.; Yao, Y.; Zhang, W. GRACE and mass budget method reveal decelerated ice loss in east Greenland in the past decade. Remote Sens. Environ. 2023, 286. [Google Scholar] [CrossRef]
- Kharuk, V.I.; Petrov, I.A.; Golyukov, A.S.; Dvinskaya, M.L.; Im, S.T.; Shushpanov, A.S. Larch growth across thermal and moisture gradients in the Siberian Mountains. J. Mt. Sci. 2023, 20, 101–114. [Google Scholar] [CrossRef]
- Matveeva, N.V. Zonality in the vegetation cover of the Arctic. Proceedings of the V. L. Komarov Botanical Institute, Russian Academy of Sciences, Issue 21: SPb, Russia, 1998; 220 pp. (in Russian).
- Yakushkin, G.D.; Kokorev, Ya.I.; Kolpashchikov, L.A. Natural zones and the animal world of Taimyr; “LitKaraVan” Publishing house: Belgorod, 2012. 276 pp. (in Russian) [Google Scholar]
- Brown, J.; Ferrians, O.J.; Heginbottom, J.A.; Melnikov, E.S. Circum-Arctic Map of Permafrost and Ground Ice Conditions, Ver. 2; Digital Media; National Snow and Ice Data Center: Boulder, CO, USA, 2002; Available online: https://nsidc.org/data/ggd318 (accessed on 13 August 2024).
- Landerer, F.W.; Swenson, S.C. Accuracy of scaled GRACE terrestrial water storage estimates. Water Resour. Res. 2012, 48, W04531. [Google Scholar] [CrossRef]
- Landerer, F. 2023. GFZ TELLUS GRACE-FO Level-3 Monthly Land Water-Equivalent-Thickness Surface Mass Anomaly Release 6.1 version 04. Ver. RL06.1v04. PO.DAAC, CA, USA. Available online: https://doi.org/10.5067/GFLND-3G614 (accessed on 1 July 2024). Available online. [CrossRef]
- Running. S.; Zhao. M. MODIS/Terra Net Primary Production Gap-Filled Yearly L4 Global 500m SIN Grid V061. 2021, NASA EOSDIS Land Processes DAAC. [CrossRef]
- Running. S.; Zhao. M. User’s Guide Daily GPP and Annual NPP (MOD17A2H/A3H) and Year-end Gap-Filled (MOD17A2HGF/A3HGF) Products NASA Earth Observing System MODIS Land Algorithm (For Collection 6.1). 2021, NASA EOSDIS Land Processes DAAC. (https://lpdaac.usgs.gov/documents/972/MOD17_User_Guide_V61.pdf, accessed on 2024-01-20).
- Webb, E.E.; Alexander, H.D.; Paulson, A.K.; Loranty, M.M.; DeMarco, J.; Talucci, A.C.; Spektor, V.; Zimov, N.; Lichstein, J.W. Fire-Induced Carbon Loss and Tree Mortality in Siberian Larch Forests. Geophys. Research Letters. 2024, 51, e2023GL105216. [Google Scholar] [CrossRef]
- Muñoz-Sabater, J.; Dutra, E.; Agustí-Panareda, A.; Albergel, C.; Arduini, G.; Balsamo, G.; Boussetta, S.; Choulga, M.; Harrigan, S.; Hersbach, H.; Martens, B.; Miralles, D.G.; Piles, M.; Rodríguez-Fernández, N.J.; Zsoter, E.; Buontempo, C.; Thépaut, J.-N. ERA5-Land: a state-of-the-art global reanalysis dataset for land applications. Earth Syst. Sci. Data. 2021, 13, 4349–4383. [Google Scholar] [CrossRef]
- Duursma, R. A. Plantecophys - An R Package for Analysing and Modelling Leaf Gas Exchange Data. PLoS ONE. 2015, 10, e0143346. [Google Scholar] [CrossRef]
- Rinn, F. TSAP V 3.6 Reference Manual: Computer Program for Tree-Ring Analysis and Presentation; Frank Rinn Distribution: Heidelberg, Germany, 1996; 263 pp. [Google Scholar]
- Holmes, R.L. Computer-assisted quality control in tree-ring dating and measurement. Tree-Ring Bull. 1983, 44, 69–75. [Google Scholar]
- Speer, J.H. Fundamentals of Tree-Ring Research; University of Arizona Press: Tucson, AZ, USA, 2010; 368 pp. [Google Scholar]
- Cook, E.R.; Kairiukstis, L.A. Methods of Dendrochronology: Applications in the Environmental Science; Doredrecht: Kluwer Academic Publishers, 1990; 394 p. [Google Scholar] [CrossRef]
- Olson, J.S. Energy stores and the balance of producers and decomposers in ecological systems. Ecology. 1963, 44, 322–331. [Google Scholar] [CrossRef]
- Silver. W.L.; Miya. R.K. Global patterns in root decomposition: comparisons of climate and litter quality effects. Oecologia. 2001, 29, 407–419. [CrossRef]
- Wieder, R.K.; Lang, G.E. A critique of the analytical methods used in examining decomposition data obtained from litter bags. Ecology. 1982, 63, 1636–1642. [Google Scholar] [CrossRef]
- Gholz, H.L.; Wedin, D.A.; Smitherman, S.M.; Harmon, M.E.; Parton, W.J. Long-term dynamics of pine and hardwood litter in contrasting environments: toward a global model of decomposition. Global Change Biol. 2000, 6, 750–765. [Google Scholar] [CrossRef]
- Zhang, D.; Hui, D.; Luo, Y.; Zhou, G. Rates of Litter Decomposition in Terrestrial Ecosystems: Global Patterns and Controlling Factors. J. Plant. Ecol.-UK. 2008, 1, 85-93. [CrossRef]
- Tsvetkov, P.A. Investigation of the nature of fires in the northern taiga of Central Siberia. Coniferous of boreal zone. 2006, 23, 186–195. (in Russian). [Google Scholar]
- Delcourt, C.; Akhmetzyanov, L.; Combee, A.; Izbicki, B.; Kukavskaya, E.; Mack, M.; Maximov, T.; Petrov, R.; Rogers, B.; Sass-Klaassen, U.; Scholten, R.; Shestakova, T.; van Wees, D.; Veraverbeke, S. Fire Severity and Carbon Combustion in Larch Forest Ecosystems of Northeast Siberia. AGU Fall Meeting. 2021, B25M-1649.
- Veraverbeke, S.; Delcourt, C.; Kukavskaya, E.; Mack, M.; Walker, X.; Hessilt, T.; Rogers, B.; Scholten, R.C. Direct and longer-term carbon emissions from arctic-boreal fires: A short review of recent advances. Current Opinion in Environmental Science & Health. 2021, 23, 100277. [CrossRef]
- Sen, P.K. Estimates of the regression coefficient based on Kendall’s tau. Journal of the American Statistical Association 1968, 63, 1379–1389. [Google Scholar] [CrossRef]
- Conover, W.J. Practical nonparametric statistics, 3rd ed.; Wiley, 1999; 608 p.
- Fernandes, R.; Leblanc, S.G. Parametric (modified least squares) and non-parametric (Theil–Sen) linear regressions for predicting biophysical parameters in the presence of measurement errors. Remote Sensing of Environment 2005, 95(3), 303–316. [Google Scholar] [CrossRef]
- Vasiliev. A.; Drozdov. D.S.; Gravis. A.G.; Malkova. G.V.; Nyland. K.E.; Streletskiy. D.A. Permafrost degradation in the Western Russian Arctic. Environ. Res. Lett. 2020, 15, 045001. [CrossRef]
- Zhu, L.; Wang, M.; Camarero, J. J.; Cooper, D. J.; Yuan, D.; Chen, Z.; Wang, X.; Cherubini, P. Permafrost melting enhances growth but leads to less intra-annual density fluctuations in boreal Larix gmelinii forests at its southernmost limit in northeast China. Ecol. Indic. 2024, 164, 112158. [Google Scholar] [CrossRef]
- Kharuk V.I.; Ranson K.J.; Im S.T.; Petrov I.A. Climate-induced larch growth response within Central Siberian permafrost zone. Environ. Res. Lett. 2015, 10:125009. [CrossRef]
- Kharuk, V.I.; Shushpanov, A.S.; Im, S.T.; Ranson, K.J. Climate-Induced Landslides within the Larch Dominant Permafrost Zone of Central Siberia. Environ. Res. Let. 2016, 11, 045004. [Google Scholar] [CrossRef]
- Bernhard, P.; Zwieback, S.; Hajnsek, I. Accelerated mobilization of organic carbon from retrogressive thaw slumps on the northern Taymyr Peninsula. The Cryosphere. 2022, 16, 2819–2835. [Google Scholar] [CrossRef]
- De Groot, W.J.; Flannigan, M.D.; Cantin, A.S. Climate change impacts on future boreal fire regimes. For. Ecol. Manag. 2013, 294, 35–44. [Google Scholar] [CrossRef]
Figure 1.
The study area is located within continuous permafrost mostly. Stars indicated on-ground study sites (1 – Pyasino, 2 – Ary-Mas, 3 – Kotuy, 4 – Embechime). Background: vegetation landcover classes (according to VEGA PRO map http://pro-vega.ru/eng) and permafrost zones (according to [18]).
Figure 1.
The study area is located within continuous permafrost mostly. Stars indicated on-ground study sites (1 – Pyasino, 2 – Ary-Mas, 3 – Kotuy, 4 – Embechime). Background: vegetation landcover classes (according to VEGA PRO map http://pro-vega.ru/eng) and permafrost zones (according to [18]).
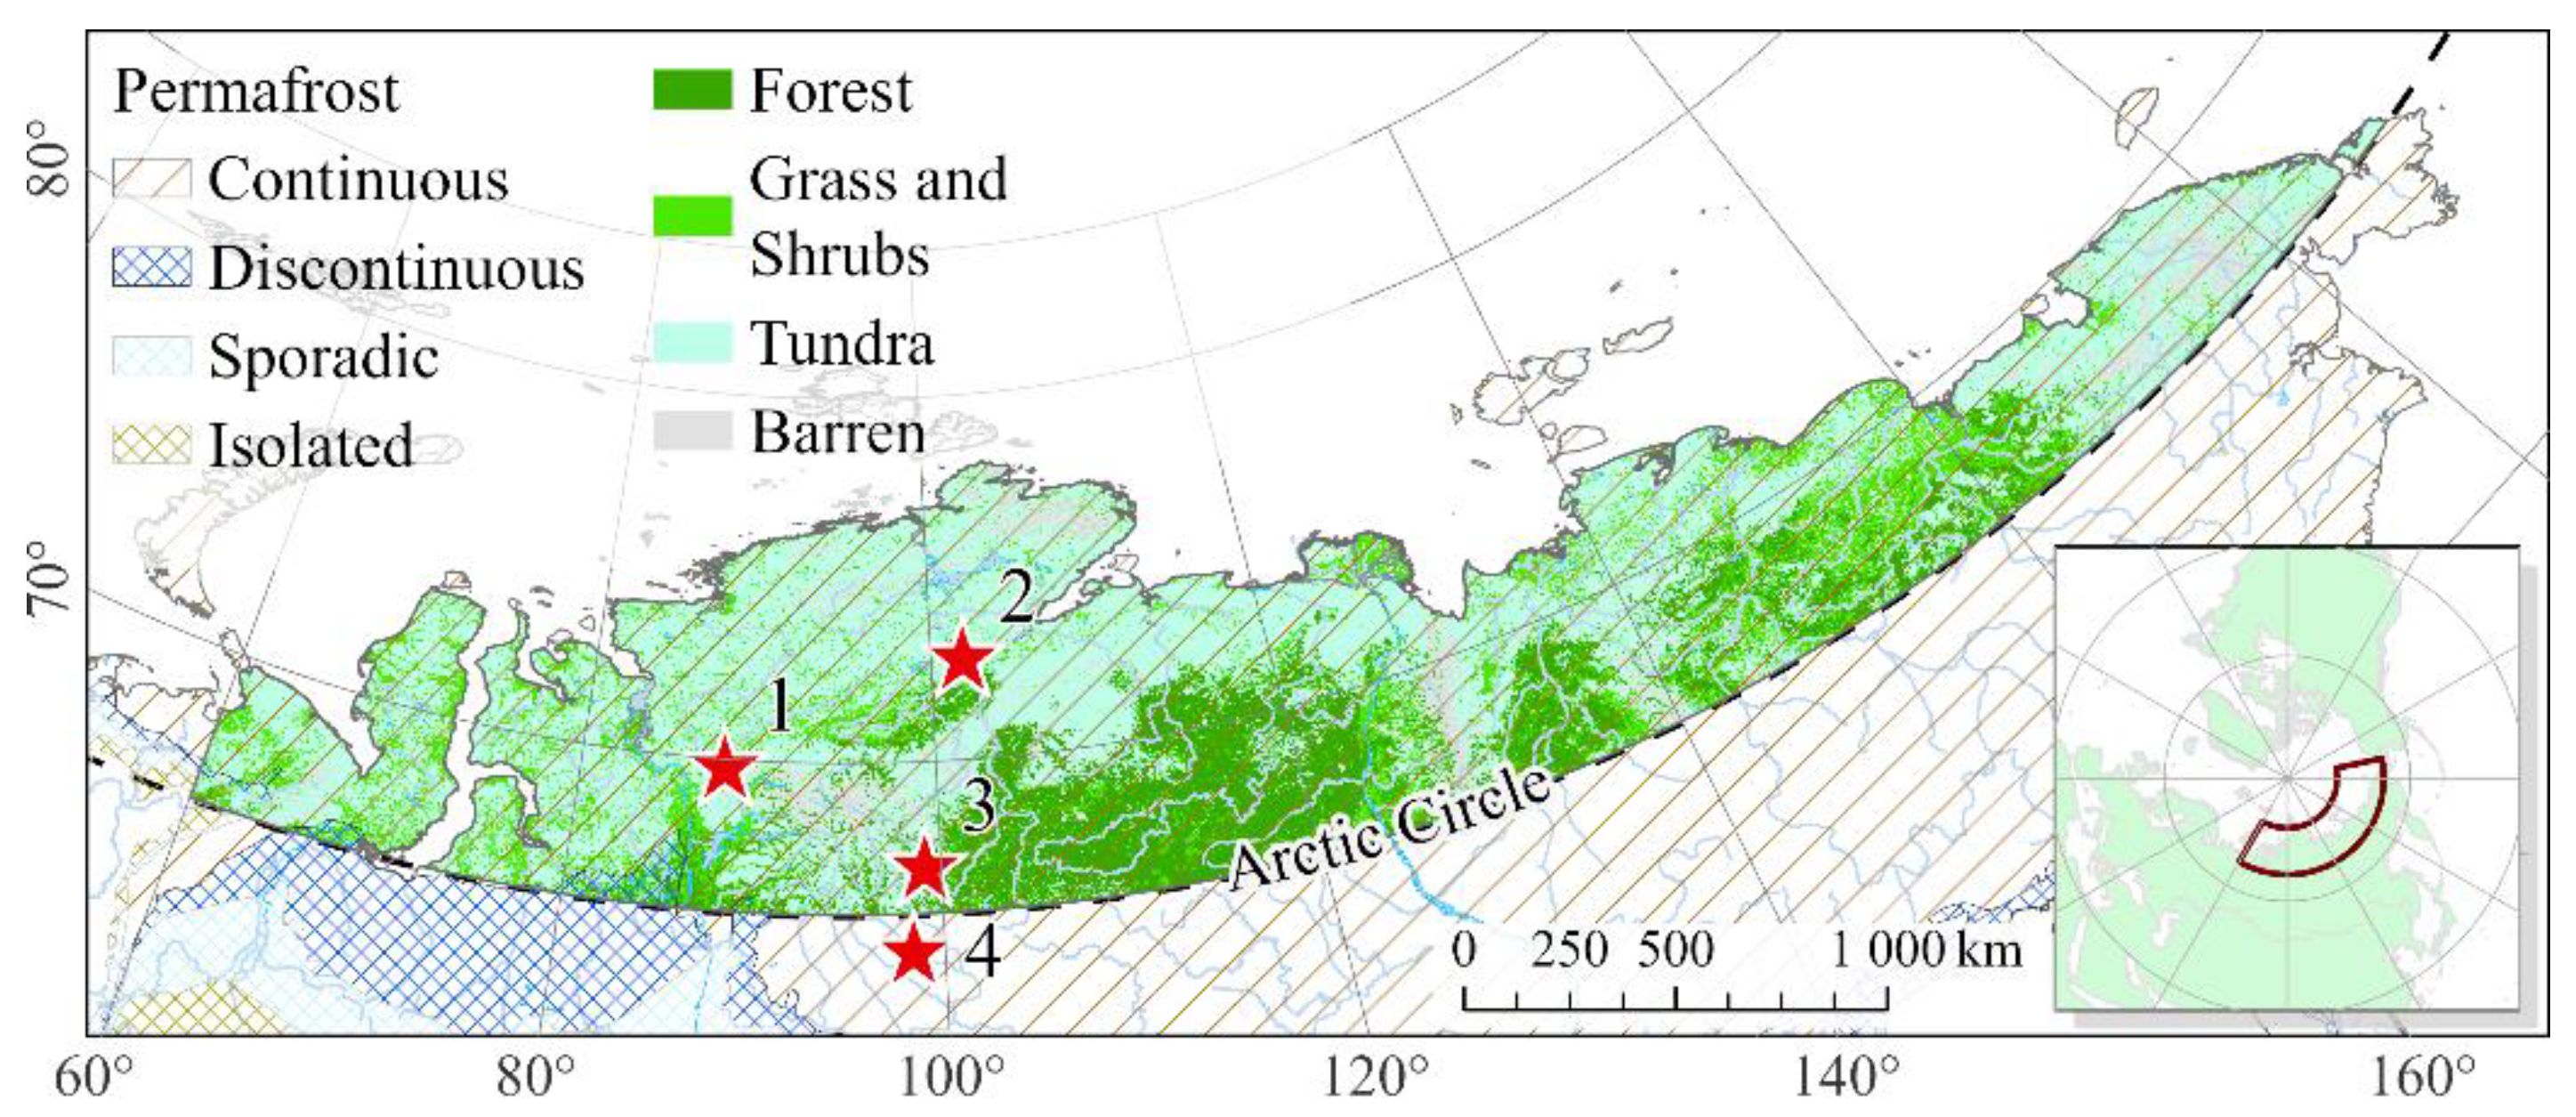
Figure 2.
Within the entire Siberian Arctic, the stable decreasing trend (p < 0.05) of water anomalies (EWTA) has been observed since 2007.
Figure 2.
Within the entire Siberian Arctic, the stable decreasing trend (p < 0.05) of water anomalies (EWTA) has been observed since 2007.
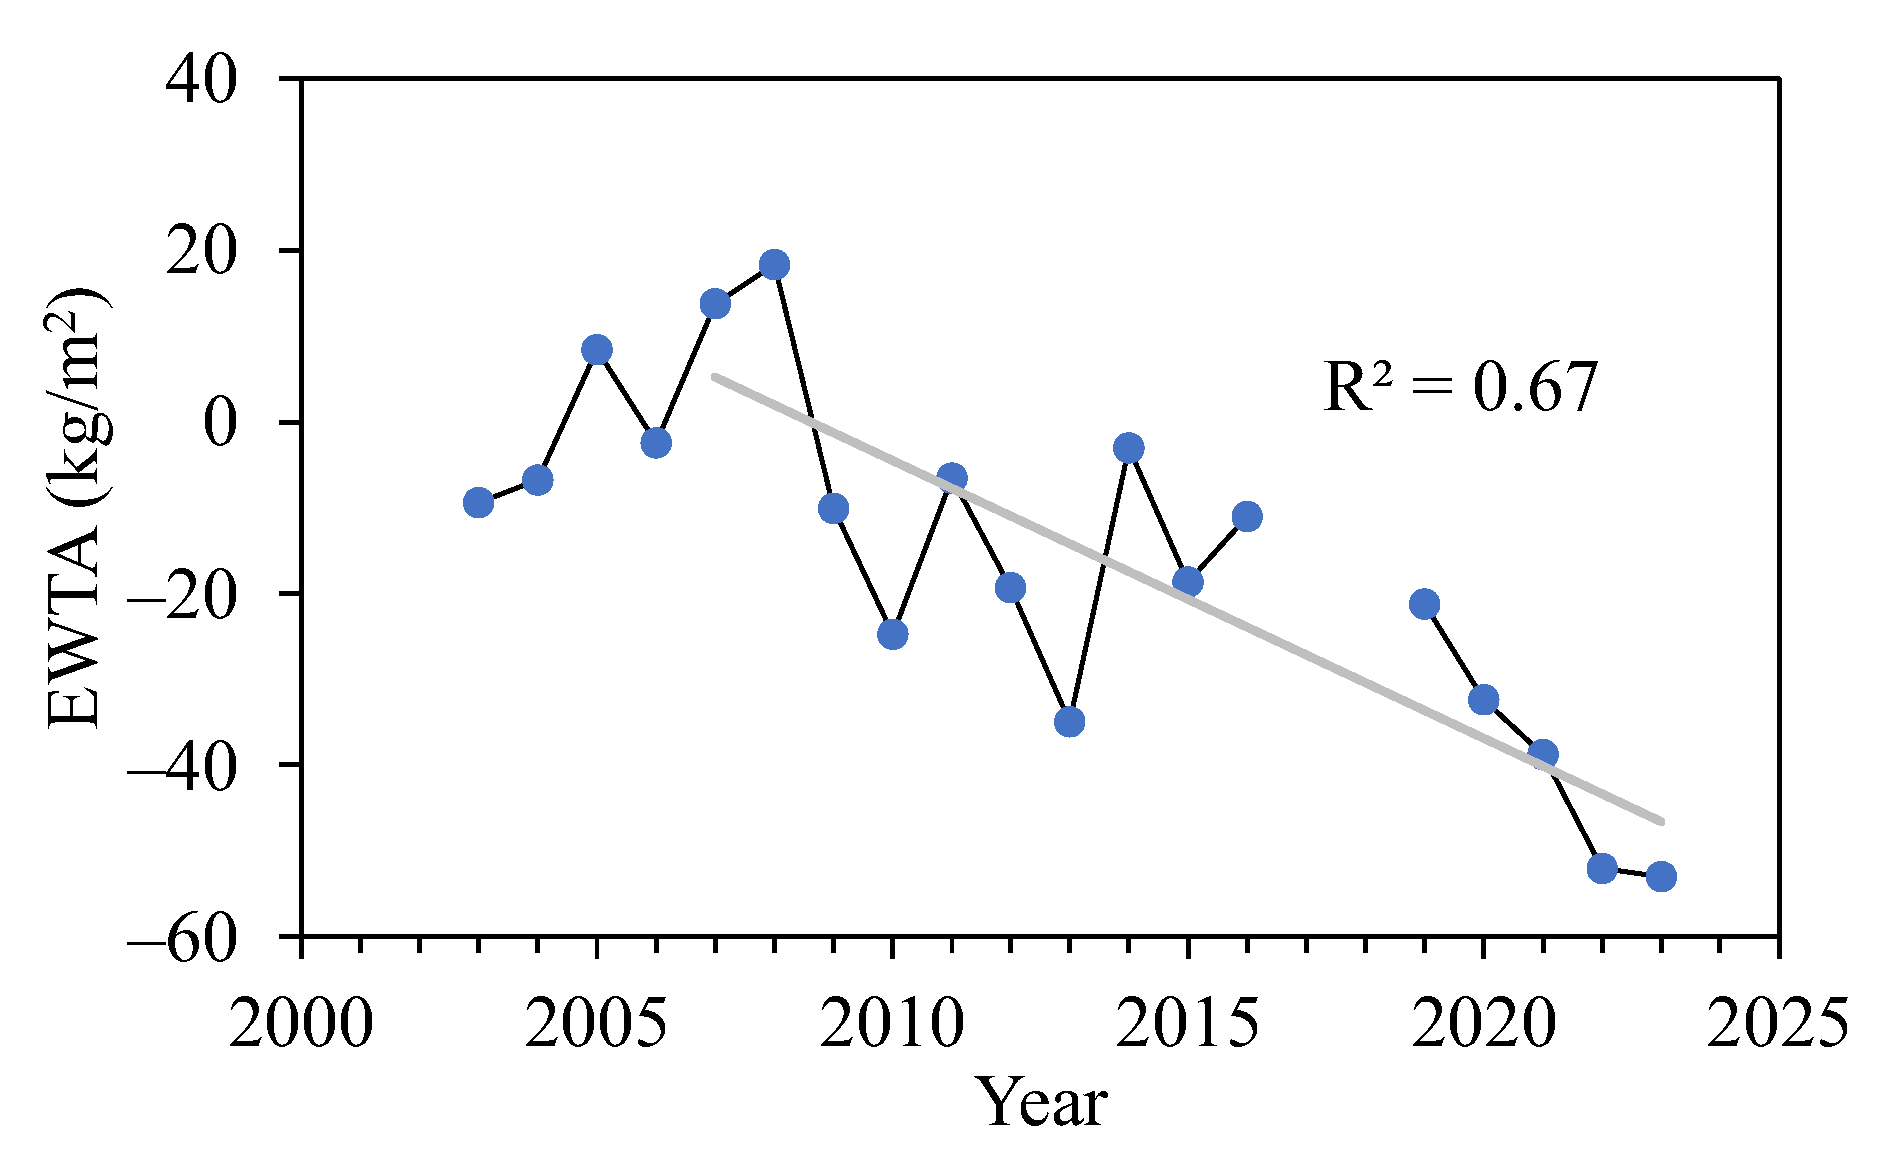
Figure 3.
Portions of the biomass remaining at the given year since the beginning of decomposition.
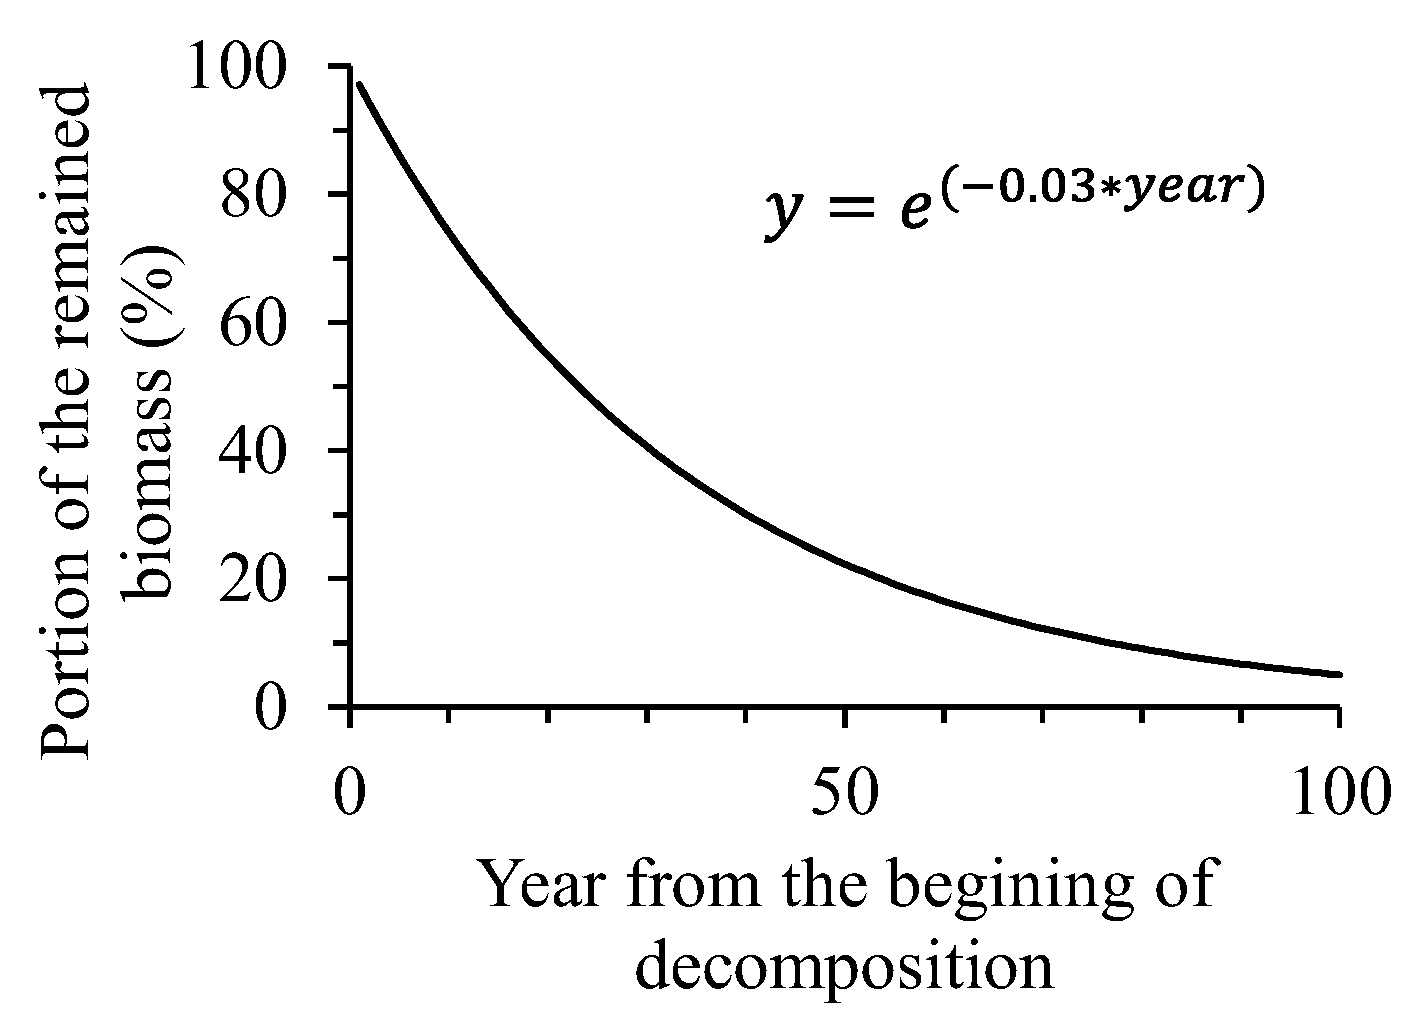
Figure 4.
A map of melting WRr (raw data) changes beyond the Arctic Circle (ΔGm = Gm(2007-2009) – Gm(2021-2023)). Mean ΔGm is 52 kg/m2 (σ = 38; min = –52, max = 175). Positive ΔGm means runoff and negative one means water accumulation. Insert is the study area location.
Figure 4.
A map of melting WRr (raw data) changes beyond the Arctic Circle (ΔGm = Gm(2007-2009) – Gm(2021-2023)). Mean ΔGm is 52 kg/m2 (σ = 38; min = –52, max = 175). Positive ΔGm means runoff and negative one means water accumulation. Insert is the study area location.
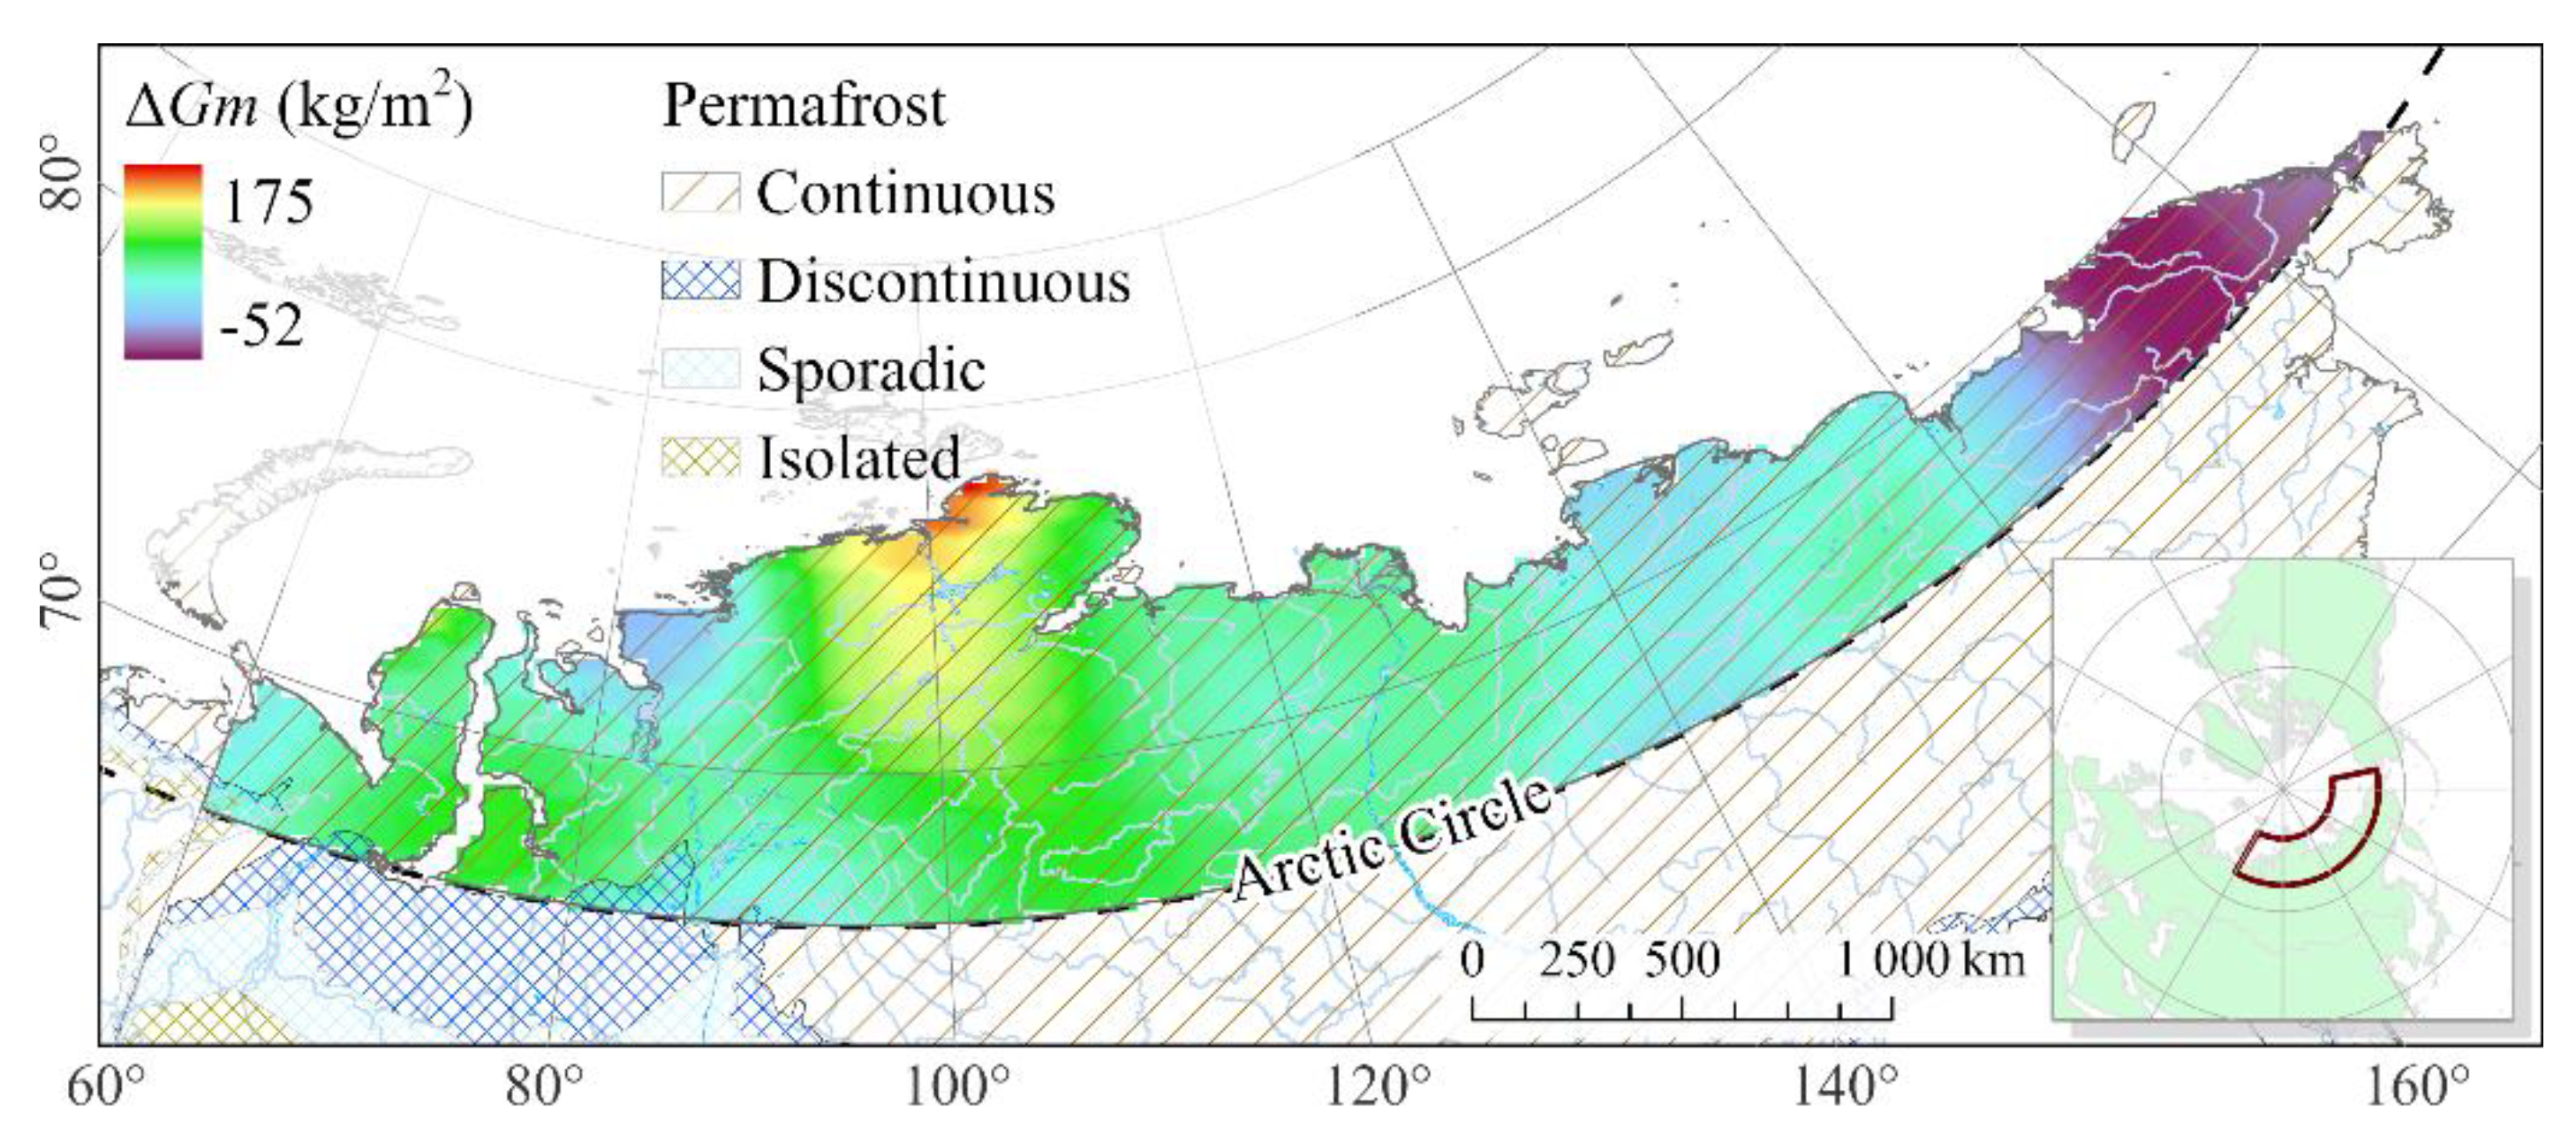
Figure 5.
WRr sectors within the Arctic. Insert is the study area location. The legend: WestSib, MidSib, LenaRiver, EastSib and ChukotkaPen are the West Siberia, Mid Siberia, Lena River, East Siberia, and Chukotka Peninsula clusters, respectively.
Figure 5.
WRr sectors within the Arctic. Insert is the study area location. The legend: WestSib, MidSib, LenaRiver, EastSib and ChukotkaPen are the West Siberia, Mid Siberia, Lena River, East Siberia, and Chukotka Peninsula clusters, respectively.
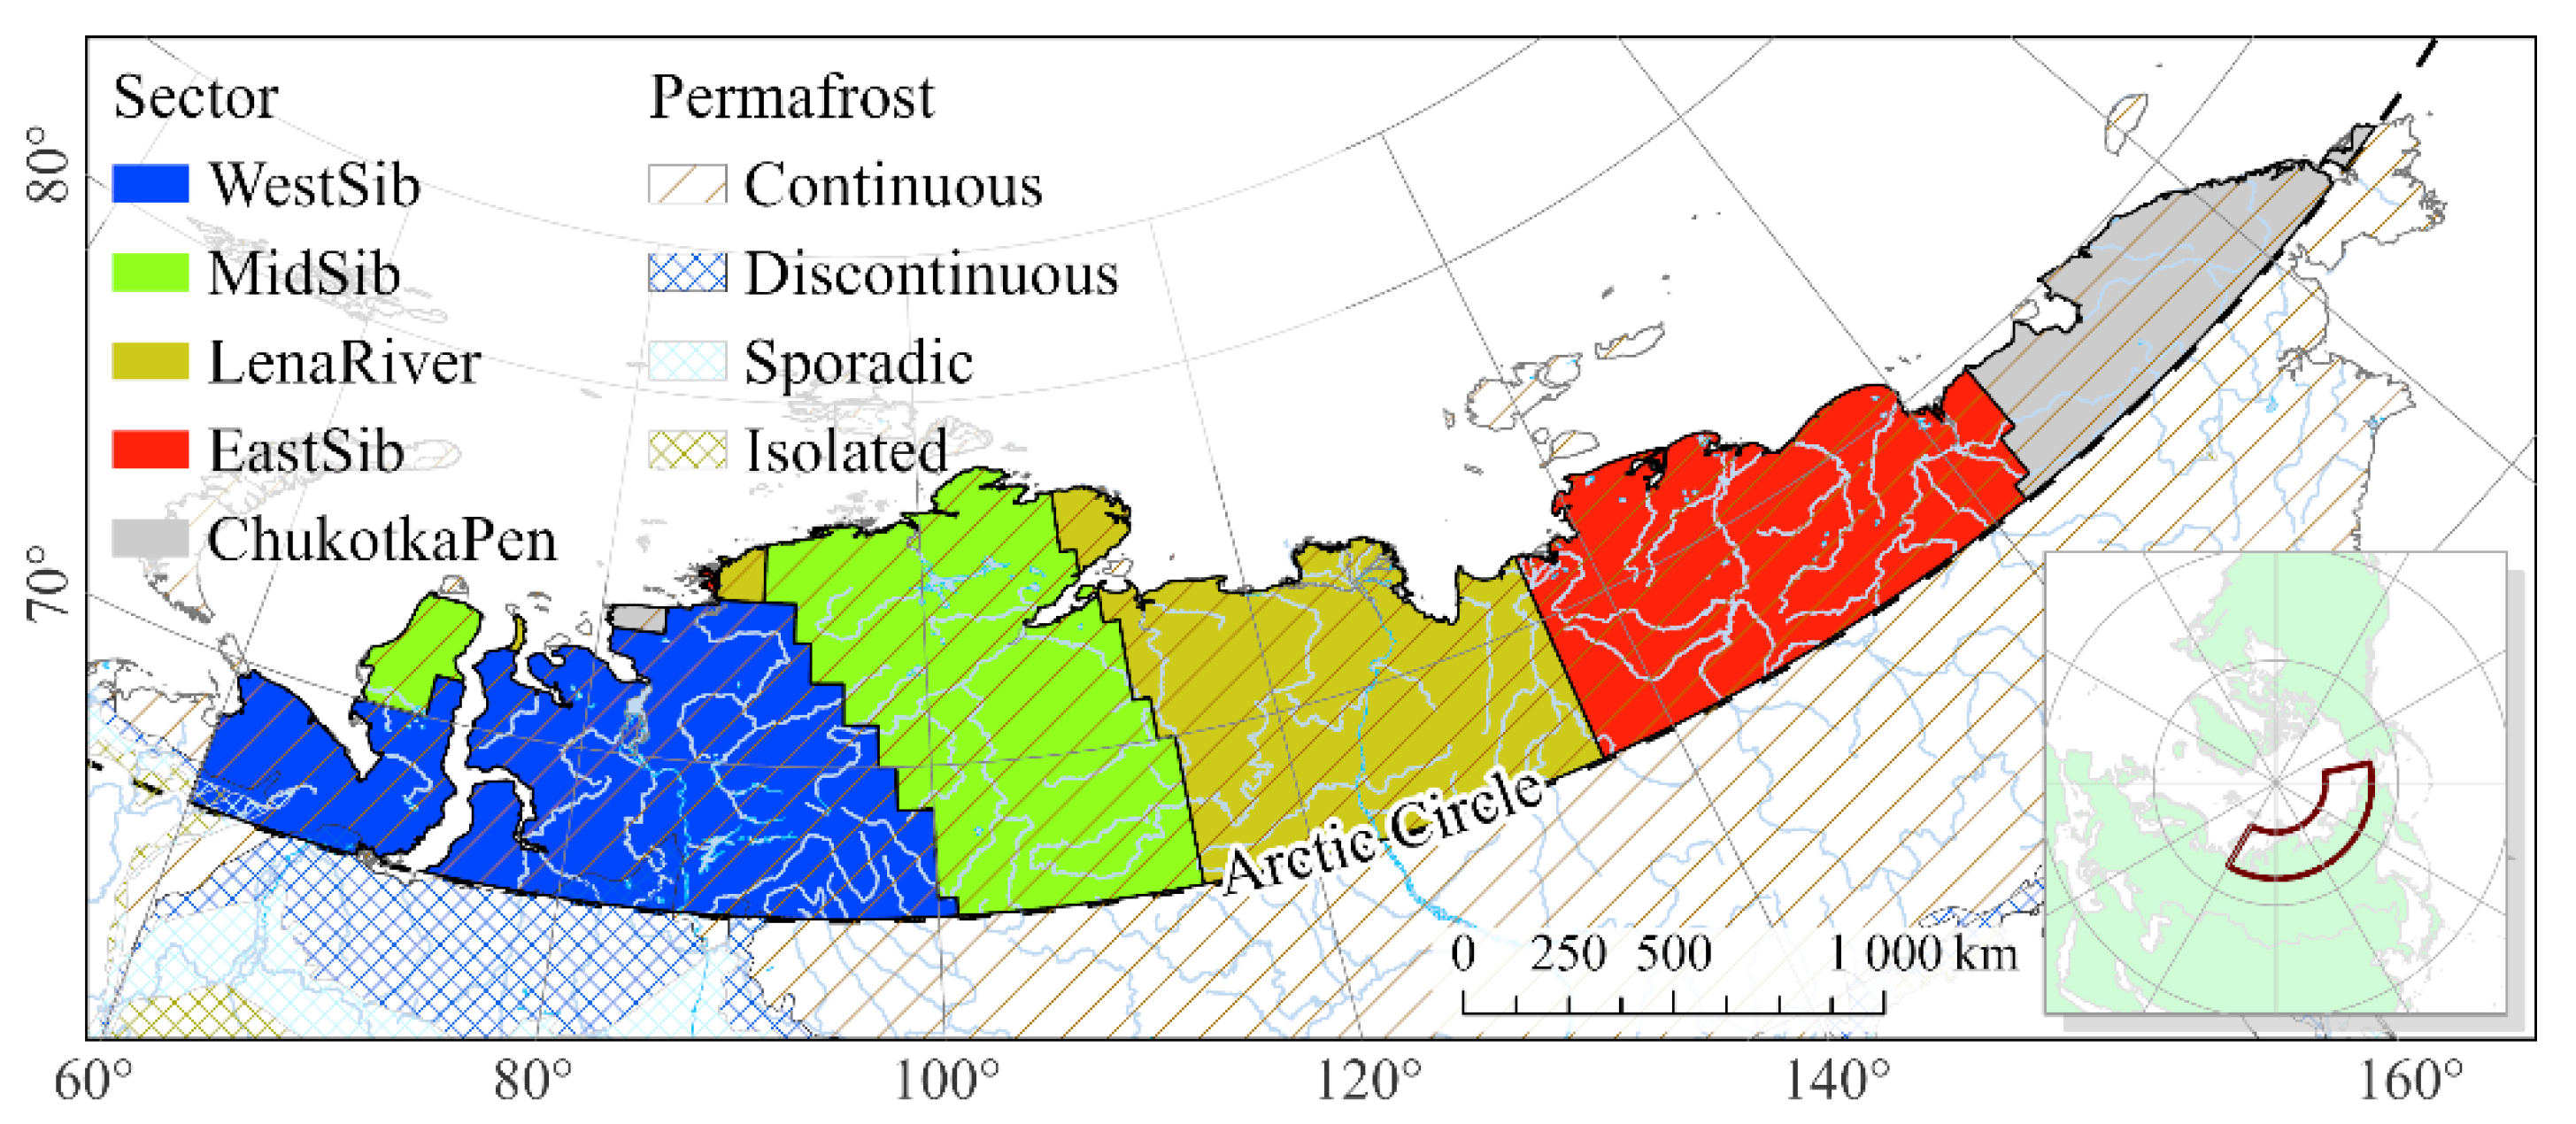
Figure 6.
The WRr (raw data) dynamics within Arctic sectors (Figure 5). On average, during 2007–2023 mean water runoff rate was about ~3 kg/m2/y (r2 = 0.67). Vertical lines show a 95% confidence interval. The trends are significant at p < 0.05. Years 2017 and 2018 were excluded because > 25% of the data were missed. Abbreviations: WestSib, MidSib, LenaRiver, EastSib, and ChukotkaPen are the West Siberia, Mid Siberia, Lena River, East Siberia, and Chukotka Peninsula clusters, respectively.
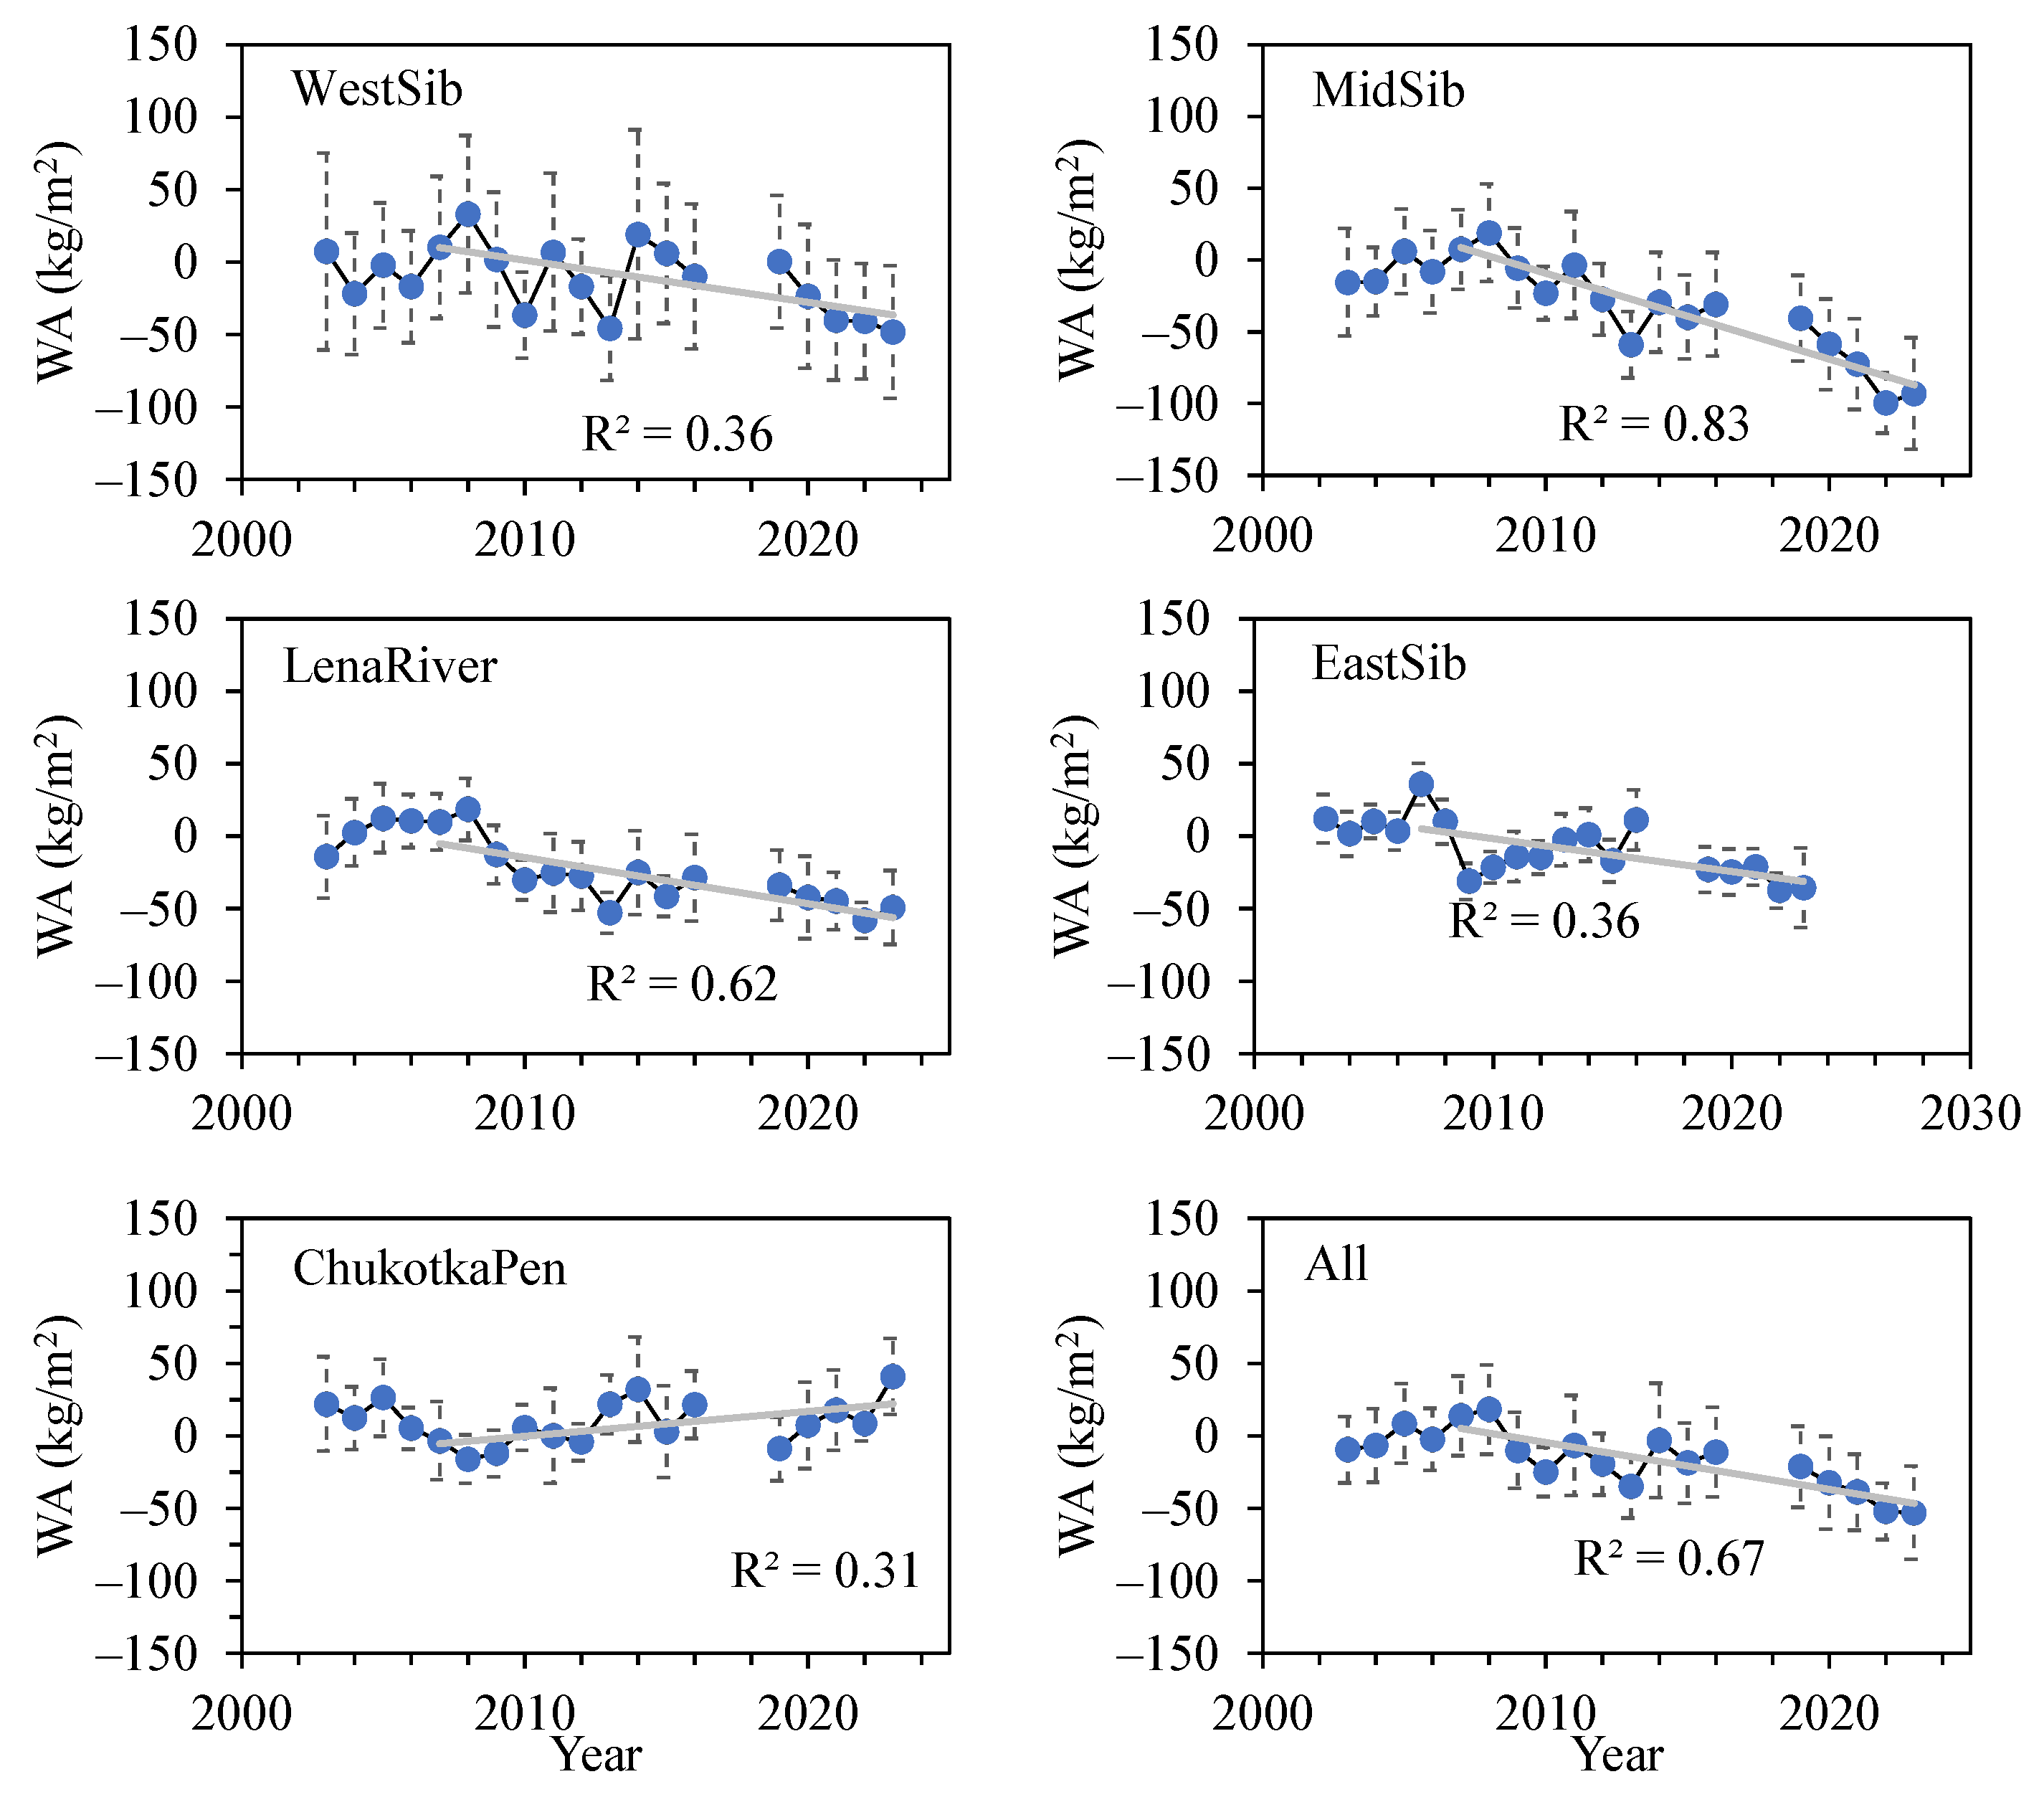
Figure 7.
Total fire-caused carbon loss (∑F) during 2007–2023. Mean ∑F is 0.06 kg/m2 (σ = 0.35; min = 0, max = 11.16).
Figure 7.
Total fire-caused carbon loss (∑F) during 2007–2023. Mean ∑F is 0.06 kg/m2 (σ = 0.35; min = 0, max = 11.16).
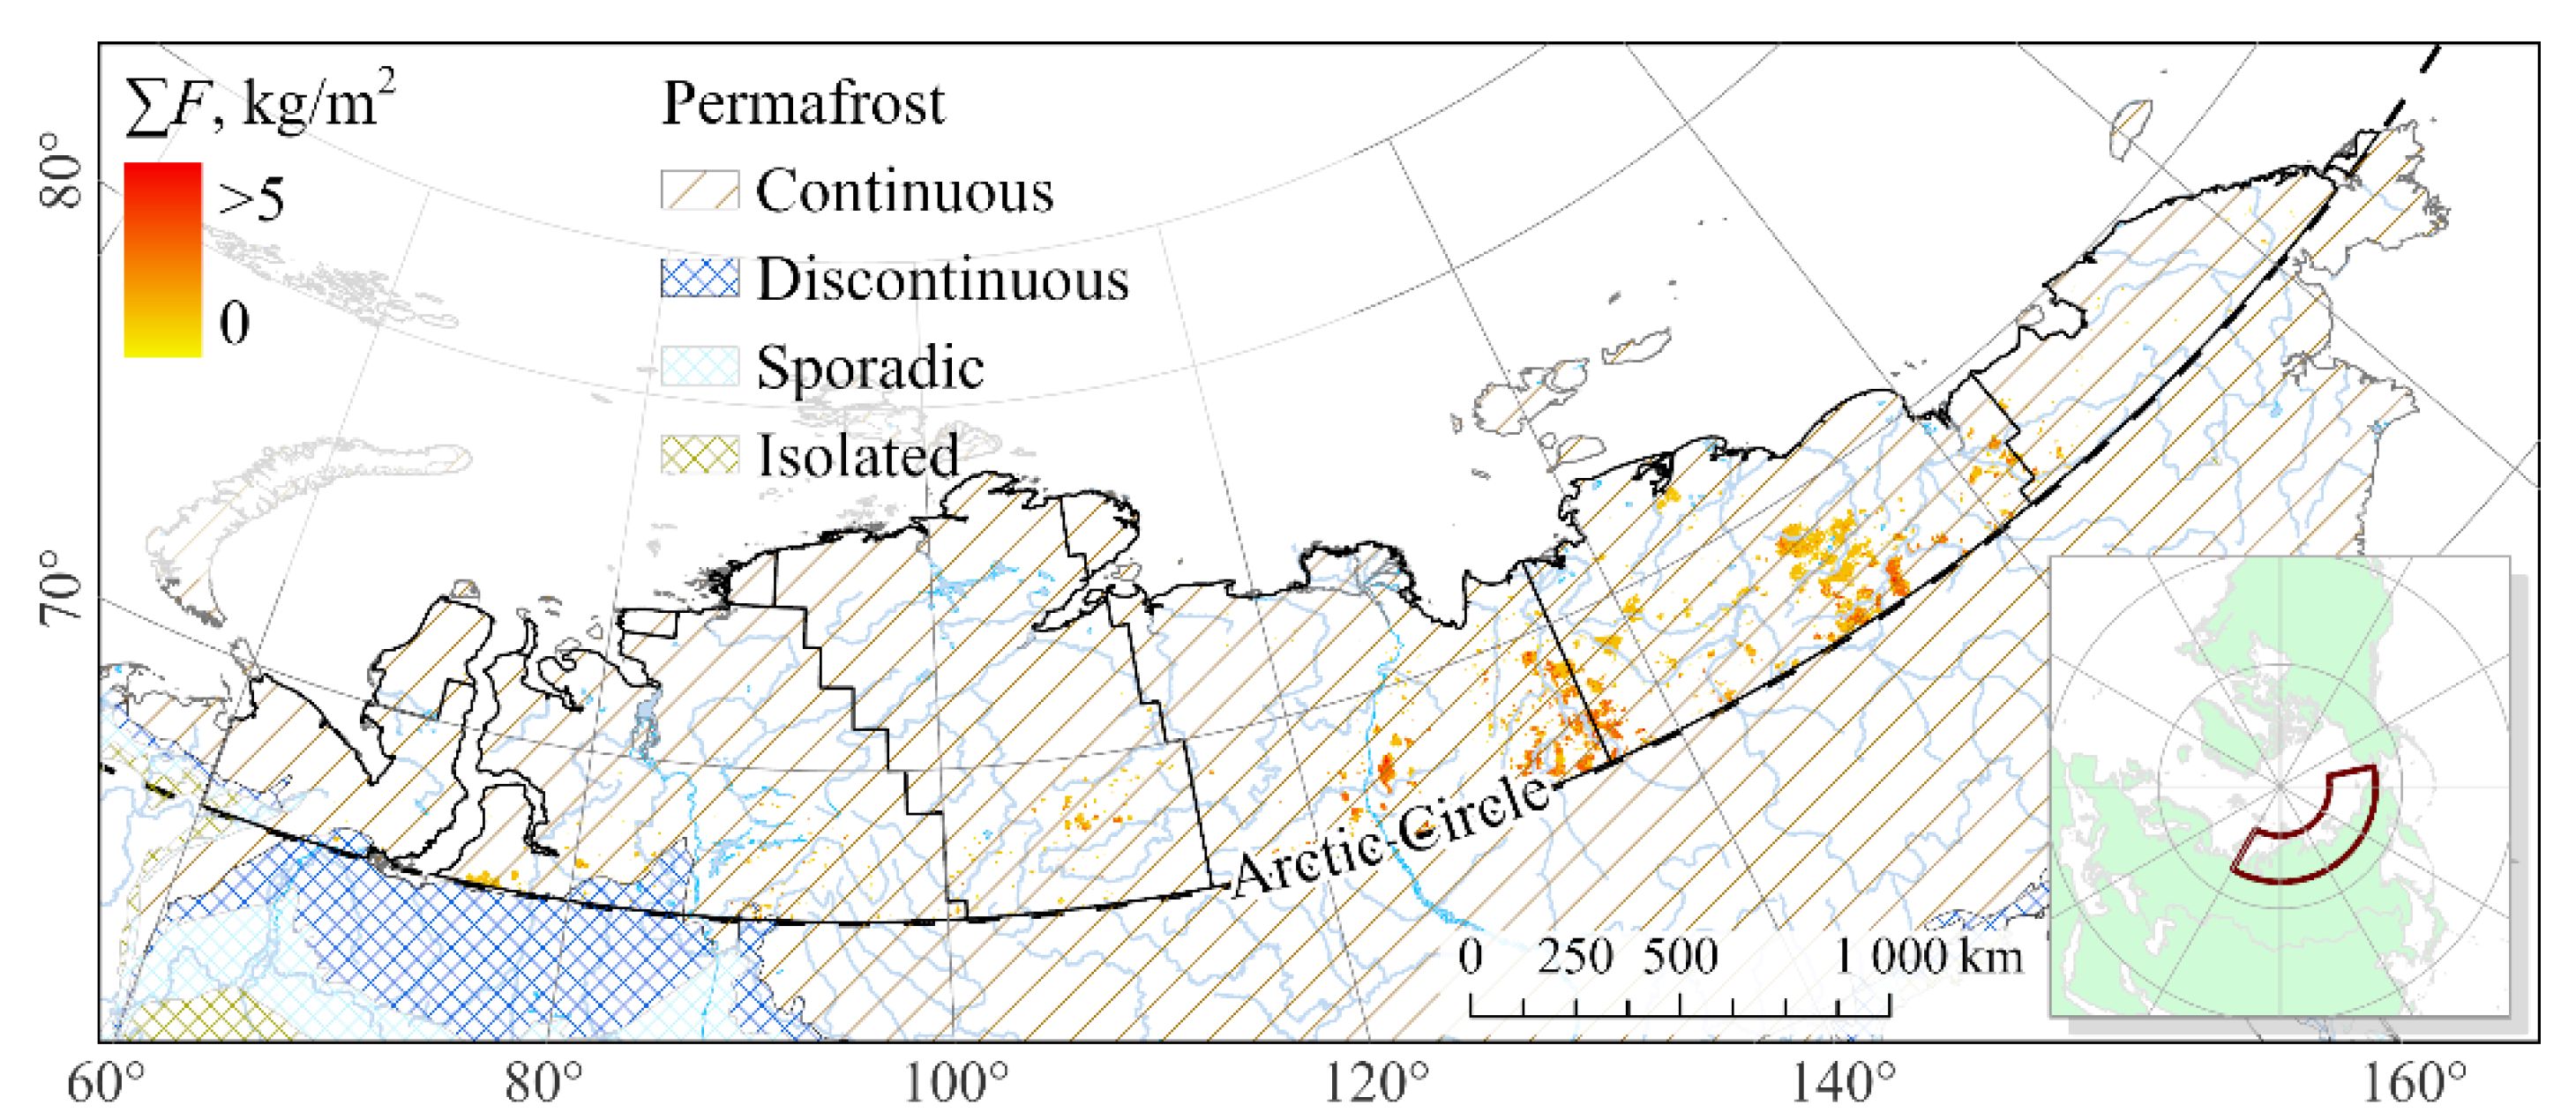
Figure 8.
(a) Map of the mean (2007-2023) annual water runoff within the Arctic. Mean WR is 7.7 kg/m2/year (σ = 4.4; min = –9.9, max = 19.1). Positive and negative WR corresponded to water runoff and water accumulation, respectively. (b) Melting water runoff within given Arctic sectors. Whiskers show standard deviations.
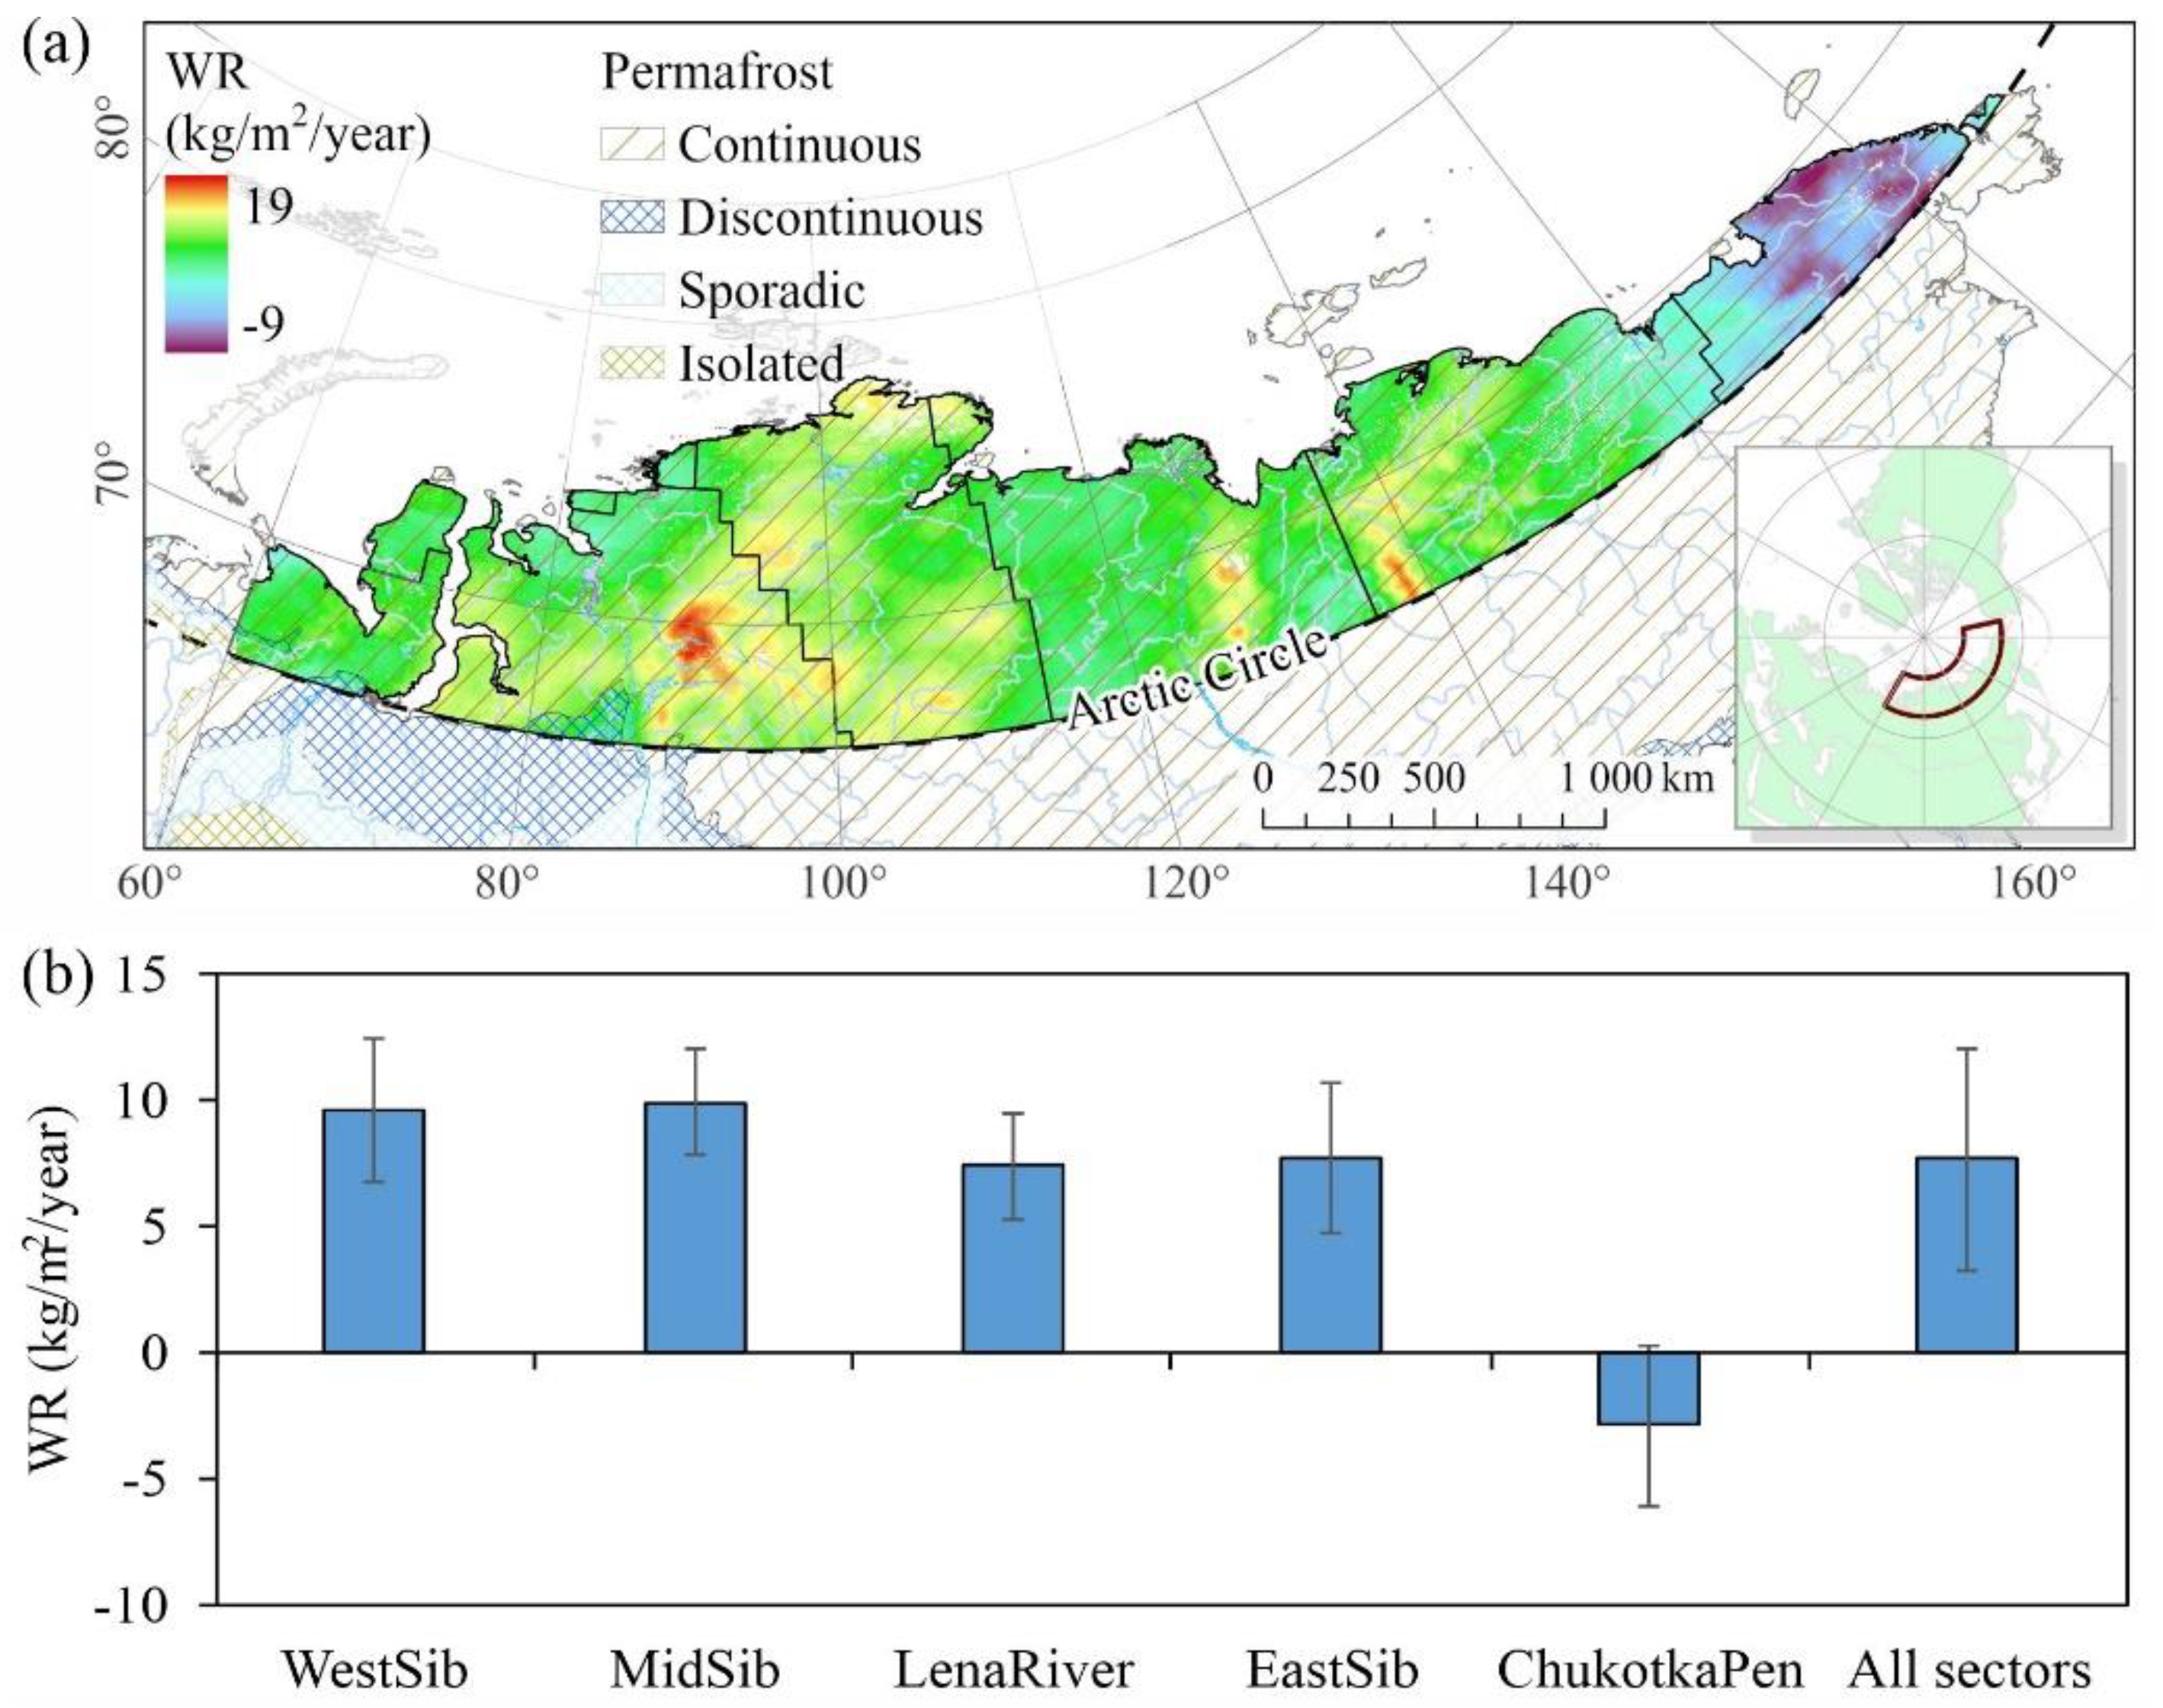
Figure 9.
(a) Map of NPP trends, (b) and the mean NPP dynamics within the Siberian Arctic (p < 0.05). Positive and negative trends occurred within ~15% of the Arctic and ~1%, respectively.
Figure 9.
(a) Map of NPP trends, (b) and the mean NPP dynamics within the Siberian Arctic (p < 0.05). Positive and negative trends occurred within ~15% of the Arctic and ~1%, respectively.
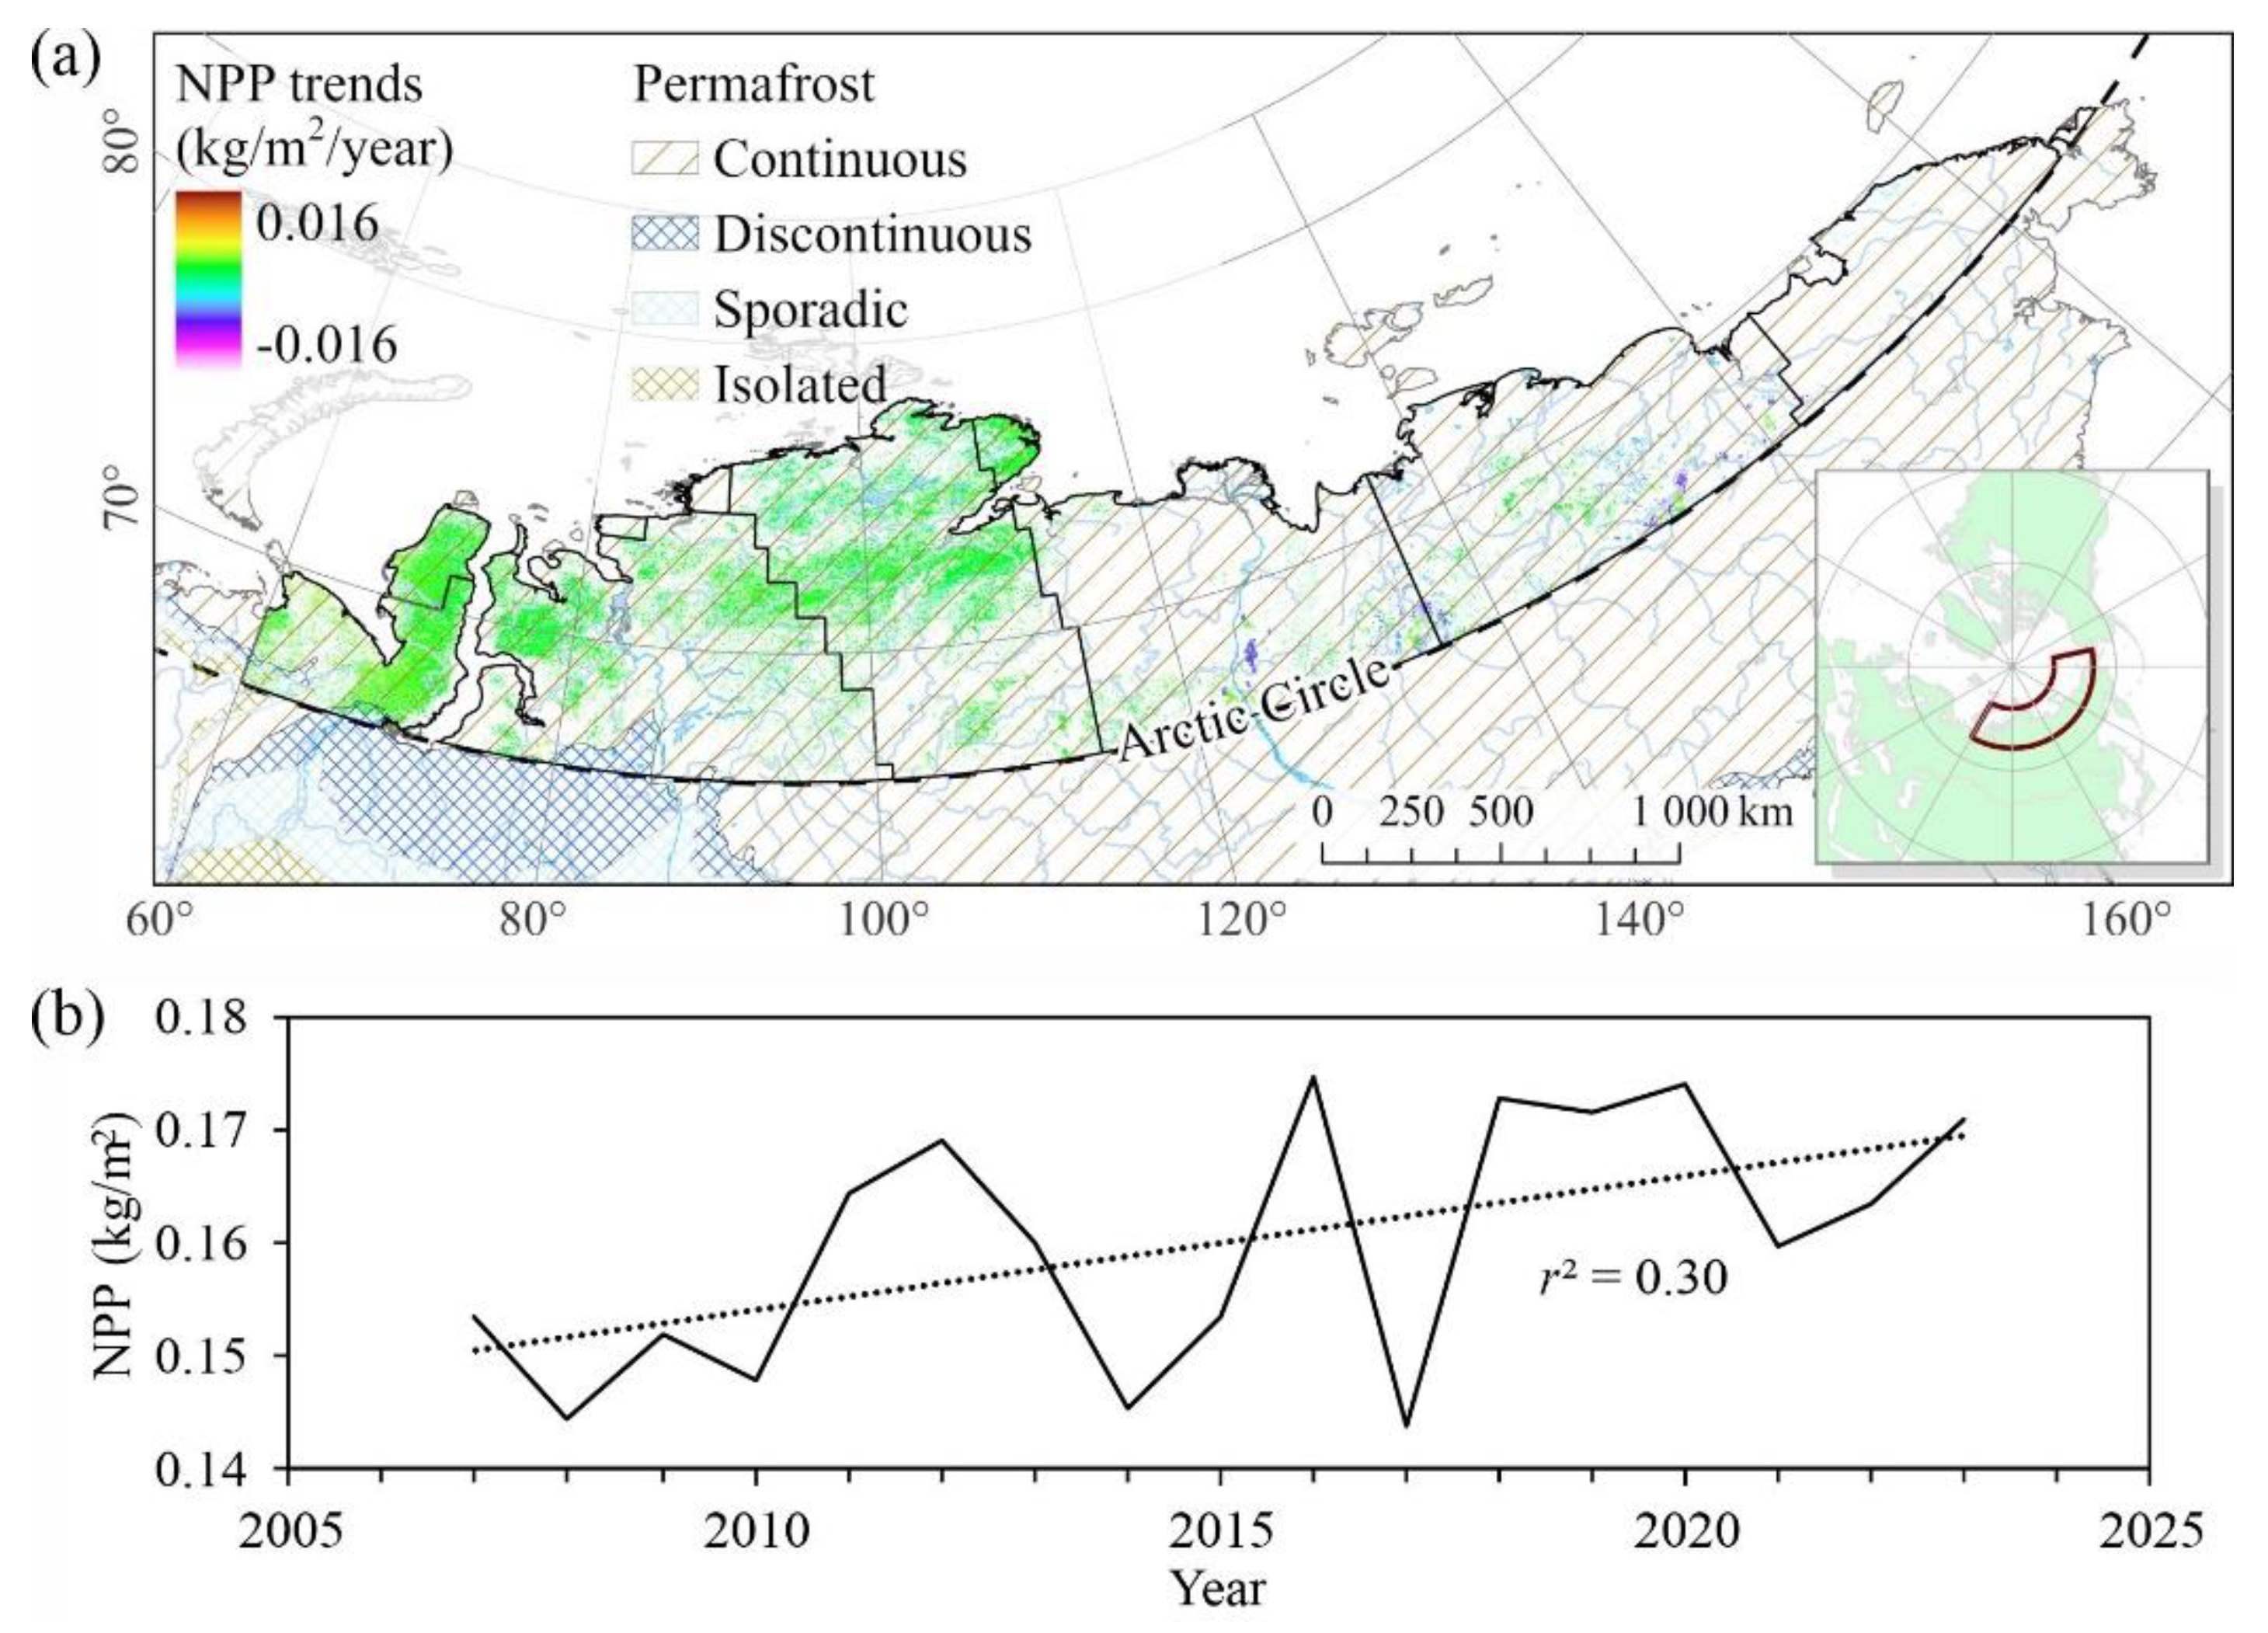
Figure 10.
(a) Map of Spearman correlations (p < 0.1) between NPP and melting water runoff (WR) during 2007–2023. Positive Spearman correlations are observed within 4.5% of the analyzed area, negative – 1%, and insignificant – 94% (p < 0.1). (b) NPP correlation with melting water runoff within the WestSib sector (p < 0.05).
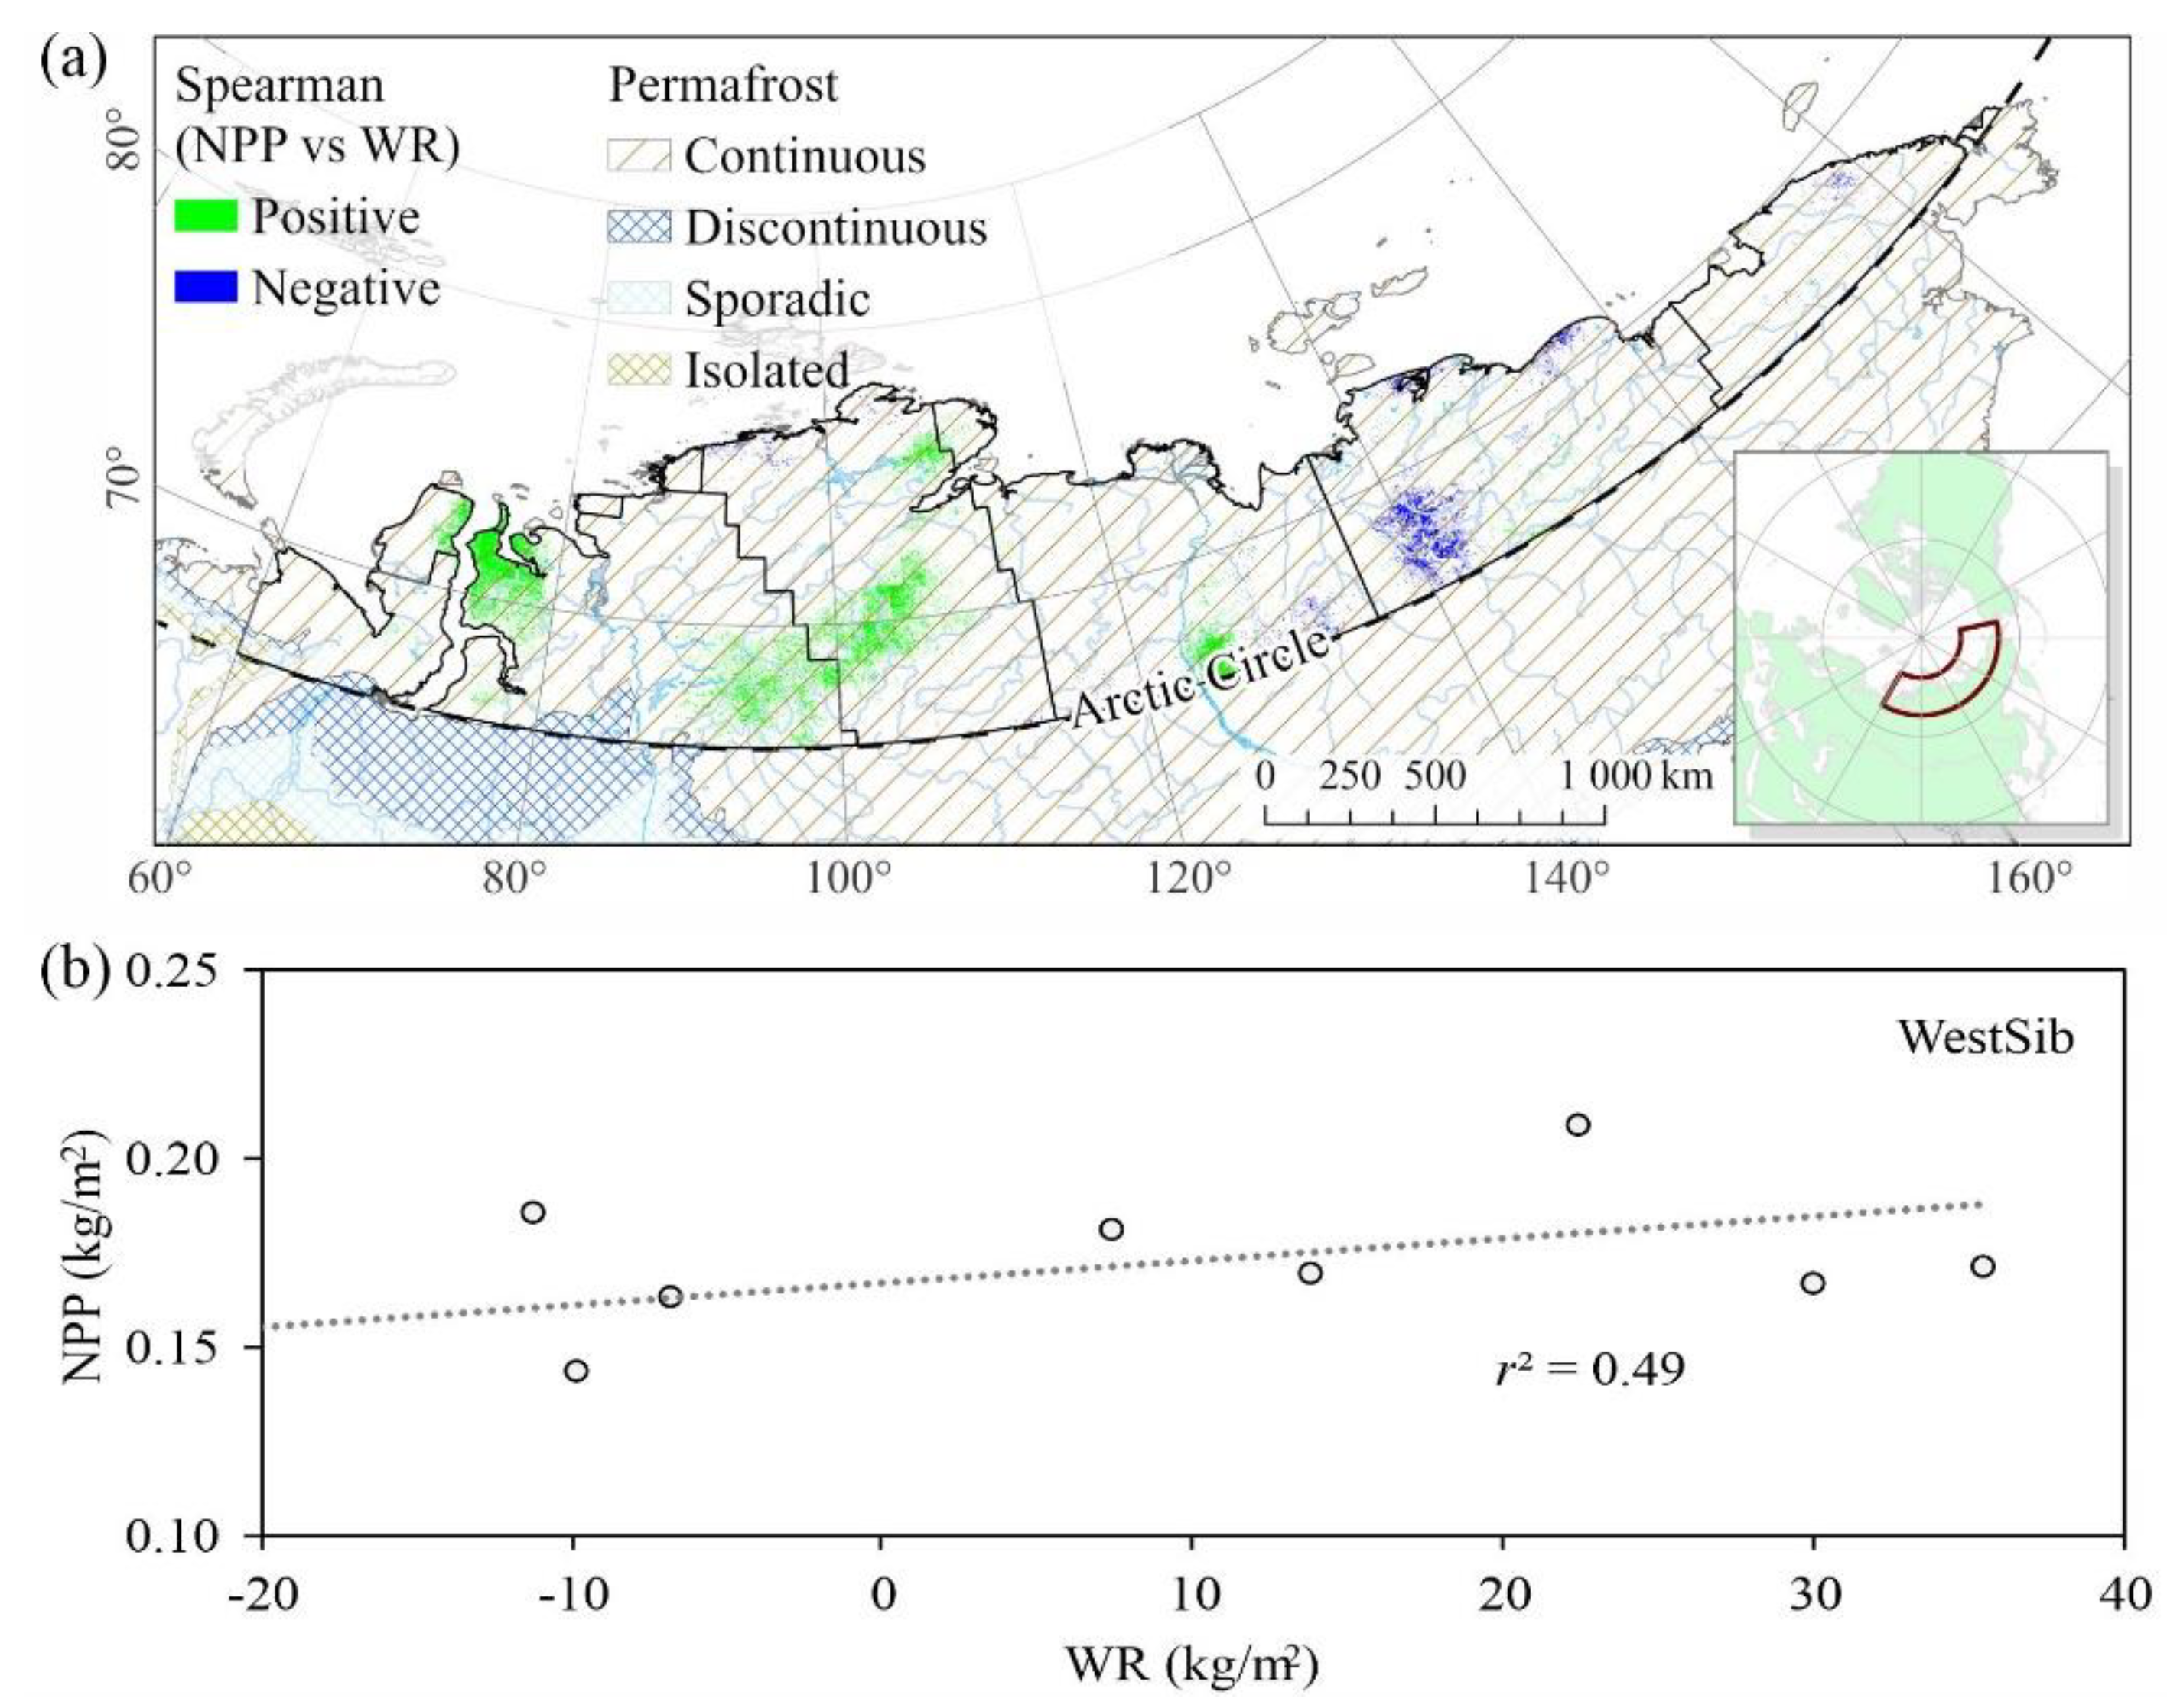
Figure 11.
NPP correlations with summer (a-e; p < 0.01) air and soil temperatures (f-j; p < 0.01), vapor pressure deficit (VPD; k-o; p < 0.01), and precipitation (p-t; p < 0.1) within the Arctic sectors (p < 0.05). Trends are significant at p < 0.05.
Figure 11.
NPP correlations with summer (a-e; p < 0.01) air and soil temperatures (f-j; p < 0.01), vapor pressure deficit (VPD; k-o; p < 0.01), and precipitation (p-t; p < 0.1) within the Arctic sectors (p < 0.05). Trends are significant at p < 0.05.
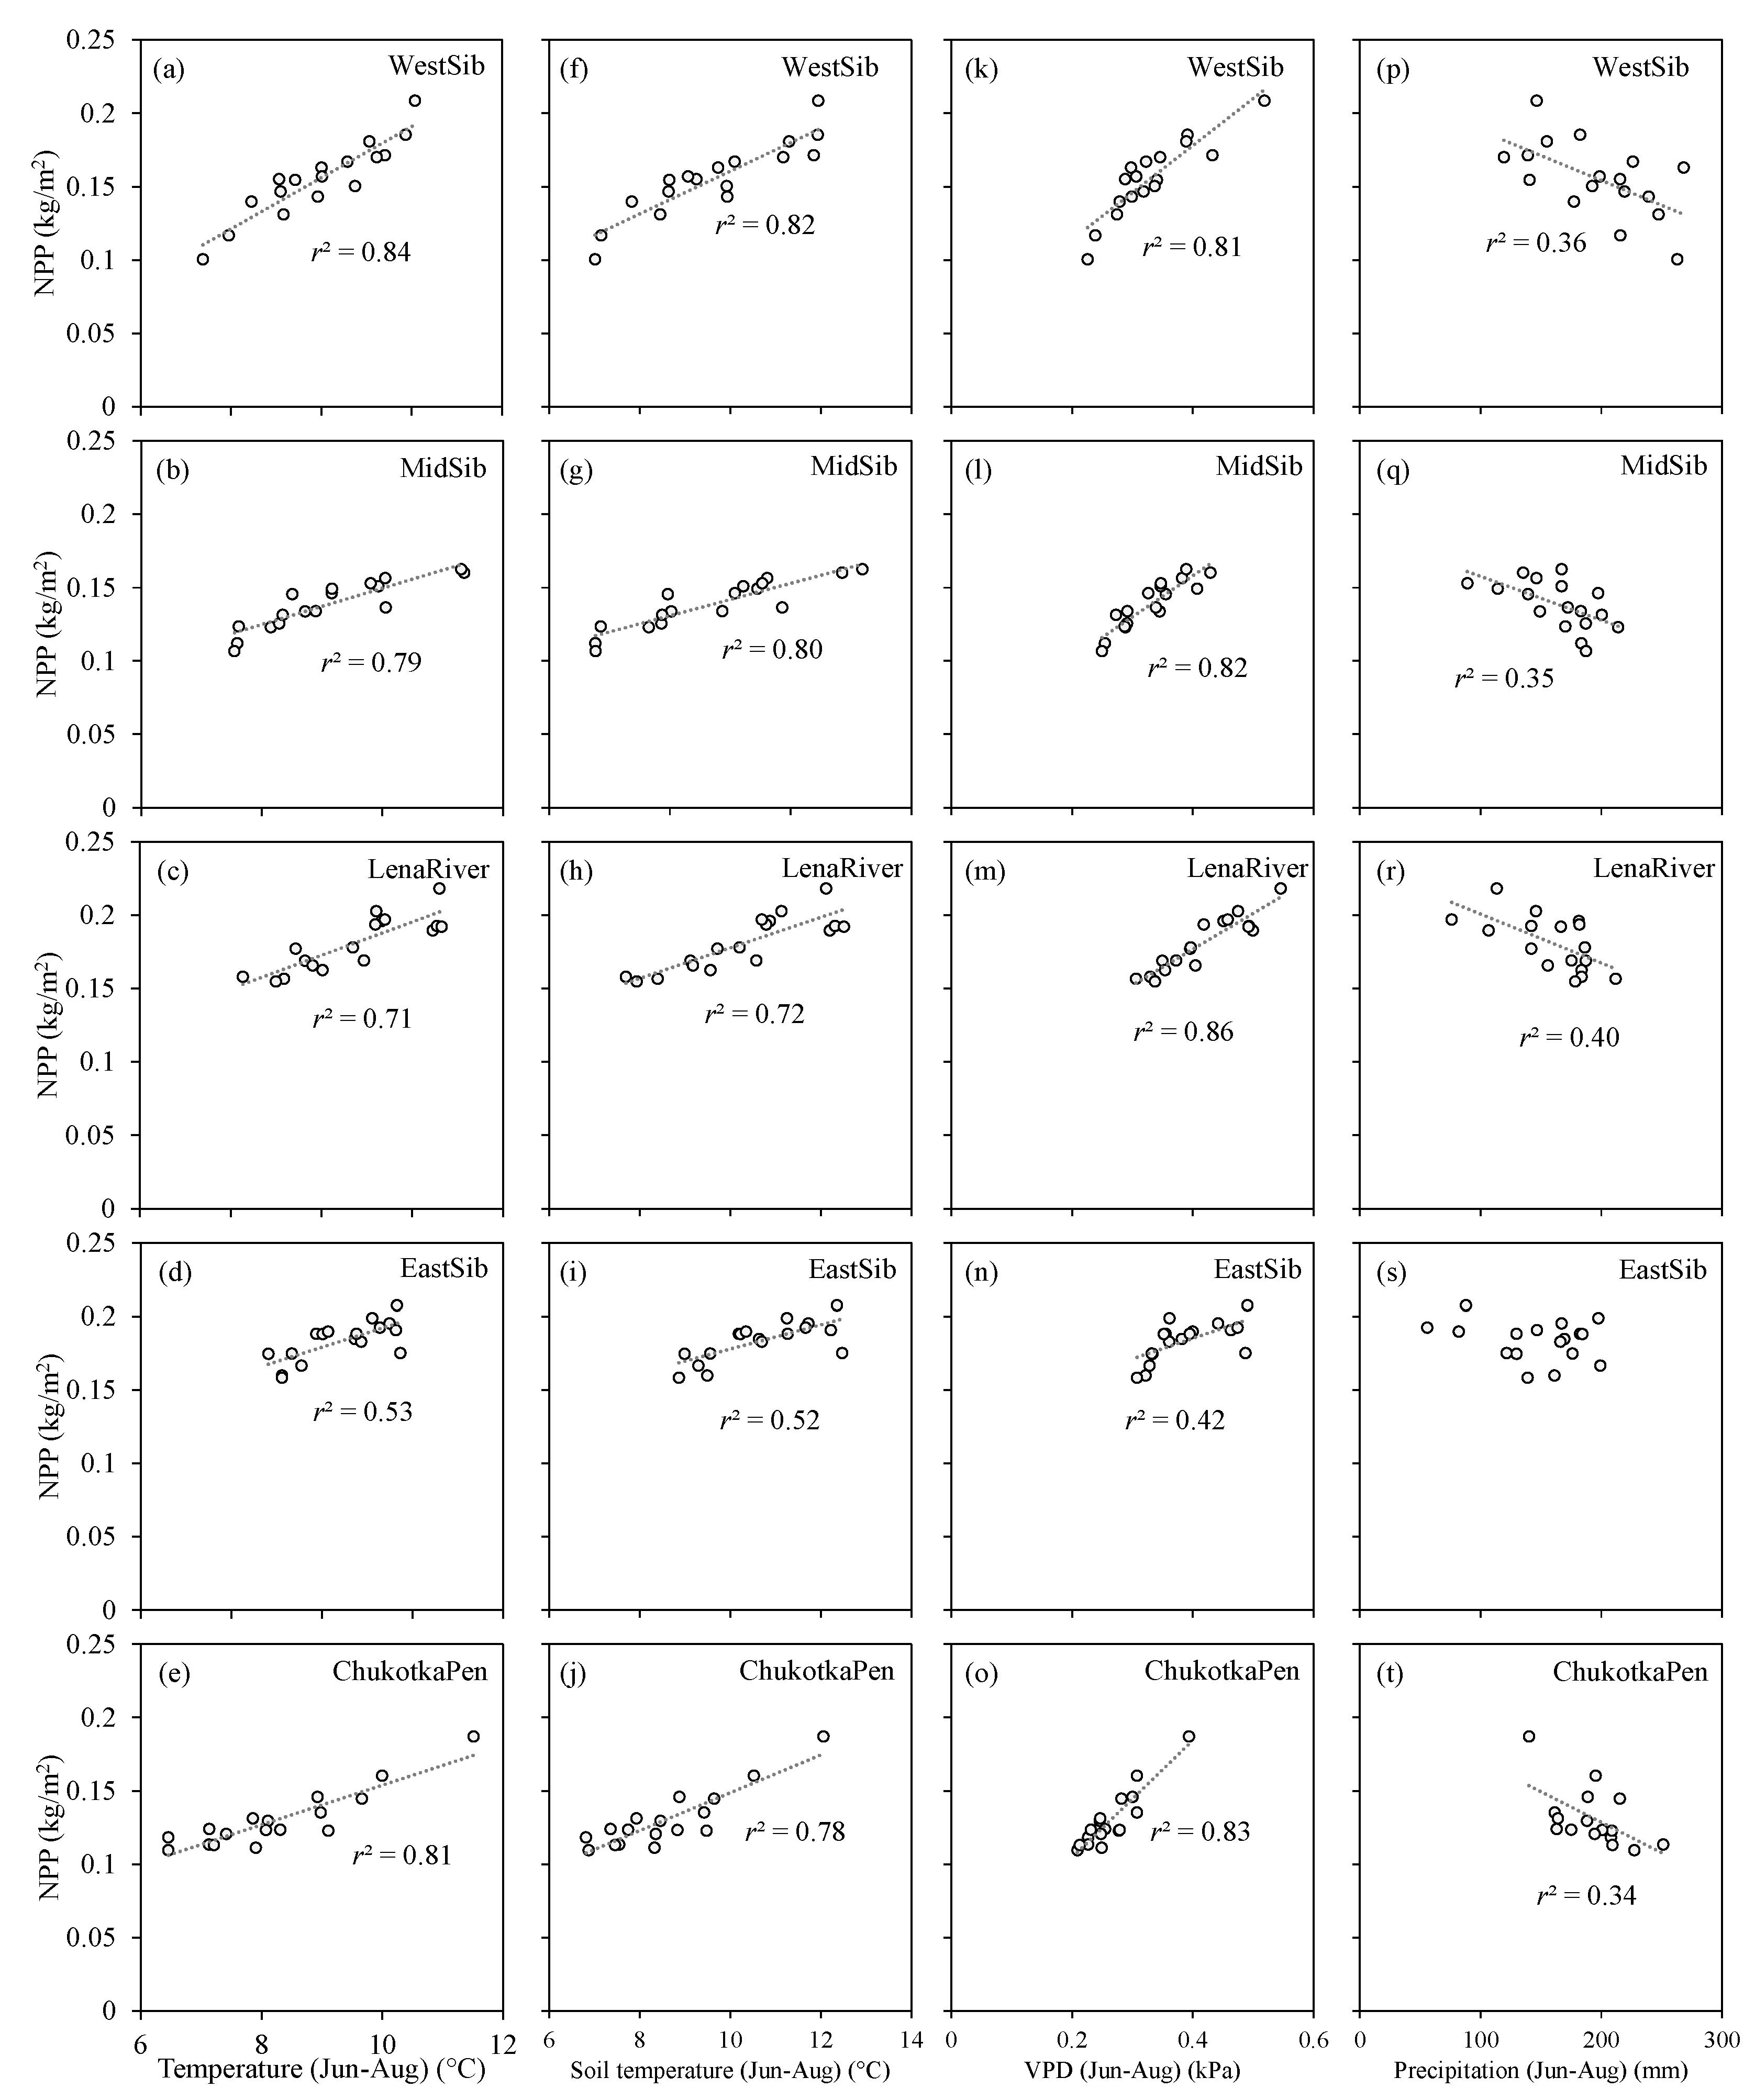
Figure 12.
(a) Correlations between larch growth index (GI) and water anomalies (WA) in (JJA, red) and the hydrological year (August – September, blue) (since 2003). Grey columns: correlations between GI and water runoff (WR) (since 2007, p < 0.2). (b) Correlations between GI and JJA air (TEMP) and soil temperature (SoTEMP), precipitation (PRE), and vapor pressure deficit (VPD). Significances at p < 0.01, p < 0.05, and p < 0.1 are indicated by one (*), two (**), and three (***) asterisks. Abbreviations: Ary-Mas, Pyasino, Kotuy, and Emb are the on-ground sites (Figure 1).
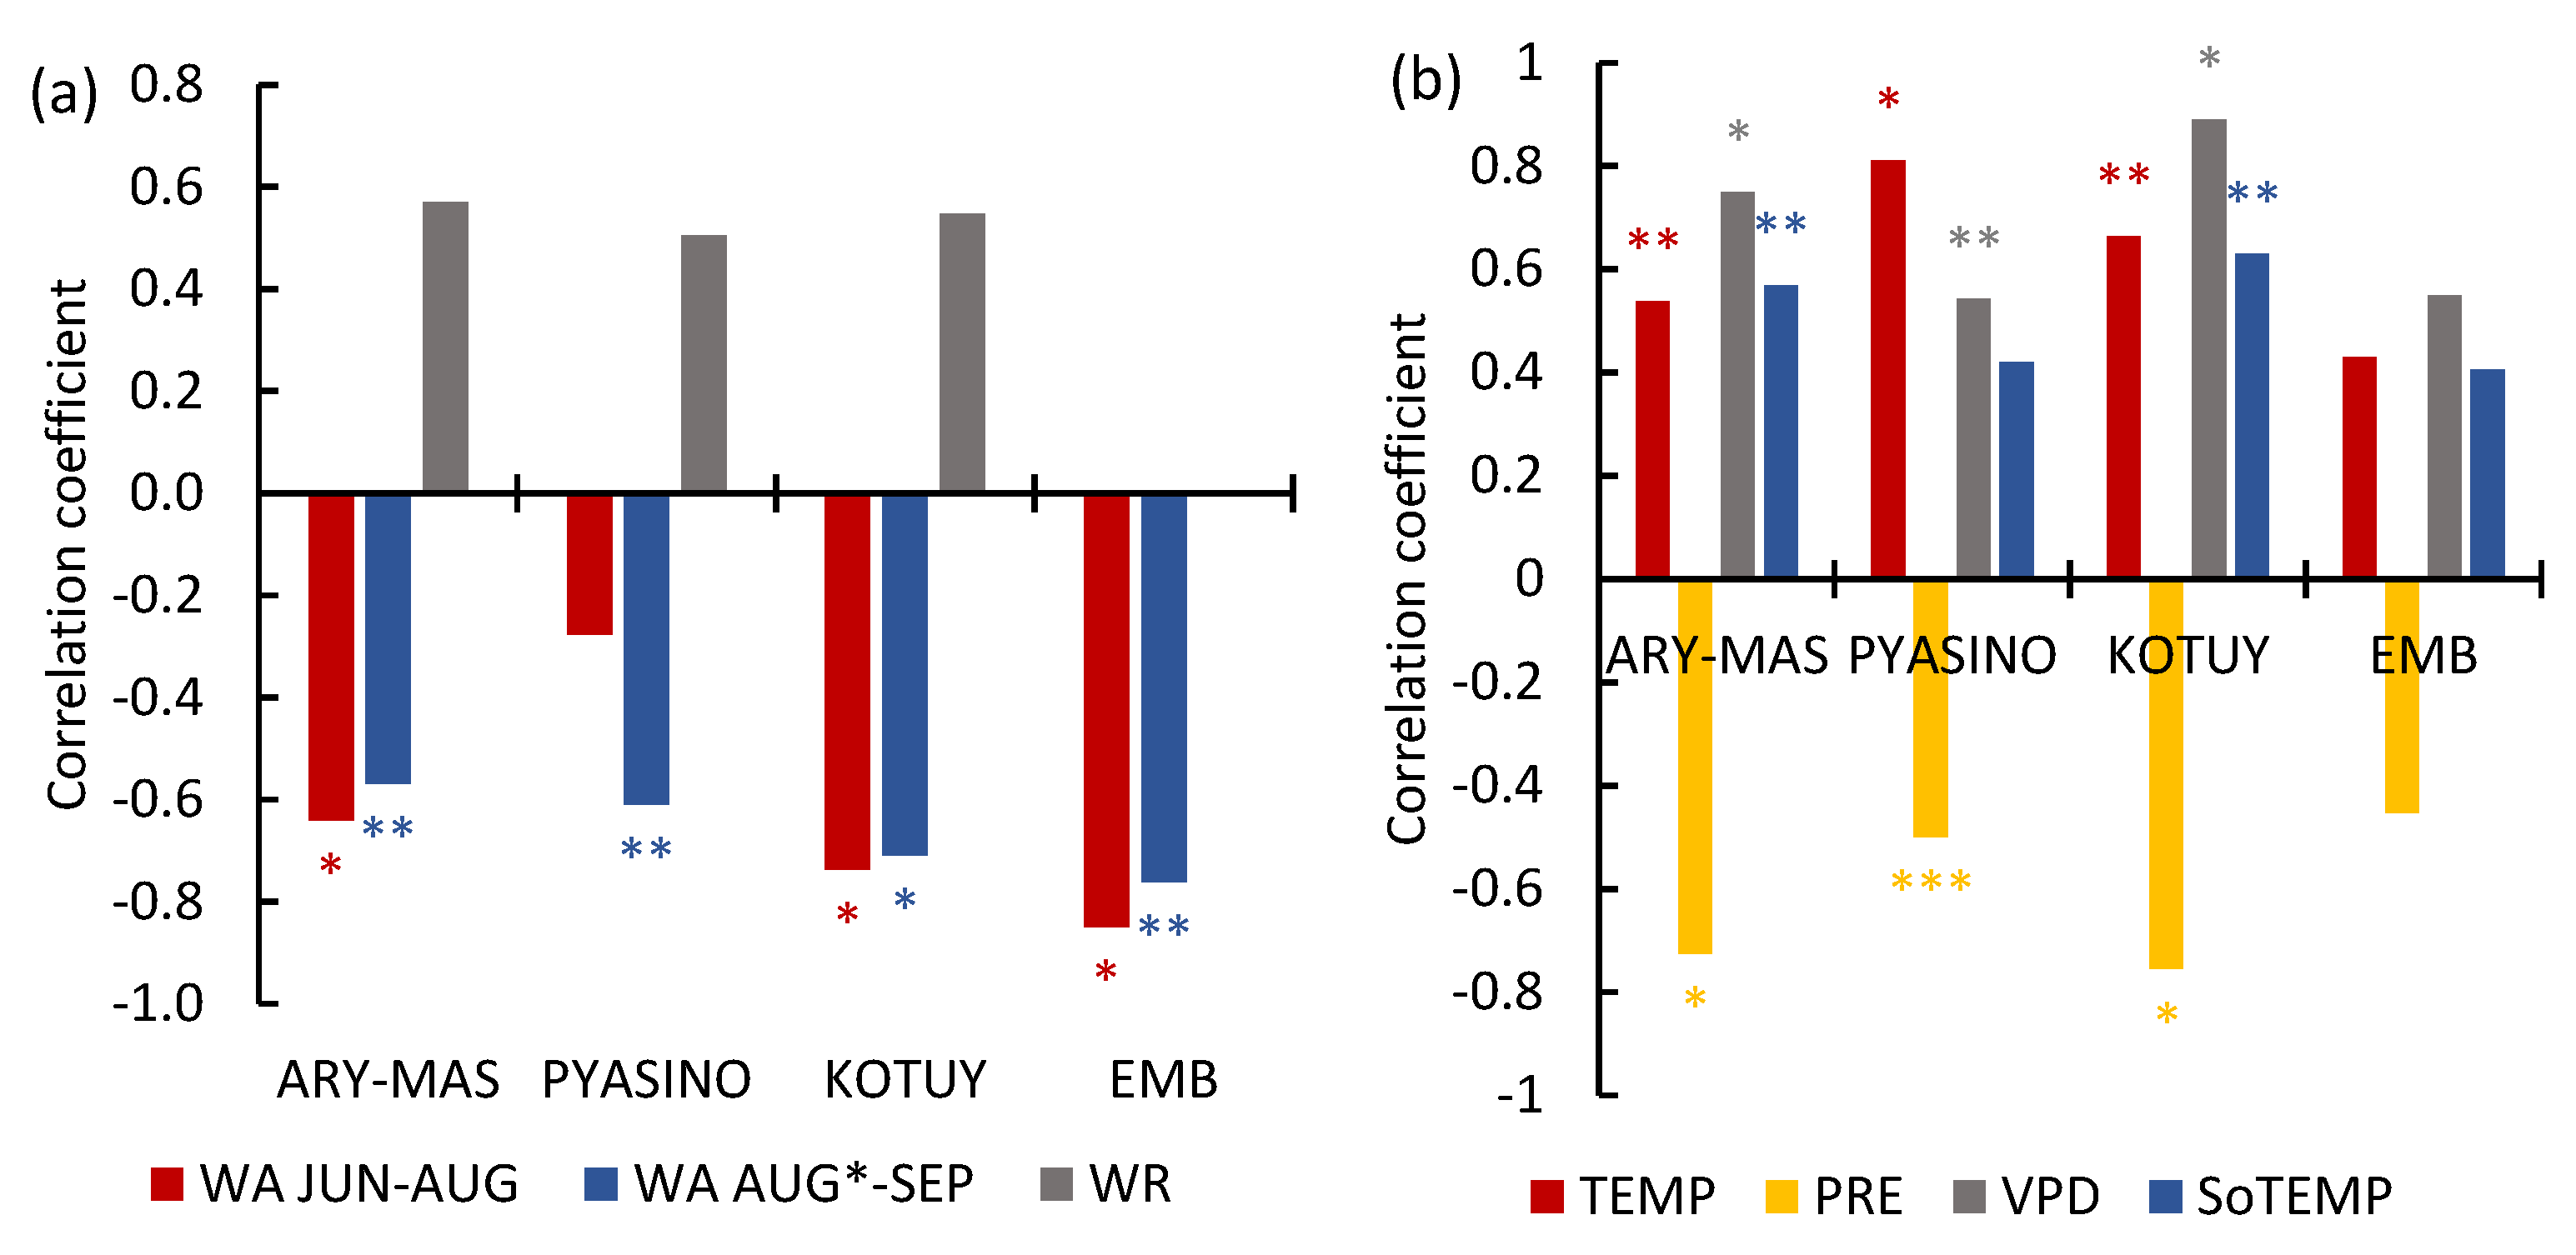

Table 1.
Melting water runoff within the Arctic sectors. ΔGm is the total WA changes, ∑NPP is the primary productivity, ∑Vm is a correction for the biomass decay, ∑F is the biomass loss caused by carbon emissions, α is the difference between precipitation and evapotranspiration (P-E); WR is the melting water runoff.
| # | Sector | Area (km2) | ΔGm (kg/m2/yr) |
∑Vm (kg/m2/yr) |
∑F (kg/m2/yr) |
α(kg/m2/yr) | WR (kg/m2/yr) |
|---|---|---|---|---|---|---|---|
| 1 | WestSib | 281496 | 3.3 ± 1.1 | 0.12 ± 0.04 | 0.001 ± 0.008 | -6.3 ± 2.5 | 9.7 ± 2.9 |
| 2 | MidSib | 646954 | 5.6 ± 1.3 | 0.11 ± 0.05 | 0.001 ± 0.008 | -4.3 ± 2.0 | 9.7 ± 2.1 |
| 3 | LenaRiver | 690721 | 3.3 ± 0.5 | 0.14 ± 0.06 | 0.006 ± 0.031 | -4.0 ± 2.0 | 7.4 ± 2.0 |
| 4 | EastSib | 813231 | 2.0 ± 0.6 | 0.14 ± 0.04 | 0.009 ± 0.031 | -5.6 ± 3.0 | 7.7 ± 2.9 |
| 5 | ChukotkaPen | 588946 | -1.9 ± 1.0 | 0.10 ± 0.05 | 0.001 ± 0.009 | 1.1 ± 2.4 | -2.9 ± 3.2 |
| All sectors | 3021348 | 3.2 ± 2.2 | 0.12 ± 0.05 | 0.004 ± 0.021 | -4.5 ± 3.1 | 7.7 ± 4.4 |
Note: Mean values ± standard deviation. Abbreviations: WestSib, MidSib, LenaRiver, EastSib and ChukotkaPen are the West Siberia, Mid Siberia, Lena River, East Siberia and Chukotka Peninsula sectors, respectively.
Disclaimer/Publisher’s Note: The statements, opinions and data contained in all publications are solely those of the individual author(s) and contributor(s) and not of MDPI and/or the editor(s). MDPI and/or the editor(s) disclaim responsibility for any injury to people or property resulting from any ideas, methods, instructions or products referred to in the content. |
© 2024 by the authors. Licensee MDPI, Basel, Switzerland. This article is an open access article distributed under the terms and conditions of the Creative Commons Attribution (CC BY) license (http://creativecommons.org/licenses/by/4.0/).
Copyright: This open access article is published under a Creative Commons CC BY 4.0 license, which permit the free download, distribution, and reuse, provided that the author and preprint are cited in any reuse.


