1. Introduction
A causative role in viral restriction and cancer mutagenesis for AID/APOBEC cytosine deaminases causing C-to-U(T) transition mutations in DNA and RNA, and for ADAR adenosine deaminases causing A-to-I(G) mutations in RNA and DNA have previously been discussed [
1,
2,
3,
4,
5,
6] and in the context of the reverse transcriptase mechanism of immunoglobulin (Ig) somatic hypermutation (SHM) [
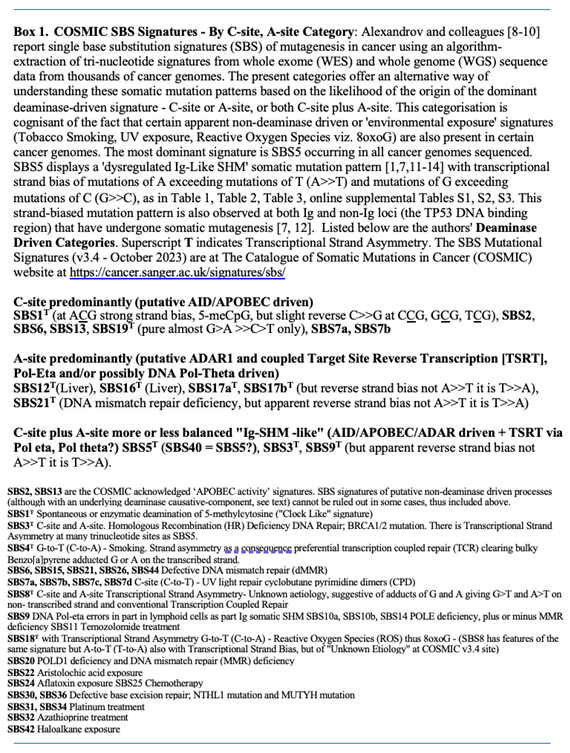
7]. This paper lays out a critical analysis of the transcriptional strand asymmetries observed in the Single Base Substitution (SBS) signatures curated at the online COSMIC database (Box 1). One subsidiary aim is that this knowledge may be leveraged to develop more precise predictive genomic tests for use in the clinic and for understanding differences between patient responses to different cancer treatments.
1. a. AID/APOBEC and ADAR Mutagenesis
It is hypothesised that transcriptional strand asymmetries in SBS signatures can be understood by the action of the mutagenic cytosine (AID/APOBEC) and adenosine (ADAR1/2) deaminases (see
Figure 1) coupled to cellular reverse transcription allowing the generation of distinct mutational strand biases. In the case of A-to-I pre-mRNA editing via ADAR1 [
27] there is an implied association with cellular reverse transcription, via DNA repair Polymerases eta and theta [
7,
28] (see
Figure 1a). DNA replication of ADAR deaminase-mediated A-to-I DNA modifications (A-to-Hx, Hypoxanthine) can also help explain, as the present analysis shows, to distinct strand-biased outcomes at resolved (collapsed) long transcriptional R-Loops. An R-loop is a long three-stranded nucleic acid structure, composed of a DNA:RNA hybrid and the associated non-template single-stranded DNA (see
Figure 1b).
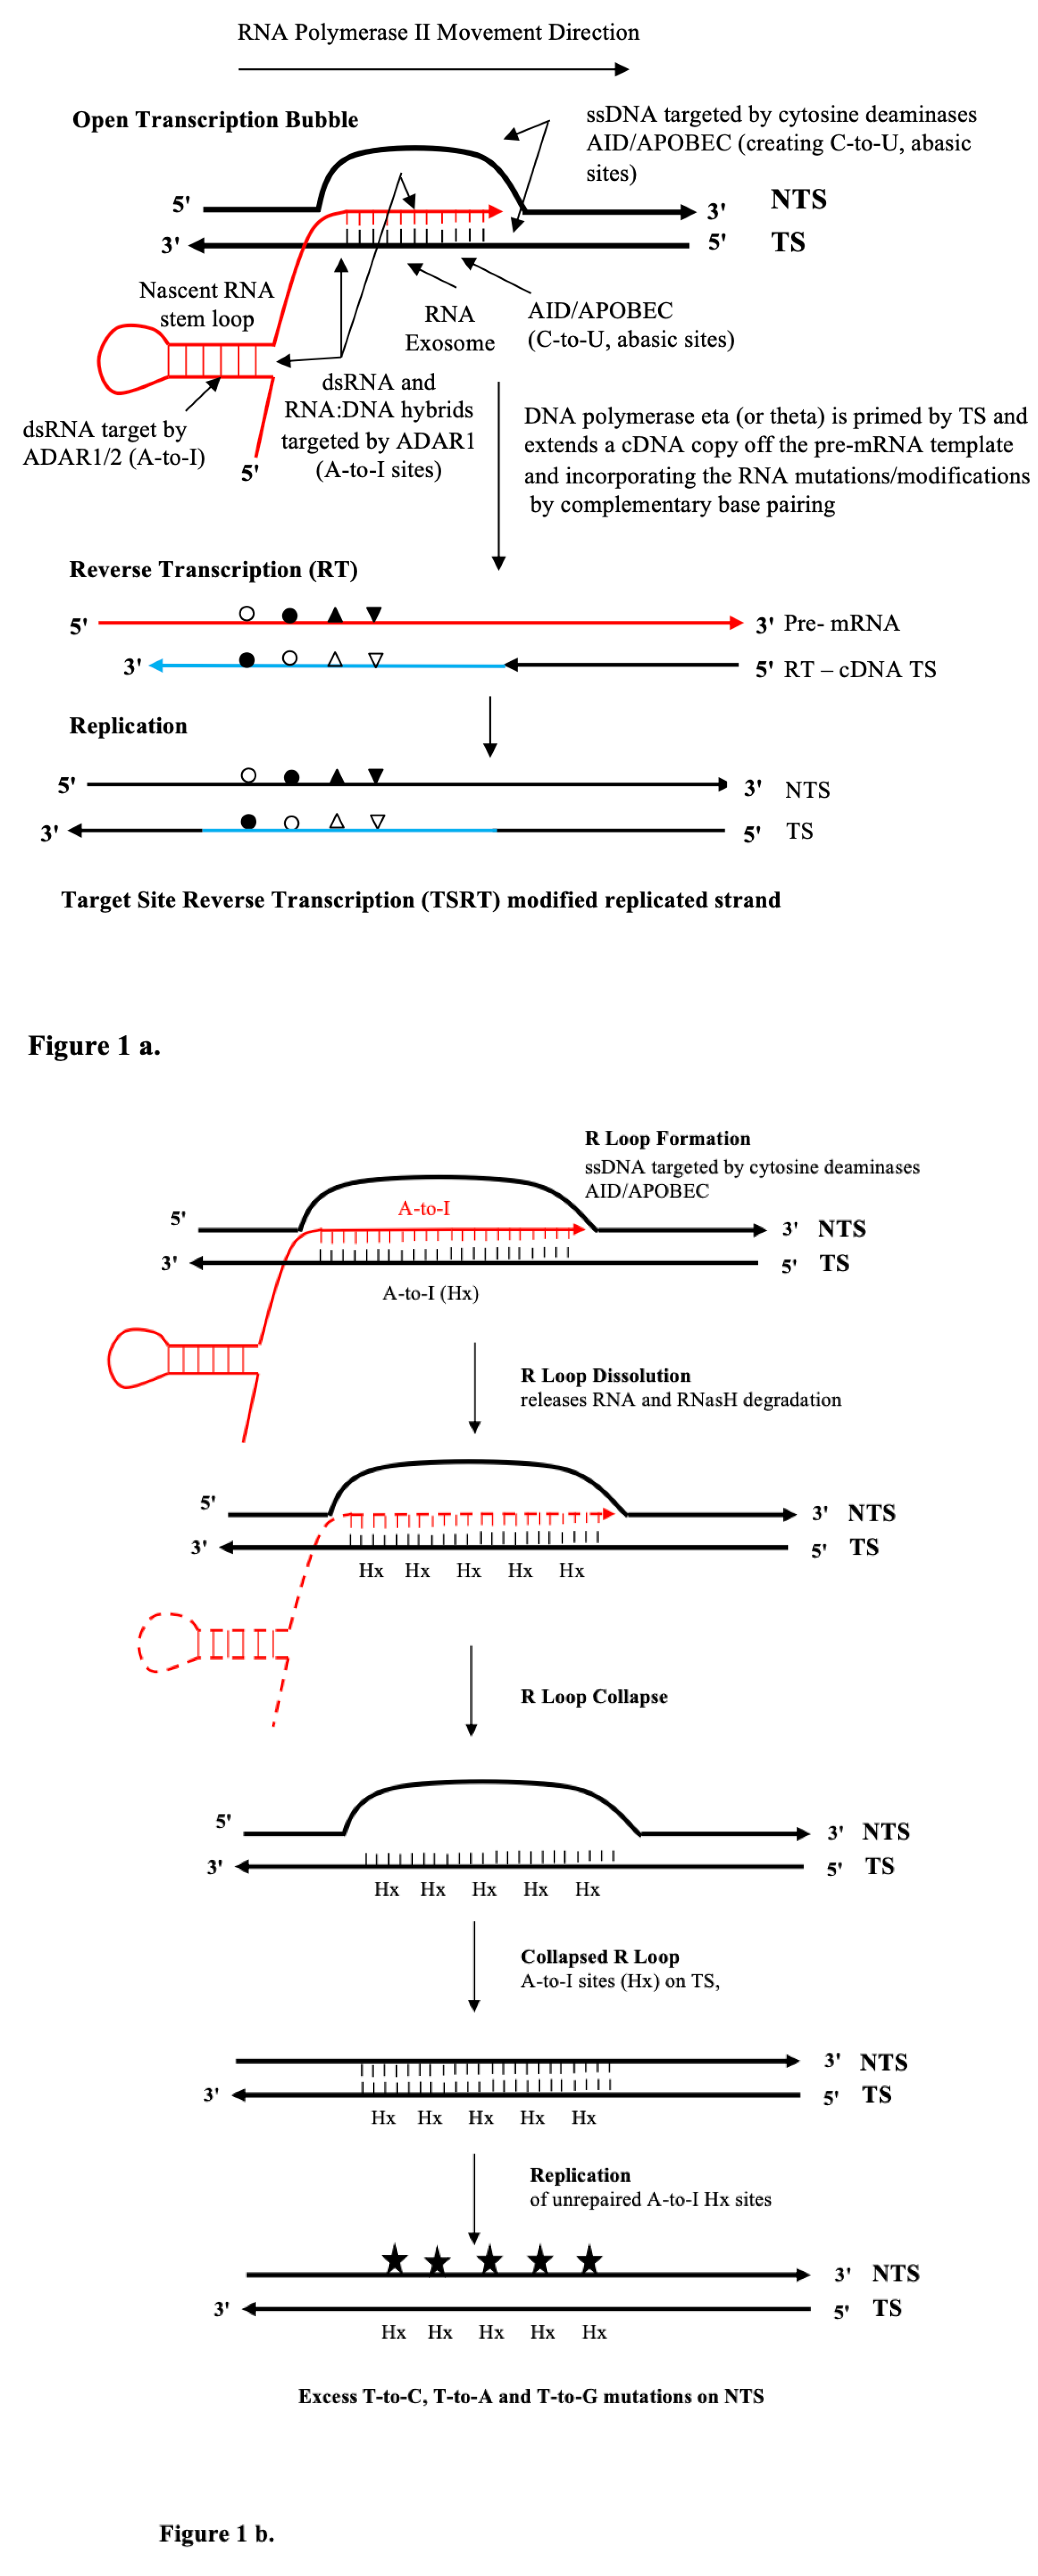
a. Stalled Transcription Bubble
The ssDNA sites in the open transcription bubble are targeted by the AID/APOBEC cytosine deaminases and create C-to-U and abasic lesion sites. Black strands represent DNA. Red strands represent RNA. Blue strands represent cDNA. RNA mutations (G-to-A, G-to-C, G-to-U) appear as a consequence of transcription across these AID/APOBEC cytosine deamination lesion sites [
15] by the RNA Polymerase II elongation complex (RNA Pol II) on the transcribed strand (TS) indicated by open circles. The RNA exosome allows access to unpaired cytosines on the TS in RNA:DNA hybrid [
16]; or by transcription-coupled ADAR1 deamination of adenine to inosine (A-to-I) in the nascent dsRNA or on both nucleic moieties of the annealed RNA:DNA hybrid (9-11 nt) indicated by closed circle. Other subsidiary non-deaminase-driven RNA modifications could include endogenous uracil isomerisation to pseudouridine (y) to give a U-to-G miscoding substitution [
17,
18,
19,
20], indicated as closed triangles; or non-deaminase-driven RNA miscoding mutations (G-to-U) following reactive oxygen species (ROS) generation of 8oxoG (c.f. SBS18 transcriptional strand asymmetry) in nascent RNA or the annealed RNA:DNA hybrids [
21], indicated by inverted closed triangles. The last TSRT step is effectively a potential ‘error prone’ DNA repair process akin to a patch nucleotide excision repair (NER) on the TS allowing replication of the helix in that damaged genomic region, discussed at length in figure four in Franklin et al. [
22]. Alternate symbol fills are shown to symbolise RNA mutation or modification as a complementary base pairing partner in DNA. Also see and compare with the Supplementary Fig S1 showing the Reverse transcriptase mechanism for Ig somatic hypermutation (SHM) and the target site reverse transcription (TSRT) process as a patch correction around DNA lesion sites following Luan et al. 1993 [
23] as discussed Steele et al. 2024 [
7].
b. R Loops
See text for more detail on deamination modifications by ADAR1 or ADAR2 [
24,
25] at long (40nt-670nt) annealed RNA:DNA hybrids at R Loops [
26]. Black strands represent DNA. Red strands represent RNA. These are often generated under replicative stress in the body of the genome, particularly at transcription replication fork (TRC) collisions (conflicts) on the same strand [
25,
26] at deaminated A-sites in both the RNA and DNA moieties. These DNA A-to-I modifications are also referred to as hypoxanthine, Hx. As discussed in the text. such deaminations contribute to R Loop dissolution by facilitating the release of the firmly bound RNA and then its degradation by RNaseH activity. After R Loop collapse the inosine modified TS (Hx) sites remaining unrepaired, will be replicated over and result in excess T-to-C, T-to-A and T-to- G mutations (filled stars) on the NTS. The incidence of these mutations (in order T-to-C > T-to-A > T-to- G) result in transcriptional strand asymmetry signatures as discussed in detail in the text and summarised in
Table 3.
Additionally, there are some secondary downstream mutation signatures such as Defective Homologous Recombination (dHR)Repair (SBS3), Defective DNA Mismatch Repair (dMMR; SBS15, SBS21, SBS26, SBS44), Defective Base Excision Repair (dBER; SBS30, SBS36), defective Nucleotide Excision Repair (dNER), and defects in replication polymerase POLE or POLD1 genes (dPOLE/dPOLD1; SBS10a,10b, SBS14, SBS20) that may result in additional replication fork-based strand-biased signatures. However, in the majority of these cases it is posited here that the primary source of de novo somatic mutations is associated with deaminase mutagenic activity: either a C-to-U, C-to-T or A-to-I modification potentially causing a mutagenic outcome in DNA or RNA sequence of the cancer genome or transcriptome. This interpretation assigns causative ‘AID/APOBEC activity’ to a far wider set of SBS signatures than is currently allocated at the online COSMIC site [
9,
10] to just SBS2 and SBS13 (see
Supplementary Figure S2).
In this paper the Deaminase-driven Reverse Transcriptase (DRT) Paradigm is formerly introduced to show how the above scenarios can plausibly occur in a transcription-linked path during oncogenesis (See
Supplementary file sections 1, 2 for more historical background to the analysis, abbreviations and definitions). It provides a molecular analytical framework based on molecular biology first principles of DNA replication, RNA transcription and DNA repair. It is a set of foundation features and assumptions that involve AID/APOBEC and ADAR deamination coupled in many cases to target site reverse transcription, TSRT [
23]. It includes the RT activity of the DNA repair Polymerase-eta, with putative back up across the cancer genome by the RT activity of DNA repair Polymerase-theta [
7,
28]. While this significant step is not fully understood in molecular detail, it nevertheless allows RNA A-to-I mutational modifications to be fixed back into the genomic DNA, scoring as a A-to-G mutation at that site when unrepaired I (Insosine) is accurately copied and replicated. For example, it helps our understanding of the genesis of the striking transcriptional strand biased A-to-G mutations observed in the genomic DNA of liver cancer cells at WA sites (e.g., SBS12, Results and Analytical Discussion).
Other prominent endogenous mutation sources of note include Reactive Oxygen Species (ROS) elevated in Innate Immune Responses and the cell-wide stress response initiated by Interferon-Stimulated Gene cascades which can also activate APOBEC and ADAR deaminases [
29]. ROS can result in oxidative 8oxoG modifications that lead to primary G-to-T mutations (SBS18) that are particularly prominent in Brain and CNS abnormalities [
30] and some other cancers [
9]. Other important endogenous alkylating events at G, A, T bases may result in non-bulky base modifications that cause instructive mutagenic lesions (06-meG G-to-A (C-to-T), 04-meT T-to-C (A-to-G) or cytotoxic lesions (N-7-meG, N3-meA, N2-meG). These are expected to be repaired by base excision repair (BER) steps, often resulting in abasic sites and ssDNA nicks [
31,
32].
The DRT hypothesis was first articulated in part in 2010 [
11]. It then developed further when applied to understanding the transcriptional strand biases of C-to-U(T) mutations at G:C base pairs and accompanying targeted mutations occurring at A:T base pairs in the DNA binding region of TP53-ve tumor samples [
1,
12]. The principles of the DRT hypothesis as now formally articulated here for cancer mutagenesis, were further employed in toto or in part in subsequent prediction/prognostication analyses by applying more specific codon-context Targeted Somatic Mutation (TSM) analysis to tumour-normal NGS tumour-normal NGS sequence data [
13], and in other deaminase-based somatic mutation and genetic analyses [
2,
4,
33].
The main difference between the DRT hypothesis and other diagnostic and therapy-focused deaminase-associated signature analyses [
8,
9,
10,
34] is that the DRT-paradigm focuses on the two main types of mutator processes in carcinogenesis (Box 1). These are: (a). Mutagenic C-site deaminations AID/APOBEC (C-to-U, and C-to-T at 5’meCpG sites); and (b). A-site deaminations mediated by ADAR1/2 RNA A-to-I editors (read as A-to-G). In most other oncogenic signature analyses involving transcriptional strand asymmetry, the latter is often ignored or overlooked.
The detection of RNA deaminations at WA sites now apparent in genomic DNA results from the coupling to cellular reverse transcription (DNA Polymerase eta and putatively DNA Polymerase theta) at many non-Ig loci across the cancer genome. It therefore follows that the execution of TSRT with the integration of an error-filled cDNA copy of the base modified transcribed strand (TS) provides the most plausible explanation for understanding how oncogenic strand bias patterns involving both C-site and A-site base changes arise. This extends 5’ and 3’ as a variable length cDNA ‘patch’ around the deaminase lesion site in the genomic DNA as summarised in (
Figure 1a) as developed from the reverse transcriptase mechanism of Ig-SHM [
7] (
Supplementary Figure S1). However it needs to be made clear at this juncture that ADAR-mediated A-to-I deamination can also occur in principle at WA sites directly on the DNA moiety of annealed RNA: DNA hybrids [
35] that are ubiquitously generated at Transcription Bubbles and R-Loops (below).
Before proceeding to the analysis of the likely origins of the major SBS signatures, the main nucleic acid substrates for AID/APOBEC and ADAR deamination are described below.
1. b. Lagging and Leading Strands of the Replication Forks
These are a significant source of unpaired and exposed ssDNA for AID/APOBEC mediated mutations at C-sites in various SBS signatures but not strictly relevant to ‘Transcriptional strand asymmetries’. These are further discussed in Supplementary file section 2A.
1. c. Stalled Transcription Bubbles
These provide the great bulk of ‘Transcriptional strand asymmetries’ observed in SBS signatures and are a genome-wide rich source of DNA and RNA substrates [
5,
6,
36]. Open Transcription Bubbles provide ssDNA in the displaced NTS as shown in
Figure 1a. This allows access to C-to-U DNA deamination in the context of the key variable deaminase motifs (
Supplementary file section 1 for abbreviations and acronyms): AID at WRCN motifs; various APOBEC3 family members at TCN motifs (APOBEC3A, APOBEC3B, APOBEC3H); and, CCN motifs (APOBEC3G). On the template TS the RNA Exosome permits access to C-sites in RNA:DNA hybrids [
16]. Stalled Transcription Bubbles would also allow the annealed RNA:DNA hybrid region to be attacked by ADAR1 or ADAR2 acting on adenosines base paired in both RNA or DNA moieties [
35].The nascent dsRNA in stem-loops also present deamination targets for the transcription coupled Z-DNA binding by ADAR1 associated with RNA Pol II elongation [
27]. APOBEC3A is also an RNA C-to-U editor [
5,
37,
38] and can also in theory deaminate nascent pre-mRNA stem-loop molecules. Stalled Transcription Bubbles are widespread and high frequency events in all protein coding RNA Pol II transcribed genes studied - from the transcription start site (TSS) to a point about 3Kb downstream into the genic regions [
39].
1. d. R-Loops in RNA Pol II Transcribed Regions
R-Loops offer a major source of both long unpaired ssDNA and long annealed RNA:DNA hybrid substrates [
5,
6,
26,
35] for both AID/APOBEC C-to-U and ADAR1/2 A-to-I deaminations. ADAR2 has been shown in vitro to deaminate both RNA and DNA moieties of the RNA:DNA hybrid [
35]; and the ongoing work by Tasakis et al. 2020 (Pers comm N.F. Papavasiliou) reveals direct ADAR DNA deaminations at RNA:DNA hybrids within R-Loops in vivo (
Figure 1b), in progressing multiple myeloma [
40]. It has been reported that APOBEC3B both regulates R-Loop formation and promotes transcription-associated mutagenesis in cancer [
41]. The entire APOBEC3 family is under TP53 expression regulatory control [
42] and we expect the RNA editing properties of APOBEC3A to play a similar role in RNA:DNA hybrid collapse and resolution (
Figure 1b) as it is also a major C-to-U DNA editor in cancer genomes.
Recent evidence analysed herein implies that both nuclear ADAR1 and ADAR2 act to resolve long annealed RNA:DNA hybrids by A-to-I editing the DNA moiety and RNA moiety (
Figure 1b). This facilitates the release of the annealed nascent RNA moiety which then becomes susceptible to digestion by RNase H enzymes that act by cleaving the RNA released in RNA/DNA hybrids. As discussed, it is conceivable that APOBEC3A also plays a role in C-to-U editing of the nascent RNA at R-Loops in their dissolution. Such RNA and DNA modifications are expected to assist the collapse of R-Loops to dsDNA helices, albeit now potentially modified by putative A-to-I DNA modifications in some cases (Hypoxanthine). If these are left unrepaired followed by replication across the R-Loop collapsed region it allows T-to-C and other Wobble Pair transversions T-to-A, T-to-G to be fixed on the NTS of the DNA helix (
Figure 1b).
This necessary background sets the stage for the systematic analysis of the causative origins of the main transcriptional strand biased SBS signatures. As indicated a deeper historical perspective of our work and in relation to the Wellcome Trust-Sanger COSMIC database can be found in the
Supplementary file including a summary of all abbreviations and terms used.
2. Results and Analytical Discussion
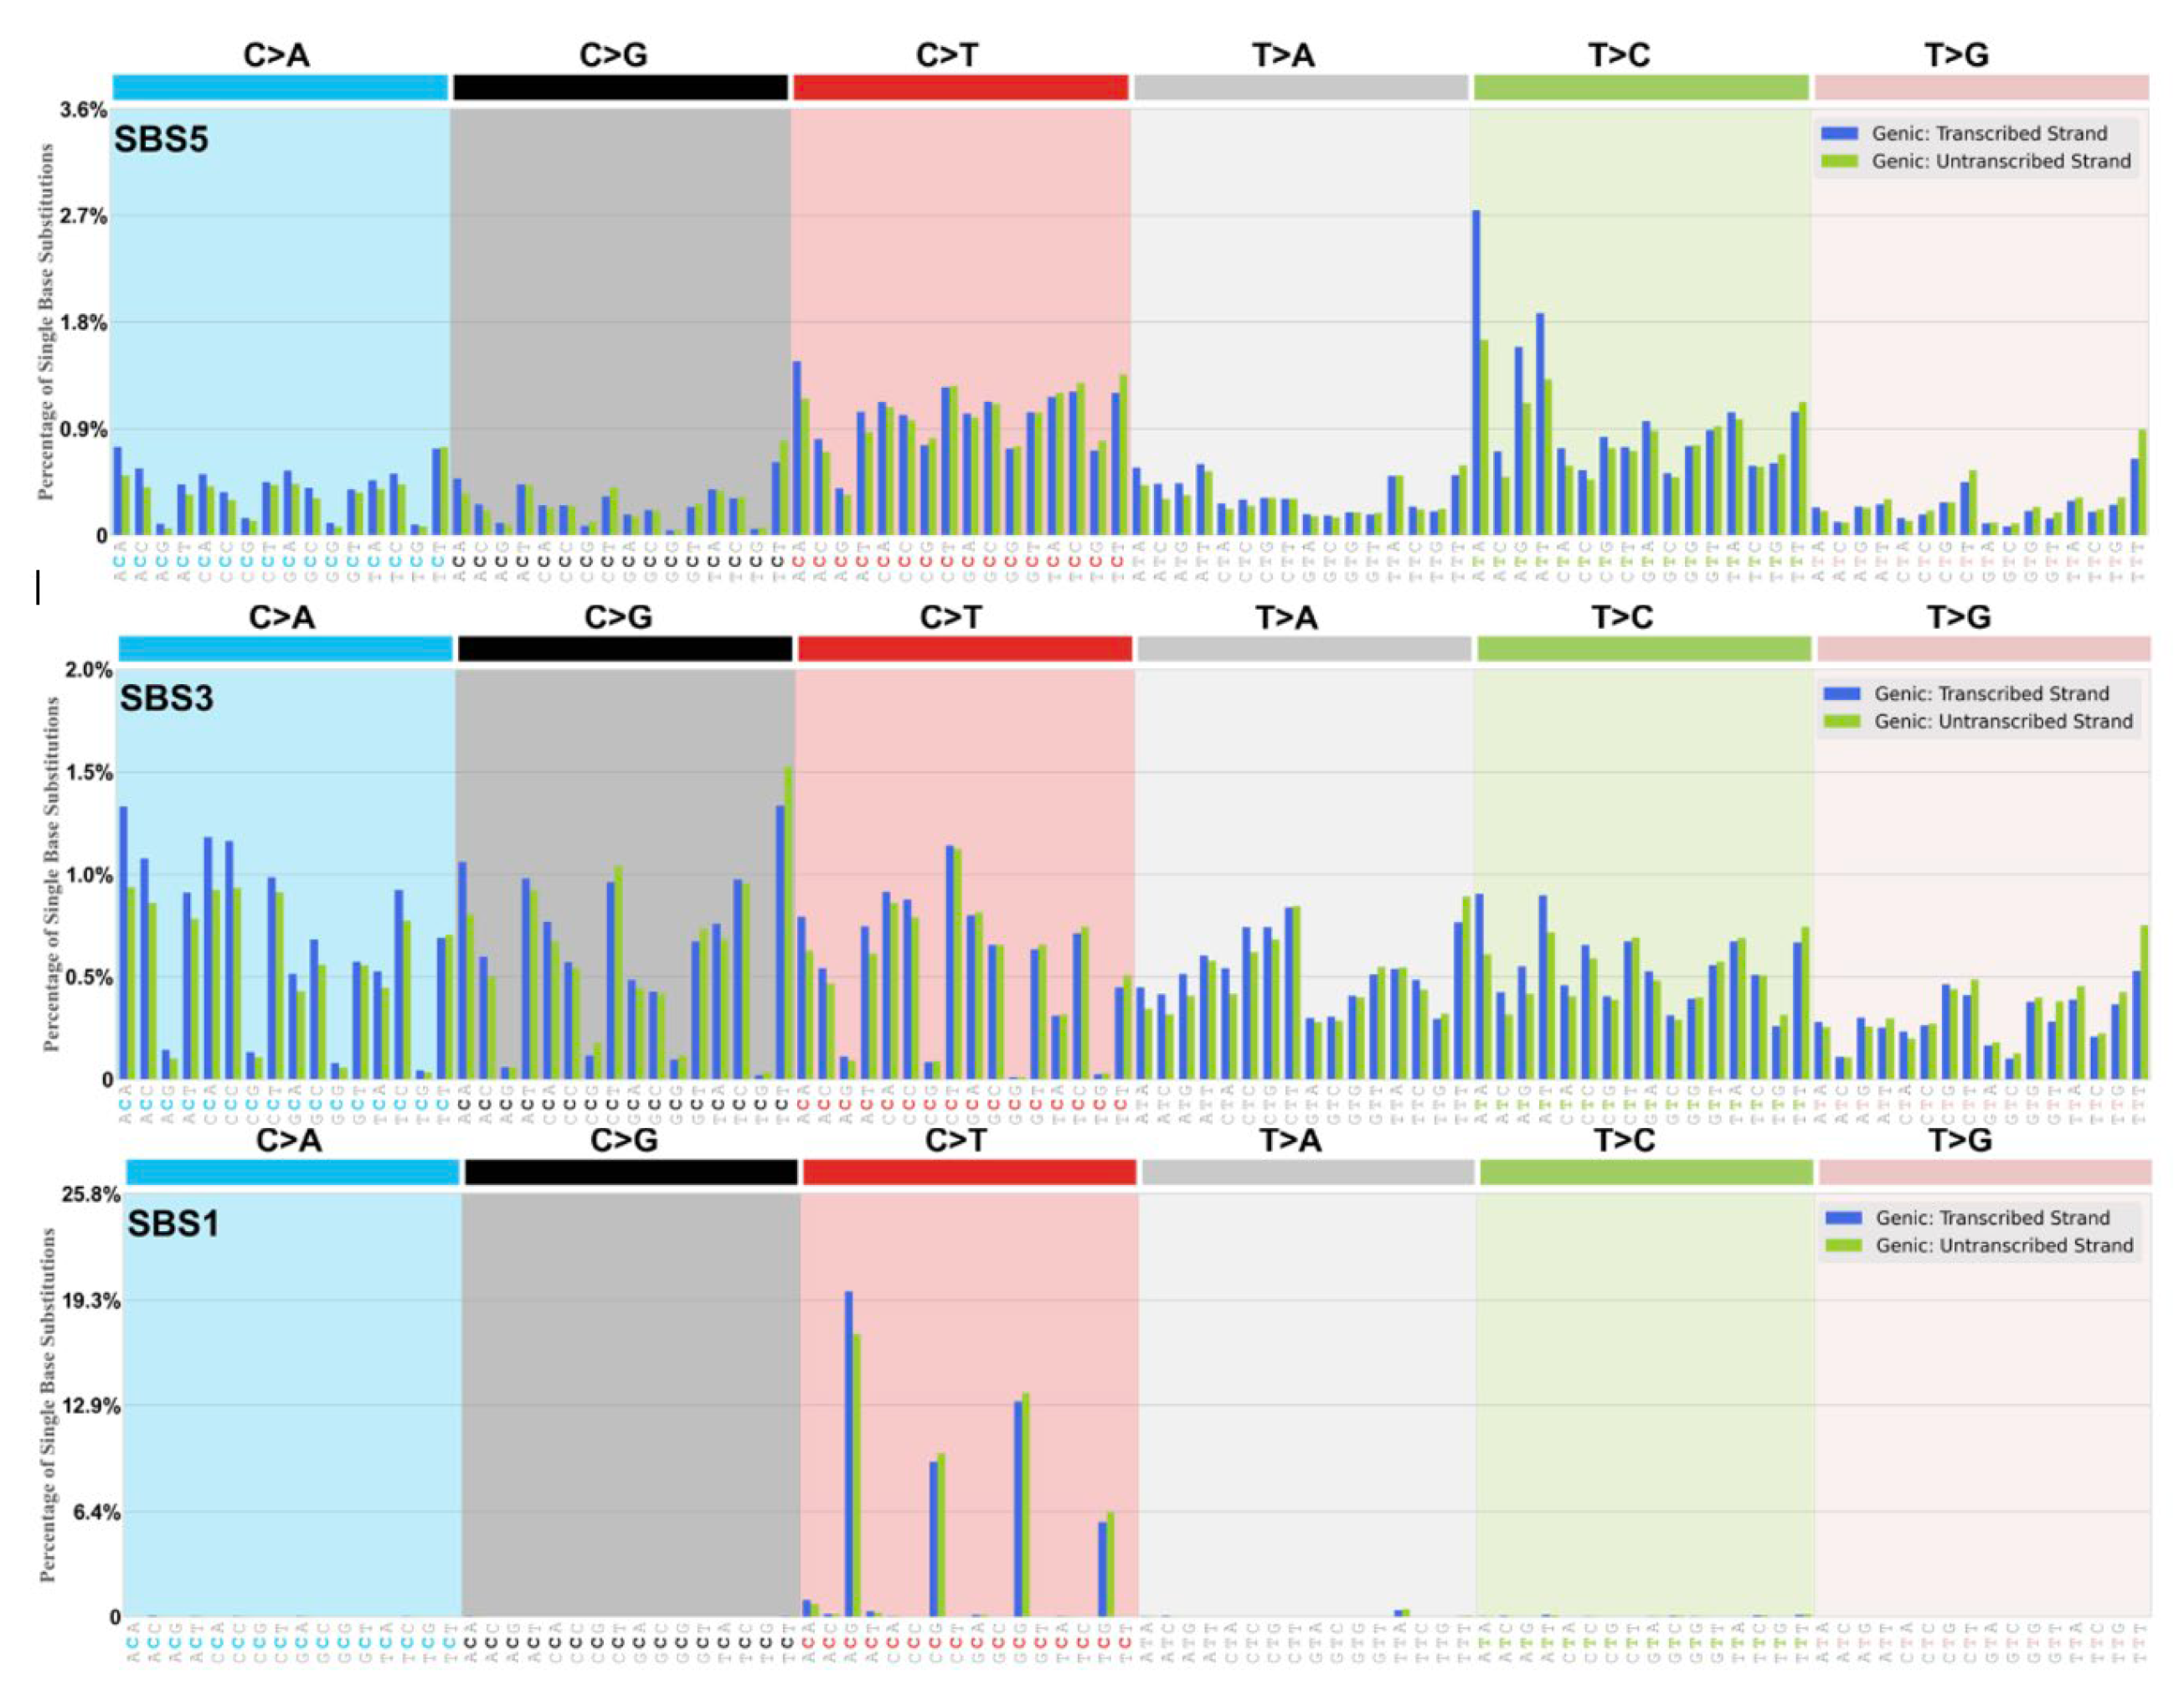
The DRT-paradigm is summarised as a set of “dysregulated Ig SHM-like” strand biased patterns, for example as observed in the dominant yet ‘flat-like’ COSMIC signature SBS5 (
Figure 2,
Table 1,
Table 2, see
Table S1). We postulate that the transient assembly (and disassembly) in the cell nucleus of AID-associated Ig-SHM like enzymes and membrane-anchoring factors create a potential “Ig SHM-like Transcription Factory” environment at many sites across the cancer genome and as described by Peter R Cook and associates (reviewed in the context of Ig SHM [
43]). The comprehensive genome-wide studies on putative AID-driven Ig-SHM like mutations in the human lymphoblastoid cell line Ramos by David G Schatz and associates are consistent with this view [
44]. It would involve the RNA Pol II elongation complex generating a Transcription Bubble at protein coding genes. Such Transcription Bubbles often transiently stall downstream of the transcription start site, to approximately 3 Kb downstream of the TSS [
39], allowing mutagenic deaminase action at exposed DNA and RNA substrates at nascent RNA stem-loops [
27], the annealed 11nt RNA: DNA hybrid [
35]and the unpaired ssDNA in the displaced NTS. Extreme examples of much longer extended RNA:DNA annealed hybrids would be in R-Loops, particularly evident in cancer genomes at Transcription Replication Fork collisions on the same strand TRC [
25,
26], and R-Loop formation at telomeres [
24].
2. a. Strong Evidence for DRT Origin of Many SBS Signatures
What follows is a detailed critical analysis of the mechanism of the origin of a number of significant SBS signatures in the context of the AID/APOBEC/ADAR deaminase mutational DRT-paradigm. To better understand these analyses, it is advised that the reader refer continuously to the transcriptional strand asymmetry signatures for that SBS at the COSMIC website. A tabular summary of the conclusions and outcomes is displayed in
Table 3.
Table 1.
Somatic point mutation patterns (as percentage of total) in data sets involving rearranged murine IgV loci (A) and in human cancer SBS5 (B), SBS3 (C).
Table 1.
Somatic point mutation patterns (as percentage of total) in data sets involving rearranged murine IgV loci (A) and in human cancer SBS5 (B), SBS3 (C).
| A. Somatic mutations (mean % 12 studies plus SEM) in rearranged murine IgV loci |
| |
|
Mutant base |
|
|
|
|
|
| From |
A |
T |
C |
G |
Total |
Strand bias factor |
|
| A |
|
10.6 (1.2) |
6.3 (0.9) |
14.6 (0.7) |
31.6 (1.7) |
A>>T 2.9x |
|
| T |
3.1 (0.6) |
|
5.3 (1.1 |
2.6 (0.6) |
11.0 (1.3) |
p <0.001 |
|
| C |
4.3 (0.8) |
13.4 (1.3) |
|
3.6 (0.7) |
21.3 (1.3) |
G>>C 1.7x |
|
| G |
20.1 (1.9) |
7.2 (1.4) |
8.7 (0.7) |
|
36.1 (2.5) |
p <0.001 |
|
| B. Somatic mutations (as percentage of total 89,120 mutations) in SBS5 |
|
| |
|
Mutant base |
|
|
|
|
|
| From |
A |
T |
C |
G |
Total |
Strand bias factor |
|
| A |
|
5.3 |
3.7 |
16 |
25 |
A>>T 1.1x |
|
| T |
4.9 |
|
13.9 |
4.3 |
23.1 |
p <0.001 |
|
| C |
5.4 |
15.5 |
|
4.2 |
25.2 |
G>>C 1.1x |
|
| G |
15.9 |
6.5 |
4.2 |
|
26.5 |
p <0.001 |
|
| C. Somatic mutations (as percentage of total 53,833 mutations) in SBS3 |
|
| |
|
Mutant base |
|
|
|
|
|
| From |
A |
T |
C |
G |
Total |
Strand bias factor |
|
| A |
|
8.4 |
4.7 |
8.8 |
21.8 |
A>>T 1.04x |
|
| T |
7.8 |
|
8.1 |
5.2 |
21 |
p >0.05 |
|
| C |
9.3 |
8.4 |
|
9.5 |
27.2 |
G>>C 1.1x |
|
| G |
9.3 |
10.9 |
9.8 |
|
29.9 |
p <0.001 |
|
Only cancer types with a minimum 2000 mutations for the SBS5 or SBS3 signatures with average probability at least 0.75 are considered, for real mutations on transcribed and non-transcribed strands. In both B, C a Chi-square 4x4 test (assigning a nominal 10 to empty cells) gives very large Chi-square values with p-values <0.00001. In B. mutations of T-to-G significantly exceed mutations of A-to-C by 1.16x p <0.001. In C. there are strand biases within A:T base pairs where A-to-G mutations exceeds T-to-C mutations by 1.1x giving p <0.01. Similar data for SBS5 and SBS3 broken down by cancer tissue type are shown in
Tables S1, S2. Generic symbol A>>T means mutations of A exceeding mutations of T at A:T base pairs. Generic symbol G>>C means mutations of G exceeding mutations of C at G:C base pairs.
Table 2.
SBS5 : Strand Biases in Types of Mutations in Different Cancers.
Table 2.
SBS5 : Strand Biases in Types of Mutations in Different Cancers.
| |
|
|
Strand Bias at Selected Base Pairs |
| |
Global Strand Bias |
A-to-G> |
T-to-G> |
G-to-A> |
G-to-T> |
| Cancer |
A>>T |
G>>C |
T-to-C |
A-to-C |
C-to-T |
C-to-A |
| |
|
|
|
|
|
|
| Billiary-AdenoCA |
+++ |
+++ |
+++ |
++ |
+ |
++ |
| Bladder-TCC |
+++ |
+++ |
+++ |
++ |
+++ |
+++ |
| Breast-Cancer |
+++ |
+++ |
+++ |
+++ |
+++ |
+++ |
| CNS-GBM |
++ |
+++ |
+++ |
+ |
+++ |
+++ |
| CNS-Medullo |
+ |
+++ |
+++ |
++ |
+++ |
+++ |
| ColoRect-AdenoCA |
R NS |
+++ |
R + |
+++ |
+++ |
+++ |
| ESCC |
+++ |
+++ |
+++ |
+++ |
+++ |
+++ |
| Eso-AdenoCA |
NS |
+++ |
NS |
++ |
NS |
+++ |
| Head-SCC |
+++ |
+++ |
+++ |
NS |
+++ |
+++ |
| Liver-HCC |
+++ |
+++ |
+++ |
+++ |
+++ |
+++ |
| Lung-AdenoCA |
+++ |
+++ |
+++ |
+++ |
NS |
+++ |
| Lung-SCC |
+++ |
+++ |
+++ |
R++ |
+++ |
+++ |
| Lymph-BNHL |
NS |
+++ |
NS |
+ |
+++ |
+++ |
| Lymph-CLL |
+++ |
+ |
+++ |
+++ |
++ |
+ |
| Panc-AdenoCA |
+++ |
+++ |
+++ |
+ |
+ |
+++ |
| Prost-AdenoCA |
+++ |
+++ |
+++ |
+++ |
NS |
+++ |
| Skin-Melanoma |
R ++ |
+++ |
+++ |
+++ |
++ |
+++ |
| Stomach-AdenoCA |
NS |
+++ |
+++ |
+++ |
+ |
+++ |
| Uterus-AdenoCA |
R+++ |
++ |
+ |
+++ |
NS |
+ |
| |
|
|
|
|
|
|
Origins SBS5
The aetiology of SBS5 is unknown and described as “flat” and “Clock-like” thus age-related. It is the most dominant SBS signature appearing prominently in frequency in all cancer genomes [
8,
9]. There is general agreement that SBS5 is the result of the accumulation of many somatic mutations over time and cell division cycles arising from the interplay of DNA damage and repair in the broadest meaning of that description [
45]. The over-arching feature is the significant transcriptional strand bias at A:T and G:C base pairs displayed by this pancancer signature (
Table 1 and
Table 2).
The somatic mutation pattern for SBS5 is displayed as a “Types of Mutation” pattern in
Table 1B in relation to the same pattern as observed in well-defined experimental somatic mutation assays observed in Germinal Centre B lymphocytes from Peyer’s Patches and spleens of aged or immunized inbred mice and transgenic systems where PCR recombinant artefacts, that blunt strand bias, have been minimized (
Table 1A). The data in
Table 1B are integrated and pooled across many thousands of sequenced cancer genomes of different cancer tissue types (see
Table S1, and strand biases further summarised by cancer type in
Table 2). The mutations of A systematically exceed mutations of T (symbolised as A>>T) and mutations of G systematically exceed mutations of C (symbolised as G>>C) at p <0.001. However within A:T base pairs the mutations at A-to-C and complement T-to-G go against this trend with T-to-G mutations significantly exceeding A-to-C mutations (p <0.001). This result is consistent across the majority of different cancer tissue types displaying SBS5 signature patterns (
Table 2, see
Table S1).
Why are these patterns so? Two of the three main sources of deaminase substrates (ssDNA, RNA:DNA hybrids) are associated with the Replication Stress (Lagging strand of the Replication Fork, ssDNA) and Transcriptional Stress (R-Loop generation, ssDNA, RNA:DNA Hybrids). In our view the third source of deamination substrates are at Stalled Transcription Bubbles, as is the case for the more defined Ig SHM systems providing ssDNA, dsRNA stem-loops, and RNA:DNA Hybrid substrates which together provide substrates for AID/APOBEC C-site and ADAR A site deaminations (
Figure 1,
Figure S1). These mutagenic events coupled to TSRT mediated by DNA Polymerase-eta, as for Ig SHM, generate the strong strand biased mutagenesis signal that outweighs the contributions from the other two mentioned sources. Blunting this systematic A>>T strand bias in SBS5 is the systematic strand bias of T-to-G over A-to-C mutations. This strand bias is not evident in the Ig SHM data (
Table 1A), but it is the case in the vast majority of different types of cancer genomes with sufficiently large enough mutation numbers to assess significance (
Table 2, see
Table S1). There are exceptions to this T-to-G strand bias viz. Squamous Cell Carcinoma of the Head and Neck (Head-SCC), and Lung cancer (Lung-SCC).
The strand biased pattern for the origins of T-to-G > A-to-C in the vast majority of cancers is plausibly explained by the DRT-Paradigm by assuming a major role for the modified isomer of uracil in pre-mRNA, pseudouridine (y), now behaving like “G” base pairing to mis-incorporate a C in the newly synthesised cDNA transcribed strand (TS) via TSRT opposite y in the pre-mRNA. There is much data in the pseudouridine literature consistent with this explanation [
17,
18,
19,
20].
What is a plausible explanation for the other less dominant yet reverse strand biases of A<<T, at certain trinucleotides such as TTC, TTT? These are at classic WA site motifs for ADAR A-to-I RNA deamination [
46]. One likely explanation is the role of ADAR1 and ADAR2 assisting R-Loop dissolution, particularly at ubiquitous transcription-generated R-Loops at replication fork head-on collisions [
25]. The annealed RNA:DNA hybrid regions are a target for ADAR1 attack for dissolution of R-Loops at telomeres [
24]; and, ADAR2 does this in the wider body of the genome at R-Loop TRC sites [
25].
Double strand DNA breaks (DSB) can provoke R-Loop formation [
47] and change the general pattern of ADAR2 A-to-I RNA editing that assists their resolution [
48] and specifically assisting DNA end resection and homologous recombination (HR). These observations are thus consistent with observed genomic mutagenesis in cancer at foci of R-Loops at TRC sites [
25].
The almost universal T-to-G strand bias observed in cancer genomes prompts an additional comment. If the suggestion that excessive pseudourinylation (y) in cancer transcriptomes is correct, then it warrants further investigation to establish, or not, whether y is a useful pancancer biomarker.
Table 3.
Summary of Origins and Features of Main SBS Types.
Table 3.
Summary of Origins and Features of Main SBS Types.
| |
|
|
Transcriptional Strand Asymmetry |
| |
Deduced Deamination |
Inferred Cause of |
Inferred Cause of |
| |
DNA |
RNA |
Transcriptional |
T-to-C > A-to-G at |
| COSMIC SBS |
C-to-U |
A-to-I |
Strand Asymmetry |
Collapsed R Loops † |
| SBS5 |
AID/APOBEC |
ADAR (+ Hx) |
TSRT |
ADAR (Hx) |
| SBS1 |
AID/APOBEC |
|
TSRT |
|
| SBS2/SBS13 |
AID/APOBEC |
|
|
|
| SBS3 |
AID/APOBEC |
ADAR |
TSRT, TCR |
|
| SBS4 |
|
|
TCR |
|
| SBS6 |
AID/APOBEC |
|
|
|
| SBS7a, SBS7b |
AID/APOBEC |
|
TCR |
|
| SBS7c, SBS7d |
|
ADAR (+ Hx) |
|
ADAR (Hx) |
| SBS8 |
|
|
TCR |
|
| SBS9 |
AID/APOBEC |
ADAR (+ Hx) |
TSRT |
ADAR (Hx) |
| SBS10a,b SBS14 |
AID/APOBEC? |
|
|
|
| SBS11 |
AID/APOBEC |
|
TSRT |
|
| SBS12 |
AID/APOBEC |
ADAR |
TSRT |
|
| SBS15 |
AID/APOBEC |
|
|
|
| SBS16 |
|
ADAR |
TSRT |
|
| SBS17a, SBS17b |
|
ADAR (+ Hx) |
|
ADAR (Hx) |
| SBS18 |
|
|
TSRT |
|
| SBS19 |
AID/APOBEC |
|
TSRT |
|
| SBS84 |
AID/APOBEC |
|
|
|
| SBS85 |
|
ADAR (+ Hx) |
|
ADAR (Hx) |
| |
|
|
|
|
Origin SBS1
This ‘Clock-Like’ signature at CpG sites appears in all cancers examined (
Figure 2). The formal description and aetiology is a ‘Clock Like’ (ie. age-related) signature arising due to spontaneous water deamination or enzymatic deamination of the methylated cytosine at NCG (read CpG) sites.
The dominant ACG motif among the C>T trinucleotides harbours approx. 36% of all substitutions within this signature. At ACG a G-to-A > C-to-T strand bias is evident when mutations are read from NTS (not significant at the other lower incidence CpG motifs, CCG, GCG, TCG). SBS1 is a minor extracted SBS signature. It is a G>>C strand bias component of the global AID/APOBEC driven strand bias at C-sites in the SBS5 signature.
The current biochemical data is inconsistent with SBS1 arising spontaneously by water hydrolysis in vivo and is most likely AID or APOBEC deaminase driven when it appears in cancer genomes in vivo. In our view SBS1 falls under the umbrella of the DRT-Paradigm.
Detailed comparative biochemistry analysis in vitro by Ito et al. [
49] of deamination C or mC to uracil or thymine suggest this is an enzyme catalysed AID/APOBEC deamination signature and that spontaneous water hydrolysis is an unlikely deamination event. Indeed, methylation of C at CpG sites appears to protect cytosines from enzymatic deamination. There is a range of dose dependent activity (‘catalytic efficiency’) for C and mC deamination across a range of substrate motifs (see data in figure one in the paper by Ito et al. [
49]). These include a TCpG site and ACA, CCA, GCA, TCC, TCT, TCA, CCC motifs. The deamination efficiency against relevant substrates, methylated or not, was compared for cytosine deaminases AID, APOBEC1, APOBEC3A, APOBEC3B, APOBEC3C, APOBEC3D, APOBEC3F, APOBEC3G and APOBEC3H. In all cases unmethylated C-sites were deaminated effectively but at varying dose dependent efficiency. What is striking is that in all cases, when the same C-centred motif is methylated substantial reductions, down 51%-98% in deamination efficiency occurred across the range of AID and APOBECs tested. Indeed, APOBEC3H was ‘inhibited’ in its deamination activity the least by cytosine methylation.
Consistent with this view is the finding that SBS1 is depleted across cancer types for multiple histone marks, including H3K9me3 [
10]. One speculation is that this is a consequence of excessive methylation of cytosines protecting against AID/APOBEC deamination of 5meC sies in general.
These are C-site mutations (Box 1) targeted at G:C base pairs [
9,
10,
50]. The designated origin is attributable to aberrant activity of the AID/APOBEC family of cytosine deaminases particularly APOBEC3A, APOBEC3B, APOBEC3H at lagging strands of replication forks under stress (see
Supplementary information Section 2 A). They do not display systematic transcriptional strand asymmetry, but they do show replication strand asymmetry with a preference for the lagging strand indicative of unpaired cytosines on the ssDNA substrates at replication forks. It is agreed that the strand bias at G:C base pairs in SBS13 is most likely generated by the translesion repair enzyme REV1 replicating across abasic sites arising from BER removal of uracil (reviewed in [
14] in the context of Ig SHM). The SBS2/SBS13 signature (
Figure S2) appears jointly and to varying degrees of strength in many cancers (24/32 in [
9]). It can be considered as a small and defined subset of the of the global AID/APOBEC and ADAR strand-biased deaminase-based TSRT signatures already discussed for SBS5 (The DRT-Paradigm). This interpretation also assigns causative ‘AID/APOBEC’ activity to the SBS2/SBS13 at the online COSMIC database [
9,
10] as shown in the summary
Table 3.
Origin SBS3
This complex SBS signature (
Figure 2,
Table 1) appears in a subset of tumors with Defective Homologous Recombination (dHR) Repair of double strand breaks (DSBs) due to genetic deficiency in BRCA1 or BRCA2 genes. It is a complex signature and many features are not inconsistent with the DRT-paradigm interpretation.
There are strong parallels in the genomic sequencing analysis on in vitro culture of the avian DT40 cell system consistent with the SBS3 profile [
51]. Superficially it appears similar and ‘flat’ to the SBS5 profile, but there are many differences. Clearly many unrepaired single base substitution lesions, apart from the more serious DSBs, are elevated in HR Defective patients. The patients themselves are surprisingly long lived given the seriousness of the formal HR deficiency, suggesting other DNA repair mechanisms compensate, which suggests back-up RNA-templated DSB repair via DNA repair reverse transcriptases, Pol-eta [
52] and thus putatively Pol-theta which is also a reverse transcriptase [
53] via TSRT as already discussed.
At A:T base pairs the global strand biased A>>T pattern is not significant, although there is a clear strand bias for A-to-G exceeding T-to-C mutations, the prominent strand bias in SBS5. There are many distortions in patterns to the ‘Types of Mutations’ that are systematic in SBS5 (
Table 2) as seen in
Table S2. Many of the cancers with this profile may also have potential ‘smoking’ adduct or aetiology for those mutation patterns; or accumulated endogenous adducts on G, and maybe A as well (
Table S2). In this regard BRCA1 deficient DT40 cells display 53BP1 dependent translesion Y family involvement of Pol-eta, Pol-kappa. This dependency on specific base substitution mutations on Pol-eta, Pol-kappa for translesion synthesis [
54] is very interesting given that human Y family polymerases eta, kappa and iota are all known to display reverse transcriptase activity [
55,
56,
57].
Final caveats on the putative involvement TSRT in the generation of some of the SBS3 profile, particular at purines G and A. The strand bias could result from exogenous sources (Tobacco smoking) or spontaneous endogenous bulky adducts on G and A thus conventional Transcription Coupled Repair, TCR [
58,
59,
60] making detected mutations on the NTS exceed those on the TS, as is clear in the ‘Tobacco smoking’ signature of SBS4 (
https://cancer.sanger.ac.uk/signatures/sbs/sbs4/#transcriptional-strand-asymmetry). However, ROS generated 8oxoG modifications in nascent pre-mRNA cannot be ruled out as primary source of excessive strand biased G-to-T mutations (see below Origins SBS18).
Further, SBS3 is a minor low level signature in most BRCA1/2 deficient cancers except Breast-Cancer, ESCC, Ovary-AdenoCA, Panc-AdenoCA, Stomach-AdenoCA (
Table S2). It is conceivable within the SBS3 profile, that there is also some endogenous ADAR A-to-I damage at A-sites in pre-mRNA, at uracils in pre-mRNA (y) at Transcription Bubbles thus an expected contribution of A-to- G > T-to-C. The global G>>C strand bias is also prominent suggesting involvement of Pol-eta (Pol-theta) TSRT repair as discussed for SBS5. This appears particularly the case for Breast-Cancer (
Table S2).
In summary, a number of strand-biased processes appear to contribute to the SBS3 profile, including bulky adduct clearance of adducted Gs and As by conventional TCR, AID/APOBEC and ADAR deaminase-driven reverse transcriptase-coupled processes involving TSRT and back up RNA-HR reverse transcriptase-mediated DSB repair.
Origin SBS4
This is the ‘Tobacco smoking’ signature. It occurs mainly at G:C base pairs but also at lower frequency at A:T base pairs. The undisputed conventional explanation is that the SBS4 transcriptional strand biases at G:C and A:T base pairs are caused by preferential bulky adduct clearance of adducted Gs and As on the transcribed strand by conventional transcription coupled repair (TCR). This signature has long been considered to be diagnostic of DNA mutagenic damage associated with tobacco smoking [
58,
59,
60].
Origin SBS6
The proposed aetiology for this signature is defective DNA mismatch repair with bias to the leading strand at replication forks [
10] and is found in microsatellite unstable tumours. It appears at significant low incidence in a very small number of cancers (Liver-HCC, Lymph-BNHL, Panc-AdenoCA, Uterus-AdenoCA [
9] The prominent apparent reversal of G-to-A over C-to-T strand bias (as SBS5,
Tables 1, 2) at some motifs CCG, GCG, GCT, TCG, but not ACA, ACG is similar to patterns at the same motifs in SBS1 (
Figure 2). None of these apparent strand biases reach significance and the numbers of mutations are small. SBS6 is considered a small subset of the AID/APOBEC deaminase driven C-site signature of SBS5 (The DRT-Paradigm).
Origin SBS7a, SBS7b and SBS7c, SBS7d
These have been attributed to exogenous UV exposure observed in Skin-Melanoma genomes [
9,
10]. Many of the component transcriptional strand biased signatures at both G:C and A:T base pairs can be plausibly understood within the frame of the DRT-paradigm
The main G:C base pairs targeted mutations in Skin-Melanoma are caused by formation of cyclobutene pyrimidine dimers (CPD) in DNA. This is a significant damage lesion in the DNA helix blocking transcription and replication passage. It is responsible for >95% of all C>T signature mutations (of C-to-T and G-to-A) in Skin -Melanoma genomes. These numbers and statistics for strand biases at G:C and A:T base pairs are summarised in
Table S3 (harvested from
https://cancer.sanger.ac.uk/signatures/sbs/). It can involve a two-step process in human cells involving cytosine deamination (C-to-U) at certain motifs then error-free polymerase bypass repair [
61]. The UVB exposure causes cyclobutene pyrimidine dimers (of adjacent pyrimidines written as C=C, T=C). The authors tested their hypothesis that largely confirms this alternative mechanism.
The main assumption in Jin et al. [
61] is that the cytosines in the CPDs are deaminated by spontaneous processes to form uracil, which are then faithfully replicated by Y family translesion DNA polymerase eta thus incorporating adenines across the deaminated, or uracil-containing CPDs. The resulting mutations in the tri-nucleotide spectrum broadly matches SBS7 (SBS7a,b), which is a very good confirmation of their alternative explanation for adjacent T-T sites appearing at T=C sites within CPDs after UVB exposure and CPD repair.
This is a reasonable explanation apart from the assumption that the recovery and repair process on UVB exposure involves non-catalytic or spontaneous cytosine deamination. Our doubts about this assumption are supported by the experimental method the authors employed.
Proposed Alternative Explanation
A key section on their method of UVB exposure is as follows: “We next applied the circle-damage-seq method to analyze the extent of CPD cytosine deamination. We irradiated human fibroblast cells with UVB and harvested them 24 and 48 hours later to allow time for deamination. To specifically map the deaminated CPDs, we applied a photolyase-mediated reversal of the CPDs first, followed by the excision of U bases by uracil DNA glycosylase (UDG) in the circle-damage-seq method (Figure 4A).” [
61].
In our view that period of 24-48 hr for deamination to occur is key to understanding these data. This time interval is consistent with the immediacy and time course of a cellular Innate Immune response. It is indeed plenty of time for the Innate Immune response to be marshalled and assembled following this quite powerful attack on the integrity of the cell, particularly the DNA damaged genome. In our opinion a cellular Innate Immune response is unavoidable.
Our contention is that sunlight UVB damage, such as CPD lesions across the genome, particularly in coding regions, can excite an Interferon Stimulated Gene-dependent Innate Immune response which includes APOBEC and ADAR activation [
29]. This itself is also likely to activate expression of the DNA damage regulator TP53 that is known to coordinate expression of APOBEC3 family genes [
42]. Thus APOBEC3G [
62], APOBEC3B and APOBEC3A at least can expect to be activated [
63,
64,
65] causing expected collateral genomic damage via DNA deaminations [
1,
3] particularly in melanoma [
66] and thus cancer pre-mutations - via C-to-U mutations at T=C and C=C cyclobutane pyrimidine dimers, involving error free DNA direct copying damage repair by DNA Polymerase eta.
Thus, SBS7a/b is a cancer mutation signature involving both active deaminase-driven cytosine deamination coupled at least to translesion DNA repair synthesis involving DNA polymerase eta.
However, not explained is the strong transcriptional reverse strand bias (in relation to SBS5) of G<<C (i.e., C-to-T > G-to-A) in both SBS7a, SBS7b, and at a far lower level of T site mutations which exceed A site mutations (
Table S3). How do these strong and highly significant transcriptional strand biases in the C>T and T>C tri-nucleotide spectral patterns arise (without replication strand bias)?
Plausible explanations that fit the data are in two parts:
1. SBS7a, SBS7b: The strong transcriptional strand bias at TpC-sites first involves the C-to-U deamination step as shown in Jin et al. [
61]. Pol-eta may well be involved in the error-free repair. However, CPDs in the cell genome would also be expected invoke a strong conventional TCR repair process [
58] - involving NER-TCR - directed at the preferential repair of the template or transcribed strand for RNA Pol II transcription (ie. TS) leaving an excess of unrepaired C-to-T mutations on the displaced non-transcribed strand (NTS). CPDs are akin to obstructive bulky adducts on the template strand, which would be cleared preferentially as shown earlier for bulky adducts of purines [
59,
69] as observed in SBS4 (Tobacco smoking).
In our opinion the extreme strand biases at G:C base pairs in the SBS7a and SBS7b profiles result from conventional TCR.
2. SBS7c, SBS7d: These mutation levels are <5% of all mutations in Skin-Melanoma genomes. In our opinion the reverse strand biases e.g., T-to-C far exceeding A-to-G require a different explanation as it involves specific mutations at A:T base pairs. The most plausible in progressing malignant melanomas would be the ubiquitous and putative large number of R Loop-Replication Fork (TRC) conflicts [
25] as discussed already to explain similar reversals in strand biases in SBS5. Thus we invoke ADAR1/2 involvement in the Inosine modification of adenine bases in the DNA moiety of the long annealed RNA:DNA hybrids at R Loops. This would then assist in release of the pre-mRNA, its degradation thus dissolution of R Loops as discussed above. The extreme T-to-C strand bias over A-to-G follows replication of the unrepaired Inosine (Hypoxanthine) in the DNA at the collapsed R Loop site. Given Wobble Base pairing off template Hypoxanthine, other possible extreme strand biased signatures at T appearing on the NTS would be T-to-A viz. at TTT trinucleotide motifs (AAA on the TS).
We support both of these explanations, although different, as they are economical on basic assumptions, and provide plausible explanations for the intriguing strand biases of SBS7. Together, both explanations are consistent with AID/APOBEC and ADAR deaminations as initiators and drivers of DNA damage in melanoma progression post UV exposure. They are thus part of the DRT-Paradigm we employ in our analytical approach to understand the generation of SBS strand bias signatures.
It is noted that the strong presence of a T-to-G > A-to-C strand bias, which we have speculated is caused by endogenous pseudouridination (y) of uracil in cancer transcriptomes (
Table S3), and now coupled to TSRT (Pol-eta, Pol-theta) as discussed earlier as the base mispair outcome of the RNA modifications appears in genomic DNA.
Origin SBS8
Classed as of “Unknown aetiology”. It is similar to the signature of alkylation of G and A by methyl methanesulfonate exposure in avian DT40 cells [
54]. However, both C-site and A-site Transcriptional Strand Asymmetry is noted at G:C and A:T base pairs. A plausible origin is exposure to alkylating agents (endogenous or exogenous ?) and the strand biased profiles are suggestive of bulky adducts of G, A and T resulting in G-to-T, A-to-T [
31,
55] and T-to-A [
56,
57] excesses on the non-transcribed strand via conventional TCR with preferentially targeting of the transcribed strand [
51] as originally described for bulky adducts of tobacco smoking c.f SBS 4 [
52,
53].
Origins SBS9
This signature is classed [
9] as “In part, polymerase eta activity”. It is classed in Box 1 as a ‘C-site plus A-site more or less balanced “Ig-SHM-like” (AID/APOBEC/ADAR driven transcriptional strand biased signatures with some TSRT and some Hx in DNA after R Loops have collapsed and replicated (
Table 3).
It appears primarily in lymphocytic and lymphoma tumours (Lymph-BNHL, Lymph-CLL). We are genuinely puzzled by this categorisation involving Pol-eta activity. In our opinion DNA Polymerase eta (and theta) can be involved in target site reverse transcription (TSRT) in the strand biased fixation of RNA mutations in DNA as in Ig SHM (
Supplementary file Figure S1). Most of the mutations are at A:T base pairs in the T>C and T>G tri-nucleotide components of the SBS9 profile (
https://cancer.sanger.ac.uk/signatures/sbs/). Parts of the patterns are interesting with systematic strand bias to the NTS of T-to-A, T-to-C and T-to-G. These are understandable under the DRT-Paradigm given previous listed analyses (SBS5), yet involving Hx in DNA at collapsed R Loops.
First, for T-to-C strand bias to the NTS. In our view, this would plausibly involve ADAR1/2 A-to-I editing of the DNA of the annealed RNA:DNA hybrid at R Loops as they are collapsed and dissolved, in rapidly proliferating lymphocyte cancers. Then the unrepaired template Hypoxanthine is copied as T-to-C into synthesis of the NTS on replication as discussed (SBS5).
Second, the origin of T-to-G strand bias, could also plausibly involve pseudouridine (y) modifications in RNA as discussed and TSRT fixation of T-to-G mispaired mutations in the genome via DNA Polymerase eta acting in its reverse transcriptase repair mode (TSRT).
The main features in SBS9 are understandable from first principles and DRT model assumptions (AID/APOBEC and ADAR deaminations coupled to TSRT). However, also note the analysis [
10] where the strong replication strand bias with enrichment of mutations on the leading strand is attributed to infidelity of polymerase eta.
Origin SBS10a, SBS10b, SBS14 (as in Box 1)
These signatures are associated with POLE gene mutations - with or without dMMR. A mutation in the POLE gene is associated with faulty polymerase proofreading. There is no reason to dispute the attributed origins of these very minor signatures that appear in Colorectal-AdenoCA, Uterus-AdenoCA, Liver-HCC as consequence of POLE mutation(s) with or without MMR deficiency. However, Otlu et al. [
10] attributes the strong replication strand bias with enrichment of mutations on the leading strand to the defective activity of polymerases, DNA polymerase epsilon (POLE) and polymerase delta (POLD1).
Origin SBS11
There is no reason to qualify the origins of SBS11 as it is associated with Temozolomide treatment. It is a minor yet distinctive signature in CNS-GBM and Panc-Endocrine tumours. The systematic transcriptional strand bias of G-to-A mutations exceeding T-to-C mutations at many C-site motifs (ACC, ACT, GCC, GCG, GCT, TCC) suggests the involvement of AID/APOBEC deamination coupled to TSRT via Pol-eta (or Pol-theta). Thus, a cytosine deaminase explanation at Transcription Bubbles coupled to genomic fixation via TSRT is plausible. The DRT-Paradigm is useful to understand the transcriptional strand bias features of SBS11.
Origin SBS12
This is one of the most interesting signatures in the SBS collection. It is of ‘Unknown’ aetiology and dominates Liver hepatocellular carcinoma (HCC) genomes (see
Table S1,
Table 2,
Table 3). It is largely focused on A:T base pairs, with lower level mutations at G:C base pairs. The notable feature is extreme strand bias of A-to-G mutations strongly exceeding T-to-C mutation on the NTS. A plausible interpretation is that this is caused by the oncogenic tumour promoting activity of high ADAR1 expression in such cancers [
67] as discussed elsewhere [
7,
68]. Others [
69] including curators at the COSMIC site, suggest this is an example of an unknown aetiology involving Transcription Coupled Damage (TCD) causing lesions at adenines on the (displaced) NTS strand at Transcription Bubbles. However, in the context of the DRT model (
Figure 1a), this is a good, though extreme, example of transcription-coupled ADAR1-mediated A-to-I deamination of nascent pre-mRNA stem-loops [
27] followed by TSRT at stalled Transcription Bubbles then fixing the pre-mRNA A-to-I mutations in DNA. This is the most plausible cause of the extreme strand bias of A-to-G mutations over T-to-C as read on the NTS. The stand-out features of SBS12 are thus understandable from first principles and foundation assumptions of the AID/APOBEC and ADAR deamination paradigm coupled to TSRT involving the RT activity Pol-eta at least, and/or the putative RT activity of Pol- theta. That is, the DRT-Paradigm.
Origin SBS15
This signature of ‘Defective DNA mismatch repair’ displays features of the DRT-paradigm. It is evident at low level in Biliary-AdenoCA, Colorectalk-AdenoCA, Stomach-AdenoCA, Uterus-AdenoCA [
9]. At the COSMIC site (ver3.4) ESCC displays the signature prominently. It is focused at G:C base pairs for the C>T set of trinucleotide motifs, particularly GCG, but also evident at GCA, GCC, GCT. These are key features of core RCN AID deaminase motifs (typically WRCG/W). What is striking about SBS15 is the complete lack of Transcriptional strand asymmetry, see
https://cancer.sanger.ac.uk/signatures/sbs/sbs15/#transcriptional-strand-asymmetry. A plausible explanation is that defects in the mismatch repair MSH2-MSH6 heterodimer activity may not sufficiently recruit DNA Polymerase eta to AID-mediated C-to-U DNA lesion sites (thus poor TSRT). Such a deficit has been established in well studied Ig SHM systems in vitro [
70]. Thus, the DRT-Paradigm allows us to better understand the lack of transcriptional asymmetry in SBS15.
Origin SBS16
This signature is of ‘Unknown’ aetiology, yet it can be plausibly attributed to “Alcohol consumption” on current observations, and mechanistically to what has been termed Transcription Coupled Damage [
10,
60]. It is evident in Head-SCC and Liver-HCC [
9,
10]. At the COSMIC site (ver3.4) ESCC and Liver-HCC display this strong A>>T strand biased signature at A:T base pairs prominently (
https://cancer.sanger.ac.uk/signatures/sbs/sbs16/#transcriptional-strand-asymmetry).
SBS16 is thus an A:T bp-focused signature at ATA, ATG, ATT motifs, which are core WA motifs for both ADAR1 mediated A-to-I pre-mRNA modifications [
46] and indeed DNA Polymerase eta [
71,
72] during Ig SHM in vivo [
27]. The strand biased mechanisms highlighted in
Figure 1 apply. As with SBS12, the SBS16 signature is therefore understandable from first principles and foundation assumptions of the AID/APOBEC and ADAR deamination paradigm coupled to TSRT, involving the RT activity Pol-eta at least, and/or the putative alternate RT activity of Pol- theta, that is the DRT-Paradigm. See comments
Table 3.
Origin SBS17a, SBS17b
This signature is also of ‘Unknown ‘ aetiology and it appears in many cancer genomes but particularly with high somatic mutation numbers in Eso-AdenoCA, Stomach-AdenoCA and is A:T bp focused. In SBS17a the reverse strand bias of A-to-G < T-to-C on NTS is significant (p<0.001). In SBS17b the strand bias of T-to-G > A-to-C at main motifs CTT, GTT and TTT is also systematically significant (p<0.001).
The explanations under the DRT-Paradigm for these different transcriptional strand biases are in two parts.
In SBS17a, these strand biased patterns are consistent with ADAR-mediated A-to-I creating hypoxanthine in the DNA moiety of long annealed RNA:DNA hybrids at R Loops in these progressing cancers. On ADAR assisted dissolution and degradation pre-mRNA, it can lead to unrepaired hypoxanthine in TS DNA being replicated to produce excess T-to-C (and Wobble Base pairing producing the alternative T-to-A) mutations on the NTS.
In SBS17b, while a contribution from Wobble Base pairing at Hypoxanthine at R Loop dissolution may contribute to the excess in T-to-G over A-to-C, putative pseudouridinylation (y) of nascent pre-mRNA as speculated previously at Stalled Transcription Bubbles followed by TSRT would also contribute to this pancancer signature (see discussion of SBS5).
Origin SBS18
This signature, in many cancer genomes, is putatively caused both by the Innate Immune Response to infections and internal cellular stress and DNA damage involving Reactive Oxygen Species (ROS) - acting to oxidize nucleic acids particularly Guanines causing G-to-T mutations in DNA as a consequence of 8oxoG formation. Thus, the strong mutation profile signature of SBS18 is focused on G:C base pairs and most dominantly in C>A trinucleotides. There are two striking features.
The first is the transcriptional strand bias of G-to-T mutations exceeding C-to-A on the NTS. This is particularly evident at ACA, ACC, ACT, CCA, GCT, GCA, GCT, TCA, TCC motifs. In different cancer types with large numbers of mutations the strand bias is very significant in Breast-Cancer, Colorect-AdenoCA, ESCC, Eso-AdenoCA, Stomach-AdenoCA (p<0.001). This is a striking result not the least because the observation conflicts strongly with known oxidative DNA base damage studies in mammalian cells. Thus Thorslund et al. [
73] investigated defined oxidative DNA base damage exposure of Chinese hamster ovary fibroblast cells in culture. In contrast to mitochondria, they report that 8oxoG is repaired equally on both DNA strands without strand bias. This is expected as 8oxoG modifications are not considered bulky adducted modifications, and can be replicated easily or presumably reverse transcribed.
Why do the SBS18 ROS signatures in many cancer genomes in vivo display strong G-to-T over C-to-A strand bias? This is reminiscent of the known similar bulky adduct-induced strand biases caused at Gs in lung cancer mutational hotspots in the TP53 gene on exposure to Benzo[a]pyrene adducts, and their slower removal from the TS [
59,
60] the now classic strand-biased outcome of Transcription Coupled Repair as discussed for SBS4 [
58].
An answer that fits the transcriptional asymmetry data assumes oxidative RNA damage in nascent pre-mRNA at stalled Transcription Bubbles as specifically speculated on earlier [
11,
12] based on the published RNA oxidative damage studies of Wu and Li [
21]. Thus, in this scenario, strong strand biases of the type G-to-T exceeding C-to-A on the NTS can also in theory be generated by ROS stress first as RNA modifications (8oxoG) which are converted to excessive strand biased G-to-T mutations via TSRT and reverse transcriptase functions of Pol-eta (or putatively Pol-theta).
The DRT-Paradigm thus allows a plausible understanding of these simple base modified strand biases now appearing in genomic DNA of cancer cells.
The second and overlooked feature of SBS18, is the significant 5’ preference for G-to-T mutations. Thus, on average, the incidence of G-to-T mutations (8oxoG) at WG sites is four times more frequent than at SG sites. This has similarities to accessibility of ADAR deaminases to the A-site at WA motifs in dsRNA [
46]. It appears that oxidation at the 8 position of G via ROS follows similar biochemistry.
The transcriptional strand asymmetry signature of SBS19 is understandable in part in terms of the DRT-paradigm.
Origin SBS19
The aetiology of this signature is ‘Unknown’. It appears as a minor signature in CNS-PiloAstro, Liver-HCC and Myeloid-MDS/MPN tumour genomes. The striking transcriptional strand asymmetry profile shows it is almost a pure G-to-A > C-to-T strand biased signature. Again, a signature that is best understood under the DRT-Paradigm.
Origin SBS84, SBS85
In Otlu et al. [
10] these are assigned as “AID-associated signatures SBS84 and SBS85.” This implies off- target Ig SHM-like mutagenesis across the cancer genome. The reverse transcriptional strand-bias is significant particularly at A:T base pairs T-to-C> A-to-G and T-to-A > A-to-T. This suggests R Loop targeting and unrepaired hypoxanthines in DNA in the transcribed strand after nascent RNA release and degradation. The key points on this reverse strand biased feature have been made viz. SBS5.
SBS Signatures SBS20 through SBS 44 (as [
9])
This paper will not critically evaluate these signatures here, as the main conceptional and interpretation points concerning the DRT-Paradigm have been established, in our opinion, by the above analyses. These additional signatures are all minor mutation patterns apart from SBS40 (‘Unknown’ aetiology, yet appears much like SBS5). Some are repetitive subsets of other established signatures. Many have no known causes. However, many also have no topographical ‘Transcriptional strand asymmetry ‘ assigned e.g SBS40.