

Submitted:
11 November 2024
Posted:
12 November 2024
You are already at the latest version
Abstract
Background: The cough variant asthma (CVA) is characterized by non-specific symptoms and normal spirometric values, which makes diagnosis challenging. To diagnose CVA it is necessary to document airway hyperreactivity (AHR). The aim of our study was to evaluate the diagnostic value of body plethysmography in the assessment of AHR by methacholine challenge test (MCT). Methods: In CVA-suspected patients, a bronchodilation test (BDT), MCT with spirometry, and body plethysmography were performed. MCT was considered positive if there was a 20% decrease in forced expiratory volume in 1 second from the baseline value (PC20FEV1) or a 40% reduction in specific conductance (PC40sGaw) after inhaling methacholine concentration < 8 mg/mL. Sensitivity and specificity were generated for different cut off points of sGaw (PC40sGaw, PC45sGaw, PC50sGaw). Anti-asthma treatment was started for those with proven AHR. The diagnosis of asthma was made after one year of follow-up based on response to treatment. Results: AHR was diagnosed in 83.5% (91/109) of patients by either BDT, PC20FEV1, or PC40sGaw. After one year of follow-up asthma was confirmed in 76 patients. The sensitivity of BDT, PC20FEV1, and PC40sGaw was 25%, 64%, and 97%, respectively. The specificity of BDT, PC20FEV1 and PC40sGaw was 94%, 88%, and 67%, respectively. The sensitivity for PC45sGaw and PC50sGaw was 88% and 63%, and the specificity was 82% and 91%, respectively. Conclusions: Body plethysmography is a valuable tool in the assessment of AHR in CVA, with the best sensitivity-to-specificity ratio for PC45sGaw.
Keywords:
cough variant asthma
; methacholine challenge test
; plethysmography
; specific conductance
; diagnostic accuracy
; sensitivity
; specificity
1. Introduction
Chronic cough is a common medical problem that affects about 10% of the general adult population [1]. It can be a symptom of many pulmonary and some extrapulmonary diseases, making diagnosis and treatment challenging. Cough Variant Asthma (CVA) has been recognized as a specific form of asthma characterized by cough as the sole presenting symptom and normal baseline lung function [2,3]. Prospective studies in patients with chronic cough have shown that, on average, 25% of adults with chronic cough have CVA [4]. Due to non-specific symptoms and normal findings of the basic examination, it can often be misdiagnosed [5]. According to the Global Initiative for Asthma, the diagnosis of asthma should be based on a combination of typical respiratory symptoms and documented airway hyperresponsiveness (AHR) [6]. Widely used test for confirming AHR is a positive bronchodilator test (BDT). The test is highly specific, but its sensitivity for CVA is low since a significant improvement in the forced expiratory volume in 1 s (FEV1) is difficult to achieve among individuals with normal baseline lung function [7]. As the next diagnostic step, the direct bronchoprovocation test (BPT) is most often used. Spirometry is the most common method for detecting airway narrowing following methacholine inhalation. Another option for evaluating the response to methacholine is to perform BPT by body plethysmography. Body plethysmography requires minimal subject cooperation, it is performed under conditions of tidal breathing, without deep inhalation and thoracic gas compression. Besides providing information on the change in specific conductance (sGaw), body plethysmography offers additional data, such as changes in lung volumes. Comparative studies between spirometry and body plethysmography in the assessment of BPT suggest better sensitivity of body plethysmography [8,9]. Higher sensitivity of plethysmography in comparison with spirometry was first reported by Fish JE et al. in 1976, showing that the response to methacholine of subjects with hay fever was similar to that of healthy subjects when measured by FEV1 but similar to that of subjects with asthma when measured by sGaw [10]. Some studies suggest a lower degree of AHR in CVA patients than in a group of patients with classic asthma [11,12]. Therefore, in this group of patients, AHR assessment by body plethysmography could have additional value. Current guidelines do not provide strict recommendations on the change in specific conductance (sGaw) needed to determine AHR [13]. A reduction in sGaw from 35-45% (sGaw35-sGaw45) was used in studies to indicate clinically significant [14,15,16,17].
The aim of our study was to:
i; compare spirometry and body plethysmography in order to evaluate their clinical value during BPT in CVA
ii; examine the sensitivity and specificity of PC20FEV1 and different reductions in sGaw (PC40sGaw, PC45sGaw, and PC50sGaw) in defining AHR.
2. Materials and Methods
2.1. Study Design
This study included 109 patients referred by primary care physicians for evaluation of chronic cough to the Outpatient Centre for Respiratory Diseases, Zagreb, Croatia. The patients were examined by pulmonologists and suspected of having CVA. The only symptom the patients reported was a cough that lasted at least 8 weeks. The diagnostic procedure consisted of: FeNO measurement, spirometry with BDT, BPT assessed by spirometry and plethysmography, and a skin prick test for inhalation allergens. For all patients, chest X-rays were performed to exclude other causes of chronic cough. All patients were referred to an otorhinolaryngologist to rule out other causes of cough such as gastroesophageal reflux or postnasal drip. Patients with well-known contraindications for BDT and BPT, including unstable coronary artery disease, cardiac arrhythmia, uncontrolled arterial hypertension, untreated hypothyroidism, or pregnancy, were excluded. For patients with respiratory tract infections within 6 weeks before testing, the diagnostic procedure was postponed. Smokers were requested to refrain from smoking for 24 hours before testing. If the patient was taking angiotensin-converting enzyme (ACE) inhibitors, testing was continued if cough persisted one month after ACE inhibitor discontinuation. None of the patients had previously been diagnosed with obstructive airway disease, nor were they using anti-asthma medications. Only patients whose baseline spirometric values were within normal limits were included in the study. Patients who met the inclusion and exclusion criteria were consecutively included in the study. In patients with positive BDT or BPT, treatment with low doses of inhaled corticosteroids (ICS) was started. They were followed-up for one year. Patients who reported cough improvement while taking ICS and who were regularly taking the medicine until the one-year follow-up visit were considered to have asthma (Figure 1). The study was approved by the Ethics Committee of the University Hospital Centre Zagreb, No: 02/013 AG.
2.2. Pulmonary Function Tests
Pulmonary function tests were performed by experienced respiratory technicians.
Spirometry was conducted using the Jaeger MasterScreen device (Jaeger GmbH, Wurzburg, Germany) in line with the 2019 recommendations of the American Thoracic Society (ATS)/European Respiratory Society (ERS) [18]. The forced vital capacity (FVC) and forced expiratory volume in 1 s (FEV1) were expressed in liters (L) and as percentages of predicted values (%). Airway obstruction was diagnosed when FEV1/FVC < 0.70 and/or FEV1 < 80% of the predictive value [19]. Spirometry was performed before and 20 minutes after the inhaled bronchodilator (salbutamol 400 µg from a pressurized inhaler). An increase of 12% and 200 mL in either FEV1 or FVC provided evidence of bronchodilator responsiveness (reversibility) [18].
Body plethysmography was conducted using the Jaeger MasterScreen Body Device (Jaeger GmbH, Wurzburg, Germany) in accordance with standard protocols [20]. Total lung capacity (TLC), residual volume (RV), and specific airway conductance (sGaw) were recorded.
BPT tests were performed in accordance with ATS/ERS standards [21]. Subjects inhaled aerosolized normal saline, followed by aerosolized saline containing methacholine, in doubling concentrations ranging from 0.03 to 8.0 mg/mL. Two-minute tidal breathing inhalation method was used. The measurements of whole-body plethysmography and spirometry were performed two minutes after inhalation of each methacholine concentration, using a body plethysmograph. The test was considered positive if there was a 20% decrease in FEV1 from the baseline value (PC20FEV1) after inhaling methacholine at a concentration < 8 mg/mL. For sGaw, we defined a methacholine challenge test (MCT) as positive based on a provocative methacholine concentration < 8 mg/ml causing a 40% reduction in sGaw. Since spirometry is a standardized method, BPT was stopped when there was a drop in FEV1 of 20%.
2.3. FeNO Measurement
The FeNO level was measured by a Niox Mino device (Aerocrine AB, Solna, Sweden) at a constant flow rate of 50 mL/s for 10 s, in accordance with ATS/ERS recommendations [22]. FeNO was measured three times, with differences in measured values within ≤ 10%. The mean value of the three measurements was used as data for statistical analysis. FeNO was measured before pulmonary function and bronchoprovocative challenge testing.
2.4. Skin Prick Test
Skin prick testing was done per standard clinic protocol. All patients were tested with an aeroallergen screening panel (Diater Laboratorios, Barcelona, Spain) that included the following allergen extracts: Dermatophagoides pteronyssinus, birch, hazel, timothy grass, ragweed, cat and dog dander. Histamine hydrochloride (1 mg/mL) and 50% glycerol-saline were used as positive and negative controls. All tests were performed on the patients’ forearms by well-trained nurses. The results were documented 20 minutes later by an experienced investigator. The skin prick test was considered positive if the test was positive for at least one tested allergen (indurate with a diameter ≥ 3 mm).
2.5. Statistical Analysis
Statistical analysis was performed with Statistica software, version 12 (Dell Inc. Inc., Tulsa, OK, USA).
The normality of the distribution was assessed with the Kolmogorov–Smirnov test. Categorical data are presented as frequencies and percentages. Normally distributed continuous data are presented as mean and its standard deviation, while abnormally distributed data are presented as median and its interquartile range (25-75 IQR).
Differences between the groups for normally distributed continuous data were assessed by a t-test for independent samples, and for abnormally distributed data Mann Whitney U test was used. χ2 test was used for assessment of differences in categorical variables. P values < 0.05 were considered significant. Pre- and post-test lung function parameter values in asthmatics and non-asthmatics have been compared with two-way repeated measures ANOVA and p-values for interactions have been reported. The diagnostic validity of the test was assessed by sensitivity, specificity, positive and negative predictive values, and odds ratios for a positive and a negative test were calculated.
3. Results
3.1. Study Population
A total of 109 patients suspected of cough variant asthma were included in the study. The median age of the group was 36.0 (26-44) years, with 36 men (33%) and 73 women (67%). There were 16 (14.7%) current smokers and 93 (85.3%) non-smokers and ex-smokers. In 71 (65.1%) patients, the skin prick test was positive for at least one allergen tested, while it was negative in 38 (34.9%) patients. Mean FeNO value for the whole study population was 48.08±40.04 ppb.
3.2. Differences Between Asthma and Non-Asthma Group
The group of patients with asthma was older (median 38.0 (28.0-46.5) years) than the non-asthma group (median 28.0 (20.5-46.5) years). The groups did not differ in sex (p=0.478), BMI (p= 0.278), smoking habit (p=0.839), or hypersensitivity to the tested allergens (p=0.660).
Although baseline values of pulmonary function tests were normal in both groups, FEV1, FEV1 expressed as a percentage of predicted value (FEV1%), FEV1/FVC, MEF50, MEF50 expressed as a percentage of predicted value (MEF50%), sGaw and sGaw expressed as a percentage of predicted value (sGaw%) were significantly lower in the asthma group. RV and RV expressed as a percentage of predicted value (RV%) were significantly higher in the asthma group. Table 1 shows baseline data for the asthma and non-asthma groups.
AHR was diagnosed in 83.5% (91/109) of patients using either BDT, PC20FEV1, or PC40sGaw. After one year of follow-up, asthma was confirmed in 83.5% (76/91), and not confirmed in 16.5% (15/91) of patients with demonstrated AHR.
FeNO was significantly higher in the asthma group. In the asthma group, the median FeNO value was 41.0 (24.0-77.75) ppb, while in the non-asthma group, the median FeNO was 20.0 (14.5-41.5) ppb, (p< 0,001).
Patients with and without asthma responded differently to challenge during BDT and BPT (PC20 and PC40). The asthma group had significantly higher FEV1 (L and %) and FVC (%) in BDT and significantly lower FEV1 (L) and sGaw (L/kPa/s) in BDT. (Table 2).
3.3. Diagnostic Accuracy of Assessing BHR by Using Different Lung Function Tests
In patients with positive BPT assessed by spirometry and plethysmography, the provocative concentration of methacholine causing a PC40sGaw was significantly lower than the methacholine concentration causing a PC20FEV1 (p<0.001). The median provocative concentration of methacholine that caused a PC40sGaw was 0.5 (0.13-1) mg/ml, and the median PC20FEV1 was 1 (0.5-4) mg/ml.
In the studied group, the BDT was positive in 21 (19.27%), PC20FEV1 in 53 (48.62%), PC40sGaw in 85 (77.98%) patients, and an increased FeNO level was noticed in 67 (61.47%) individuals. In 51 (46.79%) patients, the methacholine test was positive by spirometry and plethysmography. The difference in the tests regarding asthma was statistically significant (Table 3).
Sensitivity, specificity, positive predictive value (PPV), negative predictive value (NPV), odds ratio for a positive test, and odds ratio for a negative test were calculated for BDT, PC20FEV1, PC40sGaw and FeNO in the diagnosis of asthma. PC40sGaw had the highest sensitivity for the diagnosis of asthma (97%). BDT demonstrated the highest specificity (94%). The specificity for PC20FEV1 was somewhat lower, at 0.88. The positive predictive values were high for all four tests, including 92% for PC20FEV1, 90% for BDT, 87% for PC40sGaw, and 82% for FeNO ≥25 ppb. PC40sGaw had the highest negative predictive value (92%). The highest odds ratio for a positive test was for PC20FEV1; it was 5.32. The highest odds ratio for a negative test was for BDT, with a value of 0.8. The results for BDT, BPT assessed by spirometry, and FeNO are presented in Table 4.
Since the optimal value for sGaw in the diagnosis of airway hyperreactivity is not clearly determined, we compared three potential values of sGaw: PC40sGaw, PC45sGaw, and PC50sGaw. As expected, PC40sGaw showed the highest sensitivity, while PC50sGaw had the highest specificity. The best ratio of sensitivity, specificity, PPV, NPV, and odds ratio were for PC45sGaw. The results for PC40sGaw, PC45sGaw, and PC50sGaw are presented in Table 5.
When PC40sGaw was combined with FeNO, the sensitivity was 71%, specificity was 85%, positive predictive value was 92%, negative predictive value was 56%, odds ratio for a positive test was 4.69, and odds ratio for a negative test was 0.34 in diagnosing of asthma.
4. Discussion
The aim of our study was to evaluate the diagnostic value of plethysmography compared to spirometry in the assessment of AHR to the methacholine challenge test (MCT) in patients suspected of having CVA. The results of our study showed that the PC40sGaw is more sensitive than the traditionally used PC20FEV1 (97% vs 64%) in response to a MCT, but has a lower specificity (67% vs. 88%). The mean provocation concentration of methacholine that caused PC40sGaw was significantly lower than PC20FEV1 (0.5 vs. 1.0 mg/ml). When PC45sGaw was used as a diagnostic criterion, the specificity of the test increased (82%), while maintaining a high sensitivity (88%). These results suggest that plethysmography could be a valuable tool in the assessment of AHR in response to the MCT.
Cough variant asthma (CVA) is a special type of asthma characterized by the presence of chronic cough as the sole symptom. In accordance with the definition of CVA, the participants in our study had normal baseline values for spirometry and plethysmography. When lung function parameters were compared between the asthma and non-asthma groups, the asthma group had considerably lower spirometric and sGaw values. Although this difference reached statistical significance, it had no clinical significance and could not guide the diagnosis. CVA is considered to share the same pathogenesis and pathohistological process as conventional asthma: eosinophilic inflammation, bronchial hyperreactivity, and, if left untreated, symptoms can progress to conventional asthma and, eventually, to airway remodeling [4]. Thus, it is not unexpected that lung function is lower in CVA patients compared to healthy subjects. Asthma is a condition in which tipically a degree of airways obstruction is variable. Asthma show many different phenotypic features, where lung function is only one of them, while others involve an inflammatory component with different cytological and molecular presentations. In recent years this spectum of different phenotypes and endotypes are recognized, so nowadays asthma is not considered as a single disease but an asthma syndrome.
In our study, out of 76 patients in whom asthma was confirmed, only 19 had a positive BDT. The sensitivity of BDT in our study was low (25%), but the specificity was very high (94%). Our results indicate that the sensitivity of the BDT test is low in patients with asthma and normal spirometric values; however, if a 20% improvement in FEV1 is achieved despite normal values, the finding indicates asthma with high certainty.
Other studies including asthmatic individuals with normal initial spirometry also indicate a low sensitivity of the BDT. Goldstein MF et al. reported a BDT sensitivity of only 6.12% in a study of the population with suspected asthma with normal findings on lung examination, chest radiography, and baseline spirometry. The absence of reversibility on BDT did not exclude asthma, as there was a high rate of false negative results (79.31%) [7]. Hunter CJ et al. reported the FEV1 response after BDT in a mixed group of healthy subjects, patients with mild asthma, and non-asthmatics with asthma-like symptoms. The sensitivity of the post-BD response was 49%, while the specificity was 70% [23].
When asthma is suspected and the BDT is negative, it is reasonable to perform a BPT. The test is generally considered to have high sensitivity and negative predictive value, while moderate specificity and relatively low positive predictive value [24]. This means that a negative BPT rules out the diagnosis of asthma with high certainty. A positive BPT does not automatically confirm the diagnosis of asthma because AHR can also be present in other entities such as allergic rhinitis, cystic fibrosis, and chronic obstructive pulmonary disease. In our study, the specificity of PC20FEV1 was higher (88%) than the sensitivity (64%). Data on high sensitivity and moderate specificity are primarily the result of epidemiological studies. The results of some clinical studies, on a selected patient population, are in line with our data. In a study involving suspected asthmatics with normal baseline lung function, the sensitivity of MCT was 85.71%, and there were no false-positive results (specificity 100%) [7]. Siersted HC et al. showed a sensitivity of 69% for airway responsiveness to methacholine in a population-based sample of healthy adolescents and subjects with asthma or at risk of developing asthma [25]. Hunter CJ et al. reported that in asthmatic adults who have normal or near-normal spirometric values, MCT and differential sputum eosinophil counts are the most important tests for differentiating asthma from pseudo-asthma. Both, sensitivity and specificity of MCT was high (≥ 90%) [23]. The pre-test probability of MTC increases if symptoms consistent with asthma are present at the time of testing [10,26]. Higgins BG et al. showed that a positive MCT was more likely to be present in those with a history of wheezing and dyspnea, while it was weakly associated with a history of day or night cough [26]. Given that CVA symptoms are nonspecific and spirometric values are normal, the pre-test probability of MCT in CVA diagnosis is lower than in patients with conventional asthma.
It was reported that in asthma patients with normal lung function, the sensitivity of a MCT determined by FEV1 alone increased by 37% when FVC, sGaw, and thoracic gas volume (TGV) evaluations were added to the analysis [28]. We explored the hypothesis that assessing nonspecific bronchial hyperreactivity using plethysmography would improve the diagnostic value of MCT. When we used a PC40sGaw to define AHR, the sensitivity of the brochoprovocation test increased significantly. The sensitivity of PC40sGaw was 97%, while the specificity was 67%. According to our results, individuals with positive PC40sGaw had a 2.91 times higher risk of having asthma than those who tested negative. The results of sGaw sensitivity in our study are entirely consistent with the results of Goldstein et al. [28]. Other authors have also demonstrated that plethysmography is more sensitive than spirometry for assessing MCT. Parker et al. found that 22% of patients with methacholine-induced airway hyperresponsiveness had a decrease in PC40sGaw with no significant change in FEV1 [29].
Obviously, an ideal BPT would have a high level of sensitivity and specificity. Therefore, we investigated other cut-off values for sGaw to assess their diagnostic significance. As expected, increasing the cut-off value for sGaw increased specificity while decreasing sensitivity. As a result, we believe that the best ratio of specificity and sensitivity is for PC45sGaw. The sensitivity and specificity of PC45sGaw were 88% and 82%, respectively. Subjects with a positive test using PC45sGaw had a 4.84 times greater risk of having asthma than subjects with a negative test. Among the subjects in our study in whom asthma was clinically suspected, AHR was proven in 83.5%. We explain such a high percentage of confirmed hyperreactivity by the fact that a detailed medical history was taken, a thorough diagnostic work-up was carried out to exclude other causes of cough (including an examination by an otorhinolaryngology specialist), and several tests for AHR detection were used.
Plethysmography's greater sensitivity in detecting bronchial hyperreactivity in CVA compared to spirometry can be attributed to a variety of causes. Body plethysmography gives comprehensive information about the respiratory system. It provides information on lung residual volume (RV), total lung capacity (TLC), intrathoracic gas volume (ITGV), and specific airway resistance (sRaw). While FEV1 reflects the mechanical properties of the large and medium-sized airways, sRaw provides information on the entire airway. Another advantage of body plethysmography is that it allows measurement of airway resistance while avoiding a forced respiratory maneuver [20]. Slats AM et al. showed that maximal lung inflation to total lung capacity (TLC), as achieved by taking deep inhalations, has a bronchodilating and bronchoprotective effect [30]. Lung inflation has a stretching effect on the airways, especially the noncartilaginous ones. Inspiration to TLC and forced expiratory maneuvers widen the airway diameter, reducing the respiratory airflow resistance [31]. Back in 1981, Fish JE et al. showed that deep inspiration has a greater bronchodilation effect in non-asthmatics than in asthmatics [32]. These observations have been confirmed by several studies, including a very recent one using a protocol similar to ours in subjects who underwent methacholine BPT for various reasons including cough (14). In healthy subjects, deep inspiration maneuvers performed within a few minutes before the methacholine administration protect the airways from bronchoconstriction. In patients with mild to moderate asthma deep inspiration was able to partially reverse bronchial obstruction [33]. This protective mechanism is weakened in patients with severe asthma. Airway inflammation, remodeling and peripheral bronchoconstriction prevent airway smooth muscles from stretching [34]. Thus, a mechanism for less FEV1 than sGaw response in our challenge protocol could be explained by a transient bronchodilator effect of deep inhalation preceding the forced expiratory maneuver. The bronchodilatory effect of deep inspiration in asthma is positively associated with inflammation in airway smooth muscle cells and submucosa on bronchial biopsies [30]. Since CVA represents a milder form of asthma with ill-defined symptoms, less inflammatory infiltration of the airways is expected. The use of calm breathing to assess bronchial hyperreactivity in CVA may be more important than in conventional asthma. When spirometry is used in the assessment of AHR, the basic prerequisites for a successful test largely depend on the patient's ability to perform acceptable spirometric maneuvers, as well as the subject's cooperation and compliance. It also depends on the respiratory technician's ability to instruct and motivate the patient to properly perform spirometry. It is easier for the patient to perform plethysmography correctly because only tidal breathing is required. We have demonstrated that plethysmography enables the confirmation of AHR by using a lower concentration of methacholine compared to spirometric assessment. Therefore, the test is completed in fewer steps, making it less demanding for the patient and the respiratory technician. Given that inhaling methacholine can occasionally result in bronchospasm, the possibility of completing the test using a lower dosage of methacholine is safer for the patient.
Many clinicians include FeNO as an indirect measure of airway inflammation in their diagnostic algorithms. Numerous studies have reported that FeNO levels are elevated in asthma patients regardless of the severity of the disease [35,36]. In our study, the median FeNO levels were higher in the asthma group than in the non-asthma group, but were rather high in both groups. This may be explained by nasal contamination by exhaled NO due to the use of nose clips and may be the reason for the low diagnostic value of FeNO. Recently, Chen LC et al. reported that that combining FeNO with other spirometric values can greatly improve CVA prediction compared to either alone [37]. We also analyzed the sensitivity and specificity of FeNO in combination with PC40sGaw, however the combination did not improve the diagnostic value of FeNO.
Drawback of our study is that it was retrospective, which precluded detailed phenotyping. In future research, it would be useful to precisely determine the phenotype of the patient in order to evaluate whether some phenotypic characteristics, such as the type of inflammation, duration of cough, age of symptoms onset, could influence AHR detection.
Our study’s strength may be that we only included treatment-naïve patients. Study participants were evaluated by a pulmonologist in a specialized pulmonology outpatient clinic, and only those with suspected CVA were included in the study. Upper respiratory tract etiology, gastroesophageal reflux disease, and various intrathoracic causes of cough were excluded. Study participants underwent an extensive evaluation of AHR. In those with AHR, anti-asthma treatment was started. Diagnosis of asthma was confirmed based on symptoms, course of treatment, and response to anti-asthma therapy after one year of follow-up.
5. Conclusions
CVA is a common cause of chronic cough. It is characterized by non-specific symptoms and normal values of basic spirometry. Clinicians most often use BDT and MCT performed by spirometry to prove AHR. In CVA, BDT is often negative due to the absence of evident airway obstruction, and MCT performed by spirometry is of insufficient sensitivity. Therefore, it is necessary to use sensitive and specific diagnostic methods that will facilitate the diagnosis of this type of asthma in order to avoid misdiagnosis and overdiagnosis. In our study, we demonstrated that MCT performed by plethysmography has high sensitivity and specificity in the diagnosis of CVA. As we increased the cut-off values for PCsGaw, the sensitivity of the test increased. For the diagnosis of AHR in individuals with suspected CVA, we believe that defining a positive MCT as a 45% drop in sGaw (PC45sGaw) provides the highest sensitivity and specificity ratio.
Author Contributions
Conceptualization, N.K.L. and G.P.; methodology, N.K.L., S.P.G., E.T., A.S., R.B. and G.P.; formal analysis, N.K.L., V.I. and G.P.; investigation, N.K.L., S.P.G., E.T., A.S., R.B. and G.P.; data curation: VI; writing - original draft preparation: NKL, GP; writing - review and editing E.T., A.S., R.B., V.I.; supervision: S.P.G.; project administration: E.T., R.B. and A.S. All authors have read and agreed to the published version of the manuscript.
Funding
The APC was funded by Croatian Respiratory Society of Croatian Medical Association.
Institutional Review Board Statement
The study was conducted in accordance with the Declaration of Helsinki, and approved by the Ethics Committee of the University Hospital Centre Zagreb (CLASS. NO: 8.1-22/262-2, REG. NO.: 02/013 AG, dated 9 January 2023).
Informed Consent Statement
Informed consent was obtained from all subjects involved in the study.
Data Availability Statement
The data presented in this study are available on request from the corresponding author.
Acknowledgments
We thank physicians and nurses of Outpatient Centre for Respiratory Diseases, Zagreb for their support. The authors thank the patients for participating in this study.
Conflicts of Interest
The authors declare no conflict of interest.
References
- Song, W.J. , Chang Y.S., Faruqi S., Kim J.Y., Kang M.G., Kim S., Jo E.J., Kim M.H., Plevkova J., Park H.W., et al. The global epidemiology of chronic cough in adults: a systematic review and meta-analysis. Eur Respir J. 2015, 45, 1479–1481. [Google Scholar] [CrossRef] [PubMed]
- Corrao, W.M. , Braman S.S., Irwin R.S. Chronic cough as the sole presenting manifestation of bronchial asthma. N Engl J Med. 1979, 300, 633–637. [Google Scholar] [CrossRef] [PubMed]
- Lai, K. , Zhan W., Wu F., Zhang Y., Lin L., Li W., Yi F., Jiang Z., Dai Y., Li S., et al. Clinical and Inflammatory Characteristics of the Chinese APAC Cough Variant Asthma Cohort. Front Med (Lausanne) 2022, 8, 807385. [Google Scholar] [CrossRef] [PubMed]
- Corrao, W.M. Pearls and pitfalls in the diagnosis of cough variant asthma. Allergy Asthma Proc. 2018, 39, 466–467. [Google Scholar] [CrossRef] [PubMed]
- Hao, H. , Pan Y., Xu Z., Xu Z., Bao W., Xue Y., Lv C., Lin J., Zhang Y., Zhang M. Prediction of bronchodilation test in adults with chronic cough suspected of cough variant asthma. Front Med (Lausanne) 2022, 9, 987887. [Google Scholar] [CrossRef]
- Global Initiative for Asthma. Global strategy for asthma management and prevention. Updated 2022. Available online: https://ginasthma.org/gina-reports/URL (accessed on 9 November 2024).
- Goldstein, M.F. , Veza B.A., Dunsky E.H., Dvorin D.J., Belecanech G.A., Haralabatos I.C. Comparisons of peak diurnal expiratory flow variation, postbronchodilator FEV(1) responses, and methacholine inhalation challenges in the evaluation of suspected asthma. Chest 2001, 119, 1001–1010. [Google Scholar] [CrossRef]
- Merget, R. , Nensa F., Heinze E., Taeger D., Bruening T. Spirometry or Body Plethysmography for the Assessment of Bronchial Hyperresponsiveness? Adv Exp Med Biol. 2016, 921, 1–10. [Google Scholar] [CrossRef]
- Kraemer, R. , Smith H.J., Sigrist T., Giger G., Keller R., Frey M. Diagnostic accuracy of methacholine challenge tests assessing airway hyperreactivity in asthmatic patients - a multifunctional approach. Respir Res. 2016, 17, 154. [Google Scholar] [CrossRef]
- Fish, J.E. , Rosenthal R.R., Batra G., Menkes H., Summer W., Permutt S., Norman P. Airway responses to methacholine in allergic and nonallergic subjects. Am Rev Respir Dis. 1976, 113, 579–586. [Google Scholar] [CrossRef]
- Pratter, M.R. Difference in degree of airway hyperreactivity in wheezing and non-wheezing asthmatics. Am Rev Respir Dis. 1979, 119, 77. [Google Scholar]
- Zhou, J. , Yi F., Wu F., Xu P., Chen M., Shen H., Lin L., Zhang Y., Li S., Wu C., et al.; CPA Cohort Study Group. Characteristics of different asthma phenotypes associated with cough: a prospective, multicenter survey in China. Respir Res. 2022, 23, 243. [Google Scholar] [CrossRef] [PubMed]
- Coates, A.L. , Wanger J., Cockcroft D.W., Culver B.H.; Bronchoprovocation Testing Task Force: Kai-Håkon Carlsen; Diamant Z, Gauvreau G, Hall GL, Hallstrand TS, Horvath I, de Jongh FHC, Joos G, Kaminsky DA, Laube BL, Leuppi JD, Sterk PJ. ERS technical standard on bronchial challenge testing: general considerations and performance of methacholine challenge tests. Eur Respir J. 2017, 49, 1601526. [Google Scholar] [CrossRef] [PubMed]
- Parker, J. , Tzeng A., Wayne S., Haynes J.M., Irvin C.G., Kaminsky D.A. Validation of the clinical utility of sGaw as a response variable in methacholine challenge testing. Respirology. 2023, 28, 437–444. [Google Scholar] [CrossRef] [PubMed]
- Parker, A.L. , McCool F.D. Pulmonary function characteristics in patients with different patterns of methacholine airway hyperresponsiveness. Chest 2002, 121, 1818–1823. [Google Scholar] [CrossRef] [PubMed]
- Nensa, F. , Marek W., Marek E., Smith H.J., Kohlhäufl M. Assessment of airway hyperreactivity: comparison of forced spirometry and body plethysmography for methacholine challenge tests. Eur J Med Res. 2009, 14, 170–176. [Google Scholar] [CrossRef]
- Cockcroft, D.W. , Berscheid B.A. Measurement of responsiveness to inhaled histamine: comparison of FEV1 and sGaw. Ann Allergy 1983, 51, 374–377. [Google Scholar]
- Graham, B.L. , Steenbruggen I., Miller M.R., Barjaktarevic I.Z., Cooper B.G., Hall G.L., Hallstrand T.S., Kaminsky D.A., McCarthy K., McCormack M.C., et al. Standardization of Spirometry 2019 Update. An Official American Thoracic Society and European Respiratory Society Technical Statement. Am J Respir Crit Care Med. 2019, 200, e70–e88. [Google Scholar] [CrossRef]
- American Thoracic Society. Lung function testing: selection of reference values and interpretative strategies. Am Rev Respir Dis. 1991, 144, 1202–1218. [Google Scholar] [CrossRef]
- Criée, C.P. , Sorichter S., Smith H.J., Kardos P., Merget R., Heise D., Berdel D., Köhler D., Magnussen H., Marek W, et al; Working Group for Body Plethysmography of the German Society for Pneumology and Respiratory Care. Body plethysmography--its principles and clinical use. Respir Med. 2011, 105, 959–971. [Google Scholar] [CrossRef]
- Crapo, R.O. , Casaburi R., Coates A.L., Enright P.L., Hankinson J.L., Irvin C.G., MacIntyre N.R., McKay R.T., Wanger J.S., Anderson S.D., et al. Guidelines for methacholine and exercise challenge testing-1999. This official statement of the American Thoracic Society was adopted by the ATS Board of Directors, July 1999. Am J Respir Crit Care Med. 2000, 161, 309–329. [Google Scholar] [CrossRef]
- American Thoracic Society; European Respiratory Society. ATS/ERS recommendations for standardized procedures for the online and offline measurement of exhaled lower respiratory nitric oxide and nasal nitric oxide, 2005. Am J Respir Crit Care Med. 2005, 171, 912–930. [Google Scholar] [CrossRef] [PubMed]
- Hunter, C.J. , Brightling C.E., Woltmann G., Wardlaw A.J., Pavord I.D. A comparison of the validity of different diagnostic tests in adults with asthma. Chest 2002, 121, 1051–1057. [Google Scholar] [CrossRef] [PubMed]
- Sterk, P.J. , Fabbri L.M., Quanjer P.H., Cockcroft D.W., O'Byrne P.M., Anderson S.D., Juniper E.F., Malo J.L. Airway responsiveness. Standardized challenge testing with pharmacological, physical and sensitizing stimuli in adults. Eur Respir J. 1993, 16, 53–83. [Google Scholar] [CrossRef] [PubMed]
- Siersted, H.C. , Hansen H.S., Hansen N.C., Hyldebrandt N., Mostgaard G., Oxhøj H. Evaluation of peak expiratory flow variability in an adolescent population sample. The Odense Schoolchild Study. Am J Respir Crit Care Med. 1994, 149, 598–603. [Google Scholar] [CrossRef]
- Perpiñá, M. , Pellicer C., de Diego A., Compte L., Macián V. Diagnostic value of the bronchial provocation test with methacholine in asthma. A Bayesian analysis approach. Chest 1993, 104, 149–154. [Google Scholar] [CrossRef]
- Higgins, B.G. , Britton J.R., Chinn S., Cooper S., Burney P.G., Tattersfield A.E. Comparison of bronchial reactivity and peak expiratory flow variability measurements for epidemiologic studies. Am Rev Respir Dis. 1992, 145, 588–593. [Google Scholar] [CrossRef]
- Goldstein, M.F. , Pacana S.M., Dvorin D.J., Dunsky E.H. Retrospective analyses of methacholine inhalation challenges. Chest 1994, 105, 1082–1088. [Google Scholar] [CrossRef]
- Parker, A.L. , McCool F.D. Pulmonary function characteristics in patients with different patterns of methacholine airway hyperresponsiveness. Chest 2002, 121, 1818–1823. [Google Scholar] [CrossRef]
- Slats, A.M. , Janssen K., van Schadewijk A., van der Plas D.T., Schot R., van den Aardweg J.G., de Jongste J.C., Hiemstra P.S., Mauad T., Rabe K.F., et al. Bronchial inflammation and airway responses to deep inspiration in asthma and chronic obstructive pulmonary disease. Am J Respir Crit Care Med. 2007, 176, 121–128. [Google Scholar] [CrossRef]
- Cockcroft, D.W. , Davis B.E. The bronchoprotective effect of inhaling methacholine by using total lung capacity inspirations has a marked influence on the interpretation of the test result. J Allergy Clin Immunol. 2006, 117, 1244–1248. [Google Scholar] [CrossRef]
- Fish, J.E. , Ankin M.G., Kelly J.F., Peterman V.I. Regulation of bronchomotor tone by lung inflation in asthmatic and nonasthmatic subjects. J Appl Physiol Respir Environ Exerc Physiol. 1981, 50, 1079–1086. [Google Scholar] [CrossRef] [PubMed]
- Crimi, E. , Pellegrino R., Milanese M., Brusasco V. Deep breaths, methacholine, and airway narrowing in healthy and mild asthmatic subjects. J Appl Physiol (1985). 2002, 93, 1384–1390. [Google Scholar] [CrossRef] [PubMed]
- Pellegrino, R. , Sterk P.J., Sont J.K., Brusasco V. Assessing the effect of deep inhalation on airway calibre: a novel approach to lung function in bronchial asthma and COPD. Eur Respir J. 1998, 12, 1219–1227. [Google Scholar] [CrossRef] [PubMed]
- Kharitonov, S.A. , Yates D., Robbins R.A., Logan-Sinclair R., Shinebourne E.A., Barnes P.J. Increased nitric oxide in exhaled air of asthmatic patients. Lancet 1994, 343, 133–135. [Google Scholar] [CrossRef]
- Alving, K. , Weitzberg E., Lundberg J.M. Increased amount of nitric oxide in exhaled air of asthmatics. Eur Respir J. 1993, 6, 1368–1370. [Google Scholar] [CrossRef]
- Chen, L.C. , Zeng G.S., Wu L.L., Zi M., Fang Z.K., Fan H.Z., Yu H.P. Diagnostic value of FeNO and MMEF for predicting cough variant asthma in chronic cough patients with or without allergic rhinitis. J Asthma. 2021, 58, 326–333. [Google Scholar] [CrossRef]
Figure 1.
Diagnostic flowchart.
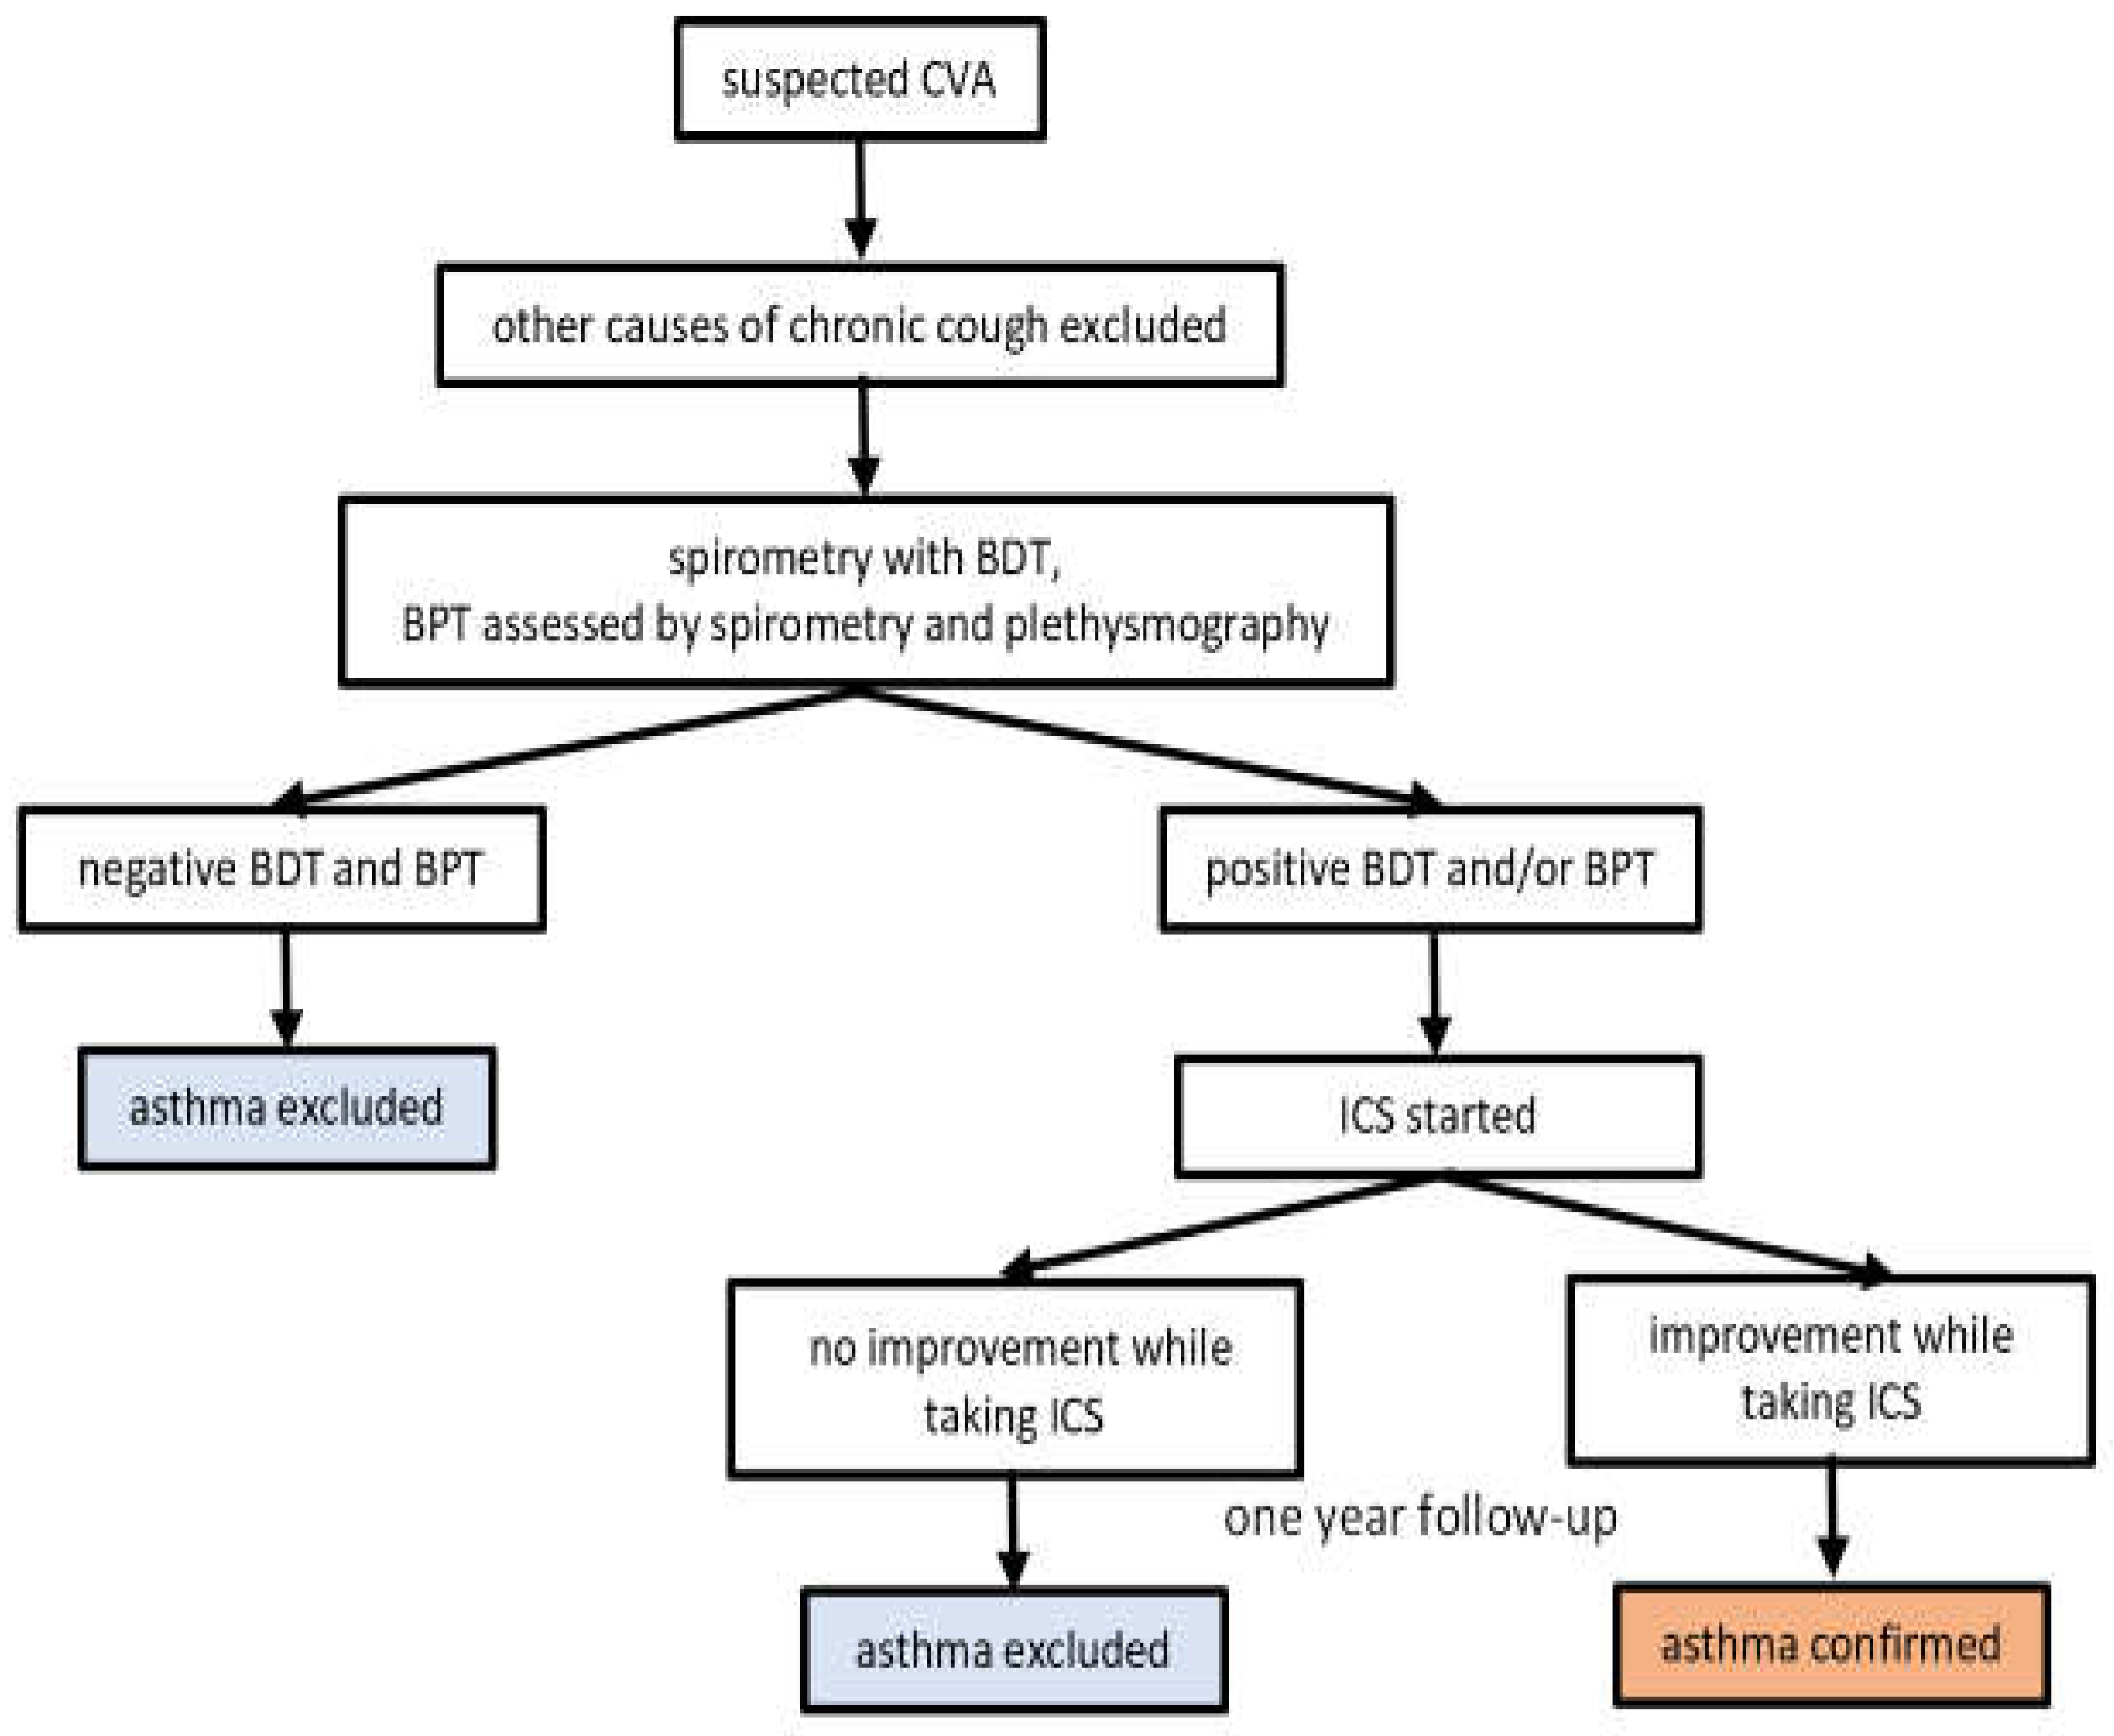

Table 1.
Baseline data in the asthma and non-asthma group.
| Asthma (N = 76) | non-asthma (N = 33) | |||||
|---|---|---|---|---|---|---|
| parameter | value | SD / (25-75 IQR) | value | SD / (25-75 IQR) | t / U | p-value |
| anthropometric data | ||||||
| Height, male (cm), mean | 179.35 | 8.3 | 178.46 | 5.27 | 0.35 | 0.731 |
| Height, female (cm), mean | 167.28 | 6.93 | 168.25 | 7.74 | 0.51 | 0.608 |
| Weight, male (kg), mean | 84.96 | 16.76 | 83.00 | 13.34 | 0.36 | 0.731 |
| Weight, female (kg), mean | 68.38 | 10.27 | 64.20 | 10.21 | 1.55 | 0.125 |
| BMI (kg/m2), mean | 25.06 | 4.04 | 24.12 | 4.41 | -1.09 | 0.278 |
| lung function data | ||||||
| FVC (L), mean | 4.19 | 0.86 | 4.54 | 1.05 | 1.83 | 0.070 |
| FVC %, median | 104.5 | 100.3-112.0 | 108.0 | 100.5-114.0 | 1133.5* | 0.426 |
| FEV1 (L) mean | 3.35 | 0.71 | 3.85 | 0.90 | 3.11 | 0.002 |
| FEV1 %, median | 99.0 | 92.3-105.0 | 105.0 | 99.0-117.0 | 779* | 0.002 |
| FEV1/FVC, mean | 80.05 | 5.9 | 84.92 | 5.14 | 4.11 | <0.001 |
| MEF50 (L), median | 3.52 | 2.83-4.19 | 4.32 | 3.44-5.11 | 787* | 0.002 |
| MEF50 %, mean | 77.6 | 19.2 | 91.0 | 20.1 | 3.6 | 0.001 |
| RV (L), median | 2.05 | 1.74 – 2.28 | 1.67 | 1.48-2.02 | 727* | 0.001 |
| RV %, median | 116.1 | 107.1-124.2 | 104.9 | 97.8-113.8 | 747* | 0.001 |
| TLC (L), mean | 6.21 | 1.16 | 6.11 | 0.99 | −0.43 | 0.667 |
| TLC %, median | 107.0 | 99.4-112.4 | 99.8 | 97.3-109.1 | 936.5* | 0.036 |
| RV/TLC %, median | 105.8 | 101.7-114.4 | 102.2 | 99.5-105.9 | 914* | 0.025 |
| sGaw (L/(kPa/s), mean | 0.97 | 0.2 | 1.13 | 0.27 | 3.55 | 0.001 |
| sGaw %, mean | 98.4 | 18.3 | 115.0 | 27.0 | 3.7 | <0.001 |
Abbreviations: BMI, body mass index; FVC, forced vital capacity; FEV1, forced expiratory volume in 1 s; MEF50, forced expiratory flow at 50% of forced vital capacity, RV, residual volume; TLC, total lung capacity; sGaw, specific airway conductance. * Mann Whitney U test.
Table 2.
Comparison of pre- and post-test lung function parameters in patients with and without asthma.
Table 2.
Comparison of pre- and post-test lung function parameters in patients with and without asthma.
| Test | Asthma (N = 76) | non-asthma (N = 33) | p-value for interaction | |||
|---|---|---|---|---|---|---|
| parameter | Pre | Post | Pre | Post | ||
| BDT | FEV1 (L) | 3.35±0.71 | 3.59±0.75 | 3.85±0.9 | 4.00±0.92 | 0.009 |
| FEV1 (%) | 100±11 | 107±5 | 107±11 | 104±4 | <0.001 | |
| FVC (L) | 4.2±0.9 | 4.3±0.9 | 4.5±1.1 | 4.6±1.0 | 0.07 | |
| FVC (%) | 106±9 | 104±5 | 105±8 | 102±4 | 0.23 | |
| BPT (PC20) | FEV1 (L) | 3.4±0.7 | 2.6±0.6 | 3.9±0.9 | 3.5±1.0 | <0.001 |
| FEV1 (%) | 101±12 | 78±7 | 108±12 | 88±9 | 0.32 | |
| BPT (PC40) | sGaw (L/(kPa/s) | 0.97±0.20 | 0.46±0.13 | 1.13±0.27 | 0.81±0.30 | <0.001 |
| sGaw % | 98±18 | 48±8 | 115±27 | 71±17 | 0.18 | |
Abbreviations: BDT, bronchodilator test; BPT, bronchial provocation test, FVC, forced vital capacity; FEV1, forced expiratory volume in 1 s; sGaw, specific airway conductance; PC20 provocative concentration causing a 20% fall in FEV1; PC40s, provocative concentration causing a 40% fall in sGaw.
Table 3.
The difference in the tests regarding asthma.
| Test | Astma | Total | |||||||
|---|---|---|---|---|---|---|---|---|---|
| No (n=33) | Yes (n=76) | n=109 | |||||||
| n | % | n | % | n | % | X2 | p | ||
| BDT | negative | 31 | 93.94 | 57 | 75.00 | 88 | 80.73 | 4.16 |
0.041 |
| positive | 2 | 6.06 | 19 | 25.00 | 21 | 19.27 | |||
| PC20FEV1 | negative | 29 | 87.88 | 27 | 35.53 | 56 | 51.36 | 25.24 |
<0.001 |
| positive | 4 | 12.12 | 49 | 64.47 | 53 | 48.62 | |||
| PC40sGaw | negative | 22 | 66.67 | 2 | 2.63 | 24 | 22.02 | 51.29 |
<0.001 |
| positive | 11 | 33.33 | 74 | 97.37 | 85 | 77.98 | |||
| FeNO | negative | 21 | 63.64 | 21 | 27.63 | 42 | 38.53 | 11.12 | 0.001 |
| positive | 12 | 36.36 | 55 | 72.37 | 67 | 61.47 | |||
Abbreviations: BDT, bronchodilator test; BPT, bronchial provocation test; PC20FEV1, provocative concentration causing a 20% fall in FEV1; PC40sGaw, provocative concentration causing a 40% fall in sGaw; FeNO, fractional exhaled nitric oxide; n, number; %, percentage; X2, chi-squared test.
Table 4.
Diagnostic value of BDT, PC20FEV1, and FeNO.
| BDT | PC20FEV1 | FeNO | |
|---|---|---|---|
| Sensitivity (%) | 25 | 64 | 72 |
| Specificity (%) | 94 | 88 | 64 |
| PPV (%) | 90 | 92 | 82 |
| NPV (%) | 35 | 52 | 50 |
| Odds ratio for a positive test | 4.13 | 5.32 | 1.99 |
| Odds ratio for a negative test | 0.80 | 0.4 | 0.43 |
Abbreviations: BDR, bronchodilator test; BPT, bronchial provocation test; PC20FEV1, provocative concentration causing a 20% fall in FEV1; FeNO, fractional exhaled nitric oxide, PPV, positive predictive value; NPV, negative predictive value.
Table 5.
Diagnostic value of PC40sGaw, PC45sGaw and PC50sGaw.
| PC40sGaw | PC45sGaw | PC50sGaw | |
|---|---|---|---|
| Sensitivity (%) | 97 | 88 | 63 |
| Specificity (%) | 67 | 82 | 91 |
| PPV (%) | 87 | 92 | 94 |
| NPV (%) | 92 | 75 | 52 |
| Odds ratio for a positive test | 2.91 | 4.84 | 6.93 |
| Odds ratio for a negative test | 0.05 | 0.15 | 0.14 |
Abbreviations: PC40sGaw, provocative concentration causing a 40% fall in sGaw, PC45sGaw, provocative concentration causing a 45% fall in sGaw; PC50sGaw, provocative concentration causing a 50% fall in sGaw; PPV, positive predictive value; NPV, negative p.
Disclaimer/Publisher’s Note: The statements, opinions and data contained in all publications are solely those of the individual author(s) and contributor(s) and not of MDPI and/or the editor(s). MDPI and/or the editor(s) disclaim responsibility for any injury to people or property resulting from any ideas, methods, instructions or products referred to in the content. |
© 2024 by the authors. Licensee MDPI, Basel, Switzerland. This article is an open access article distributed under the terms and conditions of the Creative Commons Attribution (CC BY) license (http://creativecommons.org/licenses/by/4.0/).
Copyright: This open access article is published under a Creative Commons CC BY 4.0 license, which permit the free download, distribution, and reuse, provided that the author and preprint are cited in any reuse.


