Submitted:
02 November 2024
Posted:
04 November 2024
You are already at the latest version
Abstract
The study offers an in-depth investigation of the impact of climate conditions on various terrain features in the Kaffiøyra area, southwest Svalbard, focusing on the changes of shorelines, glacier termini, and outwash areas. We utilized cost-effective, consistent remote sensing data and GIS techniques to analyze historical long-term changes in these terrain features, evaluated the effects of temperature variations on glacier retreat, and developed a predictive model for future glacier area changes based on temperature data from climate change scenarios and the ground observation station near the site. The results demonstrated a range of responses in shoreline stability and changes across different zones in the study site. Based on the predefined baseline, the glacier-shorelines (tidewater glacier) exhibit significant erosion, with the averaged rates varying from -64.7 to + 9.2 m/yr. However, the land-shorelines show relatively stable, with changes ranging from -2.2 to +3.7 m/yr, and the outwash areas exhibited minor increases of less than 10% as compared to the data obtained in 1985. The analysis of seven glacier termini indicated a general reduction in the glacier area; notably, Aavatsmarkbreen, a tidewater glacier, retained only 32% of its original size by 2023. The land glaciers such as Waldemarbreen, Irenebreen, Elisebreen, Eivindbreen, Andreasbreen, and Oliverbreen, preserve 54.8%, 61.3%, 65.0%, 74.0%, 55.5%, and 43.7% of their areas, respectively. A marked negative linear correlation between temperature and remaining glacier areas was observed, enabling the prediction of future glacier variations under various climate conditions. The study outlines the evolution of terrain features in Kaffiøyra in nearly 40 years. Results show the relative stability of land-shorelines, significant glacier retreats in response to warming temperatures, and slight growth in outwash areas. The study highlights the critical need for robust land monitoring systems that enhance our understanding and enable effective decision-making through predictive modeling of climate impacts.
Keywords:
terrain feature
; climate change
; remote sensing
; shoreline
; glacier retreat
; outwash
1. Introduction
Global climate change has been a prominent concern since the mid-20th century, impacting regions variably. Polar areas, especially the Arctic, face more severe effects. Research highlights rapid Arctic warming, known as Arctic amplification, driven by sea ice loss, heat flux changes, and cloud cover variations [1]. Arctic warming has been faster four times than the globe since 1979, based on a study using several observational datasets to analyze near-surface air temperatures over the Arctic regions [2].
Research in the Arctic has historically been challenging due to its inaccessibility and extreme weather conditions. However, remote sensing technologies have revolutionized our ability to study this region. Remote sensing provides crucial data that enhances our understanding of climate change impacts in the Arctic. Various vital indicators extracted from remote sensing monitoring for the Arctic, including surface temperature, sea ice concentration, snow cover, surface albedo, phytoplankton concentrations, and atmospheric parameters such as cloud cover, temperature profile, ozone concentration, and aerosol levels, have been derived [3]. Additionally, studies have identified key observational indicators such as air temperature, permafrost thaw, snow cover, sea-land ice dynamics, and tundra ecosystem changes, which are critical for monitoring the Arctic's response to climate change [4].
When assessing the terrain feature changes, various methods are employed based on the research scope, categorized into two main groups: direct and indirect. Direct methods, including field and Global Positioning System (GPS) surveys, ice core drilling, and seismic approaches, are commonly applied for in-depth studies in specific areas. On the other hand, indirect methods, such as remote sensing, aerial surveys, Unmanned Aerial Vehicle (UAV) imaging, or numerical modeling, are typically utilized for research covering larger geographical areas.
Over recent decades, image-based approaches have advanced significantly, becoming crucial for monitoring global environmental changes. These methods provide valuable data for mapping, environmental monitoring, and long-term assessments with high spatial and temporal accuracy [5,6,7]. Its applications in geosciences are relatively diverse, including but not limited to shoreline changes, glacier retreats, vegetation cover, temperature variations, subsidence patterns, precipitation trends, and humidity fluctuations [8,9,10,11,12,13,14,15]. The growing prominence of image-based methods underscores their pivotal role in enhancing our understanding of dynamic Earth processes and climate-related transformations.
Svalbard, a Norwegian archipelago located in the Arctic, exemplifies climate change's effects in the Arctic. Covering an area of 62,248 km2, Svalbard is notable for its extensive glaciation; glaciers cover 36,591 km2 (59%) of its area [16,17]. Longyearbyen's administrative center is often cited as being on the frontline of climate change, emblematic of the drastic environmental shifts occurring in the world's northernmost town [18]. Over recent decades, Svalbard has experienced the fastest temperature increases within Europe, a phenomenon primarily attributed to the influence of the warm Atlantic Water current that significantly impacts local climate conditions by altering sea-ice coverage and water temperatures in the region's fjords [19,20].
Previous research on the glaciers in the Kaffiøyra region has contributed significantly to the understanding of glacier retreat, mass balance, and surface dynamics, employing various methods such as using historical and archival maps, field and GPS measurements, and more recently, remote sensing and UAV data [21,22]. These studies documented glacier area reductions and mass loss, offering valuable insights into the physical transformations over time. The Atlas of Changes in the Glaciers of Kaffiøyra [17] provided a comprehensive view of glacier transformations from 1909 to 2020, emphasizing glacier area and retreat. Further studies, such as those conducted by Sobota et al. [23,24] based on specific glaciers such as Waldemarbreen and Irenebreen, explored snow accumulation and melt rates but similarly lacked long-term climate correlations. Research tasks focused on ground temperature [25] and active layer thickness [26,27] have been vital in monitoring climate variables, though primarily focused on short-term observations and limited to summer periods.
The overarching stability of Svalbard's shoreline has been documented due to initial characteristics such as a rocky basement and ice-covered resistance to significant shoreline changes [28,29,30]. The localized studies reveal considerable variations along the West Coast, attributed to factors such as the changes in sediment supply, alterations in nearshore waves due to storms, and sea-level changes [31,32,33,34,35,36,37]. The Kaffiøyra shoreline and surrounding environment have been extensively studied, particularly by the Nicolaus Copernicus University research team, starting their first expedition in 1975. Their work has focused on various aspects of glaciology, geomorphology, and permafrost, including the impact of climate change on glaciers and shoreline dynamics. Many valuable studies have been focused on glacier dynamics and permafrost. The regional-scale and long-term variations of different terrain features in response to the temperature variations in the Kaffiøyra area were limited. The investigations on the outwash areas in the Kaffiøyra region have primarily focused on geomorphology and sediment transport, especially around the Waldemar River. Weckwerth et al. [38,39] detailed the dynamics of confined outwash fans shaped by glacial meltwater. Their studies emphasize how meltwater influences sediment deposition and landscape formation but lack long-term analysis of outwash evolution under changing climate conditions.
Based on previous investigations, it is clear that numerous valuable studies have examined individual and local-scale terrain features in Kaffiøyra. However, the observations are limited in characterizing the influences of temperature on the regional scale and long-term variations of the critical terrain features such as glaciers, shorelines, and outwash areas in the Kaffiøyra area. The gap presents an opportunity for a unified approach in conducting image processing to assess long-term variations of glacier termini, shoreline evolution, and outwash areas. Specifically, the study addresses the issues using a multi-decadal Landsat dataset from 1985 to 2023, enabling consistent, long-term analysis. By correlating these terrain feature changes with temperature data, this study aims to provide a more detailed understanding of how climate factors influence terrain feature dynamics, contributing crucial insights into local, regional, and global climate processes.
2. Materials and Methods
2.1. Study Area
The study area, Kaffiøyra, is located in the southwest region of Svalbard. The research conducted in this area will focus on three main types of terrain features to understand the impact of accelerated warming conditions on landform variations. Firstly, the study extracts and calculates the rate of shoreline changes to both land and glacier shorelines. Secondly, we plan to monitor and quantify the changes in the area and rate of seven glaciers, including the tidewater glacier - Aavatsmarkbreen, and six land glaciers: Waldemarbreen, Irenebreen, Elisebreen, Eivindbreen, Andreasbreen, and Oliverbreen. Lastly, we will assess the changes in the three outwash areas, which are zones where sediment is transported to the sea through the glacier's melting process during the summer seasons (Figure 1).
The geology of the Kaffiøyra plain is defined by two dominant formations. The western section comprises a tectonic trench separating Oscar II Land from Prins Karls Forland, while the eastern part is characterized by a crystalline bedrock folded and formed during the Caledonian orogeny. Over time, these early formations were overlaid by Quaternary deposits, consisting primarily of marine and glaciofluvial sediments such as marine pebbles, gravels, and sands. The surface of the region is now mainly covered by these Quaternary deposits. Marine sediments dominate the coastal areas, contributing to complex sedimentary dynamics significantly affecting shoreline stability and glacial retreat [38,40,41,42].
The river systems (outwash) on the Kaffiøyra plain are seasonal, primarily supplied by water melted from snow, glaciers, and permafrost, contributing significantly to sediment transport during the summer months [41]. The river systems primarily consist of networks that drain individual glaciers, forming distinct fluvial networks. These systems feature dense and intricate braided-distributary channels, particularly in the outwash fans and plains where sediment is deposited by glacial meltwater [38,43]. Precipitation in Kaffiøyra during the summer (July 21–August 31) is 40.7 mm on average but shows significant variations between years. For example, the wettest season recorded 122.5 mm (1997), while the driest was only 8.5 mm (2010). Interestingly, dry summers are more common in Kaffiøyra, especially in the later years of the study period (1975–2010) [44]. These seasonal and climatic variations play a significant role in the hydrological and geological dynamics of the region, influencing both sediment transport and the long-term retreat of glaciers.
2.2. Data for the Site
Landsat images and GIS techniques extracted key terrain features, including shorelines, glaciers, and outwash areas. Landsat's long-term archive makes it an ideal selection for monitoring surface changes because of the consistent data sources and resolution. Other satellites, such as Sentinel-2, might offer higher resolution, but the duration of available data is limited. The Landsat multi-decadal coverage provides a 30-meter resolution that could balance the detail and coverage, which is crucial in Arctic regions with frequent cloud cover. Additionally, the free, well-calibrated data offered by Landsat is cost-effective, making it a practical choice for large-scale, long-term environmental studies [45].
The study utilized multitemporal remote sensing data of the Landsat Thematic Mapper (TM), Landsat Enhanced Thematic Mapper (ETM+), and Landsat Operational Land Imager (OLI) from 1985 until 2023 (see Table 1). The data are available for free at the archive of the U.S. Geological Survey. The dataset spans from 1985 to 2023, including Landsat 4-5 TM, 7 ETM+, 8 OLI/TIRS, using the WGS_1984_UTM_Zone_33N reference system and targeting annual coverage. However, due to various challenges, such as the Landsat 7 scan line errors and cloud cover, usable images were obtained for 29 out of the 38 years (Table 1).
2.3. Methods
The primary methodology for this research involves integrating remote sensing and GIS techniques to analyze Landsat images. Table 2 lists the main steps and the associated toolboxes to analyze the observed images. The following is a brief description of the processes for our analyses.
- Data collection:
The study area is in the polar region, typically covered with snow and ice from October to May next year. The Landsat images taken in this period cannot be used for the study. Therefore, the summertime images taken from June to September are used to extract the terrain features of shorelines, glaciers, and outwash areas in different years.
The image quality is critical. Thus, image selection will consider factors such as cloud cover, scanline error in satellite images, and shadow, which might cause difficulty extracting objects. From 1985 until 2023 (38 years), the study has extracted 29/38 shorelines, 28/38 glacier termini, and 21/38 outwash based on the available images.
- Image processing:
Based on the selected images, there are several processing steps, including geometric correction to align and position the image accurately, image cropping for the area of interest, and color adjustment to enhance boundary visibility.
- Boundary extraction:
The refined images are then used to delineate three terrain feature boundaries, i.e., the shoreline (sea-land boundary), glacier outline (glacier-land and glacier-sea boundaries), and outwash outline (outwash-land boundary). The Landsat Toolbox is employed to assist in distinguishing between different objects (e.g., vegetation, water, glaciers, land, lake, and others) based on their spectral reflections, categorizing them into classes (often ten classes). These are then simplified into two primary groups, the interest group and the remaining group, and then the boundary is obtained from those two groups [46]. Manual digitization supplements the automated processes in cases where clouds or shadows cover the boundaries. For more detailed processes, one can refer to Table 2.
The shoreline positions can be referenced from any consistent linear feature, such as the dry/wet line, the vegetation line, the low-water line, or the high-water line. The shoreline can be digitized from various sources, such as satellite imagery, digital orthophotos, and historical coastal survey maps). This study detected the shoreline based on consistent position and source, the dry/wet line, and the source of satellite imagery. Each shoreline vector demonstrates a specific position in time and must be assigned a date in the shoreline attribute table.
- Changes analysis
Once the boundaries are established, they are analyzed over time. The areas of glaciers and outwash are calculated to determine how they have varied over the years. The shoreline data is processed through the Digital Shoreline Analysis System (DSAS) [47,48]. It is an automated method for establishing measurement locations, performing rate calculations, and providing statistical data necessary to assess the robustness of the rates and distances. In the study area, both land-shorelines and glacier-shorelines exist, which may raise concerns about DSAS effectiveness. However, the DSAS manual states that it can be used for any boundary-change problem with clearly identifiable positions over time, such as glacier limits or riverbanks [48].
The required inputs to calculate the shoreline change through DSAS include shorelines (Figure 2 - green, yellow, blue, red lines) and baseline (Figure 2 - black lines). The baselines in this study were created manually, with several iterations needed, due to the irregularity of the shoreline in the Kaffiøyra plain. While the goal was to create transects perpendicular to the shorelines, the complexity of feature boundaries meant some transects were not perfectly aligned. However, every effort was made to ensure the transects fit as closely as possible. For the simpler shoreline profile in other zones, the baseline creation was more straightforward, with parallel alignment to the shoreline being sufficient. The baseline serves as the starting point for all transects cast by DSAS. It can be drawn anywhere relative to the shoreline vectors: onshore, offshore, and midshore among the shorelines. The DSAS uses a measurement baseline method [49] to calculate distance and rate-of-change statistics for a time series of shorelines. The transects will be cast perpendicular from baseline to shorelines (Figure 2 - gray line). The user can set the smoothness of the transect, distance from the baseline, and transect interval (Table A3).
After DSAS creates a transect cast from baseline to shorelines, the system will provide statistical analyses to calculate shoreline changes such as net shoreline movement (NSM), shoreline change envelope (SCE) (Figure 2), end point rate (EPR), linear regression rate (LRR) (Table 3). These parameters are calculated for each transect.
Notice that the NSM measures the greatest distance between the earliest and the latest shoreline, and its values can be negative or positive depending on whether it is eroded or accreted. The SCE measures the greatest distance between all shorelines without counting on the years, and the values are always positive. The EPR is calculated by NSM divided by time, and it is simple to calculate with only two shorelines sufficient, but the value will miss the trend or magnitude if you have more than two shorelines [50,51]. The LRR is estimated by fitting a least-squares regression to all intersections on each transect. Therefore, the LRR will provide a more comprehensive view of the trend over many years.
2.4. Uncertainty and Data Accuracy
Several factors contribute to uncertainty in the change analysis, mainly when using Landsat imagery. This study predominantly utilizes Landsat L1TP (Level-1 Terrain Precision-Corrected Product) and L2SP (Level-2 Surface Reflectance Product), which are terrain-corrected and orthorectified for high positional accuracy. These corrections are essential for high-latitude regions like Svalbard, where distortions from Earth's curvature and atmospheric conditions can be significant. The georeferencing error for these products is estimated at 12–15 meters, ensuring reliable spatial alignment throughout the dataset [52].
In Svalbard, the tidal range is small, typically 1–2 meters, with no significant tidal flats, limiting tidal influence on shoreline displacement. Studies show that climate-related factors such as glacial retreat, permafrost thawing, and increased wave energy due to longer ice-free seasons are the primary drivers of coastal erosion [28,53]. Additionally, the loss of sea ice has led to more decisive wave action and storm surges, further reducing the role of tides in shoreline changes [54]. Based on these studies, we assume that the tides have a negligible effect on shoreline changes in the Kaffiøyra region. Therefore, we might receive 15 meters of uncertainty in shoreline delineation due to the 30-meter resolution of Landsat imagery (half a pixel) [55,56].
We calculate total shoreline position uncertainty [57] by combining georeferencing and spatial resolution errors using the formula:
Assuming 15 meters for each error, the total is about 21.2 meters. This uncertainty is consistently applied throughout the analysis to ensure confidence in shoreline changes. Additionally, using the 95% confidence interval, incorporated into rate-of-change statistics [47], could provide a robust statistical measure of uncertainty and ensure that the derived shoreline change rates are interpreted with appropriate consideration of potential errors and enhance the reliability of the results.
3. Results
3.1. Analyze Shoreline Changes by DSAS
Figure A1 shows an example of the 2014, 2015, 2022, and 2023 boundary extraction results. Once the image extraction is complete, all the shorelines used as input for DSAS are overlapped (Figure 3a). The baselines are created along the shorelines. A baseline is good only if the transect starts from the baseline and must intersect all shorelines we have. Due to the different shoreline geometry, this study divided the baseline into five segments, as the white lines shown in Figure 3a. The transects are cast perpendicular from the baseline to all shorelines. In different baselines, we can set various parameters for the transects, such as the interval between two transects or the length of the transect (Figure 3b).
An overview of Figure 3a, the overlap shoreline map shows that the shoreline of the study area has erosion and deposition but is insignificant. Except for two regions with glacier terminus bordering the sea, the shoreline is dramatically eroded.
The study considers two main parameters (i.e., NSM and LRR) to interpret the results. The results relevant to the remaining parameters (i.e., SCE and EPR) will be presented in the appendix (see Figure A2 and Figure A3 for the calculated SCE and EPR). Figure A4 shows the specific values for each transect. Figure 4 shows the results of the calculated LRRs on different transects. The values in Figure 4 are shown with the representative color ramps. The dark red transects show values between minimum to -3 m/yr, meaning that the shoreline is experiencing intense erosion. However, the dark blue color represents a strong accretion for an area.
Figure 5 further zooms into the local areas to show the temporal behavior of the shoreline variations. Table 4 summarizes each zone's LRR and NSM values and the associated percentage of erosion and accretion for each zone. The shorelines in zones 1, 3, and 5 appear relatively stable. Zone 1 is situated in the northern part of the study area and has a shoreline length of approximately 4.5 km. Here, 255 transects were created, revealing annual erosion and accretion rates ranging between -2.2 ±0.62 m/yr and 2.3±0.73 m/yr, with an average shoreline change of -0.1 m/yr. In this zone, erosion is slightly more prevalent than accretion, affecting 56.9% of transects, compared to 43.1% showing accretion.
Zone 3 is centrally located within the study area, spanning roughly 21 km of shoreline. This zone is well-documented with 1,058 transects, demonstrating erosion and accretion rates varying from -1.1 ±0.76 to 3.7 ±1.62 m/yr and an average LRR of 0.5 m/yr. Accretion is the dominant process here, as indicated by 76.7% of transects, with only 23.3% showing erosion.
Zone 5 is located in the southern part of the study area, with a shoreline length of about 5.5 km. The number of transects is 305. The erosion and accretion rates here vary from -1.7 ±0.87 to 1.7 ±0.71 m/yr, with an average deposition rate of 0.2 m/yr. Accretion predominates in this zone, affecting 77.7% of transects, while the remaining 22.3% exhibit erosion.
In summary, the results of LRRs indicate that the shoreline on the glacier outwash plain is relatively stable compared to the LRRs of the tidewater glaciers. These zones are the boundary between the outwash plain and the sea. The variation of LRRs in these zones highly depends on the geometry of the coastal line and the sources of sediments carried by water from melted glaciers and snow. In addition, ocean currents, wind, sea waves, and floating ice could be the driving forces to control the overall behavior of the coastal line. Detailed dynamics of the variation along the coastal line might need further modeling and the associated on-site observations to quantify the erosion and deposition processes.
In contrast to the three zones with relatively stable shorelines, zones 2 and 4, which host tidewater glacier termini, have experienced significant changes, as shown in Figure 5 and Table 4. Zone 2, which encompasses the Aavatsmarkbreen tidewater glacier terminus shoreline, lasts about 8.3 km. A total of 122 transects were created here, showing a wide range of erosion or retreat rates from -64.7 ±9.37 to 9.2 ±2.92 m/yr, with an average retreat rate of -25.4 m/yr. Erosion is the dominant process, evident in 70% of the transects, particularly concentrated in the central terminus, and 30% of transects do indicate accretion.
Zone 4 is the Dalhbreen tidewater glacier terminus, with the shoreline length of approximately 3 km. Here, 152 transects were created, and the erosion and accretion rates ranged from -39.0 ±4.97 to 0.7±0.78 m/yr. The average shoreline change rate is significantly erosive at -27.5 m/yr, with erosion evident in 96.7% of transects.
There are also relatively high LRR areas near the corner of the glacier valleys. The coastal weather, ocean currents, or floating ice from melted glaciers and sea ice might influence these erosion areas. The retreating glaciers might also lead to barren zones that appear downstream (shown with light or dark blue colors) along the coastal lines and beside the glacier-sea boundaries. We observe the relatively high deposition areas along the barren zones, where the drifts accumulate, or the rocky outcrops that are covered by glaciers.
The Aavatsmarkbreen LRR indicates significant retreat, consistent with the 360 to over 540 meters of retreat reported [58] for the period 2000–2006 and the ongoing retreat documented in the Atlas of Changes in the Glaciers of Kaffiøyra [17]. Similarly, the Dalhbreen LRR aligns with the 310 meters of retreat recorded [58] from 1986 – 2005, with continued retreat also confirmed by the Atlas [17]. These comparisons underscore the accelerating glacier retreat and highlight the results of this study that match the previous ones.
In Figure 6 and Table 4, the NSM illustrates the distances between the youngest (2023) and oldest (1985) shorelines along each transect. It is observed that the values in zones 1, 3, and 5 vary from -56 m to +215 m. The negative values are marked by light red to dark red, meaning shoreline erosion has occurred. The longest eroded distance is -56 m to the landward in zone 5 (dark red). Meanwhile, the NSM value is positive at the transects marked by light blue to dark blue, which means the shoreline is accreting. The greatest distance is 215 m to the seaward in zone 5 (dark blue). The NSM values range from -2,762 m to + 426 m between the youngest (2023) and the oldest (1985) shorelines in zone 2 and zone 4. In zone 2, the longest transect with a value of -2,762 meters to landward, indicating that in 38 years, the Aavastmarkbreen has retreated the farthest distance of 2,762 meters (dark red). In zone 4, the glacier has retreated to the farthest distance of 1,654 meters (dark red).
3.2. The Glacier Terminus Areas, Retreat Rates, and the Correlation to Temperature Variations
3.2.1. Area Changes in Glacier Termini
The glacier terminus is the toe or snout of a glacier, and monitoring its changes is vital for assessing the retreat or growth of the glacier, in other words, the impact of climate change. The research utilized Landsat imagery to delineate the areas of seven glaciers within the study region, which comprised one tidewater glacier (Aavatmarkbreen) and six on-land glaciers (i.e., Waldemarbreen, Irenebreen, Elisebreen, Eivindbreen, Andreasbreen, and Oliverbreen), as shown in Figure 7. The extraction period spanned from 1985 to 2023, although data for some years were unavailable due to image errors or cloud cover, resulting in successful extraction for 28 of the 38 years. The terminus area changes were calculated by creating a reference line called the glacier baseline, shown in Figure 7, across the glaciers (yellow line). The baseline for calculating glacier terminus area changes was determined to ensure accuracy and consistency. The baseline was positioned behind all recorded glacier termini and tended to be perpendicular to the glacier's flow to capture advances and retreats. The baseline remains fixed across all years, allowing for consistent measurements of terminus positions.
Figure 8 and Table A1 illustrate a clear retreat trend among all seven glaciers. Results show that the area of the Aavatsmarkbreen glacier terminus decreased from 11.05 km² in 1985 to 3.63 km² by 2023 based on the defined baseline. This reduction of 7.42 km² translates to a loss of 67.1% of its total area, leaving only 32.9% of its original size. Aavatsmarkbreen experienced the most significant decline in the area. The on-land glaciers experienced varying degrees of area loss: Waldemarbreen at 45.2%, Irenebreen at 38.7%, Elisebreen at 35%, Eivindbreen at 26%, Andreasbreen at 44.5%, and Oliverbreen at 56.3%, as shown in the percent of remaining area chart in Figure 8. Note that the reference areas of the original glacier in the calculations are those obtained in 1985.
The study shows an average land glacier area loss of 41%, while the average remaining area is 59% by 2023. Such results are close to 43% of area reduction reported in previous studies [17,22], observed from the late 19th century to 2015. Despite the different periods, the percentage similarity suggests a consistent long-term trend of glacier retreat for land glaciers.
3.2.2. Aavatsmarkbreen – Tidewater Glacier Surge Event
The long-term time series data are valuable for assessing the dynamic of glaciers in specific areas. The available images and resolution have enabled the identification of historical events for the important terrain features in the study area. Significant fluctuations in the area of Aavatsmarkbreen were observed in 2015 (Figure 8), with an expansion of 2.5 km² from 2013, marking a substantial deviation from the typical retreat pattern. The Aavatsmarkbreen surge events in 2014 and 2015 have been previously documented, with glacier surges being a well-researched phenomenon in Kaffiøyra [59,60]. These surges are driven by complex interactions of thermal, hydrological, and mechanical processes, wherein surface meltwater drains into the glacier base, causing basal lubrication that reduces friction and increases glacier velocity. During the 2014–2015 surge, Aavatsmarkbreen expanded from 5.57 km² in 2013 to 6.52 km² in 2014, peaking at 8.07 km² in 2015 (Figure A5). On average, before the surge, the glacier retreated at 0.24 km²/yr between 1985 and 2013. During the surge period, the area gained at a rate of 1.25 km²/yr before resuming retreat at a rate of 0.53 km²/yr from 2015 to 2023 (Figure A6). These surge events are consistent with the documented behavior of Aavatsmarkbreen and reflect a known pattern of periodic glacier advances followed by retreat.
Smaller increases were observed in both tidewater and land glaciers during 1987, 1990, 2001, 2014, and 2016. Upon investigating these periods (Figure 7), it was evident that these increases were not the result of surge events, as the other glaciers continued their steady retreat. The anomalies in these glaciers primarily stem from changes in the lateral areas. Since the satellite images were captured during the summer, snow cover in the lateral regions may have temporarily increased the measured glacier area from June to September. However, the glacier termini remained consistently clear, ensuring accurate tracking of the main glacier boundaries. These minor anomalies, therefore, reflect a limitation of the method, as seasonal snow cover in the lateral areas can influence the apparent glacier extent.
3.2.3 Retreat Rate in Glacier Termini
In addition to assessing changes in areas, evaluating the rate of glacier retreat is crucial. The study generated centerlines based on the glacier outlines in 1985 (see Figure 7, marked with white lines). One centerline (AA') and two additional reference lines (BB' and CC') will be established for the tidewater glacier Aavatsmarkbreen. For the land glaciers, one centerline is defined for each glacier (i.e., Waldemarbreen, Irenebreen, Elisebreen, Eivindbreen, Andreasbreen, and Oliverbreen). These centerlines will serve as the basis for tracking retreats over time. The study will employ a linear regression model to analyze all intersection points where the centerlines meet the glacier outlines at different times. By fitting these data points, we can derive a rate of retreat for each glacier at a specific time.
In long-term retreat, Table 5 and Figure A7 show that the tidewater glacier Aavatsmarkbreen exhibits the most rapid retreat along its centerline, labeled AA', with a rate of 62.93 m/yr. Note that the reference lines BB' and CC' show similar patterns but with relatively slow retreat rates. Such slow variation of retreat along the reference lines might be influenced by the land of the coastal line and the glacier's geometry. Among the land glaciers, Andreasbreen shows the highest retreat rate at 43.74 m/yr. The retreat rates for the other land glaciers decrease as follows: Irenebreen at 22.96 m/yr, Elisebreen at 19.48 m/yr, Oliverbreen at 18.99 m/yr, Waldemarbreen at 9.24 m/yr, and Eivindbreen at 7.03 m/yr. The average retreat rate of Aavatsmarkbreen is 43.74 m/yr, while the average rate for land glaciers is 20.24 m/yr. It is worth mentioning that the retreat rate of Elisebreen at 19.48 m/yr in the study is close to the average value of 18 m/yr proposed by Sobota et al.(2016) [22]. The results of Sobota et al.(2016) were based on the observations from 1909 to 2015. Furthermore, the retreat rate of Waldemarbreen recorded by Sobota et al.(2016) was 8 m/yr, which is also close to the observation in the study. The verification shows that the image-based approach could be consistent with the ground measurements.
In short-term retreat, Table 5 shows that Aavatsmarkbreen continues to exhibit rapid retreat along AA', with an average of 83.97 m/yr over the 10-year recent boundaries, rising sharply to 210.48 m/yr in 2019-2023. The BB' and CC' show relatively lower rates, with BB' increasing from 33.49 m/yr (10-year) to 75.13 m/yr and CC' shifting from -3.16 m/yr to 165.57 m/yr, likely influenced by coastal land and glacial geometry. Among land glaciers, Andreasbreen has the highest short-term retreat, at 98.94 m/yr (10-year) and 101.02 m/yr in 2019-2023. Other land glaciers show lower rates, with Irenebreen, Elisebreen, Oliverbreen, Waldemarbreen, and Eivindbreen showing varying increases, reflecting a recent acceleration in glacier retreat. These findings align with long-term trends.
Figure 10 illustrates how the distance between measurements taken over two-year intervals varies along each centerline of a glacier. The boxplot chart helps to assess the overall behavior of different glaciers and whether a glacier's retreat is accelerating or decelerating along specific transects. Significant surge events dramatically impacted its measurements in the case of Aavatsmarkbreen (see the results of AA', BB', and CC'). To accurately assess the glacier's retreat behavior, we excluded data from the years affected by surges (2014-2019). This exclusion is vital because surges characterized by rapid and periodic advances might distort long-term trends and are generally not observed from land glaciers in the study. By focusing on non-surge periods, we aim to provide a more explicit analysis of the gradual changes indicative of the glacier's response to climatic conditions, allowing for more consistent comparisons with retreat patterns of land glaciers.
The boxplot for centerline AA' reveals a wide dispersion of data points, indicating substantial year-to-year variability in glacier retreat, suggesting that the retreat pattern along this transect is highly irregular and variable. In contrast, reference lines BB' and CC' show progressively minor variability, indicating a more consistent retreat pattern, particularly at CC', where the behavior is the most stable among the tidewater glaciers. Because the two reference lines are close to the coastal land, the geometry of the glacier or glacier flow patterns could constrain the variation of these reference lines. In addition, the coastal lands could be essential in binding two sides of the glacier front.
When we compare tidewater glaciers to land glacier centerlines, the land glaciers generally exhibit a more stable retreat. The result is evident from their boxplots, which show a narrow range and data clustered close to the median. Waldemarbreen, Eivindbreen, and Oliverbreen demonstrate the typical stable retreat patterns among the land glaciers. Conversely, Andreasbreen exhibits the most irregular retreat behavior, standing out for its inconsistency within the group of land glaciers.
The observable retreat of glaciers nearly the past four decades indicates climate change's impact on the Arctic. Various factors, including changes in precipitation, the albedo effect, ocean temperature increases, shifts in atmospheric circulation, deposition of black carbon, thawing of permafrost, increased iceberg calving, and the loss of sea ice, all contribute to glacier retreat. However, the principal driver among these is the temperature change [61,62]. Temperature changes might directly and indirectly interact with and impact other factors. Thus, the following section will discuss the temperature changes within the study area.
3.2.4. Temperature Increasing Trend
In this study, we considered Ny-Ålesund temperature data due to the discontinuous records from Kaffiøyra. The Ny-Ålesund monitoring station (78.9230N, 11.9331E), located about 25 km north of Kaffiøyra, provides a detailed temperature record from 1975 to the present, capturing monthly variations and serving as a critical resource for understanding regional climate dynamics. Research has demonstrated a high correlation between temperatures at Ny-Ålesund and Kaffiøyra [63]. Therefore, using Ny-Ålesund temperature data in this study could be acceptable. The data is accessible via the NASA Goddard Institute for Space Studies (GISS).
The annual mean temperature chart in Figure 11 illustrates a gradual upward trend from 1975 to the present, with an approximate average yearly increase of 0.09 ºC. This data underscores a consistent warming pattern over the years.
Analyzing the monthly temperature records from the Ny-Ålesund station, alongside Landsat imagery, reveals that the study area experiences summer during June, July, and August. During these months, surface temperatures rise above 0 ºC, and snow cover is typically absent. Figure 12 displays the mean summer temperatures spanning from 1975 to 2023 and indicates a warming trend. The data show an average annual increase in summer temperatures of 0.04 ºC. The average summer temperature in Ny-Ålesund closely matches that of Kaffiøyra, with a difference of approximately 0.04 ºC compared to 0.03 ºC. This slight difference may be due to the summer period defined in the study of Kejna and Sobota (2019) [63], which considers summer from July 21 to August 31. Notice that the variation behavior of annual mean temperatures might not be consistent with the summertime mean temperature. An obvious example is that in 2020, we found a historically high mean summer temperature, but the annual mean temperature in 2020 was relatively low compared to previous years. In 2015 and 2016, the high annual mean temperature came with the high mean summer temperature.
These charts reveal the warming temperature trends in the study area. The following part of the study will quantify the correlation between increasing temperatures and the glacier's remaining area by calculating the correlation coefficient of the datasets. This effort seeks to elucidate the specific impact of temperature increases on glacier retreat, offering a clearer understanding of the dynamics at play in temperature-induced changes to glacier area variations.
3.2.5. Correlation Between Glacier Terminus Area and Summer Time Mean Temperature
Before establishing the correlation between temperature increases and the reduction in the glacier terminus area, the study initially normalized each variable through z-score normalization [64]. This process was essential to ensure fair and accurate comparisons between the two variables. Z-score normalization adjusts the data to have a mean of 0 and a standard deviation of 1, thereby allowing for a direct comparison of different datasets on a like-for-like basis, regardless of their original scales or units of measurement.
This preparatory step is crucial for producing reliable results and analyzing the relationship between temperature variations and the remaining area.
Where is the z-score, is the value of the data point, represents the mean of the dataset, and is the standard deviation of the dataset.
In this analysis, we utilize the Pearson correlation coefficient [65] to measure the linear relationship between independent variables (temperature) and dependent variables (remaining glacier area). The formula to calculate the Pearson correlation coefficient is:
where the notations are the individual sample points indexed with , and are the means of samples, respectively. Figure 13 shows the scatterplot of the correlation between summertime mean temperature and the glacier's remaining areas after using the z-score normalization. The study proposes a linear regression equation to evaluate the relationship between two variables.
The findings indicate that all seven glaciers exhibit a negative correlation with temperature, with values ranging between -0.65 and -0.73 (see Table 6). These correlation coefficients are significantly negative (approaching -1), suggesting a relatively strong inverse relationship. The remaining glacier terminus areas tend to decrease as temperatures increase.
3.2.6. Prediction of Glacier Area Changes
In this section, the study will utilize a linear regression equation to predict the changes in the glacier terminus areas, drawing on the proven linear correlation between temperature increases and glacier retreat. The prediction, covering the period from 2020 to 2039, will incorporate temperature projections derived from the Shared Socioeconomic Pathways (SSPs) of the Svalbard archipelago. These SSP scenarios comprehensively account for how socioeconomic factors influence greenhouse gas emissions and the strategies for adaptation. In addition, the study uses future temperature prediction data from the Ny-Ålesund station (Figure 12 – marked with green rectangular symbols) to make the parallel comparison for the same period. This comparison aims to clarify how glacier areas might evolve in response to regional SSP-derived temperatures and local temperature trends at the Ny-Ålesund station.
Temperature data for the SSP scenarios were sourced from 2020 - 2039, as detailed on the Climate Change Knowledge Portal. The result involved collecting temperature data for each year's summer months (June, July, August) within this period. The process entailed identifying the minimum, maximum, and average temperature values across these months for 2020 to 2039. Subsequently, the averages of these minimum (Min.), maximum (Max.), and average (Avg.) monthly temperatures were calculated to serve as the input data. In the study, the temperature data for Ny-Ålesund from 2020 to 2039 was analyzed using the linear equation provided based on the station's summer data (Figure 12) to determine the minimum, maximum, and average temperature values for this period.
Figure 14 shows the future temperature predictions and the remaining glacier areas for 2020–2039. In Figure 14, we have observed that the local summer temperature at the Ny-Ålesund station exhibits a much higher temperature increase group than that obtained from the SSPs of the Svalbard archipelago. The predicted glacier area changes could be considerably different between SSPs and the local observations at the Ny-Ålesund station. Results presented in Table 7 show that the temperature projections under SSP scenarios vary between 0.44 and 4.32 ºC. Consequently, the predicted glacier area remains significantly large, with estimated ranges varying from 8.6 to 16.25 km². This projection contrasts sharply with the image-based measured remaining area of Aavatsmarkbreen from 1985 to 2023. Based on our observations, the remaining area of Aavatsmarkbreen is 3.63 km² by 2023 (see Figure 8). The temperature data from the Ny-Ålesund station yields results that align more closely with the actual changes observed at the Aavatsmarkbreen glacier (see Figure 14 and Table 7). However, all the predictions considerably underestimate the high variations of glacier remaining areas. The example of Aavatsmarkbreen in the study suggests that the impact of climate change, particularly the effect of rising temperatures, on glacier retreat is more severe at the local scale. The findings highlight the crucial role of localized temperature measurements in accurately assessing climate change impacts on glacier dynamics. Establishing additional monitoring stations will be vital for enhancing the precision of future forecasts and developing a more comprehensive understanding of climate change's local effects.
3.3. Variations of Outwash Areas
The retreat of glaciers reduces the extent of the glacier terminus and significantly impacts the surrounding landforms. The outwash is one of the main terrain features that might be developed with the land glacier retreat. The outwash areas in the study area are identified and shown in Figure 1. Specifically, Outwash 1 is located downstream of Waldemarbreen, while Ourwash 2 might receive melting water and sediments from Irenebreen and Elisebreen. Outwash 3 is located downstream of Eivindbreen, Andreasbreen, and Oliverbreen. There is no clear interface to differentiate the sources of water and sediment depositions from Oliverbreen, Eivindbreen, and Andreasbreen.
Figure 15 and Table A2 illustrate the changes in the areas of three large outwash areas over the past 38 years. Based on the original sizes of the outwash areas estimated in 1985, Outwash 1 experienced a decrease of approximately 13.1% in area, while Outwash 2 and 3 showed increases of 6.7% and 9.6%, respectively. There has been a notable decrease in Outwash 1 since 2019. A significant drop in the Outwash 1 area appeared in 2020 when the highest mean summer temperature was obtained (See Figure 12). We could not find a specific correlation between the Waldemarbreen remaining area and the Outwash 1 area changes. However, the Outwash 1 area reduction could be induced by the disconnected ice source of Waldemarbreen based on the image shown in Figure 1.
Outwash 2 and 3 show notable increases since 2015. The rise in outwash areas might be relevant to the relatively high temperature near the Ny-Ålesund. In 2015, the summer and annual mean temperatures reached historically high values compared to the data before 2015. Again, no clear evidence exists to correlate the glacier's remaining areas with the outwash areas. Unlike the conditions in Outwash 1, the increase in summer and annual temperatures are the possible factors that drive the rise in outwash areas for Outwash 2 and 3 if the upstream glaciers have sufficient ice supplied to their sources.
Water sources and sediments from glaciers or snow could influence the changes in outwash areas. As the glacier retreats, the increased meltwater output may expand outwash plains where the water and sediments are deposited. However, the time series data in Figure 15 show a slight increase in outwash area changes from 1985 to 2023. These changes are consistent with the dynamics of glacier retreat; as the glacier terminus recedes due to increased melting, the volume of meltwater feeding the outwash areas changes.
4. Discussion
The analysis reveals a significant increase in long-term shoreline change rates across different coastal zones, categorized into land-shorelines (Zones 1, 3, 5) and glacier-shorelines (Zones 2, 4). Sediment dynamics and hydrodynamic conditions predominantly influence the land-shorelines, whereas climatic factors primarily affect glacier-shorelines. Prins Karls Forland Island is a noteworthy feature within this landscape, located approximately 15 km from Kaffiøyra (Figure 1). This island is a natural buffer, shielding the nearby land-shorelines from the Atlantic's hydrodynamics. This protection is particularly evident in Zone 3, where we observe substantial accretion. Here, the average LRR over a 21 km stretch is approximately 0.5 m/year, and the NSM indicates an advance of about 56 m towards the sea over almost four decades. This advancement can be attributed to the island's shielding effect and the abundant sediment supplied from the outwash areas in the area, as evidenced by the accretion transect distribution detailed in Figure 6 (zone 3).
Conversely, the glacier-shorelines in Zones 2 and 4, known as Aavatsmarkbreen and Dalhbreen, experience a significant retreat, influenced mainly by climatic conditions, highlighting that tidewater glaciers are distinctly more vulnerable under the same climate conditions as land glaciers. Tidewater glacier terminus has retreated by 67.1% of the area, substantially more than the 40.9% average retreat observed inland glaciers. Additionally, the average retreat rate (i.e., from AA', BB', and CC') for the tidewater glacier (43.74 m/yr) is roughly twice that of land glaciers (20.24 m/yr). Recent data also show accelerated retreat rates. The Aavatsmarkbreen AA' rose from 83.97 m/yr over the 10-year boundary to 210.48 m/yr in 2019-2023, with BB' and CC' showing similar but smaller increases. Land glaciers follow this trend, with Elisebreen increasing from 8.10 m/yr to 60.69 m/yr and other glaciers like Oliverbreen and Waldemarbreen showing notable rises. This widespread acceleration suggests glaciers respond more intensely to recent climate changes, signaling a rapid shift in ice loss dynamics.
Based on previous reports, surface events in the study area occurred twice, first in 1987 and then again in 2014 and 2015, exclusively affecting the tidewater glaciers. While these events led to advances toward the sea and increased area at the glacier terminus, they should be viewed as a consequence of climate change. The development of crevasse systems during these periods likely facilitated meltwater flow to the glacier base. Following these surge events, the area loss rate of the glacier terminus more than doubled, indicating increased instability in the glacier structure post-surge, which made the terminus more prone to collapse and accelerated area loss. When examining retreat behavior via the boxplot chart (Figure 10), it is evident that the tidewater glacier exhibits more significant variability than land glaciers. The distance between two years is often significant and spans a wide range of values, reflecting this variability. In contrast, land glaciers demonstrate more stable retreat patterns; the distance between two years is smaller and distributed close to the median. This analysis supports that the tidewater glacier is more susceptible to rapid changes and potentially more hazardous in consistent climate conditions.
Temperature analyses further underscore this vulnerability, showing a strong negative correlation (between -0.65 to -0.76) between summertime mean temperatures and glacier remaining areas, signifying that rising temperatures are a primary driver of glacier retreat. A predictive model based on linear regression and temperature data from Ny-Ålesund closely aligns with observed changes more accurately than regional climate models, which fail to capture the current status of the Aavatsmarkbreen and deviate from observed data. This discrepancy emphasizes the need for improved monitoring systems that can provide more accurate local data to understand better the effects of climate change on local and regional scales.
Furthermore, outwash plains 2 and 3 show a growth trend, though the increase is less than 10%. These outwash areas are critical for shoreline evolution in Zone 3, serving as significant sediment sources. The gradual expansion of these outwash areas aligns with the steady melting of ice and snow during the summer, providing a consistent supply of sediment that supports sustained shoreline accretion. In the study, Outwash 1 area shows a decreased behavior triggered from 2019 to 2020. The image-based assessment could give an overview of the area changes, but the correlation between the outwash and the glacier is unclear. More detailed, accurate, on-site monitoring and estimations of glacier and outwash evolution might improve understanding of the interaction mechanism between glacier and downstream outwash.
Lastly, the study recognizes several limitations. While the primary focus is on nearly 40 years of long-term observation, the 30-meter resolution of Landsat imagery poses challenges in capturing small-scale landform changes. Additionally, the manual creation of baselines and transects introduces a degree of subjectivity, particularly in complex areas. The reliance on summer imagery further limits the consideration of seasonal variability in glacier and shoreline dynamics. Future research could address these limitations by utilizing higher-resolution remote sensing imagery or UAVs for more detailed analysis of small-scale changes. Incorporating numerical modeling could also enhance understanding of seasonal variability.
5. Conclusion
This study has comprehensively explored the impacts of climate change on various landforms from 1985 to 2023, utilizing cost-effective remote sensing and GIS techniques to monitor spatial and temporal changes. Key findings include the relative stability of the land-shoreline, with average changes ranging from -2.2 to +3.7 m/yr. Considerable changes were observed in the tidewater glacier terminus under the climatic conditions in the past 4 decades. The results show that the Aavatsmarkbreen exhibited the greatest loss in the terminus area, with a reduction of 67.1%, in contrast to an average area loss of 40.9% among land glaciers. Regarding the retreat rates, Aavatsmarkbreen also displayed the most rapid retreat behavior, averaging 62.93 m/yr, compared to 43.74 m/yr for land glaciers. In recent years, retreat rates have increased dramatically. For example, Aavatsmarkbreen AA' increased from 83.97 m/yr (10-year recent boundaries) to 210.48 m/yr (2019-2023). This sharp increase underscores the intensified impact of climate change on glacial dynamics, particularly on tidewater glaciers, which are retreating at accelerating rates due to heightened sensitivity to warming temperatures.
Additionally, temperature analyses from the Ny-Ålesund station revealed a strong negative correlation (ranging from -0.65 to -0.72) with the remaining glacier areas, indicating a direct impact of rising temperatures induced glacier retreat. Furthermore, the study employed these correlations alongside regional climate projections from Svalbard's SSPs and linear temperature trends from Ny-Ålesund to predict future declines in Aavatsmarkbreen. These projections suggest that regional climate models may fail to capture local scale variations, potentially leading to underestimations of climate impact.
As for the outwash plains, there is limited data availability (21 out of 38 Landsat image sets). It was noted that two outwash areas, Outwash 2 and 3, exhibited moderate increases in size, though less than 10%.
Overall, this study underscores the responses of Arctic terrain features to climate change and highlights the need for finely scaled models to predict future environmental transformations accurately. It overviews long-term landform behavior under accelerated climate change, forming a foundation for future hydrodynamic and glacier numerical modeling research. These models will further explore the interactions between climate dynamics, shoreline evolution, and glacier retreat, helping to fill the gap between images, predict future changes, and inform strategies for managing the impacts of climate change in Arctic regions.
Author Contributions
H.-S.V. and C.-F.N. conceived and designed this research, providing valuable insights during its conception. Y.-H.C., S.J.G., and P.-Y.C. collected and analyzed the landform, coastal lines, and hydrogeological data for the study area. H.-S.V. contributed to the preparation and processing of Landsat data and GIS analyses. H.-S.V. conducted the study, carried out the analyses, and drafted the initial manuscript. N.H.H. and T.-V.-T.N. support software analyses and visualization. C.-F.N., S.J.G., and P.-Y.C. further refined and finalized the manuscript for communication with the journal. All the authors have read and agreed to the published version of the manuscript.
Funding
This research was partially supported by the National Science and Technology Council, Taiwan, under grants NSTC 112-2123-M-008-001, NSTC 112-2122-M-007-002, and NSTC-113-2116-M-008 -024. The authors thank the Ministry of Education, Taiwan, the Ministry of Foreign Affairs, Taiwan, the National Central University (NCU), and the National Academy of Marine Research (NAMR), Taiwan, for supporting the research.
Data Availability Statement
The original contributions presented in the study are included in the article. Further inquiries can be directed to the corresponding author.
Acknowledgments
We thank Professor Ireneusz Sobota and PhD Candidate Kamil Czarnecki for their invaluable comments and suggestions, which significantly contributed to the revision and improvement of the original manuscript. Their feedback is instrumental in ensuring the scientific rigor and clarity of the work. The authors also thank the Nicholas Copernicus University Polar Station and the Taiwan Polar Institute for supporting the in situ surveys and monitoring.
Conflicts of Interest
The authors declare no conflicts of interest.
Appendix A
Figure A1.
The maps of the extracted results for the main terrain features in: (a) – 2014, (b) – 2015, (c) – 2022, and (d) – 2023. The boundaries are marked with white, orange, and yellow lines for shorelines, glacier terminus, and outwash, respectively.
Figure A1.
The maps of the extracted results for the main terrain features in: (a) – 2014, (b) – 2015, (c) – 2022, and (d) – 2023. The boundaries are marked with white, orange, and yellow lines for shorelines, glacier terminus, and outwash, respectively.
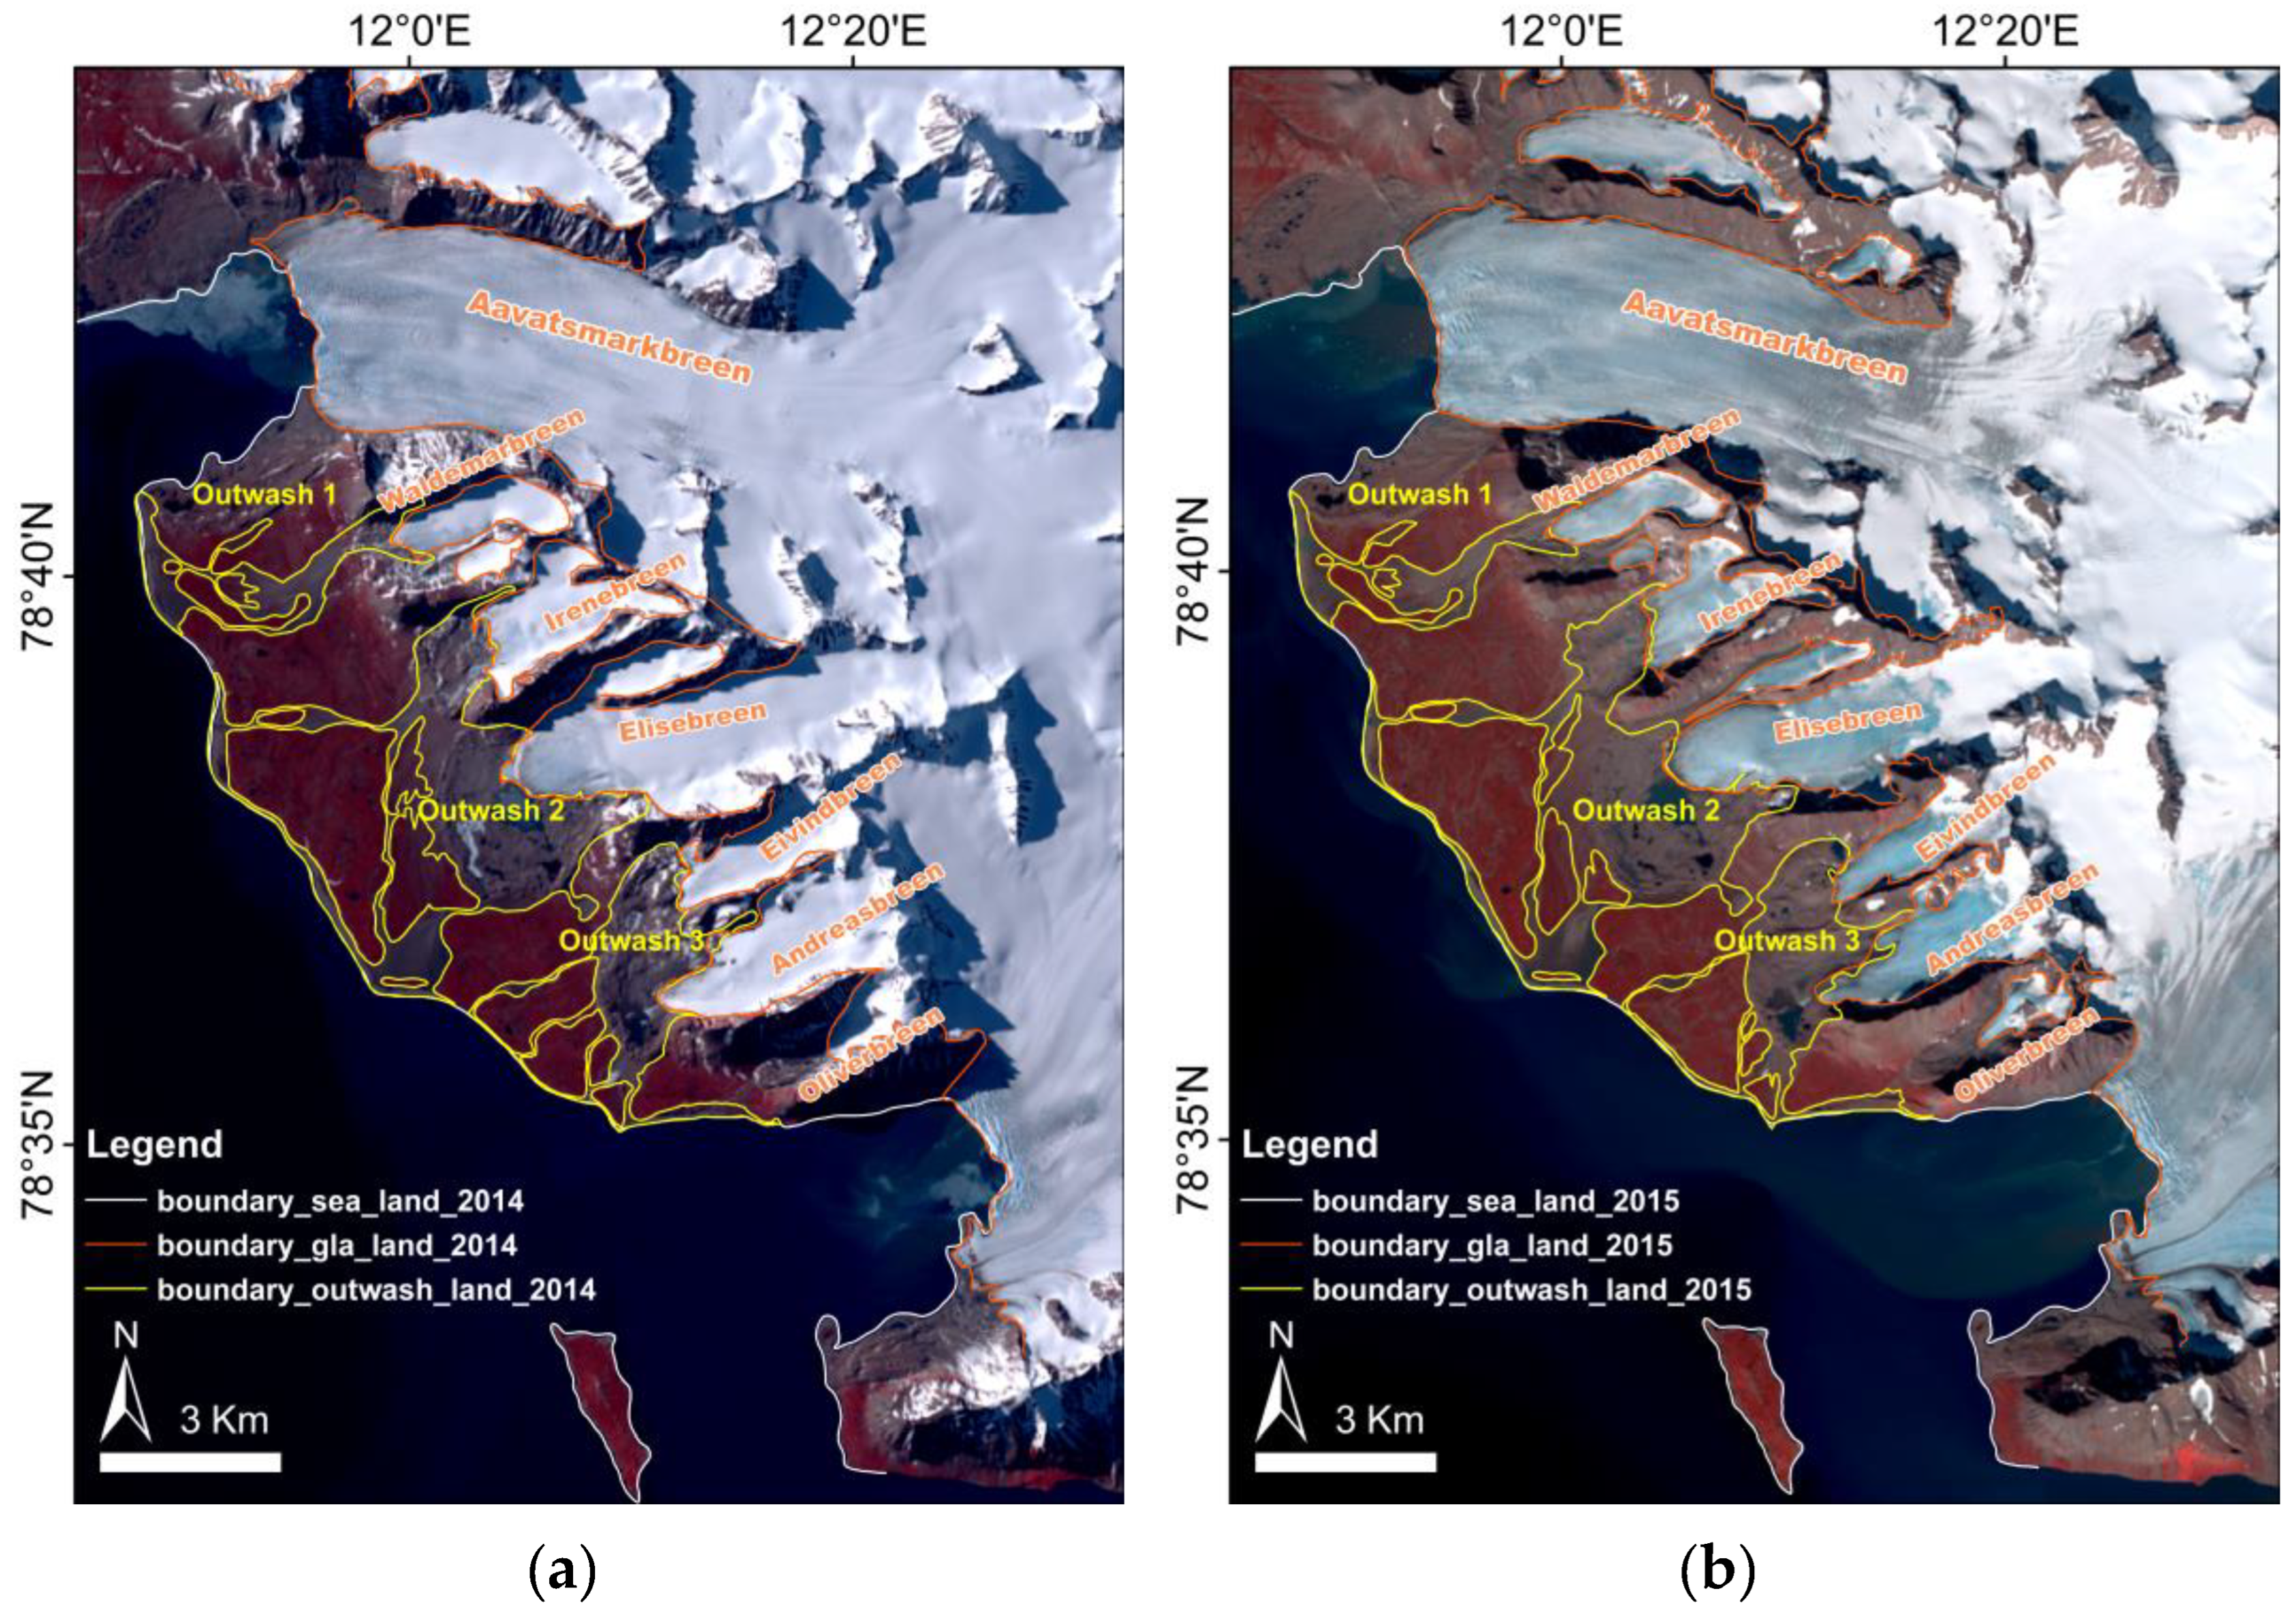
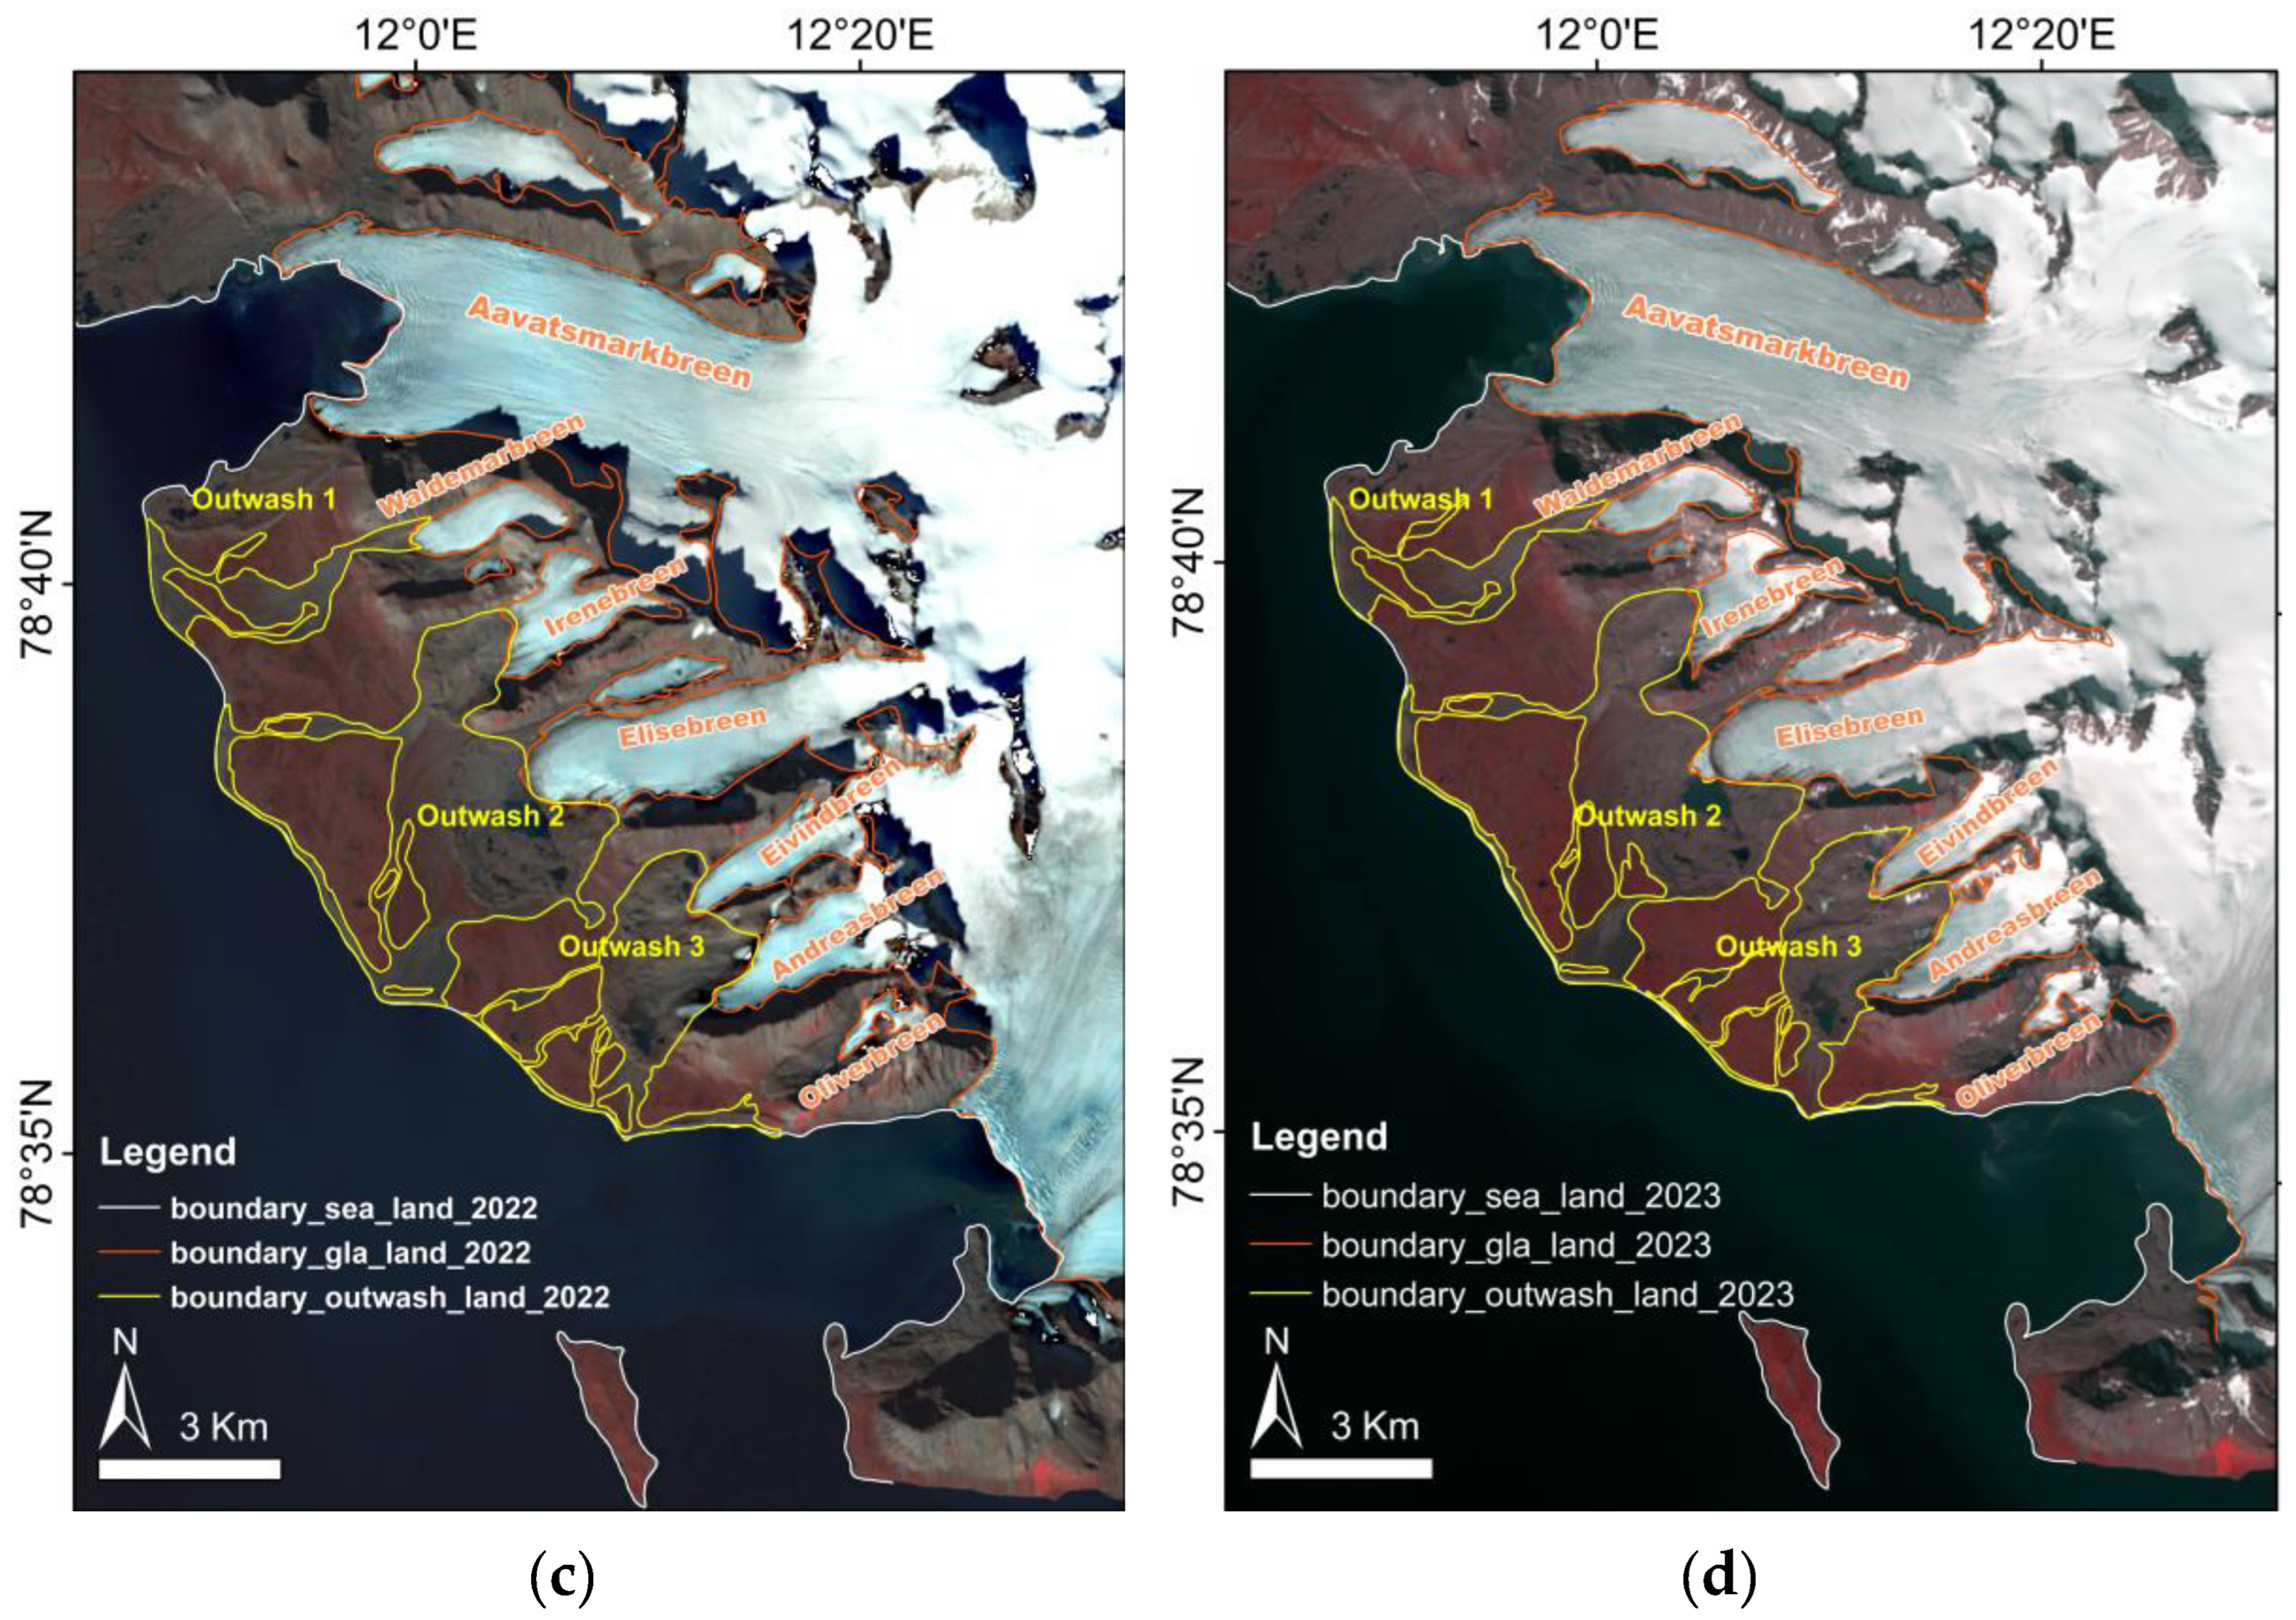
Figure A2.
The determined SCE for different zones.
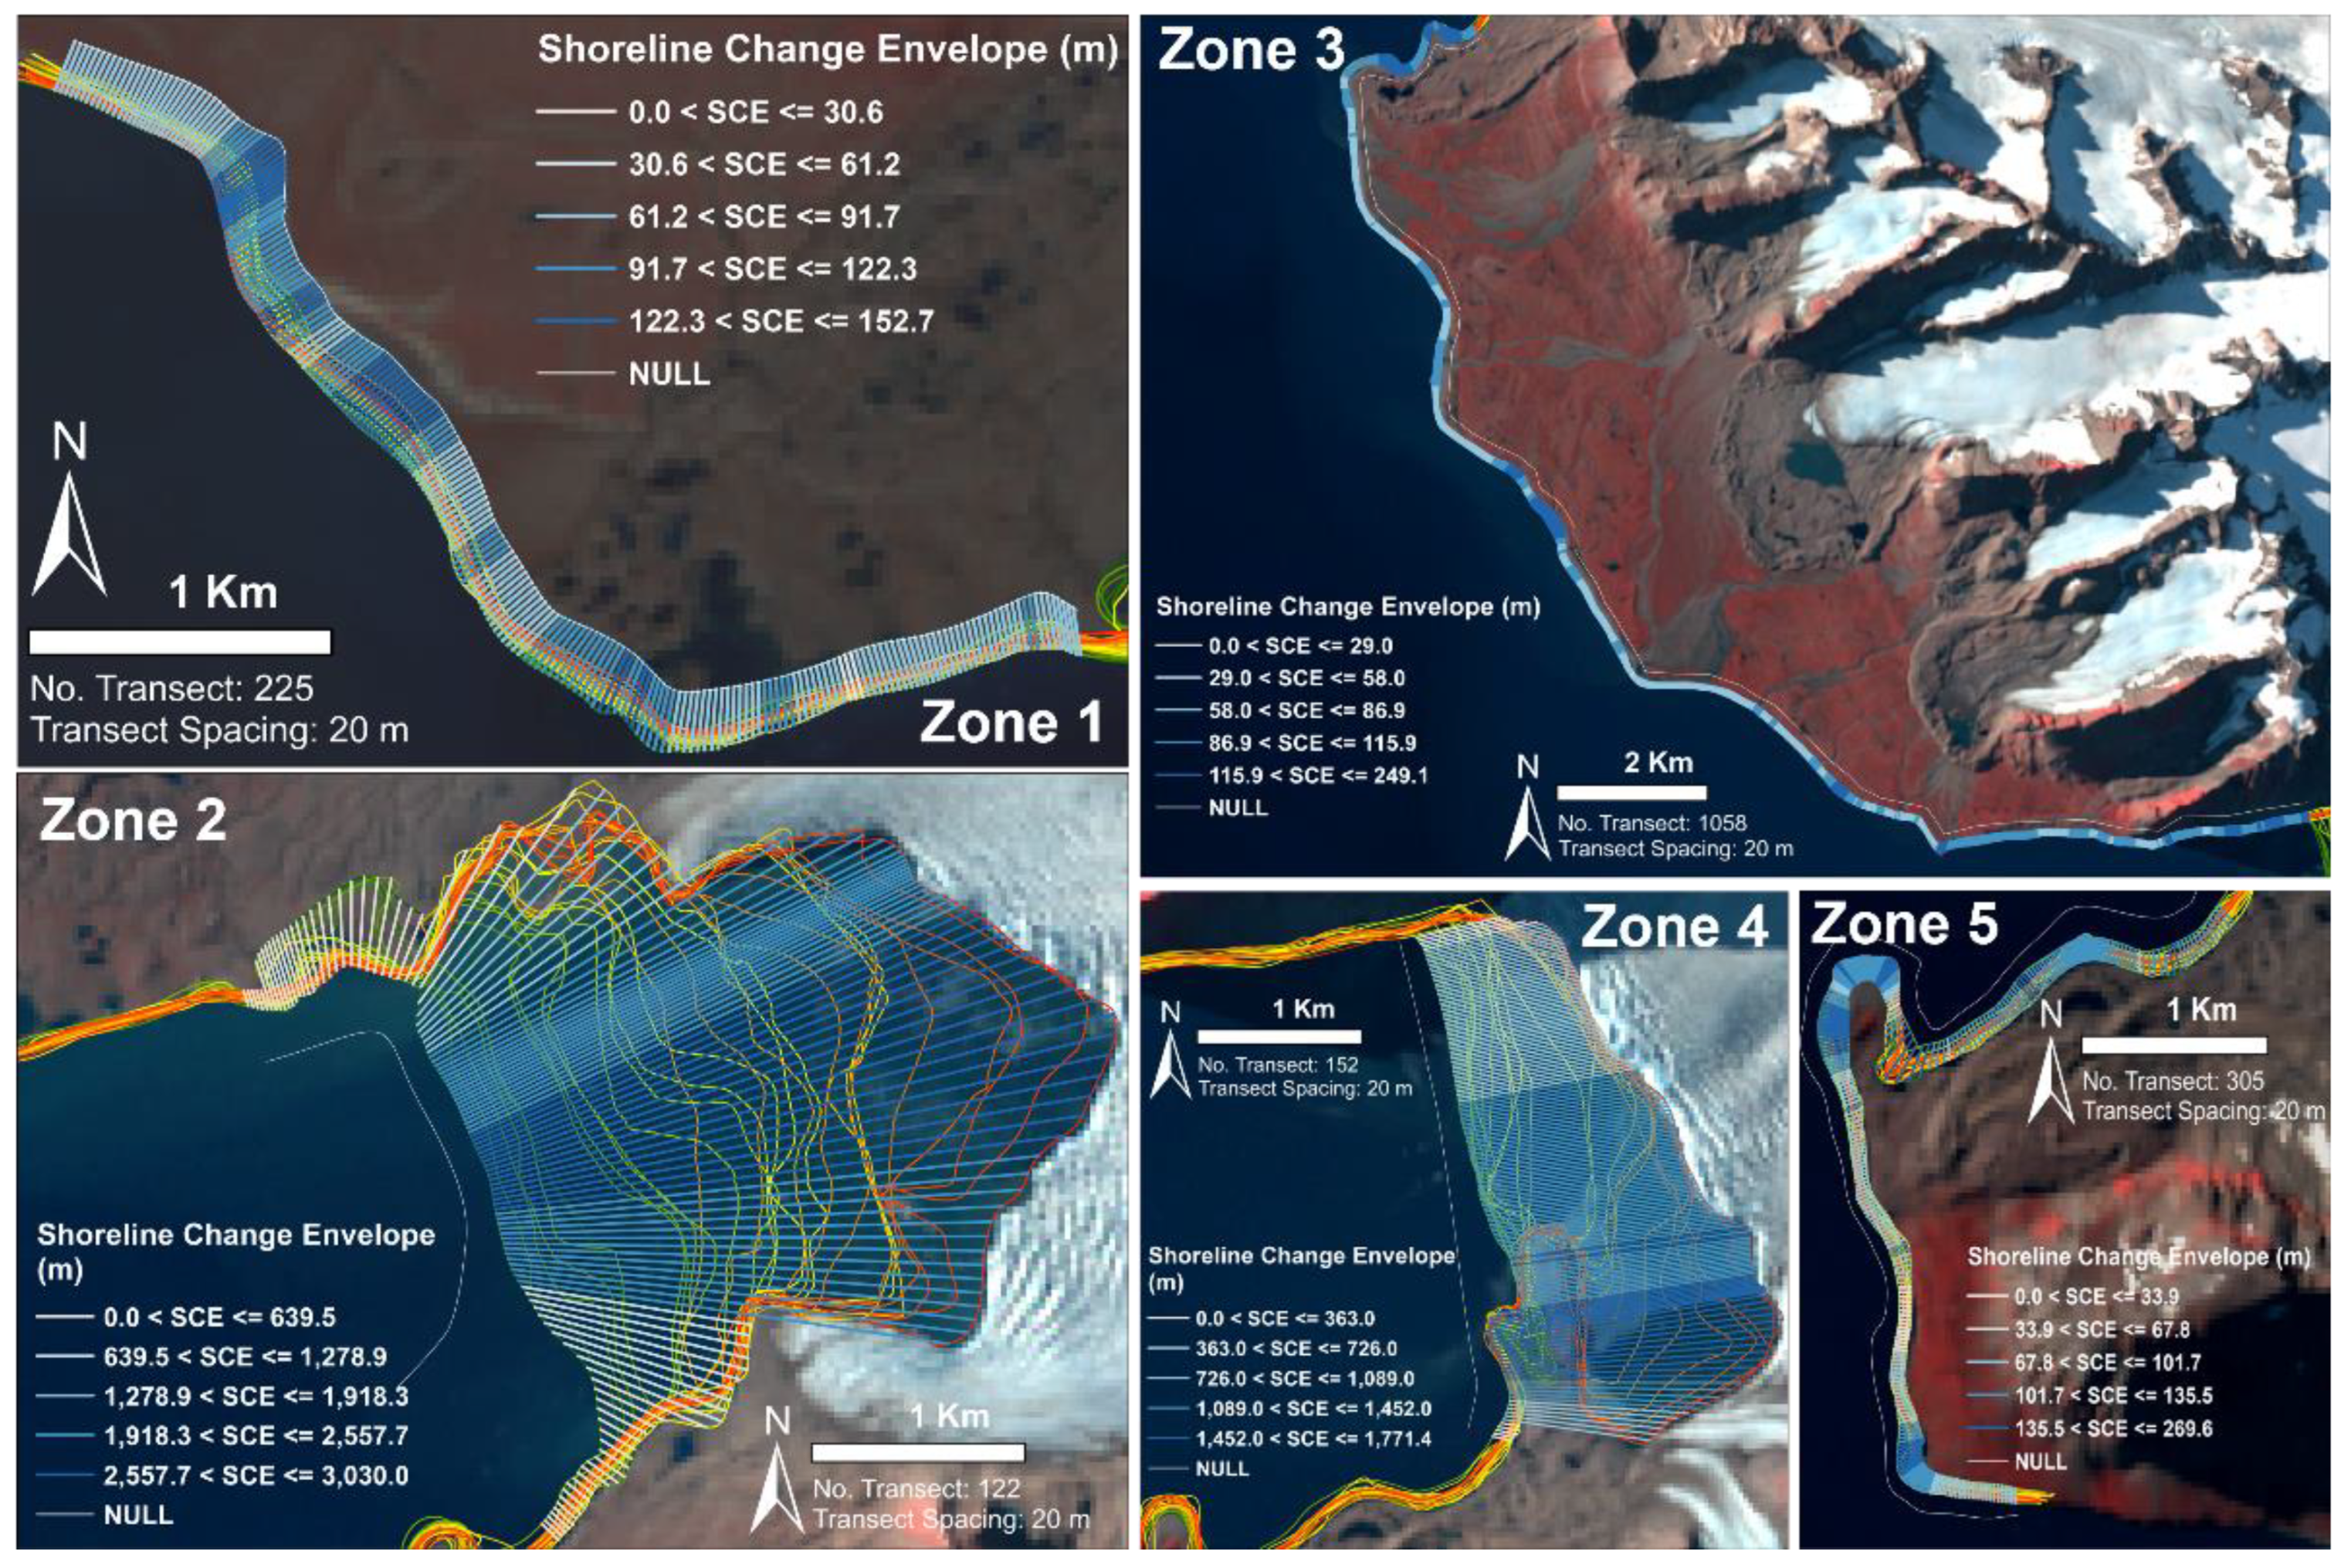
Figure A3.
The End Point Rate (EPR) map for 1985 – 2023.
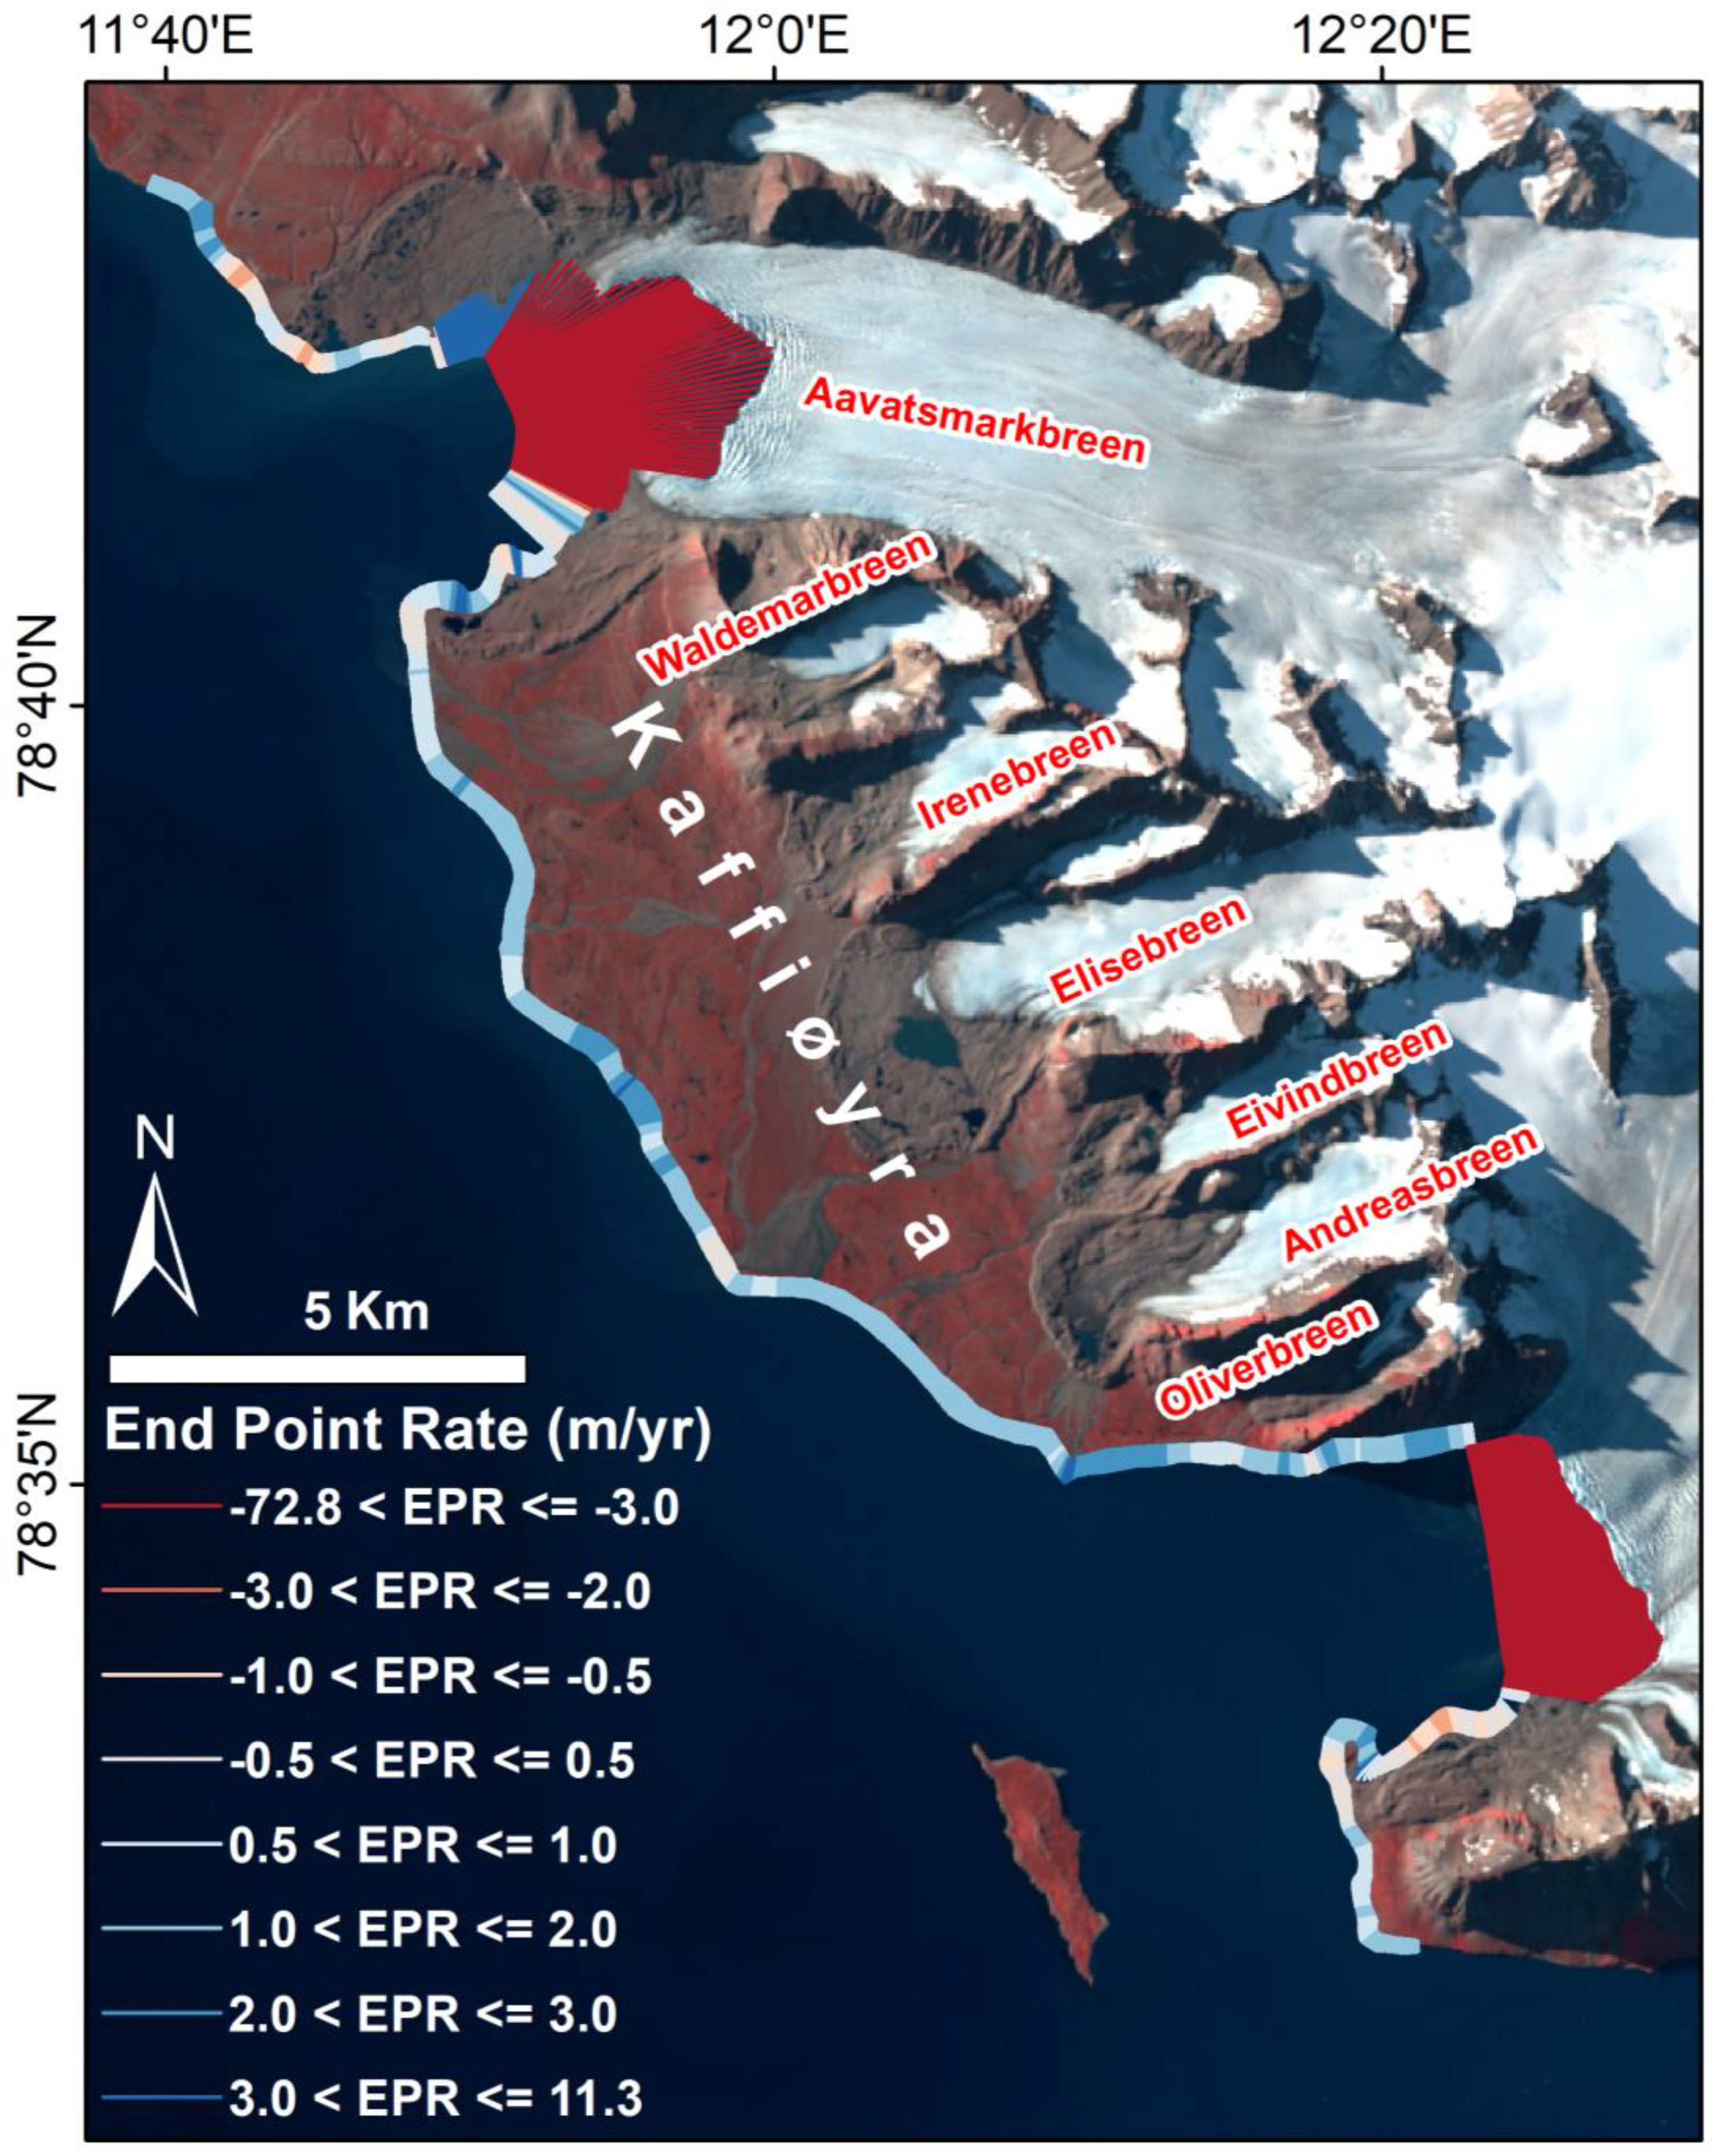
Figure A4.
The LRR values for different zones: (a) zone 1, (b) zone 2, (c) zone 3, (d) zone 4, and (e) zone 5. The red and blue dots represent the erosion and accretion.
Figure A4.
The LRR values for different zones: (a) zone 1, (b) zone 2, (c) zone 3, (d) zone 4, and (e) zone 5. The red and blue dots represent the erosion and accretion.
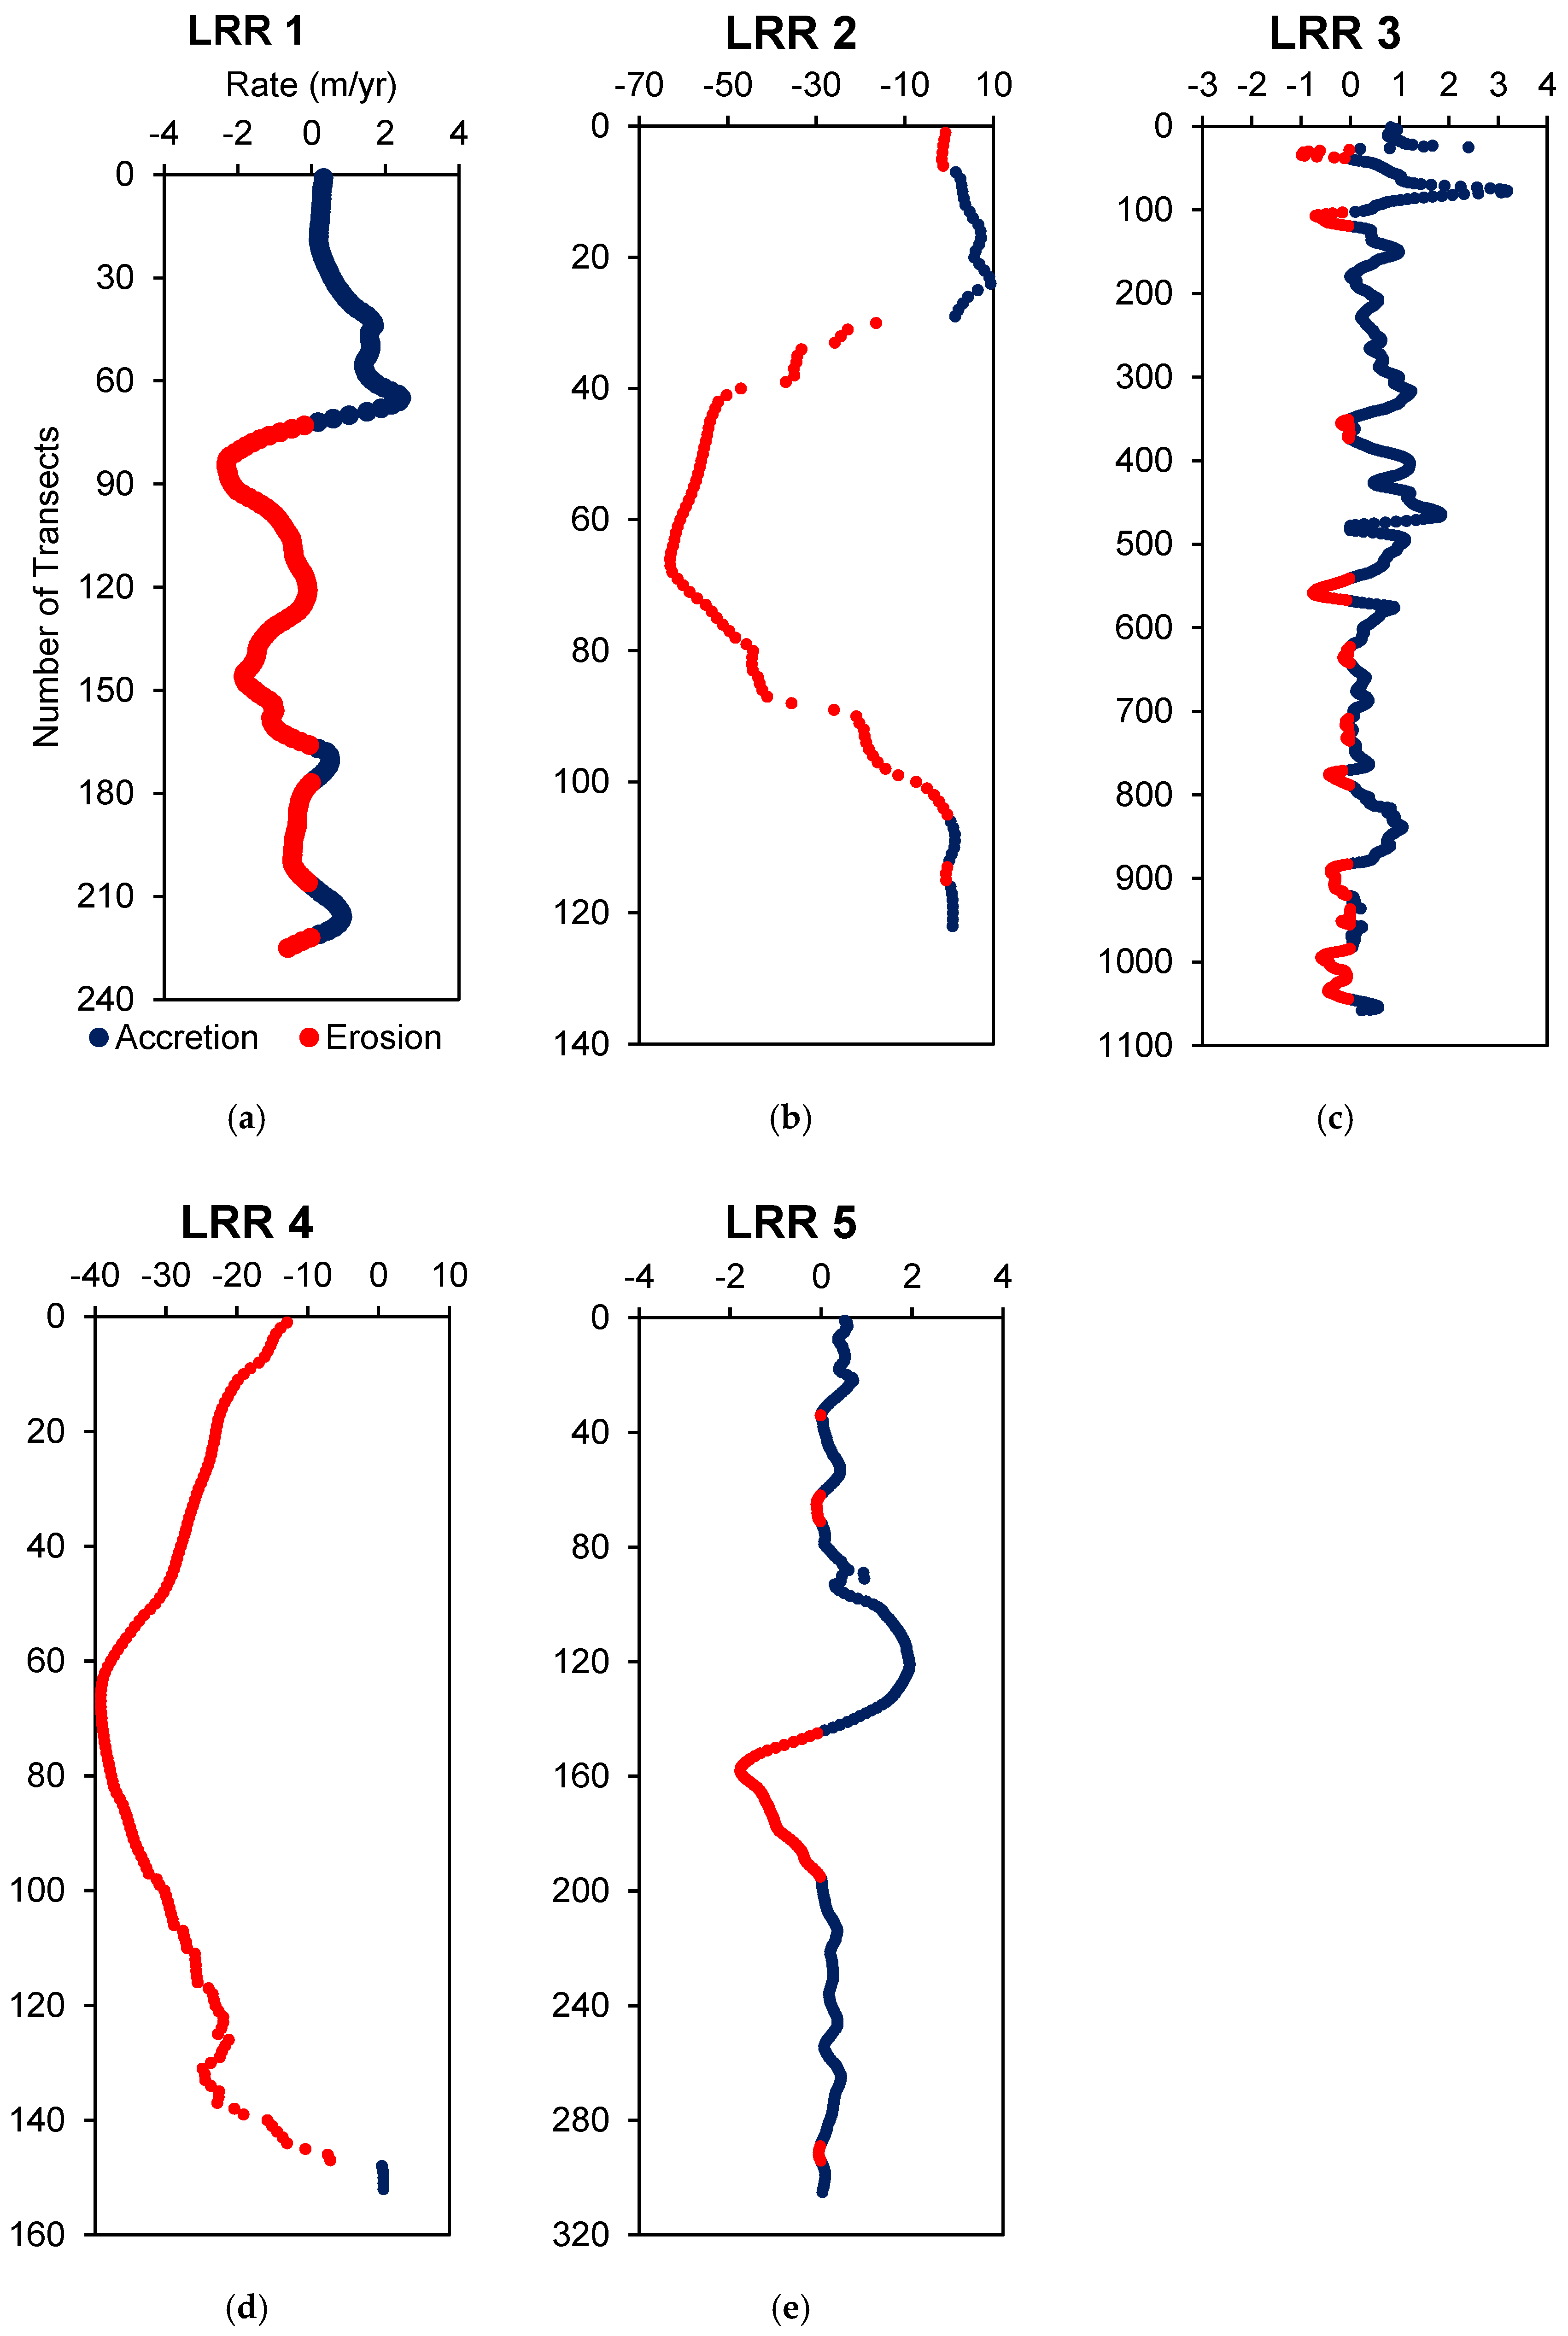
Figure A5.
The special event of the surge time in Aavatsmarkbreen induced the short-term area peak in 2015.
Figure A5.
The special event of the surge time in Aavatsmarkbreen induced the short-term area peak in 2015.
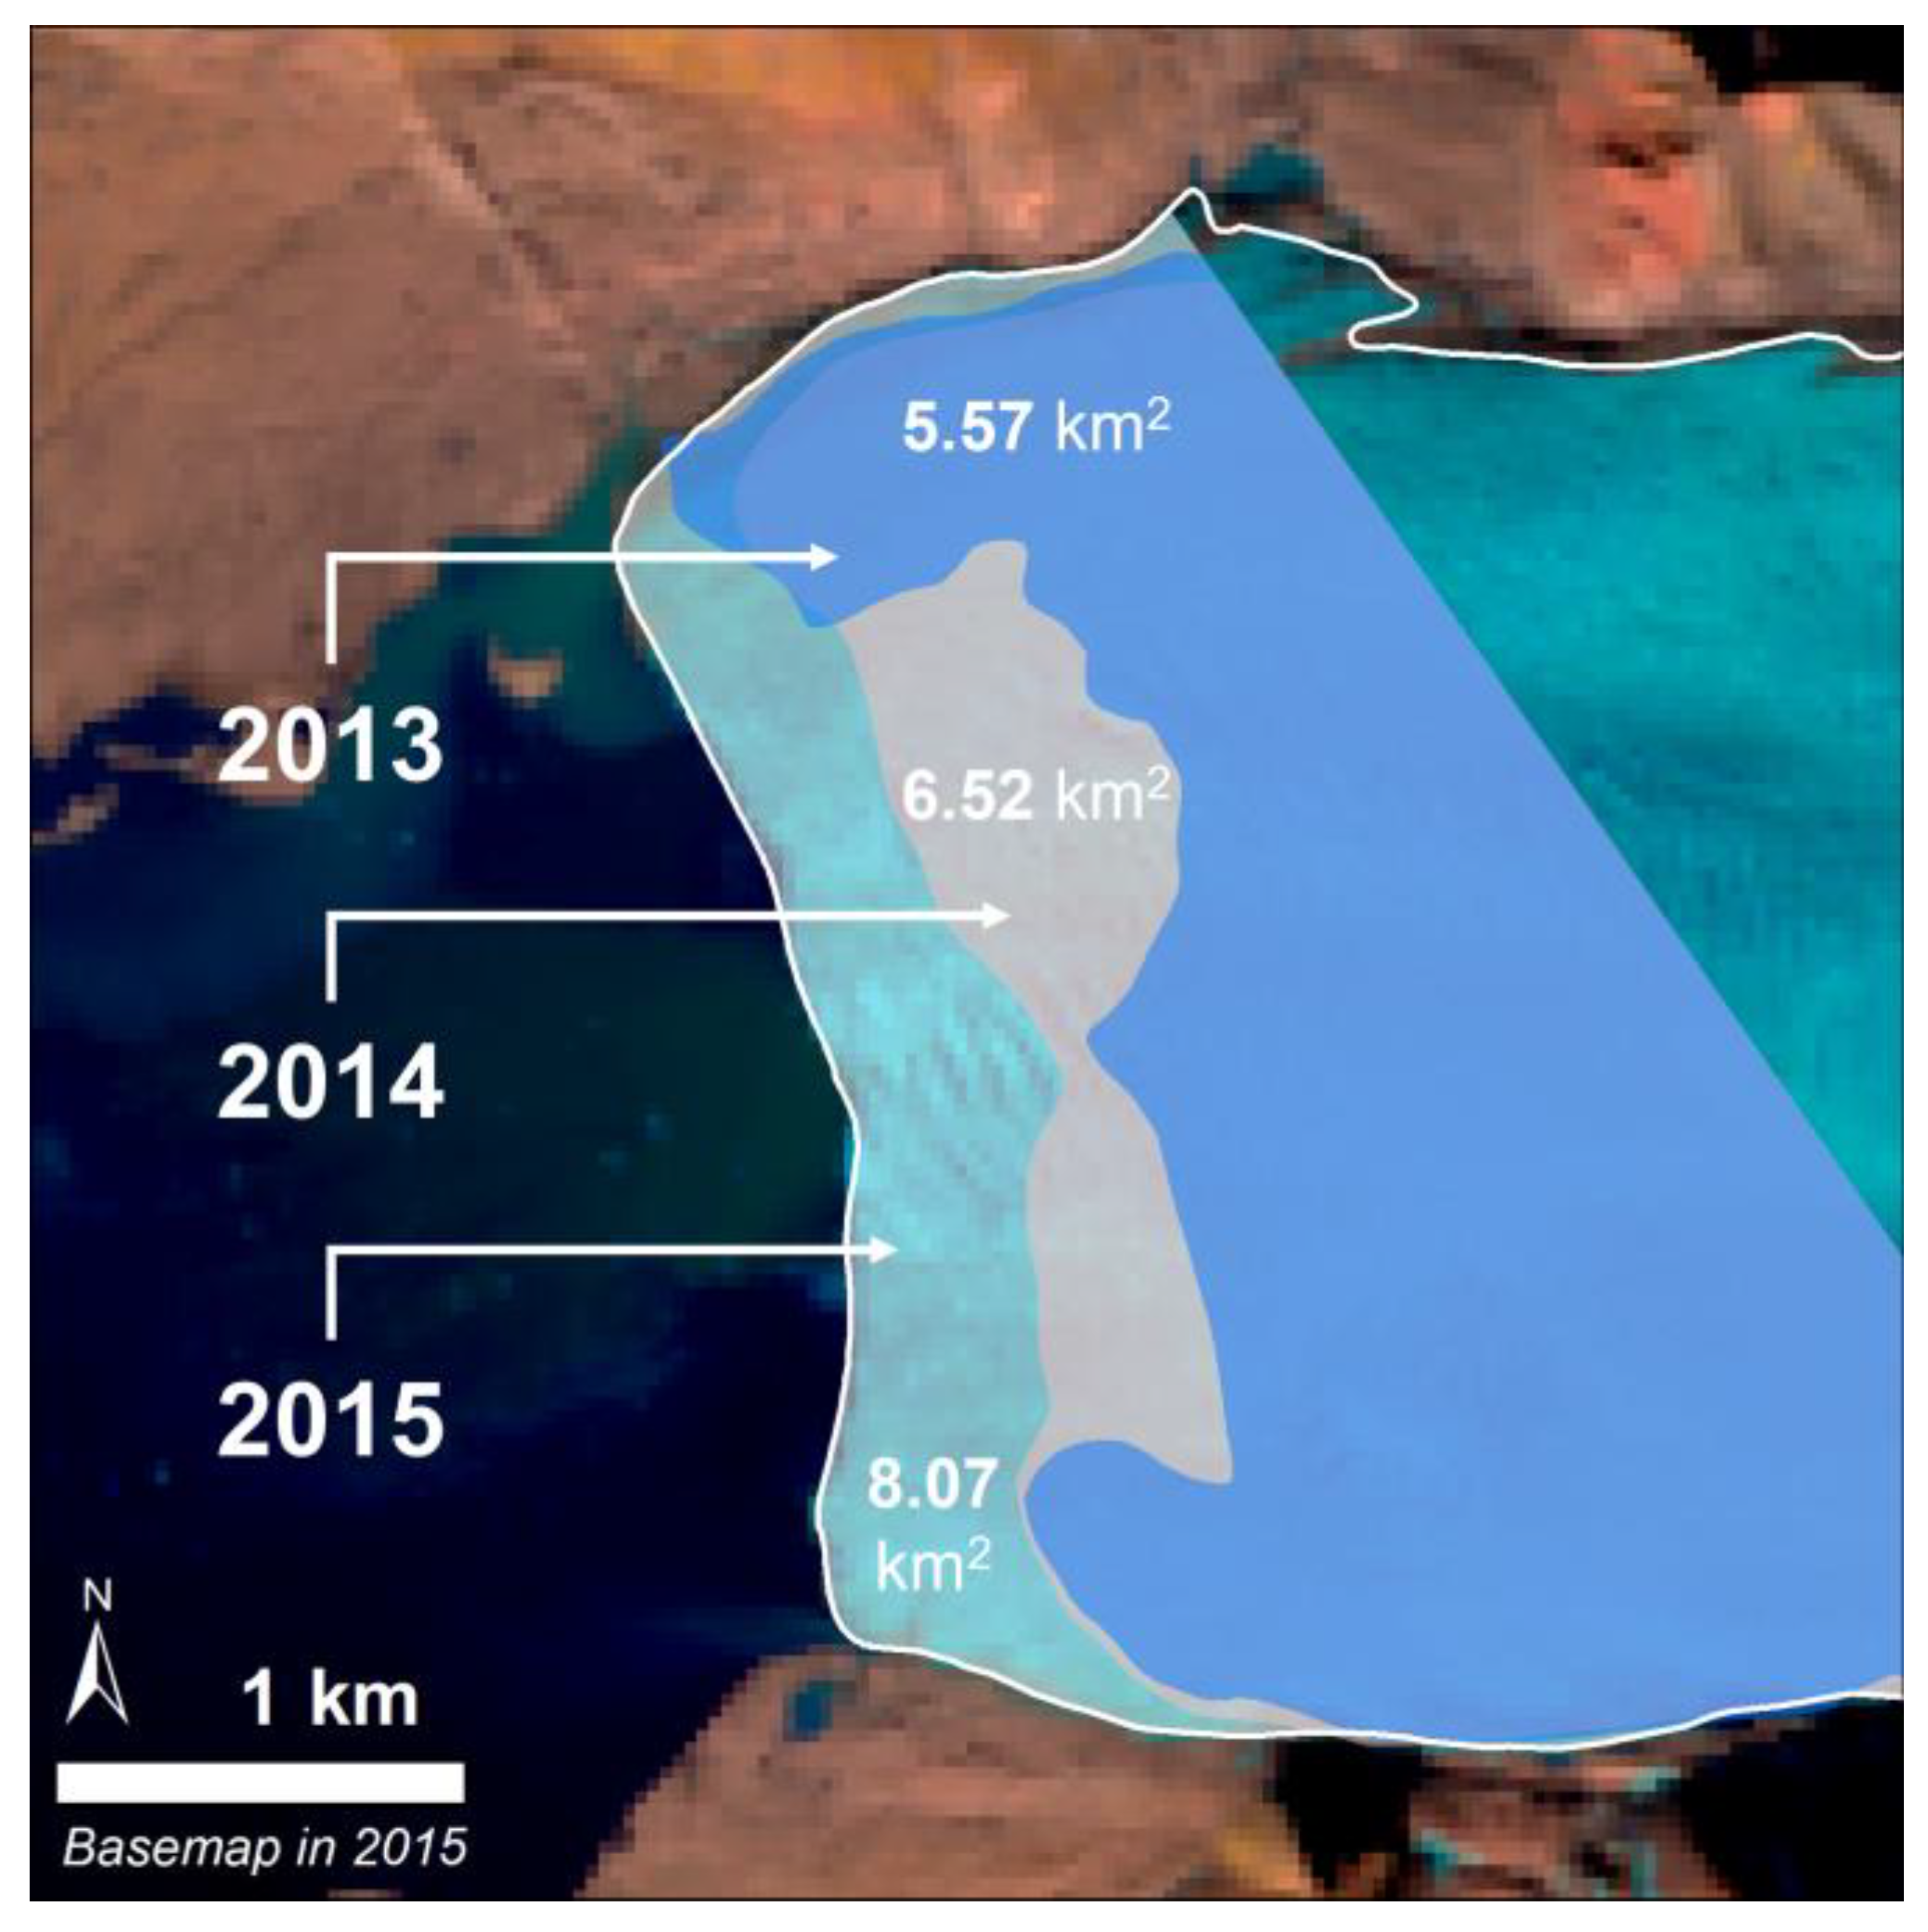
Figure A6.
The calculated loss of glacier terminus areas based on the reference line defined in 1985. In Aavatsmarkbreen, from 1987 – 2013, the area loss rate was 0.24 km2/year; from 2015 – 2023, the loss rate was 0.53 km2/year; and surge time from 2013 – 2015, the gain rate was 1.25 km2/year.
Figure A6.
The calculated loss of glacier terminus areas based on the reference line defined in 1985. In Aavatsmarkbreen, from 1987 – 2013, the area loss rate was 0.24 km2/year; from 2015 – 2023, the loss rate was 0.53 km2/year; and surge time from 2013 – 2015, the gain rate was 1.25 km2/year.
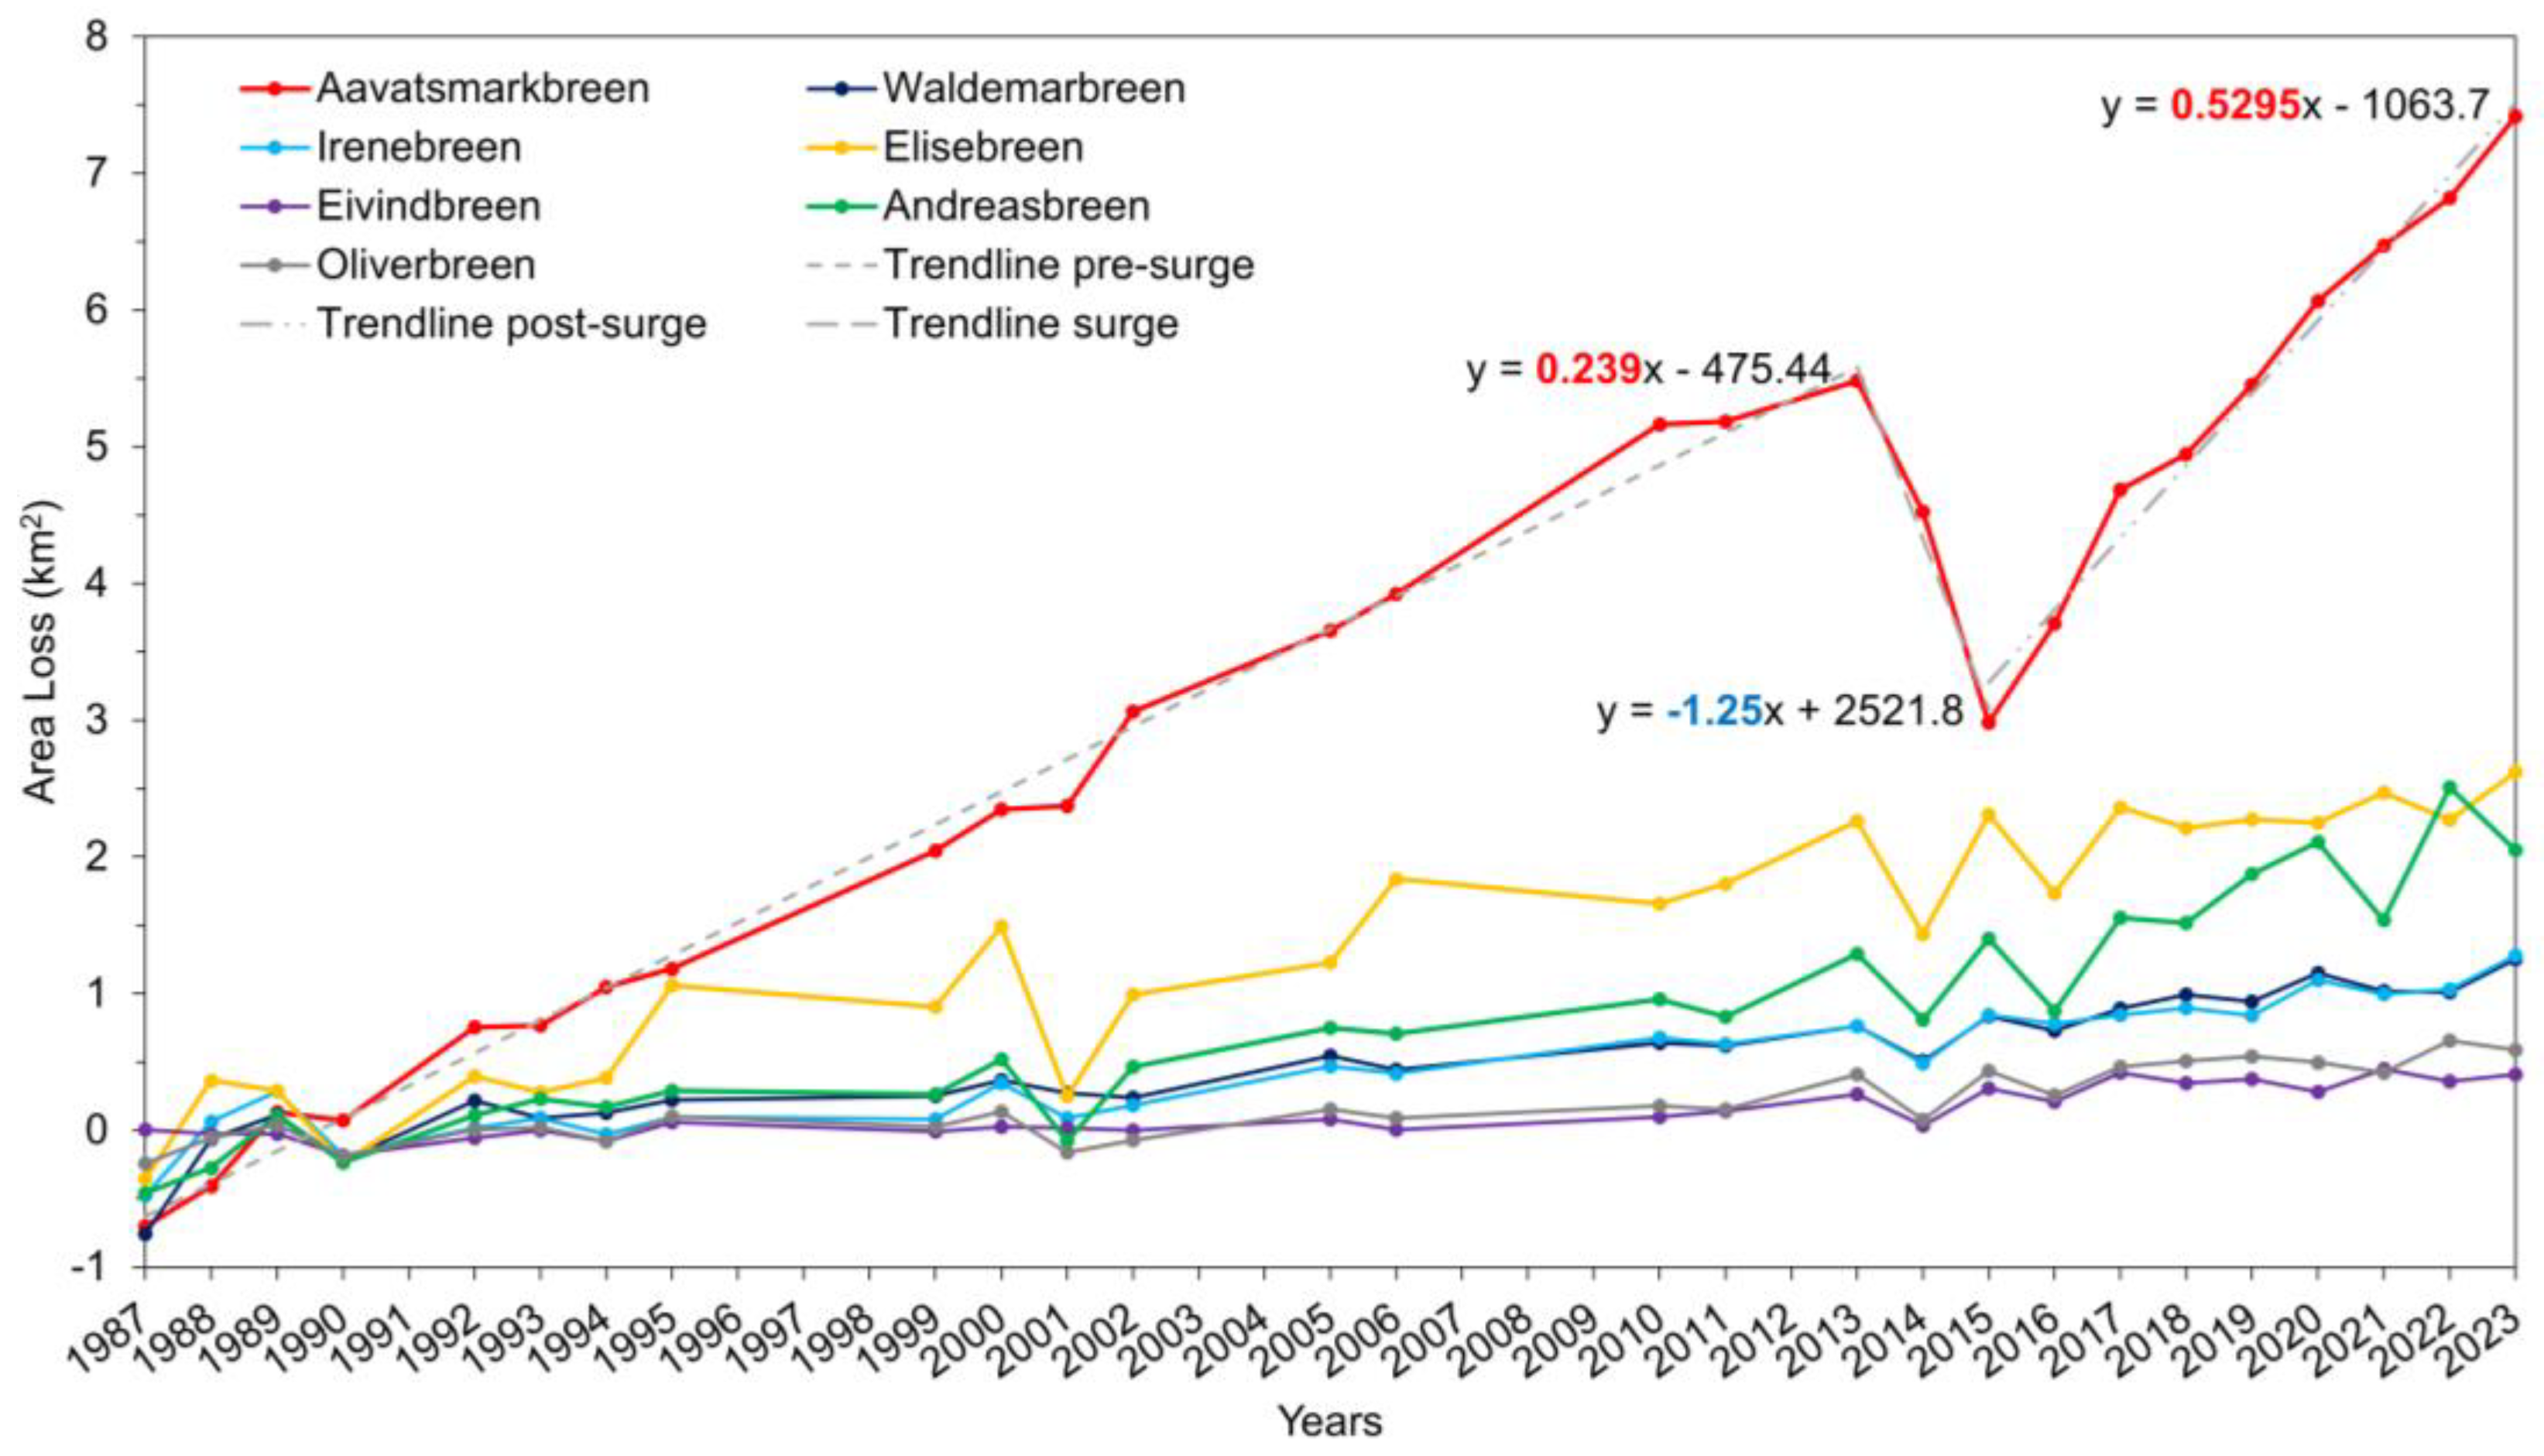
Figure A7.
The linear regression model for the long-term glacier retreats along the centerlines of the glaciers. The data points were collected by the intersection between the centerline and the glacier outlines: (a) Aavatsmarkbreen AA', (b) Aavatsmarkbreen BB’, (c) Aavatsmarkbreen CC’, (d) Waldemarbreen, (e) Elisebreen, (f) Irenebreen, (g) Eivindbreen, (h) Andreasbreen, and (j) Oliverbreen.
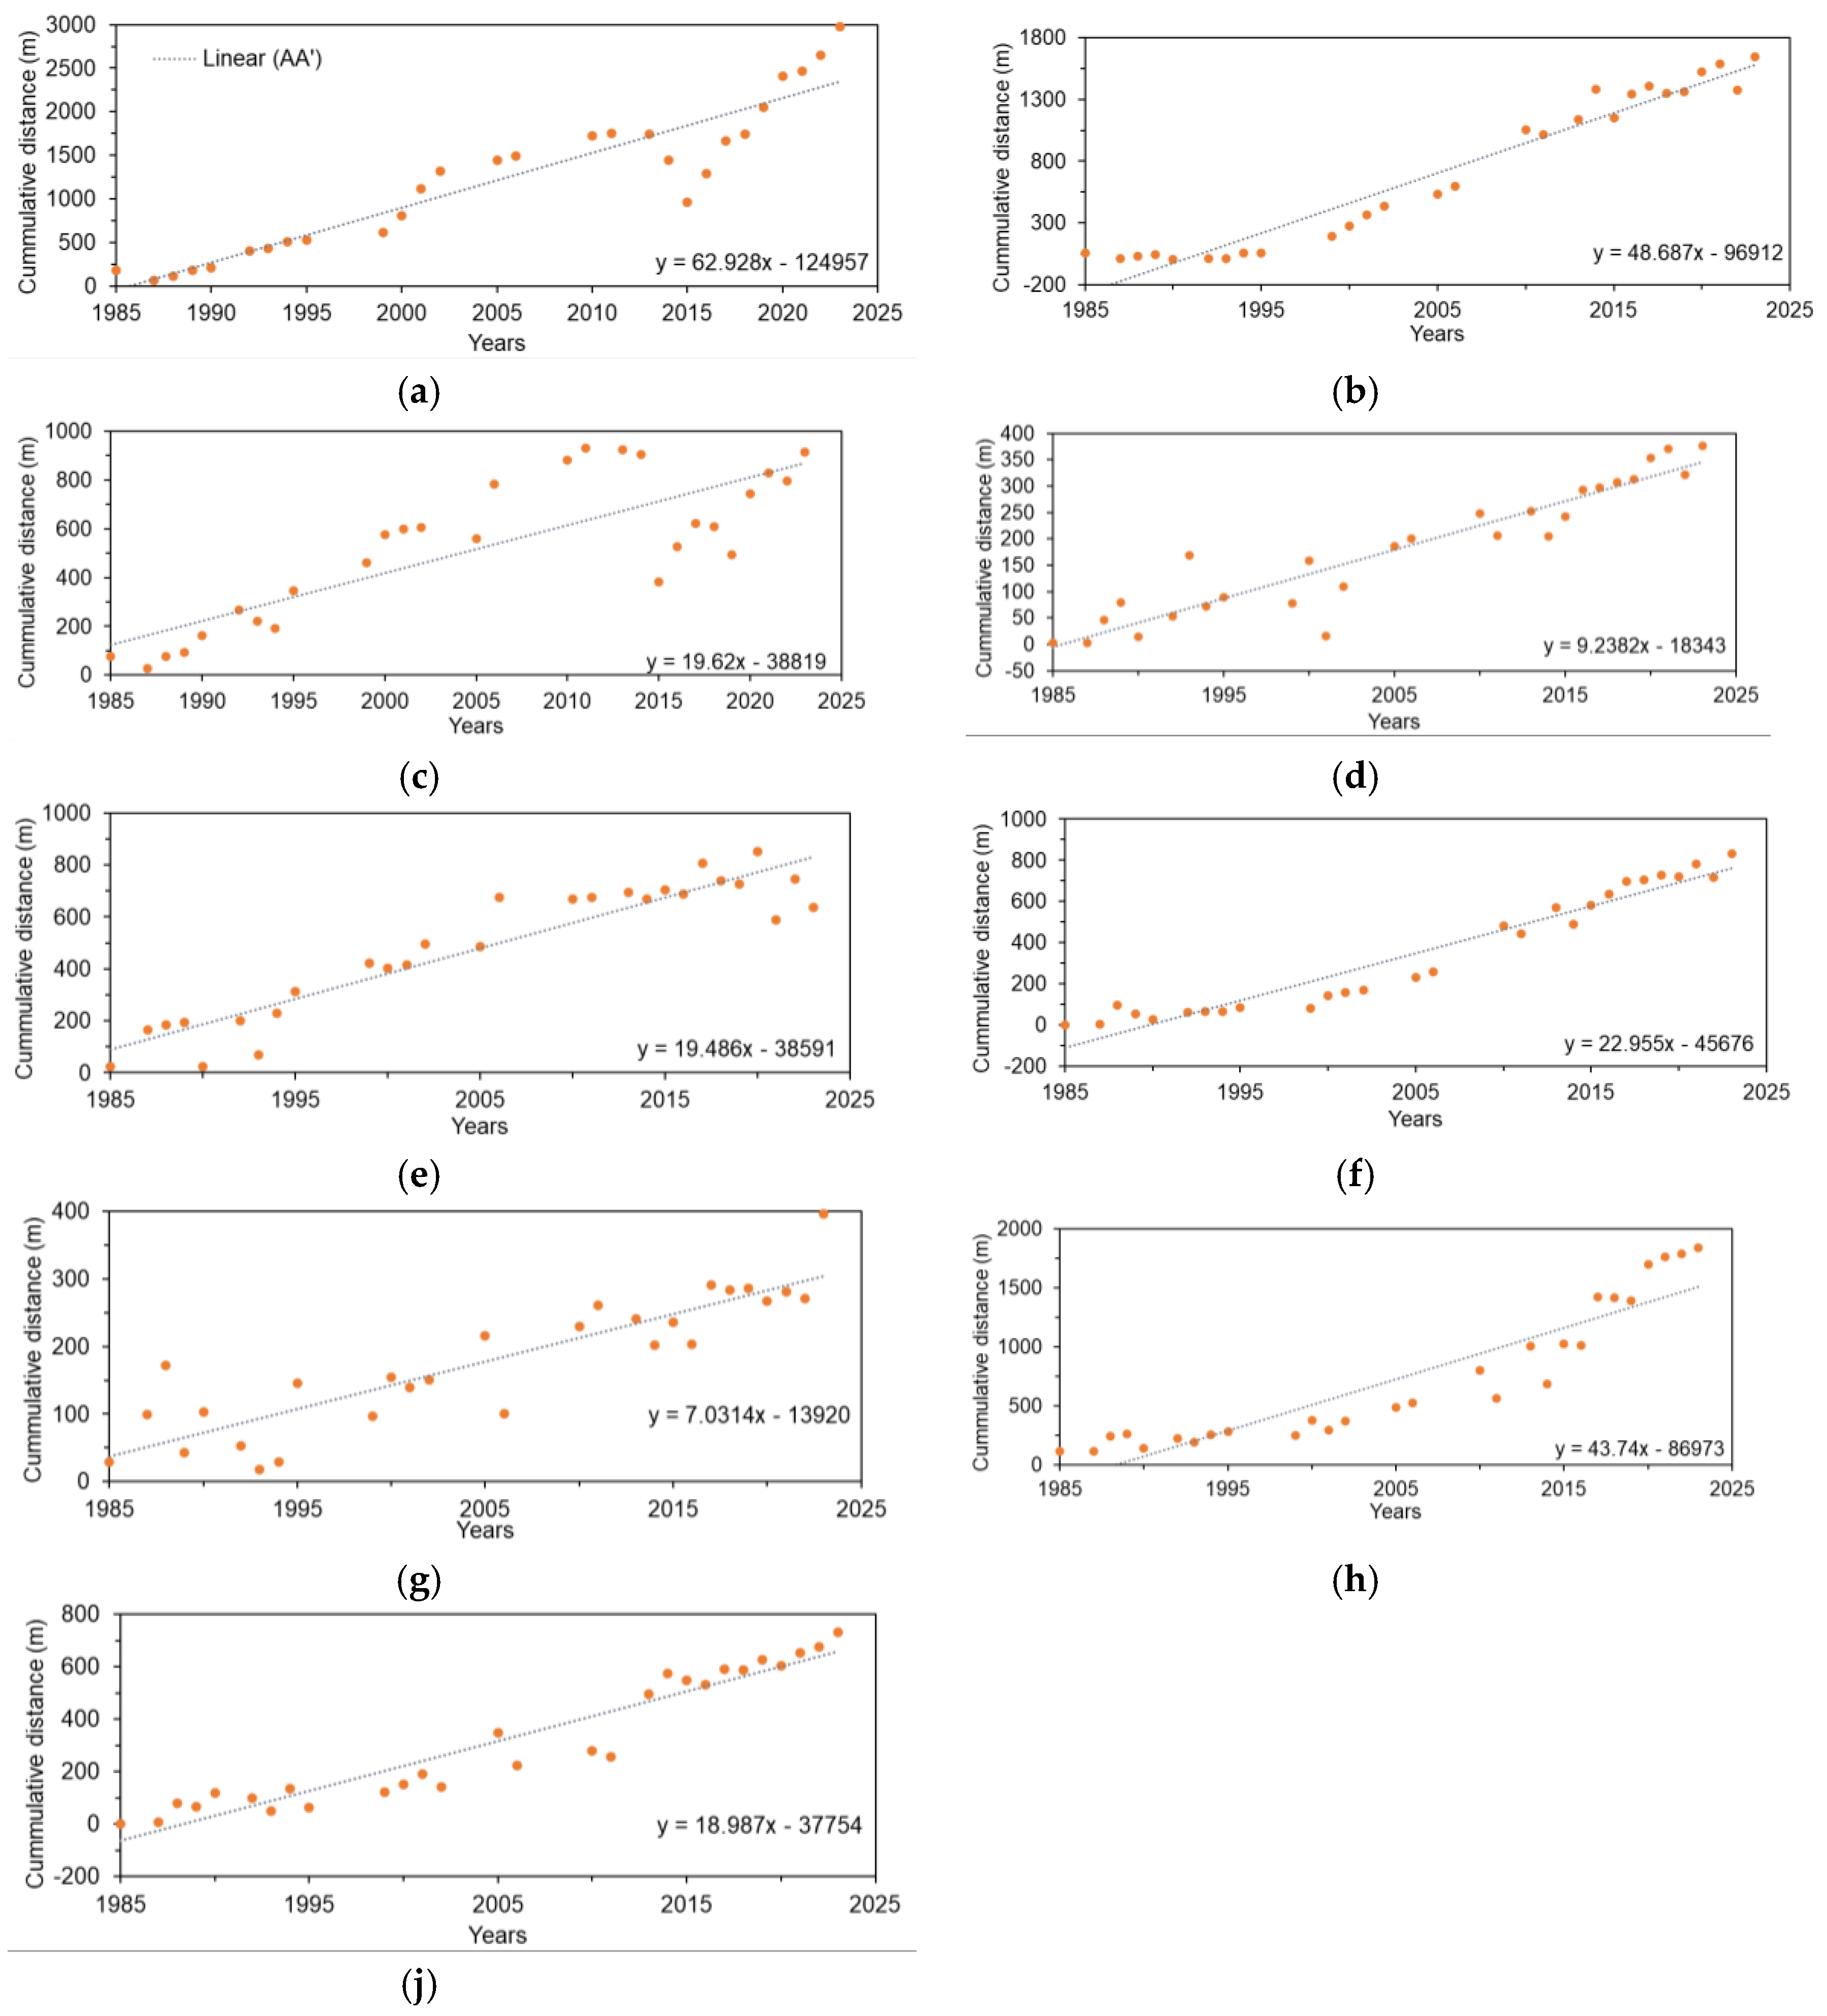

Table A1.
The estimated values of glacier remaining areas in different years.
| No. | Year | Remaining Area (km2) | ||||||
|---|---|---|---|---|---|---|---|---|
| Aavatsmark-breen | Waldemarbreen | Irenebreen | Elise-breen | Eivind-breen | Andreasbreen | Oliverbreen | ||
| 1 | 1985 | 11.05 | 2.77 | 3.30 | 7.49 | 1.56 | 4.60 | 1.04 |
| 2 | 1987 | 11.75 | 3.53 | 3.78 | 7.85 | 1.56 | 5.06 | 1.29 |
| 3 | 1988 | 11.46 | 2.84 | 3.24 | 7.13 | 1.59 | 4.88 | 1.10 |
| 4 | 1989 | 10.92 | 2.66 | 3.02 | 7.20 | 1.59 | 4.50 | 1.00 |
| 5 | 1990 | 10.98 | 2.99 | 3.48 | 7.73 | 1.75 | 4.84 | 1.23 |
| 6 | 1992 | 10.29 | 2.56 | 3.28 | 7.10 | 1.62 | 4.50 | 1.04 |
| 7 | 1993 | 10.28 | 2.68 | 3.21 | 7.22 | 1.56 | 4.37 | 1.02 |
| 8 | 1994 | 10.00 | 2.65 | 3.33 | 7.11 | 1.65 | 4.43 | 1.13 |
| 9 | 1995 | 9.87 | 2.55 | 3.20 | 6.43 | 1.50 | 4.32 | 0.94 |
| 10 | 1999 | 9.00 | 2.52 | 3.22 | 6.59 | 1.57 | 4.34 | 1.02 |
| 11 | 2000 | 8.70 | 2.41 | 2.96 | 6.00 | 1.54 | 4.08 | 0.91 |
| 12 | 2001 | 8.68 | 2.50 | 3.21 | 7.24 | 1.55 | 4.68 | 1.21 |
| 13 | 2002 | 7.99 | 2.53 | 3.12 | 6.50 | 1.56 | 4.14 | 1.11 |
| 14 | 2005 | 7.39 | 2.23 | 2.83 | 6.26 | 1.48 | 3.85 | 0.89 |
| 15 | 2006 | 7.12 | 2.33 | 2.89 | 5.65 | 1.56 | 3.90 | 0.95 |
| 16 | 2010 | 5.88 | 2.13 | 2.62 | 5.84 | 1.47 | 3.65 | 0.86 |
| 17 | 2011 | 5.87 | 2.16 | 2.67 | 5.69 | 1.42 | 3.77 | 0.89 |
| 18 | 2013 | 5.57 | 2.01 | 2.54 | 5.23 | 1.30 | 3.31 | 0.64 |
| 19 | 2014 | 6.52 | 2.27 | 2.81 | 6.06 | 1.53 | 3.79 | 0.97 |
| 20 | 2015 | 8.07 | 1.94 | 2.46 | 5.18 | 1.26 | 3.20 | 0.61 |
| 21 | 2016 | 7.34 | 2.04 | 2.52 | 5.76 | 1.35 | 3.73 | 0.79 |
| 22 | 2017 | 6.36 | 1.88 | 2.46 | 5.13 | 1.14 | 3.05 | 0.58 |
| 23 | 2018 | 6.10 | 1.78 | 2.41 | 5.28 | 1.22 | 3.09 | 0.54 |
| 24 | 2019 | 5.60 | 1.83 | 2.46 | 5.22 | 1.19 | 2.73 | 0.50 |
| 25 | 2020 | 4.98 | 1.62 | 2.20 | 5.24 | 1.28 | 2.50 | 0.55 |
| 26 | 2021 | 4.58 | 1.76 | 2.31 | 5.02 | 1.12 | 3.07 | 0.62 |
| 27 | 2022 | 4.23 | 1.76 | 2.27 | 5.22 | 1.20 | 2.10 | 0.39 |
| 28 | 2023 | 3.63 | 1.52 | 2.02 | 4.87 | 1.16 | 2.56 | 0.46 |
Table A2.
The calculated values of outwash remaining areas in different years.
| No. | Year | Outwash Area (km2) | ||
|---|---|---|---|---|
| Outwash 1 | Outwash 2 | Outwash 3 | ||
| 1 | 1985 | 3.29 | 12.75 | 6.56 |
| 2 | 1986 | 3.43 | 12.69 | 6.16 |
| 3 | 1987 | 2.99 | 11.3 | 5.62 |
| 4 | 1988 | 3.13 | 11.21 | 5.67 |
| 5 | 1989 | 3.18 | 11.1 | 5.73 |
| 6 | 1992 | 3.24 | 10.8 | 5.68 |
| 7 | 1993 | 3.33 | 12.35 | 5.4 |
| 8 | 1994 | 2.84 | 11.17 | 5.16 |
| 9 | 2000 | 2.95 | 11.94 | 5.53 |
| 10 | 2002 | 3.22 | 11.95 | 5.51 |
| 11 | 2013 | 2.85 | 11.23 | 5.88 |
| 12 | 2014 | 3.14 | 11.17 | 5.48 |
| 13 | 2015 | 3.05 | 11.65 | 6.07 |
| 14 | 2016 | 3.52 | 13.21 | 6.6 |
| 15 | 2017 | 3.43 | 13.44 | 6.23 |
| 16 | 2018 | 3.38 | 13.08 | 6.11 |
| 17 | 2019 | 3.63 | 13.71 | 6.69 |
| 18 | 2020 | 3.16 | 13.38 | 6.76 |
| 19 | 2021 | 3.19 | 13.78 | 6.82 |
| 20 | 2022 | 2.99 | 13.4 | 7.1 |
| 21 | 2023 | 2.86 | 13.6 | 7.19 |
Table A3.
The setup parameters for conducting DSAS.
| No. | Transect in Zone | Transect interval (m) | Smoothing (m) | Uncertainty value (m) |
|---|---|---|---|---|
| 1. 1 | 2. 1 | 3. 20 | 4. 500 | 5. 21.2 |
| 6. 2 | 7. 2 | 8. 20 | 9. 500 | 10. 21.2 |
| 11. 3 | 12. 3 | 13. 20 | 14. 500 | 15. 21.2 |
| 16. 4 | 17. 4 | 18. 20 | 19. 500 | 20. 21.2 |
| 21. 5 | 22. 5 | 23. 20 | 24. 500 | 25. 21.2 |
References
- Serreze, M.C.; Barry, R.G. Processes and impacts of Arctic amplification: A research synthesis. Global and planetary change 2011, 77, 85-96. [CrossRef]
- Rantanen, M.; Karpechko, A.Y.; Lipponen, A.; Nordling, K.; Hyvärinen, O.; Ruosteenoja, K.; Vihma, T.; Laaksonen, A. The Arctic has warmed nearly four times faster than the globe since 1979. Communications Earth & Environment 2022, 3, 168. [CrossRef]
- Comiso, J.C. Arctic warming signals from satellite observations. Weather 2006, 61. [CrossRef]
- Box, J.E.; Colgan, W.T.; Christensen, T.R.; Schmidt, N.M.; Lund, M.; Parmentier, F.-J.W.; Brown, R.; Bhatt, U.S.; Euskirchen, E.S.; Romanovsky, V.E. Key indicators of Arctic climate change: 1971–2017. Environmental Research Letters 2019, 14, 045010. [CrossRef]
- Blaschke, T.; Lang, S.; Lorup, E.; Strobl, J.; Zeil, P. Object-oriented image processing in an integrated GIS/remote sensing environment and perspectives for environmental applications. Environmental information for planning, politics and the public 2000, 2, 555-570.
- Benz, U.C.; Hofmann, P.; Willhauck, G.; Lingenfelder, I.; Heynen, M. Multi-resolution, object-oriented fuzzy analysis of remote sensing data for GIS-ready information. ISPRS Journal of photogrammetry and remote sensing 2004, 58, 239-258. [CrossRef]
- Yao, H.; Qin, R.; Chen, X. Unmanned aerial vehicle for remote sensing applications—A review. Remote Sensing 2019, 11, 1443. [CrossRef]
- Milewski, A.; Sultan, M.; Yan, E.; Becker, R.; Abdeldayem, A.; Soliman, F.; Gelil, K.A. A remote sensing solution for estimating runoff and recharge in arid environments. Journal of Hydrology 2009, 373, 1-14. [CrossRef]
- Nitze, I.; Grosse, G.; Jones, B.M.; Romanovsky, V.E.; Boike, J. Remote sensing quantifies widespread abundance of permafrost region disturbances across the Arctic and Subarctic. Nature communications 2018, 9, 5423. [CrossRef]
- Vos, K.; Harley, M.D.; Turner, I.L.; Splinter, K.D. Pacific shoreline erosion and accretion patterns controlled by El Niño/Southern Oscillation. Nature Geoscience 2023, 16, 140-146. [CrossRef]
- Murray, J.; Adam, E.; Woodborne, S.; Miller, D.; Xulu, S.; Evans, M. Monitoring shoreline changes along the southwestern coast of South Africa from 1937 to 2020 using varied remote sensing data and approaches. Remote Sensing 2023, 15, 317. [CrossRef]
- Khazendar, A.; Schodlok, M.; Fenty, I.; Ligtenberg, S.; Rignot, E.; van den Broeke, M. Observed thinning of Totten Glacier is linked to coastal polynya variability. Nature Communications 4 2013, 1, 2857. [CrossRef]
- Akpoti, K.; Dembélé, M.; Forkuor, G.; Obuobie, E.; Mabhaudhi, T.; Cofie, O. Integrating GIS and remote sensing for land use/land cover mapping and groundwater potential assessment for climate-smart cocoa irrigation in Ghana. Scientific Reports 2023, 13, 16025. [CrossRef]
- Mansourmoghaddam, M.; Rousta, I.; Zamani, M.; Olafsson, H. Investigating and predicting Land Surface Temperature (LST) based on remotely sensed data during 1987–2030 (A case study of Reykjavik city, Iceland). Urban Ecosystems 2023, 26, 337-359. [CrossRef]
- Bokhari, R.; Shu, H.; Tariq, A.; Al-Ansari, N.; Guluzade, R.; Chen, T.; Jamil, A.; Aslam, M. Land subsidence analysis using synthetic aperture radar data. Heliyon 2023, 9. [CrossRef]
- Ferrigno, J.G.; Richard jr, S. Satellite image atlas of glaciers of the world; US Government Printing Office: U.S. Geological Survey, 1988.
- Sobota, I.; Brombley, T.; Kużdrzał, C. Atlas of Changes in the Glaciers of Kaffiøyra:(Svalbard, the Arctic); Nicolaus Copernicus University Press: 2021.
- Fraser, A. On the front lines of climate change in the world's northernmost town. Reuters 2019.
- Piechura, J.; Walczowski, W. Warming of the West Spitsbergen Current and sea ice north of Svalbard. Oceanologia 2009, 51, 147-164. [CrossRef]
- Nordli, Ø.; Przybylak, R.; Ogilvie, A.E.; Isaksen, K. Long-term temperature trends and variability on Spitsbergen: the extended Svalbard Airport temperature series, 1898–2012. Polar research 2014, 33, 21349. [CrossRef]
- Sobota, I.; Lankauf, K.R. Recession of Kaffiøyra region glaciers, Oscar II land, Svalbard. Bulletin of Geography. Physical Geography Series 2010, 27-45. [CrossRef]
- Sobota, I.; Nowak, M.; Weckwerth, P. Long-term changes of glaciers in north-western Spitsbergen. Global and Planetary Change 2016, 144, 182-197. [CrossRef]
- Sobota, I. The near-surface ice thermal structure of the Waldemarbreen, Svalbard. Polish Polar Research 2009, 30. [CrossRef]
- Sobota, I. Snow accumulation, melt, mass loss, and the near-surface ice temperature structure of Irenebreen, Svalbard. Polar Science 2011, 5, 327-336. [CrossRef]
- Araźny, A.; Przybylak, R.; Kejna, M. Ground temperature changes on the Kaffiøyra Plain (Spitsbergen) in the summer seasons, 1975–2014. Polish Polar Research 2016, 1-21-21-21. [CrossRef]
- Sobota, I.; Nowak, M. Changes in the dynamics and thermal regime of the permafrost and active layer of the high arctic coastal area in north-west spitsbergen, svalbard. Geografiska Annaler: Series A, Physical Geography 2014, 96, 227-240. [CrossRef]
- Sobota, I.; Weckwerth, P.; Grajewski, T.; Dziembowski, M.; Greń, K.; Nowak, M. Short-term changes in thickness and temperature of the active layer in summer in the Kaffiøyra region, NW Spitsbergen, Svalbard. Catena 2018, 160, 141-153. [CrossRef]
- Lantuit, H.; Overduin, P.P.; Couture, N.; Wetterich, S.; Aré, F.; Atkinson, D.; Brown, J.; Cherkashov, G.; Drozdov, D.; Forbes, D.L. The Arctic coastal dynamics database: A new classification scheme and statistics on Arctic permafrost coastlines. Estuaries and Coasts 2012, 35, 383-400. [CrossRef]
- Overduin, P.P.; Strzelecki, M.C.; Grigoriev, M.N.; Couture, N.; Lantuit, H.; St-Hilaire-Gravel, D.; Günther, F.; Wetterich, S. Coastal changes in the Arctic. Geological Society, London, Special Publications 2014, 388, 103-129. [CrossRef]
- Irrgang, A.M.; Bendixen, M.; Farquharson, L.M.; Baranskaya, A.V.; Erikson, L.H.; Gibbs, A.E.; Ogorodov, S.A.; Overduin, P.P.; Lantuit, H.; Grigoriev, M.N. Drivers, dynamics and impacts of changing Arctic coasts. Nature Reviews Earth & Environment 2022, 3, 39-54. [CrossRef]
- Mercier, D.; Laffly, D. Actual paraglacial progradation of the coastal zone in the Kongsfjorden area, western Spitsbergen (Svalbard). Geological Society, London, Special Publications 2005, 242, 111-117. [CrossRef]
- Kowalska, A.; Sroka, W. Sedimentary environment of the Nottinghambukta delta, SW Spitsbergen. Polish Polar Research 2008, 29, 245-259.
- Zagórski, P. Shoreline dynamics of Calypsostranda (NW Wedel Jarlsberg Land, Svalbard) during the last century. Polish Polar Research 2011, 67-99. [CrossRef]
- Sessford, E.G.; Bæverford, M.G.; Hormes, A. Terrestrial processes affecting unlithified coastal erosion disparities in central fjords of Svalbard. Polar Research 2015, 34, 24122. [CrossRef]
- Strzelecki, M.C.; Long, A.J.; Lloyd, J.M. Post-Little Ice Age development of a High Arctic paraglacial beach complex. Permafrost and Periglacial Processes 2017, 28, 4-17. [CrossRef]
- Bourriquen, M.; Mercier, D.; Baltzer, A.; Fournier, J.; Costa, S.; Roussel, E. Paraglacial coasts responses to glacier retreat and associated shifts in river floodplains over decadal timescales (1966–2016), Kongsfjorden, Svalbard. Land Degradation & Development 2018, 29, 4173-4185. [CrossRef]
- Zagórski, P.; Jarosz, K.; Superson, J. Integrated assessment of shoreline change along the Calypsostranda (Svalbard) from remote sensing, field survey and GIS. Marine Geodesy 2020, 43, 433-471. [CrossRef]
- Weckwerth, P.; Greń, K.; Sobota, I. Controls on downstream variation in surficial sediment size of an outwash braidplain developed under high Arctic conditions (Kaffiøyra, Svalbard). Sedimentary geology 2019, 387, 75-86. [CrossRef]
- Weckwerth, P.; Sobota, I.; Greń, K. Where will widening occur in an outwash braidplain? A new approach to detecting controls on fluvial lateral erosion in a glacierized catchment (north-western Spitsbergen, Svalbard). Earth Surface Processes and Landforms 2021, 46, 942-967. [CrossRef]
- Kowalska, J.B.; Nicia, P.; Gąsiorek, M.; Zadrożny, P.; Węgrzyn, M.H.; Waroszewski, J. Are natural or anthropogenic factors influencing potentially toxic elements' enrichment in soils in proglacial zones? An example from Kaffiøyra (Oscar II Land, Spitsbergen). International Journal of Environmental Research and Public Health 2022, 19, 13703. [CrossRef]
- Borysiak, J.; Grześ, M.; Pulina, M.; Szpikowska, G. Hydrogeochemical and biogeochemical processes in Kaffiøyra River catchments (Spitsbergen, Norway). Quaestiones Geographicae 2015, 34, 111-124. [CrossRef]
- Jaworski, T.; Chutkowski, K. Genesis, morphology, age and distribution of cryogenic mounds on Kaffiøyra and Hermansenøya, Northwest Svalbard. Permafrost and Periglacial Processes 2015, 26, 304-320. [CrossRef]
- Sobota, I. Changes in dynamics and runoff from the High Arctic glacial catchment of Waldemarbreen, Svalbard. Geomorphology 2014, 212, 16-27. [CrossRef]
- Przybylak, R.; Kejna, M.; Arazny, A. Air temperature and precipitation changes in the Kaffioyra region (NW Spitsbergen) from 1975 to 2010. Papers on Global Change 2011.
- Roy, D.P.; Wulder, M.A.; Loveland, T.R.; Woodcock, C.E.; Allen, R.G.; Anderson, M.C.; Helder, D.; Irons, J.R.; Johnson, D.M.; Kennedy, R. Landsat-8: Science and product vision for terrestrial global change research. Remote sensing of Environment 2014, 145, 154-172. [CrossRef]
- Daniels, R.C. Using ArcMap to extract shorelines from Landsat TM & ETM+ data. In Proceedings of the 32nd ESRI International Users Conference, San Diego, CA, USA, 2012; pp. 23-27.
- Thieler, E.R.; Himmelstoss, E.A.; Zichichi, J.L.; Ergul, A. The Digital Shoreline Analysis System (DSAS) version 4.0-an ArcGIS extension for calculating shoreline change; 2331-1258; US Geological Survey: 2009.
- Himmelstoss, E.; Henderson, R.E.; Kratzmann, M.G.; Farris, A.S. Digital shoreline analysis system (DSAS) version 5.0 user guide; 2331-1258; US Geological Survey: Reston, VA, 2018.
- Leatherman, S.; Clow, B. UMD shoreline mapping project. IEEE Geoscience and Remote Sensing Society Newsletter 1983, 22, 5-8.
- Dolan, R.; Fenster, M.S.; Holme, S.J. Temporal analysis of shoreline recession and accretion. Journal of coastal research 1991, 723-744. https://www.jstor.org/stable/4297888.
- Crowell, M.; Douglas, B.C.; Leatherman, S.P. On forecasting future US shoreline positions: a test of algorithms. Journal of Coastal Research 1997, 1245-1255. https://www.jstor.org/stable/4298734.
- Storey, J.; Choate, M.; Lee, K. Landsat 8 operational land imager on-orbit geometric calibration and performance. Remote sensing 2014, 6, 11127-11152. [CrossRef]
- Paprota, M.; Majewski, D.; Sulisz, W.; Szmytkiewicz, M.; Reda, A. Effects of climate changes on coastal erosion in Svalbard. In Proceedings of the Proceedings of the 7th International Short Course and Conference on Applied Coastal Research Ŕ SCACR, 2016; pp. 499-508.
- Overeem, I.; Anderson, R.S.; Wobus, C.W.; Clow, G.D.; Urban, F.E.; Matell, N. Sea ice loss enhances wave action at the Arctic coast. Geophysical Research Letters 2011, 38. [CrossRef]
- Alesheikh, A.A.; Ghorbanali, A.; Nouri, N. Coastline change detection using remote sensing. International Journal of Environmental Science & Technology 2007, 4, 61-66. [CrossRef]
- Boak, E.H.; Turner, I.L. Shoreline definition and detection: a review. Journal of coastal research 2005, 21, 688-703. [CrossRef]
- Ruggiero, P.; Kratzmann, M.G.; Himmelstoss, E.A.; Reid, D.; Allan, J.; Kaminsky, G. National assessment of shoreline change: historical shoreline change along the Pacific Northwest coast; US Geological Survey: 2013.
- Grześ, M.; Król, M.; Sobota, I. Submarine evidence of the Aavatsmark and Dahl Glaciers fluctuations in the Kaffiøyra region, NW Spitsbergen. Polish Polar Research 2009, 143-160-143-160.
- Sobota, I.; Weckwerth, P.; Nowak, M. Surge dynamics of Aavatsmarkbreen, Svalbard, inferred from the geomorphological record. Boreas 2016, 45, 360-376. [CrossRef]
- Sevestre, H.; Benn, D.I.; Luckman, A.; Nuth, C.; Kohler, J.; Lindbäck, K.; Pettersson, R. Tidewater glacier surges initiated at the terminus. Journal of Geophysical Research: Earth Surface 2018, 123, 1035-1051. [CrossRef]
- Przybylak, R. Recent air-temperature changes in the Arctic. Annals of Glaciology 2007, 46, 316-324.
- Walsh, J.E.; Overland, J.E.; Groisman, P.Y.; Rudolf, B. Ongoing climate change in the Arctic. Ambio 2011, 40, 6-16. [CrossRef]
- Kejna, M.; Sobota, I. Meteorological conditions on Kaffiøyra (NW Spitsbergen) in 2013–2017 and their connection with atmospheric circulation and sea ice extent. Polish Polar Research 2019, 40, 175-204. [CrossRef]
- Altman, E.I. Financial ratios, discriminant analysis and the prediction of corporate bankruptcy. The journal of finance 1968, 23, 589-609. [CrossRef]
- Sedgwick, P. Pearson's correlation coefficient. Bmj 2012, 345. [CrossRef]
Figure 1.
Kaffiøyra is the study area located in southwest Svalbard (red square). The study focuses on three landforms: shoreline (white line), glacier termini (blue polygon), and outwash areas (green polygon).
Figure 1.
Kaffiøyra is the study area located in southwest Svalbard (red square). The study focuses on three landforms: shoreline (white line), glacier termini (blue polygon), and outwash areas (green polygon).
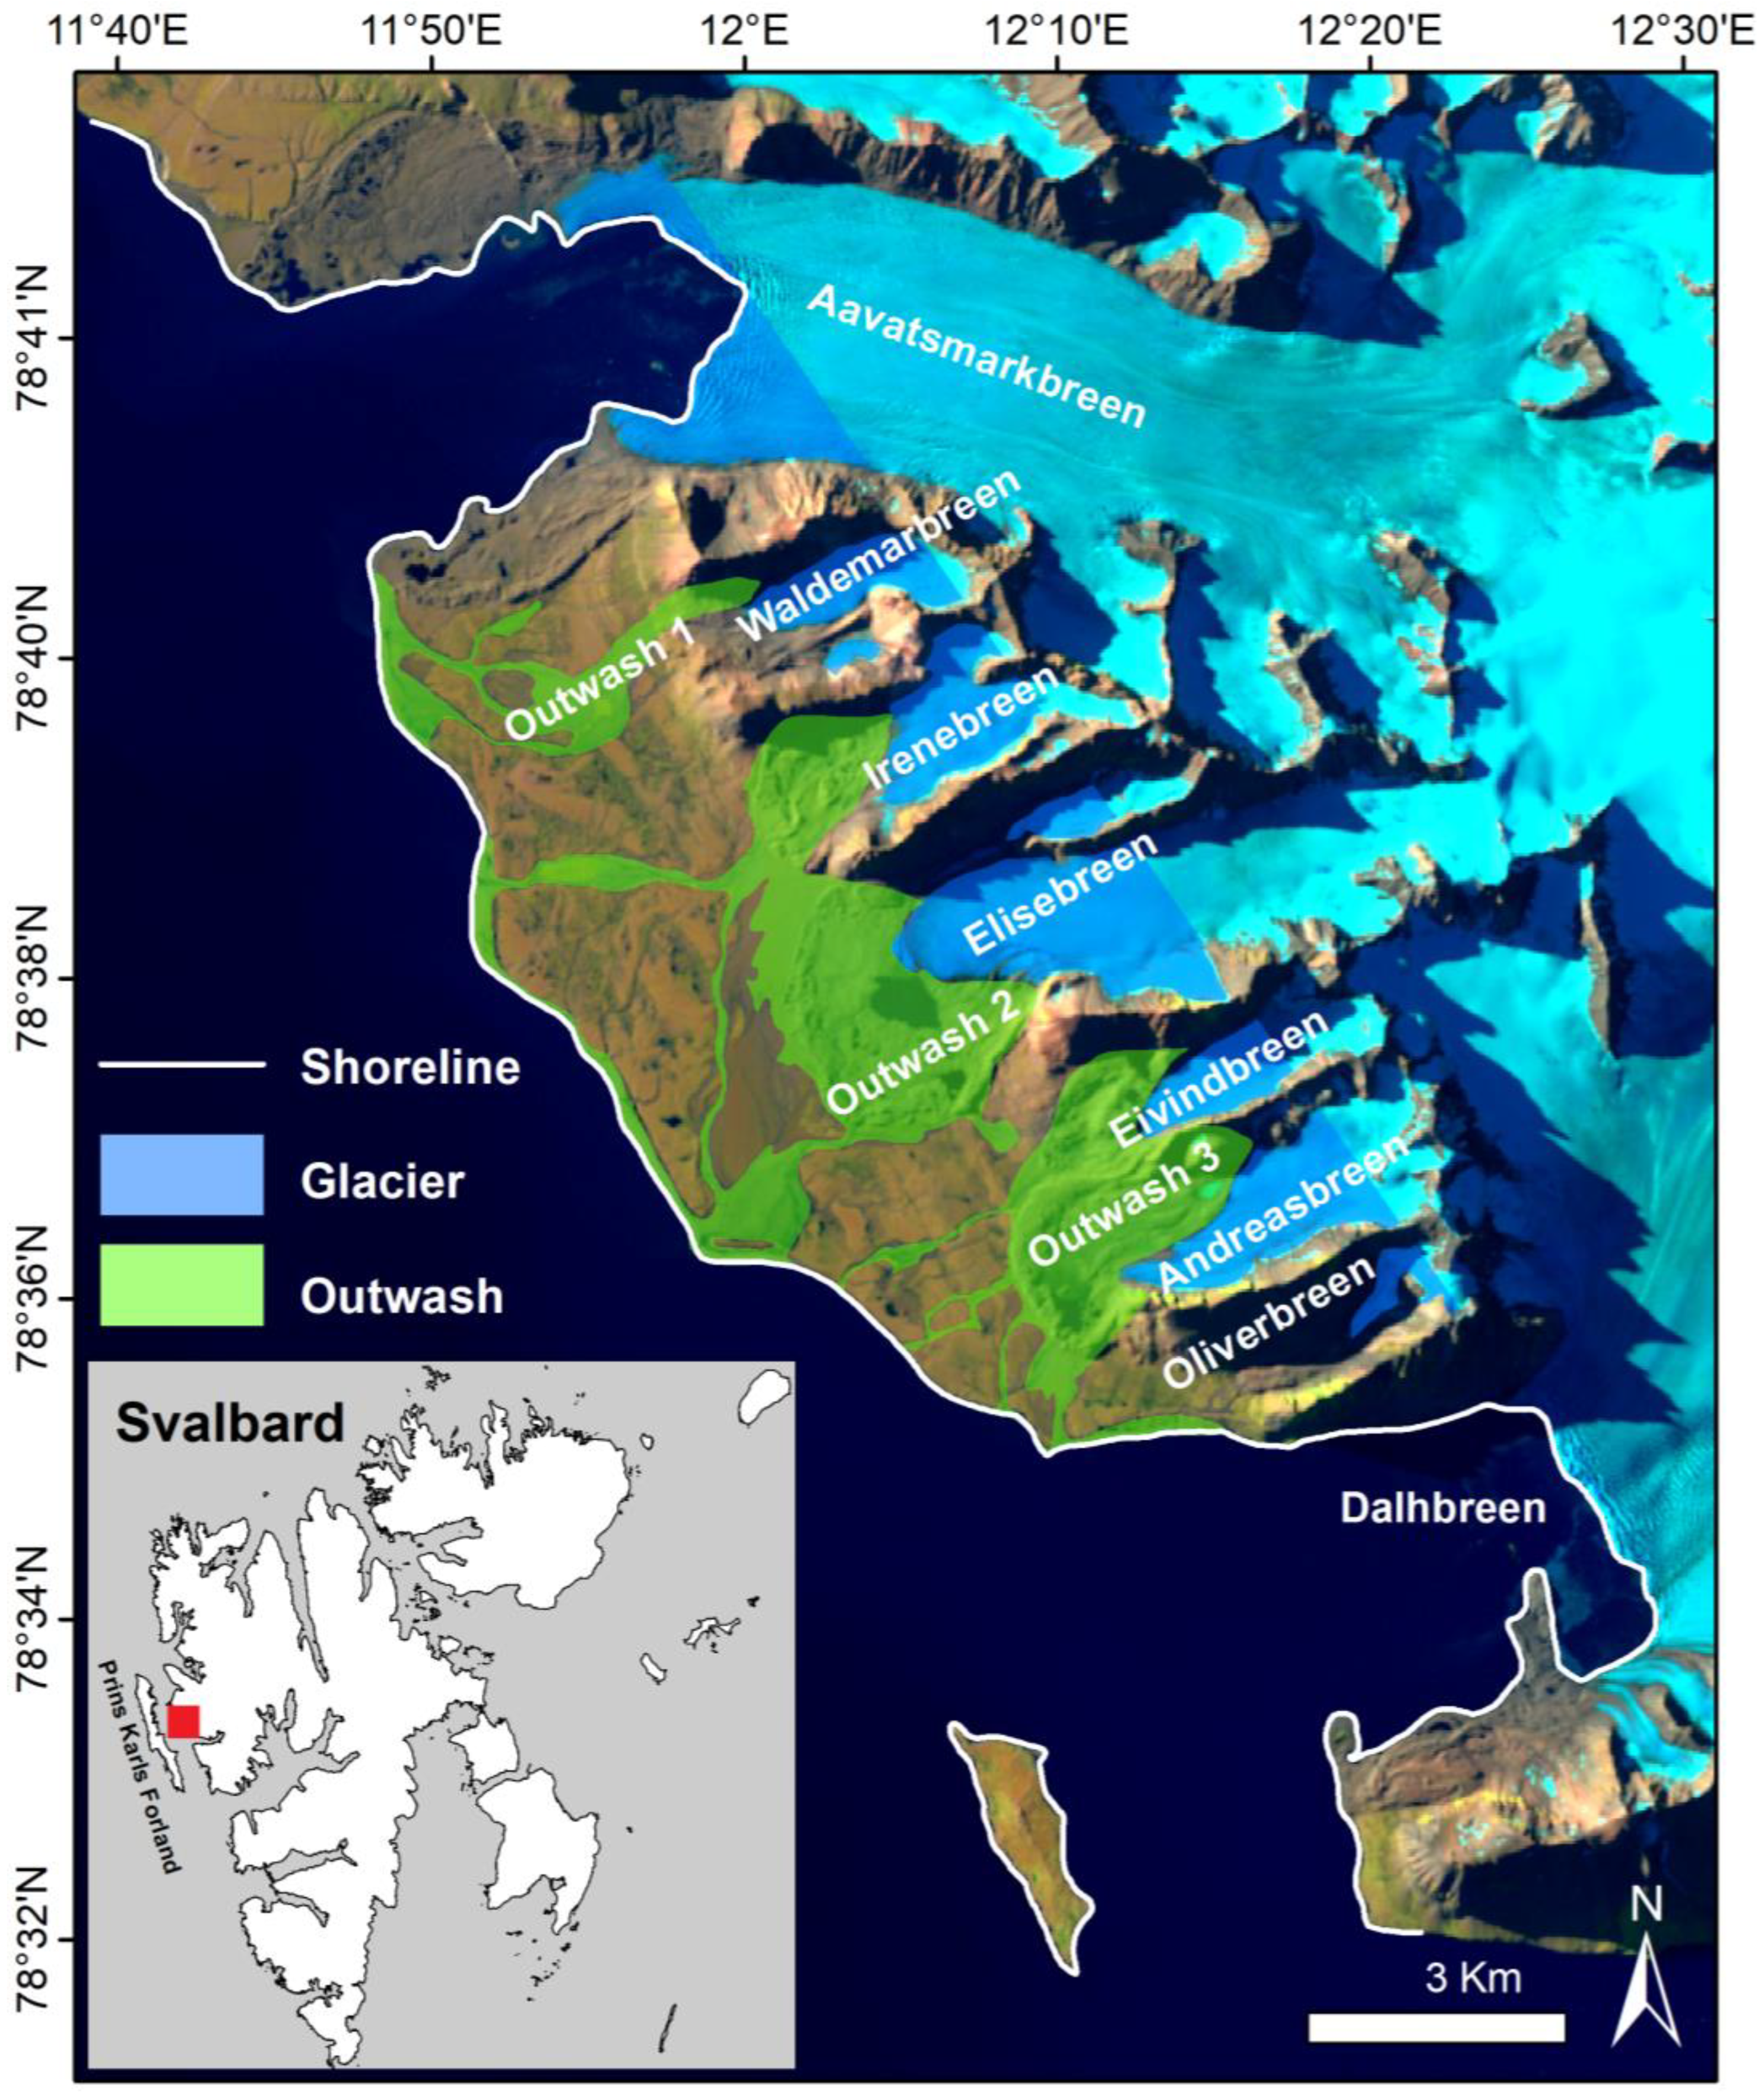
Figure 2.
The DSAS concept and shoreline change envelope (SCE) and net shoreline movement (NSM) definition (modified based on [48]). The shorelines are green, yellow, blue, and red at different times. The black line indicates where a baseline can be constructed (onshore, offshore, or midshore). The gray line is the transect cast perpendicular from baseline to shorelines.
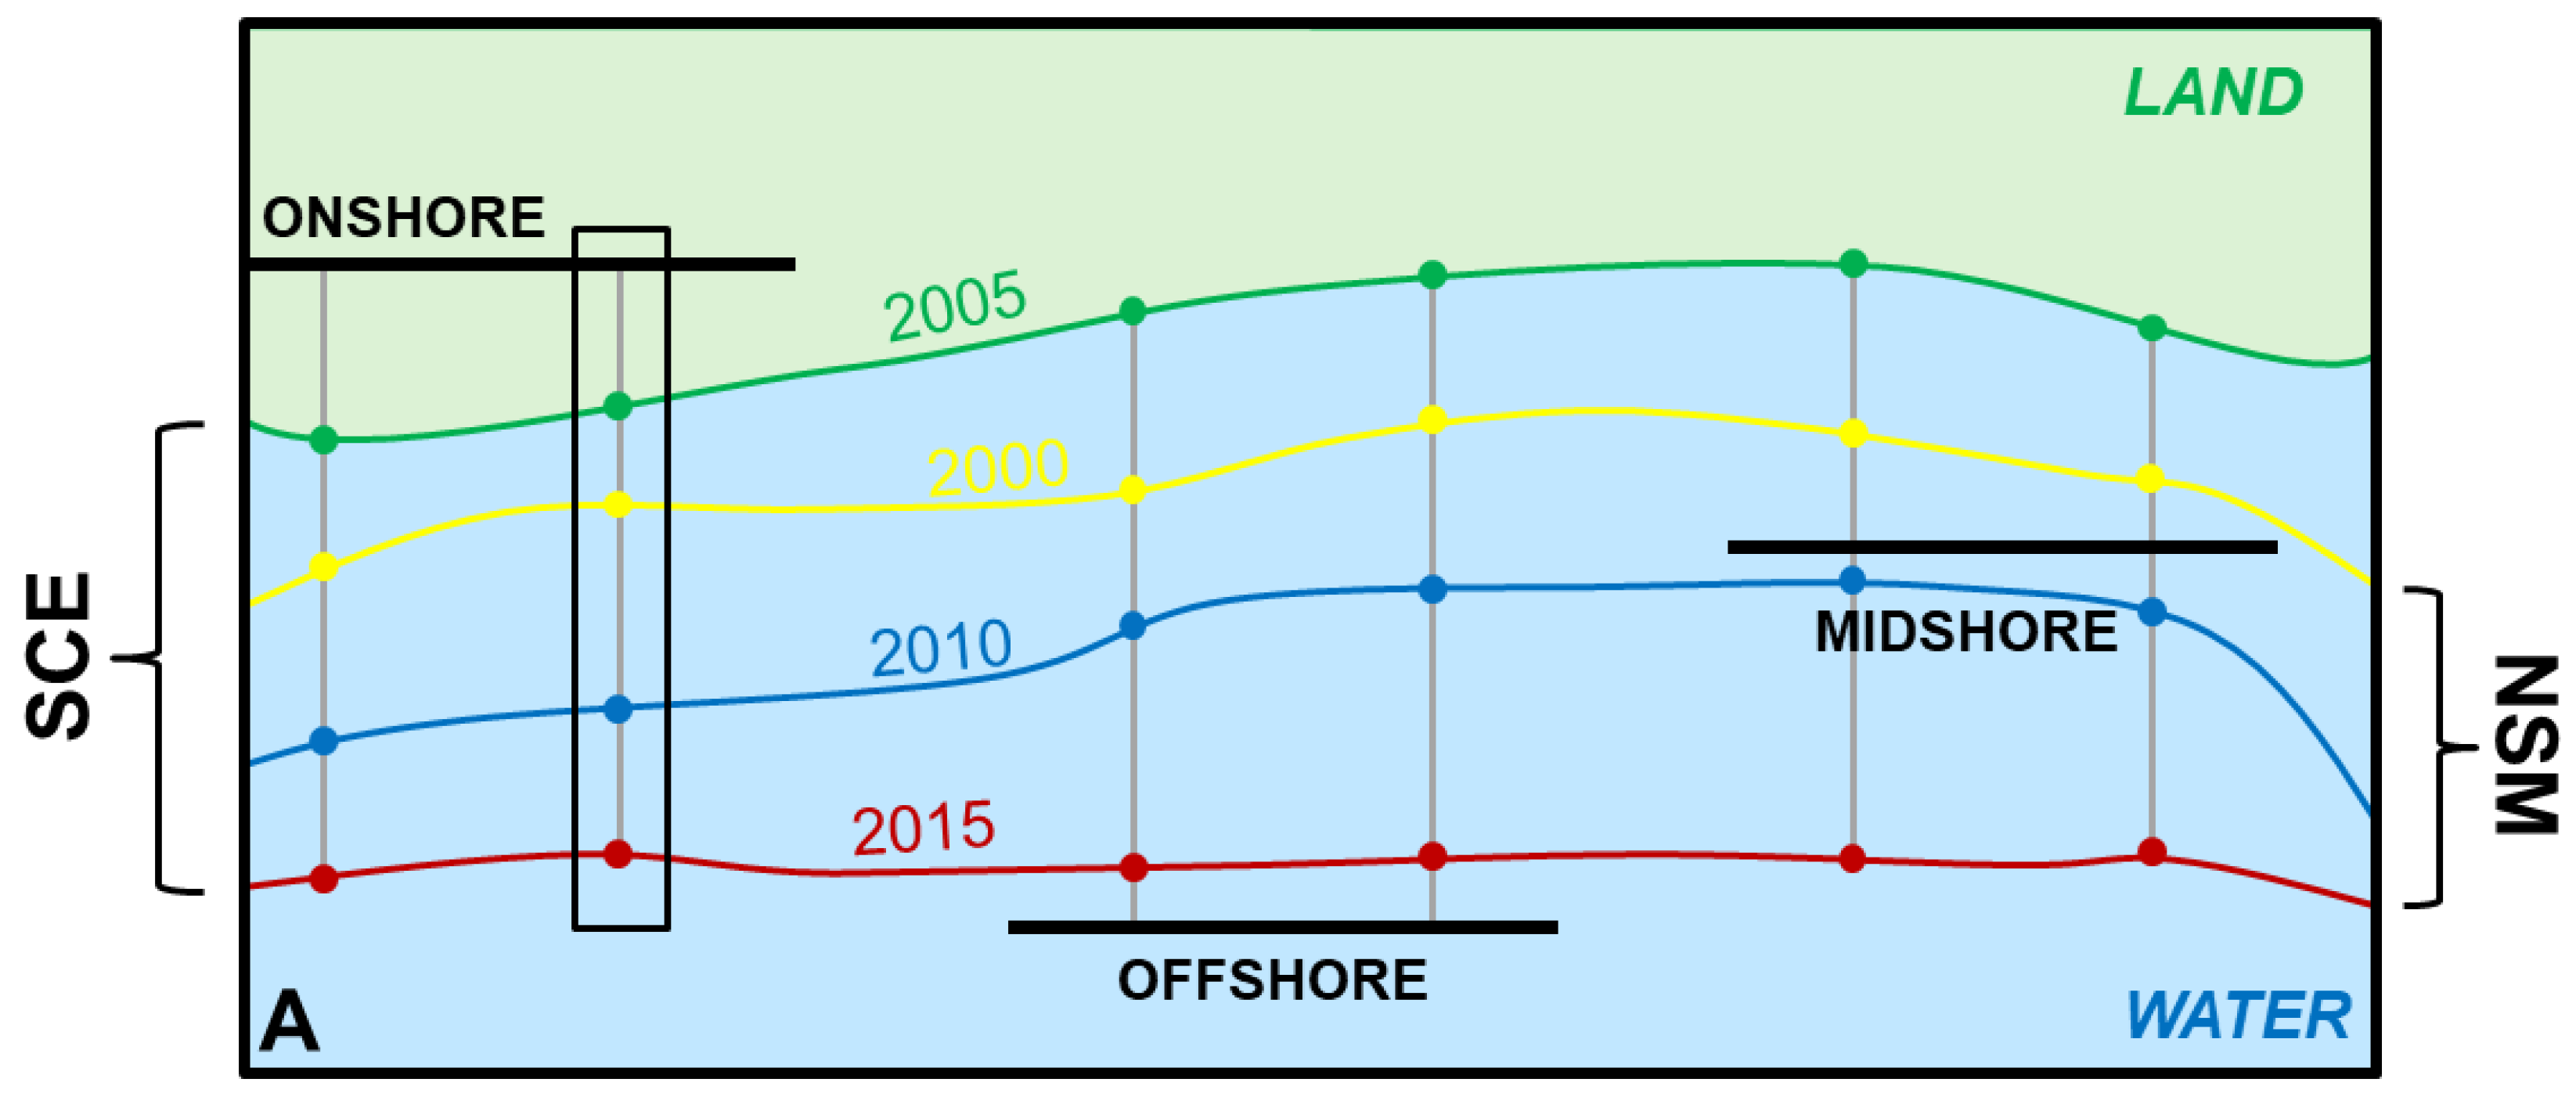
Figure 3.
The DSAS module's preparatory process includes: (a) the shorelines from 1985 to 2023 and the predefined baselines along the shoreline geometry, and (b) the transects are derived from the baselines and cast perpendicular to the shorelines.
Figure 3.
The DSAS module's preparatory process includes: (a) the shorelines from 1985 to 2023 and the predefined baselines along the shoreline geometry, and (b) the transects are derived from the baselines and cast perpendicular to the shorelines.
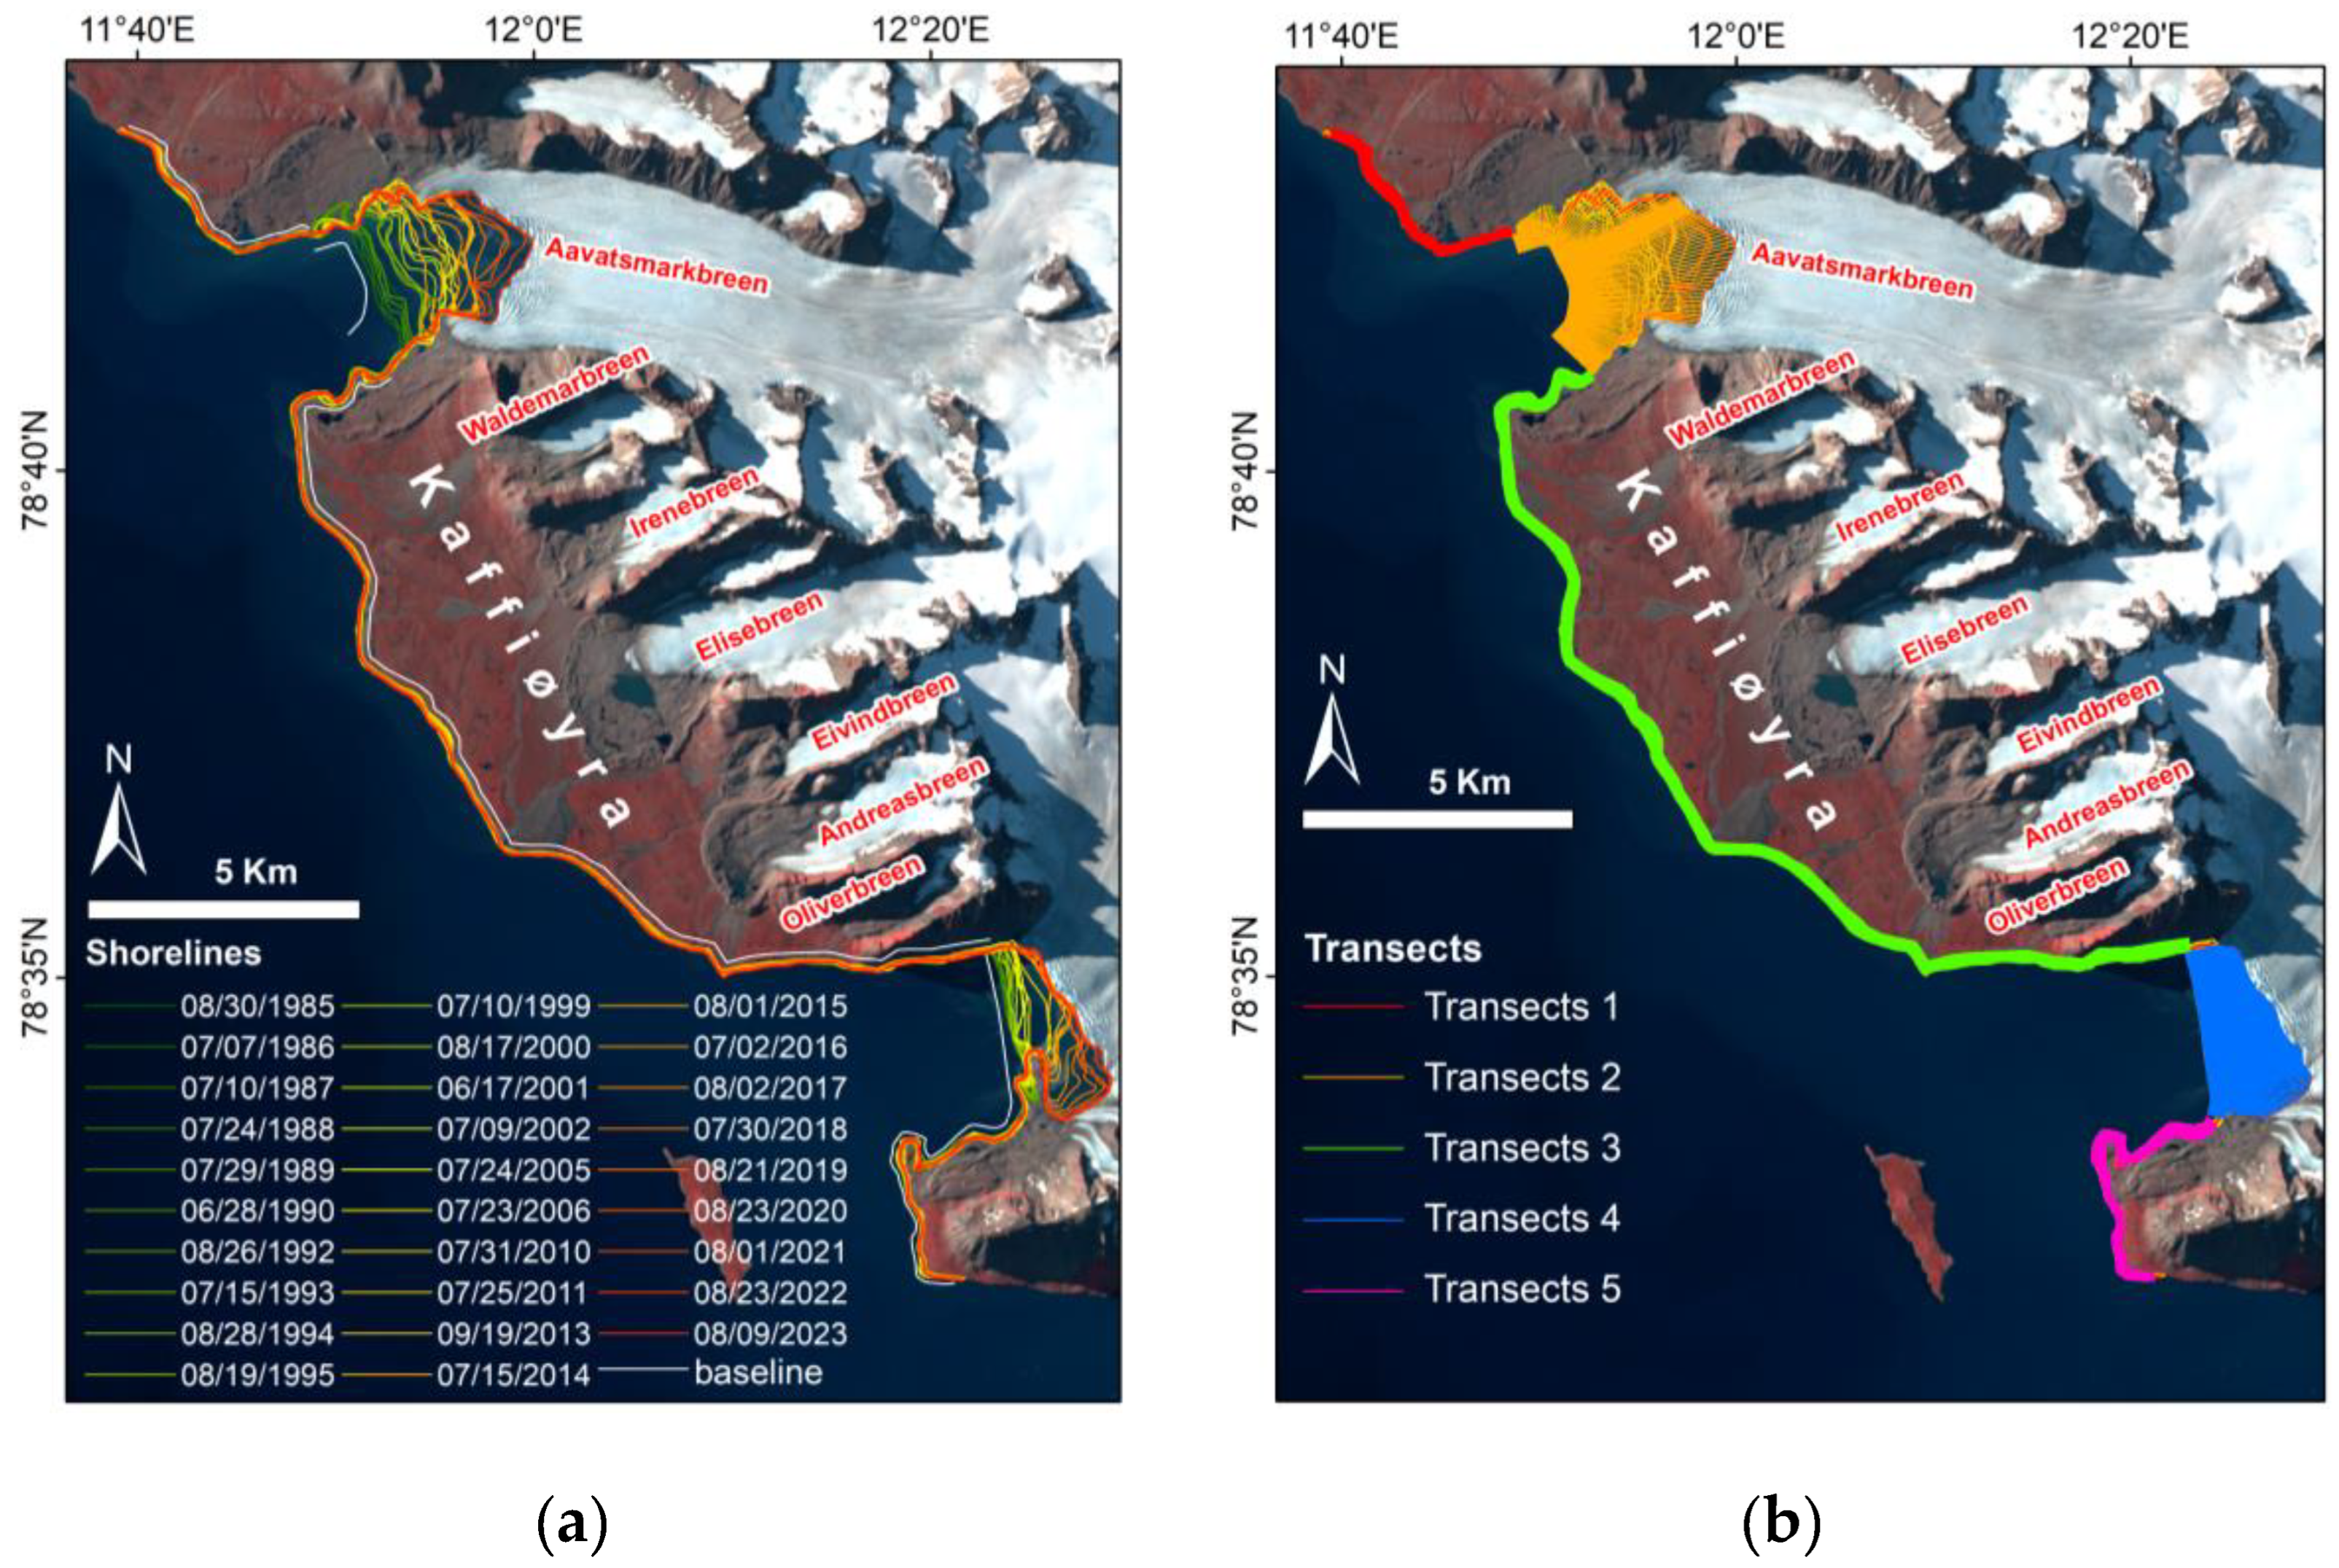
Figure 4.
The map of Linear Regression Rate for 38 years. Based on this map, the shoreline can be classified into five zones depending on the LRRs. In the study area, zones 2 and 4 have relatively high rates, while zones 1, 3, and 5 have relatively low rates.
Figure 4.
The map of Linear Regression Rate for 38 years. Based on this map, the shoreline can be classified into five zones depending on the LRRs. In the study area, zones 2 and 4 have relatively high rates, while zones 1, 3, and 5 have relatively low rates.
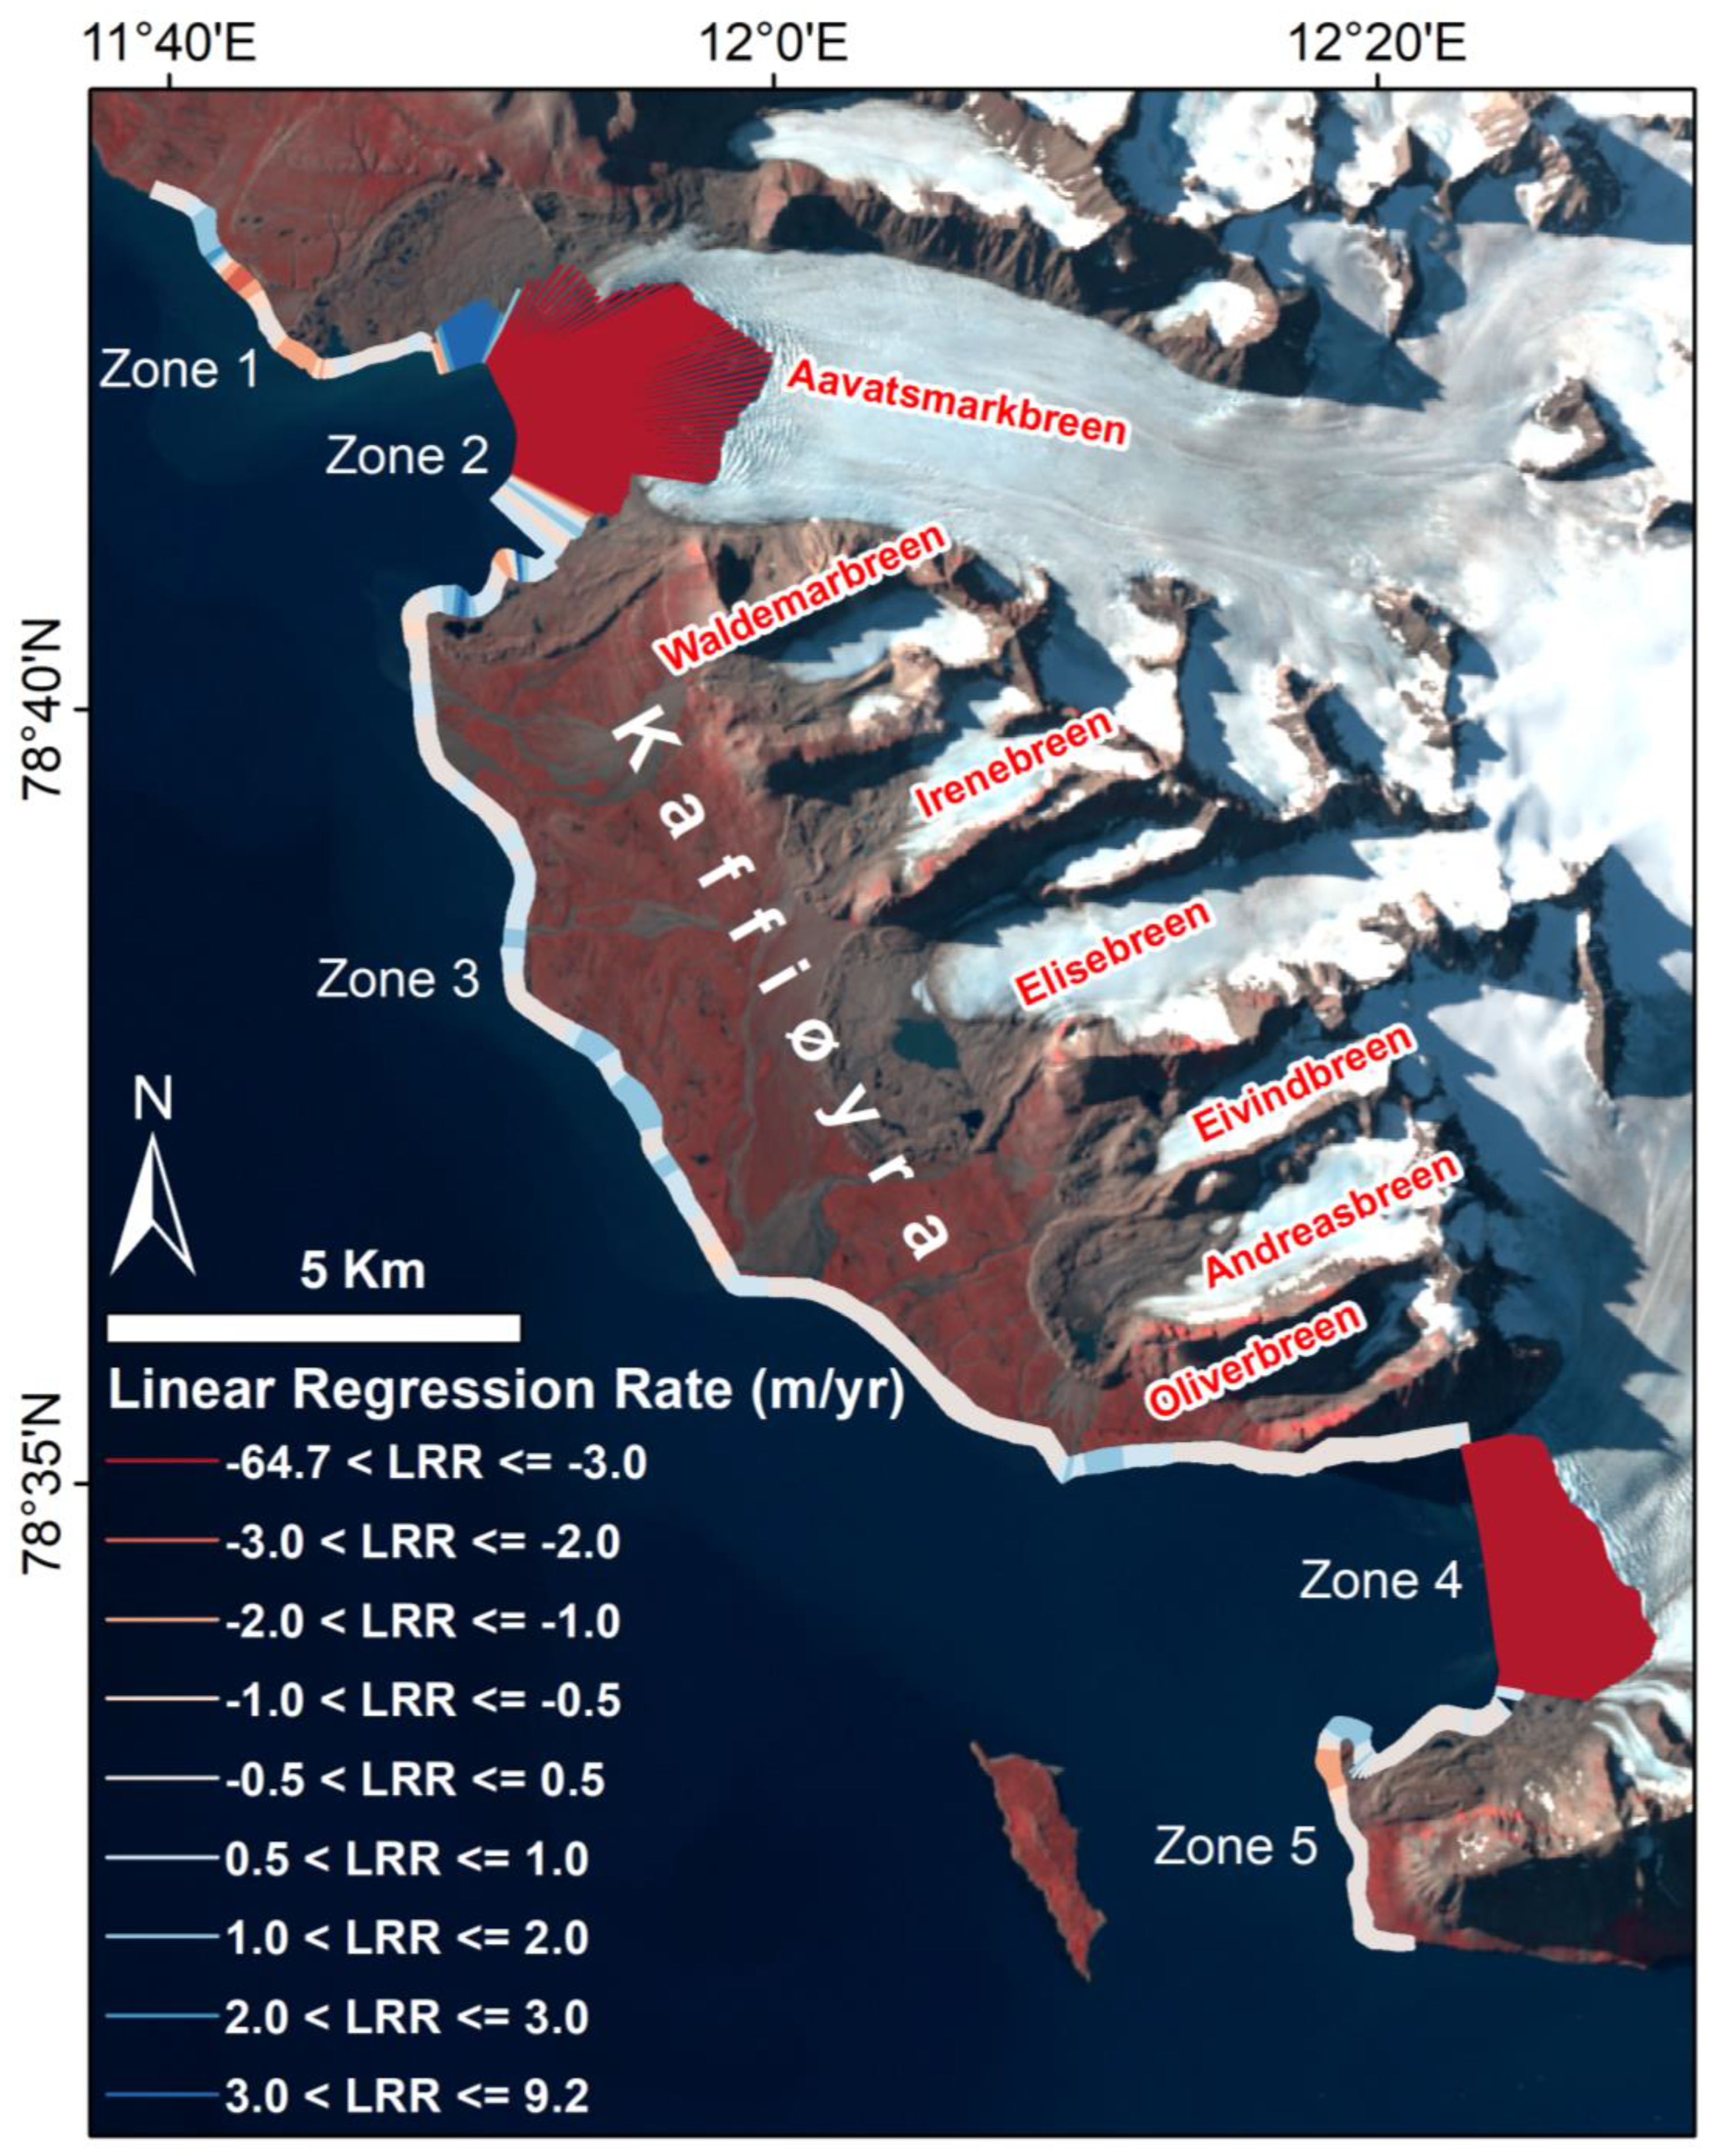
Figure 5.
The map shows LRR in different zones. Zones 1, 3, and 5 are relatively stable, whereas in zones 2 and 5, LLR values vary significantly from -64.7 to 9.2 m/yr. Note that the negative and positive values represent the erosion and accretion, respectively. .
Figure 5.
The map shows LRR in different zones. Zones 1, 3, and 5 are relatively stable, whereas in zones 2 and 5, LLR values vary significantly from -64.7 to 9.2 m/yr. Note that the negative and positive values represent the erosion and accretion, respectively. .
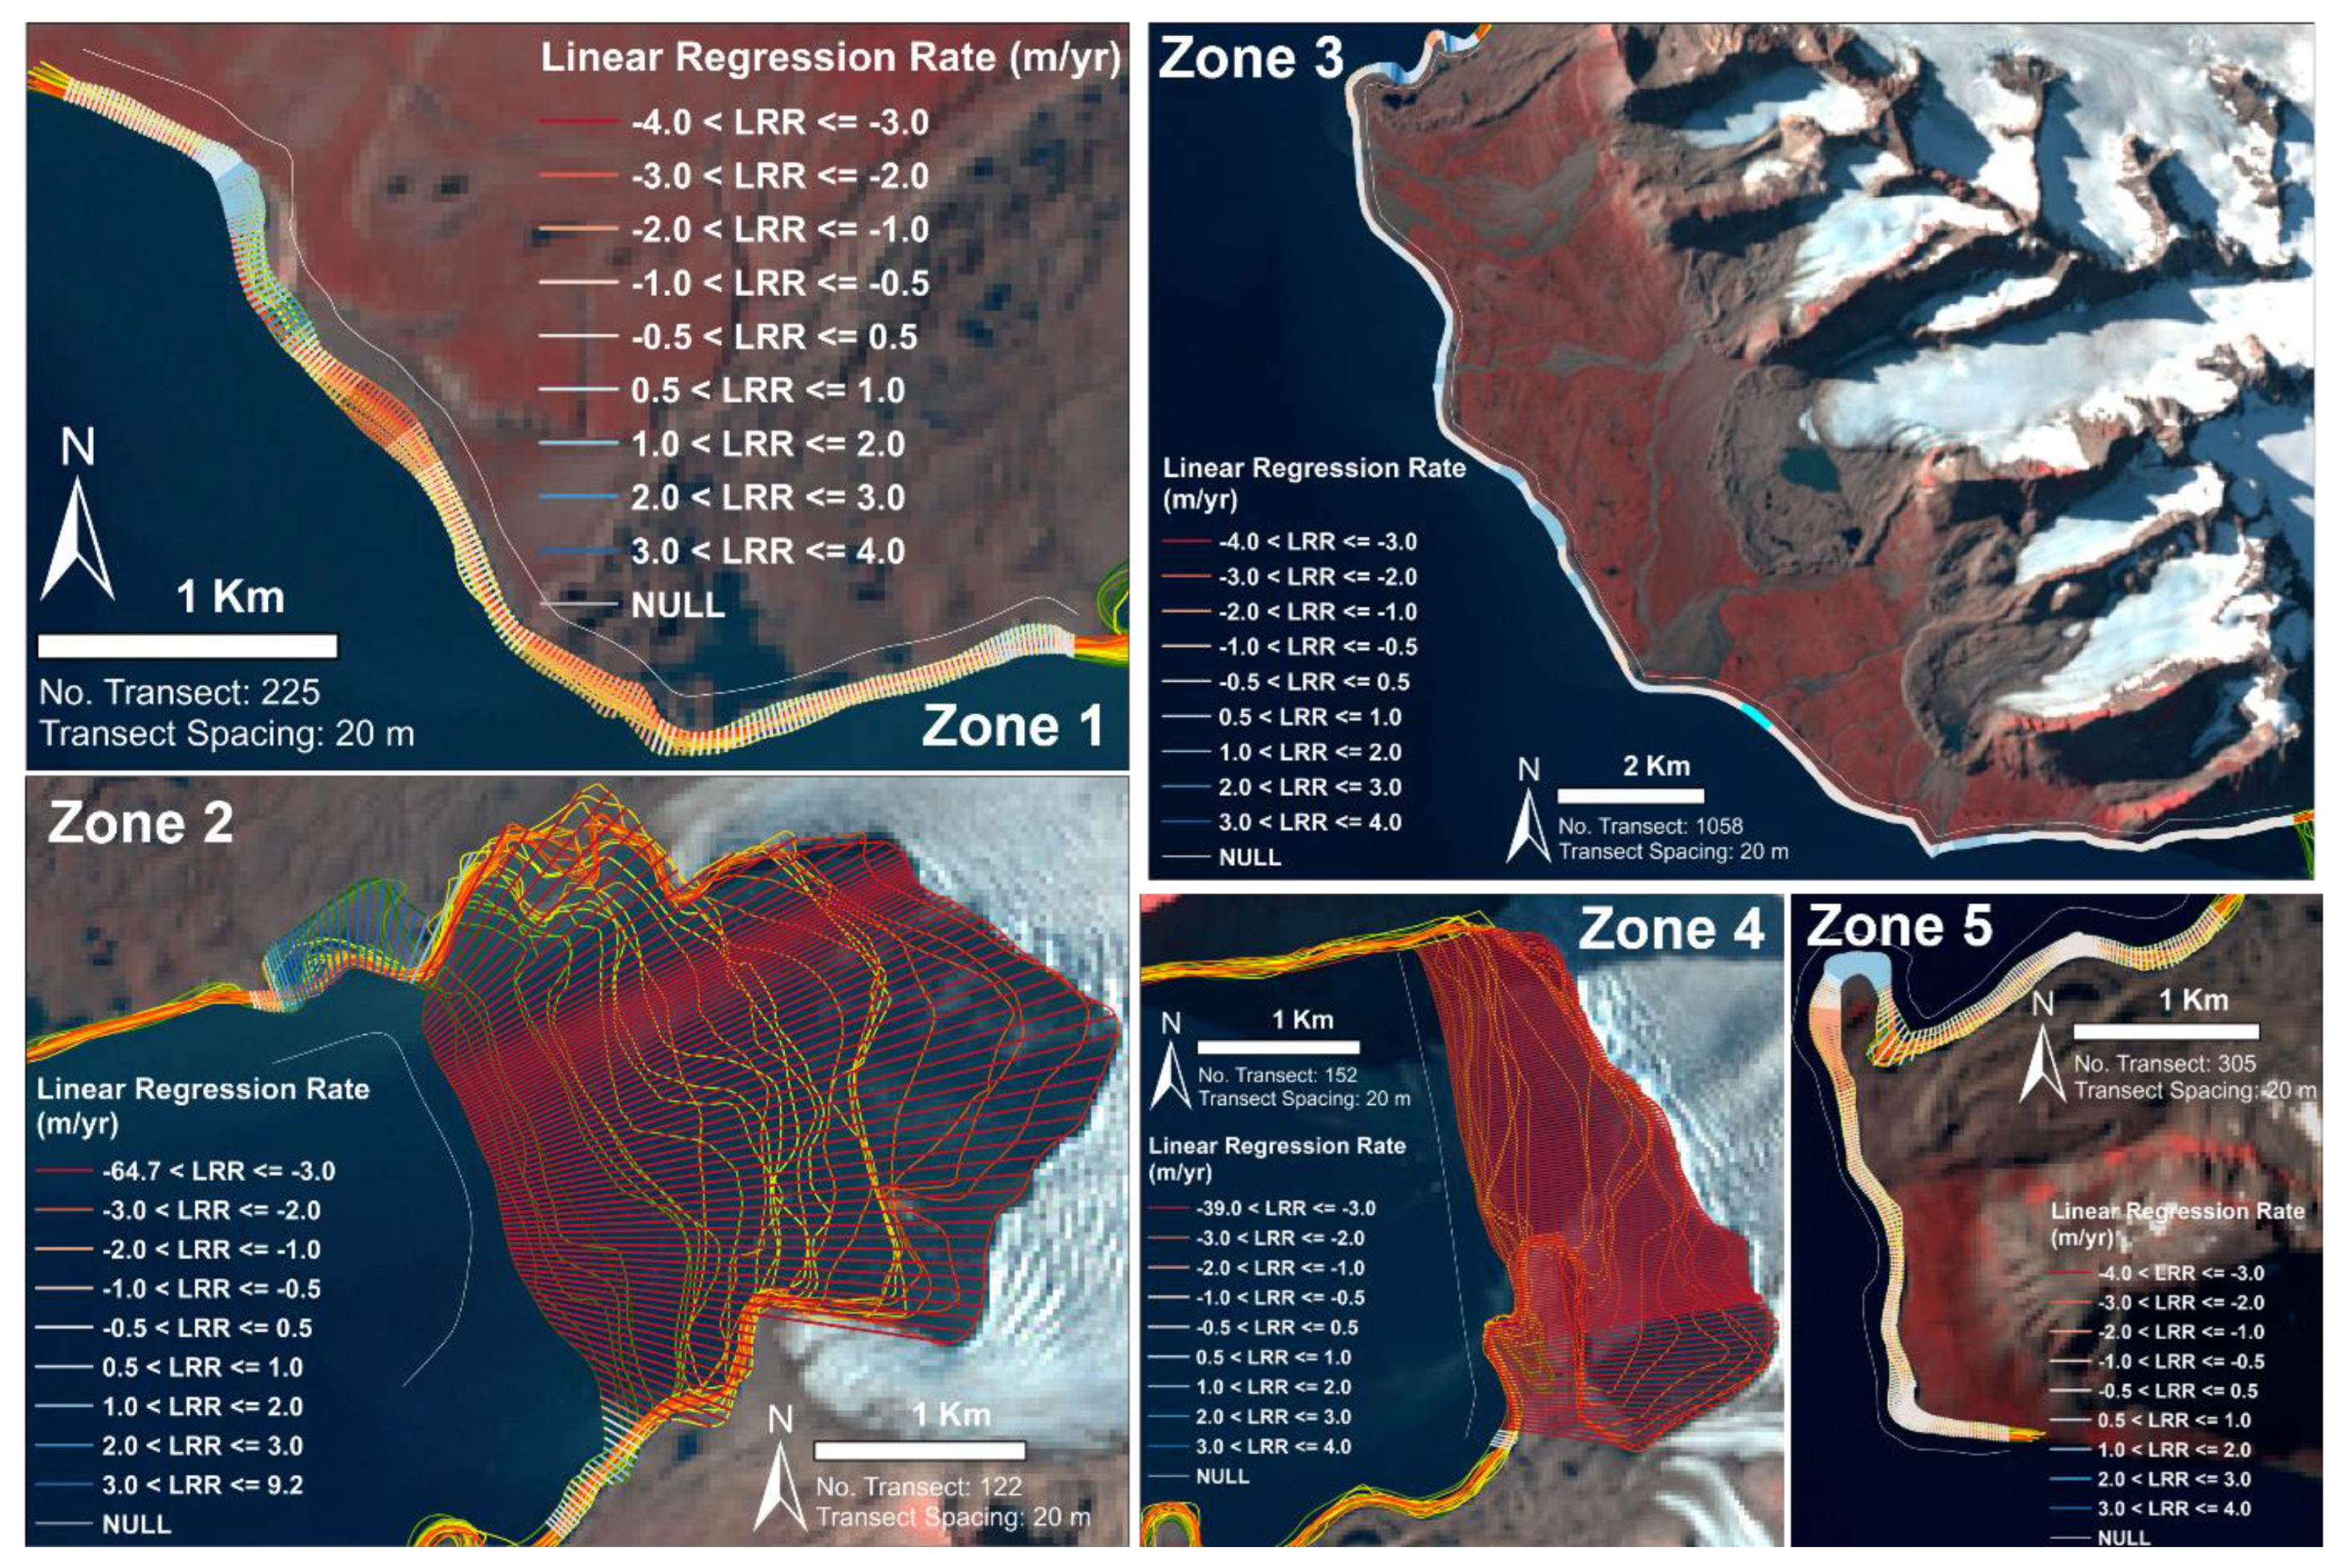
Figure 6.
The net shoreline movement (NSM) in different zones. The large NSM values of shorelines in zones 2 and 4 are 2,762 m and 1,654 m to the landward.
Figure 6.
The net shoreline movement (NSM) in different zones. The large NSM values of shorelines in zones 2 and 4 are 2,762 m and 1,654 m to the landward.
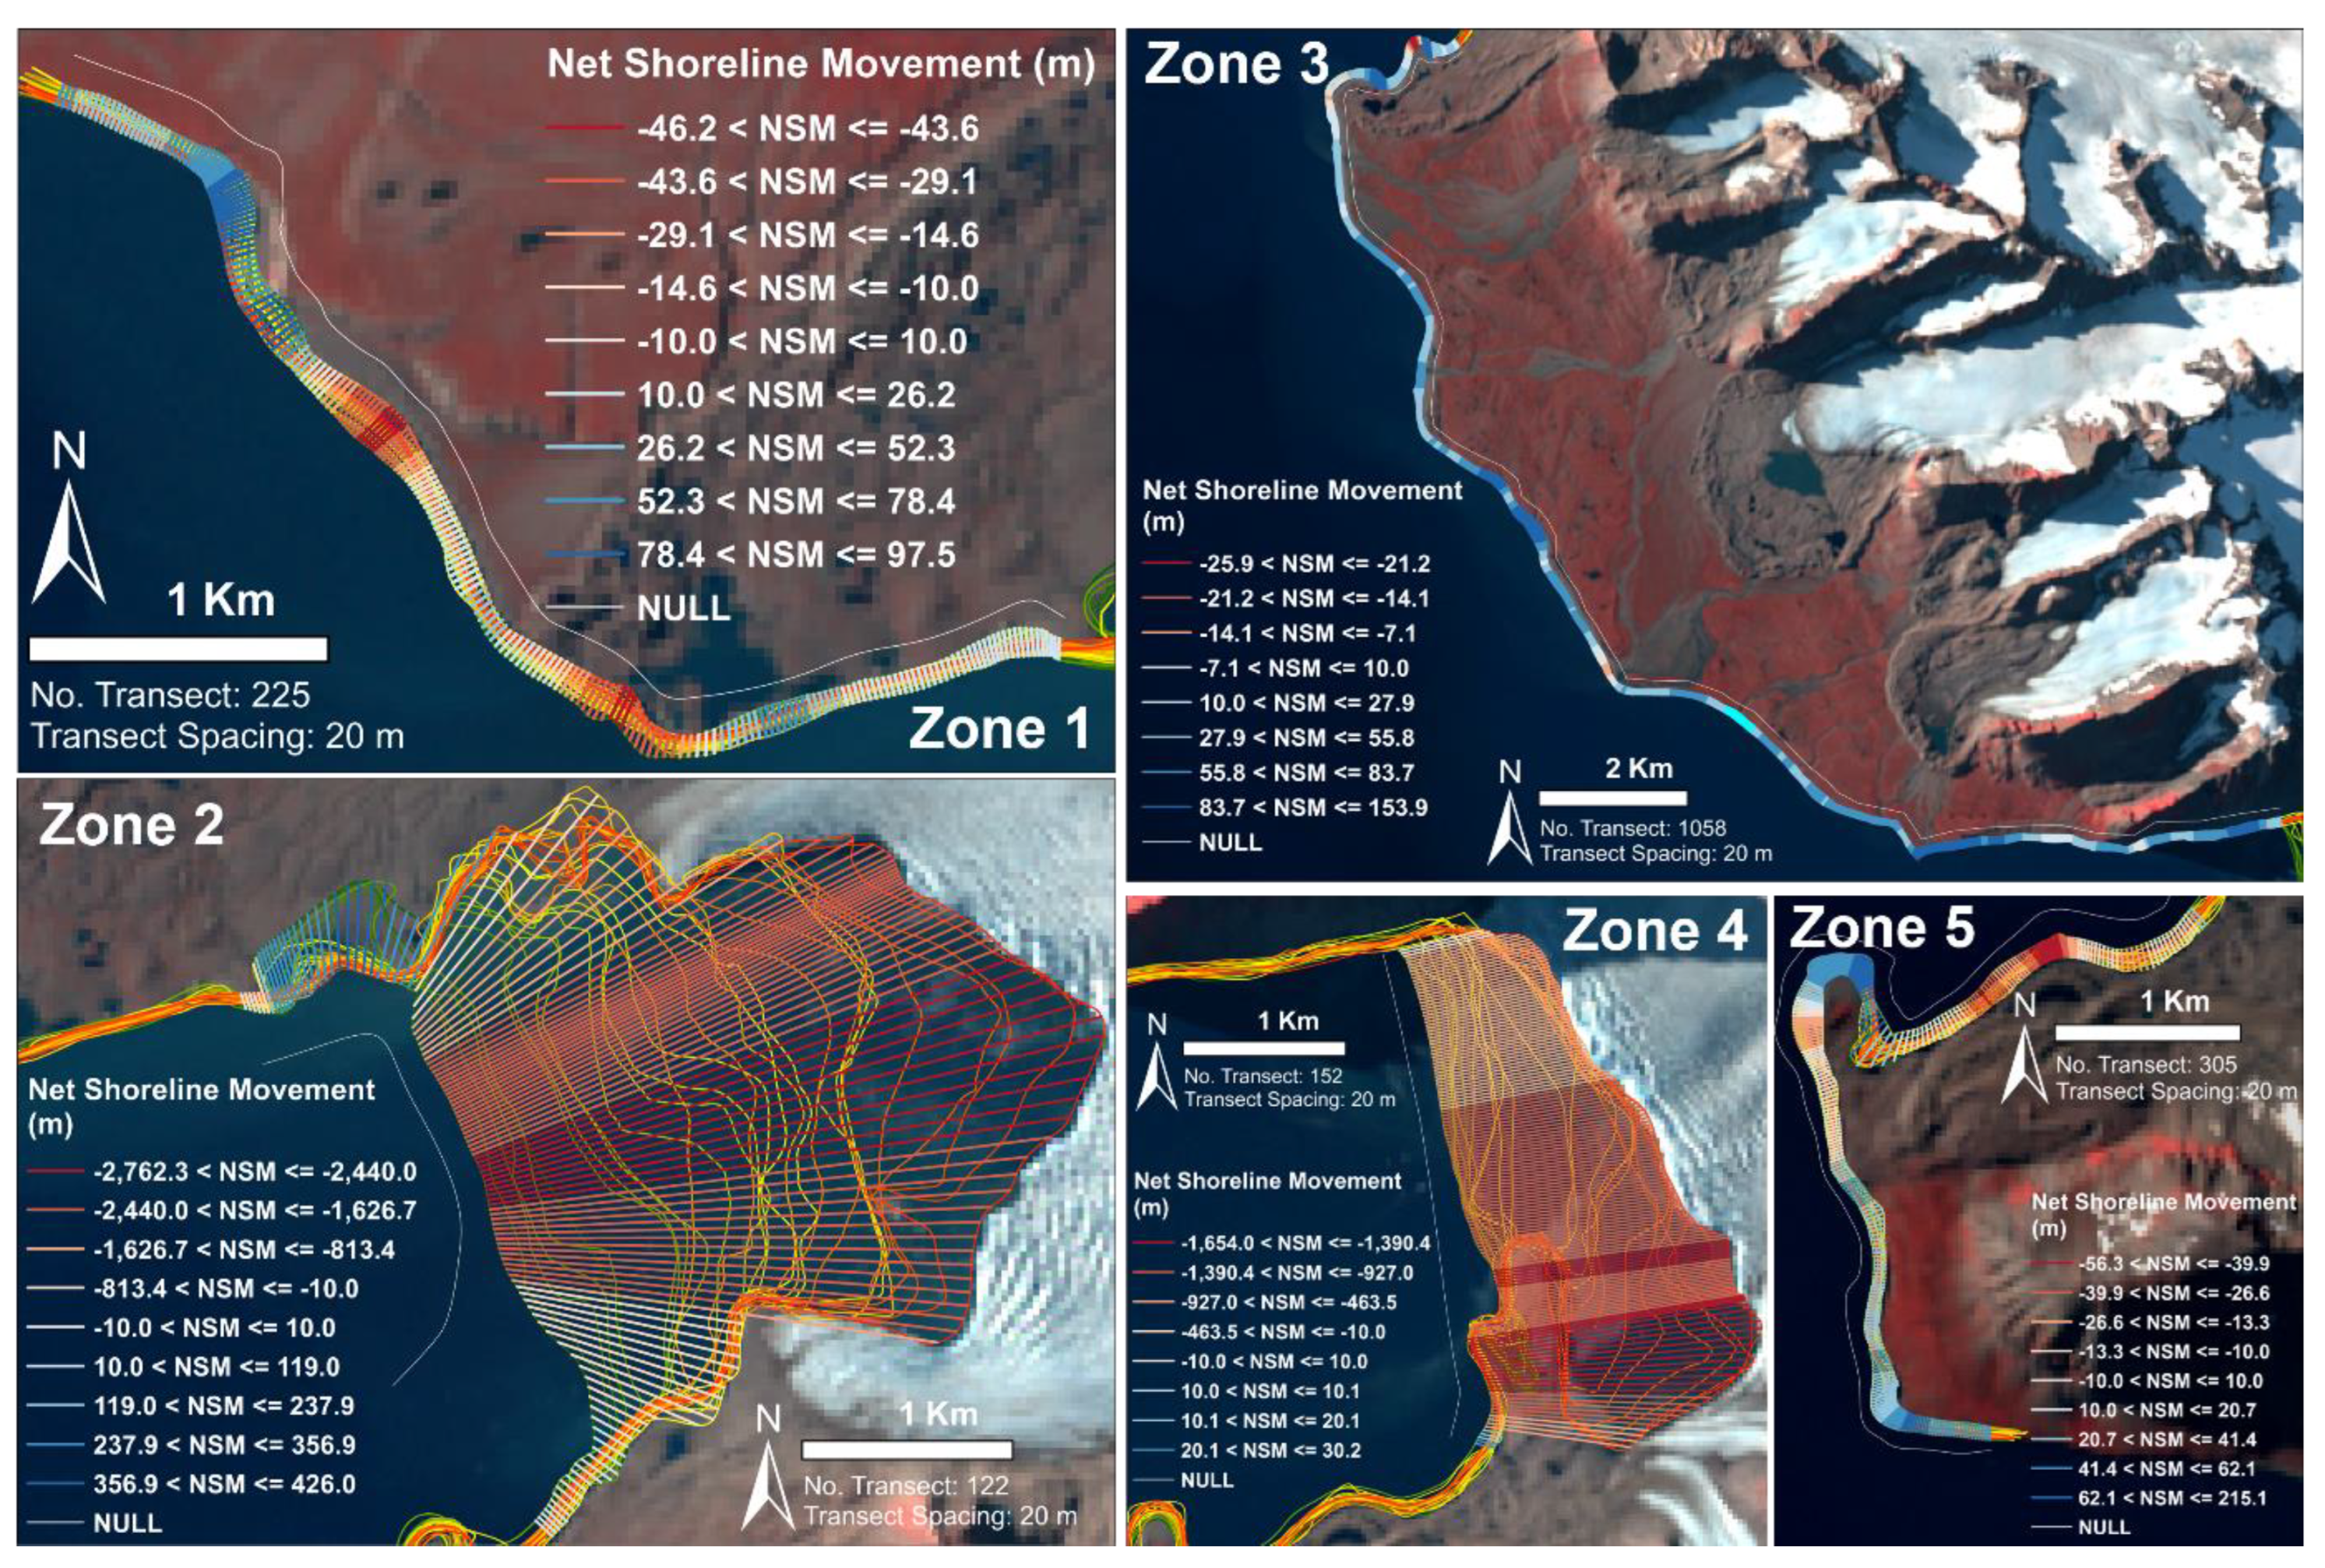
Figure 7.
The map shows the result of glacier boundaries extracted from 1985 – 2023. A glacier baseline (yellow straight-line) crosses all the glaciers to calculate the terminus area. The centerlines and reference lines (marked with white color) are also created to calculate the rate of the glacier terminus retreat.
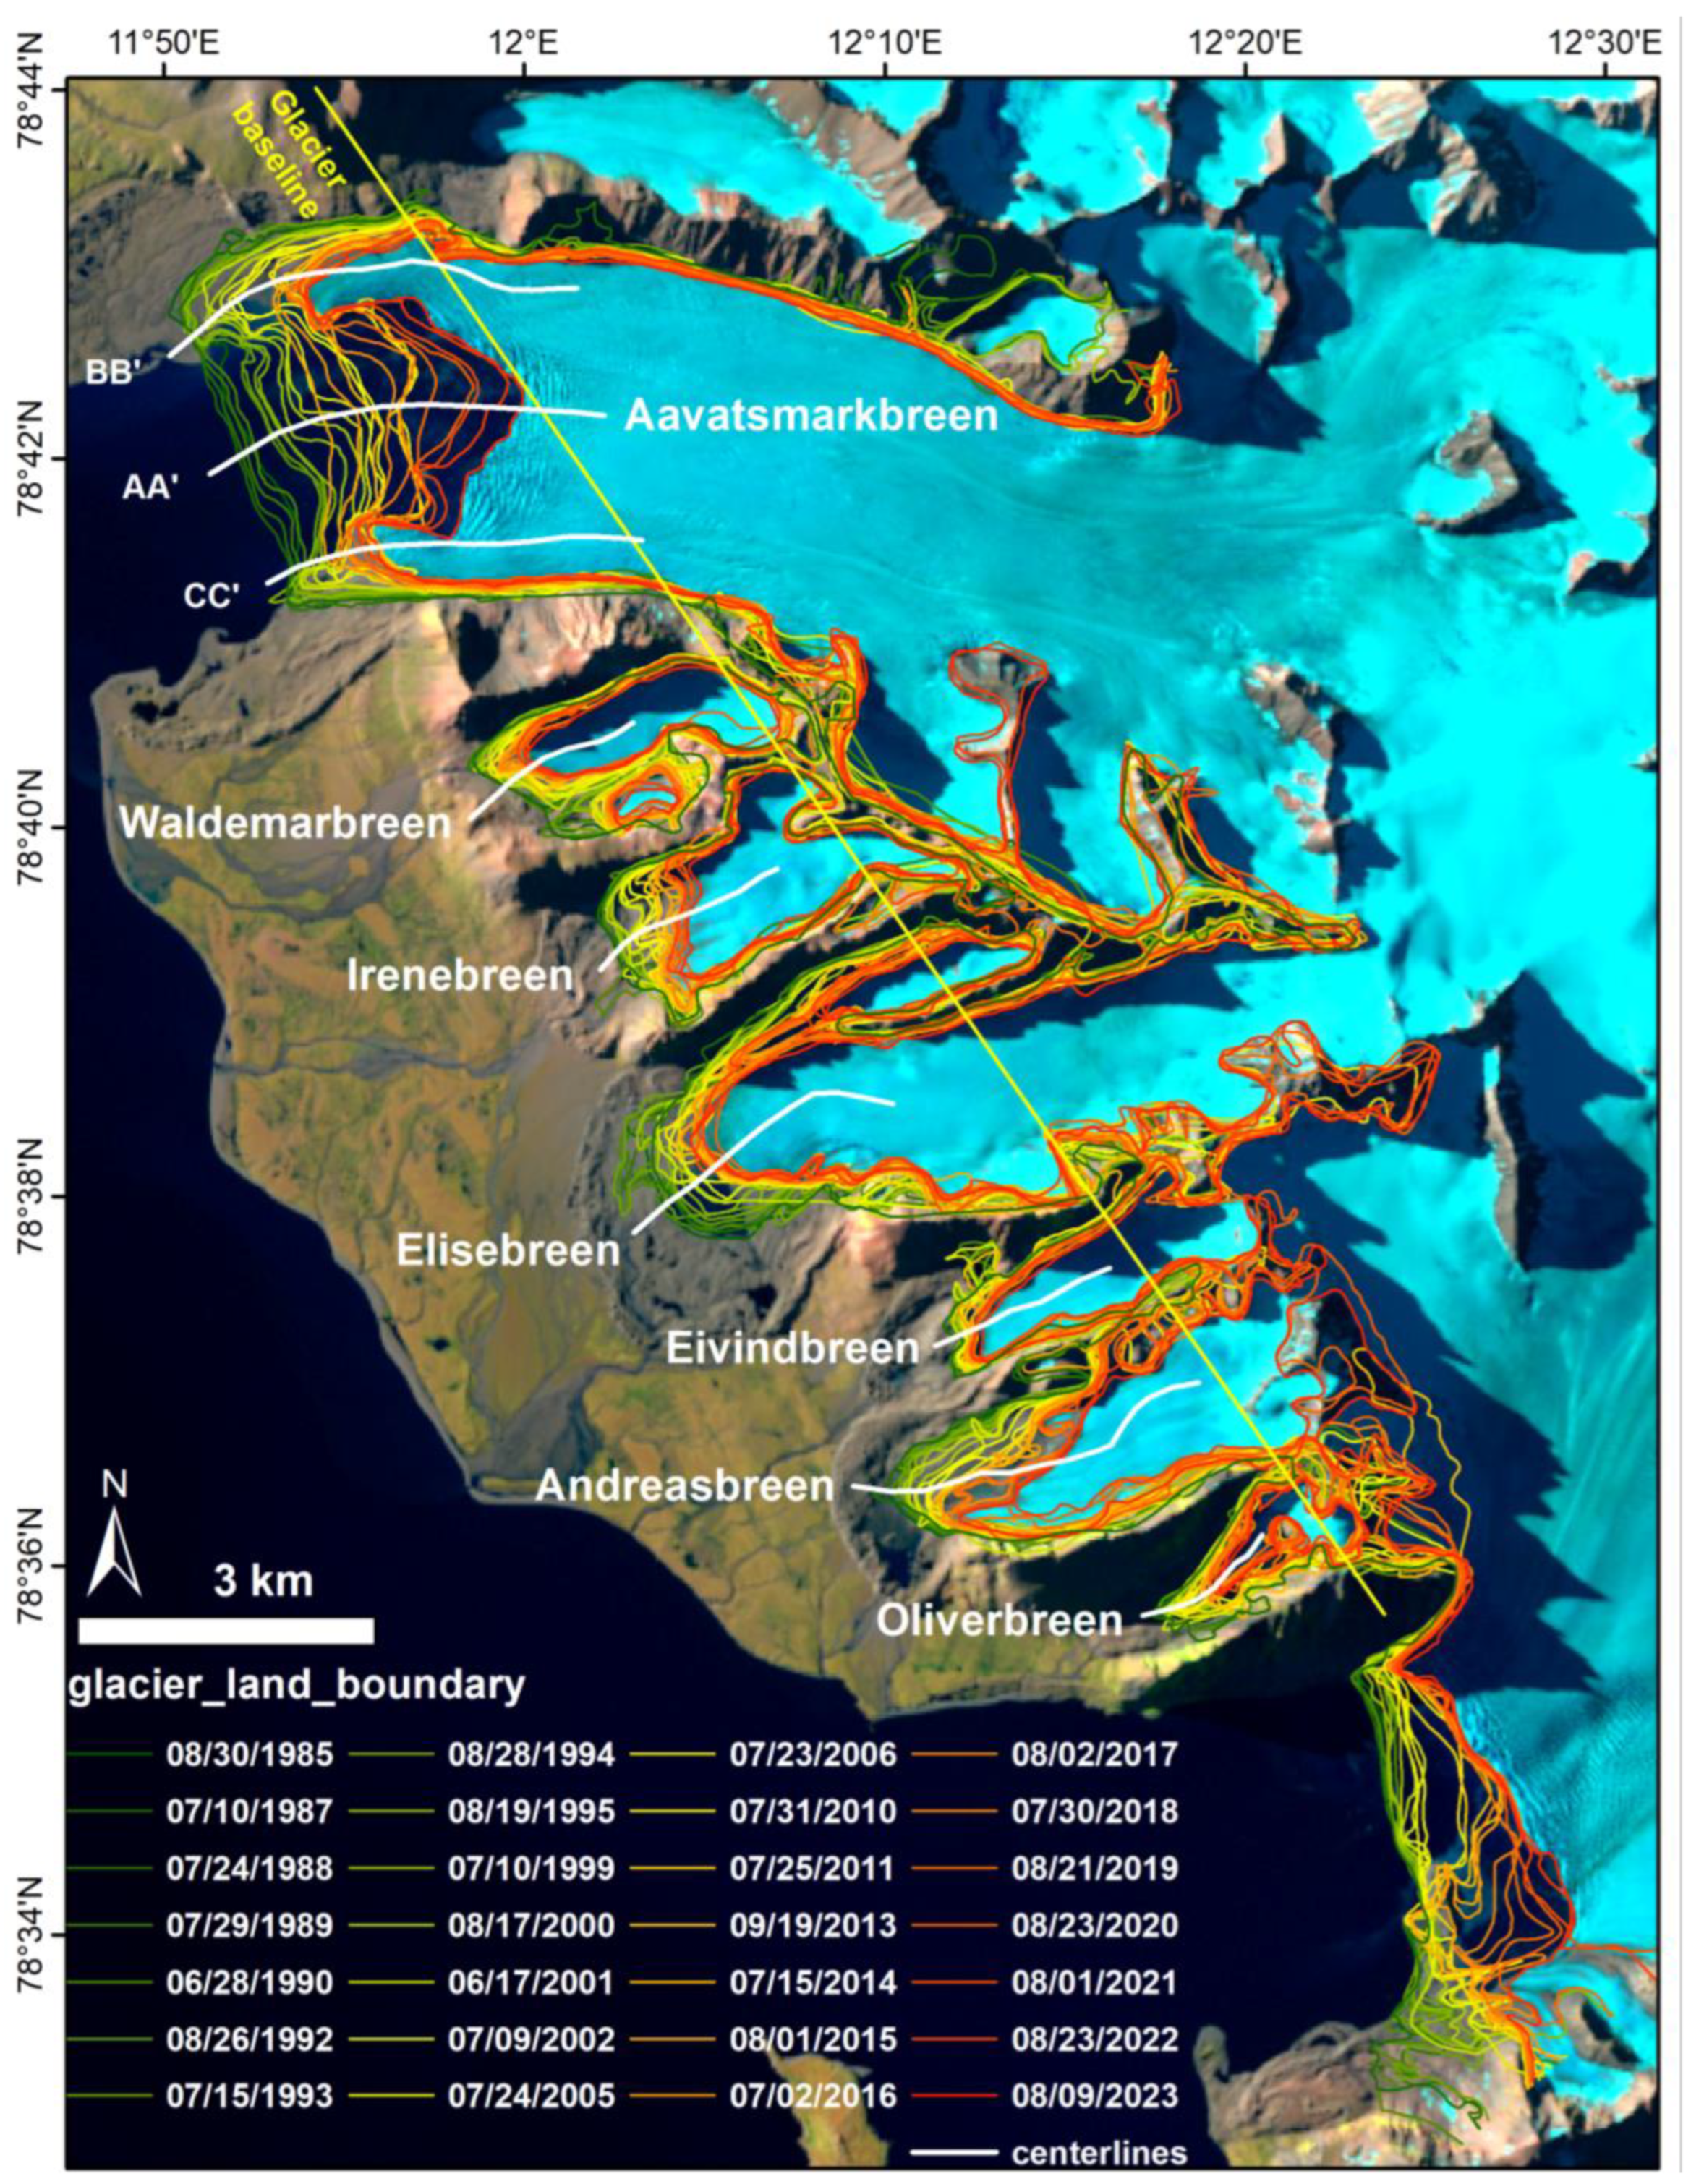
Figure 8.
The time series of the glacier terminus remaining areas are obtained based on the predefined glacier baseline. The small chart in the right-up corner shows the percentages of the remaining areas in 2023 compared with the area received in 1985.
Figure 8.
The time series of the glacier terminus remaining areas are obtained based on the predefined glacier baseline. The small chart in the right-up corner shows the percentages of the remaining areas in 2023 compared with the area received in 1985.
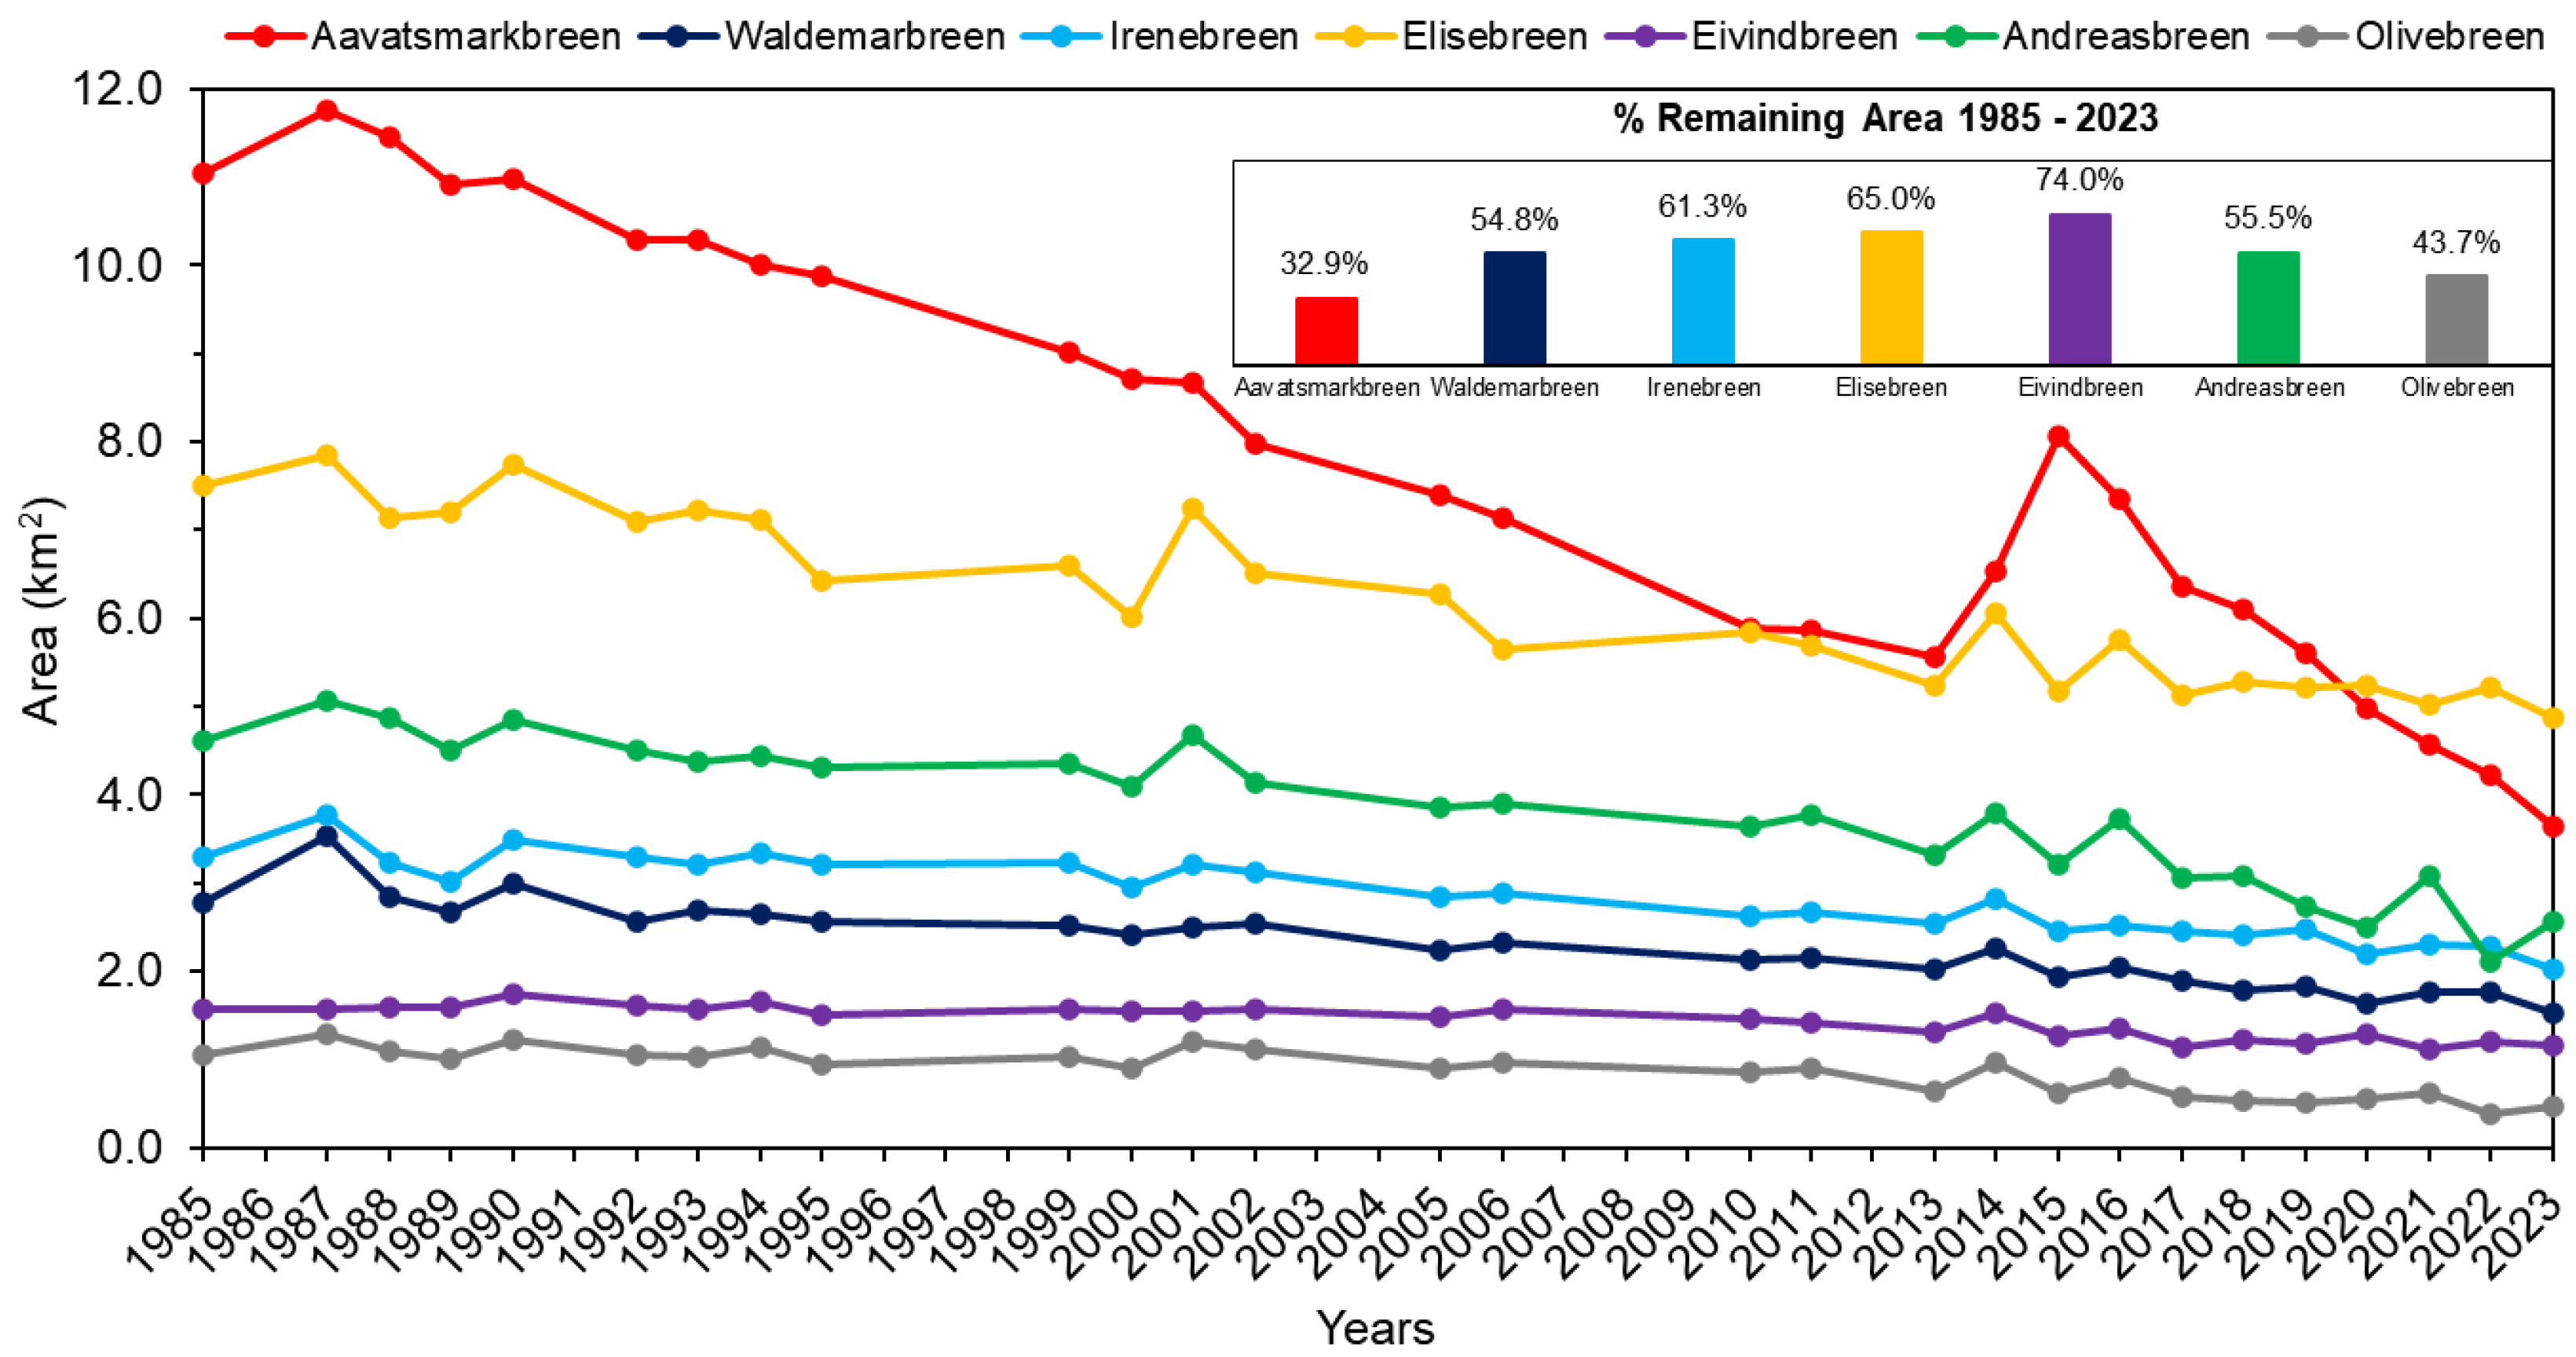
Figure 9.
The stages of the Aavatsmarkbreen surge event from 2013 to 2016: (a) 2013 – regular glacier, (b) 2014 - surge occurs, (c) 2015 - surge continues to advance, and (d) 2016 - back to the retreat trend.
Figure 9.
The stages of the Aavatsmarkbreen surge event from 2013 to 2016: (a) 2013 – regular glacier, (b) 2014 - surge occurs, (c) 2015 - surge continues to advance, and (d) 2016 - back to the retreat trend.
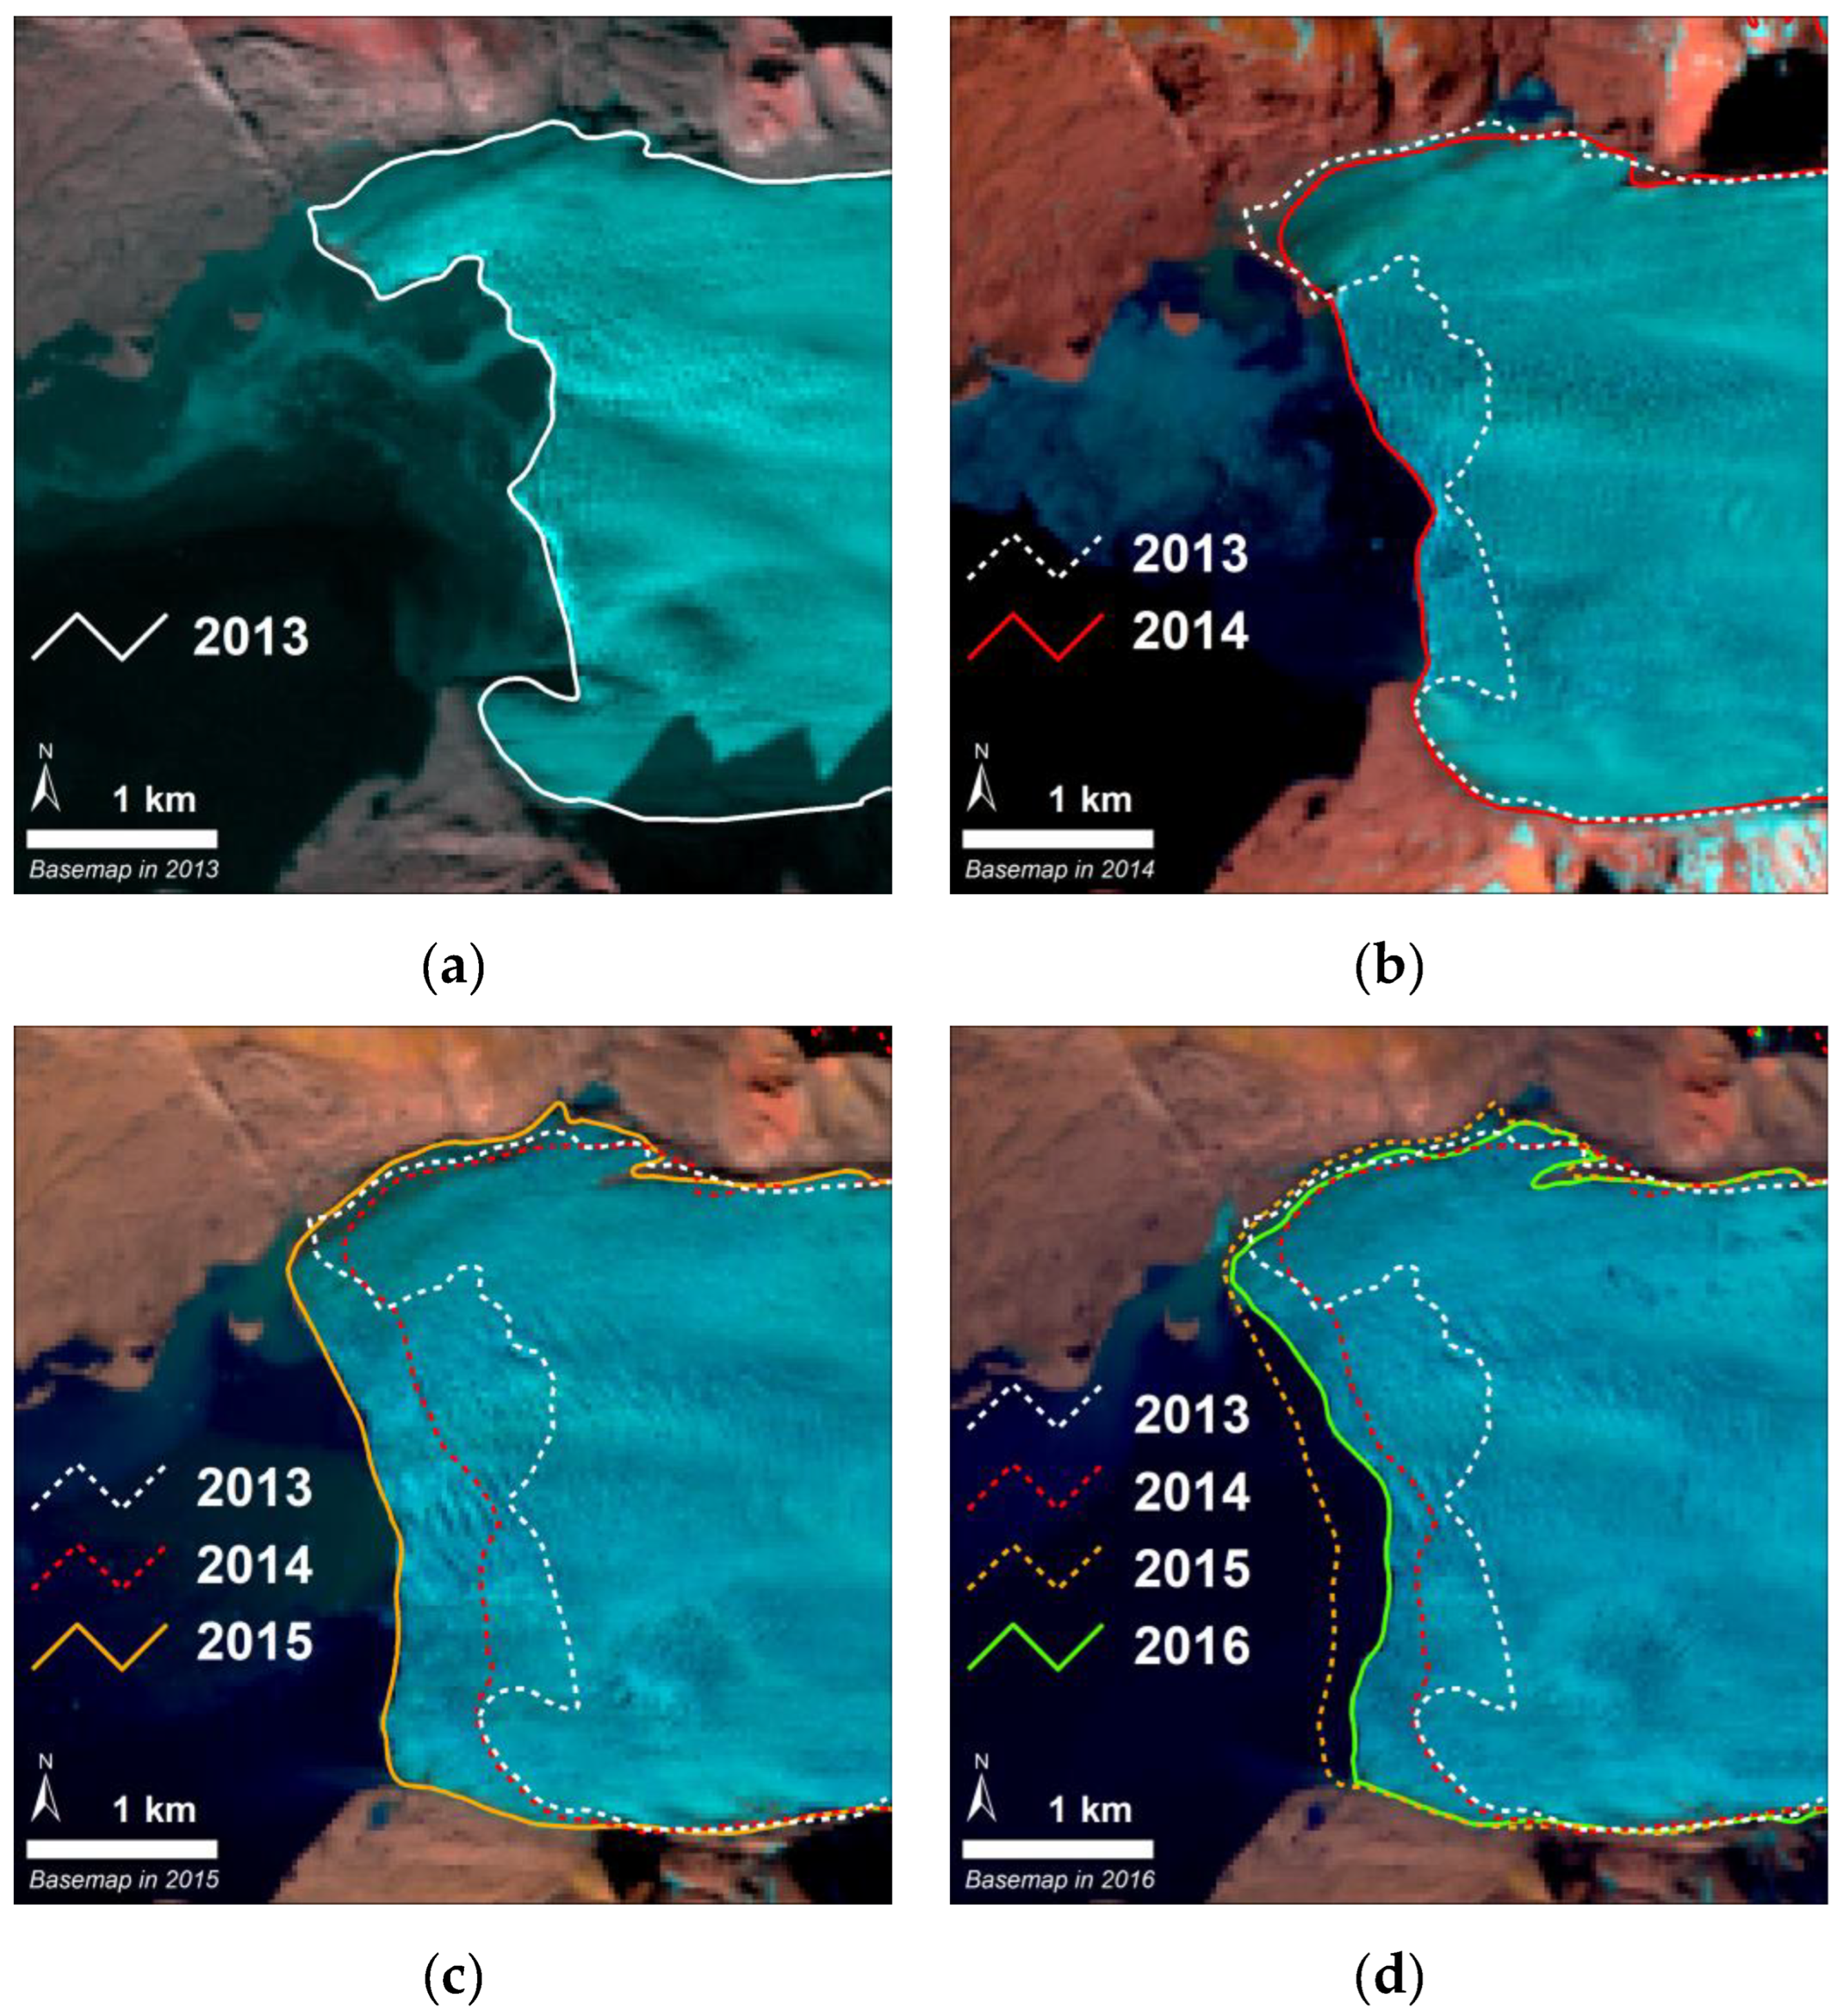
Figure 10.
The behavior of retreat pattern for each centerline along a glacier. The AA' has the most complex behavior that shows high variability through the yearly data, while Andreasbreen expresses the highest variability in the land glaciers. Other land glaciers, such as Waldemarbreen, Eivindbreen, and Oliverbreen, show relatively stable retreat behavior. The boxplot with the central black line being the median, the hollow black square being the mean, the box range representing the interquartile 25th, 75th, and the whiskers are the 5th and 95th percentile ranges as shown in the right corner.
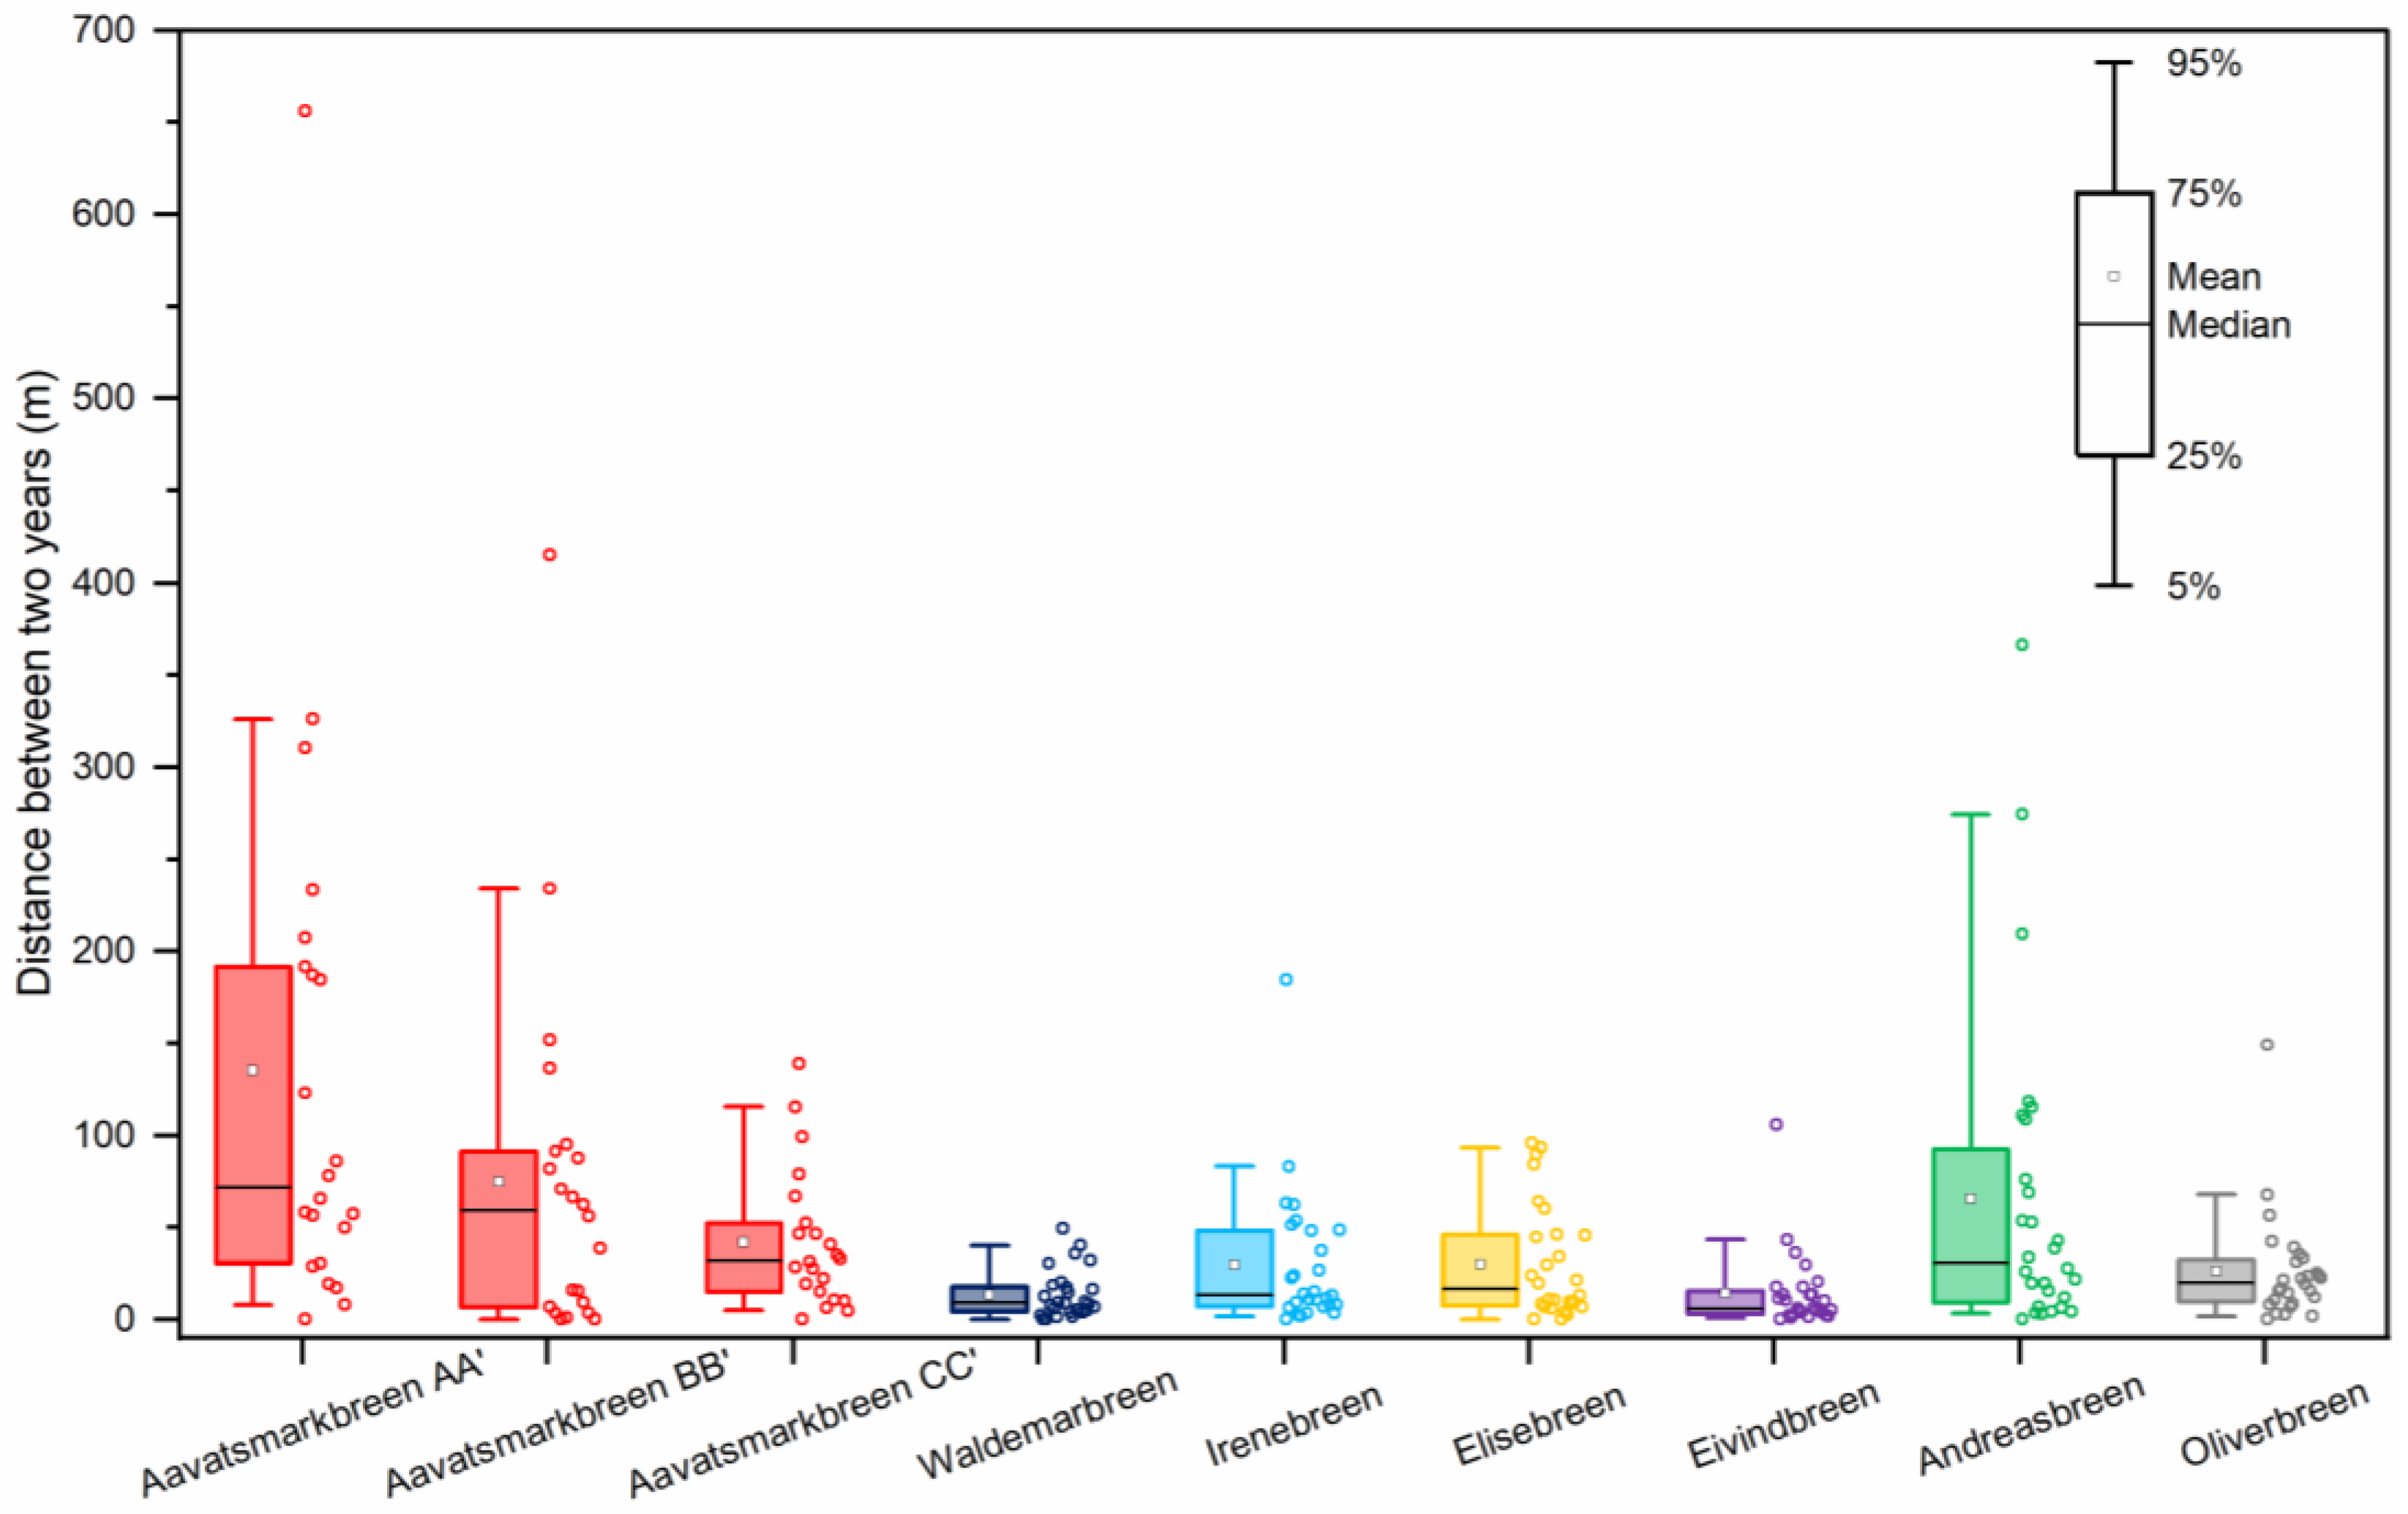
Figure 11.
The graph demonstrates the annual mean temperatures in Ny-Ålesund station, 25km north of the Kaffiøyra. The average rate is increasing by close to 0.09 ºC per year.
Figure 11.
The graph demonstrates the annual mean temperatures in Ny-Ålesund station, 25km north of the Kaffiøyra. The average rate is increasing by close to 0.09 ºC per year.
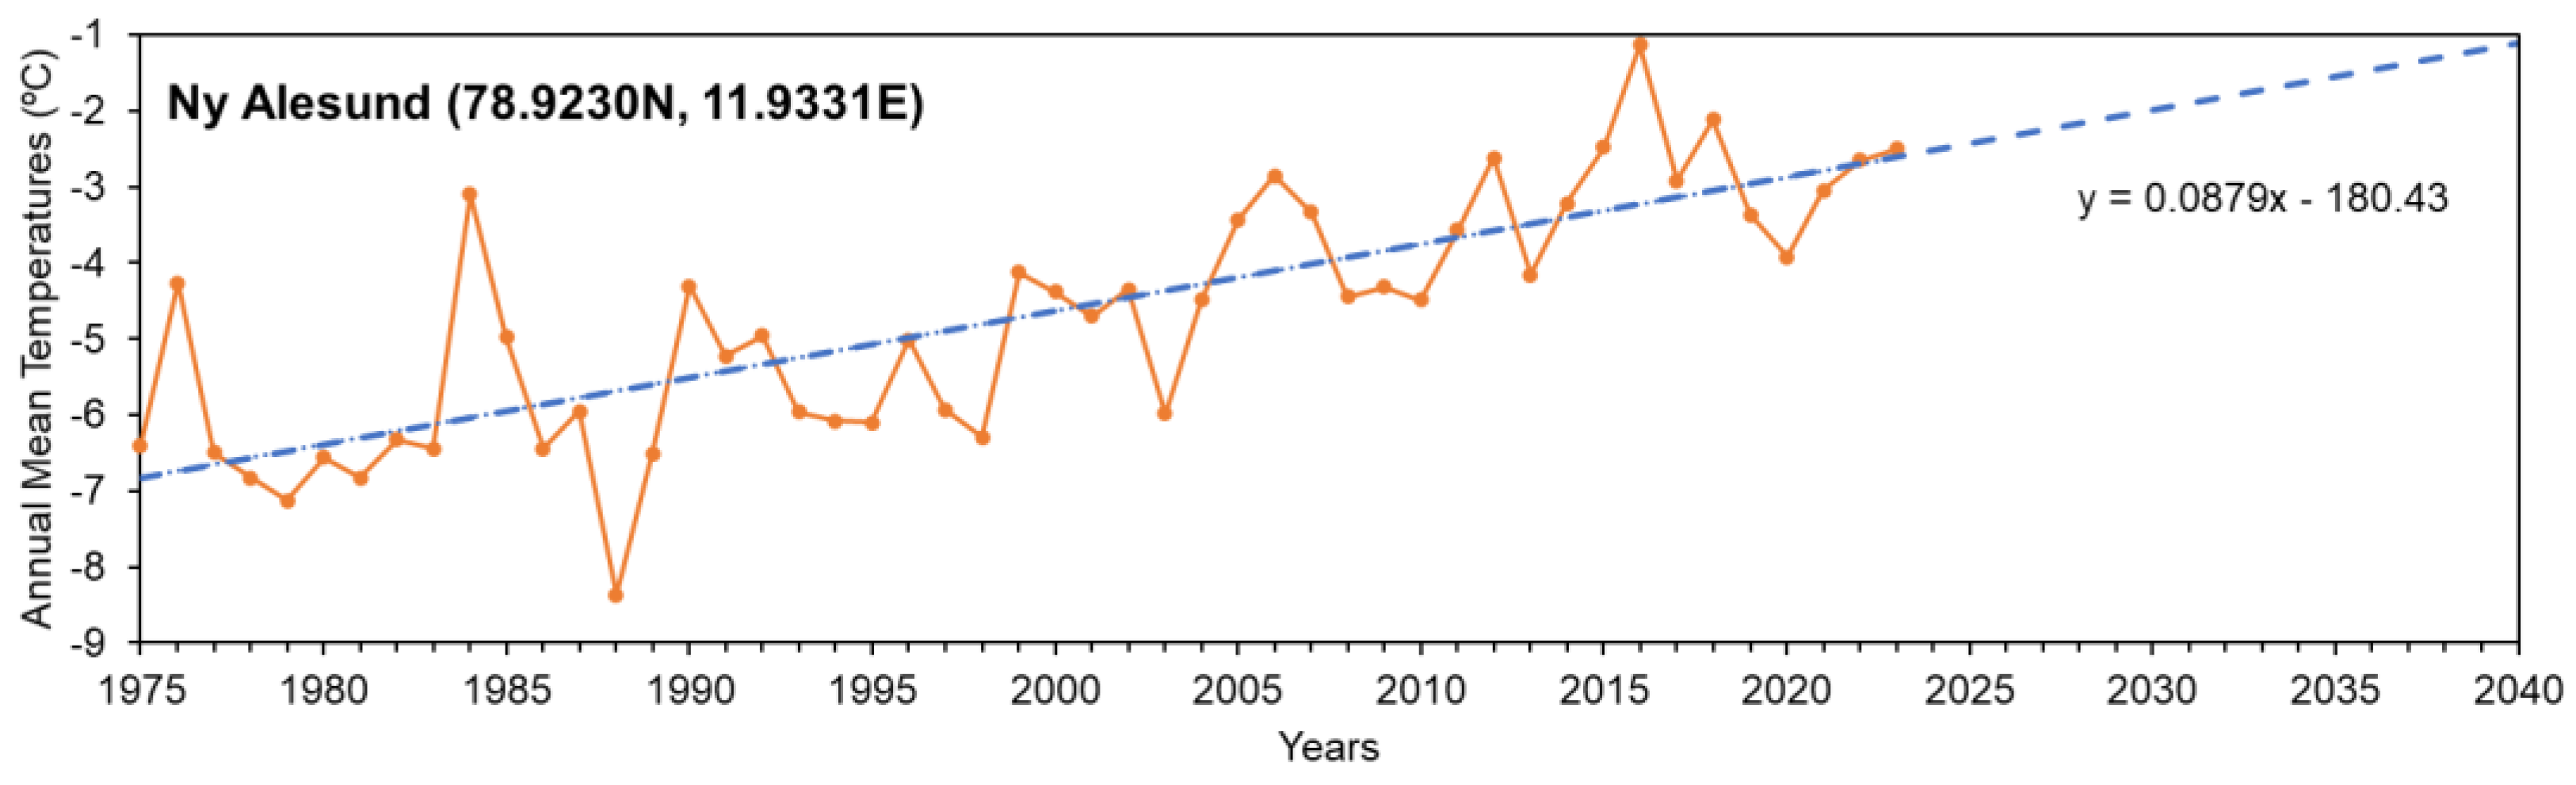
Figure 12.
The graph shows the summertime (i.e., June, July, and August) mean temperatures in Ny-Ålesund station. The green dash box is the linear trend for the next 20 years. The temperature will be used to predict the glacier's remaining area at the same period.
Figure 12.
The graph shows the summertime (i.e., June, July, and August) mean temperatures in Ny-Ålesund station. The green dash box is the linear trend for the next 20 years. The temperature will be used to predict the glacier's remaining area at the same period.
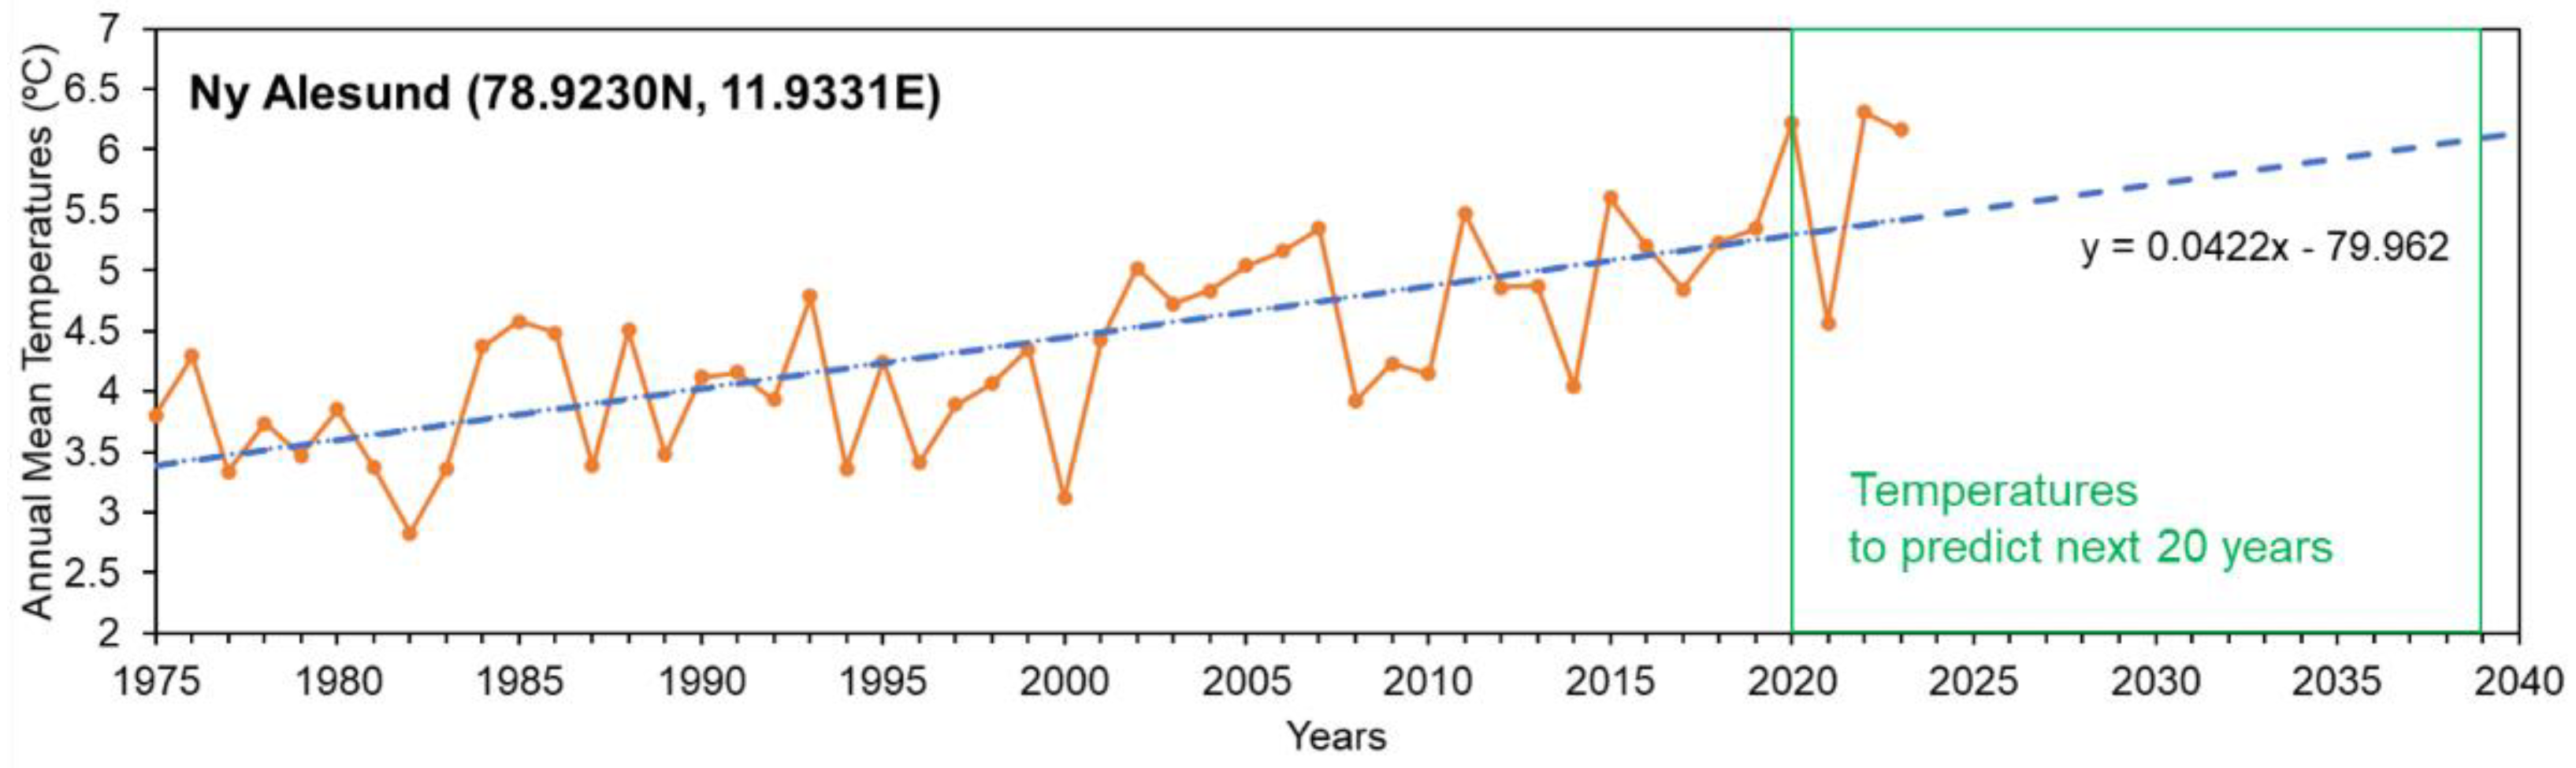
Figure 13.
The correlation between summertime mean temperature and glacier remaining areas after using the z-score normalization: (a) Aavatsmarkbreen, (b) Waldemarbreen, (c) Irenebreen, (d) Elisebreen, (e) Eivindbreen, (f) Andreasbreen, and (g) Oliverbreen.
Figure 13.
The correlation between summertime mean temperature and glacier remaining areas after using the z-score normalization: (a) Aavatsmarkbreen, (b) Waldemarbreen, (c) Irenebreen, (d) Elisebreen, (e) Eivindbreen, (f) Andreasbreen, and (g) Oliverbreen.
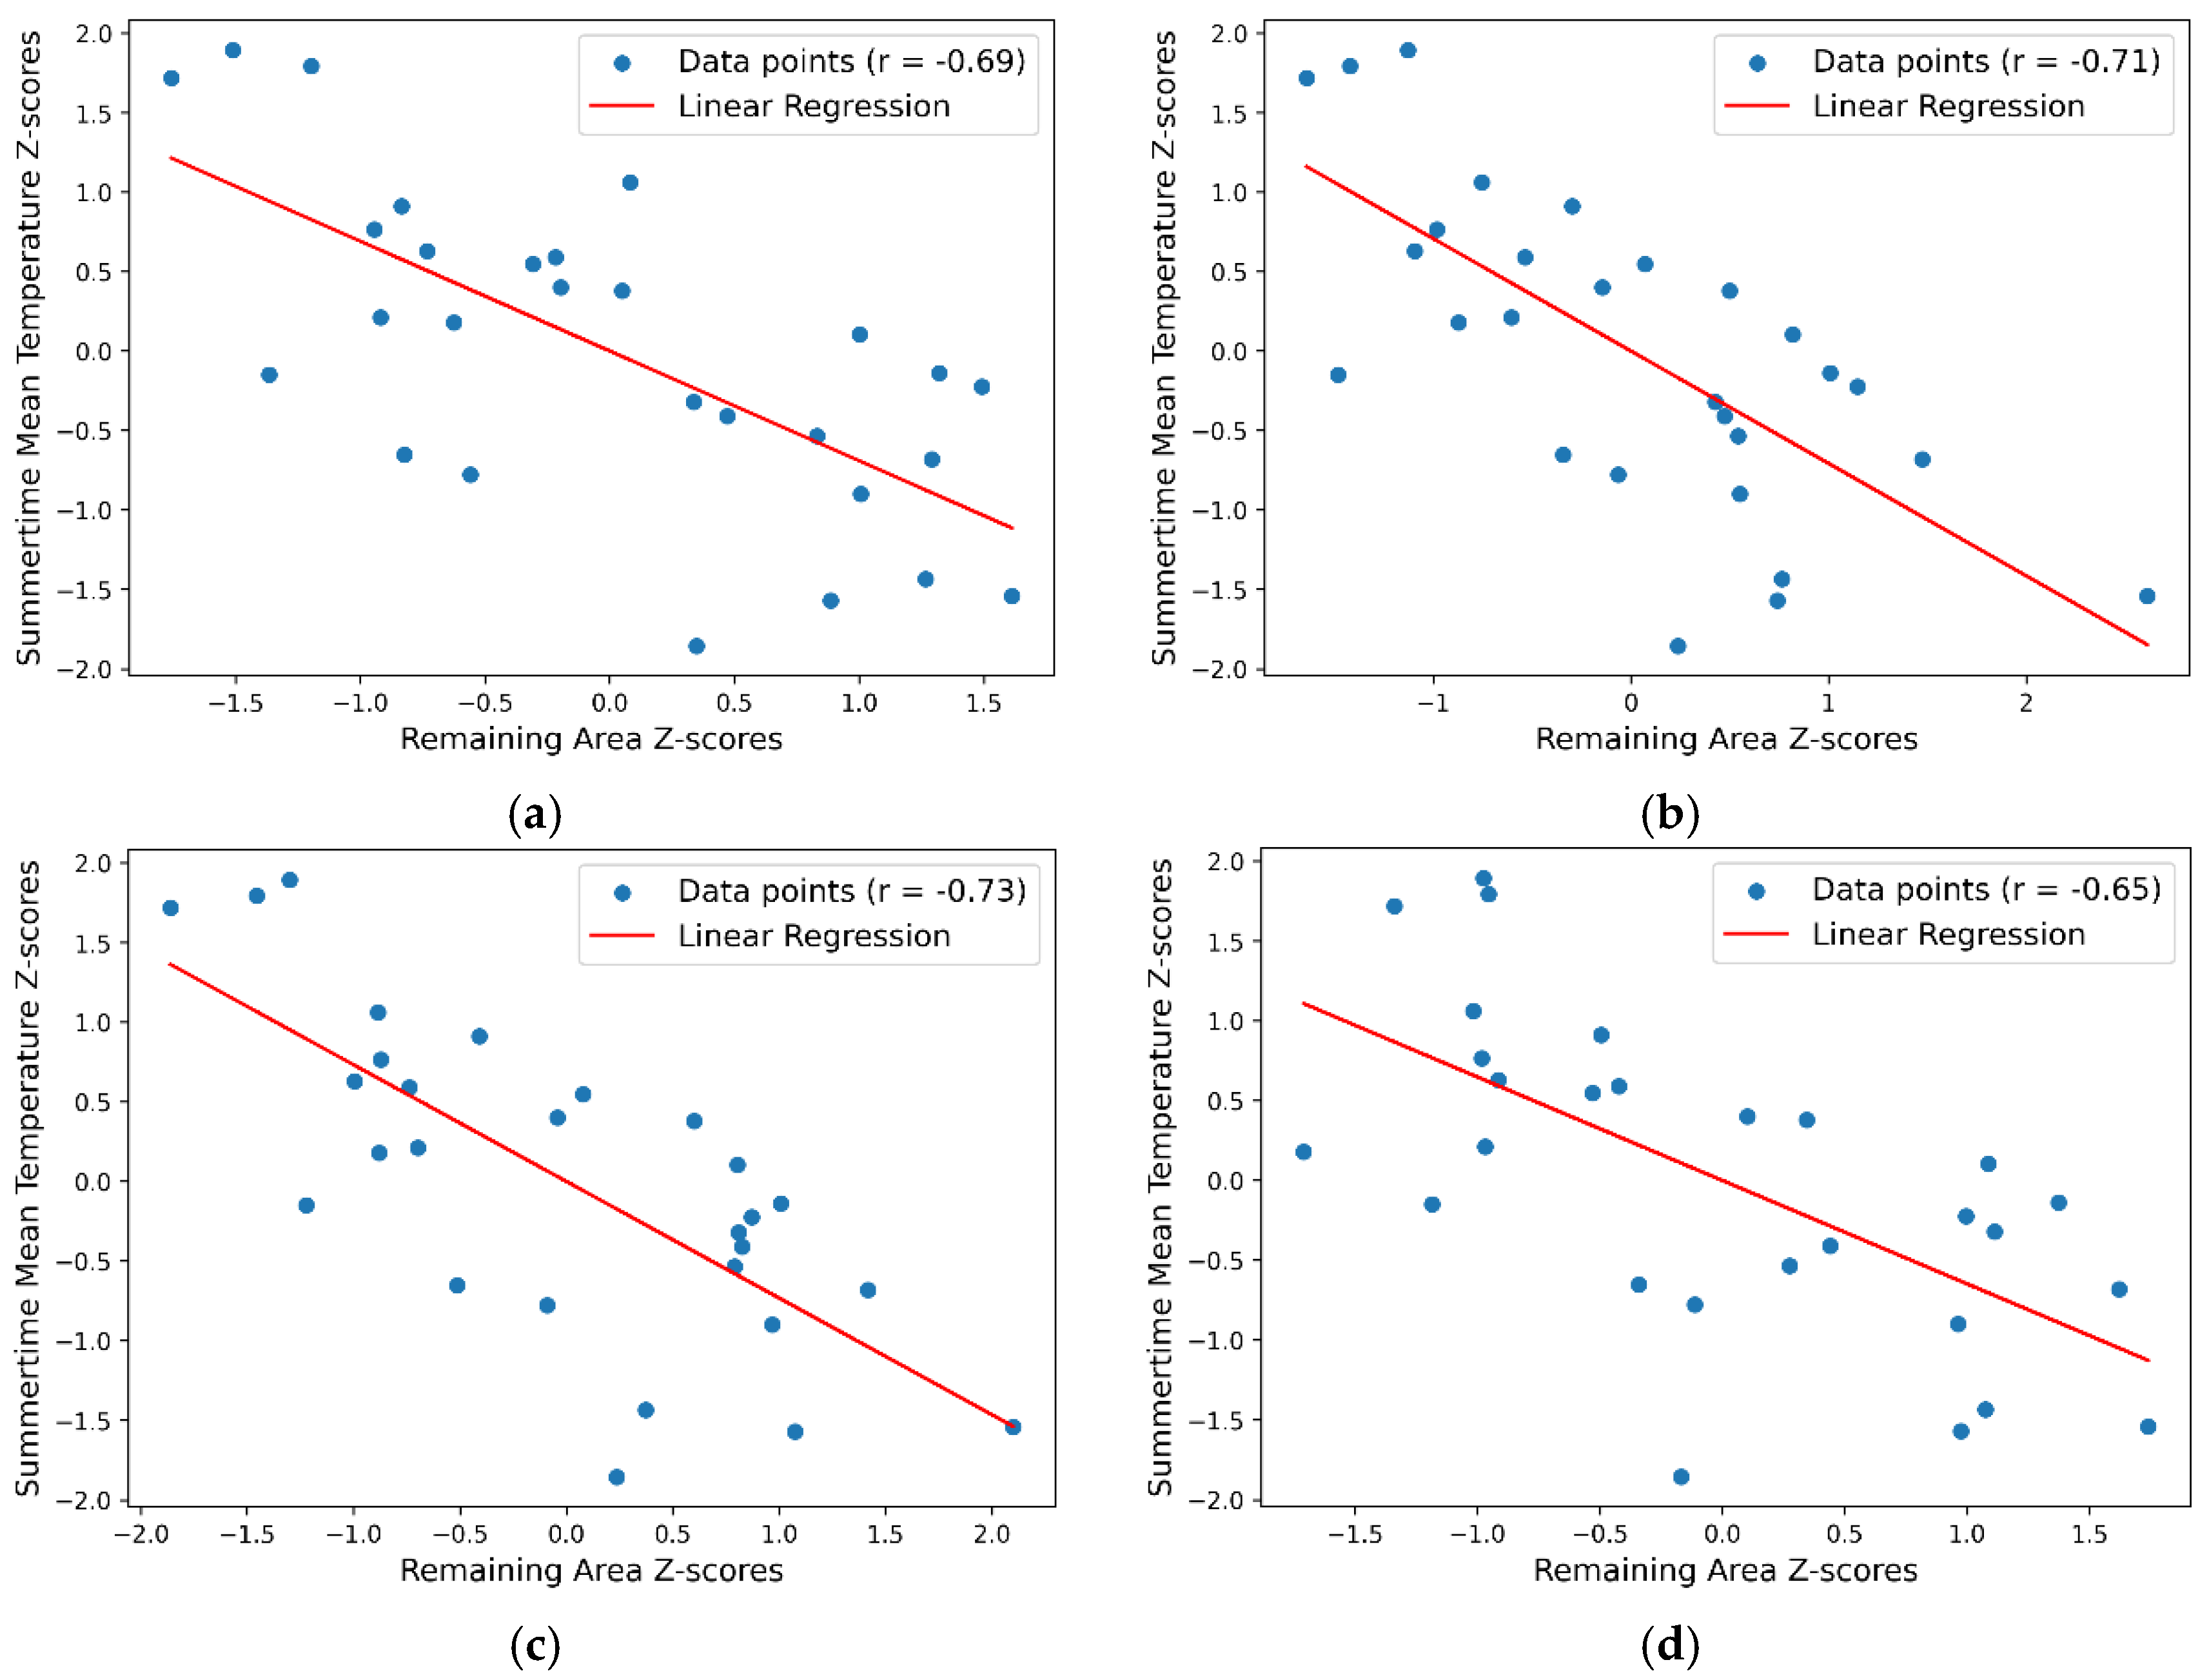
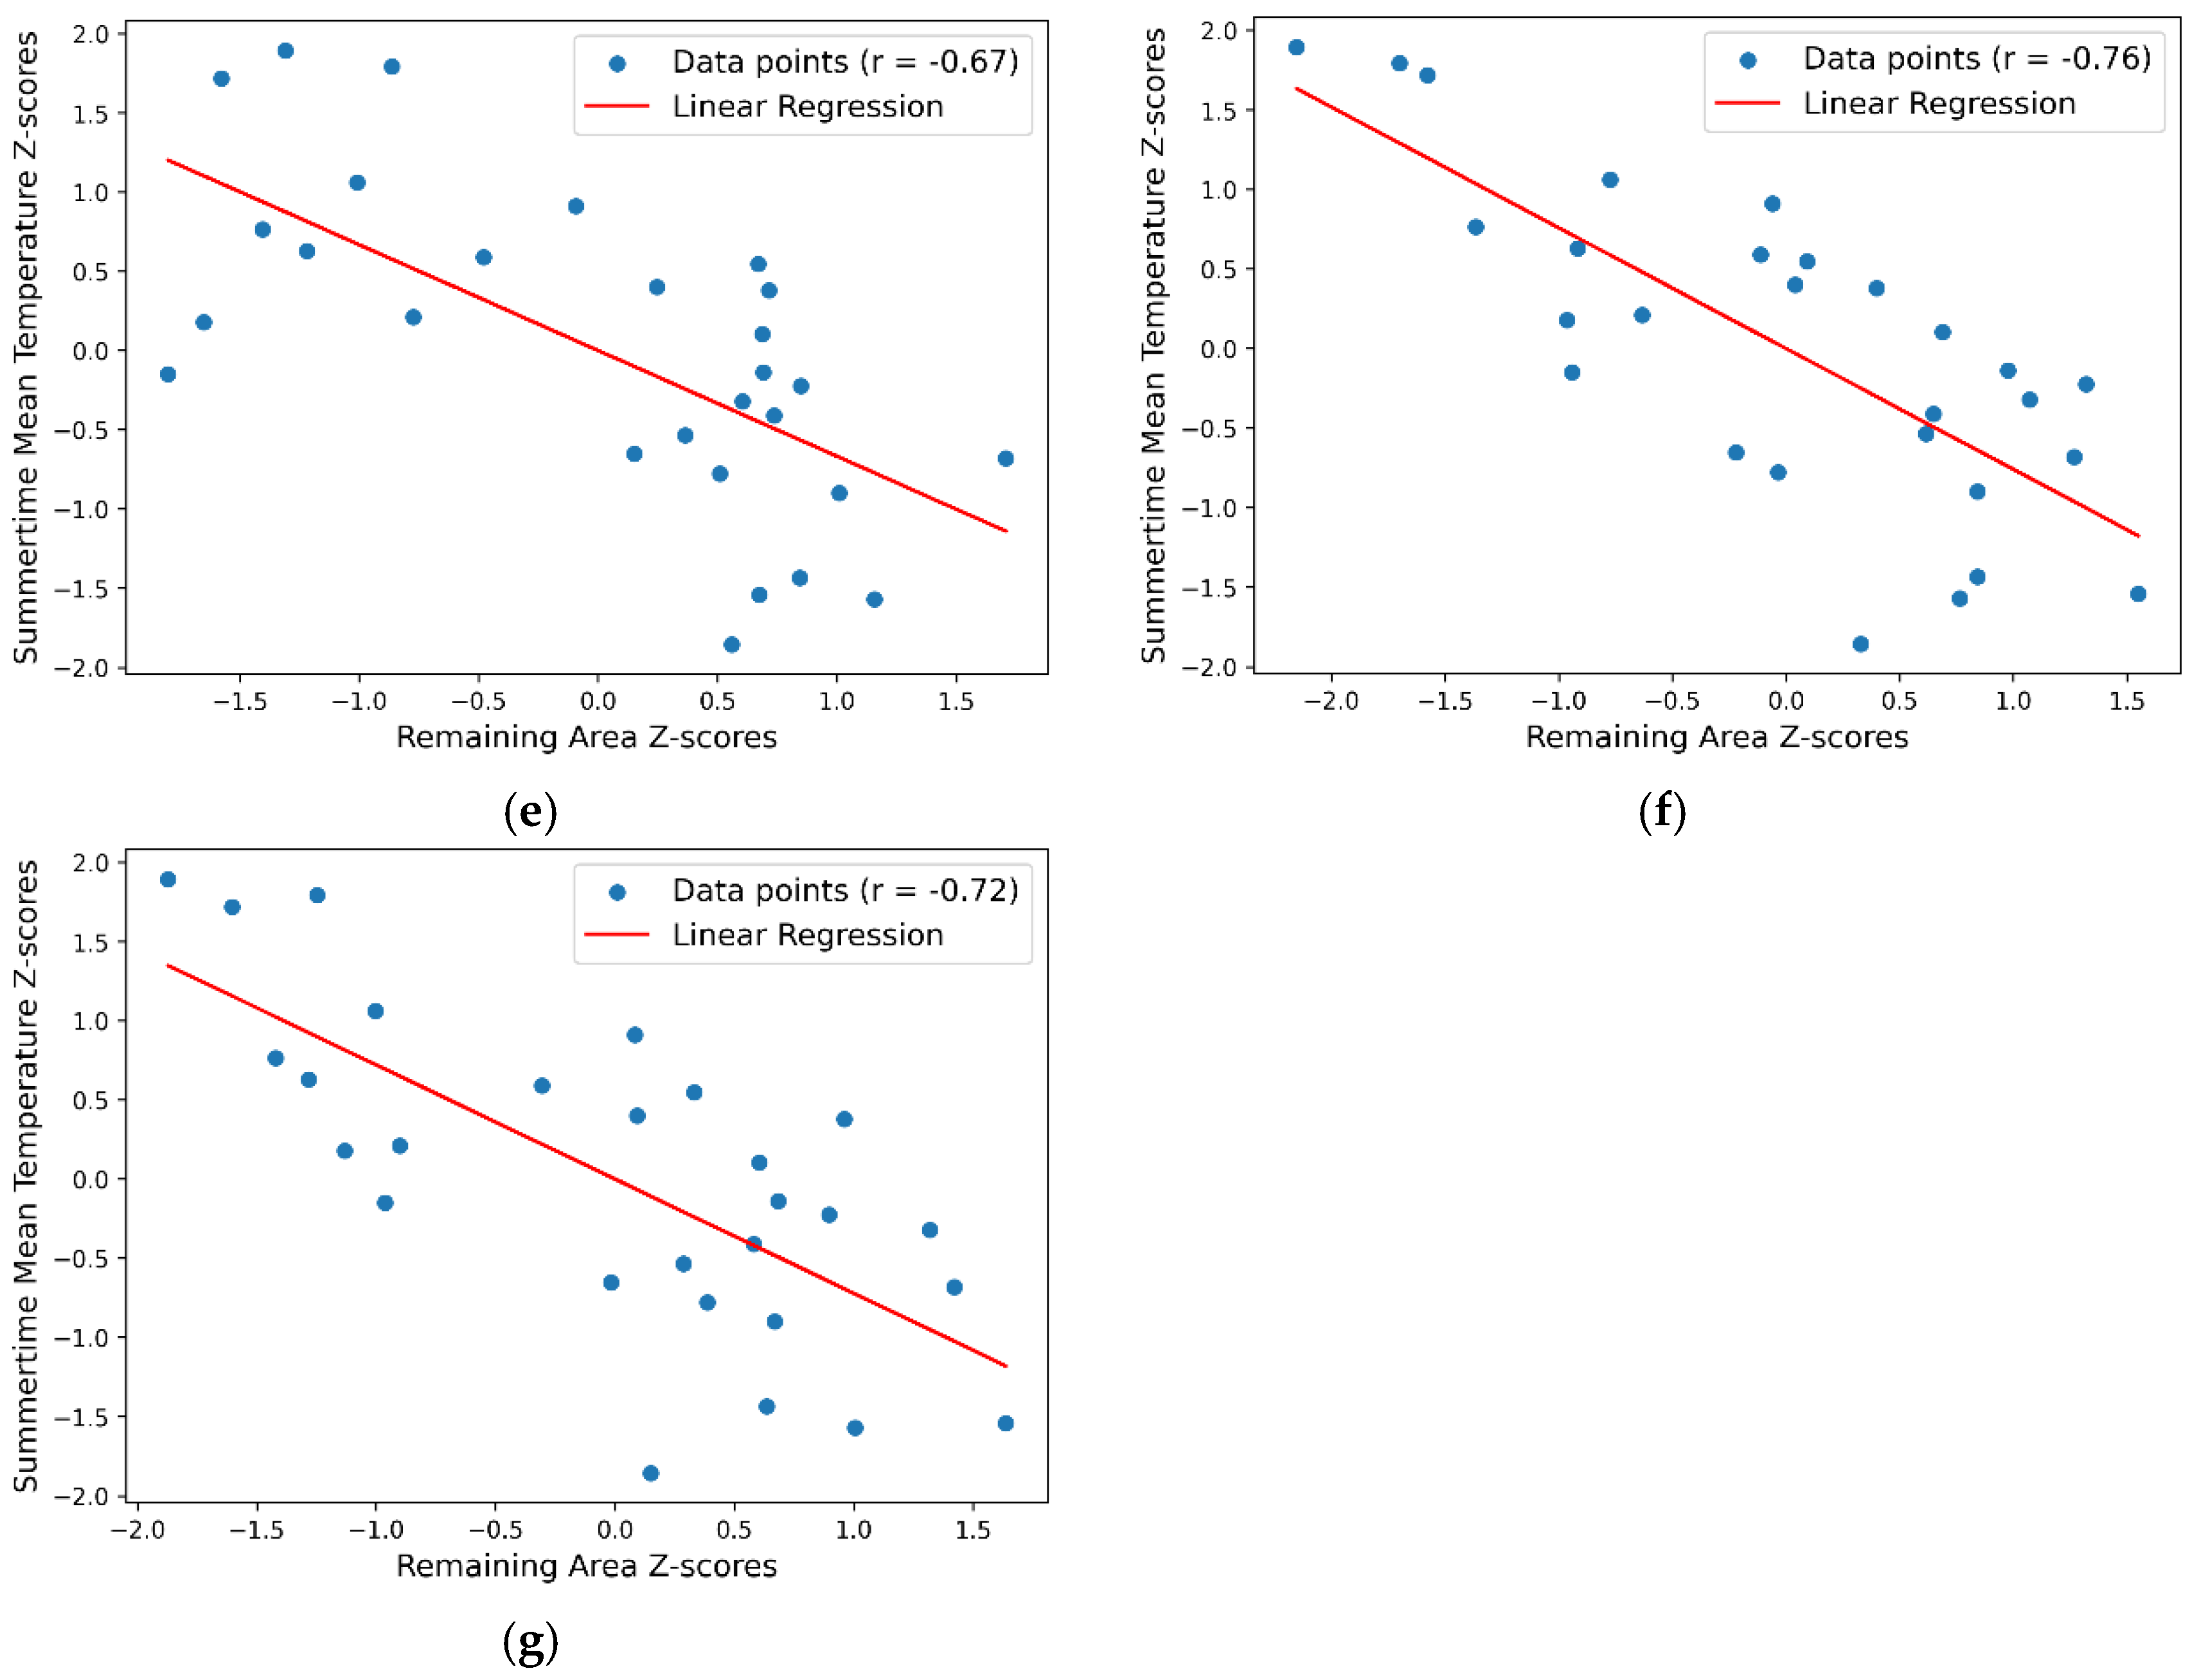
Figure 14.
The future temperature predictions and the associated glacier remaining areas for 2020 – 2039. The inputs of the average temperatures in the summertime are the maximum, minimum, and average values from the climate change scenarios (SSP1-2.6, SSP2-4.5, SSP3-7.0, SSP5-8.0) and the ground observations collected at Ny-Ålesund station.
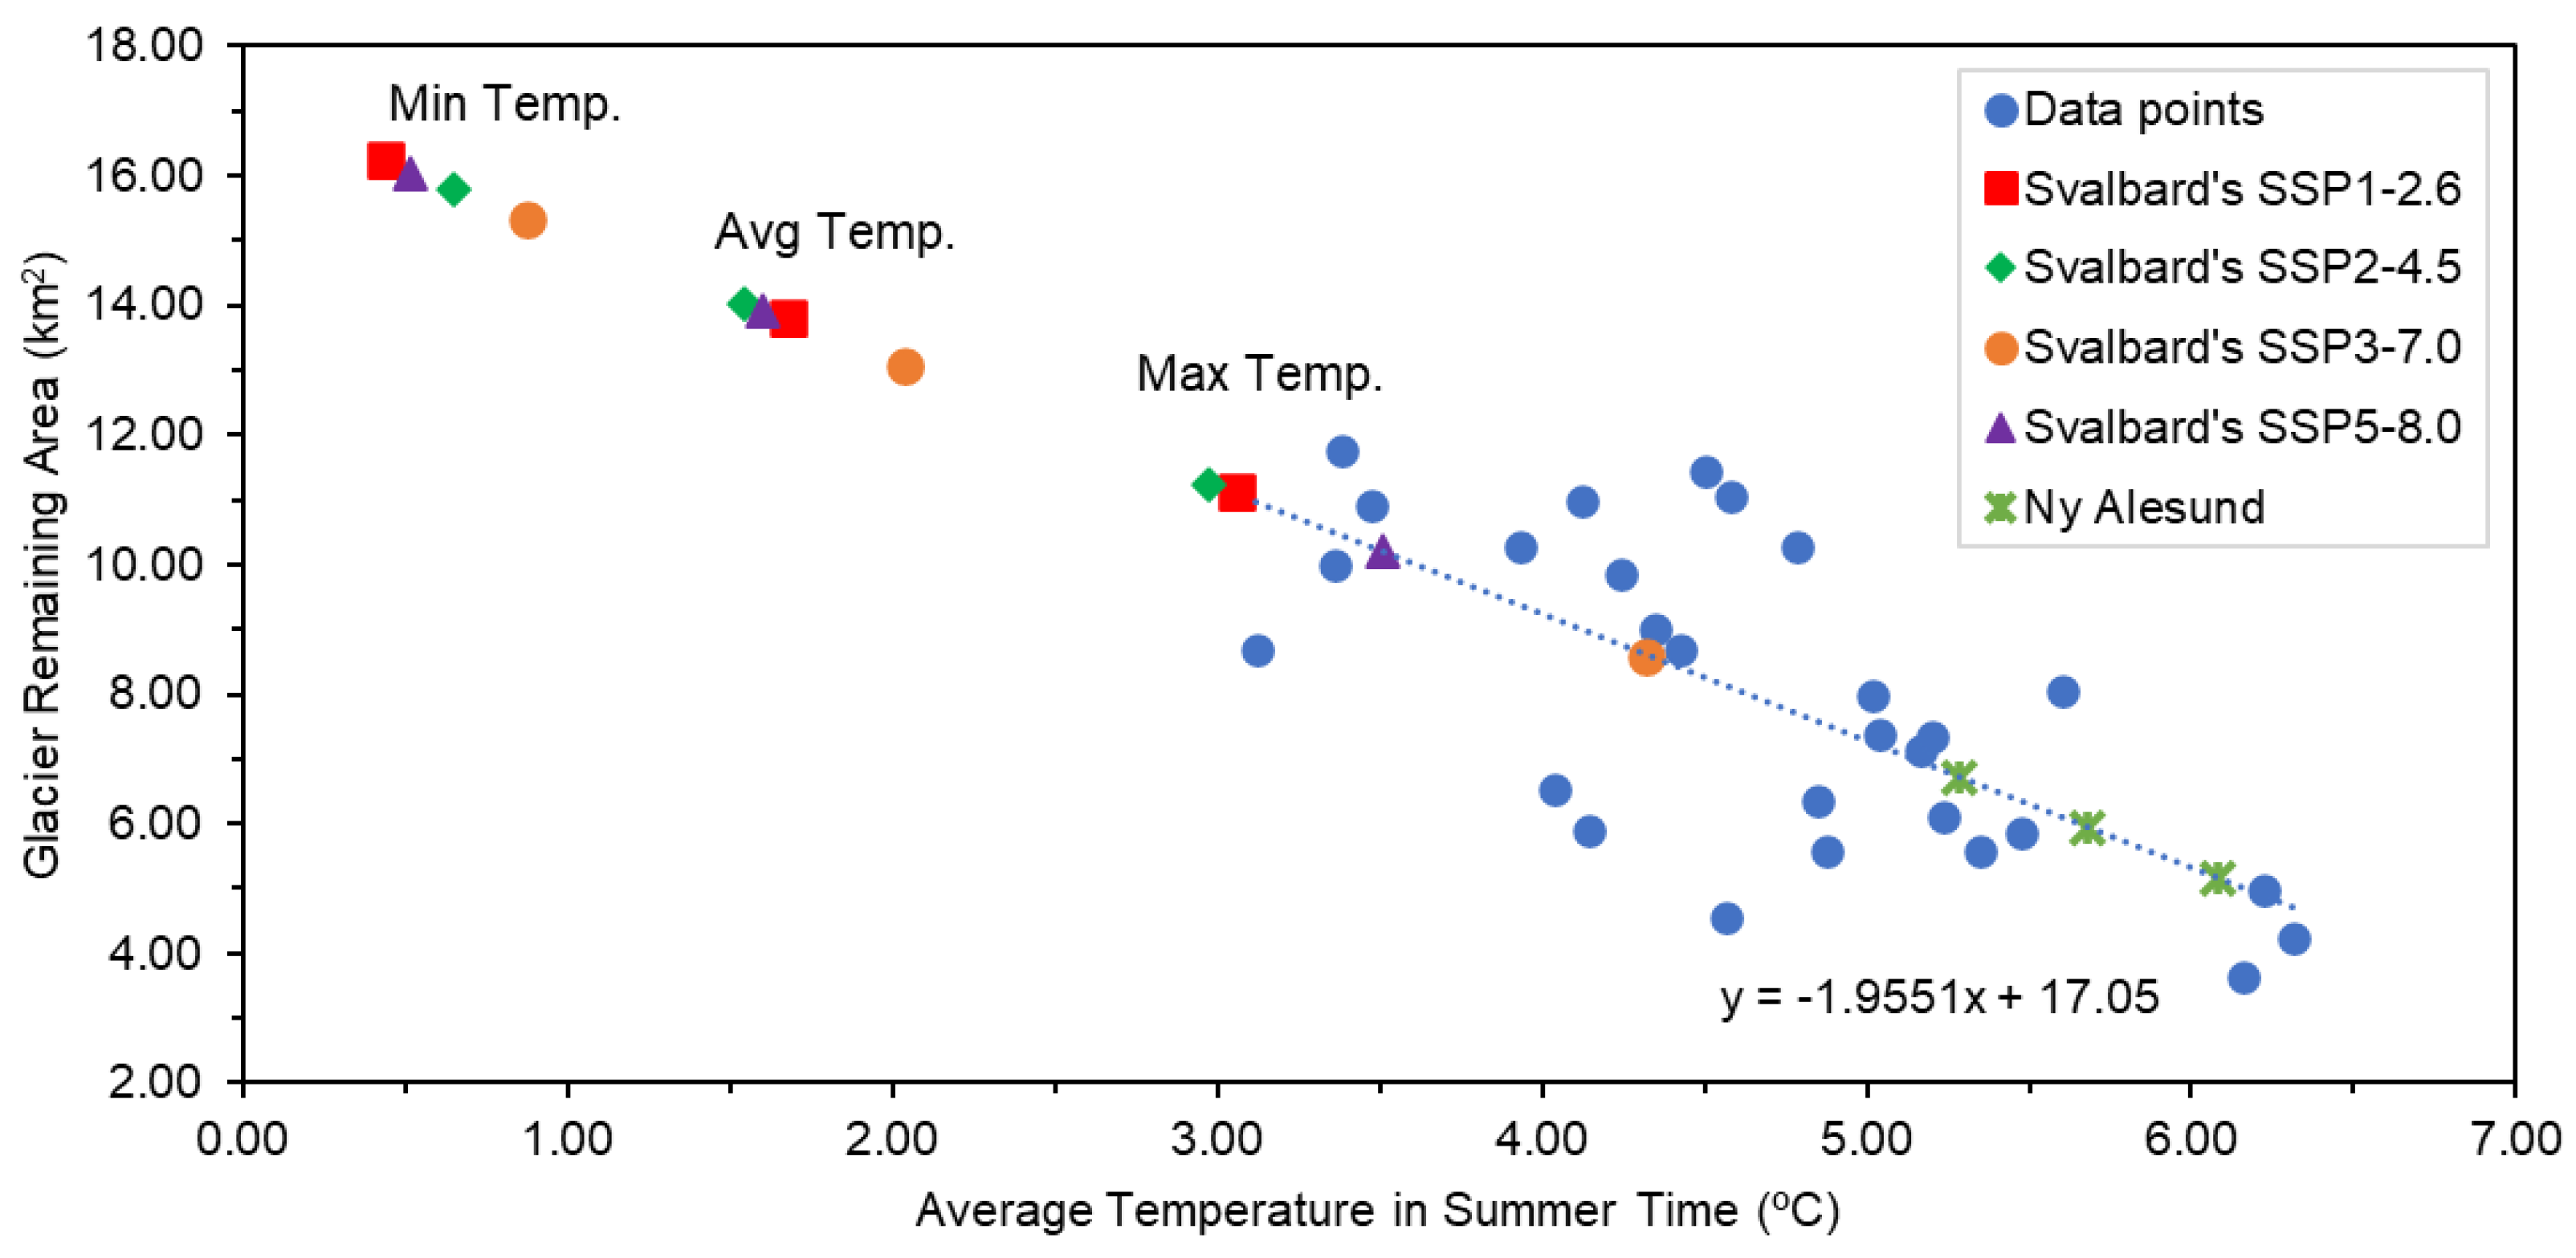
Figure 15.
The results of the outwash area changes from 1985 to 2023. The small chart in the right corner shows the percentage of the outwash area in 2023 compared to 1985.
Figure 15.
The results of the outwash area changes from 1985 to 2023. The small chart in the right corner shows the percentage of the outwash area in 2023 compared to 1985.
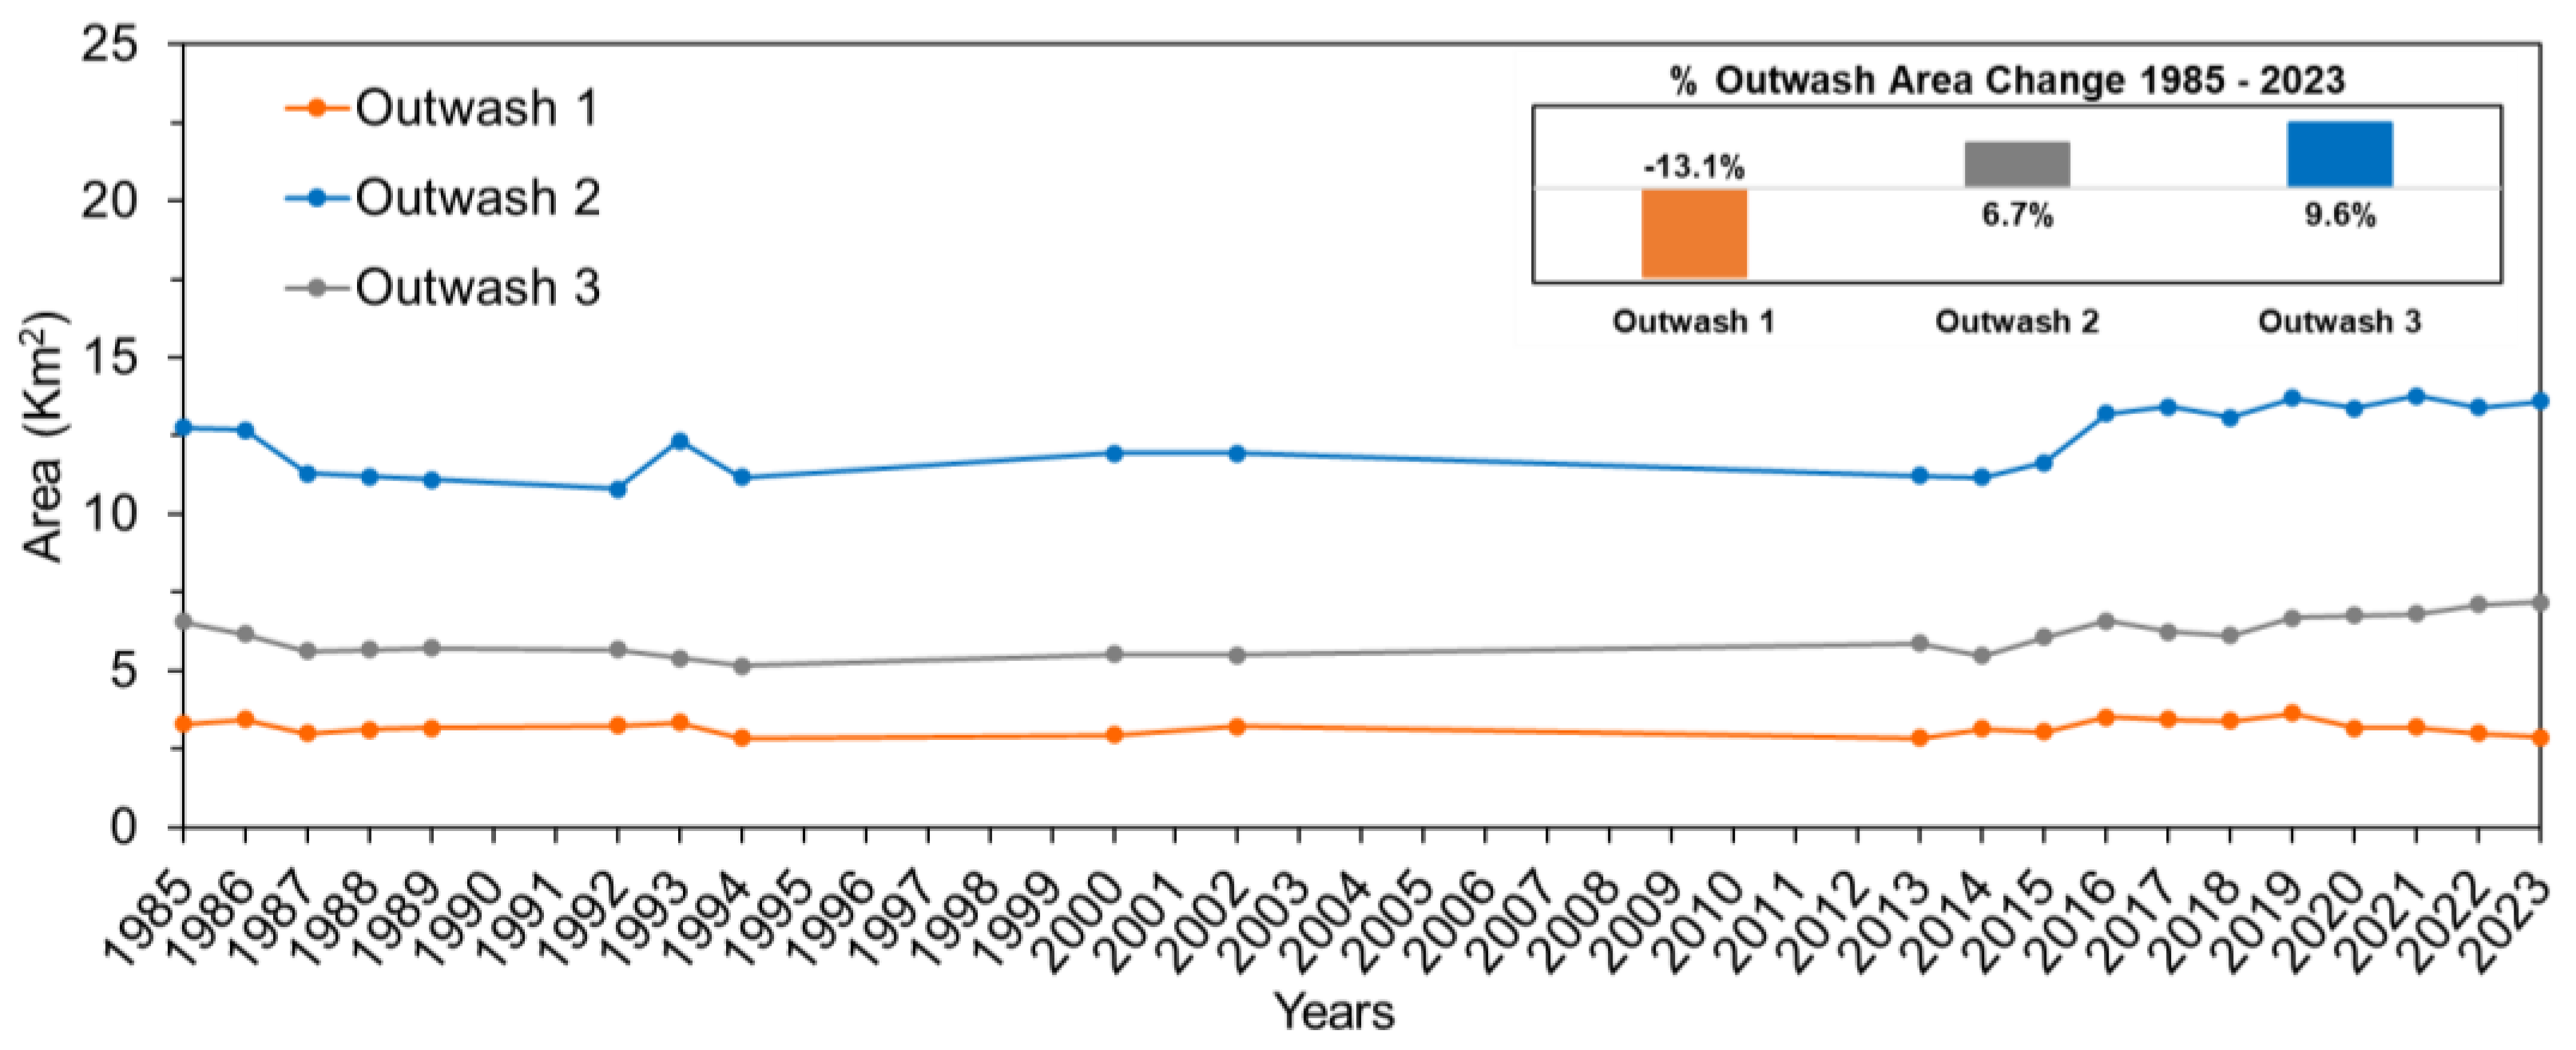
Table 1.
The Landsat images data acquisition: essential information.
| No. | Sensor | Frame | Acquisition date | Spatial resolution (m) |
|---|---|---|---|---|
| 1 | Landsat 4-5 TM | 216/004 | 1985/08/30 | 30 |
| 2 | Landsat 4-5 TM | 217/004 | 1986/07/07 | 30 |
| 3 | Landsat 4-5 TM | 217/004 | 1987/07/10 | 30 |
| 4 | Landsat 4-5 TM | 221/003 | 1988/07/24 | 30 |
| 5 | Landsat 4-5 TM | 219/003 | 1989/07/29 | 30 |
| 6 | Landsat 4-5 TM | 221/003 | 1990/06/28 | 30 |
| 7 | Landsat 4-5 TM | 215/004 | 1992/08/26 | 30 |
| 8 | Landsat 4-5 TM | 220/003 | 1993/07/15 | 30 |
| 9 | Landsat 4-5 TM | 219/003 | 1994/08/28 | 30 |
| 10 | Landsat 4-5 TM | 215/004 | 1995/08/19 | 30 |
| 11 | Landsat 7 ETM+ | 218/003 | 1999/07/10 | 30 |
| 12 | Landsat 7 ETM+ | 214/004 | 2000/08/17 | 30 |
| 13 | Landsat 7 ETM+ | 214/004 | 2001/06/17 | 30 |
| 14 | Landsat 7 ETM+ | 219/003 | 2002/07/09 | 30 |
| 15 | Landsat 7 ETM+ | 220/003 | 2005/07/24 | 30, scanline error |
| 16 | Landsat 4-5 TM | 216/004 | 2006/07/23 | 30 |
| 17 | Landsat 7 ETM+ | 219/003 | 2010/07/31 | 30, scanline error |
| 18 | Landsat 7 ETM+ | 220/003 | 2011/07/25 | 30, scanline error |
| 19 | Landsat 8 OLI/TIRS | 217/004 | 2013/09/19 | 30 |
| 20 | Landsat 8 OLI/TIRS | 029/240 | 2014/07/15 | 30 |
| 21 | Landsat 8 OLI/TIRS | 216/004 | 2015/08/01 | 30 |
| 22 | Landsat 8 OLI/TIRS | 216/004 | 2016/07/02 | 30 |
| 23 | Landsat 8 OLI/TIRS | 220/003 | 2017/08/02 | 30 |
| 24 | Landsat 8 OLI/TIRS | 025/241 | 2018/07/30 | 30 |
| 25 | Landsat 8 OLI/TIRS | 215/004 | 2019/08/21 | 30 |
| 26 | Landsat 8 OLI/TIRS | 215/004 | 2020/08/23 | 30 |
| 27 | Landsat 8 OLI/TIRS | 216/004 | 2021/08/10 | 30 |
| 28 | Landsat 8 OLI/TIRS | 221/003 | 2022/08/23 | 30 |
| 29 | Landsat 8 OLI/TIRS | 221/003 | 2023/08/09 | 30 |
Table 2.
Data processing of Landsat Toolbox to extract the interest objects.
| No. | Processes | Description |
|---|---|---|
| 1 | Download and Extract images | https://eathexplorer.usgs.gov/ |
| 2 | Landsat Tasseled Cap | Calculate the Tasseled Cap brightness, greenness, and wetness transformations. Normalize the band values to 0-255 |
| 3 | Normalized Difference Moisture Index (NDMI)/ Normalized Difference Vegetation Index (NDVI) | Calculate the Normalize Difference Moisture Index (NDMI) and Normalized the band values to 0-255 |
| 4 | Category Creation for Land & Object (sea, glacier, outwash) | Take Tasseled Cap and NDMI bands as input and create a 10-class land cover data set and dendrogram |
| 5 | Classify Land and Object | Reclass the land cover data set from 10 to 2 classes |
| 6 | Create Object Boundary | Create an object boundary from the 2-class land cover data set using Majority filtering, Contour, and Smooth line commands. |
| 7 | Output Interesting Object | Correct for cloud/surf/beach |
Table 3.
The statistical metrics and the definition of the transects for the study to calculate the shoreline variations.
Table 3.
The statistical metrics and the definition of the transects for the study to calculate the shoreline variations.
| No. | Statistical metric | Unit | Definition of metric |
|---|---|---|---|
| 1 | NSM | m | Distance between the earliest and the latest shorelines |
| 2 | SCE | m | The longest distance among all the shorelines |
| 3 | EPR | m/yr | Shoreline movement distance divided by time (NSM/time) |
| 4 | LRR | m/yr | Fitting a least-square regression line to all shoreline points |
Table 4.
The LRR and NSM values for each zone and the percentage of erosion and accretion for each zone.
Table 4.
The LRR and NSM values for each zone and the percentage of erosion and accretion for each zone.
| Zone | Number of transects |
Approximate lengths of zone (km) | LRR ± Confidence Interval 95%1 (m/yr) |
LRR average (m/yr) | NSM range (m) | NSM average (m) | Percentage of accretion (%) | Percentage of erosion (%) | |
|---|---|---|---|---|---|---|---|---|---|
| Min. | Max. | ||||||||
| 1 | 255 | 4.5 | -2.2 ± 0.62 | 2.3 ± 0.73 | -0.1 | -46.19 – 97.43 | 26.07 | 43.1 | 56.9 |
| 2 | 122 | 8.3 | -64.7 ± 9.37 | 9.2 ± 2.92 | -25.4 | -2762.0 – 425.9 | -955.3 | 30.0 | 70.0 |
| 3 | 1058 | 21 | -1.1 ± 0.76 | 3.7 ± 1.62 | 0.5 | -25.88 – 153.8 | 55.92 | 76.7 | 23.3 |
| 4 | 152 | 3 | -39.0 ± 4.97 | 0.7 ± 0.78 | -27.5 | -1654.0 – 30.12 | -1002.0 | 3.3 | 96.7 |
| 5 | 305 | 5.5 | -1.7 ± 0.87 | 1.7 ± 0.71 | 0.2 | -56.23 – 215.0 | 21.38 | 77.7 | 22.3 |
1 The values in the Min. and Max. columns represent the Linear Regression Rate (LRR) ± the 95% Confidence Interval, indicating the range of possible LRR values with 95% certainty.
Table 5.
The annual regression rate of glacier termini is based on the centerlines.
| No. | Glacier | Average Regression Rate (m/yr) | |||
|---|---|---|---|---|---|
| 1985 - 2023 | Average on tidewater/land glacier |
10-year recent boundaries | 2019 - 2023 | ||
| 1 | Aavatsmarkbreen AA' | 62.93 | 43.74 | 83.97 | 210.48 |
| 2 | Aavatsmarkbreen BB' | 48.69 | 33.49 | 75.13 | |
| 3 | Aavatsmarkbreen CC’ | 19.62 | -3.16 | 165.57 | |
| 4 | Waldemarbreen | 9.24 | 20.24 | 9.97 | 17.64 |
| 5 | Elisebreen | 19.48 | 8.10 | 60.69 | |
| 6 | Irenebreen | 22.96 | 23.78 | 30.45 | |
| 7 | Eivindbreen | 7.03 | 7.04 | 21.25 | |
| 8 | Andreasbreen | 43.74 | 98.94 | 101.02 | |
| 9 | Oliverbreen | 18.99 | 18.17 | 31.53 | |
Table 6.
The results of the correlation coefficient between summertime mean temperature and the glacier's remaining areas.
Table 6.
The results of the correlation coefficient between summertime mean temperature and the glacier's remaining areas.
| No. | Glacier | |
|---|---|---|
| 1 | Aavatsmarkbreen | -0.69 |
| 2 | Waldemarbreen | -0.71 |
| 3 | Irenebreen | -0.73 |
| 4 | Elisebreen | -0.65 |
| 5 | Eivindbreen | -0.67 |
| 6 | Andreasbreen | -0.76 |
| 7 | Oliverbreen | -0.72 |
Table 7.
The predicted Aavatsmarkbreen remaining areas for 2020-2039 results using SSPs and Ny-Ålesund station temperature data.
Table 7.
The predicted Aavatsmarkbreen remaining areas for 2020-2039 results using SSPs and Ny-Ålesund station temperature data.
| Source | Summertime Mean Temperature (ºC) | Remaining Area (RA) (km2) | ||||
|---|---|---|---|---|---|---|
| Min. | Avg. | Max. | Min. | Avg. | Max. | |
| SSP1-2.6 | 0.44 | 1.68 | 3.06 | 16.25 | 13.81 | 11.13 |
| SSP2-4.5 | 0.65 | 1.54 | 2.98 | 15.78 | 14.04 | 11.23 |
| SSP3-7.0 | 0.87 | 2.04 | 4.32 | 15.34 | 13.07 | 8.60 |
| SSP5-8.0 | 0.52 | 1.60 | 3.51 | 16.03 | 13.91 | 10.19 |
| Ny-Ålesund | 5.28 | 5.68 | 6.08 | 6.72 | 5.94 | 5.16 |
Disclaimer/Publisher’s Note: The statements, opinions and data contained in all publications are solely those of the individual author(s) and contributor(s) and not of MDPI and/or the editor(s). MDPI and/or the editor(s) disclaim responsibility for any injury to people or property resulting from any ideas, methods, instructions or products referred to in the content. |
© 2024 by the authors. Licensee MDPI, Basel, Switzerland. This article is an open access article distributed under the terms and conditions of the Creative Commons Attribution (CC BY) license (http://creativecommons.org/licenses/by/4.0/).
Copyright: This open access article is published under a Creative Commons CC BY 4.0 license, which permit the free download, distribution, and reuse, provided that the author and preprint are cited in any reuse.


