

Submitted:
01 November 2024
Posted:
04 November 2024
You are already at the latest version
Abstract
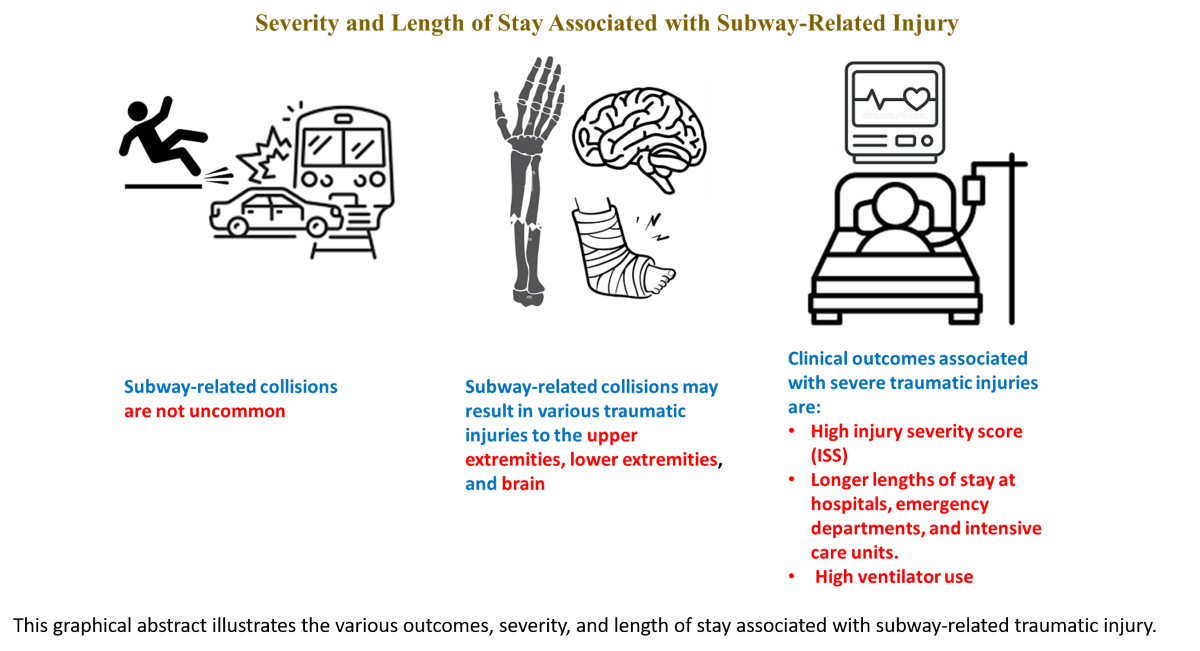
Objectives: There has been limited research on injuries related to subway incidents. Our study seeks to examine the seriousness of these injuries and the duration of hospital stays following subway accidents. This research has the potential to enhance the treatment of trauma patients and deepen our understanding of injuries associated with subway incidents.Methods: This is a retrospective, single-center study of patients with subway-related injuries admitted to a level 1 trauma center from 2016 to 2023. Patients were identified based on the cause and injury mechanism of subway-related trauma incidents. Descriptive statistics, ANOVA, and Pearson correlation analyses were performed on length of stays and ISS, with significance set at p < 0.01.Results: Over 8 years, we identified 383 patients who presented with subway injuries to our Level 1 ACS verified Trauma Center. 80.7 % of patients were male and 19.3% were females. The mean (SEM) age of the cohort was 47.36, with a standard deviation of 17.72. The mean Injury Severity Score (ISS) was 10.39, with a standard deviation of 11.01. The mean for Emergency department (ED) length of stay (LOS) is 12.33 (hours), 1.73 (days) for Intensive care unit (ICU) LOS, and 8.26 (days) for hospital (H) LOS. The age range which has the highest number of subway-related trauma incidents was in their 30s (n=82, 21.4%), followed by the age range 50 to 60 (n = 63, 16.4%), in their 40s (n= 62, 16.2%), and 20s (n= 57,14.9%). The ANOVA analysis shows significant differences in quality of care indicators (ED LOS, ICU LOS, HLOS, and ventilator days) based on injury severity metrics, with p-values below 0.05. Higher ISS are linked to longer lengths of stay and increased ventilator use. Pearson correlation analysis shows ED LOS negatively correlates with ICU LOS and ISS, demonstrating minor injuries may result in shorter ICU stays and no escalation of trauma care. Additionally, ICU LOS and HLOS are positively correlated, and both are moderately correlated with ISS, suggesting that more severe injuries lead to longer ICU and hospital stays. All correlations are significant at the 0.01 level (two-tailed).Conclusion: The individuals in the age group of 20 to 60 years experienced the highest trauma related to subways. The number of injured males was higher than females. Non-Hispanic individuals showed higher injury rates compared to Hispanic individuals. Injury rates in Whites were higher, followed by Blacks and Asians. The most common combinations of severe injuries were in the head, thorax, lower extremities, abdomen, and spine. Injured patients suffered from severe head and thorax injuries, which consequently affected the length of their hospital and ICU stay.
Keywords:
Subway
; trauma
; length of stay
; severity
; injury
Introduction
Subway systems are a critical component of urban transportation in the United States, facilitating the daily commutes of millions of passengers. However, subway-related injuries (SRIs) pose a significant public health challenge, particularly in densely populated cities like New York City (NYC), with a subway system that carried 2,027,286,000 riders in 2023 [1]. Between 1990 and 2003, NYC reported over 668 subway-related fatalities, with a substantial number of injuries resulting in severe trauma, including extremity fractures and amputations [2].
Research indicates that the majority of subway-related incidents stem from self-harm, with alcohol often playing a role in unintentional injuries [3]. Furthermore, in a retrospective analysis of 16 cases of subway rail electrocutions, Rabban et al. found that the most common mechanisms included suicide attempts and unintentional falls [4]. For instance, a study conducted at Bellevue Hospital in New York revealed that a significant percentage of patients involved in subway accidents were under the influence of substances at the time of their injuries [5].
The complexity and severity of these injuries often necessitate extensive medical intervention, including surgeries and prolonged hospital stays. Understanding the mechanisms and outcomes of SRIs is crucial for improving patient care and developing effective prevention strategies. Despite the high incidence of such injuries, there remains a lack of comprehensive studies on injuries associated with subway incidents. This study aims to fill this gap by analyzing the severity of injuries and length of hospital stay associated with subway-related trauma at a level 1 trauma center in the United States. This study can advance the understanding of SRIs and promote trauma quality improvement practices regionally and nationally.
Methods
This is a retrospective, single-center study of patients after SRIs admitted to a Level 1 trauma center in New York City from 2016 to 2023. This study has our center’s institutional review board (IRB) approval. Patients were identified based on the injury mechanism and AIS body region. The study population consisted of patients who experienced SRIs between January 1, 2016, and December 31, 2023. Patients who did not sustain SRIs were excluded. Extracted data include demographics, severity of injuries, length of stay (LOS) at the Emergency Department (ED), Intensive care unit (ICU), Hospital (H), and trauma type. The severity of traumatic injuries was determined using the Injury Severity Score (ISS) method. The Abbreviated Injury Severity (AIS) regions for patients were also evaluated, with regions of interest being head, face, neck, thorax, abdomen, spine, upper extremity, lower extremity, and external injuries. Furthermore, age groups (in years) were collected into nine groups: 10-19, 20-29, 30-39, 40-49, 50-59, 60-69, 70-79, 80-89, and 90-99. Descriptive statistics were calculated using the Univariate and Means procedure. The age, ED LOS, ICU LOS, HLOS, and Injury Severity Score (ISS) were of focus for the univariate analysis. When comparing the trauma patient’s quality of care indicators, LOS, and ventilator days with the patient’s ISS, the ANOVA method was used, where a p-value of <0.05 was considered significant. Additionally, we used Pearson correlation analysis to establish statistical connections between the length of stay variables and the patient's injuries, measured by the ISS. The correlation was considered significant at the 0.01 level with a two-tailed approach.
Results
During the 8 years, 383 patients were admitted to the Emergency Department for SRIs. Demographic details can be found in Table 1 (Show Age / Age Group / Gender / Race / Ethnicity). The age range which has the highest number of subway-related trauma incidents was in their 30s (n=82, 21.4%), followed by the age range 50s to 60s (n = 63, 16.4%), in their 40s (n= 62, 16.2%), and 20s (n= 57,14.9%). (Here, n represents the highest number of subway-related trauma incidents).
The majority of the injured population was reported under other races (56.4%), followed by White (14.6%), Black (13.1%), Asian (11.5%), and Unknown (4.4%). Injury was higher in non-Hispanics (48.6%) compared to Hispanics (43.3%). The mean (SEM) age of the cohort was 47.36.
Figure 1.
It represents the histogram with a frequency curve demonstrating the trends of the number of cases for hospital arrival dates from 2016 to 2024. The percentage of patients was used to demonstrate the number of subway-related trauma incidents. The highest number of subway-related trauma incidents occurred between 2023 and 2024. There was a spike in 2020 followed by a drop in 2021, but a steady increase in cases is noticeable from that year up to 2023.
Figure 1.
It represents the histogram with a frequency curve demonstrating the trends of the number of cases for hospital arrival dates from 2016 to 2024. The percentage of patients was used to demonstrate the number of subway-related trauma incidents. The highest number of subway-related trauma incidents occurred between 2023 and 2024. There was a spike in 2020 followed by a drop in 2021, but a steady increase in cases is noticeable from that year up to 2023.
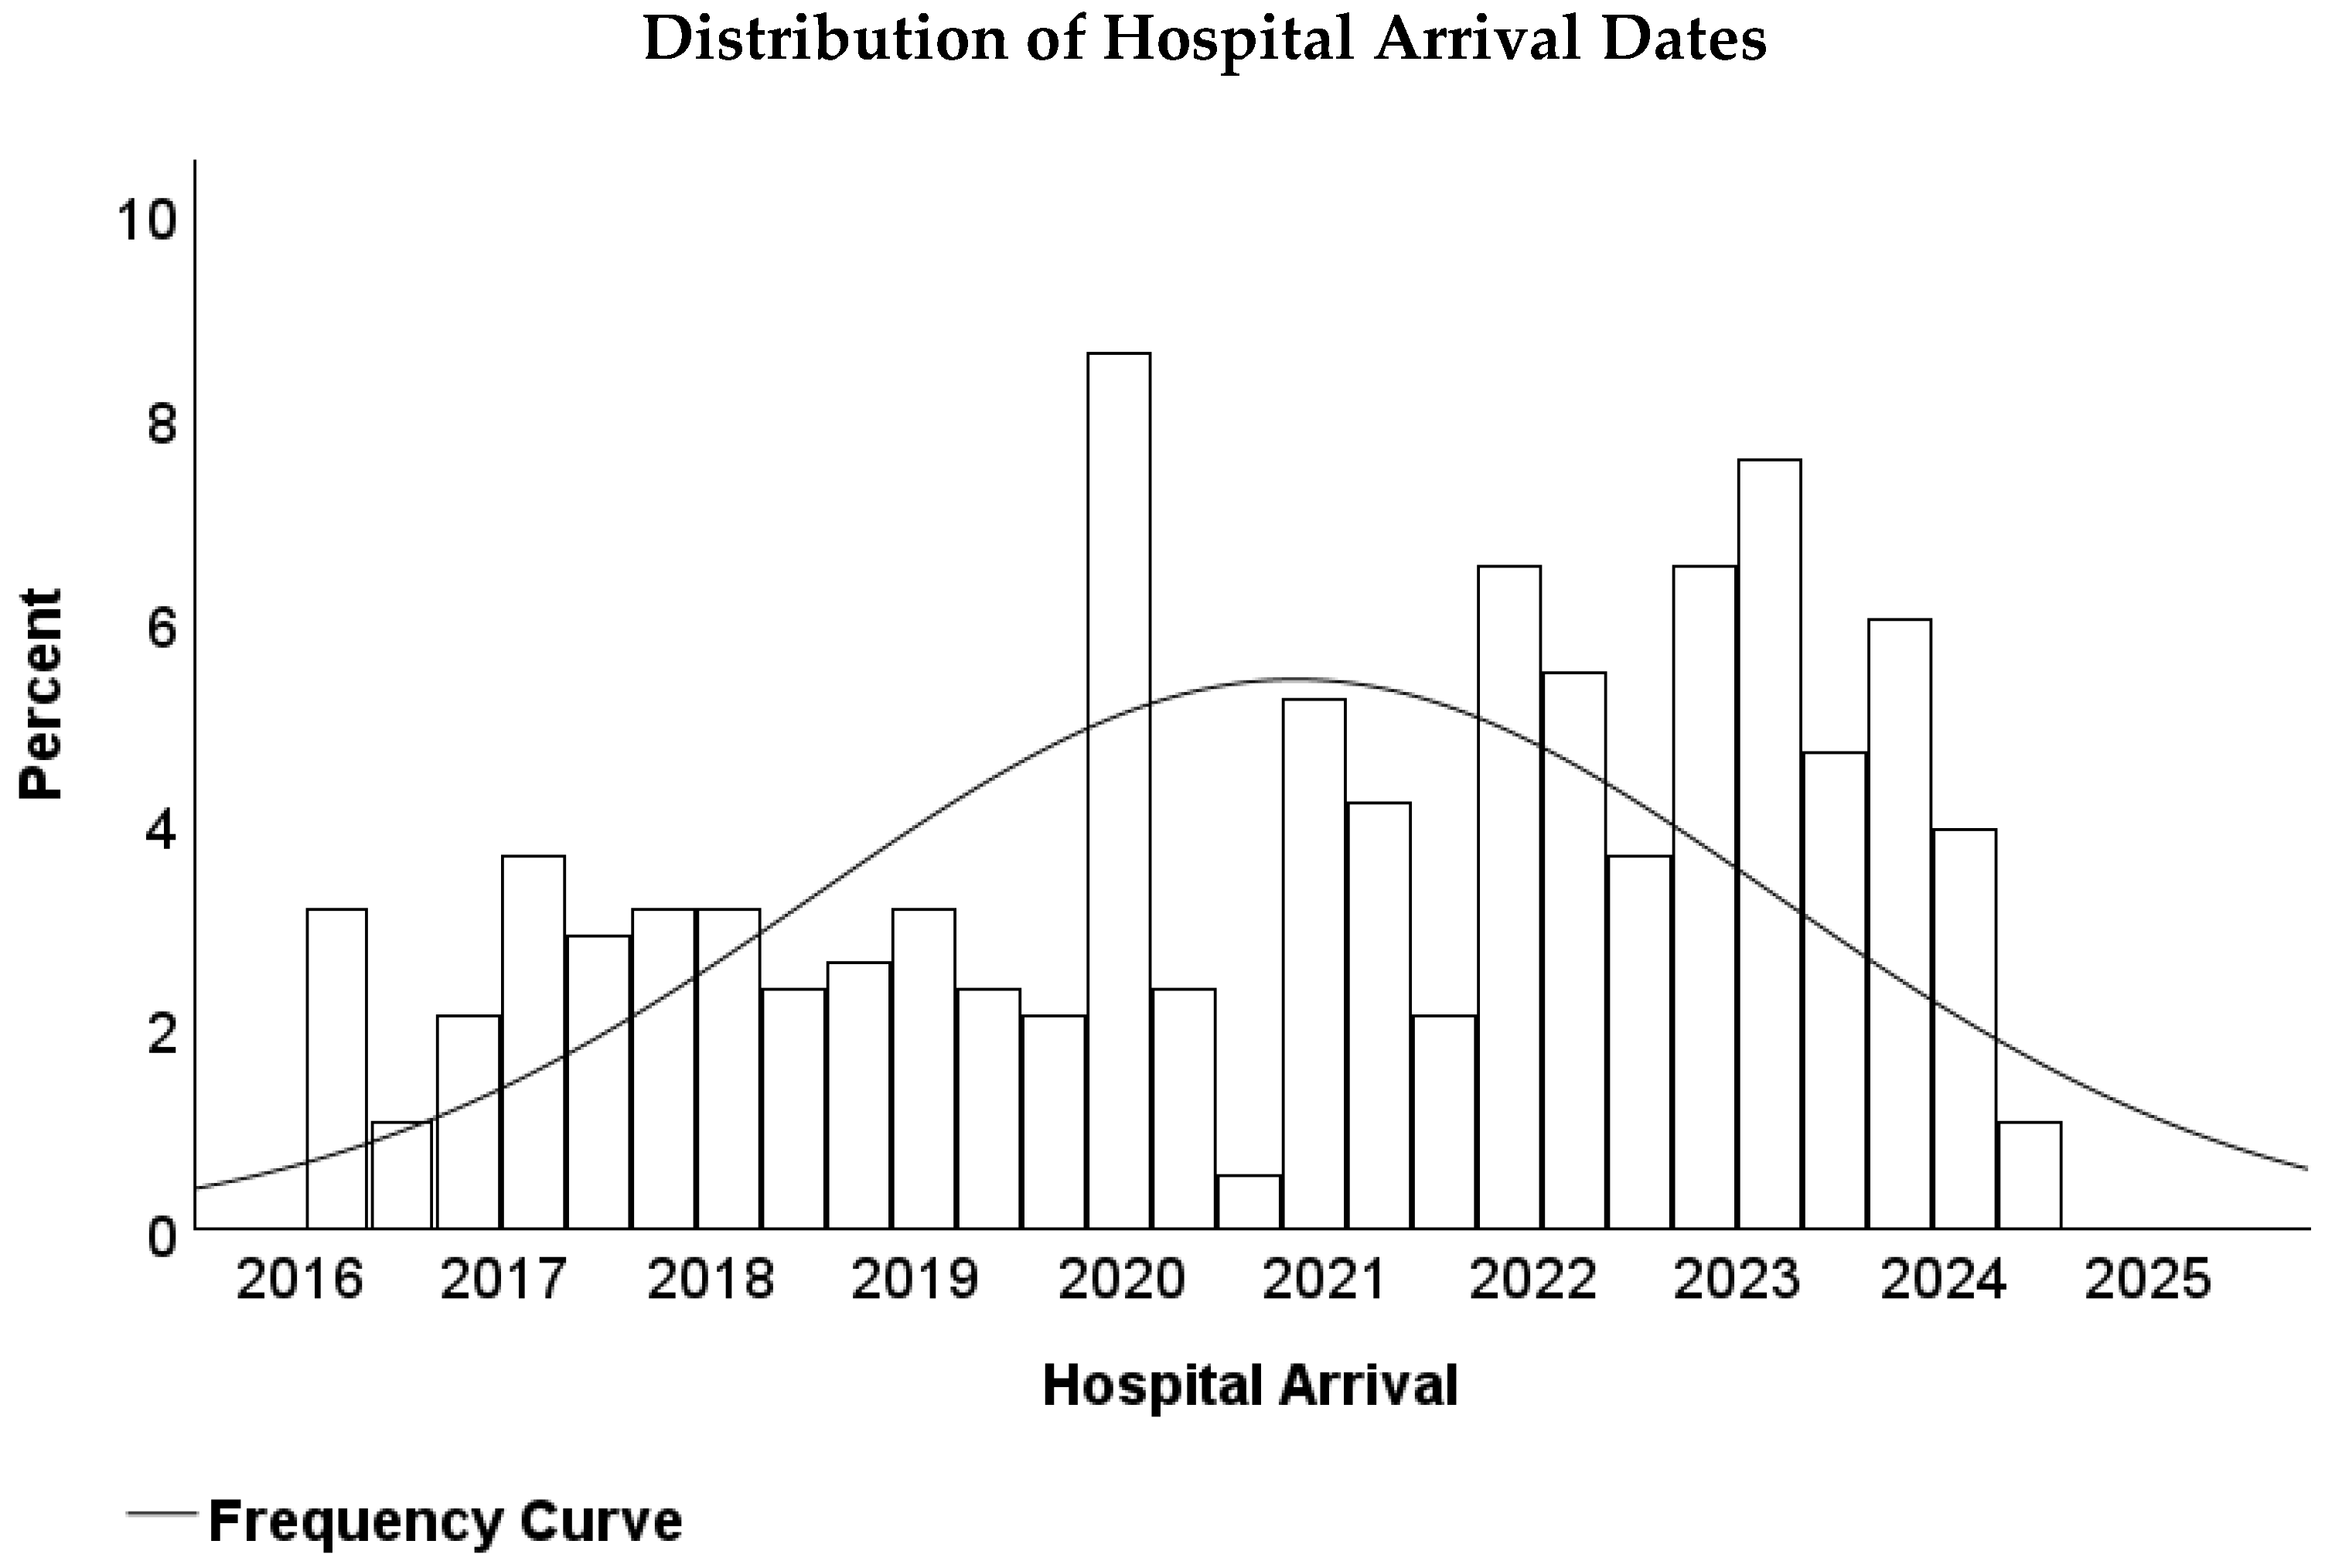
Table 2 represents common combinations of severe injuries per body region. The head region is the highest, followed by thorax region injuries and lower extremity injuries.
The distribution of the ISS provides intriguing insights into the frequency of injuries based on their severity levels within the study population, as demonstrated in Table 3. Overall, the mean ISS of 10, with a standard deviation of 11, suggests a broad range of traumatic injuries. Most patients (suffered from minor injuries, the ISS of which is between 1 and 9. In total, these patients constitute 233 cases. Meanwhile, around 19.1% (73 cases) were observed with moderate injuries, the ISS score between 10 and 16. Severe injuries (the ISS of 17-24) comprised 8.9% of the study cohort (34 cases). Lastly, 11.2% (43 cases) of trauma patients suffered from very severe injuries (the ISS of 25 and above). A wide variation of the standard deviation reveals a diversity of injuries among the patient cohort. That is why, overall, these patients demonstrated a broad distribution of trauma cases. The mean ED LOS was 12.33 hours, with a standard deviation of 10.80, indicating notable variability with patient stays. The mean ICU LOS is relatively lower at 1.73 days, with a standard deviation of 5.17, suggesting less variability in ICU admissions. On the other hand, the average HLOS is 8.26 days, with a higher standard deviation of 15.82, indicating a wider range of hospital stays. The ISS averages 10.39, with a standard deviation of 11.01, showing variability in the severity of injuries among patients.
The ANOVA analysis method indicates that the p-values are below the 0.05 threshold, confirming differences in means across all quality of care indicators (ED LOS, ICU LOS, HLOS, and ventilator days) with the injury severity metrics, as presented in Table 4. The findings indicate that the ISS has a significant impact on trauma patient’s clinical outcomes. Higher levels of injury, as indicated by ISS, are linked to longer hospital stays and increased ventilator usage.
The Pearson correlation analysis between the above variables demonstrates several statistically significant relationships, as shown in Table 5. ED LOS exhibits a significant negative correlation with both ICU LOS (r = -0.208, p < 0.001) and Injury Severity Score (ISS) (r = -0.283, p < 0.001). Furthermore, ED LOS does not significantly correlate with Hospital Length of Stay (HLOS) (r = -0.094, p = 0.065). The correlation coefficient shows that ICU LOS and ISS tend to decrease as ED LOS increases, which can be attributed to the patient having minor injuries, and they are likely admitted and kept in observation before discharge, with no further escalation of trauma care. ICU LOS and HLOS have a strong positive correlation (r = 0.629, p < 0.001), and both ICU LOS and HLOS show moderate positive correlations with ISS (r = 0.383 and r = 0.280, respectively, both p < 0.001). This suggests that higher ICU LOS is associated with longer HLOS and more severe injuries as measured by the ISS. All correlations significant at the 0.01 level are two-tailed.
Discussion
This study provides a comprehensive analysis of subway-related trauma cases over eight years, shedding light on the demographics, injury severity, and length of stay at the Hospital, ED, and ICU. These all factors have the potential to influence trauma management and outcomes. The findings reveal important trends and characteristics that can inform preventive measures and improve care strategies for this unique patient population. A study of 12 years of U.S. trauma inpatient admission data described an overall all-injury case-fatality rate of 2.4% [6]. Our predominantly male patient demographic (80.7%) reflects similarly to that found by Lin and Gill and Rodier et al. [7,8]. Furthermore, similar to Rabban et al. and Rodier et al. the most common events leading to injury were falling onto the tracks [6,8]. Also, the data shows that individuals in their 30s represented the largest age group for SRIs (21.4%), followed by those in their 50s (16.5%) and 40s (16.2%). This distribution suggests that working-age adults are most at risk for these incidents, potentially due to higher exposure to subway environments during commuting hours. The high incidence in the 50-60 age group may reflect increased vulnerability or diminished physical capabilities. Race and ethnicity also play a significant role in the distribution of subway-related injuries. The predominance of individuals classified as "Other" races (56.4%) among the injured population highlights the importance of considering diverse social determinants of health in assessing injury risk. This category includes racial groups not specifically identified as Asian, Black, or White, indicating the need for more detailed data on race and ethnicity to understand the unique vulnerabilities of these populations. Non-Hispanic individuals made up a significant portion of the injured population (48.56%), further emphasizing the influence of cultural, economic, and social factors in injury prevalence. Among the specific racial groups, Black individuals accounted for 13.05% of injuries, Asians for 11.49%, and Whites for 14.62%.
The relatively high percentage of individuals from "Other" racial backgrounds suggests that those who may not be represented in traditional racial categories could be at greater risk for subway-related injuries, potentially due to systemic inequalities or patterns of subway usage. The presence of a sizable "Unknown" category (4.44%) also underscores the need for improved data collection and reporting practices to ensure a more accurate understanding of the racial and ethnic dynamics of injury risk in urban settings. Severe injuries (AIS ≥3) were most frequently recorded in the head (23.5%), thorax (15.7%), and lower extremities (13.6%). This pattern is typical of high-energy mechanisms such as falls from height or being struck by moving objects, which are common in subway environments. In our study, the mean ISS was 10.4 (median 8, IQR 10), indicating a moderate trauma severity across the cohort. The standard deviation of 11.15 suggests variability in trauma severity, with a notable skewness (2.18), indicating that a small subset of patients sustained significantly higher trauma scores. In contrast, the Rodier et al. study reported a median ISS of 14 (IQR 5-24), which is notably higher than the median ISS in our cohort [7]. This suggests that subway-related traumas, particularly those involving being hit or pinned by trains, tend to involve more severe injuries compared to the broader urban trauma mechanisms examined in our study.
The skewness in ISS observed in our data is reflected in the Rodier et al. findings as well, where the patients who died had a significantly higher ISS, averaging 74.5 (p < 0.001), demonstrating the life-threatening nature of subway traumas [7]. In our study, AIS ≥3 injuries were most commonly found in the head (23.5%), thorax (15.7%), and lower extremities (13.6%). These injuries, often linked to high-energy trauma such as falls or being struck by moving objects, are similar to the mechanisms described in the Rodier et al. subway trauma cohort, where the primary mechanisms included being hit by a train (49%) and falling onto the tracks (44%) [7]. Rodier et al. reported that long bone fractures (38%), intracranial hemorrhage (ICH) (27%), and extremity amputations (21%) were the most frequent injuries [7]. The distribution of severe injuries in their study suggests a high incidence of life-threatening conditions. While both studies show high rates of severe head and extremity injuries, the Rodier et al. cohort had a significantly higher rate of amputations and long-bone fractures, which may account for the higher median ISS observed in their study [7].
In our study, 16% of patients had severe thoracic injuries (AIS ≥3), whereas Rodier et al. reported that 34% of patients sustained torso injuries, with 21% experiencing rib fractures and 13% pneumothoraces [7]. This higher incidence of torso injuries aligns with the severe mechanisms of subway trauma, which often involve high-energy impacts to multiple body regions. In our cohort, severe injuries were attributed to mechanisms such as falls and blunt trauma. In contrast, the Rodier et al. study had a higher incidence of train-related mechanisms, such as being hit or pinned by trains, which naturally resulted in higher trauma severity. Another difference between the studies is the influence of intoxication on trauma incidents. Rodier et al. reported that 55% of patients were intoxicated or tested positive for drugs at the time of injury [7]. This high rate of intoxication correlates with subway trauma, where the chaotic environment and impaired judgment play a significant role in injury mechanisms. In contrast, our study did not have detailed data on intoxication levels, which could affect the injury patterns and severity if further investigated.
The mean length of stay (LOS) in the Emergency Department (ED) was 12.3 hours, while the ICU length of stay for severely injured patients was notably higher at 3.7 days compared to the overall ICU LOS of 1.7 days. This discrepancy suggests that more severe cases, particularly those involving head and thoracic injuries, require more extensive monitoring and critical care resources. Additionally, patients with severe injuries (AIS ≥3) had longer hospital stays (mean LOS of 13.7 days) compared to the overall population (8.3 days), underscoring the increased resource utilization associated with high-severity trauma cases. In comparison, a study found that the overall mean hospital LOS was 11.9 days, with a median LOS of 6 days (IQR 1-18 days), aligning closely with the mean LOS for severely injured patients [7]. The overall mortality rate in this study was 10%, with deaths occurring relatively soon after admission [7]. Notably, patients who died had a significantly shorter mean LOS of 1.5 days compared to those who survived (13 days), illustrating the rapid decline in more critical cases [7]. Excluding fatalities, the mean LOS was 13 days, which mirrors the mean LOS of 13.7 days observed in high-severity trauma cases [7]. Additionally, in subway-related trauma cases, the median LOS was also 6 days, although the presence of psychosocial factors like substance use and psychiatric illness contributed to varying patient outcomes [7]. Both studies emphasize the increased resource demand, length of stay, and mortality associated with severe trauma, further illustrating the complexity of managing these cases [7].
Temporal analysis of hospital arrival dates showed a notable spike in subway-related trauma cases in 2020, followed by a drop in 2021 and a steady increase until 2024. This pattern may be influenced by external factors such as changes in public transportation usage patterns due to the COVID-19 pandemic and subsequent recovery phases. These findings underscore the importance of adaptive resource allocation in EDs and trauma centers to handle fluctuations in trauma volume. Our collection of data goes into more detail about certain subway-related injury factors that other studies do not, such as the temporal analysis of hospital arrival dates. To conclude, our study highlights the complex interplay of demographic, behavioral, and environmental factors in the severity of injuries resulting from the subway. It also illuminates the need to advance education programs to control such life-changing incidents.
Limitations
Data was collected from the NTRACS Trauma Registry, which may not always provide complete or detailed information. This may limit the generalizability of the findings to other settings with different demographic and socioeconomic characteristics. A multicenter study incorporating all emergency medical services’ data would provide a more accurate description of the injuries. Furthermore, the retrospective nature of the study and reliance on available medical records may introduce biases. The study does not consider potential confounding variables, such as patient comorbidities, trauma severity scoring variations, or treatment protocol differences that could impact outcomes. Additionally, the cross-sectional design of the study limits the ability to establish causal relationships between trauma characteristics and outcomes. Future studies should aim to include multi-center data and explore strategies to address trauma management-related quality issues related to prolonged length of stay of trauma patients, especially the ICU LOS and HLOS. These limitations suggest that further research, incorporating more comprehensive and geographically diverse data, is necessary to fully understand the epidemiology of subway-related injuries in urban settings.
Conclusion
This study offers valuable insights into the factors associated with extended stays in the ED, ICU, and hospital, as well as the severity of injuries sustained in subway-related trauma within an urban setting. Our study found that people between the ages of 20 and 60 experienced a high rate of trauma related to the subway. There was a notable spike in subway-related trauma cases in 2020, followed by a drop in 2021 and a steady increase until 2024. Most of the injured population were predominantly male. Severe injuries (AIS ≥3) were most frequently recorded in the head, thorax, and lower extremities. Most of the severe cases, particularly those involving head and thoracic injuries, require more extensive monitoring and critical care resources. LOS at ICU and hospital were positively correlated, and both were moderately correlated with ISS, suggesting that more severe injuries result in longer stays in the ICU and hospital. The unique subway system of NYC, with a high prevalence of traumatic injuries, further underscores the need for tailored public health interventions. Future research should focus on identifying additional risk factors and evaluating the effectiveness of preventive measures in reducing the incidence and severity of traumatic incidents associated with the subway.
Author Contributions
Conceptualization- BS; writing—original draft preparation- BS and SC; writing—review and editing- BS, AA, KT, NDB, GA, JD, JM, ZS, and JW; figures and table, BS and AA; supervision- BS; project administration- BS
Funding
There is no grant support or financial relationship for this manuscript.
Institutional Review Board (IRB) Statement
This retrospective study was approved by the IRB at Elmhurst Hospital Center (EHC) on July 17, 2024, with IRB number 24-12-287-05G.
Acknowledgment
Not Applicable
Conflicts of Interest
The authors have no competing interests to declare.
References
- Metropolitan Transportation Authority. (2023). New York City subway and bus ridership 2023. Available online: https://new.mta.info/agency/new-york-city-transit/subway-bus-ridership-2023#:~:text=Significant%20factors%20contributing%20to%20slower,75%20express%20routes (accessed on 3 September 2024).
- Gershon RR, Pearson JM, Nandi V, Vlahov D, Bucciarelli-Prann A, Tracy M, Tardiff K, Galea S. Epidemiology of subway-related fatalities in New York City, 1990-2003. J Safety Res. 2008;39(6):583-8. Epub 2008 Nov 14. Erratum in: J Safety Res. 2009;40(1):75. PMID: 19064043. [CrossRef]
- Ho J, Mansour M, Gomez D. Subway-related trauma at a level 1 trauma center in Toronto, Ontario. Can J Surg. 2021 Nov 2;64(6): E588-E593. PMID: 34728524; PMCID: PMC8565880. [CrossRef]
- Rabban J, Adler J, Rosen C, Blair J, Sheridan R. Electrical injury from subway third rails: serious injury associated with intermediate voltage contact. Burns. 1997 Sep;23(6):515-8. PMID: 9429035. [CrossRef]
- JOUR; Aarabi, Shahram; Miglietta, M A; Wasserman, J; Hazen, A; Saadeh, P B; Gurtner, G C; Levine, J P; Traumatic Subway-Related Injuries: A 16-Year Experience in New York City; 0743-684X; 1098-8947;2006; J Reconstr Microsurg; Journal of Reconstructive Microsurgery; EN;22;08;A020;2007/01/11;10.1055/s-2006-958668. Available online: http://www.thiemeconnect.com/products/ejournals/abstract/10.1055/s-2006-958668.
- DiMaggio C, Ayoung-Chee P, Shinseki M, Wilson C, Marshall G, Lee DC, Wall S, Maulana S, Leon Pachter H, Frangos S. Traumatic injury in the United States: In-patient epidemiology 2000-2011. Injury. 2016 Jul;47(7):1393-403. Epub 2016 Apr 22. PMID: 27157986; PMCID: PMC5269564. [CrossRef]
- Rodier, S. G., DiMaggio, C. J., Wall, S., Sim, V., Frangos, S. G., Ayoung-Chee, P., Bukur, M., Tandon, M., Todd, S. R., & Marshall, G. T. (2018). Subway-Related Trauma: An Urban Public Health Issue with a High Case-Fatality Rate. The Journal of Emergency Medicine, 55(2), 165–171.e1. [CrossRef]
- Lin PT, Gill JR. Subway train-related fatalities in New York City: accident versus suicide. J Forensic Sci. 2009 Nov;54(6):1414-8. Epub 2009 Oct 5. PMID: 19804531. [CrossRef]

Table 1.
Demographic information of patients who encountered subway-related trauma.
| Descriptive | |||||
| Mean | Count | Column N % | Standard Deviation | ||
| Age | 47.36 | 383 | 100.0% | 17.72 | |
| Age Group (year) | 10-19 | 15 | 3.9% | ||
| 20-29 | 57 | 14.9% | |||
| 30-39 | 82 | 21.4% | |||
| 40-49 | 62 | 16.2% | |||
| 50-59 | 63 | 16.4% | |||
| 60-69 | 63 | 16.4% | |||
| 70-79 | 25 | 6.5% | |||
| 80-89 | 14 | 3.7% | |||
| 90-99 | 2 | 0.5% | |||
| Gender | Female | 74 | 19.3% | ||
| Male | 309 | 80.7% | |||
| Ethnicity | Hispanic Origin | 166 | 43.3% | ||
| Non-Hispanic Origin | 186 | 48.6% | |||
| Unknown | 31 | 8.1% | |||
| Race | Asian | 44 | 11.5% | ||
| Black | 50 | 13.1% | |||
| Other | 216 | 56.4% | |||
| Unknown | 17 | 4.4% | |||
| White | 56 | 14.6% | |||
Note: Percentages are based on the total number of participants (N = 383).
Table 2.
Prognostic scale values with severe injuries per body region of patients with Subway-Related Traumas The occurrence of injuries by body region with an AIS score of three or greater, which is considered a severe traumatic injury per trauma patient, was evaluated.
Table 2.
Prognostic scale values with severe injuries per body region of patients with Subway-Related Traumas The occurrence of injuries by body region with an AIS score of three or greater, which is considered a severe traumatic injury per trauma patient, was evaluated.
| Highest AIS score ≥3 per body region | Number of patients | % |
| AIS Head | 90 | 23 |
| AIS Thorax | 60 | 16 |
| AIS Low Extremities | 52 | 14 |
| AIS Abdomen | 14 | 4 |
| AIS Spine | 9 | 2 |
Note: Percentages are based on the total number of patients with an AIS score ≥3 as per body region.
Table 3.
It represents statistics based on injury severity score (ISS) and length of stay (LOS) at the emergency department (ED), intensive care unit (ICU), and hospital.
Table 3.
It represents statistics based on injury severity score (ISS) and length of stay (LOS) at the emergency department (ED), intensive care unit (ICU), and hospital.
| Mean | Standard Deviation | Count | % | ||
| Injury Severity Score (ISS) | 10.39 | 11.01 | - | - | |
| ISS Group | Minor (ISS 1-9) | - | 233 | 60.8% | |
| Moderate (ISS 10-16) | - | 73 | 19.1% | ||
| Severe (ISS 17-24) | - | 34 | 8.9% | ||
| Very Severe (ISS ≥25) | - | 43 | 11.2% | ||
| ED Length of Stay (hours) | 12.33 | 10.80 | |||
| ICU Length of Stay (days) | 1.73 | 5.172 | |||
| Hospital Length of Stay (days) | 8.26 | 15.821 | |||
Note: Percentages are based on the total number of patients within each ISS range.
Table 4.
It shows the Analysis of variance (ANOVA) for LOS (ED, ICU, and hospital) and ventilator days by injury severity score (ISS).
Table 4.
It shows the Analysis of variance (ANOVA) for LOS (ED, ICU, and hospital) and ventilator days by injury severity score (ISS).
| ANOVA Table | |||||||
| Quality Indicators vs ISS | Sum of Squares | df | Mean Square | F | Sig. | ||
| ED LOS * ISS | Between Groups | (Combined) | 7311.000 | 38 | 192.395 | 1.779 | .004 |
| Within Groups | 37206.752 | 344 | 108.159 | ||||
| ICU LOS * ISS | Between Groups | (Combined) | 3628.082 | 38 | 95.476 | 4.983 | <.001 |
| Within Groups | 6591.320 | 344 | 19.161 | ||||
| HLOS * ISS | Between Groups | (Combined) | 23425.990 | 38 | 616.473 | 2.938 | <.001 |
| Within Groups | 72192.375 | 344 | 209.862 | ||||
| Vent Days * ISS | Between Groups | (Combined) | 1091.326 | 38 | 28.719 | 4.151 | <.001 |
| Within Groups | 2380.219 | 344 | 6.919 | ||||
Note: The sum of Squares represents the variation attributed to each source; df = Degrees of Freedom; Mean Square = Sum of Squares divided by the corresponding Degrees of Freedom; F-value = Ratio of Mean Square Between Groups to Mean Square Within Groups; Significance (Sig.) = p-value indicating the probability of observing the data if the null hypothesis is true.
Table 5.
It shows the Pearson correlation analysis between the various variables demonstrating several statistically significant relationships.
Table 5.
It shows the Pearson correlation analysis between the various variables demonstrating several statistically significant relationships.
| Variables | ED LOS | ICU LOS | HLOS | ISS | |
| ED LOS | Pearson Correlation | 1 | -.208** | -.094 | -.283** |
| Sig. (2-tailed) | <.001 | .065 | <.001 | ||
| ICU LOS | Pearson Correlation | -.208** | 1 | .629** | .383** |
| Sig. (2-tailed) | <.001 | <.001 | <.001 | ||
| H LOS | Pearson Correlation | -.094 | .629** | 1 | .280** |
| Sig. (2-tailed) | .065 | <.001 | <.001 | ||
| ISS | Pearson Correlation | -.283** | .383** | .280** | 1 |
| Sig. (2-tailed) | <.001 | <.001 | <.001 | ||
Note: ** Correlation is significant at the 0.01 level (2-tailed); N=383, Pearson Correlation indicates the strength and direction of linear relationships between variables, Sig. (2-tailed): p-values show statistical significance (p < 0.01 denotes significance).
Disclaimer/Publisher’s Note: The statements, opinions and data contained in all publications are solely those of the individual author(s) and contributor(s) and not of MDPI and/or the editor(s). MDPI and/or the editor(s) disclaim responsibility for any injury to people or property resulting from any ideas, methods, instructions or products referred to in the content. |
© 2024 by the authors. Licensee MDPI, Basel, Switzerland. This article is an open access article distributed under the terms and conditions of the Creative Commons Attribution (CC BY) license (http://creativecommons.org/licenses/by/4.0/).
Copyright: This open access article is published under a Creative Commons CC BY 4.0 license, which permit the free download, distribution, and reuse, provided that the author and preprint are cited in any reuse.