

Submitted:
30 October 2024
Posted:
31 October 2024
You are already at the latest version
Abstract
This paper presents a three-dimensional model of pollutant diffusion in the atmosphere. The model is based on the advection-diffusion equation taking into account pollution sources and decay processes of substances. The numerical solution of the equation is realized using the finite difference method on a three-dimensional grid. The model takes into account the spatial distribution of pollutant concentrations, the influence of wind and atmospheric diffusion. Key parameters include diffusion coefficient, wind speed components, intensity of pollution sources and decay coefficient of substances. Special attention is paid to the vertical distribution of pollutants, which allows for more accurate modeling of atmospheric processes. The presented model can be used to predict the spread of pollutants, assess the impact of different sources on air quality and develop strategies to reduce air pollution in urban and industrial areas.
Keywords:
concentration
; advection
; diffusion coefficient
; upwind scheme
; numerical modeling
Introduction
Air pollution in urban areas is one of the most serious environmental problems of our time, which has a significant impact on public health and quality of life. The city of Almaty, the largest megacity in Kazakhstan, is no exception and faces serious air quality problems caused by a unique combination of geographical, climatic and anthropogenic factors.
Located in the foothills of the Zailiyskiy Alatau, Almaty is characterized by complex topography and specific meteorological conditions that significantly affect the distribution and concentration of pollutants in the city's atmosphere. Frequent temperature inversions, limited air circulation and intensive urbanization create favorable conditions for accumulation of pollutants, especially in winter.
In recent years, there has been a growing interest in the application of mathematical modeling for the analysis and prediction of air quality in urban environments. Atmospheric dispersion models of pollutants have become an indispensable tool for understanding the dynamics of air pollution, assessing the impact of different emission sources and developing effective strategies to improve air quality.
This study is aimed at the development and application of a comprehensive model of pollutant dispersion in the atmosphere of Almaty, taking into account the specific features of the city. The paper presents the results of modeling in one-dimensional (1D), two-dimensional (2D) and three-dimensional (3D) spaces, which allows to obtain a comprehensive understanding of the processes of pollutant spreading at different scales and conditions.
The results of this study have important practical significance for the development of effective measures to improve air quality in Almaty, as well as can be applied to other cities with similar geographical and climatic conditions. In addition, the developed model can serve as a basis for the creation of an early warning system of unfavorable environmental situations and decision-making support in the field of air quality management.
The main objectives of the study are: development of an adapted model of pollutant distribution for Almaty conditions, analysis of spatial and temporal distribution of key pollutants, including , and , assessment of the influence of topographical and meteorological factors on pollutant concentrations, identification of critical zones with increased pollution levels and determination of the main factors affecting air quality in these zones.
Literature Review
In [1], a mathematical model describing the effects of traffic and air flows (natural and forced) in urban tunnels, especially on single-lane roads, was developed. The model accurately represents the traffic flows and agrees well with experimental data. It provides numerical calculations of exhaust emissions, their accumulation in tunnels and changes due to traffic induced airflows. The study recommends avoiding stop-and-go traffic in tunnels, for example by placing traffic lights further away from tunnel exits to reduce queues. In addition, tunnel ventilation should coincide with the direction of traffic to avoid increasing air pollution. And also, a numerical model has been established to simulate the exhaust emissions from cars, their accumulation in the tunnels and their change under the influence of air currents caused by traffic. Theoretical studies have allowed the development of recommendations for the design of urban transport infrastructure:
- In long tunnels, stopping and accelerating vehicles should be avoided, excluding the placement of traffic lights and other means of regulation inside the tunnel or near its exit.
- Forced ventilation is effective when the direction of airflow coincides with the direction of traffic.
- Ventilation in the opposite direction can lead to accumulation of toxic gases at high tunnel occupancy.
The model allows predicting the level of air pollution in tunnels under different traffic and regulation conditions, as well as determining the maximum intensity of car flow without exceeding the permissible pollution level. However, in [2], a numerical model is proposed to describe two-dimensional transport and diffusion of pollutants in the atmosphere from an area source at steady state. The model takes into account the variable particle deposition rate and the turbulent diffusion profile. The dispersion of pollutants in the atmosphere considering deposition is analysed. The results obtained are in good agreement with known data. These expressions allow us to investigate the atmospheric dispersion of pollutants taking into account the deposition rate.
The study [3] consisted in comparing the results of air pollution modelling using the ADMOSS system designed for large areas and moss biomonitoring data. In the area on the border of the Czech Republic, Poland and Slovakia, mathematical calculations of pollution and collection of moss samples were carried out. The samples were analysed by neutron activation analysis (INAA) and the results were processed statistically and compared with ADMOSS data. Moss biomonitoring proved to be effective for validating mathematical pollution models due to its ability to capture long-term precipitation of pollutants and determine the actual distribution of chemical elements consistent with the model. Biomonitoring shows long-term changes in the study area. The identified elements related to metallurgy and solid fuel combustion are mostly consistent with the results of the mathematical modelling, except for the area around Czestochowa. Differences between the model and biomonitoring may be caused by phenomena that the ADMOSS system does not take into account, such as inversions, in which contaminated areas become wider and depend on terrain features.
According to the author [4] in Ipoh, Perak, Malaysia, data were collected on carbon monoxide and sulphur dioxide concentrations and traffic volume at several sites divided into closed and open areas. For each site, different vehicle travelling modes were considered. Based on the least squares method, mathematical models of pollutant concentration were developed. The results showed that the maximum concentration of pollutants is higher in closed zones for all traffic modes compared to open zones for similar traffic volume. The obtained relationships between traffic flows and pollutant concentrations confirmed the effectiveness of the traffic-based approach for predicting pollution levels in Malaysia.
Moreover, [5] considers modelling of atmospheric layer pollution by nitrogen dioxide caused by car exhaust gases. Methods for analysing data intervals and a new technique for identifying the mathematical model of nitrogen dioxide distribution taking into account measurement errors are proposed. The developed model in the form of a difference equation provides accurate prediction of nitrogen dioxide concentrations in the city and takes into account changes in traffic, which reduces the cost of environmental control. The new model identification method is more efficient than existing methods and provides guaranteed accuracy of predictions. Modelling atmospheric nitrogen dioxide pollution from automobile exhausts is important for monitoring urban environments because high concentrations of nitrogen dioxide are hazardous to health. Measuring and controlling pollution is expensive, so mathematical modelling techniques have been proposed. The use of discrete equations, similar to partial differential equations, allows the model to be identified from experimental data and adapted to specific conditions using partial measurements over a limited area. This approach takes into account traffic intensity and changes in meteorological conditions.
The author of the following study [6], studies atmospheric pollution to mathematically describe the spatial and temporal distribution of pollutants. Modelling of the dispersion of pollutants from power plants is performed in the FlexPDE software package, which allows estimating the degree of air pollution based on pollutant concentrations and atmospheric conditions. The monitoring includes SO2, NOx and PM. Due to the process of atmospheric dispersion, pollutant concentrations can vary at different points in the region. Model errors are inversely proportional to computation time. The input data should accurately reflect the meteorological conditions, geographical location and pollution source parameters. Wind plays a key role in the model to accurately describe the smoke evolution. The results of numerical modelling in FlexPDE show the dispersion of pollutant concentration.
Consider the author's study [7], which describes the equations, algorithms and components of the CMAQ air quality modelling system. This system is designed for comprehensive air quality analyses, including issues related to tropospheric ozone, fine particles, acid precipitation, and visibility impairment. CMAQ has multi-scale modelling capability, allowing it to be used for both urban and regional applications without the need for separate models. It covers atmospheric dynamics and key chemical-physical processes affecting pollutant distribution, and uses a generalised coordinate system for consistency with meteorological models. CMAQ includes three main components: meteorological modelling, emission models, and a chemical-transport model to simulate chemical transformations. Processes such as horizontal and vertical advection, chemical reactions, photolysis, aerosol dynamics, and deposition are considered. The paper details the principles of the CMAQ system, its basic equations, scientific algorithms and examples of practical applications.
However, the author of the paper [8] in his study obtained highly accurate predictions of suspended particulate matter concentrations ( and ) using meteorological data from the Local Data Assimilation and Prediction System (LDAPS) and machine learning (ML). The study was conducted in Seoul, South Korea from July 2018 to June 2021. PM predictions were compared with actual measurements to evaluate the accuracy. Among the tree-based ML algorithms, the Light Gradient Boosting (LGB) algorithm performed the best. predictions: bias = -0.10 μg/m³, RMSE = 13.15 μg/m³, R² = 0.86; for : bias = -0.02 μg/m³, RMSE = 7.48 μg/m³, R² = 0.83. Daily predictions gave RMSE ≤ 1.16 μg/m³ and R² = 0.996. These results are 21% more accurate than the chemical transport model (CTM). The LGB algorithm showed good predictive ability even at high PM concentrations, making it useful for air quality monitoring and improvements in addition to the CTM. Prediction of suspended particulate matter (PM) concentrations using various machine learning (ML) algorithms and meteorological data has already been carried out in many countries. However, the accuracy of the predictions may depend on the selected variables and terrain characteristics. This paper also proposes the use of predicted PM data to improve the accuracy of CTM. Business models require the use of fast algorithms with low computational cost such as LGB. In large cities like Seoul, South Korea, highly accurate PM prediction is important for public health, and the data can be applied to environmental policies to monitor and improve air quality.
Moreover, [9] describes that clean air is vital for the health of humans and wildlife, but industrial growth and increasing population leads to increased air pollution especially in developing countries like India. Regular monitoring and forecasting is necessary to maintain air quality. In this study, machine learning models were used for Vishakhapatnam city in India to predict Air Quality Index (AQI) based on 12 pollutants and 10 meteorological parameters (2017-2022). The Catboost model showed the best accuracy with correlation coefficient R² = 0.9998, while Adaboost was the least accurate. This confirms the promise of machine learning for AQI prediction. The study predicted the air quality index (AQI) in Vishakhapatnam from 2017 to 2022. The AQI levels increased from 2017 to 2019, then decreased in 2020 due to COVID-19-related lockdown, after which they started increasing again. PM2.5 and PM10 particles were found to be the main factors affecting AQI, while meteorological parameters had minimal influence. Machine learning models, especially Random Forest and Catboost, showed high prediction accuracy with correlations of 0.9998 and 0.9936. To extend the models to other regions, it is necessary to test their accuracy under different air quality conditions.
And also in studies, the author [10] assesses the relationship between premature mortality and air pollution, mainly PM2.5 particles. Using a global atmospheric chemistry model, the authors found that air pollution causes 3.3 million premature deaths annually, mostly in Asia. Emissions from domestic energy use, such as heating and cooking, have the greatest impact, especially in India and China. In the USA and some countries, transport and energy are important sources of emissions, while in Eastern Europe and Asia, emissions from agriculture play a significant role. Projections indicate a possible doubling of deaths from air pollution by 2050.
Modeling the atmospheric dispersion of pollutants is an important tool for air quality assessment and management. Classical works, such as [11], provide a theoretical framework for understanding the processes affecting pollutant dispersion, including advection, diffusion, and chemical transformations.
In urban environments such as Almaty, air quality models such as [12] are widely used for air quality prediction and management. These models take into account the complex interactions between emissions, meteorology and chemical reactions in the atmosphere [13].
For cities located in mountainous areas such as Almaty, topography and climatic conditions play a key role in the distribution of pollutants. Studies such as [14] emphasize the importance of taking into account inversions and mountain-valley circulations, which can significantly affect pollutant concentrations.
Modern research is increasingly using remotely sensed data and ground-based observations to improve air quality models. The authors [15] demonstrate how data integration can improve the accuracy of forecasts and help validate models.
Particulate matter such as and are among the most dangerous pollutants for human health. In [16], methods for modeling these particles in urban environments are investigated, emphasizing the importance of considering different emission sources and meteorological conditions.
In recent years, machine learning methods have begun to be applied to air quality forecasting. In [17] it is shown that these methods can significantly improve the accuracy of forecasts, especially in the context of limited data, which can be useful for cities with insufficient monitoring network.
The article [18] focuses on using algorithmic tools for analyzing environmental observations in the Northern Caspian Sea to predict ecological changes and establish a centralized storage system for diverse data (e.g., hydrochemical and hydrobiological). By utilizing the TOFI software platform for data acquisition, exchange, and processing, the study aims to present multidimensional bio-monitoring data cubes to decision-makers and the public.
In this paper [19], the authors explore the application of neural networks in forecasting environmental processes, with a particular focus on their use in forecasting greenhouse gas emissions. Several types of neural networks, including recurrent neural networks (RNN): Simple RNN, LSTM-RNN, and stacked LTSM-RNN, are considered to evaluate their effectiveness in processing raw data and forecasting emissions at various spatial and temporal scales.
This paper [20] develops and presents a software implementation of environmental monitoring using the Oracle enterprise database management system. The developed information system allows finding optimal solutions for cleaning and recycling contaminated areas.
Mathematical Model
The diffusion-advection equation, which describes the diffusion of pollutants in the atmosphere, is considered:
here is concentration of air pollutants, is time, , , are coordinates in space, , , are components of velocities, , , are diffusion coefficients, are source of pollution, are purification coefficient (pollution decay), are change in air pollutant concentration over time, are advection, pollution transport, are diffusion, dispersion of pollutants.
Solution Method
We will expand the derivatives of equation (1) in a Taylor series using an explicit scheme:
To eliminate oscillations in the results that may appear as a consequence of higher orders in finite difference schemes (second and higher order) for the first derivatives with respect to spaces, upwind smoothing schemes should be used:
The second derivatives have the following forms with the second order of accuracy:
We insert the finite difference forms of derivatives into equations (1):
for instance, for , ,
We write the sought term of the time derivative of concentration (new layer) in the following form:
where , , .
Problem Statement
The boundary conditions at the boundaries of the region are the Dirichlet condition for the one-dimensional case, and similarly for other dimensions:
The concentration of the pollutant at the boundaries of the area was set to zero, meaning that the pollutant cannot leave the area through its boundaries.
This model does not assume that the pollutant can return to the region through opposite boundaries (non-reflection boundary conditions).
At the initial moment of time, the concentration of the pollutant was set in the central part of the region. This simulates the situation when the source of pollution is in the center of the region.
For the two-dimensional and three-dimensional cases, similarly, with localized pollution in the central part of the domain. These conditions allow us to model the spread of a pollutant from a localized source in a limited area, which is a typical problem for studying advection and diffusion processes in the atmosphere.
For numerical simulation, the parameters from Table 1 were used.
Results and Discussion
Graph 1 shows an asymmetric distribution of pollution, which corresponds to the combined effect of advection (transport in the direction of the wind) and diffusion (symmetric expansion). The concentration peak shifts to the right with time, which corresponds to a positive wind speed. A sinusoidal change in wind speed leads to a non-linear shift of the concentration peak, which is evident from the uneven distance between the curves at different times. As the temperature increases, the diffusion coefficient increases, which leads to a faster smearing of the concentration profile over time.
Figure 1.
Concentration and spread of pollution in the one-dimensional case.
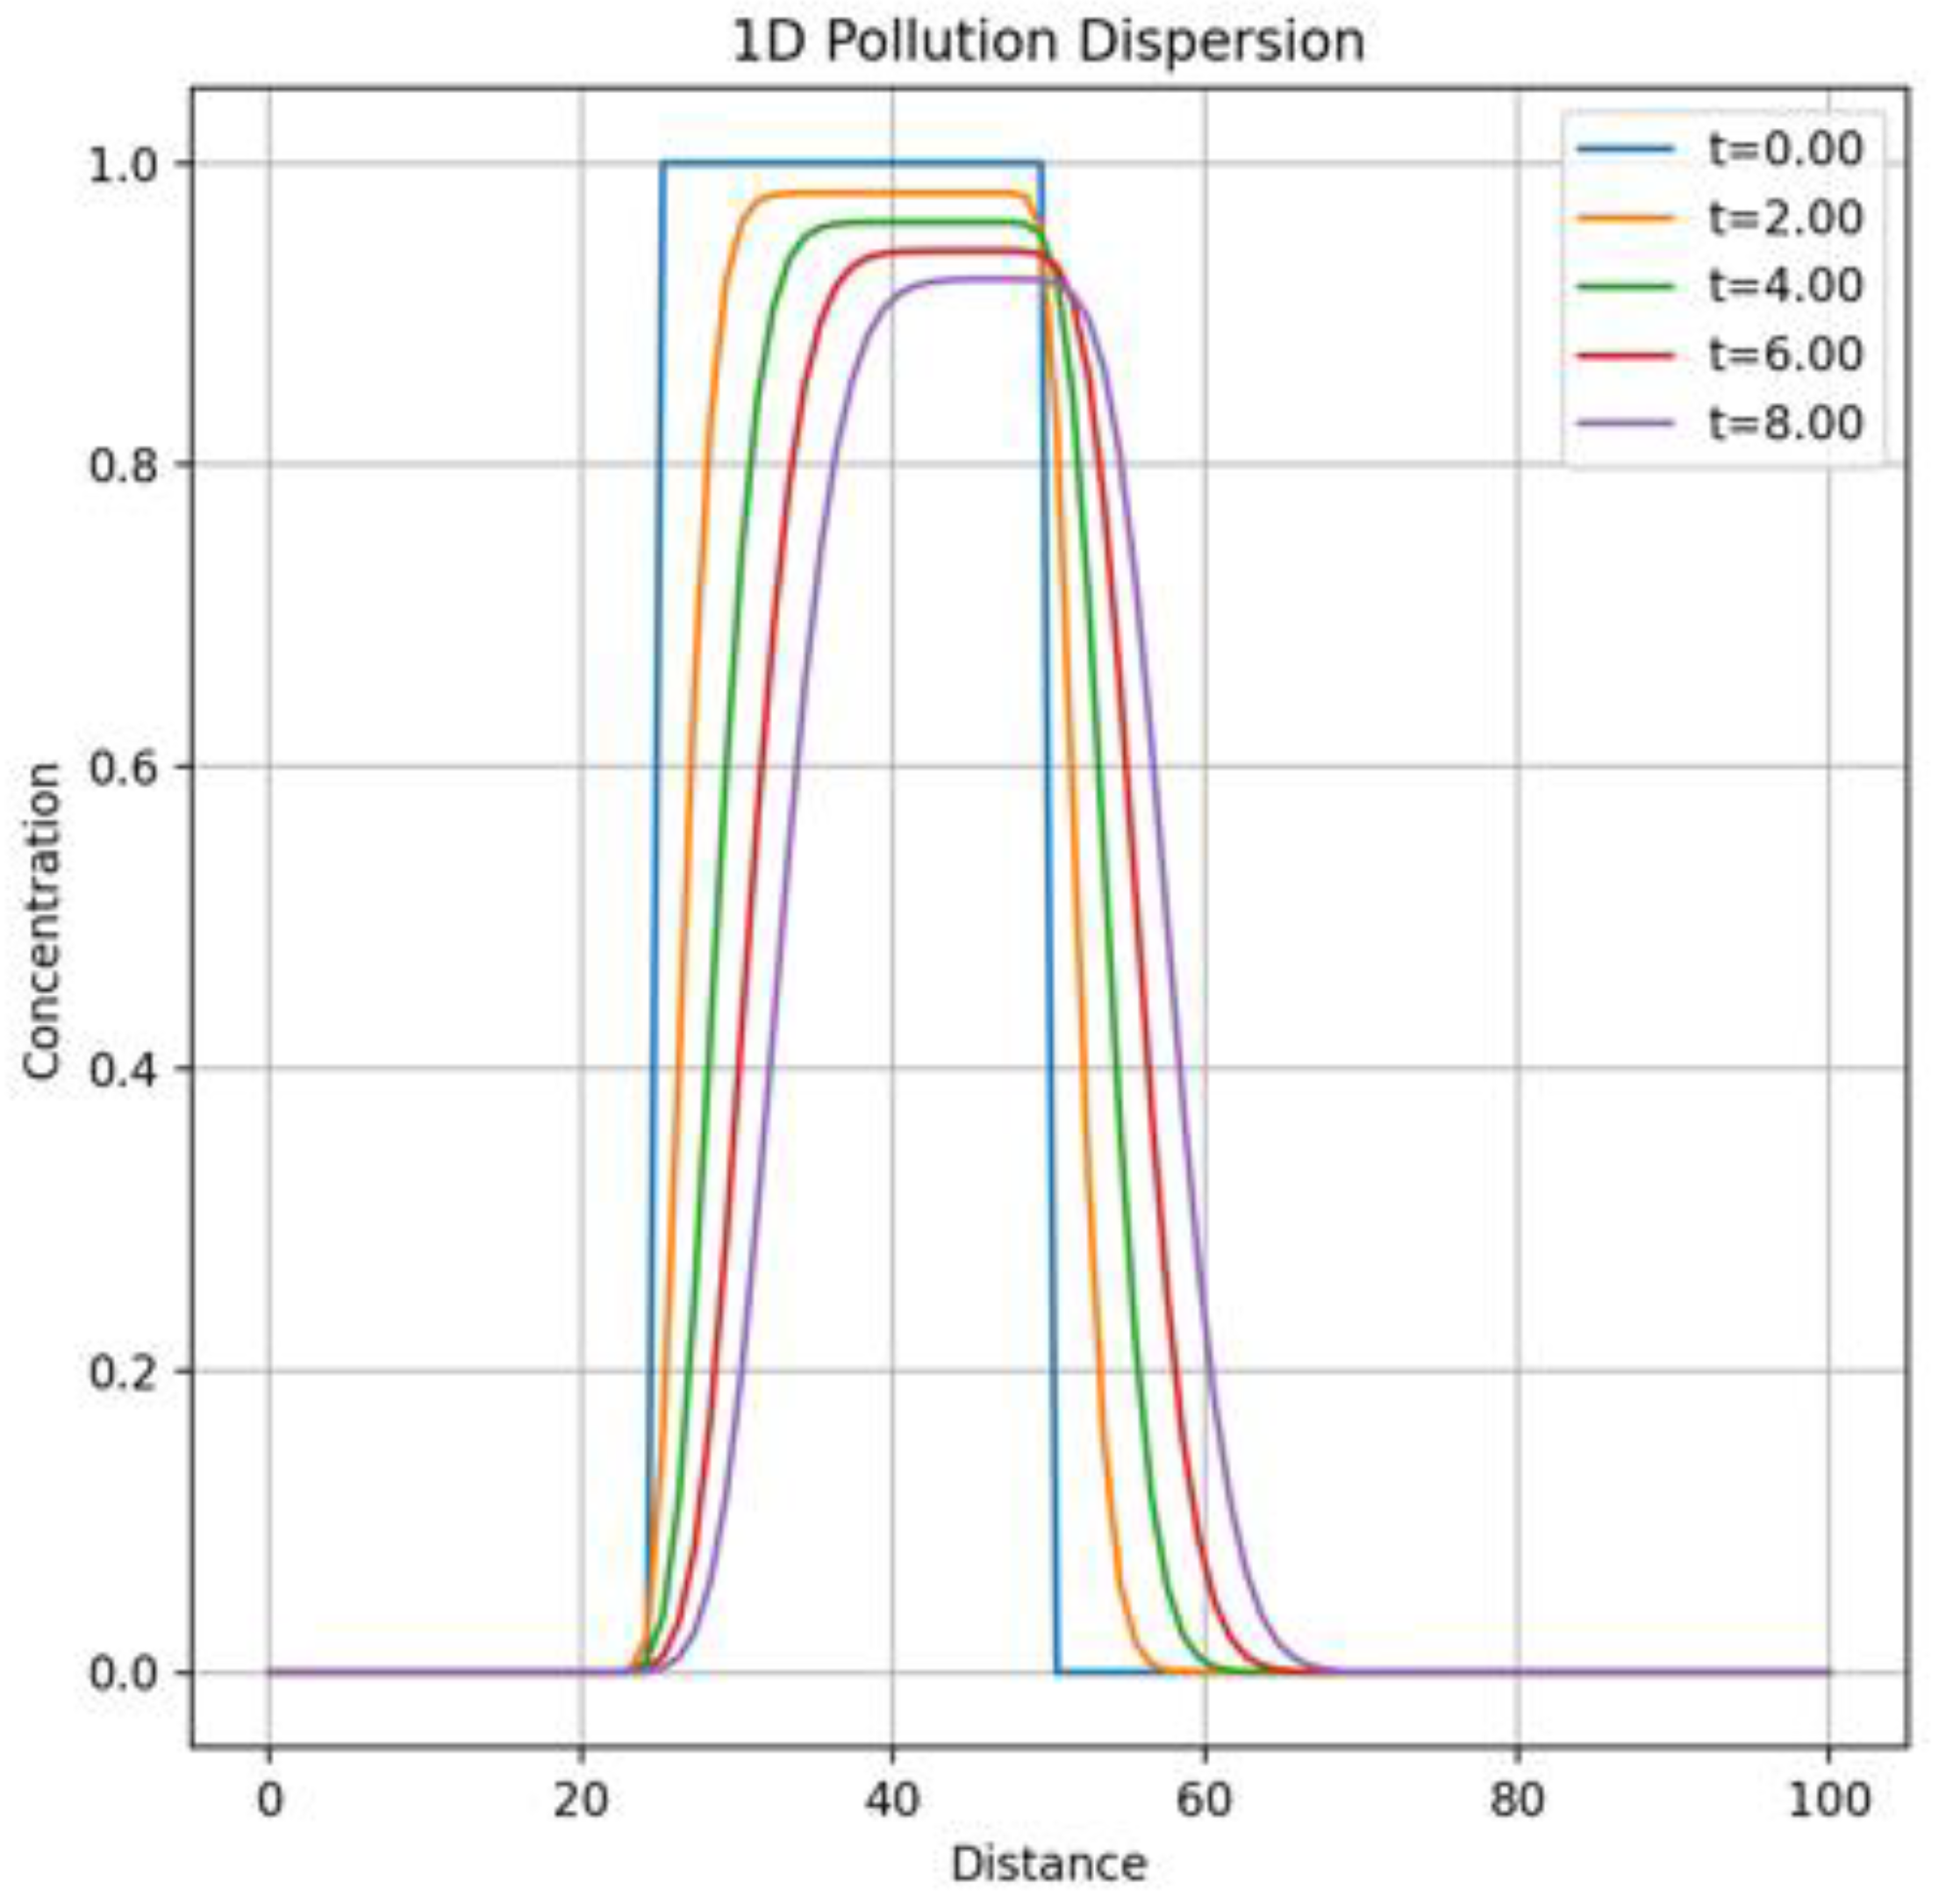
The two-dimensional model in Figure 2 allows us to observe the anisotropic spread of pollution caused by the directional wind. The elliptical shape of the pollution region indicates the prevalence of advection in the wind direction over diffusion. Steeper concentration gradients are observed on the windward side of the pollution cloud and flatter ones on the leeward side, which corresponds to the physics of the advection-diffusion process. Despite the use of the upwind scheme, some numerical diffusion is still present, which can lead to a slight blurring of the pollution front.
In Figure 3, the Z-section allows us to estimate the vertical distribution of pollution, which is also subject to advection and diffusion. A more complex structure of the concentration distribution is observed due to the interaction of processes in three dimensions. Although the model does not take into account the vertical temperature gradient, the three-dimensional distribution shows the potential for modeling the vertical stratification of the atmosphere. The three-dimensional model requires significantly more computational resources, which is reflected in the lower grid resolution compared to the 1D and 2D cases.
In Figure 4, Figure 5 and Figure 6, the upwind scheme effectively eliminates numerical oscillations in all three cases, providing a stable solution.
The model successfully reflects the main physical processes: advection, diffusion and decay of pollutants.
Taking into account the dependence of the diffusion coefficient on temperature allows us to model more realistic behavior of pollution in the atmosphere.
Moving from 1D to 3D models provides a more complete picture of the spread of pollution, but requires a trade-off between accuracy and computational cost.
Graphs 7-8 show that the maximum concentration decreases monotonically with time. This corresponds to the diffusion process, where the contaminant spreads from an area of high concentration to an area of low concentration.
Figure 8.
Change in maximum concentration over time.
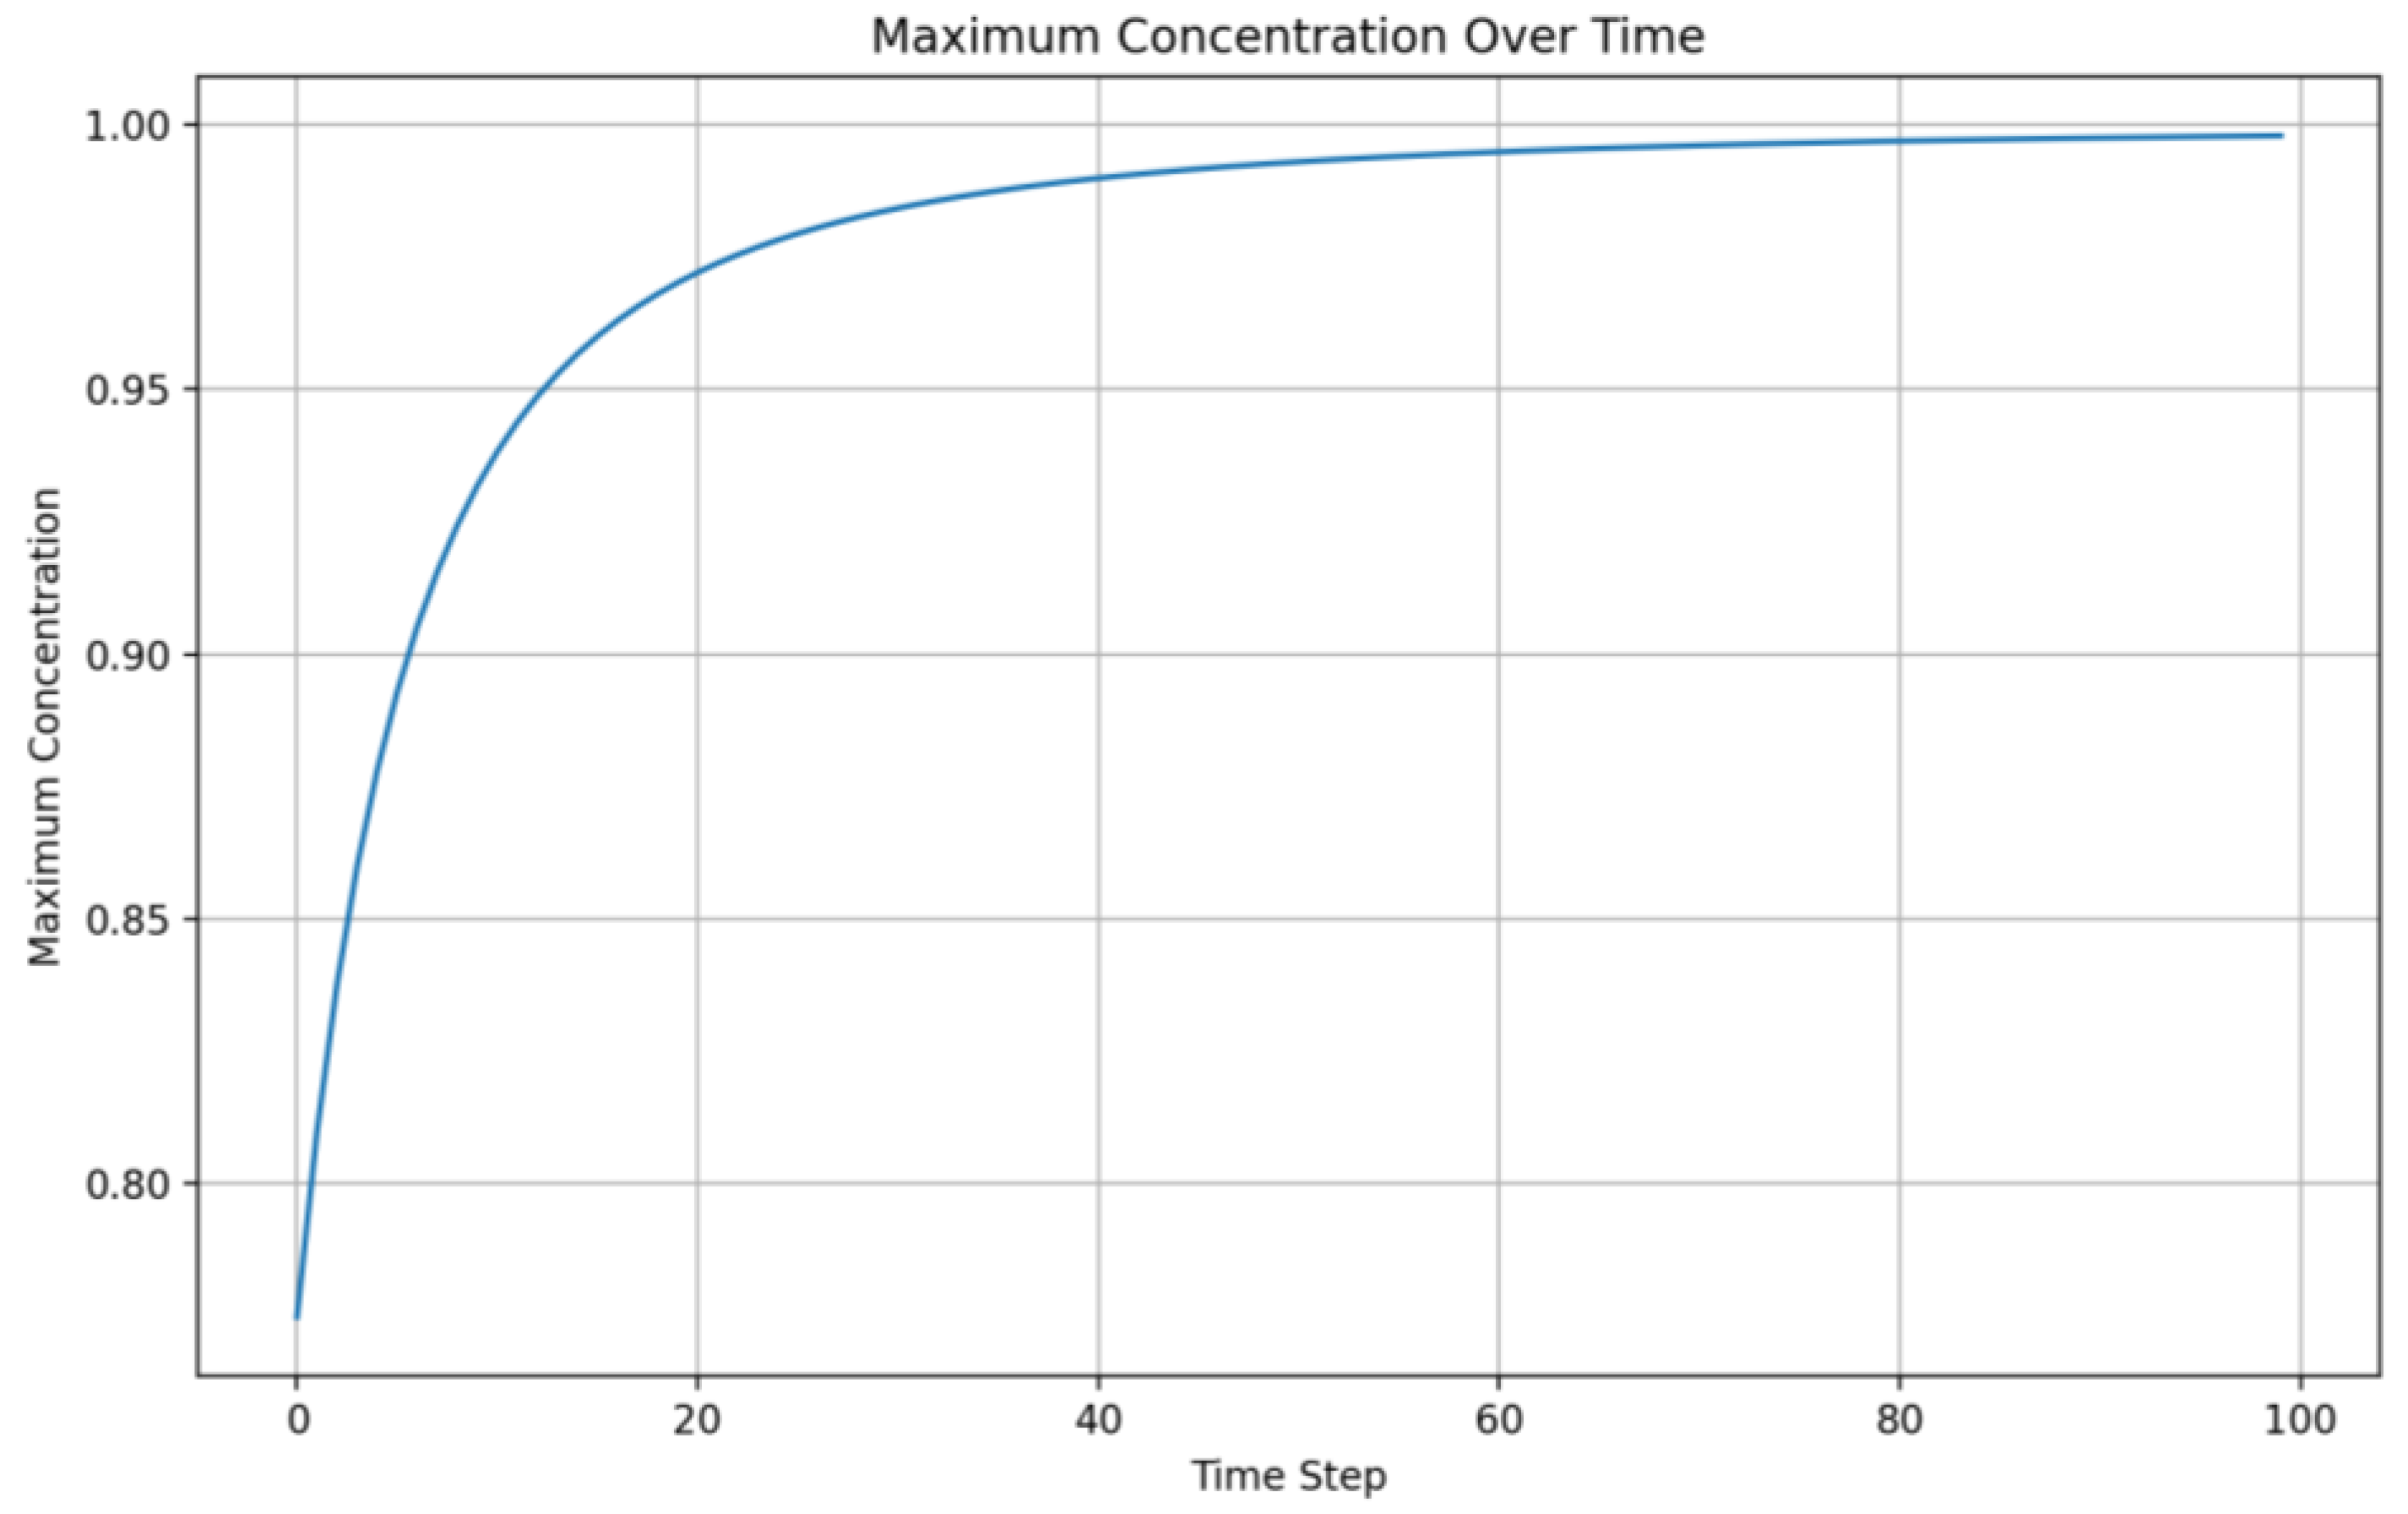
Figure 9 shows the stages of the concentration distribution simulation. In graph 9, a, the pollution concentration is maximum in the center of the region and decreases rapidly toward the edges. This corresponds to a localized pollution source.
In graph 9, b, pollution begins to spread from the center, the maximum concentration decreases, and the pollution area expands.
In graph 9, c, the pollution has spread over a larger area. The maximum concentration has decreased significantly and the distribution has become more uniform.
To test the model more accurately, let us consider different sources of air pollution in the city of Almaty (Kazakhstan), see Table 2.
Figure 10 shows a one-dimensional distribution of carbon monoxide concentrations, , where the concentration decreases exponentially with increasing distance from the source. This is typical behavior for pollutants spreading from a point source. The concentration decreases rapidly with increasing distance from the source, indicating a localized effect of the pollution.
Figure 11 shows the distribution of nitrogen dioxide concentration on a two-dimensional plane. Here, the concentration is maximum at the center and decreases radially, indicating a uniform distribution of the pollutant in two dimensions.
Graph 12 shows the distribution of the concentration of particulate matter in three-dimensional space, where it is maximum in the center and decreases in three directions. The maximum concentration in the center can indicate the source of pollution, and the decrease in concentration in three directions indicates the diffusion and dispersal of the pollutant in the atmosphere.
These results demonstrate the typical behavior of pollutants spreading from source in Almaty city. Concentrations decrease with increasing distance, which corresponds to the physical processes of diffusion and advection.
The obtained results can be useful for assessing the impact of pollution sources on the environment and for developing strategies to reduce air pollution, they also demonstrate the effectiveness of the upwind scheme for modeling the spread of pollutants in the atmosphere and provide a basis for further research and improvements in the field of atmospheric modeling.
Conclusions
In this paper, numerical modeling of pollutant dispersion in the air basin was carried out using the advection-diffusion model. The main attention was paid to analyzing the dynamics of pollution concentration as a function of time and spatial coordinates.
The simulation showed that the initial concentration of contamination localized in the central part of the region gradually spreads under the influence of advection and diffusion processes. This leads to a decrease of the maximum concentration and expansion of the pollution area. Model parameters, such as wind speed and diffusion coefficient, have a significant influence on the rate and character of pollution spreading. An increase in wind speed promotes faster transport of pollutants, while an increase in the diffusion coefficient leads to a more uniform concentration distribution.
The use of real data on pollutant concentrations allowed for more accurate modeling of pollution conditions in the city of Almaty. This makes the model useful for air quality forecasting and management.
This work demonstrates the potential of using mathematical modeling to address environmental problems in urban settings and can serve as a basis for further research and development in air quality management.
Acknowledgment
The article was carried out within the framework of the MSHE of RK grant funding project on scientific and/or scientific-technical projects for 2023-2025 AP19678926 «Development of an intelligent system to investigate and solve environmental problems of soil and air pollution using data science methods».
References
- Smirnova, M.N., et al. “Mathematical Modeling of Air Pollution in City Tunnels and Evaluating Mitigation Strategies.” Transportation Research Interdisciplinary Perspectives, vol. 4, Mar. 2020, p. 100086. Accessed 5 Sept. 2020. [CrossRef]
- Chattopadhyay, Dr. B.B., and Shibajee Singha Deo. “Mathematical Model in Air Pollution with Area Source.” SSRN Electronic Journal, 2020, Accessed 20 Dec. 2021. [CrossRef]
- Svozilík, Vladislav, et al. “Comparison of the Air Pollution Mathematical Model of PM10 and Moss Biomonitoring Results in the Tritia Region.” Atmosphere, vol. 12, no. 6, 21 May 2021, p. 656, Accessed 29 Sept. 2021. [CrossRef]
- Farhan, Ahmad, et al. “AIR POLLUTION from MOTOR VEHICLES a MATHEMATICAL MODEL ANALYSIS: CASE STUDY in IPOH CITY,PERAK, MALAYSIA.” Journal of the Eastern Asia Society for Transportation Studies, vol. 5, 2003, core.ac.uk/download/pdf/298087089.pdf.
- “Modeling Based on the Analysis of Interval Data of Atmospheric Air Pollution Processes with Nitrogen Dioxide due to The….” Dntb.gov.ua, 2023, ouci.dntb.gov.ua/en/works/ldq85bY9/. Accessed 12 Sept. 2024.
- Mărunţălu, Oliver, et al. “MATHEMATICAL MODEL for AIR POLLUTANTS DISPERSION EMITTED by FUEL COMBUSTION.” U.P.B. Sci. Bull., Series D, vol. 77, no. 4, 2015, www.scientificbulletin.upb.ro/rev_docs_arhiva/full677_521179.pdf. Accessed 12 Sept. 2024.
- Byun, Daewon, and Kenneth L. Schere. “Review of the Governing Equations, Computational Algorithms, and Other Components of the Models-3 Community Multiscale Air Quality (CMAQ) Modeling System.” Applied Mechanics Reviews, vol. 59, no. 2, 2006, p. 51, https://doi.org/10.1115/1.2128636. Accessed 5 Jan. 2022. [CrossRef]
- Kim, Bu-Yo, et al. “Short-Term Prediction of Particulate Matter (PM10 and PM2.5) in Seoul, South Korea Using Tree-Based Machine Learning Algorithms.” Atmospheric Pollution Research, vol. 13, no. 10, Oct. 2022, p. 101547. [CrossRef]
- Ravindiran, Gokulan, et al. “Air Quality Prediction by Machine Learning Models: A Predictive Study on the Indian Coastal City of Visakhapatnam.” Chemosphere, vol. 338, 1 Oct. 2023, p. 139518, www.sciencedirect.com/science/article/pii/S004565352301785X?via%3Dihub. [CrossRef]
- Lelieveld, J., et al. “The Contribution of Outdoor Air Pollution Sources to Premature Mortality on a Global Scale.” Nature, vol. 525, no. 7569, Sept. 2015, pp. 367–371. [CrossRef]
- Seinfeld, J. H., & Pandis, S. N. (2016). Atmospheric Chemistry and Physics: From Air Pollution to Climate Change. Wiley.
- Byun, D., & Schere, K. L. (2006). Review of the governing equations, computational algorithms, and other components of the Models-3 Community Multiscale Air Quality (CMAQ) modeling system. Applied Mechanics Reviews, 59(2), 51-77.
- Steyn, D. G., et al. (2013). Air pollution modeling and its application XXII. Springer.
- Zheng, B., et al. (2013). Observing and understanding the Southeast Asian aerosol system by remote sensing: An initial review and analysis for the Seven Southeast Asian Studies (7SEAS) program. Atmospheric Research, 122, 403-416.
- Kim, Y., et al. (2020). Modeling of PM2.5 and PM10 in major urban areas: A case study in Seoul. Atmospheric Environment, 223, 117295.
- Wen, X., et al. (2019). Machine learning models to predict air quality in urban and rural areas in China. Atmospheric Pollution Research, 10(3), 939-948.
- Lelieveld, J., et al. (2015). The contribution of outdoor air pollution sources to premature mortality on a global scale. Nature, 525(7569), 367-371.
- G. D. Kaziyeva, S. K. Sagnayeva, G. K. Sembina and A. A. Ismailova, "Software tools for environmental monitoring of the Northern part of the Caspian sea," 2018 4th International Conference on Computer and Technology Applications (ICCTA), Istanbul, Turkey, 2018, pp. 85-90. [CrossRef]
- K.Kolesnikova, L.Naizabayeva, A.Myrzabayeva, R. Lisnevskyi Use the neural networks in prediction of environmental processes. SIST 2024 - 2024 IEEE 4th International Conference on Smart Information Systems and Technologies, Proceedings, 2024, pp. 625–630. [CrossRef]
- Lyazat Naizabayeva, Chingiz Nurzhanov, Zhassulan Orazbekov, Gulnara Tleuberdieva. Corporate environmental information system data storage development and management (Environmental Information System), Open Computer Science, 2017, 7(1), pp. 29–35.
Figure 2.
Concentration and distribution of pollution in the two-dimensional case.
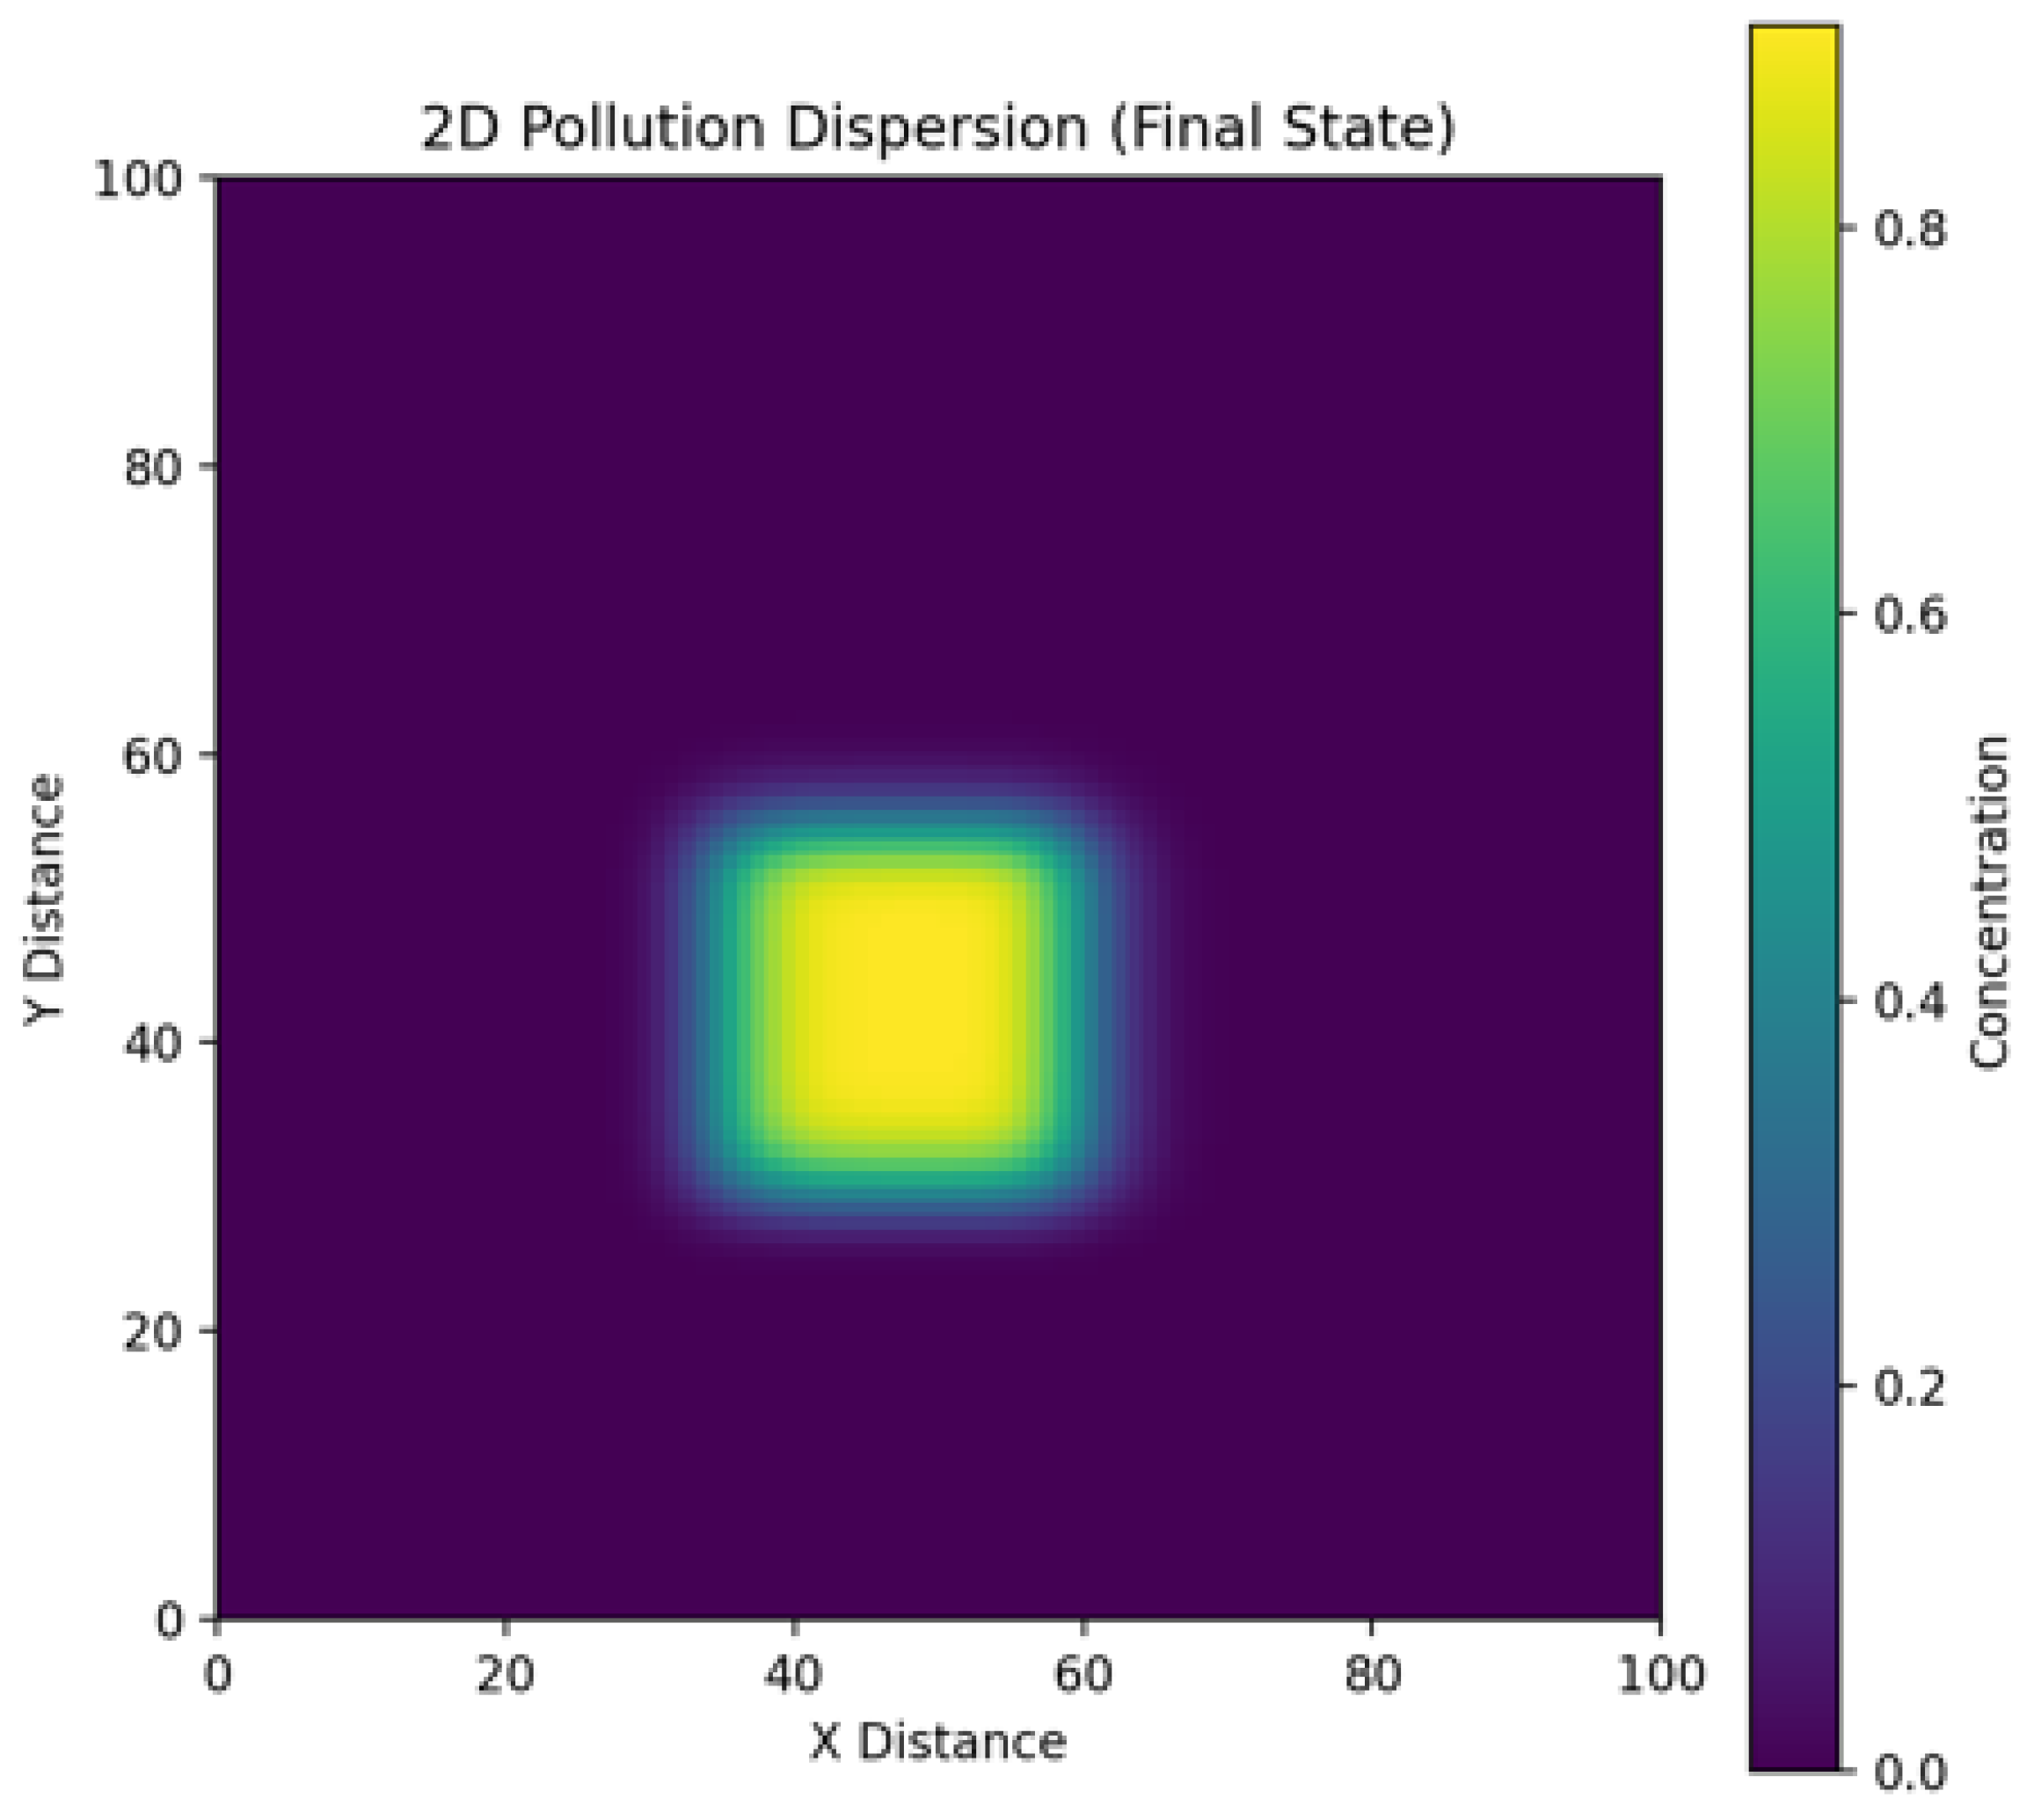
Figure 3.
Concentration and spread of pollution in the three-dimensional case.
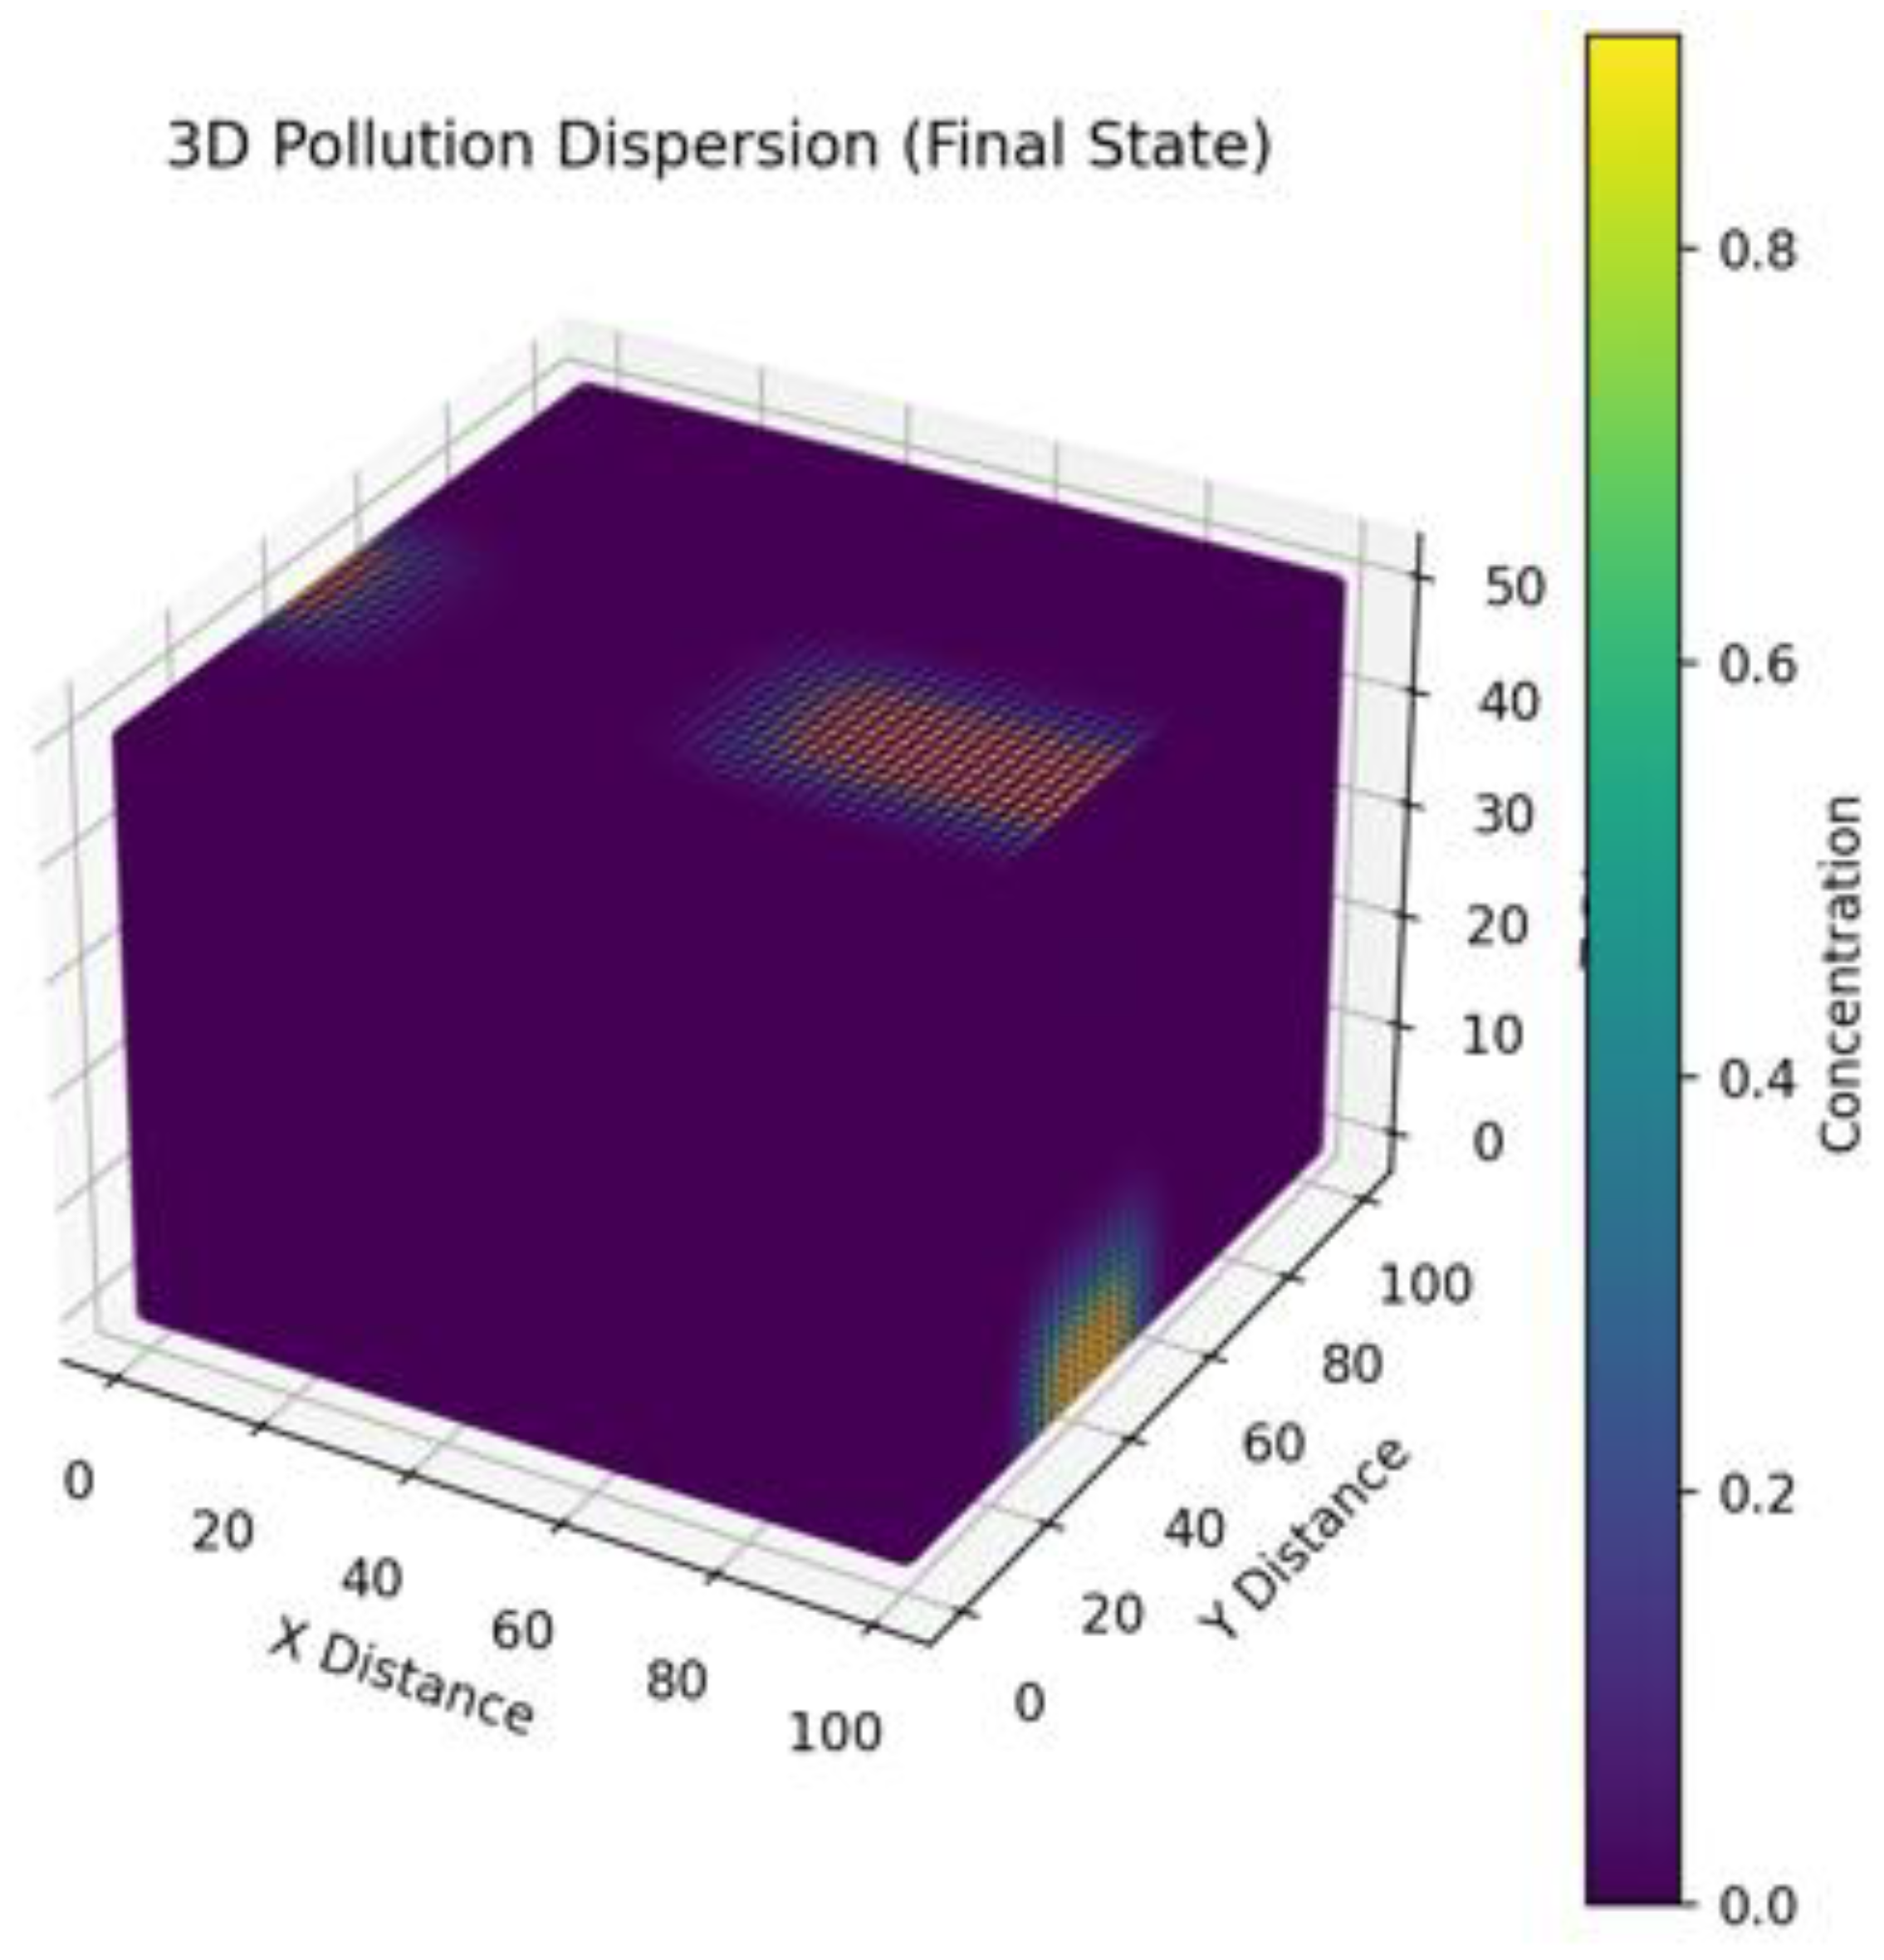
Figure 4.
Change in concentration over time t in the one-dimensional case.
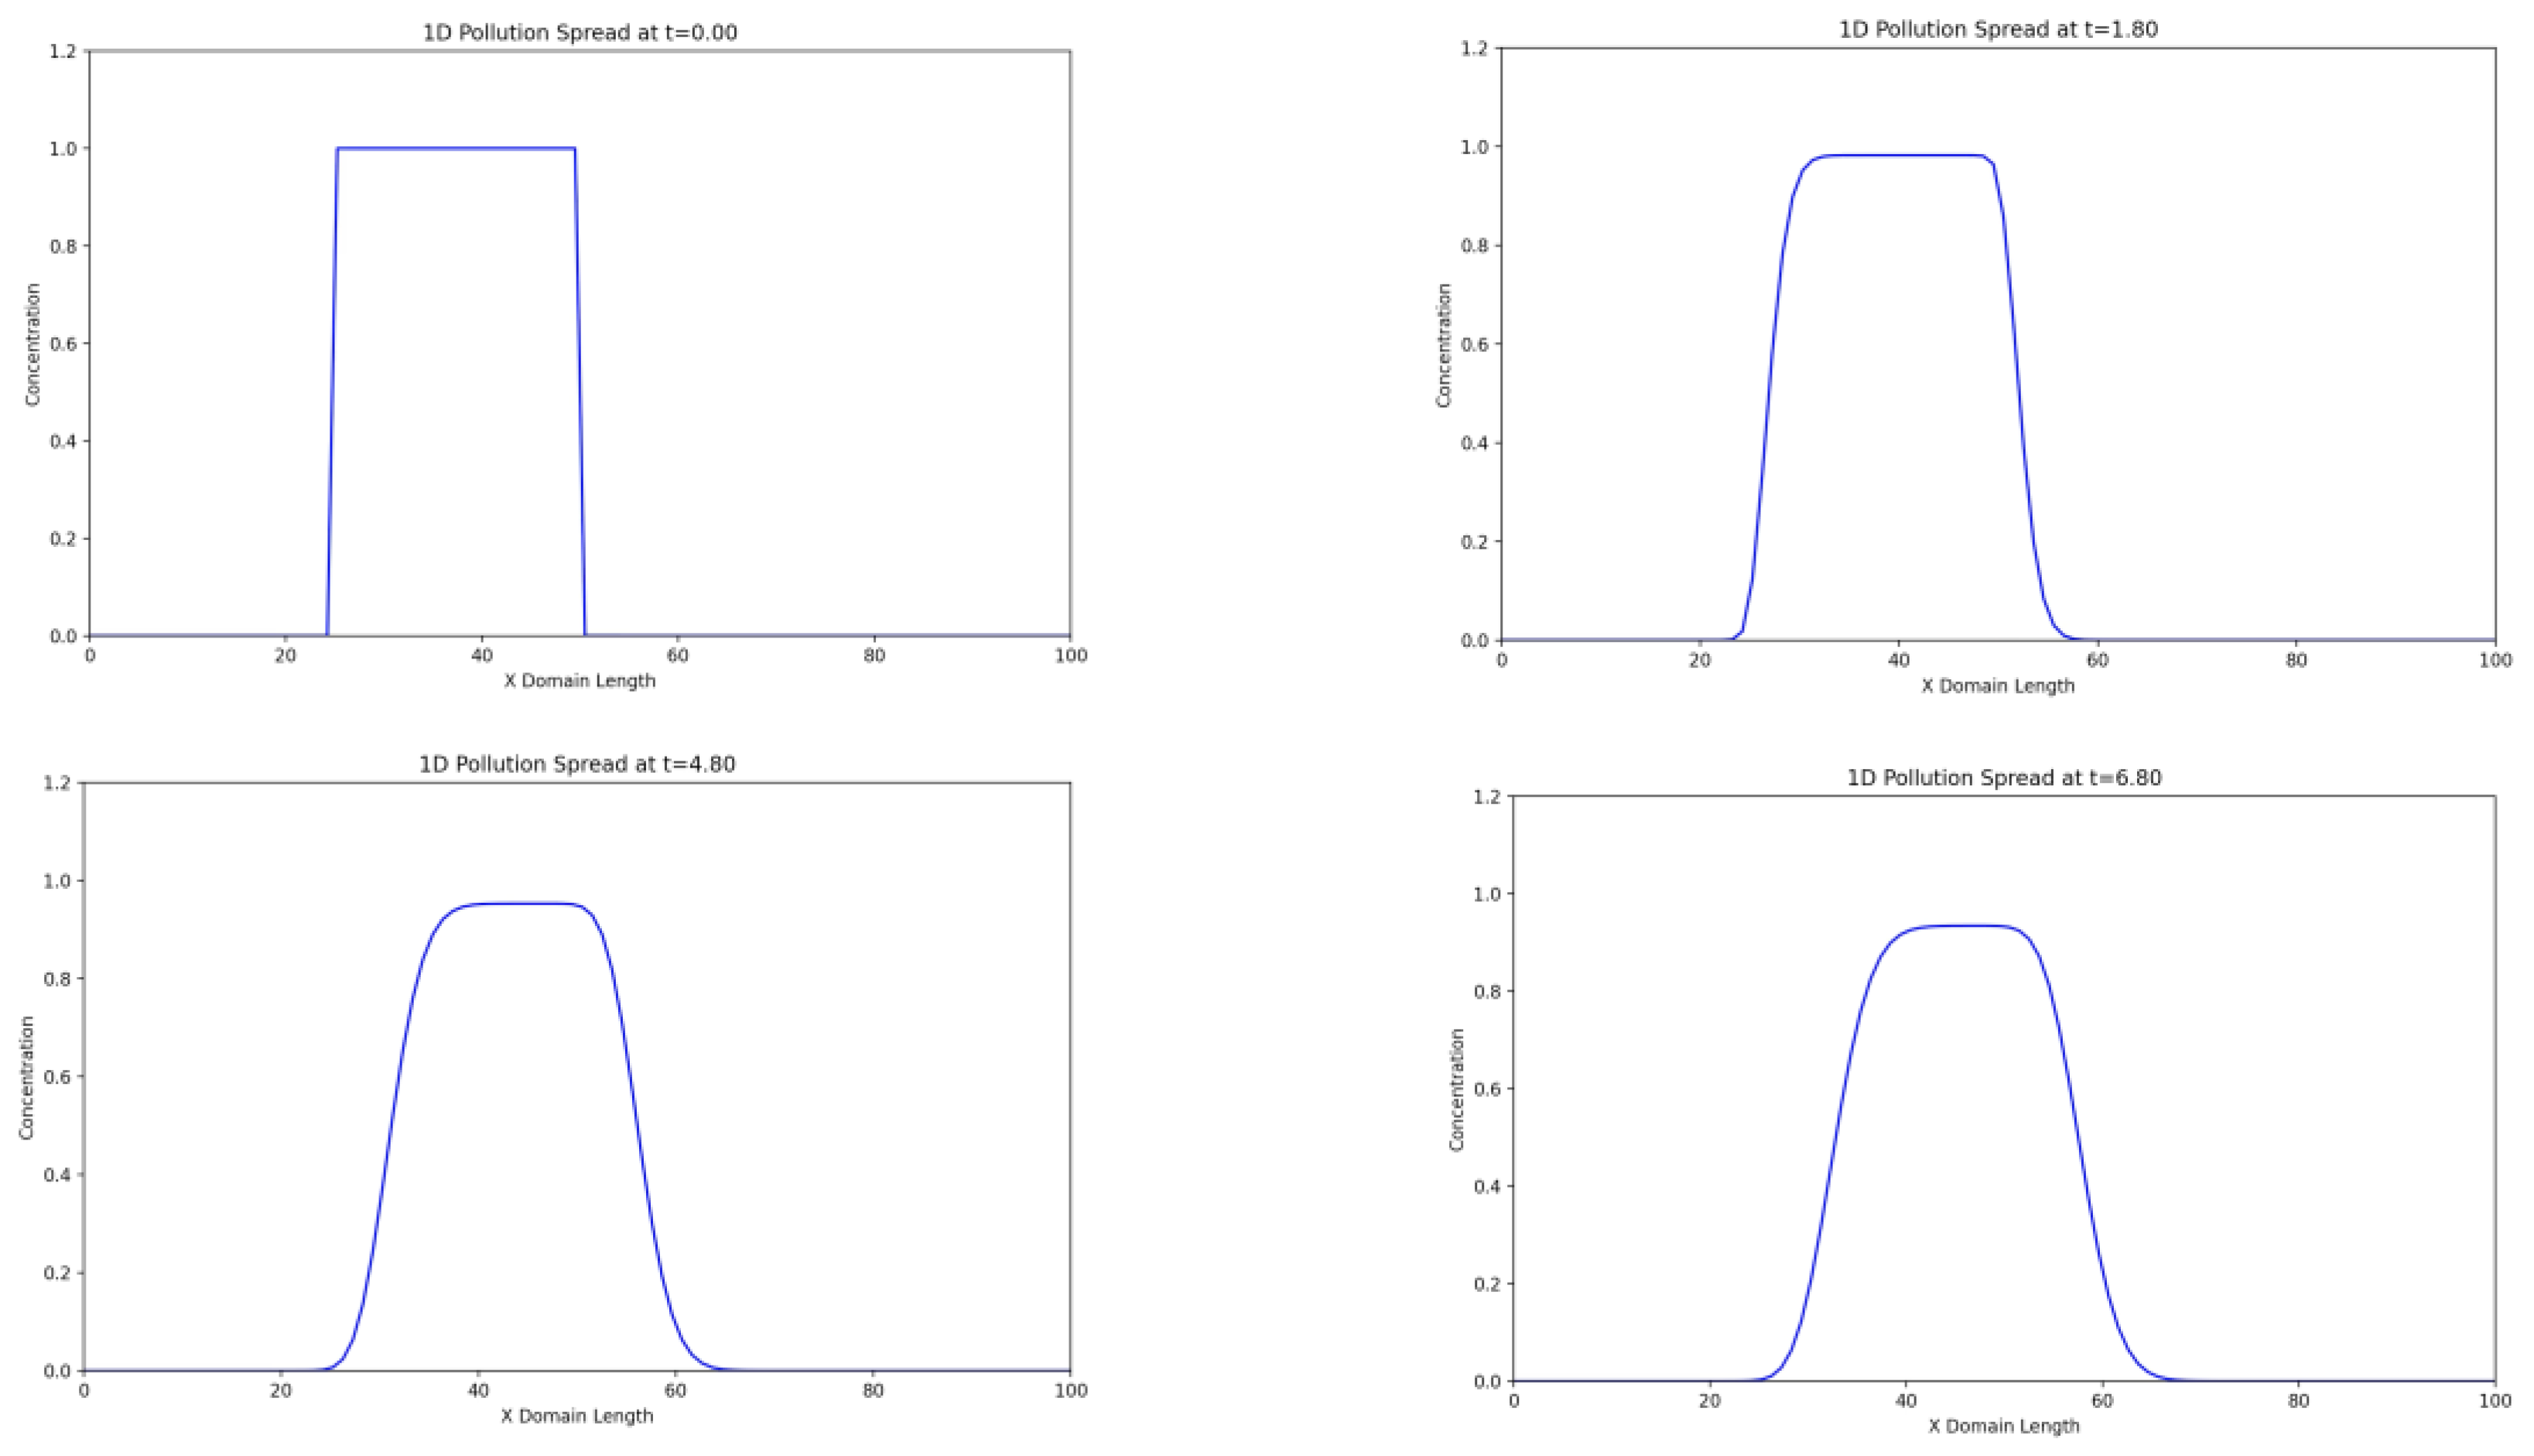
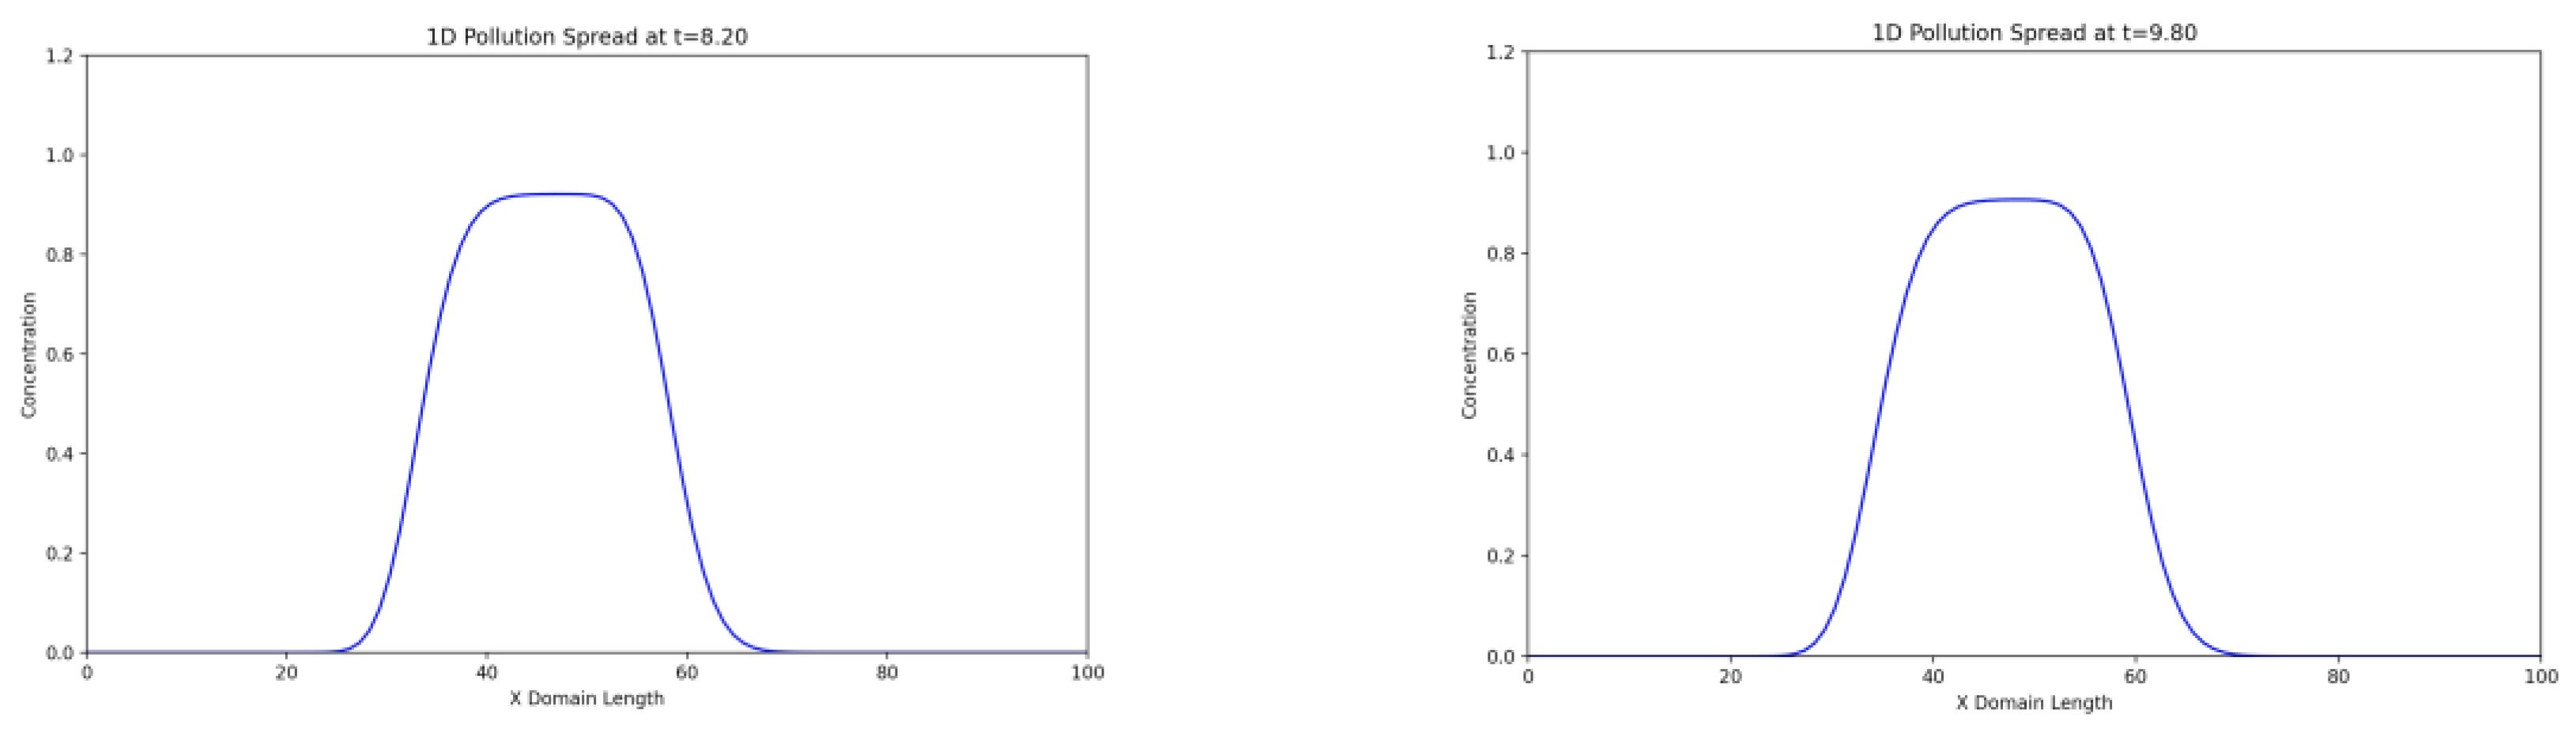
Figure 5.
Change in concentration over time t in the two-dimensional case.
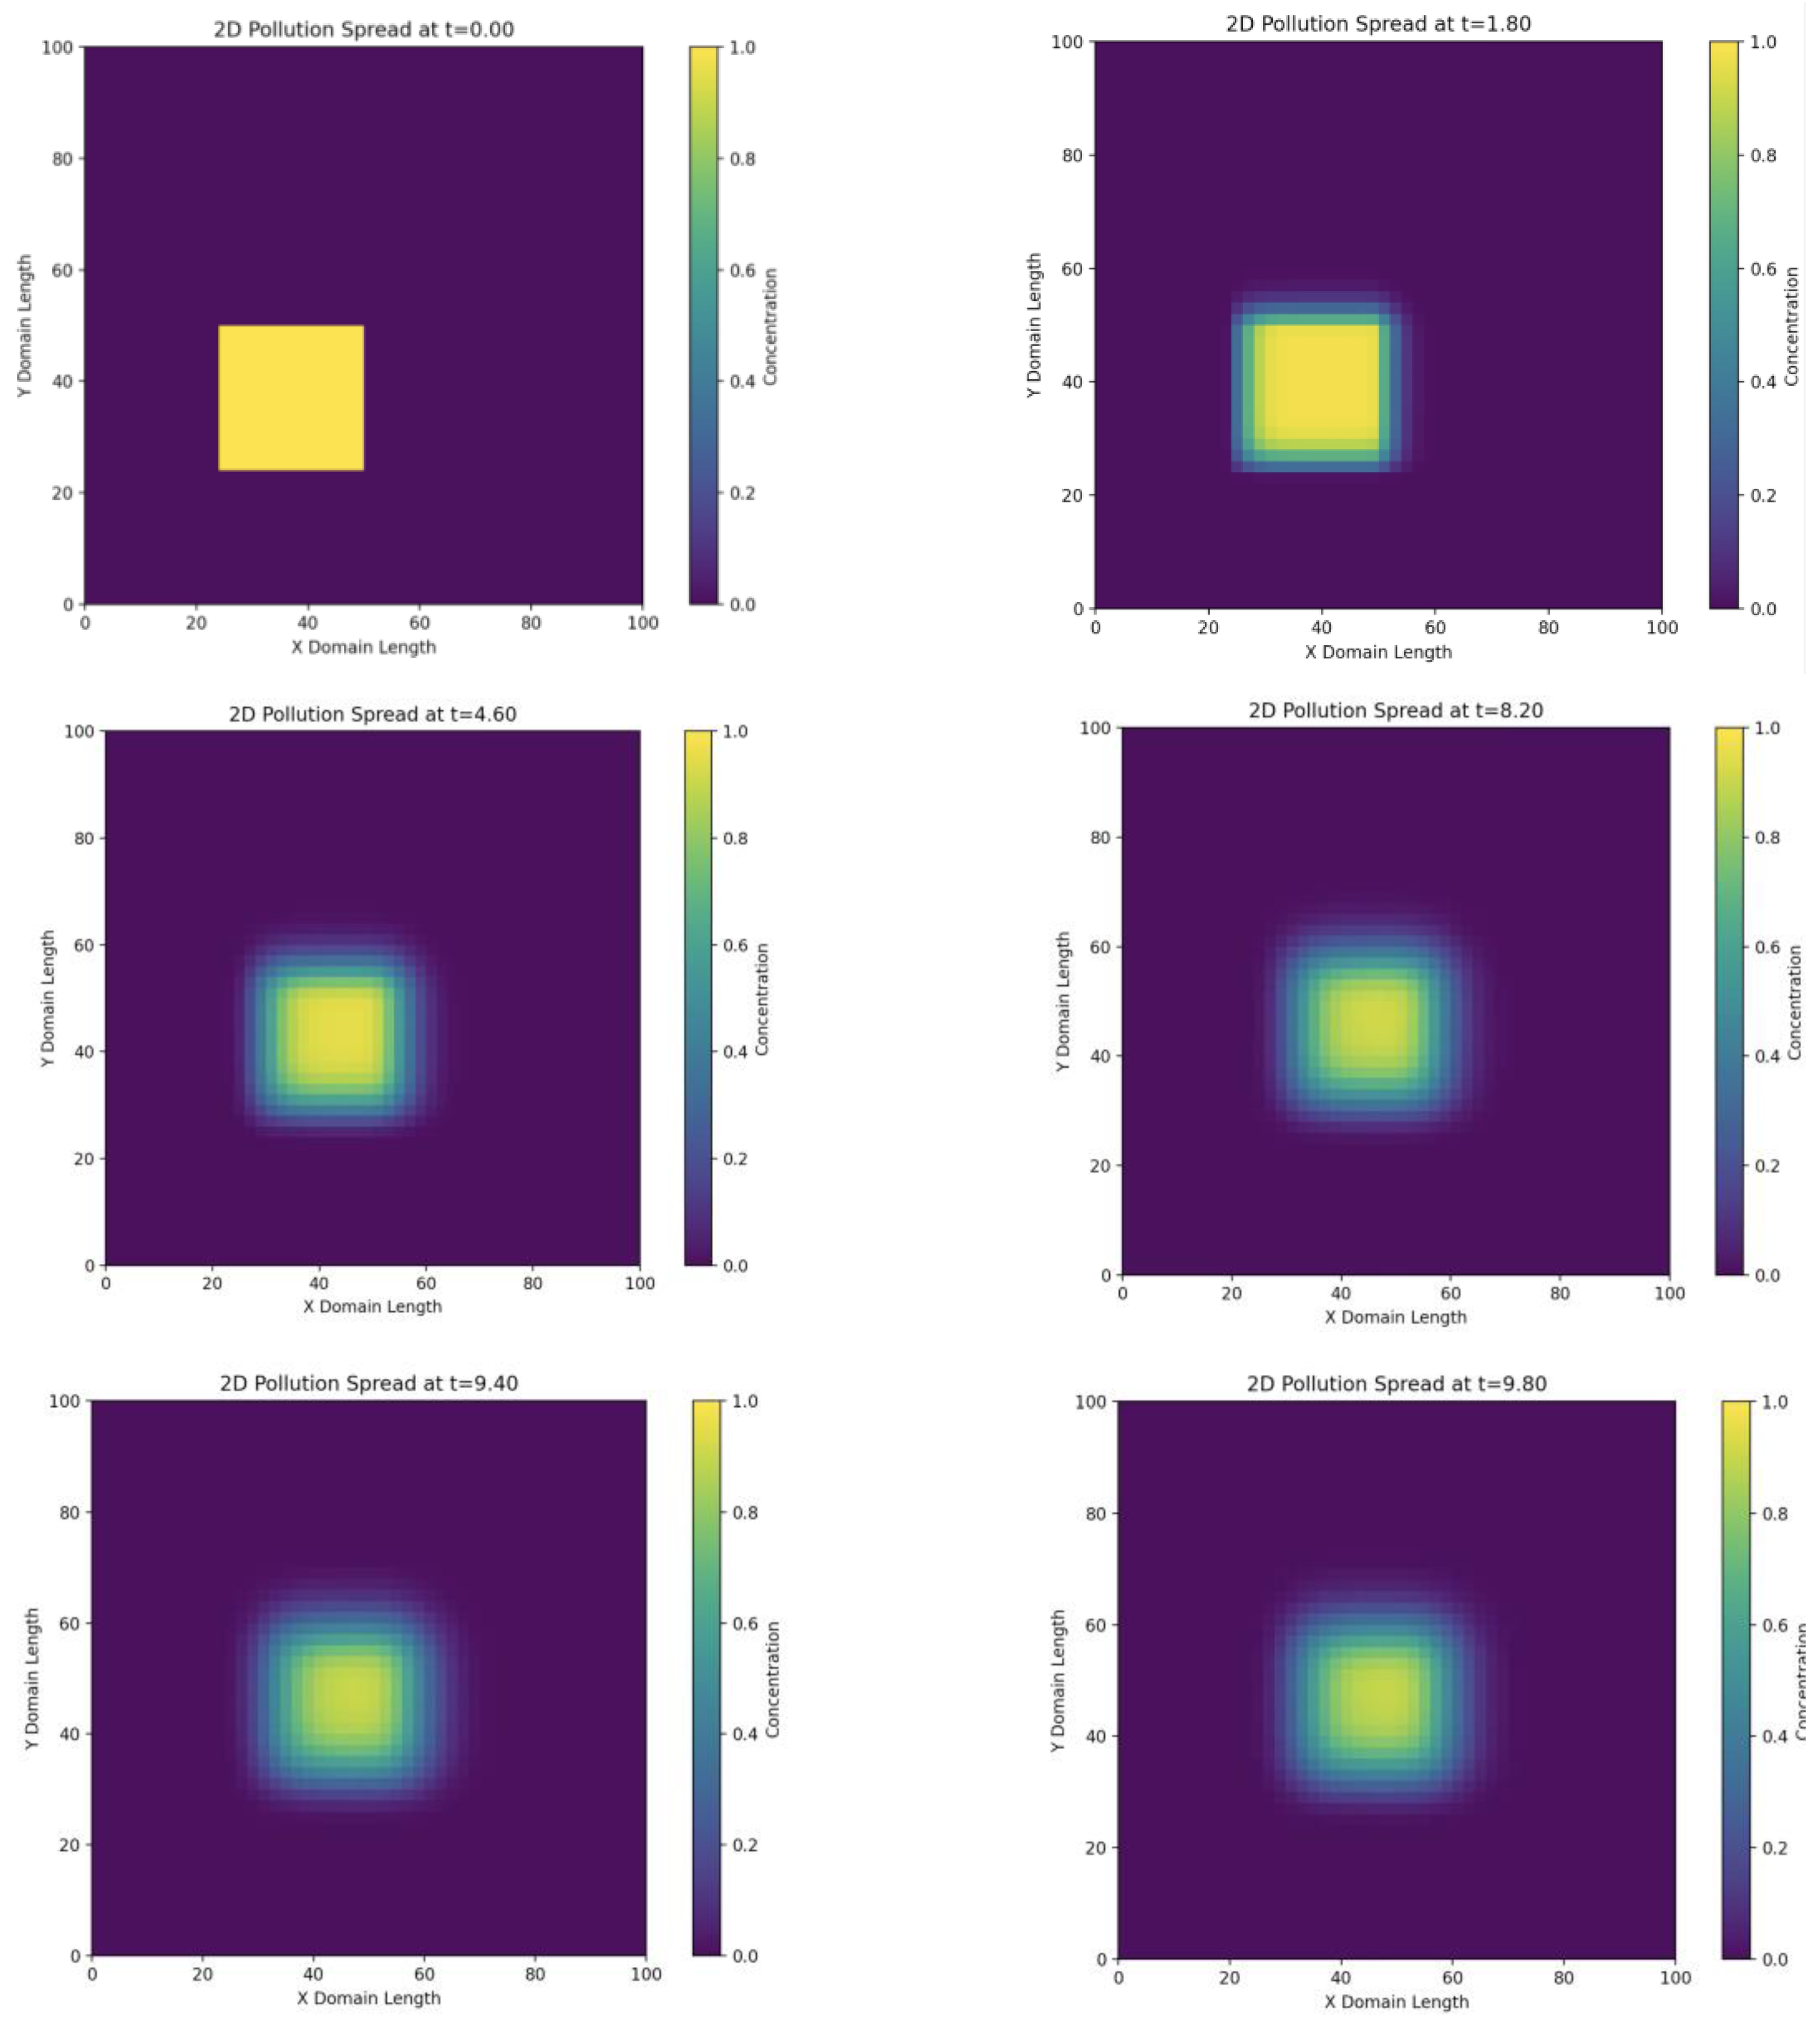
Figure 6.
Change in concentration over time t in the three-dimensional case.
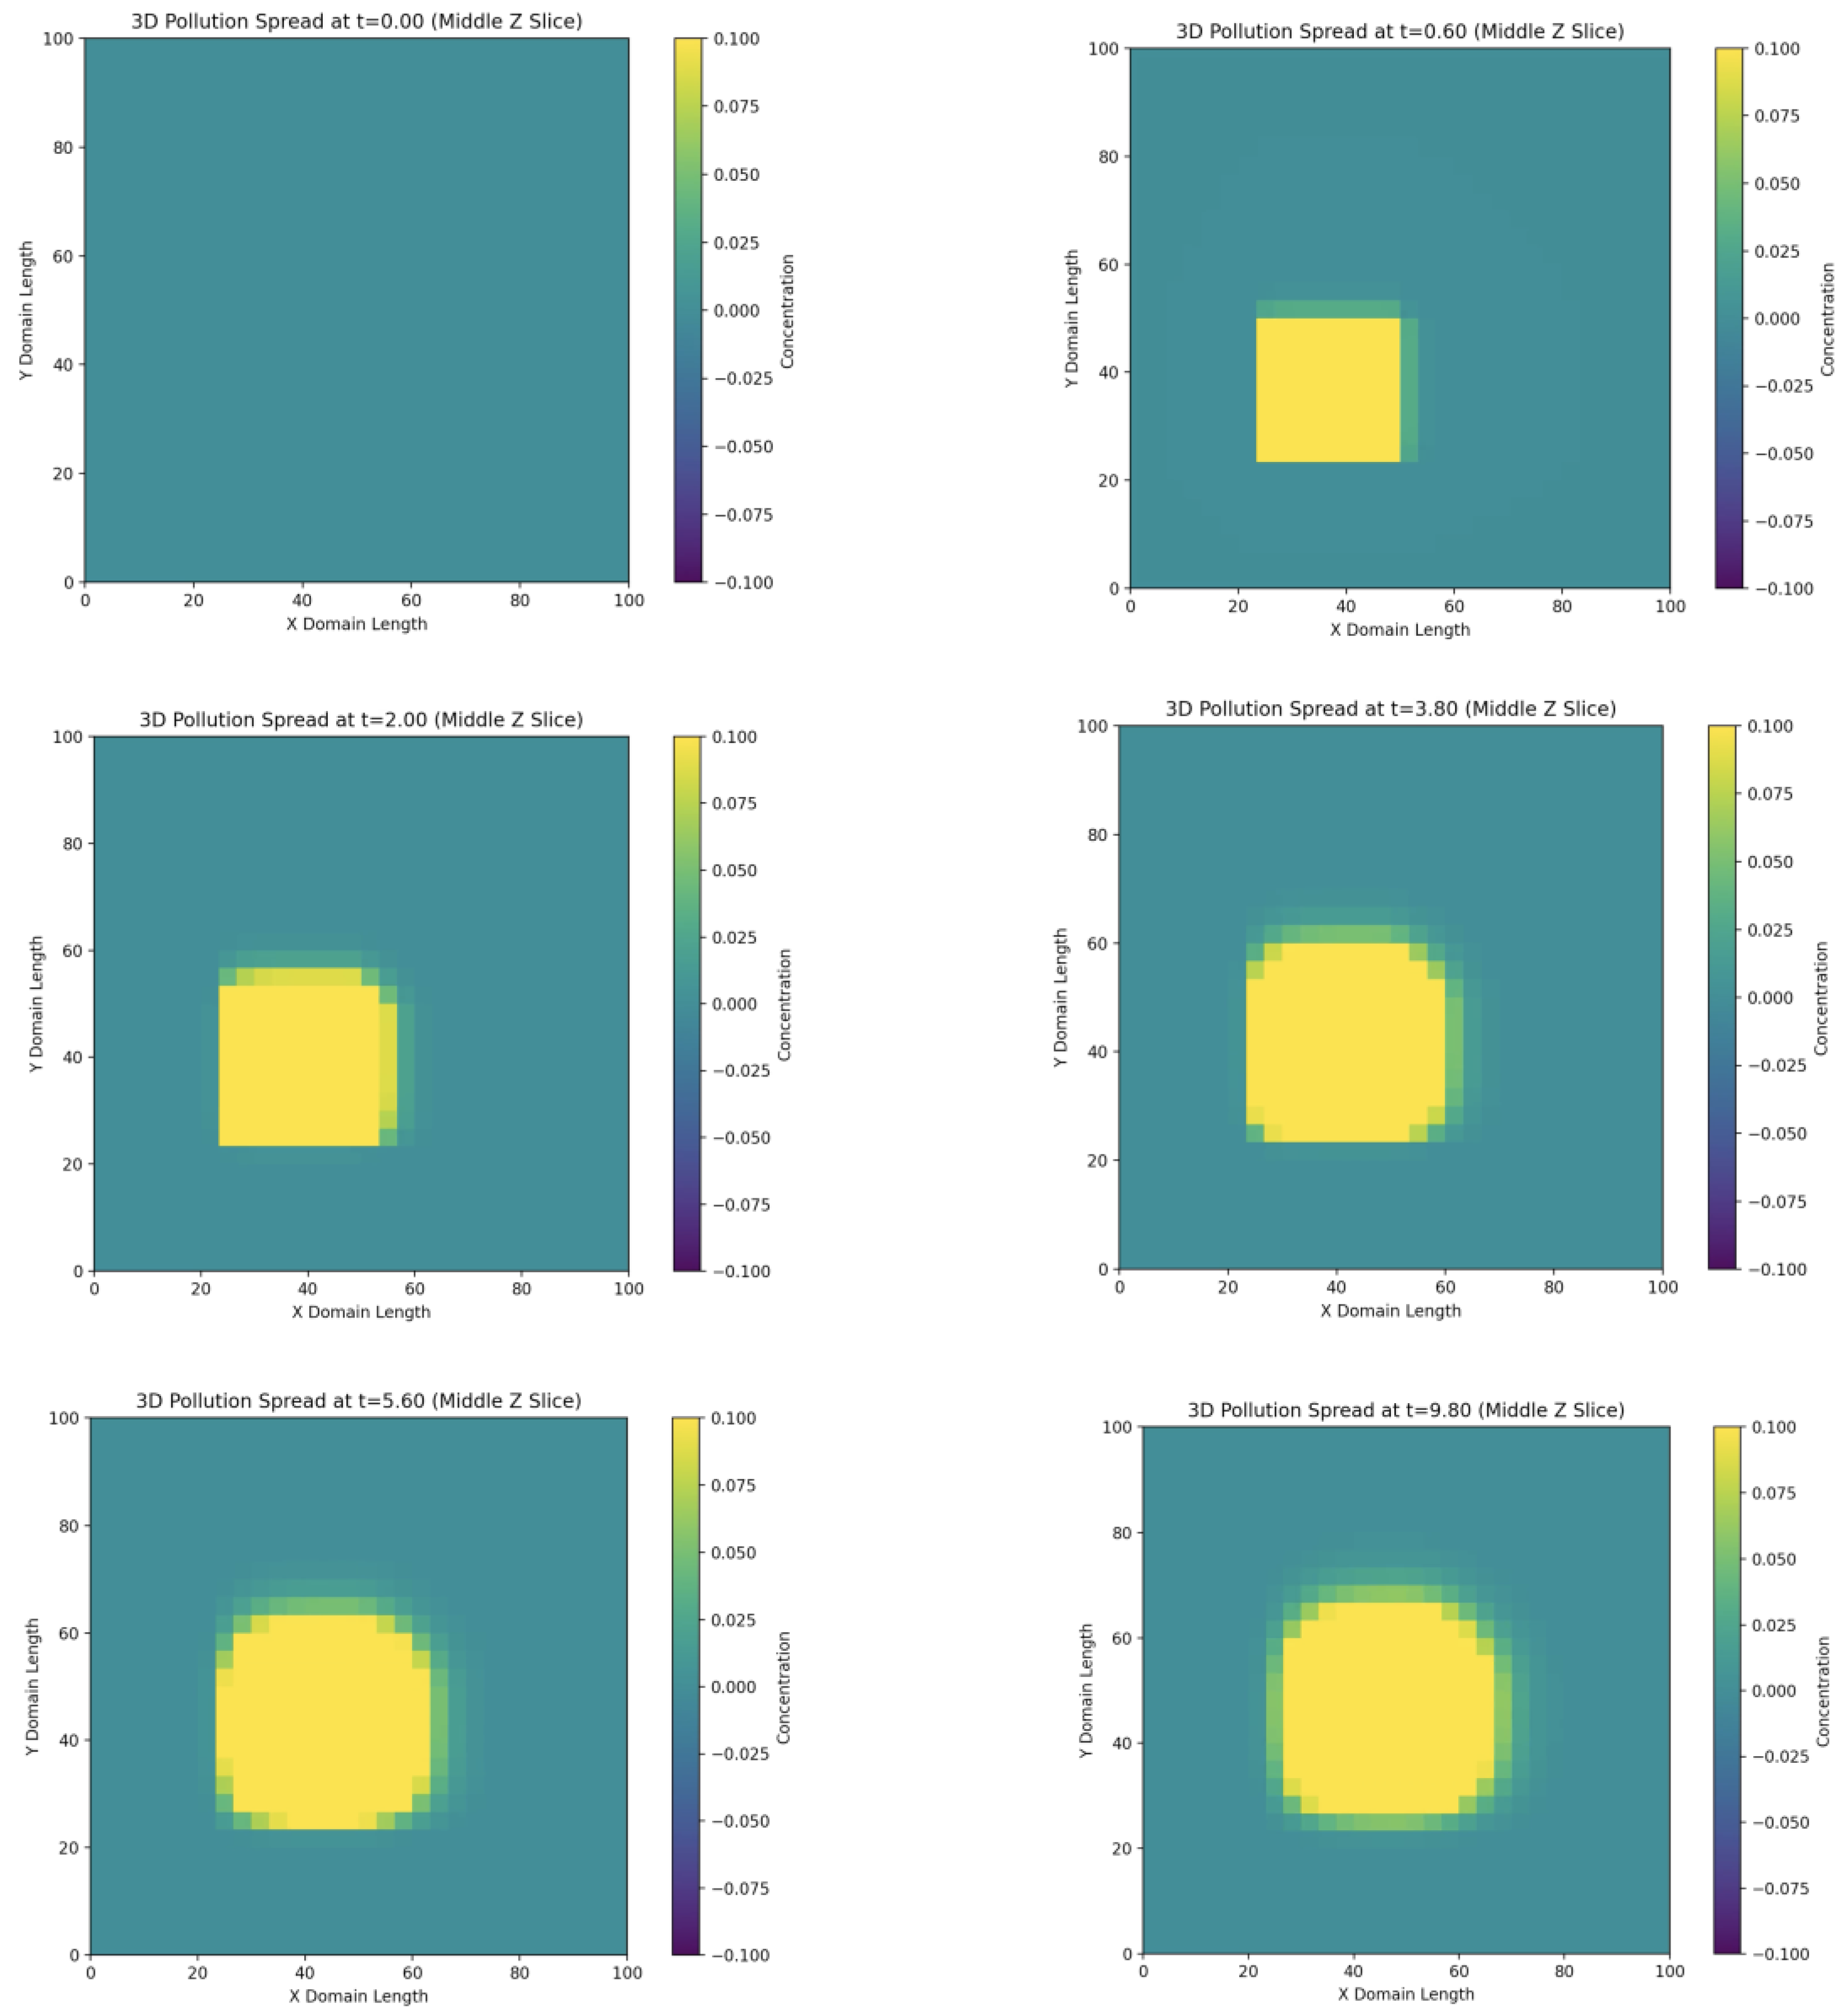
Figure 7.
Concentration profile over time at a fixed point.
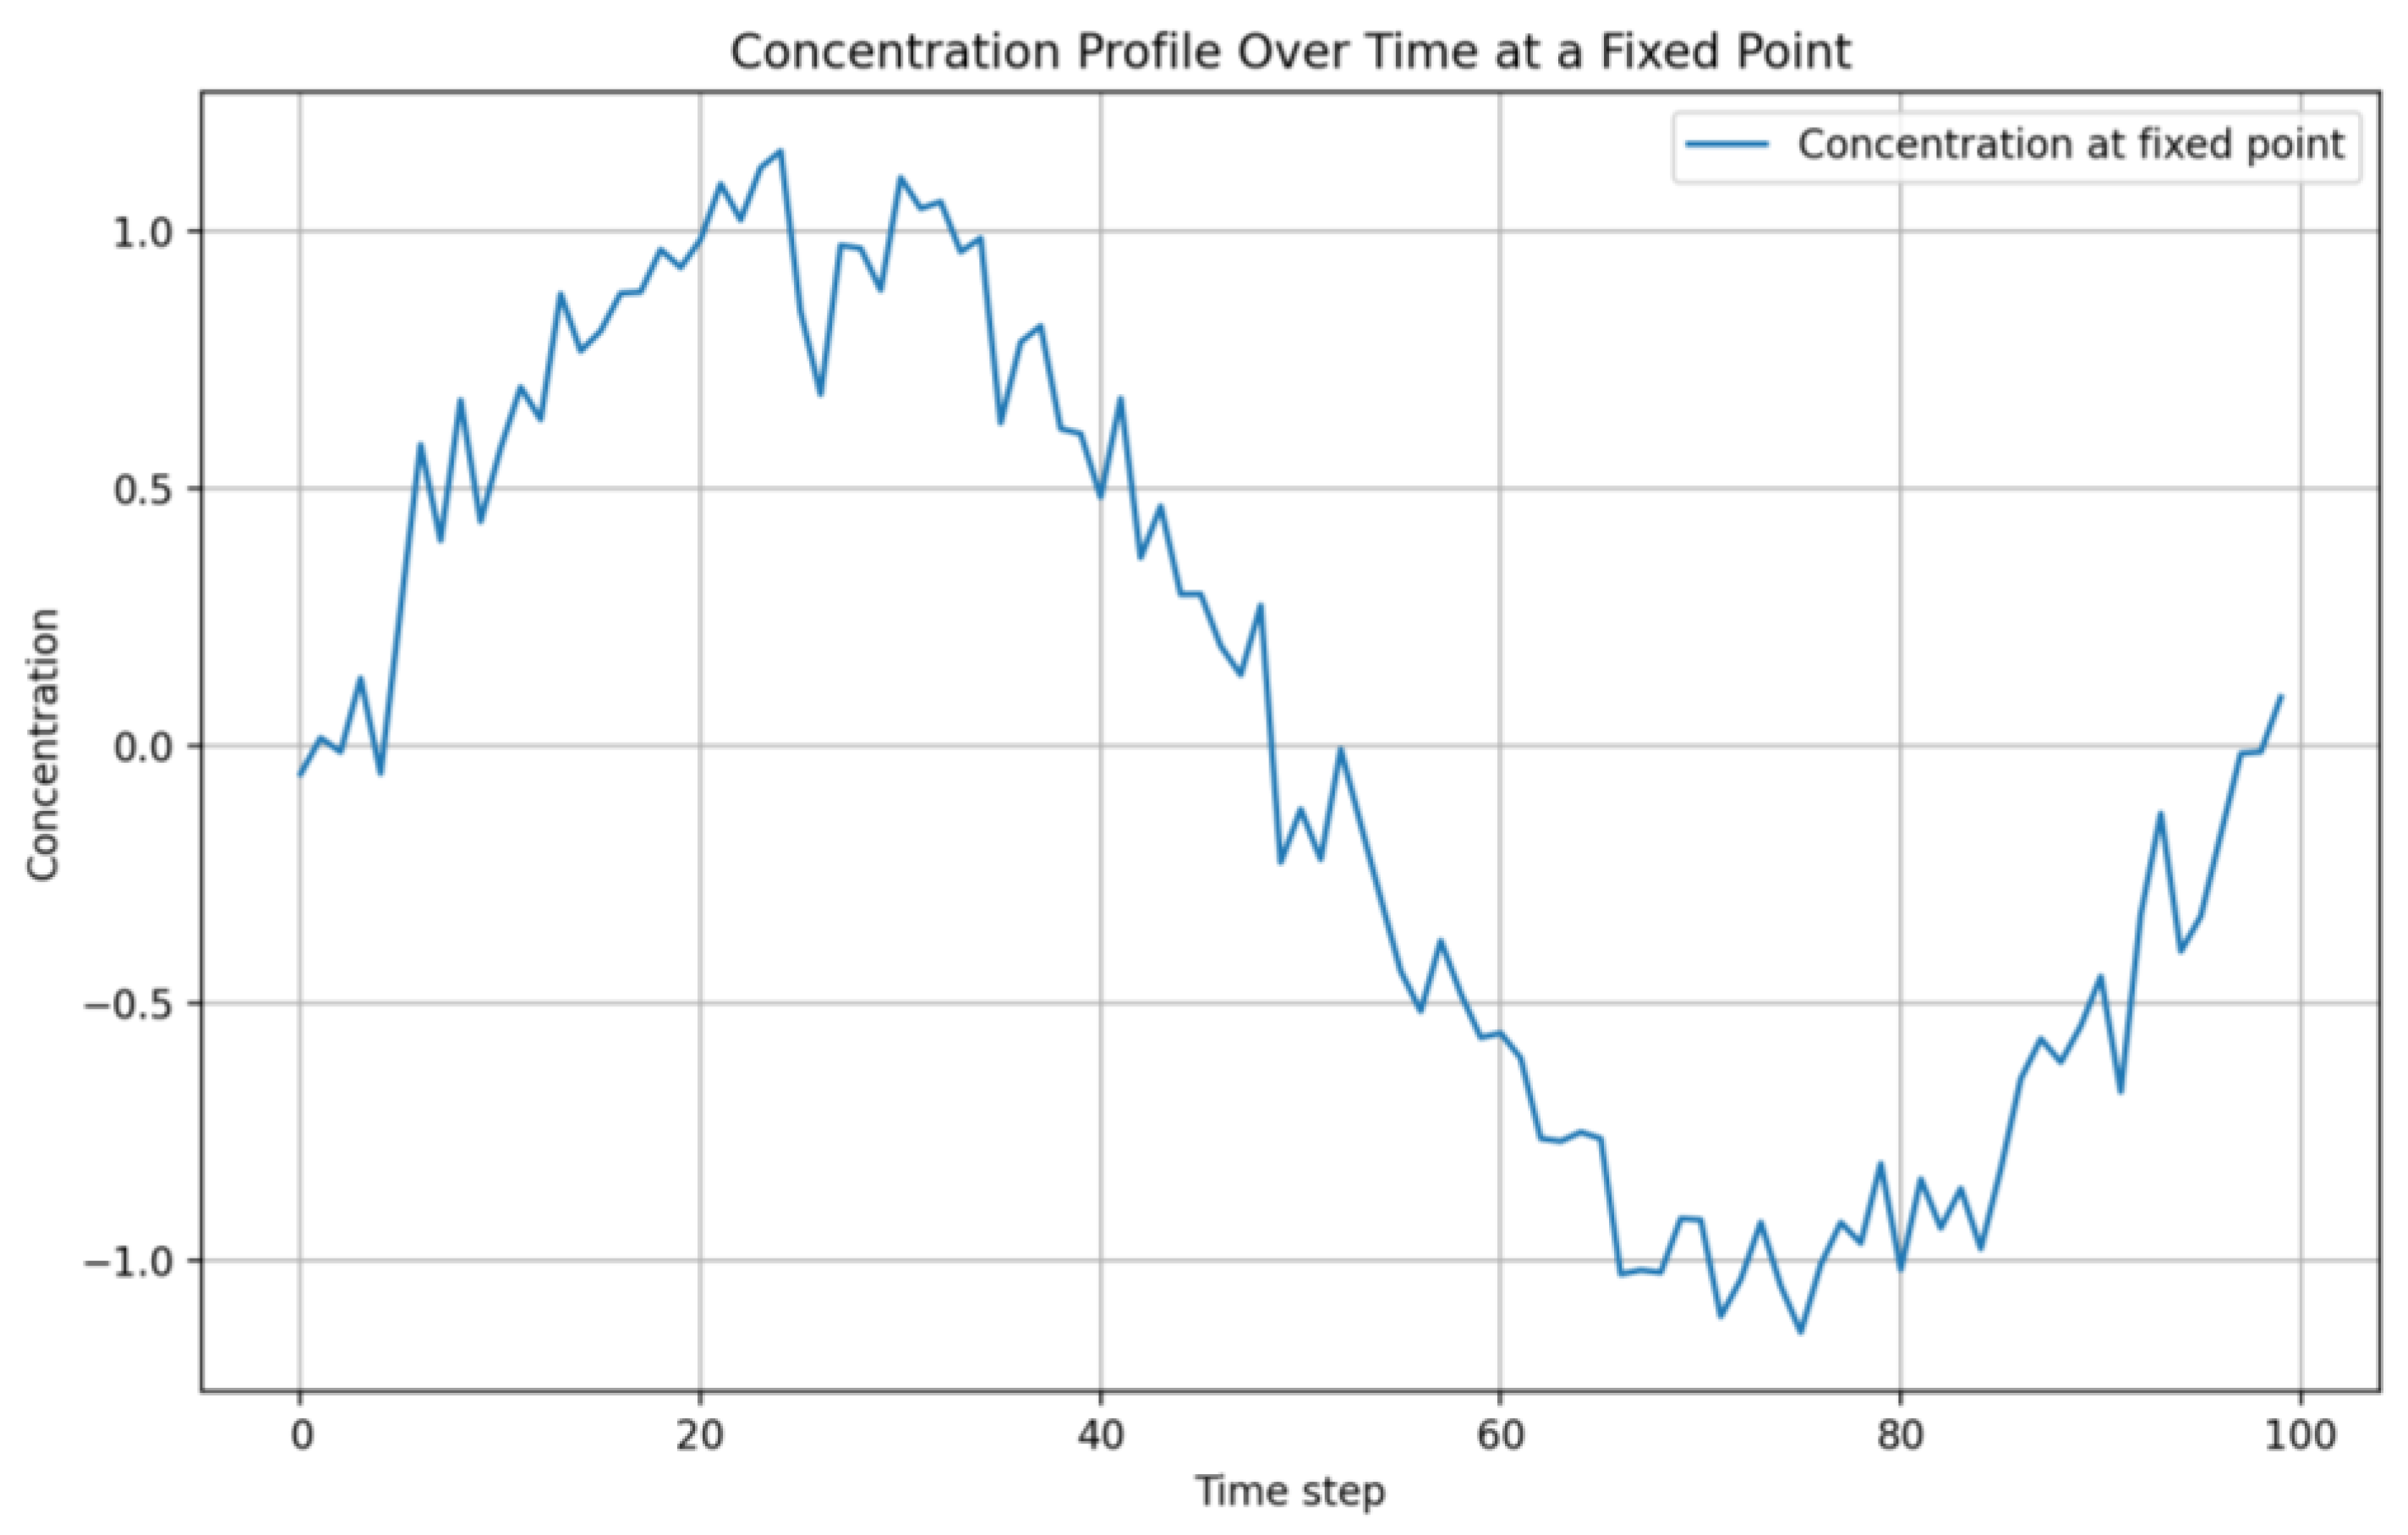
Figure 9.
Distribution of concentration in different time steps.
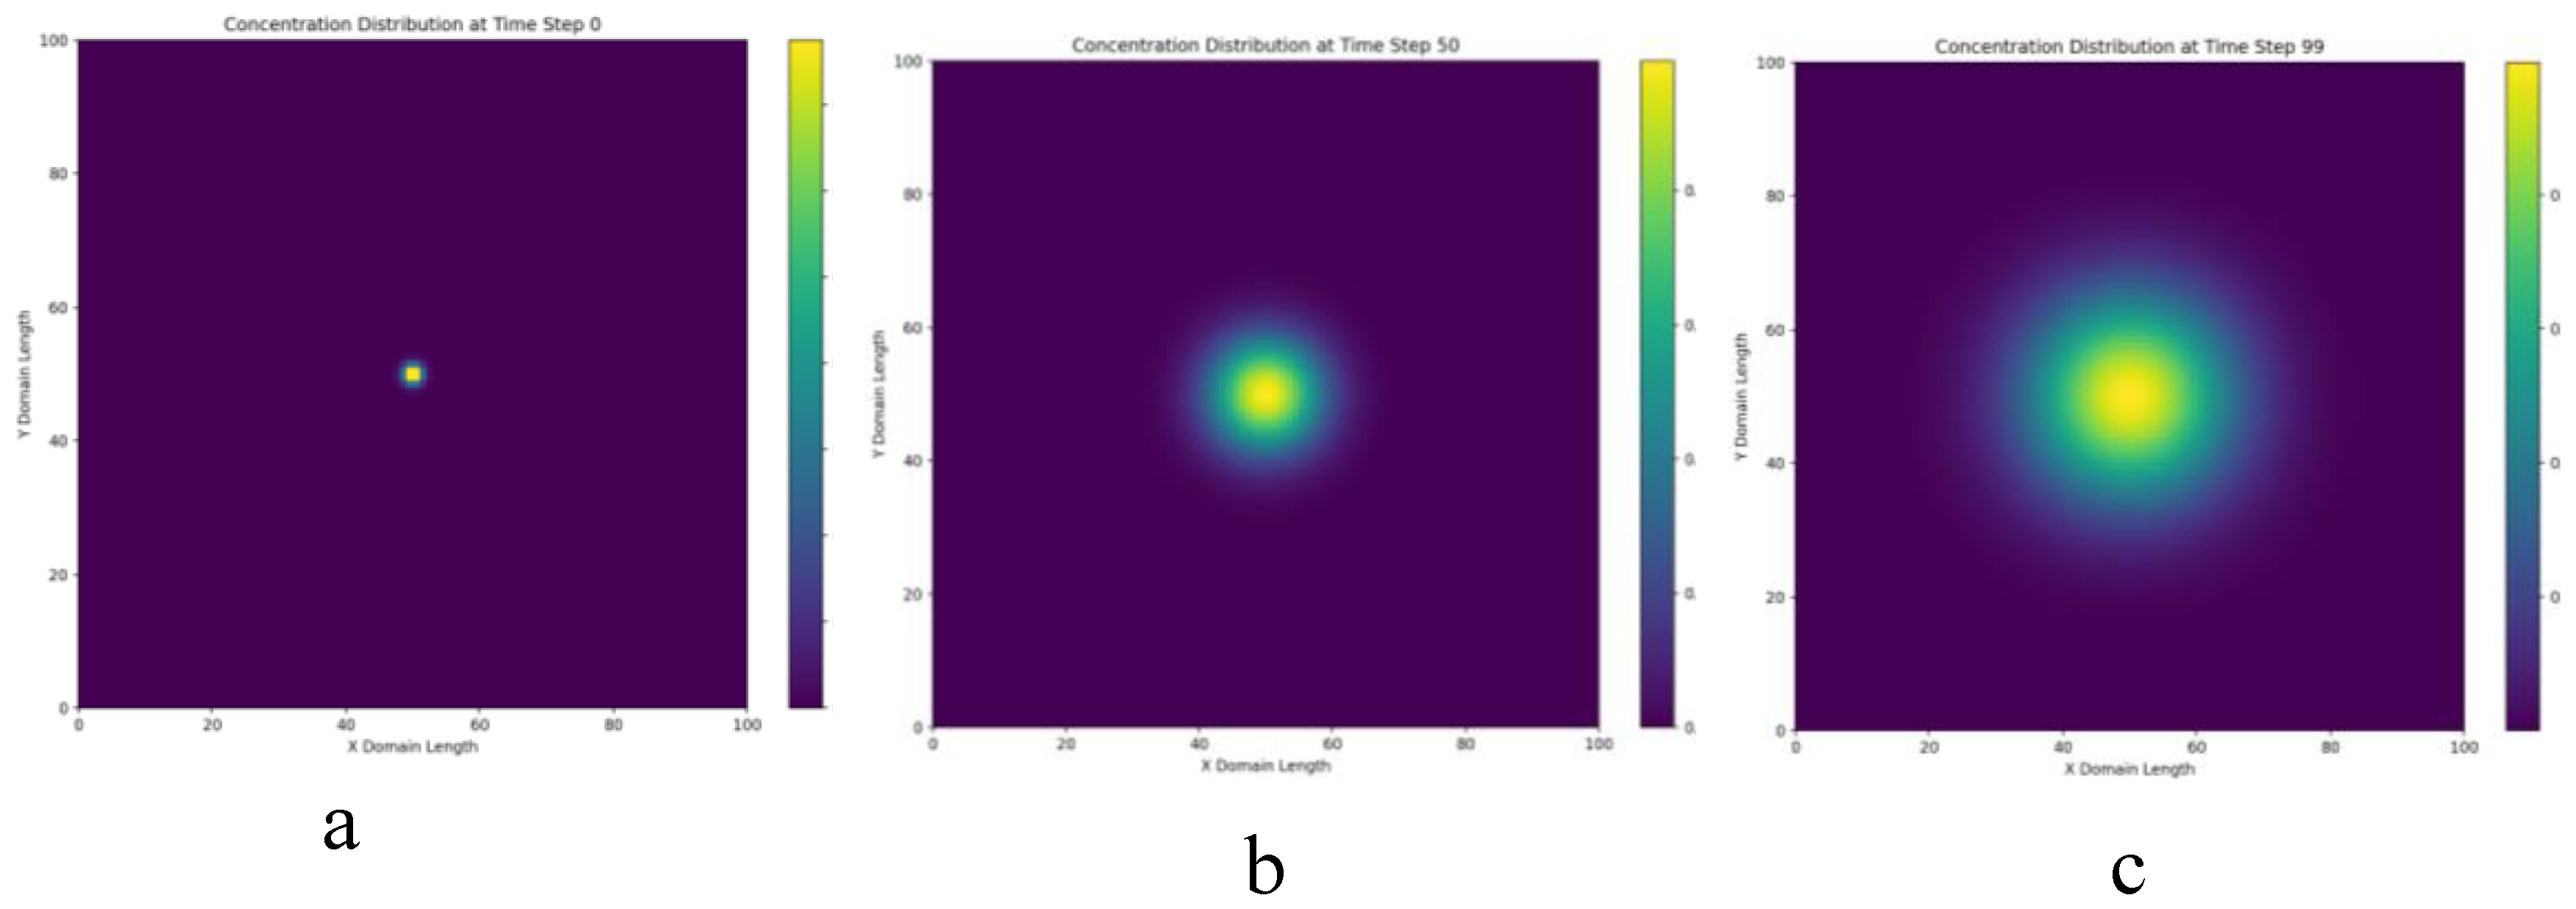
Figure 10.
Distribution of gas concentration.
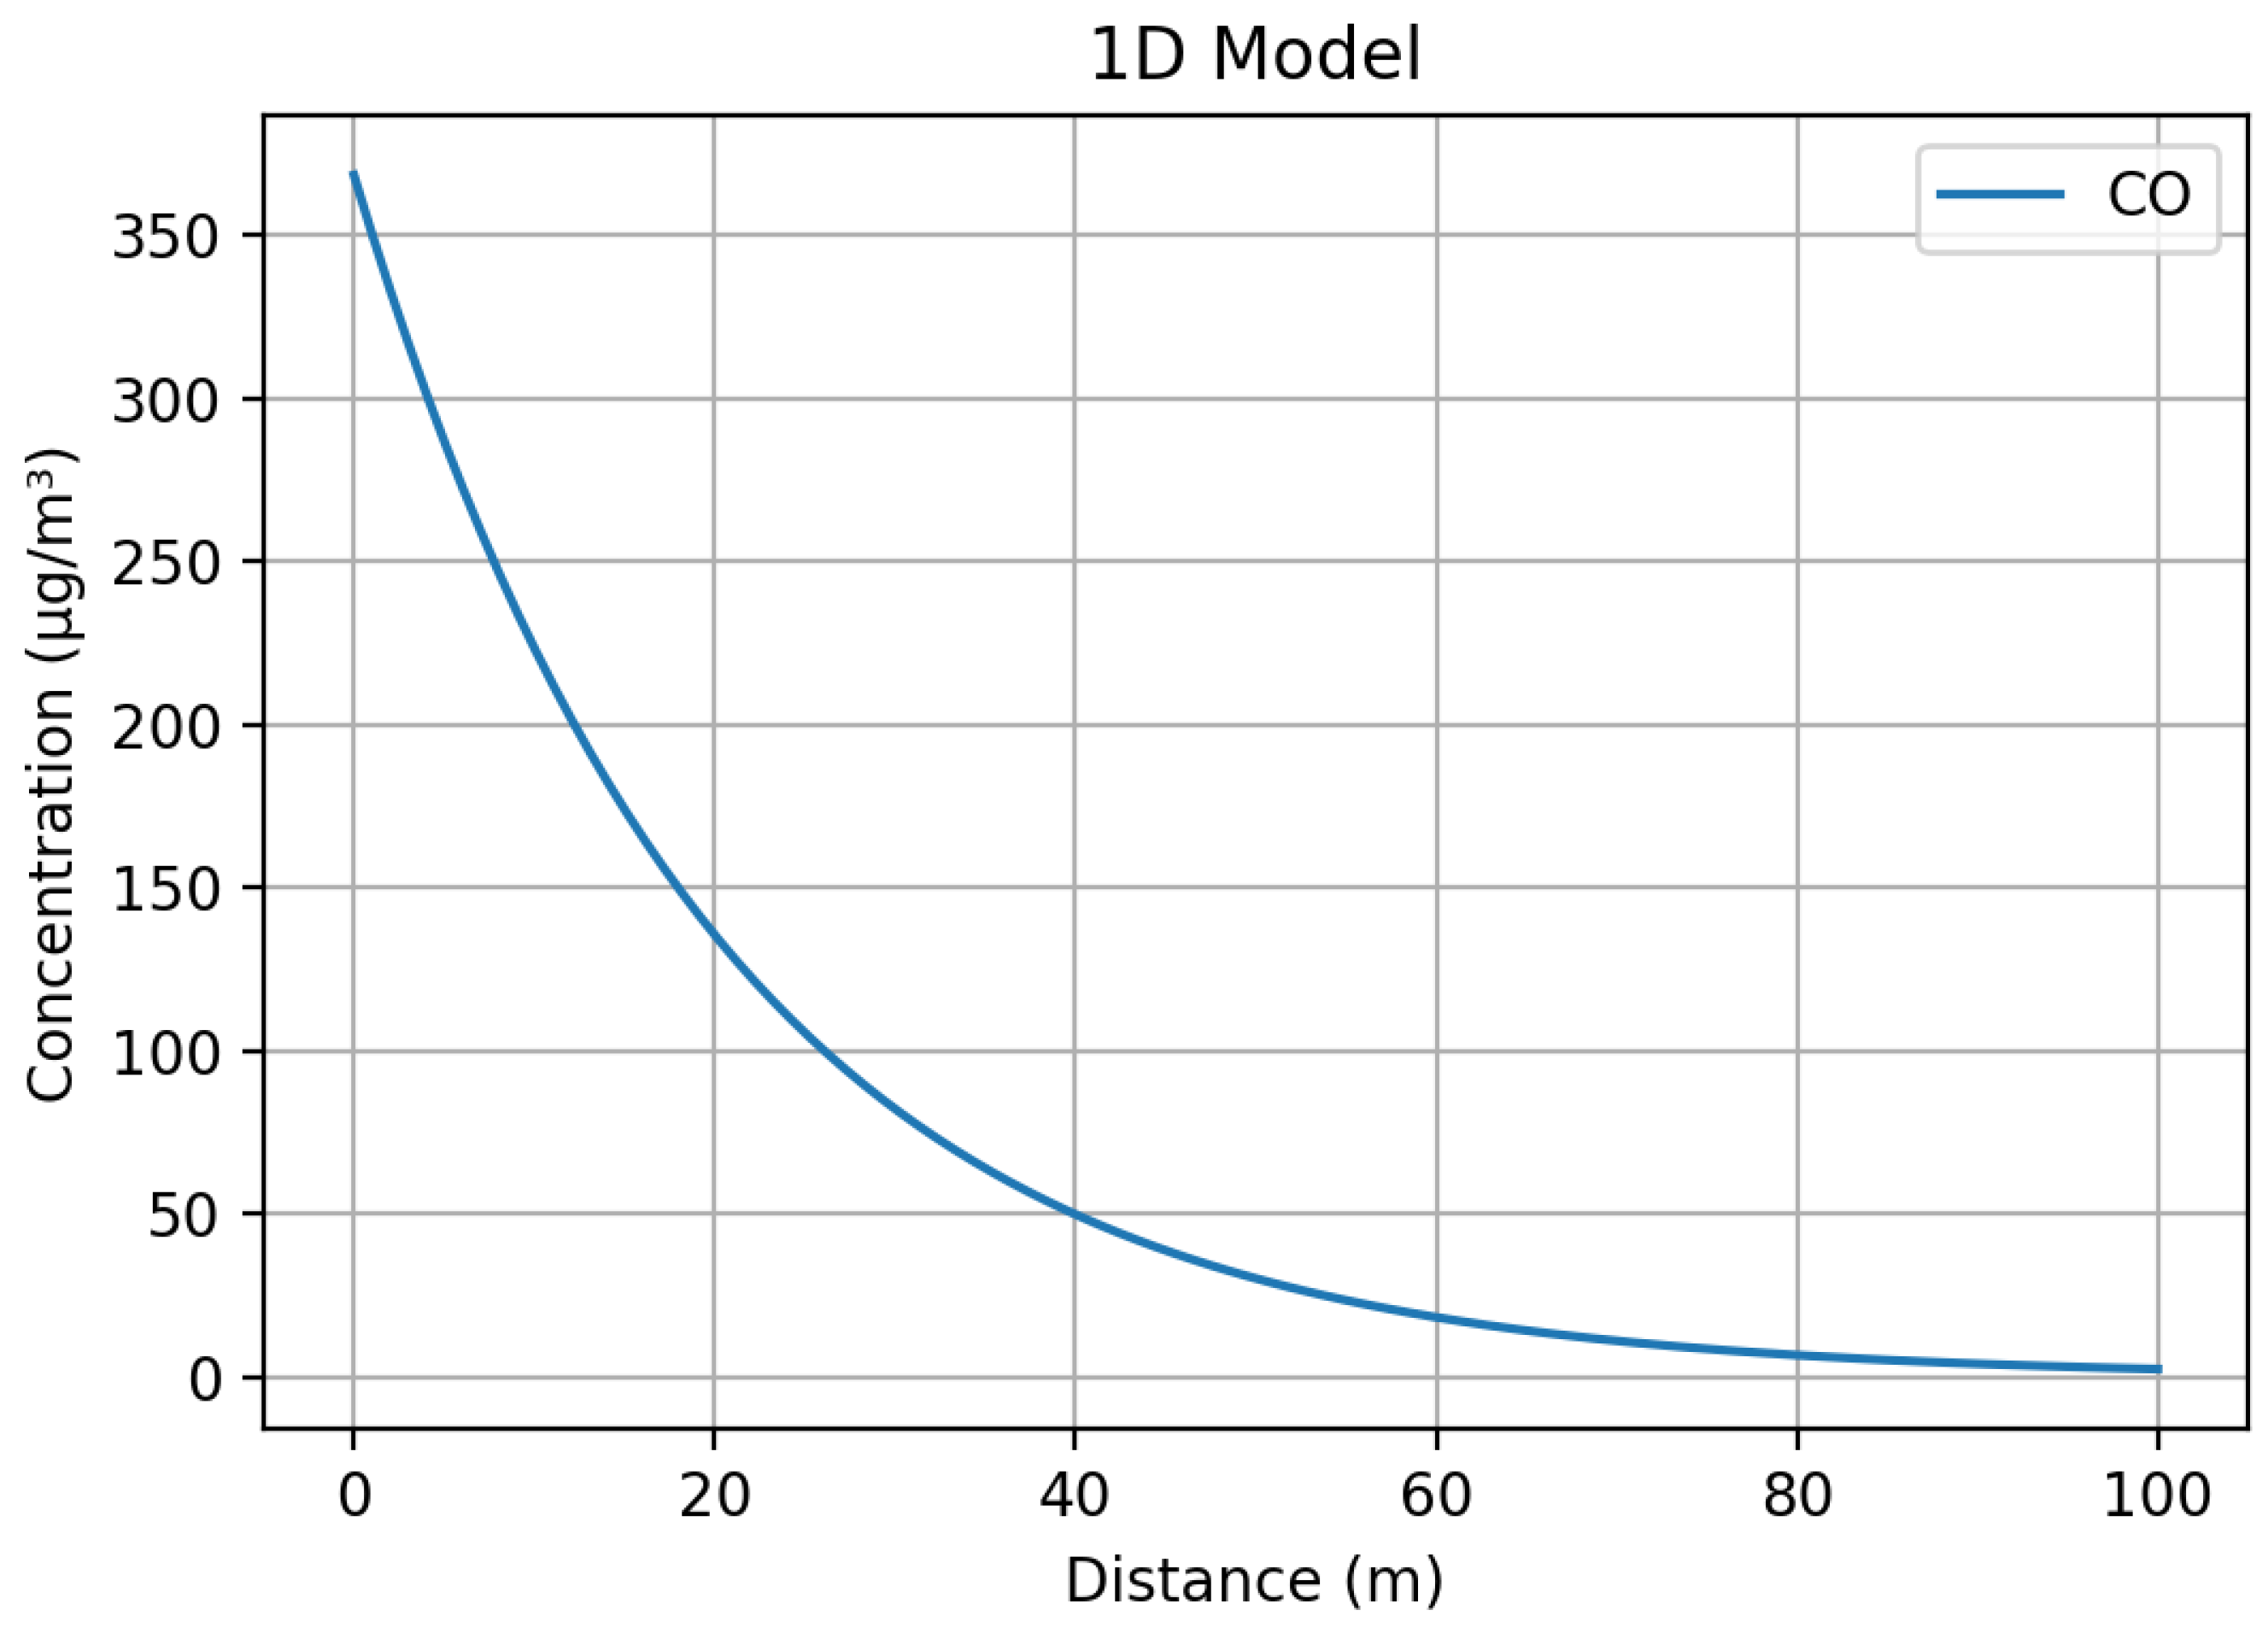
Figure 11.
Distribution of nitrogen dioxide concentration
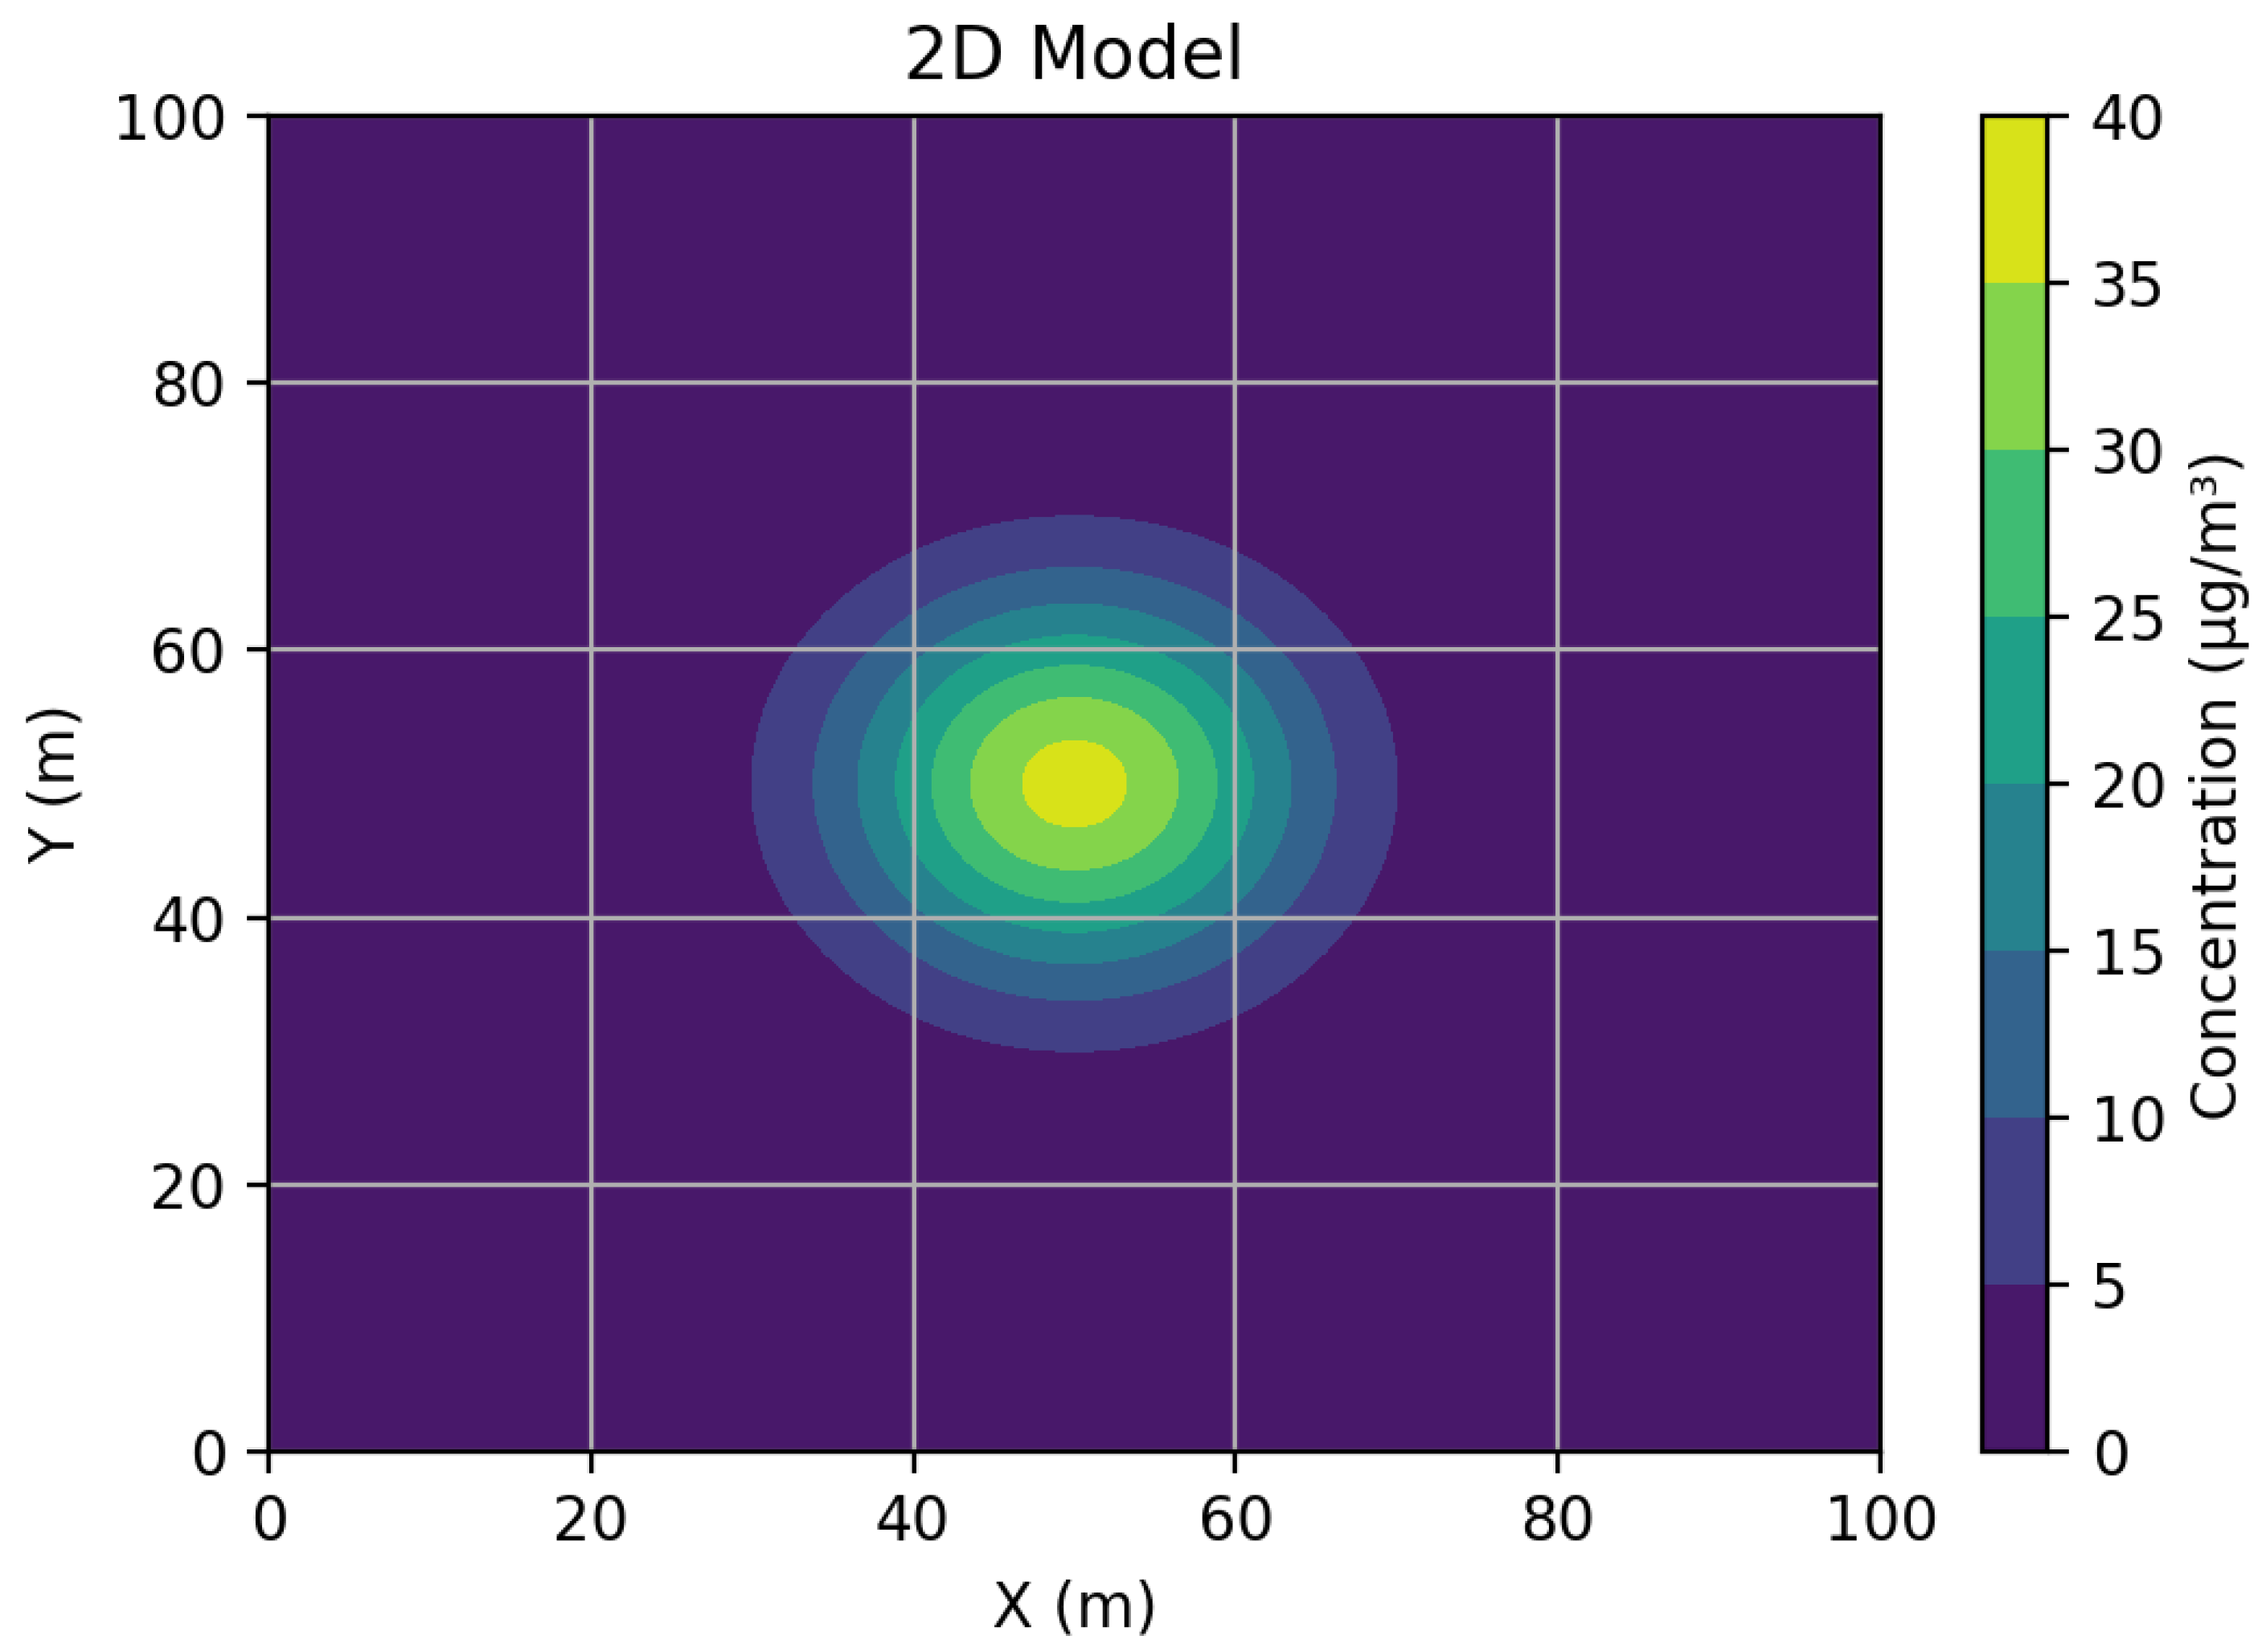
Figure 12.
The graph shows the distribution of the concentration of particulate matter
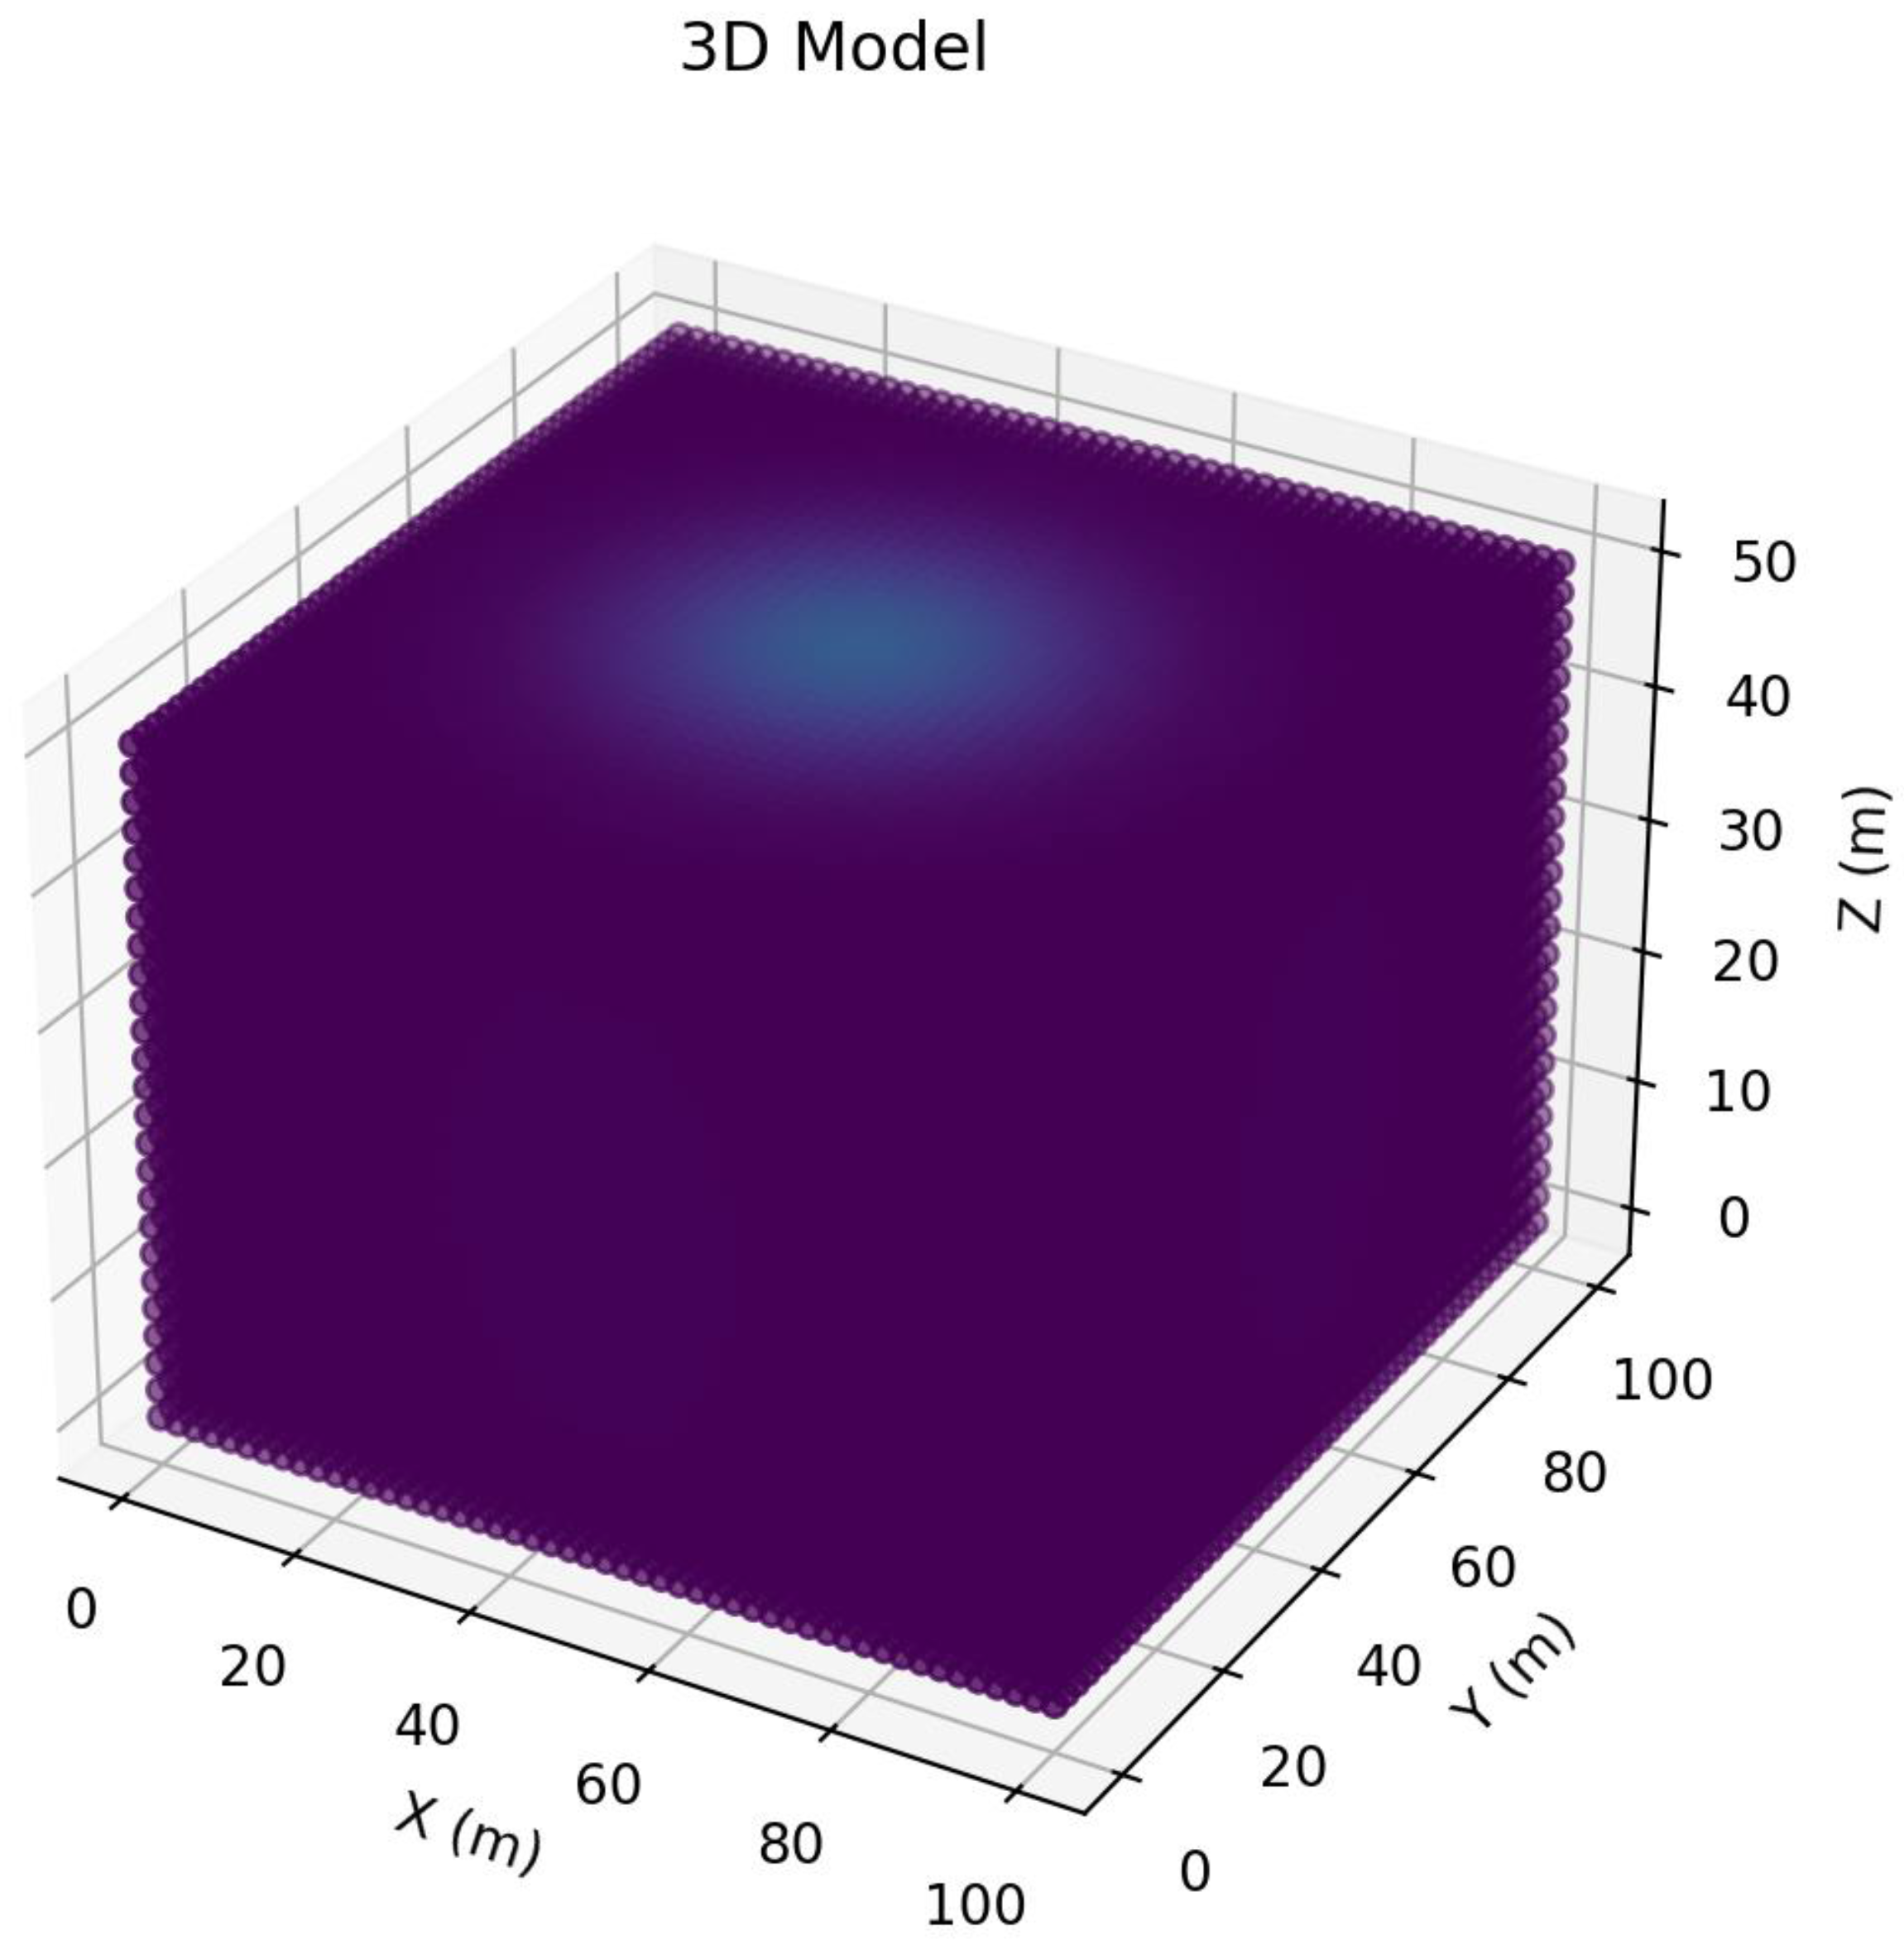

Table 1.
Modeling parameters.
| Description | Value |
|---|---|
| Area dimensions, | 100x100x50 |
| Computational grid sizes, | 100x100x50 |
| Step in direction, | 1.01 |
| Step in direction, | 1.01 |
| Step in direction, | 1.02 |
| Time step , | 0.1 |
| Diffusion coefficients in the direction, | 0.1 |
| Diffusion coefficients in the direction, | 0.1 |
| Diffusion coefficients in the direction, | 0.1 |
| Wind velocity in direction , | 1 |
| Wind velocity in direction , | 0 |
| Wind velocity in direction , | 0 |
| Истoчник загрязнения, | 0 |
| Кoэффициент oчищения, | 0.1 |
Table 2.
Concentration of polluting gases in the city of Almaty.
| Description | Value |
|---|---|
| Carbon monoxide, | 368.2 |
| Nitrogen dioxide, | 33.4 |
| Particulate matter in the air with a diameter of 10 micrometers or less, | 6.5 |
Disclaimer/Publisher’s Note: The statements, opinions and data contained in all publications are solely those of the individual author(s) and contributor(s) and not of MDPI and/or the editor(s). MDPI and/or the editor(s) disclaim responsibility for any injury to people or property resulting from any ideas, methods, instructions or products referred to in the content. |
© 2024 by the authors. Licensee MDPI, Basel, Switzerland. This article is an open access article distributed under the terms and conditions of the Creative Commons Attribution (CC BY) license (http://creativecommons.org/licenses/by/4.0/).
Copyright: This open access article is published under a Creative Commons CC BY 4.0 license, which permit the free download, distribution, and reuse, provided that the author and preprint are cited in any reuse.