

Submitted:
22 October 2024
Posted:
24 October 2024
You are already at the latest version
Abstract
The growing number of algorithmic decision-making environments, which blend machine and bounded human rationality, strengthen the need for a holistic performance assessment of such systems. Indeed, this combination amplifies the risk of local rationality, necessitating a robust evaluation framework. We propose a novel simulation-based model to quantify algorithmic interventions within organisational contexts, combining causal modelling and data science algorithms. To test our framework's viability, we present a case study based on a bike-share system focusing on inventory balancing through crowdsourced user actions. Utilising New York's Citi Bike service data, we highlight the frequent misalignment between incentives and their necessity. Our model examines the interaction dynamics between user and service provider rule-driven responses and algorithms predicting flow rates. This examination demonstrates why these dynamics are necessary for devising effective incentive policies. The study showcases how sophisticated machine learning models, with the ability to forecast underlying market demands unconstrained by historical supply issues, can cause imbalances that induce user behaviour, potentially spoiling plans without timely interventions. Our approach allows problems to surface during the design phase, potentially avoiding costly deployment errors in the joint performance of human and AI decision-makers.
Keywords:
Machine learning
; system dynamics
; simulation modelling
; algorithmic decision-making
; supply chain planning
; NY Citi Bike
1. Introduction
Despite the rapid advancement of Artificial Intelligence (AI), particularly with generative AI [1], human judgment remains critical in decision-making [2,3].
From a macroeconomic perspective, AI, as a General-Purpose Technology (GPT), requires complementary structures, processes and systems to maximise its value [4,5]. This transition is gradual, particularly for organisations not born digital, which will blend old and new processes for some time [6]. While automation replicates existing rules, an augmentation approach—combining humans and AI—creates opportunities to innovate and extend task boundaries, effectively “growing the pie” by expanding the range of available options [7,8].
From an organisational decision-making perspective, AI’s handling of tasks involving tacit knowledge is often unreliable due to the variability in such tasks [9,10,11]. Effective AI integration requires a shift from ‘point solutions’ to a system-level approach that considers interdependencies within the organisation [6]. This transition from narrow ‘digitisation’ to a holistic, problem-led ‘digital’ view acknowledges the contextual richness of organisational decision-making, recognising the limitations of reducing complex problems to a few variables [12,13,14]. As Gigerenzer points out, simplifications are inadequate in a world that lacks stability, necessitating a systemic approach that accounts for both uncertainty and the complexity of real-world contexts [15].
Technologically, the limitations of Large Language Models (LLMs) and the biases inherent in machine learning highlight that data and models are not entirely objective [16,17,18]. Machine learning models inevitably reflect the biases of their designers, refuting claims of “theory-free” AI [19,20].
These mutually reinforcing perspectives establish human-AI collaboration as the default for complex problem-solving. Research shows that coordination dynamics, already complex with traditional technologies and likened to navigating a rugged landscape, become even more intricate with the introduction of machine learning [21,22,23].
In light of the need for collaborative decision-making between humans and AI, the challenge is to make the dynamics of joint decisions transparent. Our proposed framework addresses this by integrating deep learning as the centrepiece of the algorithmic component, complemented by human judgment, within a simulation workbench designed to evaluate and refine decision policies. To demonstrate the framework’s application, we applied it to inventory balancing in docked bike-sharing systems, which often experience spatial and temporal inventory asymmetries, where stations with similar initial stocks diverge over time. A widely used eco-friendly approach incentivises users to rent or return bikes at stations facing inventory imbalances. Our framework tackles this challenge by integrating heuristic and data-driven methods, enabling a comprehensive assessment of their performance across different experimental conditions.
From a systems perspective, organisations with hierarchical structures, interacting parts, beliefs, rules, and goals can be viewed as complex systems. System dynamics, which focuses on dynamic complexity arising from interactions over time rather than the number of components, offers a viable method for understanding organisational behaviour [24,25].
Traditionally, policy modelling in such systems has relied on judgmental heuristics, which assume that system behaviour emerges from simple rules and component interactions [26]. The introduction of PySD in 2015 [27], which incorporates Python’s data science libraries into system dynamics models, creates opportunities to combine these heuristics with more sophisticated methods like deep learning. Since one of the core principles of a complex system is its hierarchical structure—what Simon calls “boxes-within-boxes” [28]—characterised by more interactions within subsystems and fewer between them, we might model organisational behaviour as a mix of relatively closed algorithmic subsystems and more open rule-based ones cohabiting, using PySD.
A key advantage of system dynamics modelling is its promotion of double-loop learning [30], where real-world feedback continuously informs and shapes mental models. As shown in Figure 1, modern organisations blend rule-based and AI-driven models, mirroring the heuristic-data science approach used in our bike-sharing study. However, despite integrating human judgment and algorithmic decision-making, organisations often fail to comprehensively evaluate the overall performance of joint decision-making, meaning double-loop learning is not always achieved. This gap highlights the proposed model’s novelty, facilitating a more comprehensive evaluation of human-AI collaboration.
2. Modelling Framework
Our primary deliverable is a quantitative model designed to bridge the gap between recognising the need for ML in decision-making and its implementation. Since our model focuses on the technical aspects of the modelling process, we leave the articulation of the problem and hypothesis generation to the conceptual phase, providing only a brief overview. Our work lies in the evaluation phase, following conceptualisation and preceding implementation. At this stage, we assume the focal firm has identified the decision context where they would like to use ML—call it the intervention—where a business problem or opportunity prompts a re-evaluation of decision policies, leading to an initial concept combining ML and human judgment and has considered role separation.
As a first step in the evaluation phase, Causal Mapping produces causal diagrams to represent current and future decision-making states, abstracting from operational details to establish system boundaries and identify key feedback structures. Simulation and ML models step uses tools like Vensim, PySD, and ML methods (e.g., Recurrent Neural Network (RNN)) to elaborate on these causal maps and develop models to integrate ML and heuristic methods. Partial model testing verifies the local rationality of subsystems, ensuring alignment with process-level objectives before full integration. Finally, Integration and policy analysis assesses the global rationality of the intervention by testing system-wide outcomes against organisational goals, identifying potential misalignments, and exploring adaptations. In the implementation phase, the simulation model we develop in the evaluation phase serves as a low-risk tool for evaluating the intervention’s effectiveness, supporting the organisation in deciding whether to proceed with or adapt its human-AI strategy.
3. The Bike-Share Problem
3.1. Business Context
The business context involves a docked bike-sharing system, modelled on New York’s Citi Bike [31], where customers rent and return bikes at docking stations. Unlike the more flexible dockless model, which allows rentals and returns anywhere [32], docked systems often face outages due to inventory imbalances despite sufficient overall bike availability [33].
Outages occur when bikes are unavailable, or docking slots are full, reducing rentals due to limited returns and causing future stockouts. Providers can address this through strategies, including a) overnight inventory balancing, b) monitoring and rebalancing during the day, and c) incentivising users to help with rebalancing. Option (c) is particularly attractive as a primary tool because it crowdsources the problem to users (like Citi Bike’s Bike Angels program, which rewards users with redeemable “angel points” [34]) and has green credentials.
However, its success depends on:
- Accurate estimation of incentives’ impact on bike flow rates.
- Coordination with the provider’s rebalancing efforts.
- Forecasting rental and return demand to time incentives effectively. Success depends on the provider’s ability to anticipate shortages and determine what can be resolved through incentives before resorting to other measures, such as rebalancing with the provider’s own fleet (e.g., bike trains).
3.2. Evidence of Problem at Citi Bike
We analyse hourly bike utilisation at seven stations within a chosen demand cluster (selection criteria discussed in Subsection 3.3) over a typical week, with high utilisation defined as 85% (e.g., a station with 40 bikes would have an average of six available per hour). Several instances show more than one station at risk of outages simultaneously, highlighting significant opportunities for inventory balancing through crowdsourcing among nearby stations to reduce stockouts.
However, examining the crowdsourcing strategy reveals poor incentive timing (further details on the sampling strategy are provided in the Data section). For example, at station E 20 St & Park Ave (which ranked second in incentives offered during the analysis period August 2023), we relax the assumption about high utilisation further and assume that an incentive offered above 70% could be reasonable and further suppose that a failure to initiate incentives above 85% is a missed opportunity, and incentives when utilisation is below 70% are excessive. Figure 2 illustrates this scenario, highlighting incorrectly timed incentives in red and correctly timed ones in green, showing a clear pattern of more ill-timed than valid incentives. Given the evidence supporting crowdsourcing’s effectiveness, it is reasonable to hypothesise that better timing could have prevented some stockouts.
3.3. Data
Forecasting user demand for rentals and returns is the first step in allocating bike inventories to stations and anticipating balancing needs. We base our forecasts on Citi Bike’s monthly trip histories published online (https://ride.citibikenyc.com/system-data).
3.3.1. Justification for Focusing on a Subset of Bike Stations for the Model
The Bike Angels program incentivises users to balance inventory by offering redeemable ride points. Incentives for users to rebalance inventory are inherently local, as they redirect returns from overflowing stations to those in need, adjusting flows between nearby stations without significantly altering overall demand. Given the asymmetries in stockout patterns between nearby stations, modelling a carefully selected cluster of proximate stations is justified to test causal hypotheses.
We selected stations based on the following criteria:
- (a)
- Availability of incentive data to correlate with demand, allowing analysis of its historical effectiveness using a causal inference model, which estimates the impact of incentives on user demand and adjusts demand accordingly.
- (b)
- At least one station in the cluster should rank high in demand or ride counts to ensure the analysis focuses on a high-impact cluster.
- (c)
- Stations should be within walking distance, allowing users to switch between stations easily, thus balancing inventory through guided incentives to “give” at one station and “take” at another to improve overall balance.
For a time, station incentive data was accessible via an API (https://layer.bicyclesharing.net/map/v1/nyc/stations), but this ceased after August 25, 2023. Since this data is critical for analysis (criterion a), we focused on August 2023, the latest month with available data. To meet criteria b and c, we visualised station locations on a map, using circle sizes to represent ride counts. E 17 St & Broadway, ranked fifth out of 400 stations, was chosen as the nodal station, with the additional requirement to have several nearby stations (see Figure 3 -- Tableau background map sourced from Mapbox). We then selected stations within a 350-metre radius to form our demand cluster.
3.4. Evaluation - Causal Mapping
From the August 2023 data (Figure 2), we observe that when a station’s bike inventory is low (blocking rentals) or high (blocking returns), incentives are often either absent or incorrectly applied, indicating a flaw in the logic behind triggering incentives. In other words, since we have evidence that crowdsourcing as a policy is effective, we can conclude that improving the inventory balancing policy would reduce out-of-stock events (or no-service events).
Given that the scope is inventory balancing, Figure 4 illustrates the hypothesised mental model, mapping the causal relationships between relevant variables, with an initial focus on a single bike station for clarity. This general framework applies to bike-sharing systems beyond Citi Bike.
The Return and Rental rates represent the inflows and outflows of the Bike stock, with base rates reflecting demand influenced by weather or other contextual factors.
The difference between inflows and outflows, or the net inflow, integrates into the Bike stock. Specifically (note that represents any point in time between and ):
As bike stock increases, Dock utilisation (Bike saturation) at the station increases, assuming all else remains equal. This positive relationship (indicated by the plus sign on the arrow) reduces the station’s attractiveness for returns (User perception of return attractiveness shown with negative polarity), causing users to avoid full stations and creating some baulking. The balancing loop “B1” resists this change, feeding back to stabilise the system.
A similar dynamic occurs in the balancing loop “B2”. As the Bike utilisation or Dock saturation (number of free docks) increases, the attractiveness for rentals (User perception of rental attractiveness) decreases, reducing the rental rate and inducing stronger baulking at near-empty stations. The Simulation and ML Models section will provide mathematical precision to these qualitative statements.
The outer loops “B3” and “B4” are more consequential to overall system behaviour. The Perceived bike availability, a smoothed composite of Forecasted bike availability and real-time Bike utilisation, influences the provider’s perception of risk. Delays in incorporating real-time data may, however, occur, either due to system limitations or a deliberate “wait and see” approach (indicated by dashed arrows) where the provider does not want to react too soon to fluctuations (thus, “smoothing”) [35]. As the perceived bike availability decreases, the Perceived risk of bike outage increases, which raises the pressure to incentivise returns (User incentives for returns). These incentives boost the return rate, increasing bike stock as intended. A similar dynamic plays out in the case of dock outage risk (Perceived risk of dock outage) that triggers more rentals (User incentives for rentals). It is assumed, both here and in the forthcoming equation formulation, that incentives reroute demand between stations rather than increase overall demand. When coordinated effectively, especially between nearby stations with asymmetric demand, crowdsourced inventory balancing through incentives reduces imbalances across the system.
In this simplified example, we observe multiple feedback loops with varying strengths, delays, and non-linear relationships (e.g., the effect of bike availability on the provider’s risk perception and user perception), making a closed-form solution unfeasible.
Based on the causal representation of the inventory imbalance problem, we might hypothesise about the potential root causes (see numbered flags in Figure 4). These are:
The baulking behaviour reduces recorded demand, effectively censoring flows (1). When used for forecasting, this results in a pessimistic outlook on future demand (2). In other words, historical issues hinder the ability to predict future demand accurately, worsening the situation over time. Additionally, inefficiencies in incorporating real-time availability or overemphasising it (where demand outliers or temporary fluctuations heavily influence decisions) (3) affect the provider’s perception of stock levels. Lastly, the rules for triggering incentives, based on perceived and desired bike availability (4), impact their effectiveness.
The causal map’s feedback-oriented view helps explain the dynamic behaviour behind inventory imbalance (the current state). Having identified the leverage points, we might further hypothesise a mental model that addresses the problem—the envisaged future state. Our proposed mental model likely involves a mix of human judgment and ML. For addressing bike-share inventory imbalance, several factors need to be considered: initiating incentives cannot be fully algorithmic due to budget constraints and other balancing methods; user response to station saturation is non-linear; it is better to base outage risk on patterns of actual and projected bike availability, rather than reacting to temporary demand fluctuations; and policy robustness is preferable over chasing “optimal” incentive schemes.
3.5. Evaluation - Simulation and ML Models
Causal mapping established perceived bike availability, a synthesis of real-time and forecasted data, as the bike-share provider’s key information source to assess outage risk and adjust incentive actions. Incorporating flow rate predictions helps smooth the impact of real-time fluctuations on outage risk perception. The data science component of the organisational mental model also includes predictions of how incentives will impact bike-share demand, specifically the expected increase in returns and rentals from crowdsourced inventory balancing. The accuracy of these predictions directly influences projected bike stock and future incentive decisions.
Figure 5 illustrates how these information flows—expected demand and response to incentives—impact material flows and system performance.
A standard metric for evaluating performance is the service level, which in the bike-share context can be defined as:
In our case, improving prediction accuracy reduces no-service events, enhancing service levels. Bike-share demand, both rentals and returns (Base Demand), is driven by market demand, influenced by bike availability for rentals and dock availability for returns. Realised demand serves as the basis for Demand Forecasting. Through data cleansing (de-censoring), realised demand is adjusted to remove distortions from stockouts and outliers, producing a version closer to true market demand (Inferred Base Demand). The Demand Forecasting process then generates a forecast (Expected Demand), incorporating factors like weather forecasts that correlate with customer demand.
The Inventory Management process defines the provider’s policies for ensuring adequate stock at individual stations (disaggregation of bike inventory) to meet expected demand. It also monitors real-time availability and triggers balancing actions or customer incentives to prevent stockouts. The process relies on expected demand and incentive impact predictions (Expected Response to Incentives) based on causal inference from historical incentive effects (Inferred Incentivised Demand from underlying Incentivised Demand).
We now discuss the ML forecasting process and causal inference that form the backbone of the algorithmic content in the mental model.
3.5.1. Demand Forecasting
Demand de-censoring
A crucial step in preparing the historical rental and return data for forecasting is removing outliers or de-censoring demands. Outlier correction aims to eliminate the impact of extraordinary circumstances [37], providing a solid base for forecasting [38]. Unusual events disrupt the stationarity assumption, which is essential for reliable forecasting, as it assumes historical patterns can be extrapolated to predict future demand. Outlier correction seeks to minimise these disruptions.
For bike-share data, we detect and correct two types of outliers. The first occurs when the provider cannot meet rental or return demand due to insufficient bike or dock inventory, censoring legitimate demand and incorrectly assuming the supply issue will continue. The second type arises from inventory balancing actions, such as bulk returns or rentals, which deviate demands significantly from the average. Below, we outline the data preprocessing and cleansing steps used to create an outlier-corrected rentals and returns file.
Data preprocessing. Citi Bike’s trip data contains transactional information used to determine bike-share rental and return demand. The key fields are location details and ride start and end times.
We used Tableau Prep Builder (https://help.tableau.com/current/prep/en-us/prep_about.htm) to transform the source data into the desired format for demand forecasting. We applied a filter to the station fields (start or end) to focus the data on the nine stations selected for the case study’s demand cluster. We split each day into ten-minute intervals and assigned ride start and end times to their respective slots. This aggregation reduces granularity, minimises demand variability, and improves forecast accuracy. Based on a preliminary analysis showing an average trip duration of 11 to 13 minutes, we selected ten-minute intervals to ensure we capture short trips to and from the same station. We then split rentals and returns into two streams for individual forecasting.
For the incentives data from Citi Bike’s Bike Angel program, we developed a Python script to run every ten minutes and pull real-time data. Using the fields “name,” “last_reported,” and “bike_angels_action,” we determined the timing of incentives at the selected stations. Figure 6 illustrates the data pipeline, from demand and incentive data to the two critical prediction types for inventory management.
With the Raw Demands and Incentives Data in place, we split the demands into Incentivised Demands and Un-incentivised Demands (or Base Demands).
Un-incentivised or Base Demands. If a demand period at a ten-minute time slot for individual stations has no incentive, the base demand equals the raw demand. If an incentive is applied, the base demand is the average demand for that timeslot at the station and filtered for periods without incentives during that month.
Incentivised Demands. If a demand period is under incentive, the incentivised demand equals the raw demand. Otherwise, it equals the average demand for that timeslot at the station/month, filtered for periods with incentives.
Outlier correction. A demand is considered an outlier if it exceeds the Upper Threshold Limit (UTL) or falls below the Lower Threshold Limit (LTL). For Base Demands, outliers are those below the 10th percentile or above the 95th percentile. For Promoted Demands, the LTL is the 25th percentile, and the UTL is the 99th percentile. Any detected outliers are corrected to the average value for the same timeslot and station, excluding outliers from the calculation.
Machine learning forecast
Given that various contextual factors—such as temporal patterns, weather, local events, and urban dynamics—affect bike-share demand, predicting it is a complex function of these inputs, making machine learning approaches like RNN ideal.
A crucial design decision in the RNN architecture is determining the type of inputs passed to the Dense output layer. The last recurrent layer can either return sequences, passing outputs across all timesteps or return only the final timestep’s output as a vector [39]. As we will explore later, this proved a significant leverage point for improving forecast accuracy in the bike-share case study.
Implementation details. The outlier-corrected base demands for rentals and returns served as the primary inputs for training the RNN on the bike-share data. We also downloaded historical weather data for August 2023 from OpenWeather (https://openweather.co.uk/about) using location details around the nodal station (E17 St & Broadway).
Besides weather, we also experimented with other correlates such as lagged demands (supplying demands with an n-period lag as additional features in the current timestep), demands of nearby stations with symmetric demands and temporal signals. Table A1 in the Appendix A details the data inputs, model architecture, parameters, and features we tested and used for the final evaluation.
Weather data had a marginal impact on forecast accuracy, likely due to training on a single month’s data. Similarly, nearby station demands and lagged demands showed no significant contribution. After several trials, we settled on using temporal signals and rental demands (to forecast returns and vice versa) as key features. By applying sine and cosine transformations on the time of day and day of the week, we created six features per prediction type (rental or return).
Traditional RNNs suffer from memory loss over long sequences due to repeated transformations, which leads to information degradation ([40], pp. 297—300). Given the granular nature of bike-share data (144 periods per day), we used Long Short-Term Memory (LSTM), a type of RNN, for the model architecture, which mitigates this by carrying information across timesteps. Acting like a “conveyor belt” ([40], pp. 297—300) that selectively retains or discards memory, LSTM improves accuracy by focusing on relevant data. Another key improvement came from training the network on every timestep (sequence-to-sequence) rather than only the final timestep.
A sequence-to-vector approach would output a tensor shaped as . In a sequence-to-sequence setup, in contrast, each timestep generates a tensor shaped as . This structure enhances performance, as omitting sequences can reduce accuracy by 40%. With predictions and losses at each timestep, more error gradients flow back, and shorter gradient travel distances (via Backpropagation Through Time) reduce information loss, further improving performance.

Table 1.
Comparison of Model Performance for Bike-Share Rentals.
| Station | MSE | LSTM Improvement (%) | |||
| Naïve | EXS | LSTM | vs Naïve | vs EXS | |
| Broadway & E 19 St | 1.00 | 1.02 | 0.79 | 21 | 22 |
| Broadway & E 21 St | 1.50 | 1.50 | 1.15 | 23 | 24 |
| E 16 St & 5 Ave | 1.02 | 1.05 | 0.75 | 27 | 29 |
| E 16 St & Irving Pl | 1.44 | 1.42 | 1.13 | 22 | 20 |
| E 17 St & Broadway | 1.54 | 1.54 | 1.08 | 30 | 30 |
| E 20 St & Park Ave | 1.04 | 1.03 | 0.74 | 29 | 28 |
| W 20 St & 5 Ave | 1.30 | 1.29 | 0.95 | 27 | 26 |
Table 2.
Comparison of Model Performance for Bike-Share Returns.
| Station | MSE | LSTM Improvement (%) | |||
| Naïve | EXS | LSTM | vs Naïve | vs EXS | |
| Broadway & E 19 St | 1.39 | 1.47 | 1.01 | 28 | 31 |
| Broadway & E 21 St | 1.32 | 1.34 | 1.08 | 18 | 19 |
| E 16 St & 5 Ave | 1.24 | 1.24 | 1.02 | 18 | 18 |
| E 16 St & Irving Pl | 1.07 | 1.09 | 0.76 | 29 | 30 |
| E 17 St & Broadway | 2.24 | 2.26 | 1.70 | 24 | 25 |
| E 20 St & Park Ave | 0.94 | 0.94 | 0.74 | 22 | 22 |
| W 20 St & 5 Ave | 1.16 | 1.16 | 0.82 | 30 | 29 |
Note: (i) MSE = Mean Squared Error; EXS = Exponential Smoothing; LSTM = Long Short-Term Memory. Improvement percentages are calculated as (Alternative - LSTM) / Alternative * 100%. Positive values in the Improvement columns indicate superior LSTM performance. (ii) Why are there only seven stations in the evaluation table? An exploratory analysis of the source data revealed that two of the nine stations initially identified in the cluster were missing data for several days in the August trip data file. Therefore, we decided to proceed with the seven remaining stations.
3.5.2. Causal Inference
We apply a causal inference model proposed by Brodersen et al. using a Bayesian framework [41] to infer the impact of incentives on rental and return flows.
The model predicts the impact of an intervention (e.g., bike angel incentives) on the response metric (e.g., demand uplift) by regressing its pre-intervention time series on covariates unaffected by the intervention. It then generates a counterfactual response for the post-intervention period based on these “untreated” covariates. The impact is the difference between the observed and predicted counterfactual values.
To identify suitable contemporaneous correlates, we first compute similarity scores for station pairs in the demand cluster using the bike utilisation metric (as outlined below). For each station, we then select the time series of one or more of the closest stations.
Stage 1: Clustering by Demand Symmetry
Data: Hourly bike utilisation for each station.
Bike utilisation = Dock availability / Capacity (percentage of bikes rented)
Steps:
-
Load and preprocess the data:
- ○
- Pivot the dataset to create a 24-hour utilisation vector for each station and day.
- Normalise the utilisation vectors for each station using MinMax scaling.
-
For each pair of stations (21 pairs for 7 stations):
- ○
- Extract the 24-hour utilisation vectors for corresponding days for both stations.
- ○
- Calculate the L2 distance between the normalised vectors for each day.
- ○
- Compute the average L2 distance across all days as the final similarity metric for the station pair.
- Store the average L2 distances for all station pairs in a table, sorted by similarity (lowest to highest distance).
A typical week for the two stations identified as most similar by normalised bike utilisation during the analysis period is shown in Figure 8 below.
In the second stage, we use the causal impact model to estimate the effects of incentives. The demand censoring step provides two continuous time streams for the unincentivised and incentivised demands. For the target station, we pass the incentivised demands for the post-intervention period to the model to infer what would have happened without the intervention. The inputs include the unincentivised demands from correlates, which are stations with similar demand patterns (identified in stage one).
Stage 2: Causal Impact Model for Estimating Incentive Effects
Data: Base (unincentivised) and incentivised rental/return demands for each station.
Steps:
-
Prepare the Data:
- ○
- Filter and rename the columns to distinguish between base and incentivised demands (e.g., “Rentals Normal” for base demands, “Rentals Uplift” for incentivised).
- ○
- Pivot the data to create a time series of rentals and returns for each station, with pre-intervention values using base demand and post-intervention values using incentivised demand.
- ○
- Define the pre and post-intervention periods based on the intervention days.
-
Run the Causal Impact Model:
- ○
- Use the base demands from correlated stations (identified in Stage 1) as covariates and the incentivised demand for the target station as the response series.
- ○
- The model infers the base demand for the target station during the post-intervention period (had no incentives been applied).
-
Collate and Average Results:
- ○
- Collect the inferred rental/return uplift (i.e., the difference between the incentivised and predicted base demand) for the target station across all intervention days.
- ○
- Average the results to create a typical week, showing hourly estimated percentage uplifts for rentals and returns.
The charts in Figure 9 compare the (counterfactual or inferred) base and incentivised rental demands for the test period.
3.5.3. Stocks and Flows Modelling
A common way to summarise systems thinking is by stating that a system’s behaviour stems from its structure. When we unpack “structure,” it consists of stocks, flows, and feedback. However, in our causal mapping of problematic behaviour in the bike-share case and potential interventions, we did not explicitly distinguish between stocks and flows; instead, we focused on the interconnected feedback loops to offer plausible explanations. While identifying key variables and their relationships suffices to hypothesise behaviour patterns, precise quantification for simulation requires clearly distinguishing between stocks and flows.
The stocks and flows schematic in Figure 10 illustrates the kind of causal map elaboration needed to advance in the simulation process. It highlights the decision-making role of feedback structures and emphasises the importance of stock and flow variables.
The feedback or decision structures process cues from stock variables across different system sectors to make decisions that alter flow rates, which, in turn, feed back into the stocks. For example, the inflow rate (I1) into stock S1 depends on S1 and stock S4. Endogenous variables (V [1,2,3]), exogenous variables (U1), constants (C1), and time constants (T [1,2,3]) simplify the specification and maintenance of algebraic equations in simulation tools like Vensim. Essentially, net inflows are functions of stocks (with constants acting as slow-changing stocks) and exogenous variables; the intermediaries help break complex formulations into manageable parts.
This formulation provides the precision to quantify the interrelationships and determine the differential equations for net inflows. Once defined, the system’s behaviour over time is simulated by numerically integrating these equations to evolve the stocks.
In the bike-share model, focusing on a single station, the bike stock represents the physical inventory that generates information cues for decision-making, influencing future flows. This stock reflects the real-world availability of bikes. A parallel structure also projects the future stock based on machine learning-predicted return and rental flows. The inventory management policy synthesises these two streams to assess outage risks, accounting for reporting and information delays. A set of rules translates this perception into decisions to incentivise returns or rentals.
A further algorithmic component that plays a crucial role in the feedback is the expected impact of incentives. During scenario simulations where various plausible rental and return flows operate on the real-world stock (our focus in the last two steps of the evaluation phase), the quality of predictions about incentive effectiveness influences our assessment of the effectiveness of policy variables. For example, if the accuracy of the causal impact of crowdsourcing inventory balancing through incentives is poor, the simulated real-world stocks will deviate from reality, skewing our assessment.
If we remove the single-station constraint, additional complexity arises from coordinating incentive actions by leveraging the complementarity between stations or clusters. Specifically, the inventory status of a partner station or cluster with asymmetric demands informs whether to apply incentives. The future-state inventory policy also incorporates a target range for bike availability or station utilisation. The distance between current perceived availability and the upper or lower threshold determines perceived risk, guiding stock levels within these limits. Figure 11 illustrates how these two streams converge to orchestrate feedback loops influencing the system’s stock evolution.
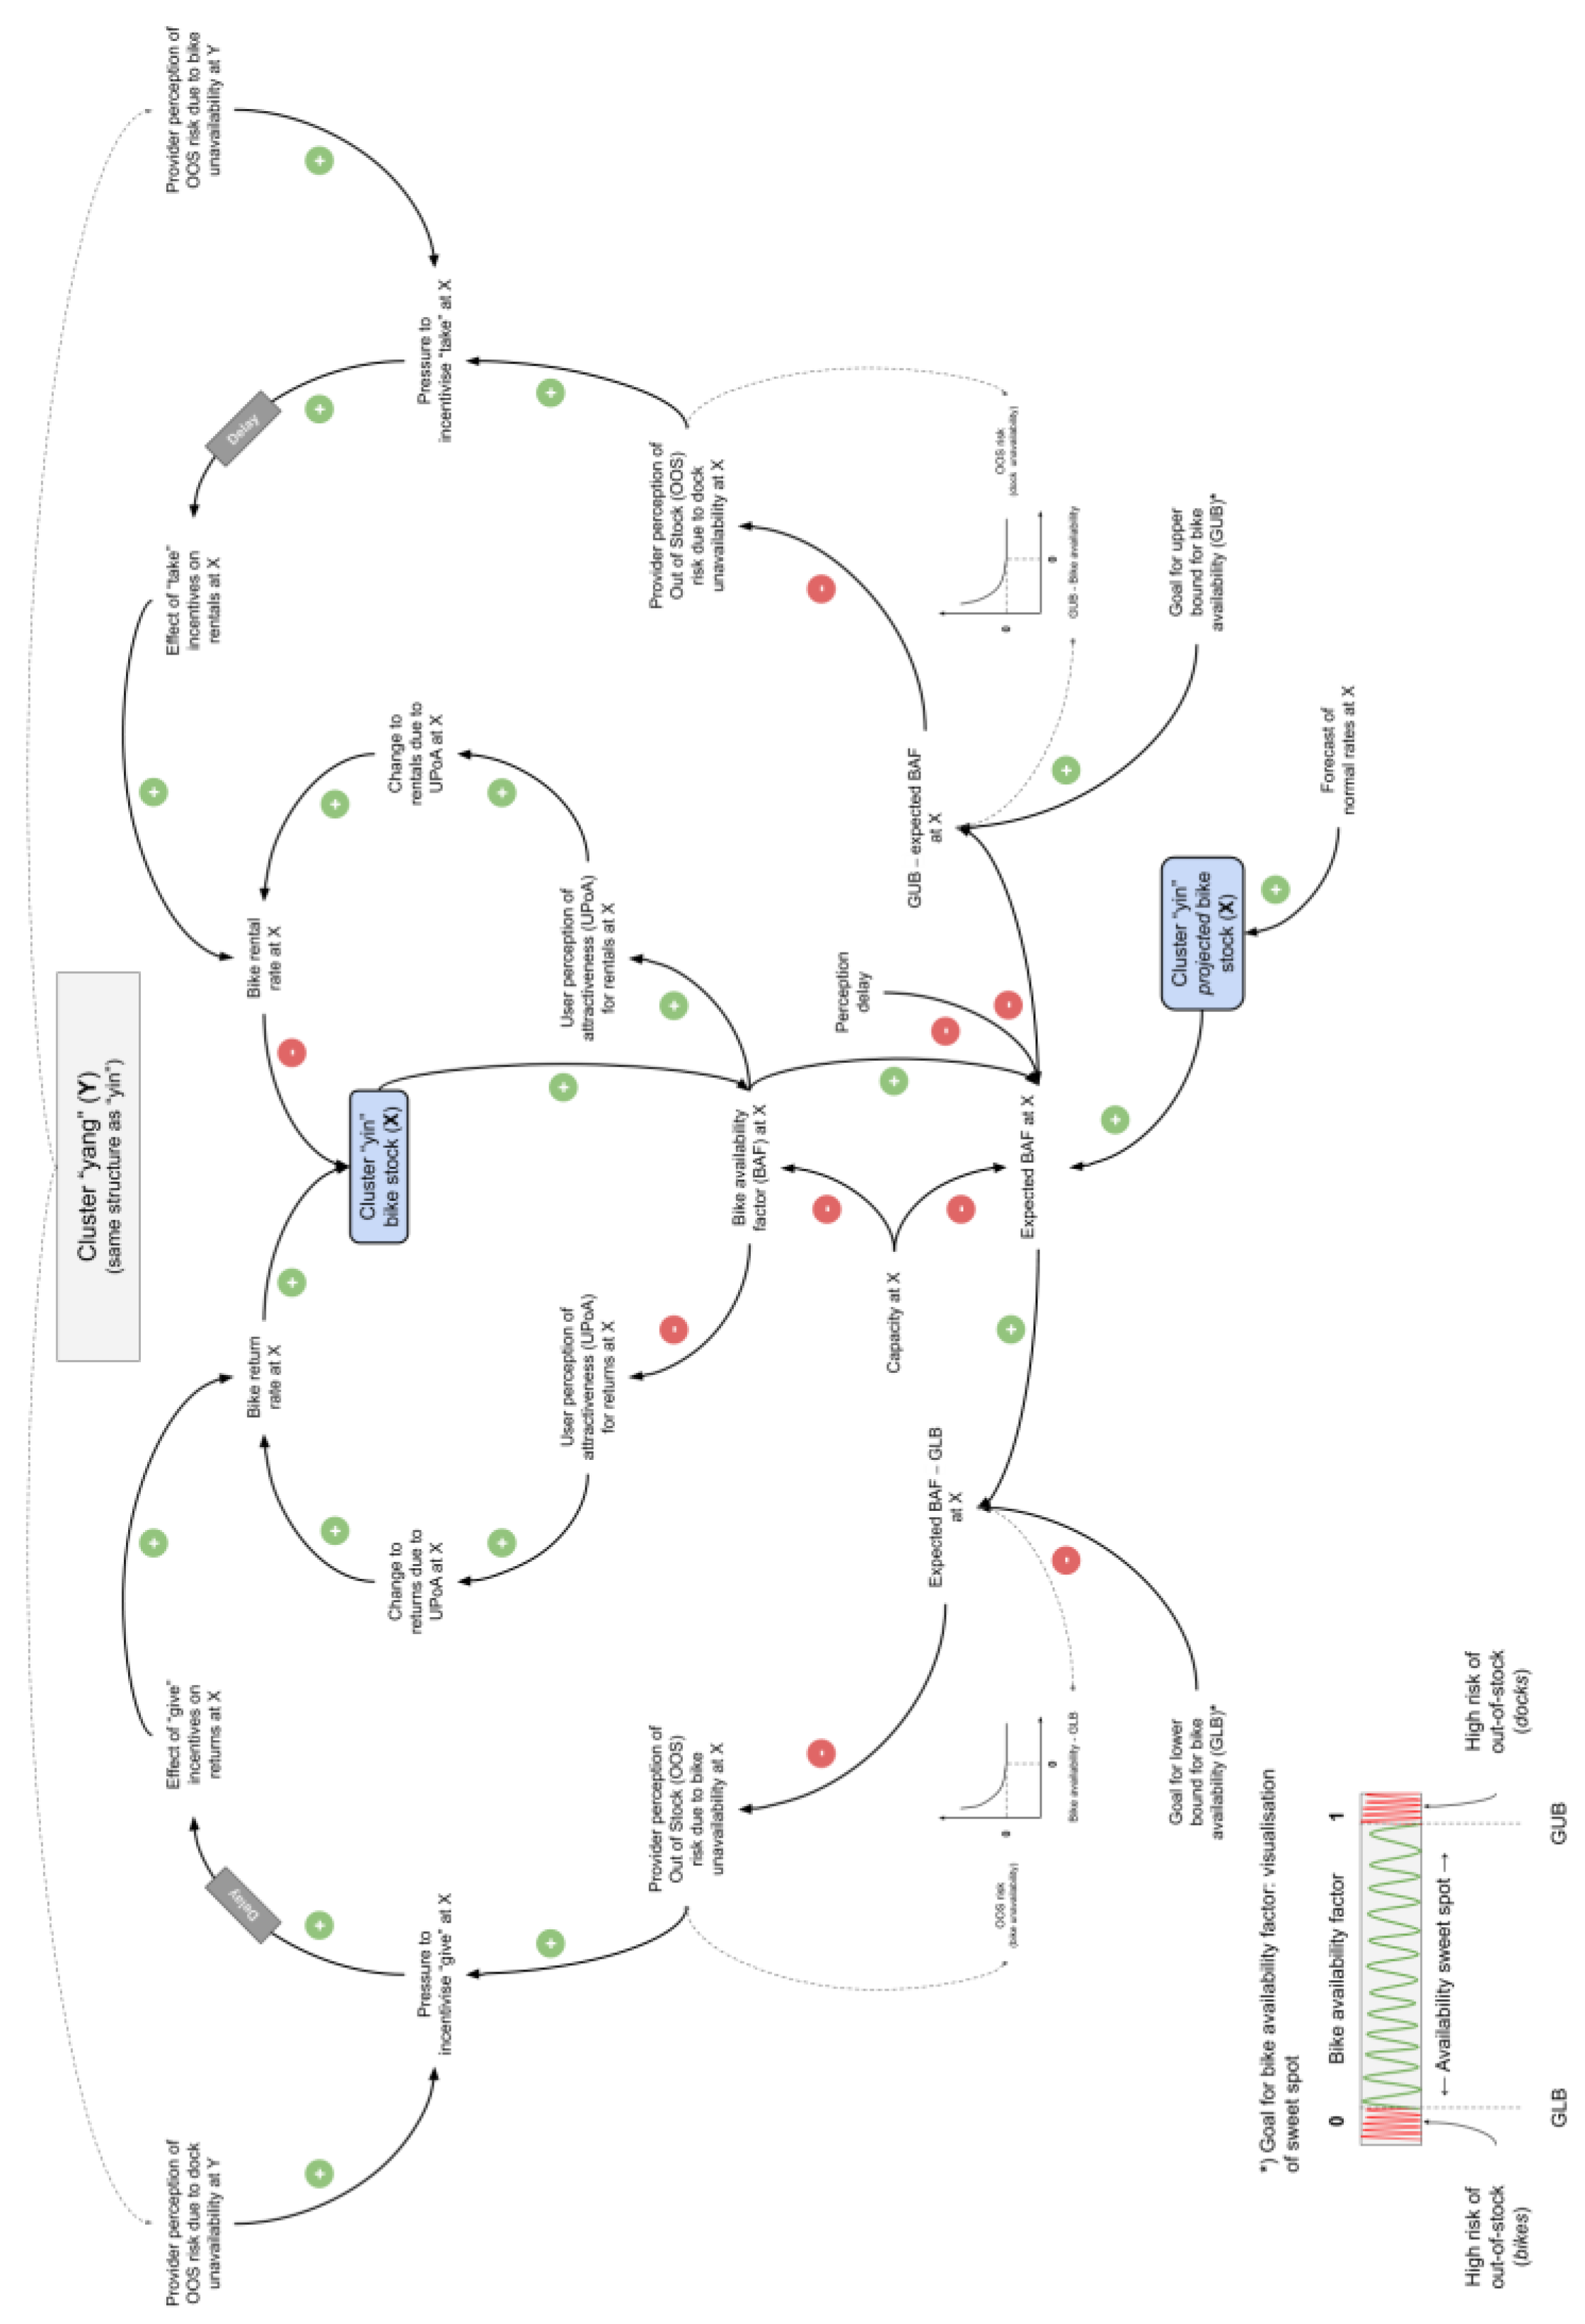
We now review the two main components (in the corresponding stocks and flows formulation), synthesising information cues about the current and anticipated system states. For clarity, in Figure 12, we focus on the returns flow, noting that the dynamics are similar for rental flows. We also limit our review to a single-station model to simplify how the formulation of stocks and flows enables the mathematical representation needed for simulations. (Figure A1 in the Appendix A provides the full structure, and the GitHub repository contains the equations for the two-station/cluster model.)
The first component is the formation of perception about availability, represented by the variable Perceived bike availability factor (PeBAF). This stock variable is shown in the diagram, which zooms in on the stocks, flows, and feedback structure used to simulate the real-time behaviour of the system’s return flows.
Since the decision-maker anchors their perception on forecasted availability, the real-time simulation connects to this critical information through the Projected Bike Availability Factor (PrBAF). To initialise PrBAF before the actual simulation, we run a model using forecasted demand flows (all done programmatically in a Python test workbench). Additionally, as the provider may update projections multiple times daily, a decision parameter controls the refresh frequency, which determines the look-ahead horizon.
Figure 13 shows how, in the look-ahead model, a rolling forecast of returns and rentals updates the projected stock. The process begins by aligning the initial projected stock with the actual stock at the start of the look-ahead horizon. The projected factors feeding into the real-time model are the ratio of projected stock to the station or cluster’s maximum capacity.
With these definitions, we present the algebraic equations defining the variables involved in the decision-making process, ultimately shaping the perception of the station or cluster’s inventory status.
- Perceived bike availability factor = Perceived bike availability factor(t - dt) + Update perception * dt
- Initial Perceived bike availability factor = Projected bike availability factor
- Update perception = Adjustment towards actual + Adjustment towards projected
- Adjustment towards actual = Adaptive smoothing factor * Discrepancy to actual
- Adaptive smoothing factor = f(time, Responsiveness to actual)
- Discrepancy to actual = Bike availability factor - Perceived bike availability factor
- Adjustment towards projected = (1 - Adaptive smoothing factor) * Discrepancy to projected
- Discrepancy to projected = Projected bike availability factor - Perceived bike availability factor
- Projected bike availability factor g(rental and return demands, other factors)
In the structural equations, the delay variable Responsiveness to Actual determines how quickly the decision-maker integrates the actual Bike Availability Factor (BAF) into their perception. The Adaptive Smoothing Factor (ASF), a non-linear logistic function of the current look-ahead step and responsiveness, weighs the perception update. This update combines the deviations from actual (BAF) and projected availability (PrBAF), with ASF applied to the actual deviation and (1 - ASF) to the projected deviation. The function represents the generation of projections based on the machine learning forecast, which utilises historical demands and other features.
The second component is the risk perception, which gradually updates based on the Perception delay to reflect the current availability perception; this follows the classic anchor-and-adjust heuristic. In the case of risk, the stock variable retains some memory of prior risk, with the delay variable modelling the inertia.
Figure 14 and Figure 15 below show the simulation result where the projected stock starts at 20 units (about 31% of the station’s maximum capacity). In contrast, the initial stock in the real-time model is set to zero, creating a significant discrepancy between BAF and PrBAF. The graphs display the availability and risk curves for high and low responsiveness levels. With a look-ahead horizon of 48 timesteps, we see the projection align with the actual around 8 AM (six timesteps each hour) after the first refresh. A consequence of low responsiveness is that the risk perception curve is much narrower earlier in the day, as perception aligns more closely with the artificially inflated projected availability values.
3.6. Evaluation - Partial Model Testing
The objective of partial model testing, as suggested by Morecroft, is to broaden the perspective from the task level—typically the initial focus of the intervention—to encompass its immediate process context before fully integrating it into the holistic model. For more traditional policy changes that do not involve machine-learning agents, Morecroft advocated for partial testing to prevent what he called the “leap of logic” from equations to consequences [42].
This approach assumes that, under bounded rationality, policy interventions are generally reasonable at the local or subsystem level before accounting for the dynamic complexity of the entire system. Partial testing, therefore, helps confirm that an intervention is rational in intention before expanding its scope. Since machine learning introduces new dynamics, particularly in navigating decision-making alongside humans, partial testing becomes even more critical.
In the bike-share experiment, we apply this approach to test the reasonableness of using a deep learning method for demand forecasting instead of the traditional exponential smoothing technique—a well-established statistical procedure [43]. While the forecast accuracy metric showed substantial improvement with the RNN model, which intuitively makes sense given its ability to leverage correlates of demand that a univariate method like exponential smoothing cannot, we broaden the testing scope and use a process-oriented metric to determine if these improvements hold at this level.
The following steps outline the procedure for executing the partial tests.
Inputs:
ML (LSTM) and exponential smoothing (STAT) predictions for a given bike station/day.
Maximum capacity of a station.
Procedure:
-
Calculation of Just-in-Time Inventory Balancing (Receipts and Issues):
- ○
- Run the ML and STAT predictions through a simplified stocks-and-flows structure to compute projected stocks.
- ○
- Whenever an outage occurs (either lack of bikes or docks), record the volume as a planned balancing receipt or issue.
-
Calculation of the Process Metric: Total Outages with Just-in-Time Balancing (ML vs. STAT Predictions):
- ○
- Run actual or simulated rental and return demands through a structure that models actual stock (aligned with the projected stock structure).
- ○
- Use planned receipts and issues (from the previous step) as lookups to adjust rentals and returns.
- ○
- Record the bikes and docks outages.
Figure 16 depicts the stocks-and-flows structure used to compute the process metric. Despite its simplicity, the partial test helps determine whether individual rationality—in this case, the superior forecast accuracy of the RNN’s rental and return predictions—translates to collective rationality. The latter refers to whether the combined use of these predictions in a more realistic setting continues to outperform the simpler alternative.
In our first iteration, the performance of several stations under ML was unexpectedly worse. The charts in Figure 17 illustrate a typical outcome. The blue and red lines in the stock outages chart represent the process metric for the station Broadway & E 21 St from August 22 to 25, 2023, for STAT and ML, respectively. Despite ML’s forecast accuracy (measured by Mean Squared Error) being about 28% better for rentals and 19% for returns, its process metric is 95% worse, with 72 units versus 37 units of combined bike and dock outages. A closer inspection, tracing the red and blue arrows, reveals the reason by comparing the projected and actual utilisation over time.
The projected utilisation, defined as the ratio of projected stock to maximum capacity, is consistently and significantly lower for ML than the actual utilisation, indicating a systematic bias in the predictions. Specifically, this involves either under-forecasting returns or over-forecasting rentals or both.
In this case, returns were severely under-forecasted, leading to just-in-time receipts that caused dock outages (as receipts exceeded maximum capacity). The partial test generally revealed complex temporal interdependencies between rentals and returns. These dependencies became markedly pronounced after running partial tests with zero initial stock. For instance, the station’s performance is susceptible to bias and accuracy early in the simulation. Around 9 AM, returns briefly outstrip rentals, allowing a short-term build-up of inventory that reduces sensitivity to accuracy later on. This temporal pattern appeared similarly across other stations in our demand cluster. To address the issue of bias, we adapted the LSTM model by adding a bias correction layer and incorporating a hybrid loss function that combines MSE (sensitive to large errors) and Mean Absolute Error (MAE, which measures the overall magnitude of errors). Table 3 outlines the adjustments.
Table 4 below compares the MSE and bias across three scenarios: exponential smoothing (STAT), ML without bias correction (ML HI-B), and ML with bias correction (ML LO-B).
The green line in the outage and utilisation charts in Figure 17 represents the ML LO-B scenario. Among all scenarios, this shows the closest match between projected and actual stock. While the MSE, in this case, is nearly the same as without bias correction (showing about a 28% improvement for rentals and 19% for returns), the improvement in the outage metric is 22%, compared to a 95% worse performance without the bias correction.
3.7. Evaluation - Integration and What-If Analysis
In contrast to partial testing, which emphasises the rationality of one or more subsystems (i.e., procedural rationality), whole-model testing incorporates all problem-relevant interactions between subsystems. These inter-subsystem interactions are crucial for assessing whether the simplifying assumptions driving the design of decision rules remain valid in light of the system’s emergent dynamic complexity.
A common artefact of dynamic complexity is policy resistance, which occurs when subsystem goals pull in different directions, leading to behaviours contradicting overarching system goals. Policy resistance is one example of an archetype in systems literature, defined as “common patterns of problematic behaviour” ([24], p.111).
While there are many archetypes, policy resistance is the most relevant for assessing the impact of ML interventions on whole-system behaviour, particularly when algorithms and human judgment interact. Since ML is less likely to be influenced by existing organisational beliefs [22], it is more open to exploration, potentially placing the organisation in an unexplored decision space. However, this novelty—seen as beneficial within the limited scope of the ML model—might induce resistance elsewhere in the system. Moreover, nonlinearities and delays, typical of complex systems, mean that resistance may not manifest immediately, often producing a “better before worse” effect ([25], p.59). Our approach in this final step of the bike-share case builds on this insight.
Based on assumptions about the future state mental model, we vary control variables that inform the judgmental component to map the fitness or performance landscape. Although constrained by structural assumptions, this landscape allows us to survey interdependencies between decision variables, providing insights into the system’s “ruggedness.” Ruggedness refers to the extent to which decision performance, influenced by a parameter’s value, depends on other parameters. More importantly, this overview highlights leverage points in the system—policy variables that have an outsized influence on performance.
In real-life scenarios where the focal organisation knows the decision variables of routines complementing the intervention, this approach enables an evaluation of performance for both the current configuration and neighbouring parameter values. Instead of producing a single-point estimate, the organisation gains insights into the performance gradient—the direction and rate of change in performance as decision variables shift—enabling more informed decisions about what else needs to change alongside the intervention to maximise system performance.
3.7.1. Starting Inventory Policy
A natural candidate for a high-leverage control variable is the station’s starting inventory for the day. Since overnight balancing actions are standard practice, setting an optimal starting inventory can significantly reduce the need for extraordinary measures, such as offering incentives or deploying the provider’s fleet for additional balancing.
The performance comparison between LSTM and the statistical method showed that LSTM significantly reduces residual errors by detecting patterns from past demand and, crucially, other demand correlates. Therefore, when setting the starting inventory, LSTM’s superior pattern recognition must be considered, in addition to the uncertainty introduced by randomness and unaccounted-for demand factors.
This dual requirement leads to a straightforward approach for setting the starting inventory. Forecast errors are assumed to follow a normal distribution with zero mean (indicating no systematic bias) and a standard deviation equal to the Root Mean Squared Error (RMSE). Based on a confidence interval, random errors are generated and scaled by the RMSE to reflect forecast uncertainty. Adding these errors to the forecast creates multiple demand scenarios for rentals and returns. These scenarios are then applied in a simplified simulation model (single station, without feedback loops for user incentives) to determine the most robust inventory value. Along with the confidence interval and the number of scenarios, the relative weighting of bike and dock outages is an essential parameter in evaluating performance.
Figure 18 below shows demand scenarios for the station “E 16 St & 5 Ave,” generated for August 24th, with a confidence interval of 80% and 300 scenarios. Since the provider must determine the target inventory for overnight balancing before the day begins, the forecasts are generated on a rolling basis (see Figure A2 in the Appendix A for an illustration of how this logic works). As much as possible, actual historical demands are used (adjusted to account for the time needed to execute physical balancing actions). However, when forecasting into the future—where actual demand data is unavailable—the previously generated forecasts are used instead. This approach enables the creation of a continuous forecast time series covering the entire day.
3.7.2. Simulation of Performance Across the Fitness Landscape
The dimensions of the fitness landscape—shaped by the parameters of heuristics that complement algorithmic decisions—include several decision variables beyond starting inventory. These variables include delays that influence the PeBAF and the perception of out-of-stock (OOS) risk (due to bike or dock unavailability); the aggregation logic and horizon for the PrBAF, which, along with the actual bike availability factor (BAF), affects availability perception; the refresh frequency for updating forecasts and PrBAF throughout the day; and the desired bandwidth for bike availability (where, if the PeBAF remains within the “utilisation sweet spot,” inventory balancing actions are unnecessary). Each parameter set consists of specific values for these decision variables. After defining reasonable domains for the decision variables, parameter sets are generated to correspond to different policy scenarios. The simulation runs on each scenario; the results are collated and visualised in Tableau.
Given the limited incentives data (available only for August 23), only two stations—”E 16 St & 5 Ave” and “E 16 St & Irving Pl”—qualified as candidates. These stations had incentive data and exhibited asymmetric demand patterns, as the causal inference analysis identified. We ran the policy scenarios on these stations, designated as yin and yang, respectively. The focus was on scenarios with zero starting inventory because, during the test period (22nd to 25th August), the proposed target starting inventory was sufficient to prevent most stockouts. The natural buffer that builds up when returns exceed rentals further reduces the likelihood of stockouts. This buffer, however, obscured performance differences that could arise from varying parameter values. By focusing on zero-starting-inventory scenarios, we could better observe the impact of different parameters on performance, as any existing buffer would have masked these effects.
Figure 19 below presents the results of the simulation runs for parameter sets that include the decision variables mentioned earlier. The risk and availability perception delays each take three values (roughly corresponding to low, medium, and high delays); the look-ahead horizon has two values (short and long); the replan frequency is set to 2, 5, or 11 (indicating how many times the plan is refreshed throughout the day); and the utilisation sweet spot is either 20%-80% (0.2) or 30%-70% (0.3).
Each cell represents a policy variant, with the overview displaying 432 scenarios in total. The cell value, formatted as x% (y), shows the improvement over the scenario without crowdsourced incentives (x), along with the total number of stockouts (bikes and docks combined, y). Parameter combinations that perform better than the corresponding scenario without incentives are highlighted in blue.
3.8. Insights and Implications
A notable insight from the overview—evident in Figure 19, where the block of scenarios with the highest risk perception delay (risk delay for short) value has few highlighted cells—is the sharp decline in scenarios where crowdsourced inventory balancing through incentives outperforms the baseline (scenarios without incentives). When the risk perception delay is set to 3 and 6, 89 and 81 scenarios outperform the baseline, respectively, but this number drops significantly to 19 when the delay reaches 12.
This delay parameter is part of the anchor-and-adjust heuristic that updates risk perception. A longer delay implies a slower assimilation of the current PeBAF. The steep drop at the highest delay value suggests that the wait-and-see approach, which anchors the decision maker’s risk perception to prior beliefs, results in missed intervention opportunities when availability shifts away from the desired bandwidth.
A closer inspection of scenarios with a utilisation sweet spot between 30% and 70% (risk buffer = 0.3) reveals a surprising behaviour: the number of scenarios showing improvement over the baseline slightly increases as the delay rises from 3 to 6. We analyse the underlying stocks and flows driving this behaviour to understand this. The following graphs in Figure 20 illustrate two specific scenarios on a chosen day, comparing key stock and flow variables while holding all parameters constant except for the risk delay, set at 3 and 6, respectively.
When the risk delay is set to 6 timesteps (or 60 minutes), this medium delay causes lower responsiveness to PeBAF, allowing the memory of historical risk to persist longer than with a low delay of 3 timesteps. Early in the day, this results in the risk of bike outages at yang remaining above the incentive threshold (indicated by the horizontal dotted line) for an extended period, prompting incentives that encourage users to return bikes to yang over yin. Later in the day, this rerouting causes yin to reach a critical stock level sooner, triggering incentives that bring in additional returns just in time to prevent most stockouts—an advantage not achieved in the low-delay scenario.
The analysis highlights how endogenous decision variables mediate the impact of exogenous temporal demand dynamics at the stations (which influence projected stock) on performance. Specifically, the inventory buffer at yin builds up faster than at yang earlier in the day. The longer delay creates a broader window for incentivisation at yang, setting off the downstream behaviours described earlier and ultimately leading to better performance under a longer delay in perceiving risk changes. While faster responsiveness to risk is generally beneficial, this example shows that uncertainty can simultaneously cause both clusters to experience high risk. In such cases, the system may defy typical assumptions about how decision variables affect performance, as recovery depends on exogenous factors.
After risk delay, the delay in assimilating real-time availability information into perception (availability delay) has the next most significant impact on performance. While this generally holds, performance varies considerably across different availability delay values between days. For instance, the coefficient of variation in improvement over baseline (defined as the standard deviation over the mean of the improvement metric) is lowest on the 24th, at 0.85, and highest on the 23rd, at 2.92. Analysing the lowest and highest availability delays for a given set of parameters further clarifies the underlying dynamics (see Figure 21).
While poor forecast accuracy emphasises the need for better responsiveness to improve performance, a less obvious consequence is that it also introduces stronger interdependencies between decision variables and performance. This is illustrated on the 23rd with the decision variable aggregation horizon, which controls how many periods into the future are considered when computing PrBAF. The domain includes two values: 3 and 12 (short and long horizons).
On this day, among the scenarios that perform better than the baseline (8 in total), only one does so with a short look-ahead horizon. Due to poor forecast accuracy, averaging over a longer horizon, combined with asymmetrical demand profiles (distinct ramp-up and ramp-down patterns at the two clusters), enables initial inventory balancing via crowdsourced incentives that target the more inventory-starved cluster. As in an earlier example, this causes the source of the initial rerouting to reach a critical stock situation earlier (if at all) than in the shorter-horizon scenario. The longer horizon exacerbates this by presenting a more pessimistic view of inventory during the later ramp-down phase. In the example shown, yin is the source of the initial transfer. By intervening early enough (additional returns due to incentives starting after 17:10), yin benefits from inflows rerouted from yang, avoiding most of the stockouts it would have faced with a shorter horizon.
However, the longer look-ahead horizon is beneficial only when paired with a short availability delay (seven of the eight scenarios outperforming the baseline have a short delay). With a longer delay, PeBAF fails to assimilate inventory updates quickly enough when balancing actions occur, leading to prolonged incentivisation at yin and causing yang’s risk to exceed the threshold. Once yin’s improved availability registers in PeBAF, the flow reverses direction. If the second transfer window opens early, this flipping may happen multiple times, resulting in poor stability and worse performance overall.
The increased interdependency between decision variables under poor forecast accuracy leads to greater variability in performance across scenarios, as demonstrated by the analysis of the 23rd. In contrast, on the 24th, when forecast accuracy is highest among the test days, the variability across scenarios is lowest. Since understanding these interdependencies is crucial in devising better policies, even when forecast accuracy is generally high, introducing variability by perturbing demands can provide valuable insights into their impact.
The test workbench includes an option to create demand scenarios by manipulating original demands in predefined ways. For example, Figure 22 below shows scenarios where 80% of rental demands on yin and yang until 10:00 are redistributed across the remaining periods in proportion to the demands during those periods. Simulations for these scenarios resulted in a coefficient of variance in performance improvement (considering low and medium risk delays) of 0.62 with perturbations, compared to 0.36 without. This variability-inducing approach is an additional tool for studying performance sensitivity to different combinations of decision variables. While test data may naturally contain high variability, this option proves helpful when variability is low or needs amplification, offering a way to explore system dynamics more thoroughly.
4. Conclusions
Successive innovations in AI, particularly transformer-based models, along with increased investments in data and computing, continue to drive rapid growth in the field. These advancements create new opportunities for automation but also introduce novel risks, highlighting the need for human oversight. Recognising these risks and the potential for new tasks through human-AI collaboration has shifted the focus towards augmentation rather than pure automation in decision-making. Although frameworks for augmentation offer guidelines—often drawing on decision theory, systems theory, and empirical data—they remain only a starting point, as each organisation’s approach is shaped by its unique decision-making routines and resources. To bridge the gap between theory and practice, organisations need to evaluate their specific blend of human judgment, AI, and, more broadly, algorithmic decision-making. The system dynamics-based simulative modelling framework proposed in this paper addresses the “last mile” challenge of moving from a hypothesised teaming of human and AI agents to practical implementation, enabling quantification that accounts for firm-specific decision complements.
We applied the model to the inventory balancing problem in docked bike-share systems, where incentivising users to perform balancing, although eco-friendly, poses a coordination challenge. The model leverages the complementarity between stations or station clusters with asymmetrical demand patterns to optimise inventory management. Our experiments support recent research suggesting that introducing ML as a novel learning agent creates a decision-making landscape that is likely to be rugged. The flexibility of ML, unconstrained by the prior beliefs that shape human decision-making, allows it to explore a broader decision space. This flexibility creates opportunities for substantial improvement over traditional approaches but also introduces risks. For instance, our simulations of multiple policy variants for inventory balancing, combining judgmental heuristics with data science approaches (including deep learning), showed that while ML’s superior ability to anticipate future flows often leads to significant improvements, there are also scenarios where performance declines compared to using no incentives.
Furthermore, by simulating not only the assumed future-state policy variant but also neighbouring scenarios, our approach reveals that ruggedness can result in significant variability: a variant performing well above the baseline may have nearby scenarios performing much worse. Given irreducible uncertainty, prioritising robust scenarios over elusive optimal ones is essential. Our approach enables the mapping of the performance landscape, offering the opportunity to develop robust policies through parameter fine-tuning and structural adjustments that deliver synergistic human-AI teaming.
Due to the limited incentive data available from NY Citi Bike, the provider used in our case example, we focused our experiments on just two bike stations. However, the simulation workbench supports complementary clusters of multiple stations, allowing for broader analysis. A real-world application could involve clustering the entire network of stations and running parallel simulations for multiple demand clusters using selected policy variants. The data could consist of recent demand patterns, incentives, and forecasts representative of future planning scenarios. The resulting incentive schedule could then inform decisions on fine-tuning policies or supplementing schedules with additional balancing measures. Additionally, while we used a fixed desired bandwidth for available bike inventory in our study, the temporal dynamics observed suggest that a time-dependent bandwidth may be more appropriate for a larger dataset. For instance, employing a tighter bandwidth earlier in the day and a broader one later on could better align with standard nightly balancing practices.
Author Contributions
All authors have read and agreed to the published version of the manuscript.
Funding
This research received no external funding.
Institutional Review Board Statement
Not applicable.
Informed Consent Statement
Not applicable.
Data Availability Statement
The ML code, system dynamics simulation files, and data are available on GitHub under: bss-model-E3BF.
Conflicts of Interest
The authors declare no conflict of interest.
Appendix A
Table A1.
Bike-share forecast model characteristics.
| Aspect | Description |
|---|---|
| Model Architecture | - Sequential model - Input layer - Two LSTM layers (64 units each, ReLU activation) - Custom Bias Correction layer (corrects bias in predictions) - Dense output layer |
| Features Used | - Rentals - Returns - Returns as correlate for rentals forecast - Rentals as correlate for returns forecast - Time signals (sin/cos of time of day and week) |
| Optional Features | - Weather data (actual or forecast) - Lagged correlates - Contemporaneous correlates |
| Model Parameters | - Sequence length: 288 (2 days * 24 hours * 6 records per hour) - Forecast horizon: 12 (2 hours * 6 records per hour) - Batch size: 24 - LSTM units: 64 per layer - L1 regularization: 1e-04 - L2 regularization: 1e-05 - Learning rate: 0.002 (with ReduceLROnPlateau) |
| Loss Function | -Asymmetric Hybrid Loss with parameters: α, λ_bias, λ_over, and λ_under (custom loss function designed to penalise different types of errors differently) |
| Optimisation | - Adam optimiser - ReduceLROnPlateau (factor: 0.8, patience: 5 epochs, min_lr: 0.0003) |
| Data Preprocessing | - MinMax scaling (feature range: -1 to 1) - Sequence generation using Keras utilities - Optional differencing (24 * 6 periods) |
| Training Process | - Early stopping (monitoring validation loss, patience: 10 epochs) - ReduceLROnPlateau (learning rate reduction on plateau) - Maximum 50 epochs |
| Evaluation Metrics | -MSE, MAE |
| Implementation | -TensorFlow/Keras |
| Data Granularity | -10-minute intervals (applies to both input data and output predictions) |
| Forecasting Approach | -Separate models for rentals and returns |
| Notable Features | - Custom Bias Correction layer (for improved prediction accuracy) - Asymmetric Hybrid Loss function (penalises under- and over-estimations differently) - Flexibility to include/exclude various features - Sequence-to-sequence option |
| Reproducibility | - TensorFlow version: 2.17.0 - Keras version: 3.4.1 - Python version: 3.10.12 - GPU: Tesla T4 with CUDA 12.2 - Fixed random seed (511) for TensorFlow and NumPy operations |
Figure A1.
CLD of the bike-share two-stock model.
References
- Raschka S. Build a Large Language Model from Scratch. Manning Publications; 2024. 400 p.
- Malone TW. MIT Sloan Management Review. 2018 [cited 2021 Sep 22]. How Human-Computer “Superminds” Are Redefining the Future of Work. Available from: https://sloanreview-mit-edu.plymouth.idm.oclc.org/article/how-human-computer-superminds-are-redefining-the-future-of-work/.
- Agrawal A, Gans JS, Goldfarb A. MIT Sloan Management Review. 2017 [cited 2021 Sep 14]. What to Expect From Artificial Intelligence. Available from: https://sloanreview-mit-edu.plymouth.idm.oclc.org/article/what-to-expect-from-artificial-intelligence/.
- Brynjolfsson E, Mitchell T. What can machine learning do? Workforce implications. Science [Internet]. 2017 Dec 22 [cited 2021 Sep 1]; Available from: https://www.science.org/doi/abs/10.1126/science.aap8062.
- Autor D. Polanyi’s Paradox and the Shape of Employment Growth [Internet]. National Bureau of Economic Research; 2014 Sep [cited 2021 Sep 8]. Report No.: 20485. Available from: https://www.nber.org/papers/w20485.
- Agrawal A, Gans J, Goldfarb A. Power and Prediction: The Disruptive Economics of Artificial Intelligence. Boston, Massachusetts: Harvard Business Review Press; 2022. 288 p.
- Brynjolfsson E. The Turing Trap: The Promise & Peril of Human-Like Artificial Intelligence. Daedalus [Internet]. 2022 May 1 [cited 2022 May 18];151(2):272–87. [CrossRef]
- Acemoglu D, Johnson S. Power and Progress: Our Thousand-Year Struggle Over Technology and Prosperity. 1st edition. New York: PublicAffairs; 2023. 560 p.
- Kambhampati S. Polanyi’s Revenge and AI’s New Romance with Tacit Knowledge [Internet]. 2021 [cited 2021 Sep 6]. Available from: https://cacm.acm.org/magazines/2021/2/250077-polanyis-revenge-and-ais-new-romance-with-tacit-knowledge/fulltext.
- Lebovitz S, Levina N, Lifshitz-Assaf H. Is AI Ground Truth Really “True?” The Dangers of Training and Evaluating AI Tools Based on Experts’ Know-What [Internet]. Rochester, NY; 2021 [cited 2022 Oct 28]. Available from: https://papers.ssrn.com/abstract=3839601.
- Raghu M, Blumer K, Corrado G, Kleinberg J, Obermeyer Z, Mullainathan S. The Algorithmic Automation Problem: Prediction, Triage, and Human Effort [Internet]. arXiv; 2019 [cited 2023 Nov 20]. Available from: http://arxiv.org/abs/1903.12220.
- Ross J. MIT Sloan Management Review. [cited 2022 Nov 7]. Don’t Confuse Digital With Digitization. Available from: https://sloanreview.mit.edu/article/dont-confuse-digital-with-digitization/.
- Moser C, Hond F den, Lindebaum D. What Humans Lose When We Let AI Decide. MIT Sloan Management Review [Internet]. 2022 Feb 7 [cited 2022 May 24]; Available from: http://sloanreview.mit.edu/article/what-humans-lose-when-we-let-ai-decide/.
- Morgan G. Images of Organization. Updated edition. Thousand Oaks: SAGE Publications, Inc; 2006. 520 p.
- Gigerenzer G. How to Stay Smart in a Smart World: Why Human Intelligence Still Beats Algorithms. Penguin; 2022. 307 p.
- Chiang T. ChatGPT Is a Blurry JPEG of the Web. The New Yorker [Internet]. 2023 Feb 9 [cited 2023 Nov 24]; Available from: https://www.newyorker.com/tech/annals-of-technology/chatgpt-is-a-blurry-jpeg-of-the-web.
- Babic B, Cohen IG, Evgeniou T, Gerke S. When Machine Learning Goes Off the Rails. Harvard Business Review [Internet]. 2021 Jan 1 [cited 2022 May 25]; Available from: https://hbr.org/2021/01/when-machine-learning-goes-off-the-rails.
- Smith BC. The Promise of Artificial Intelligence: Reckoning and Judgment. Illustrated Edition. Cambridge, MA: The MIT Press; 2019. 184 p.
- Kitchin R. Big Data, new epistemologies and paradigm shifts. Big Data & Society [Internet]. 2014 Apr 1 [cited 2021 Oct 11];1(1):2053951714528481. [CrossRef]
- Domingos P. A Few Useful Things to Know About Machine Learning. Commun ACM. 2012 Oct 1;55:78–87.
- Levinthal DA. Adaptation on Rugged Landscapes. Management Science [Internet]. 1997 Jul [cited 2023 Dec 26];43(7):934–50. Available from: https://pubsonline.informs.org/doi/abs/10.1287/mnsc.43.7.934.
- Sturm T, Gerlach JP, Pumplun L, Mesbah N, Peters F, Tauchert C, et al. Coordinating Human and Machine Learning for Effective Organizational Learning. MIS Quarterly [Internet]. 2021 Sep [cited 2022 Oct 28];45(3):1581–602. Available from: https://search.ebscohost.com/login.aspx?direct=true&AuthType=ip,url,shib&db=bth&AN=152360588&site=ehost-live.
- Dell’Acqua F, McFowland E, Mollick ER, Lifshitz-Assaf H, Kellogg K, Rajendran S, et al. Navigating the Jagged Technological Frontier: Field Experimental Evidence of the Effects of AI on Knowledge Worker Productivity and Quality [Internet]. Rochester, NY; 2023 [cited 2023 Nov 13]. Available from: https://papers.ssrn.com/abstract=4573321.
- Meadows DH. Thinking in Systems: International Bestseller. Wright D, editor. White River Junction, Vt: Chelsea Green Publishing; 2008. 240 p.
- Senge PM. The Fifth Discipline: The Art & Practice of The Learning Organization. Revised & Updated edition. New York: Doubleday; 2006. 445 p.
- Morecroft JD. System dynamics: Portraying bounded rationality. Omega [Internet]. 1983 Jan 1 [cited 2021 Oct 22];11(2):131–42. Available from: https://www.sciencedirect.com/science/article/pii/0305048383900026.
- Houghton J, Siegel M. Advanced data analytics for system dynamics models using PySD. In: Proceedings of the 33rd International Conference of the System Dynamics Society. Cambridge, Massachusetts, USA: System Dynamics Society; 2015.
- Simon HA. The Sciences of the Artificial - 3rd Edition. 3rd edition. Cambridge, Mass: The MIT Press; 1996. 248 p.
- Sankaran G, Palomino MA, Knahl M, Siestrup G. A modeling approach for measuring the performance of a human-AI collaborative process. Appl Sci. 2022;12(22):11642.
- Sterman JD. Business Dynamics. International edition. Boston: McGraw-Hill Education; 2000. 993 p.
- Oliveira GN, Sotomayor JL, Torchelsen RP, Silva CT, Comba JLD. Visual analysis of bike-sharing systems. Computers & Graphics [Internet]. 2016 Nov 1 [cited 2022 Nov 29];60:119–29. Available from: https://www.sciencedirect.com/science/article/pii/S0097849316300991.
- Shen Y, Zhang X, Zhao J. Understanding the usage of dockless bike sharing in Singapore. International Journal of Sustainable Transportation [Internet]. 2018 Oct 21 [cited 2022 Nov 29];12(9):686–700. [CrossRef]
- Shaheen SA, Guzman S, Zhang H. Bikesharing in Europe, the Americas, and Asia: Past, Present, and Future. Transportation Research Record [Internet]. 2010 Jan 1 [cited 2022 Nov 30];2143(1):159–67. [CrossRef]
- Chung H, Freund D, Shmoys DB. Bike Angels: An Analysis of Citi Bike’s Incentive Program. In: Proceedings of the 1st ACM SIGCAS Conference on Computing and Sustainable Societies [Internet]. New York, NY, USA: Association for Computing Machinery; 2018 [cited 2022 Oct 24]. p. 1–9. (COMPASS’ 18). [CrossRef]
- Morecroft JDW. Strategic Modelling and Business Dynamics: A feedback systems approach. 2nd ed. Hoboken, New Jersey: Wiley; 2015. 504 p.
- Singla A, Santoni M, Bartók G, Mukerji P, Meenen M, Krause A. Incentivizing Users for Balancing Bike Sharing Systems. Proceedings of the AAAI Conference on Artificial Intelligence [Internet]. 2015 Feb 10 [cited 2023 Aug 11];29(1). Available from: https://ojs.aaai.org/index.php/AAAI/article/view/9251.
- Makridakis SG, Wheelwright SC, Hyndman RJ. Forecasting: Methods and Applications. 3rd ed. New York: Wiley; 1998. 923 p.
- Sankaran G, Sasso F, Kepczynski R, Chiaraviglio A. Improving Forecasts with Integrated Business Planning: From Short-Term to Long-Term Demand Planning Enabled by SAP IBP [Internet]. Cham: Springer International Publishing; 2019 [cited 2024 Aug 27]. (Management for Professionals). Available from: http://link.springer.com/10.1007/978-3-030-05381-9.
- Géron A. Hands-On Machine Learning with Scikit-Learn, Keras, and TensorFlow: Concepts, Tools, and Techniques to Build Intelligent Systems. 2nd edition. Beijing China ; Sebastopol, CA: O’Reilly Media; 2019. 856 p.
- Chollet F. Deep Learning with Python, Second Edition. 2nd edition. Shelter Island: Manning; 2021. 504 p.
- Brodersen KH, Gallusser F, Koehler J, Remy N, Scott SL. Inferring causal impact using Bayesian structural time-series models. The Annals of Applied Statistics [Internet]. 2015 Mar [cited 2023 Jul 6];9(1):247–74. Available from: https://projecteuclid.org/journals/annals-of-applied-statistics/volume-9/issue-1/Inferring-causal-impact-using-Bayesian-structural-time-series-models/10.1214/14-AOAS788.full.
- Morecroft JDW. Rationality in the Analysis of Behavioral Simulation Models. Management Science [Internet]. 1985 Jul 1 [cited 2021 Oct 22];31(7):900–16. Available from: https://pubsonline.informs.org/doi/abs/10.1287/mnsc.31.7.900.
- Makridakis S, Spiliotis E, Assimakopoulos V. Statistical and Machine Learning forecasting methods: Concerns and ways forward. PLOS ONE [Internet]. 2018 March 27 [cited 2022 June 7];13(3):e0194889. Available from: https://journals.plos.org/plosone/article?id=10.1371/journal.pone.0194889.
Figure 1.
Double-loop learning.
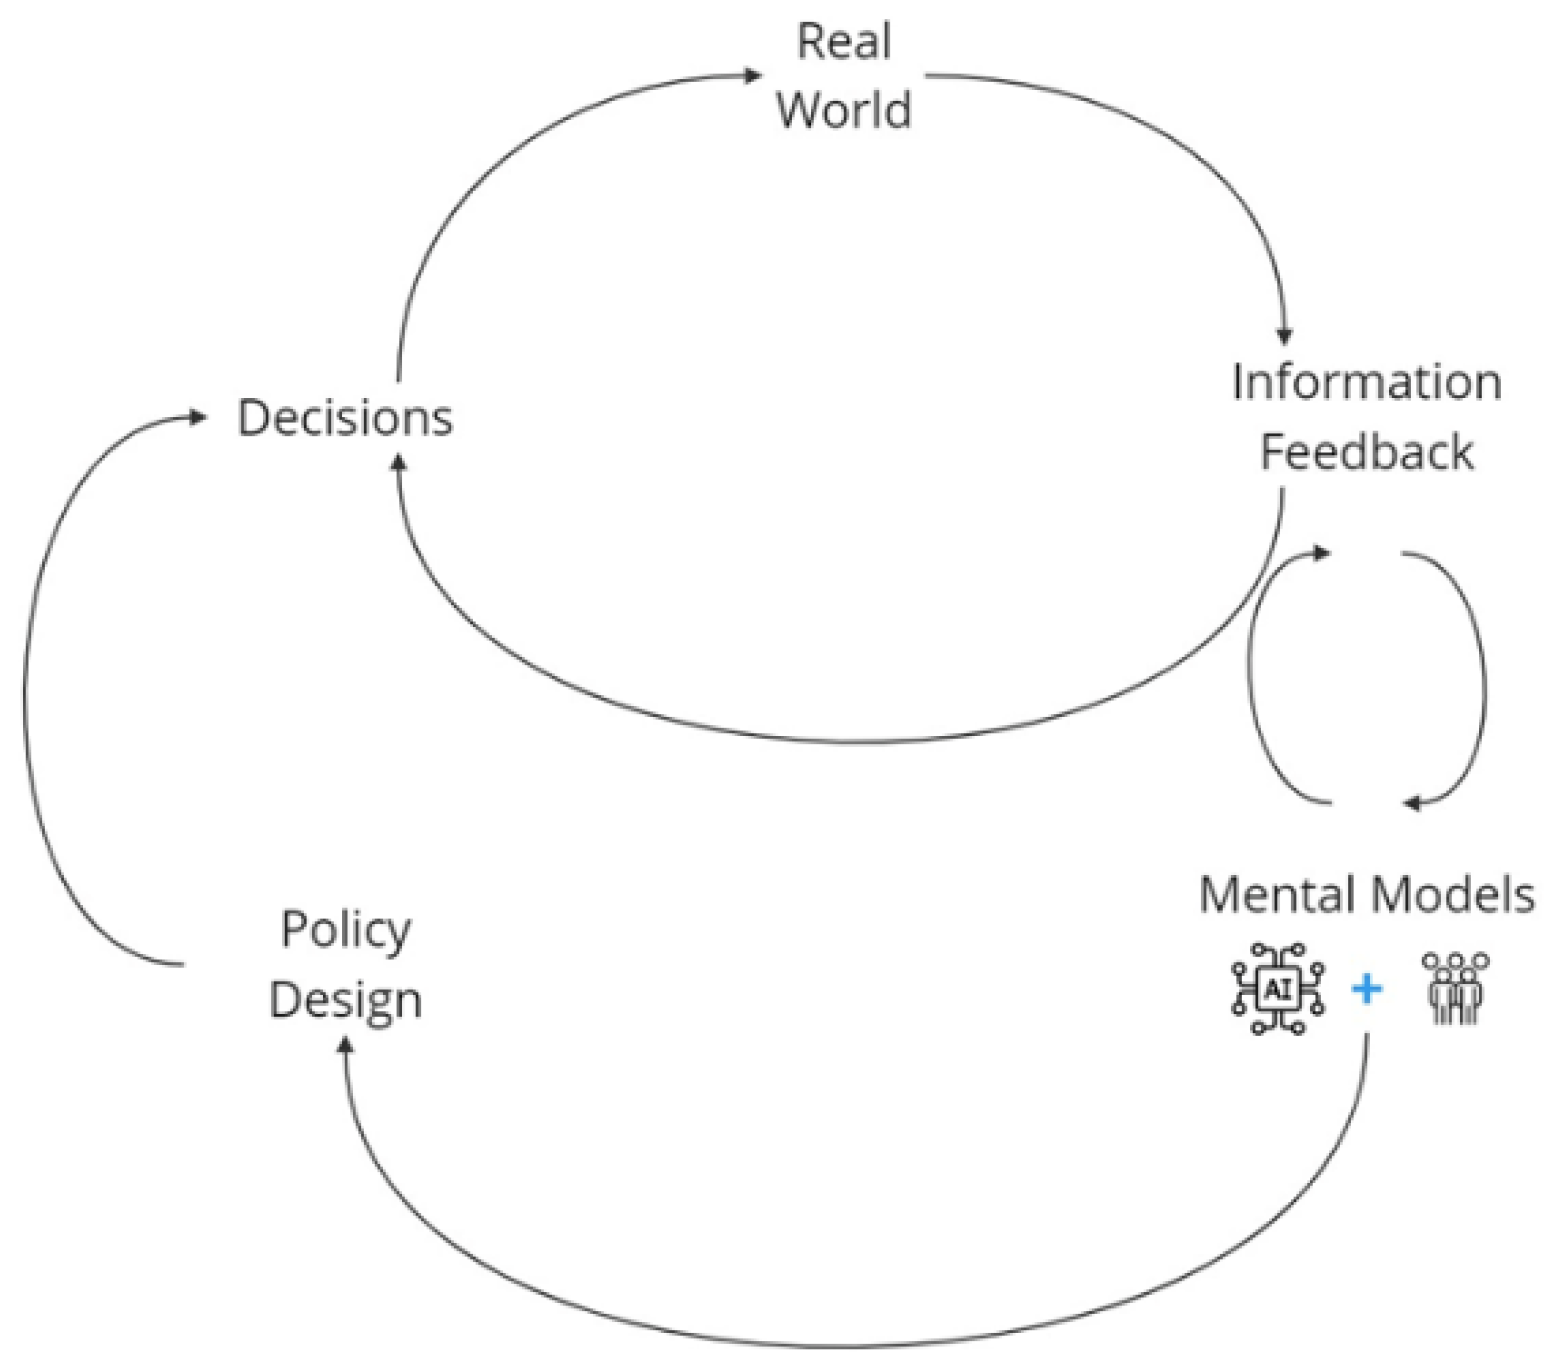
Figure 2.
Evidence of poor incentivisation strategy at a Citi Bike station in August 2023. Conditional coloring formula: COLOUR = { GREEN: if CU ≥ HUT and RI > 0; RED: if CU ≥ HUT and (RI = 0 or RI is null); RED: if CU < RHUT and RI > 0; GRAY otherwise}, Where CU = Average Capacity Utilisation = AVERAGE(DA / CA), RI = Sum of Return Incentives, HUT = High Utilisation Threshold, RHUT = Reasonably High Utilisation Threshold, DA = Docks Available, and CA = Capacity Available.
Figure 2.
Evidence of poor incentivisation strategy at a Citi Bike station in August 2023. Conditional coloring formula: COLOUR = { GREEN: if CU ≥ HUT and RI > 0; RED: if CU ≥ HUT and (RI = 0 or RI is null); RED: if CU < RHUT and RI > 0; GRAY otherwise}, Where CU = Average Capacity Utilisation = AVERAGE(DA / CA), RI = Sum of Return Incentives, HUT = High Utilisation Threshold, RHUT = Reasonably High Utilisation Threshold, DA = Docks Available, and CA = Capacity Available.
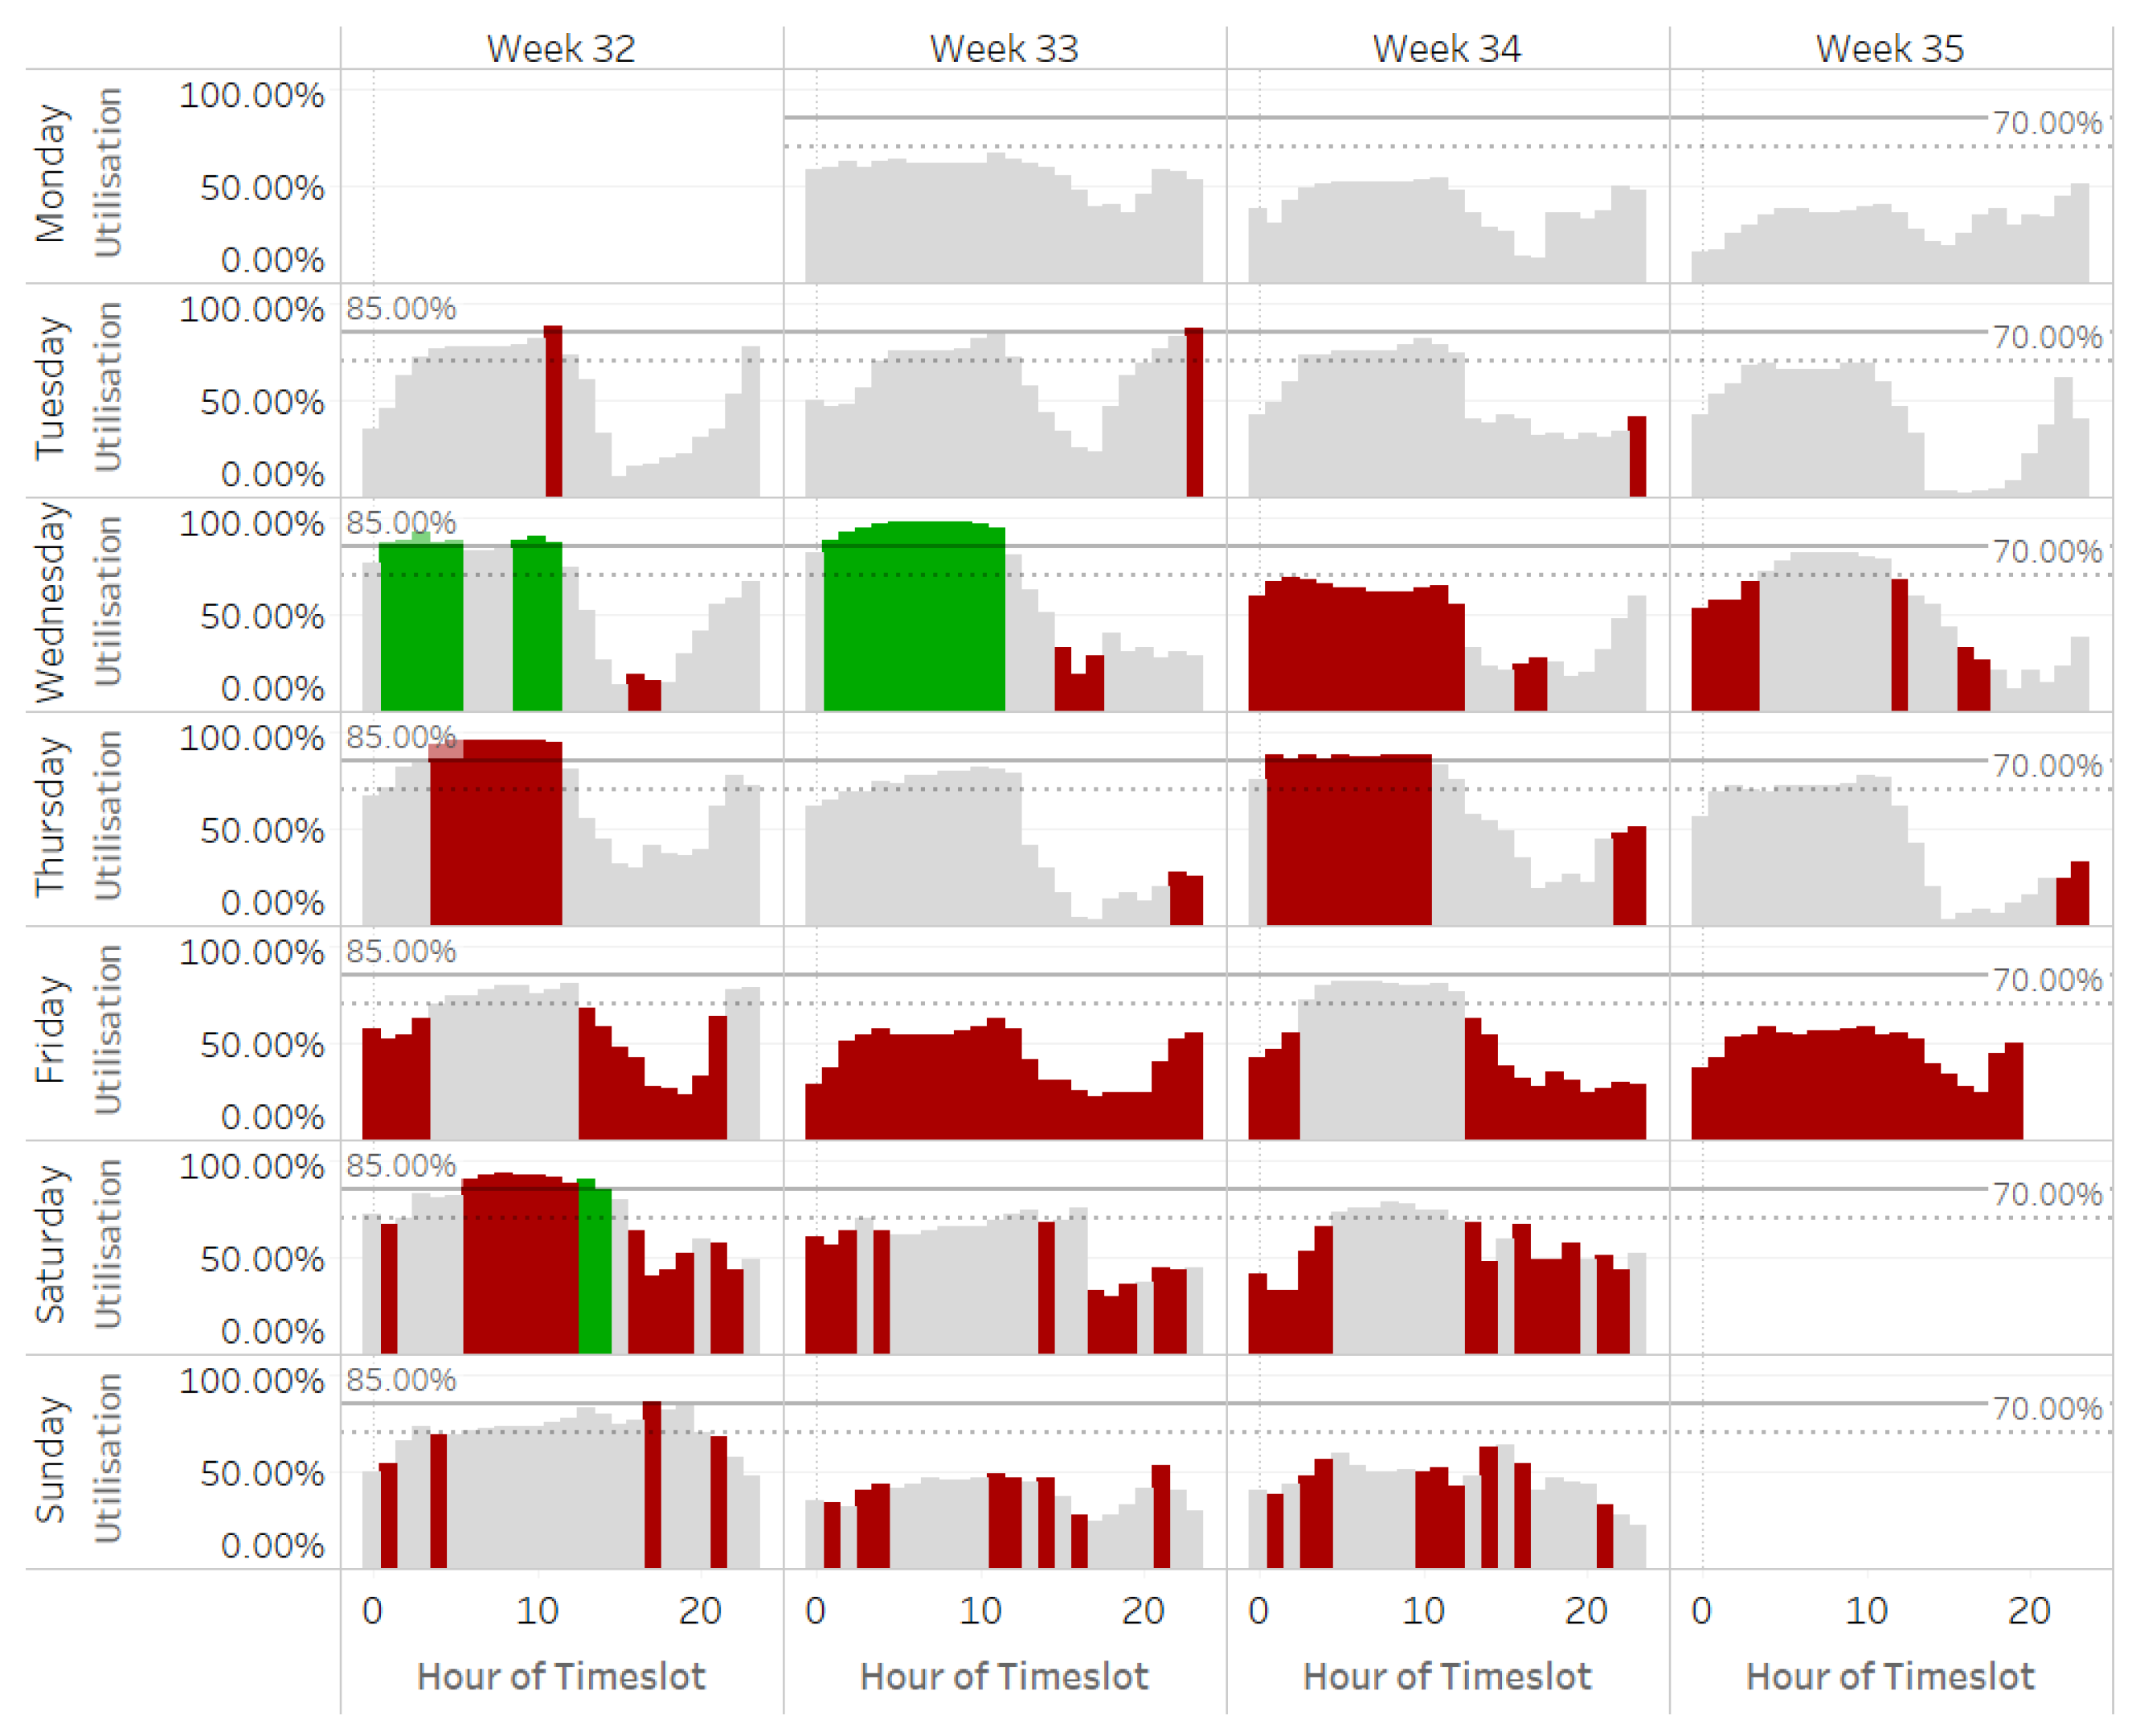
Figure 3.
Chosen demand cluster consisting of nine stations.
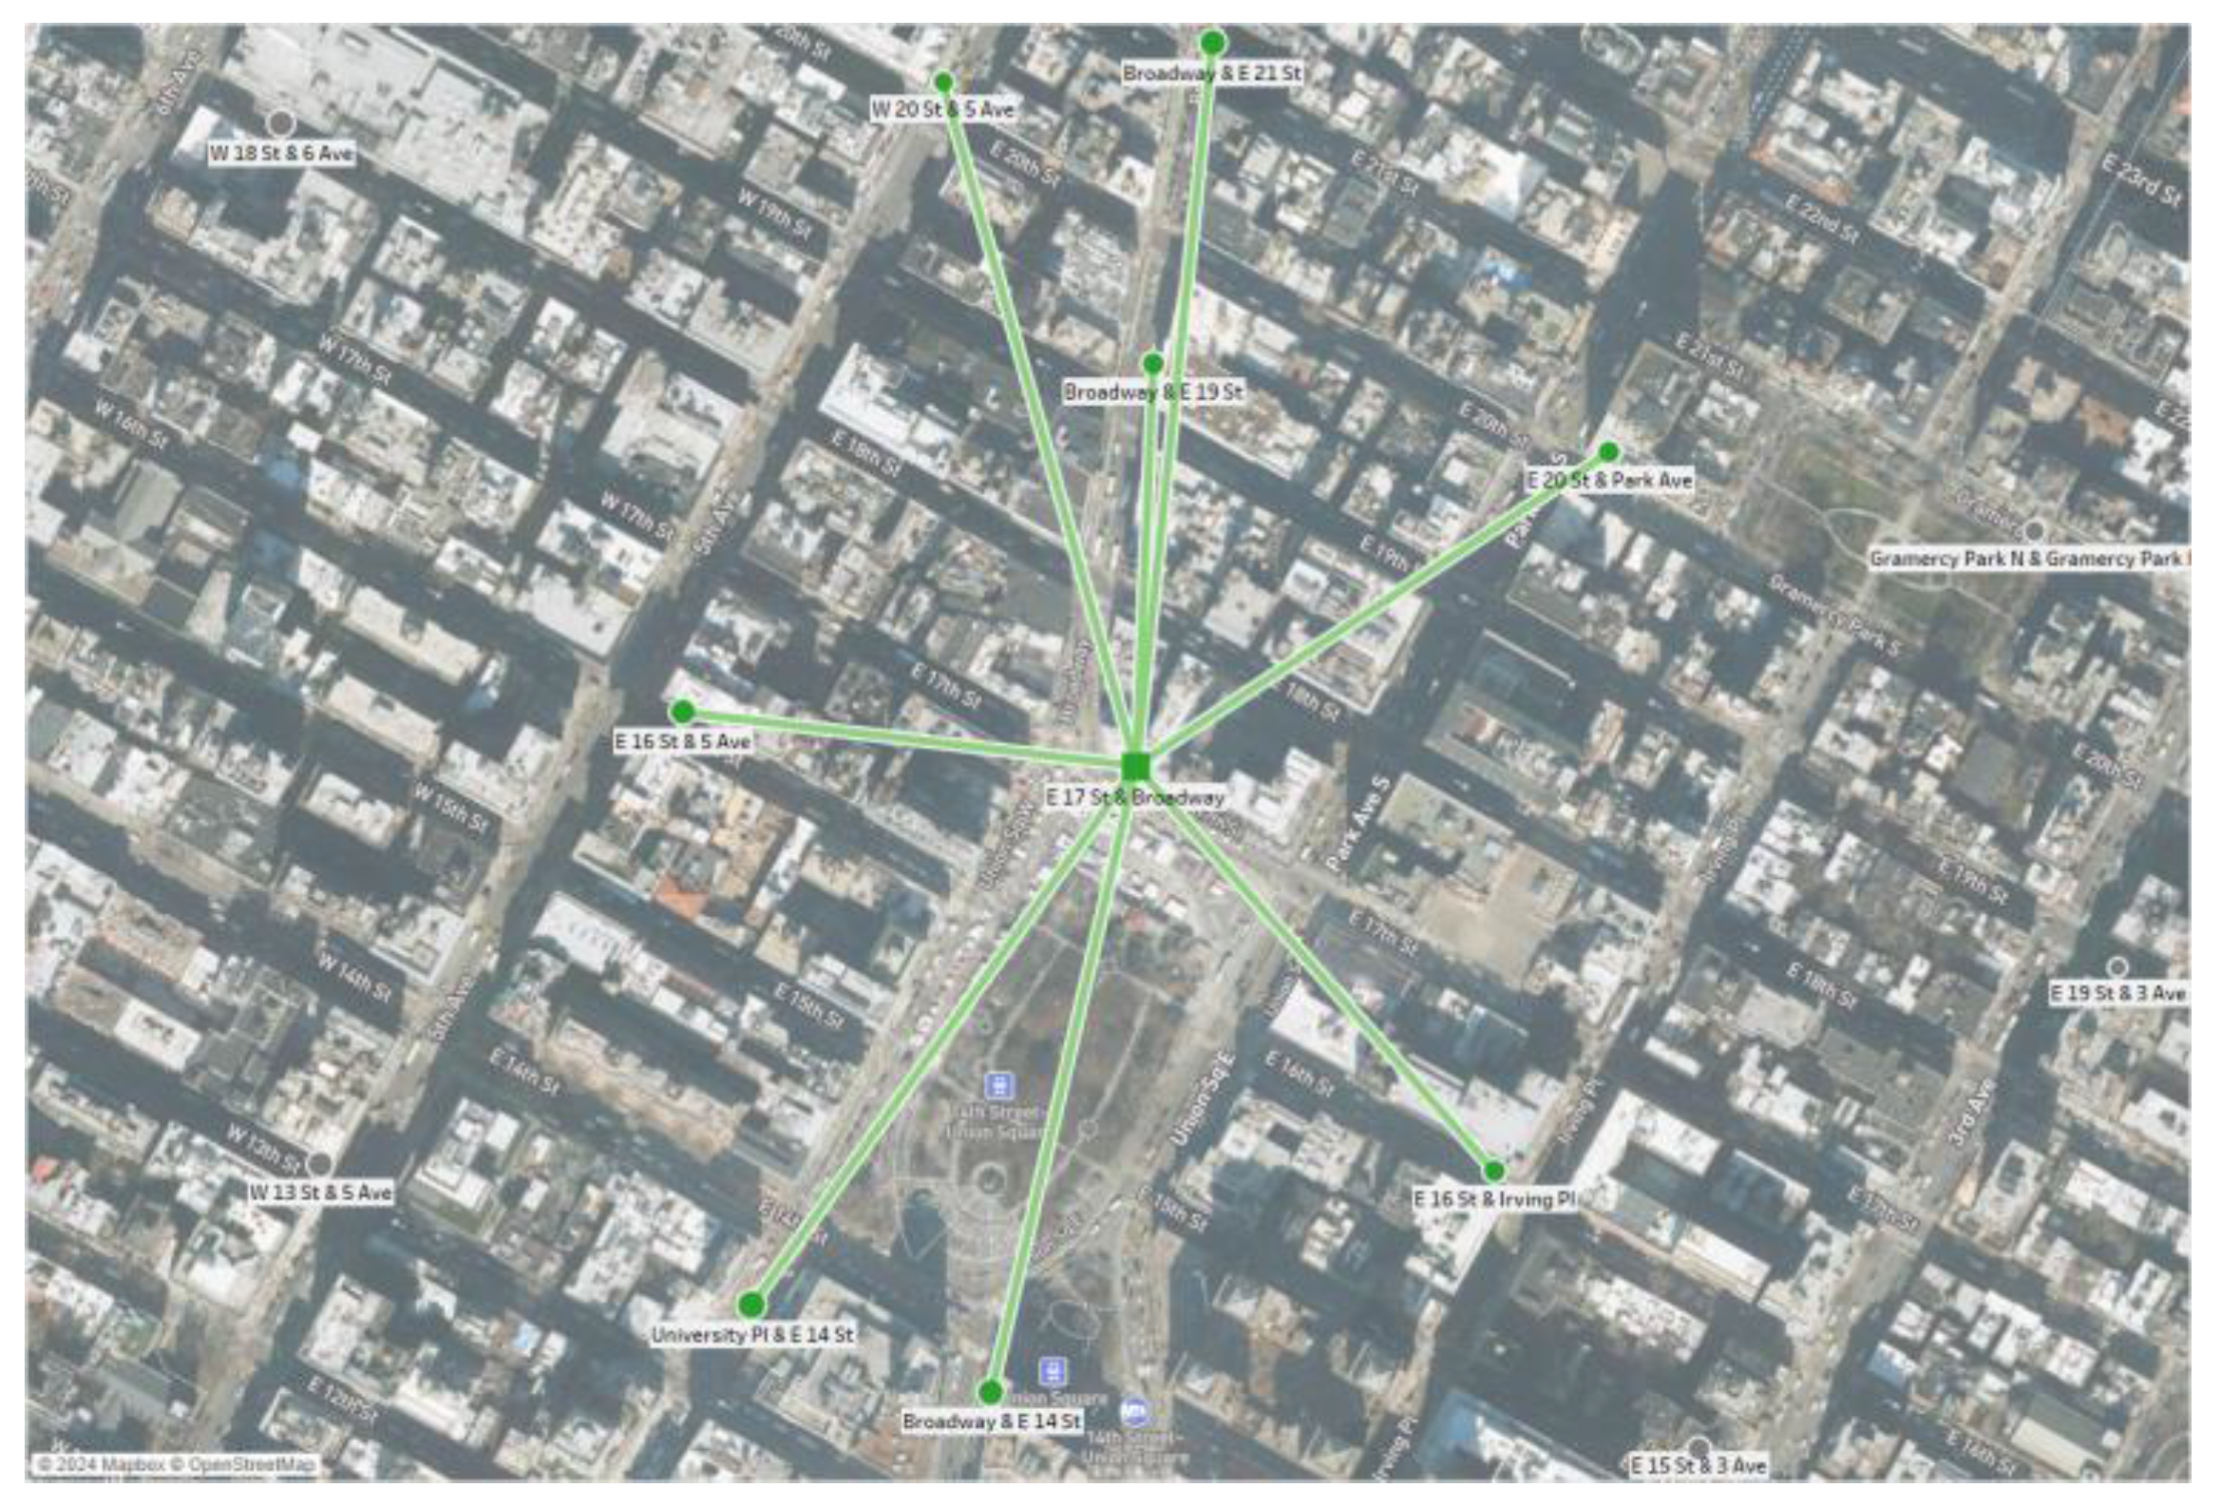
Figure 4.
A Causal Loop Diagram of the bike-share inventory balancing with a dynamic hypothesis.
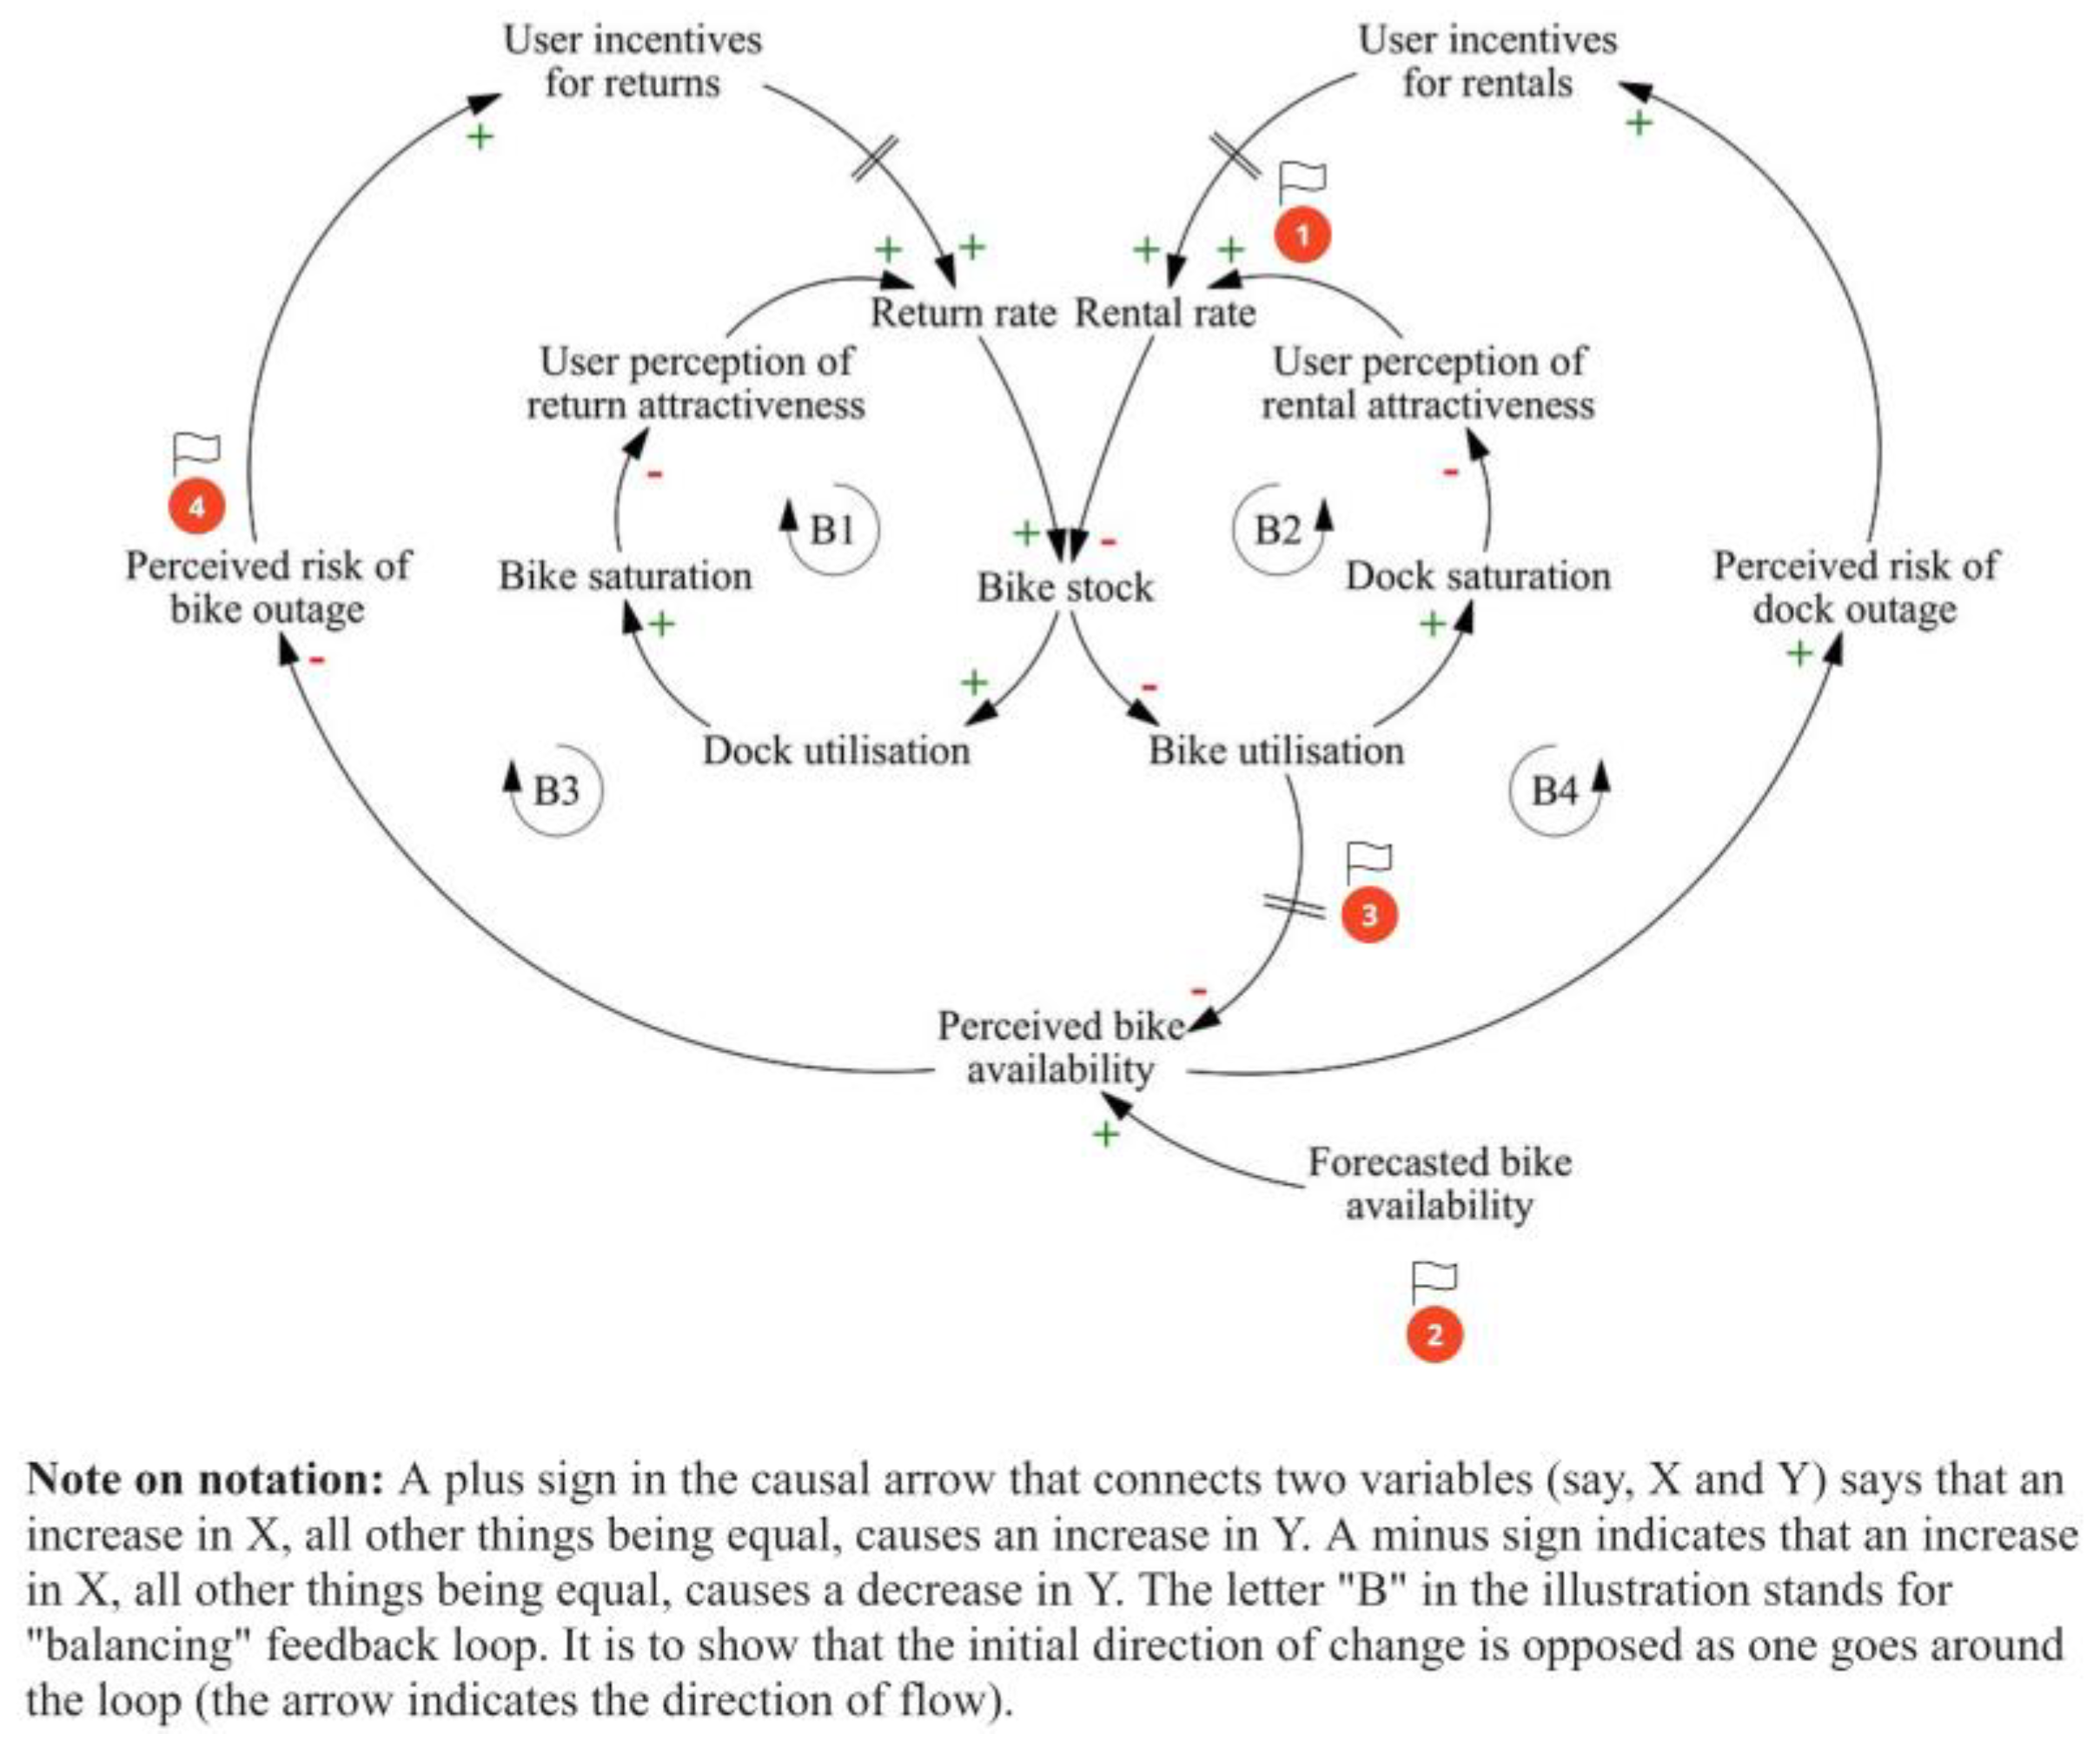
Figure 5.
Bike-share model high-level flows.
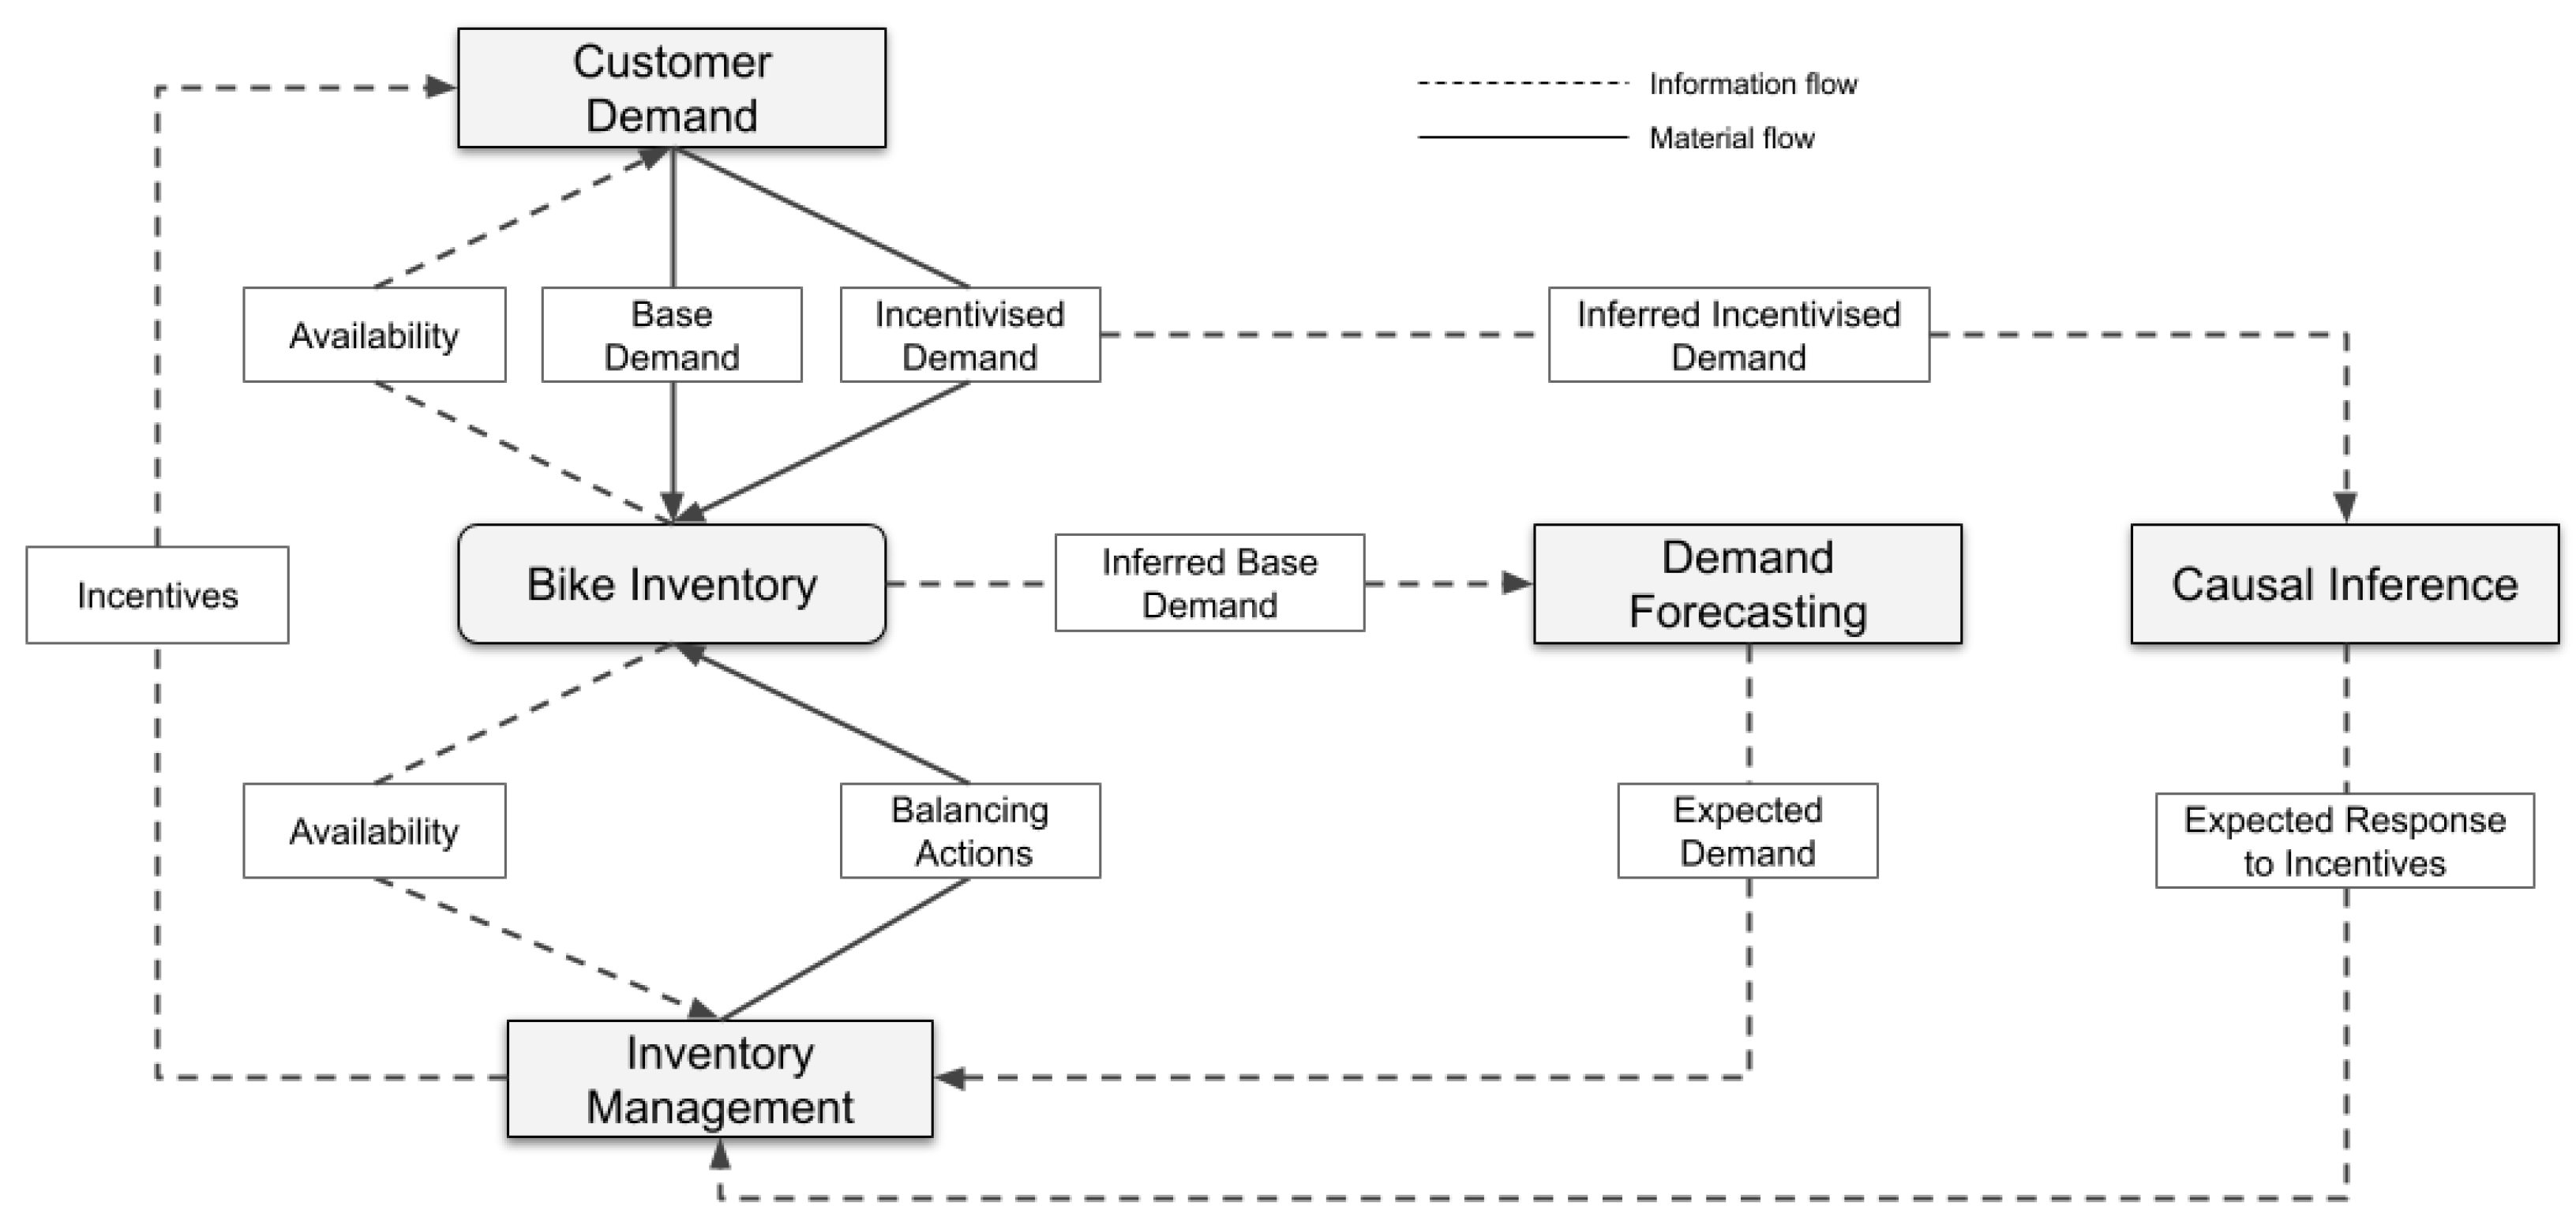
Figure 6.
Data pipeline.
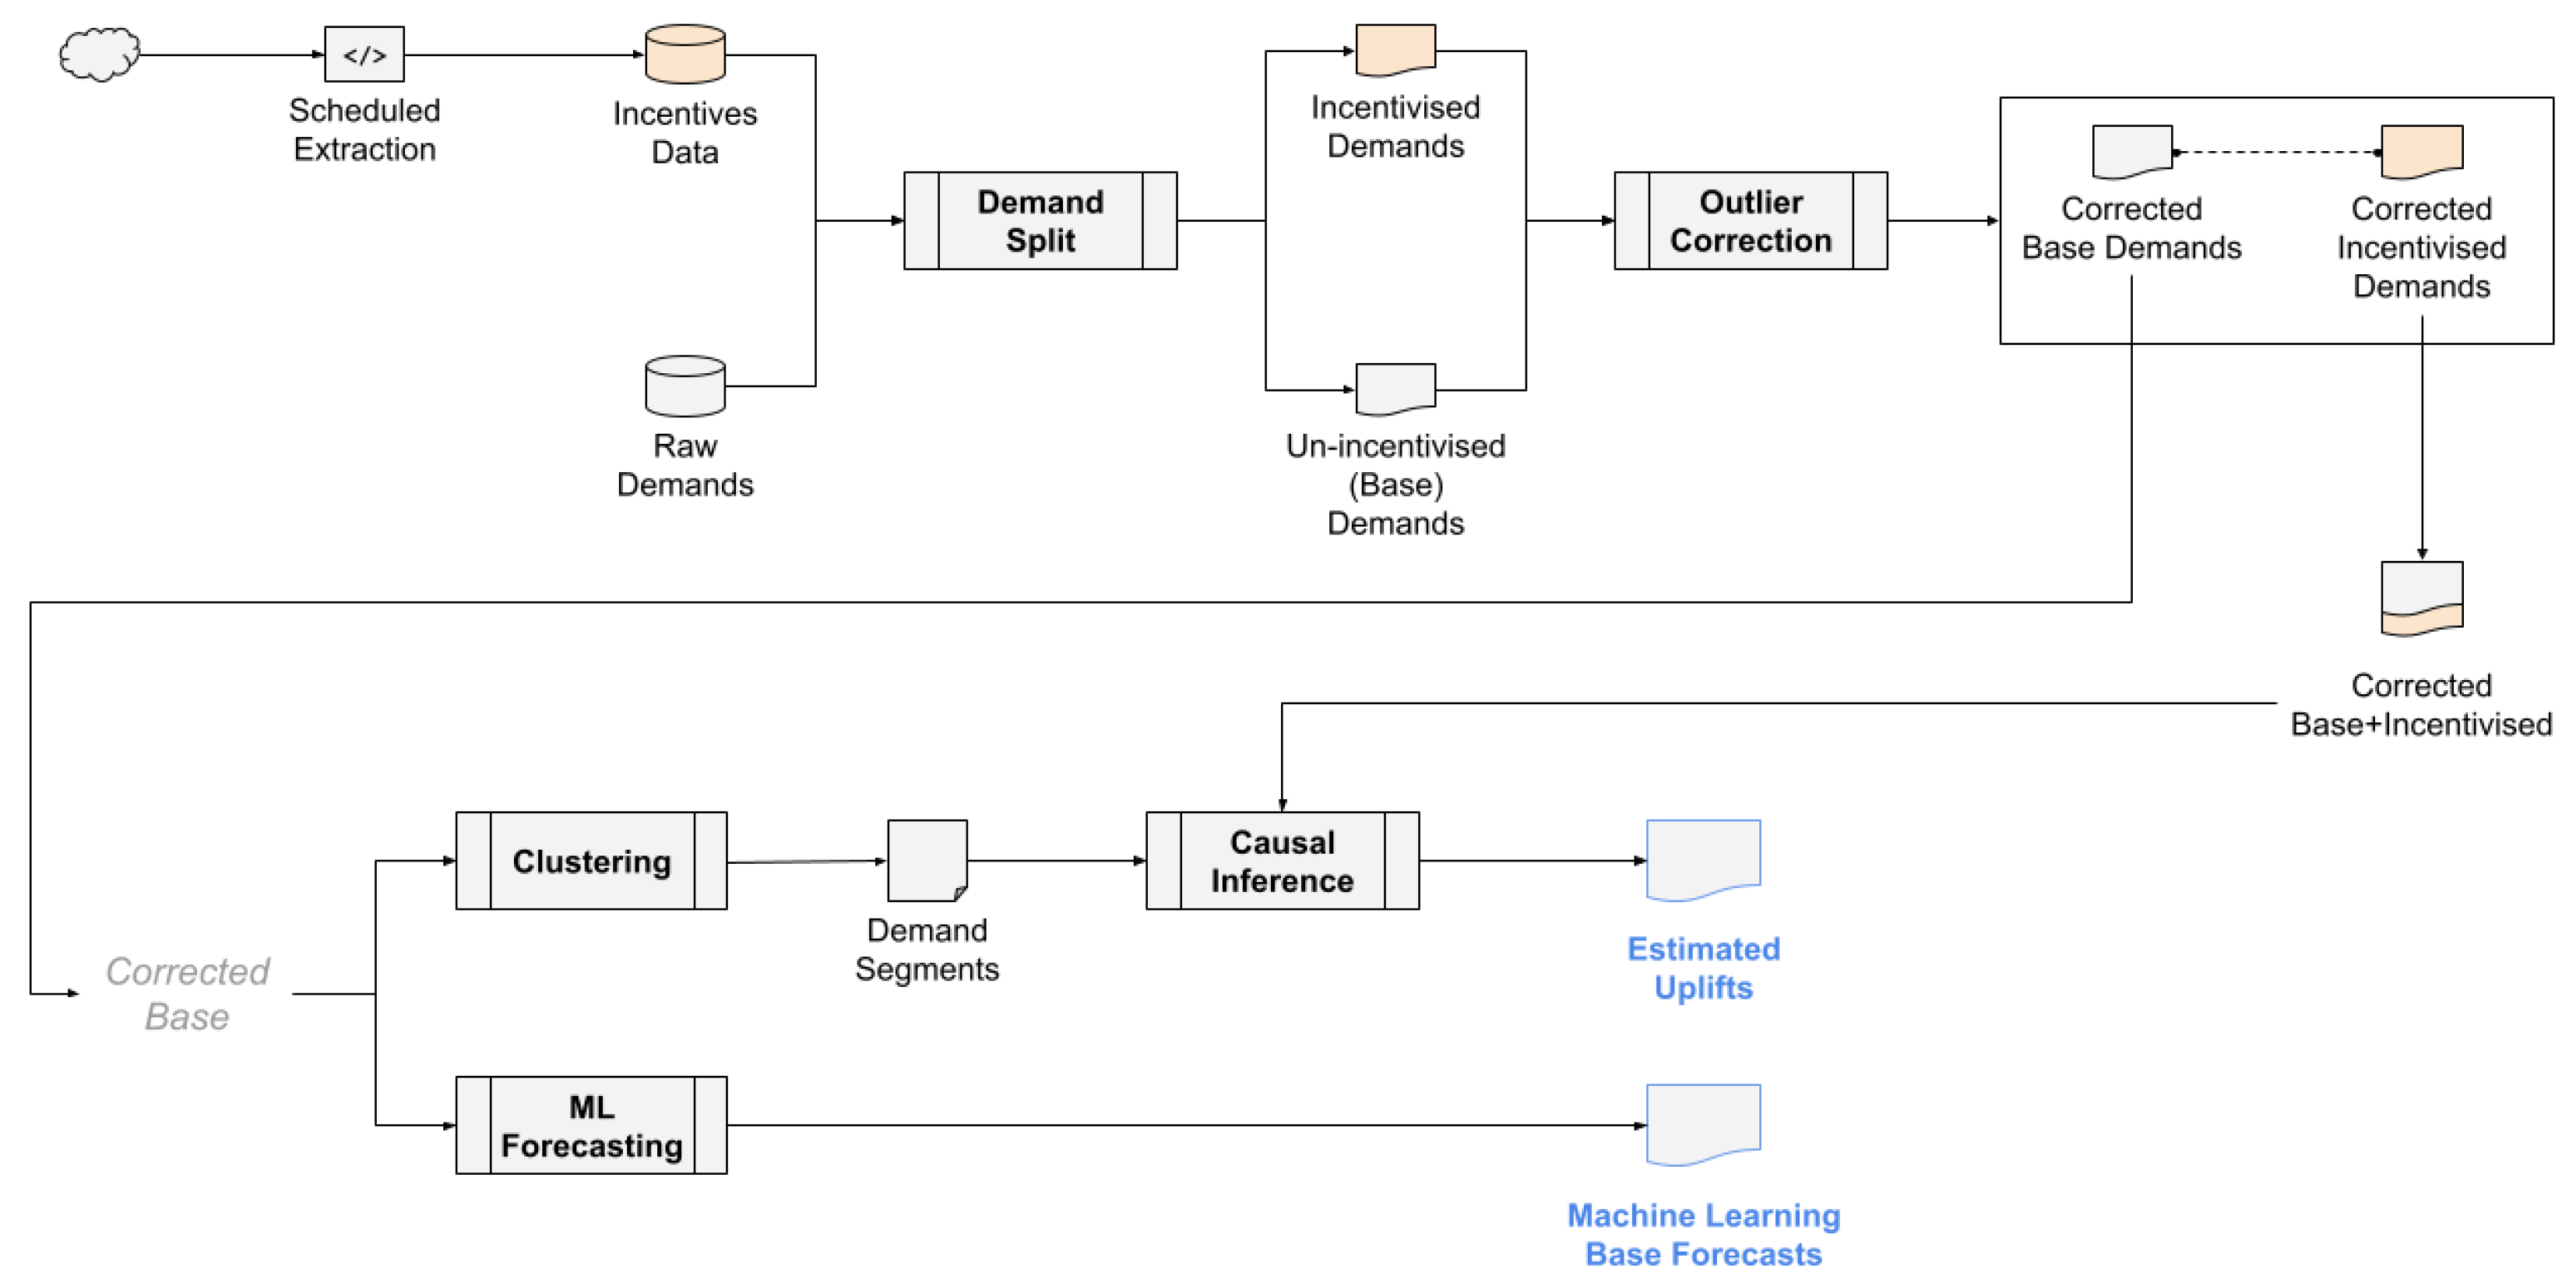
Figure 8.
Demands in a typical week at the two most symmetrical stations of the cluster.
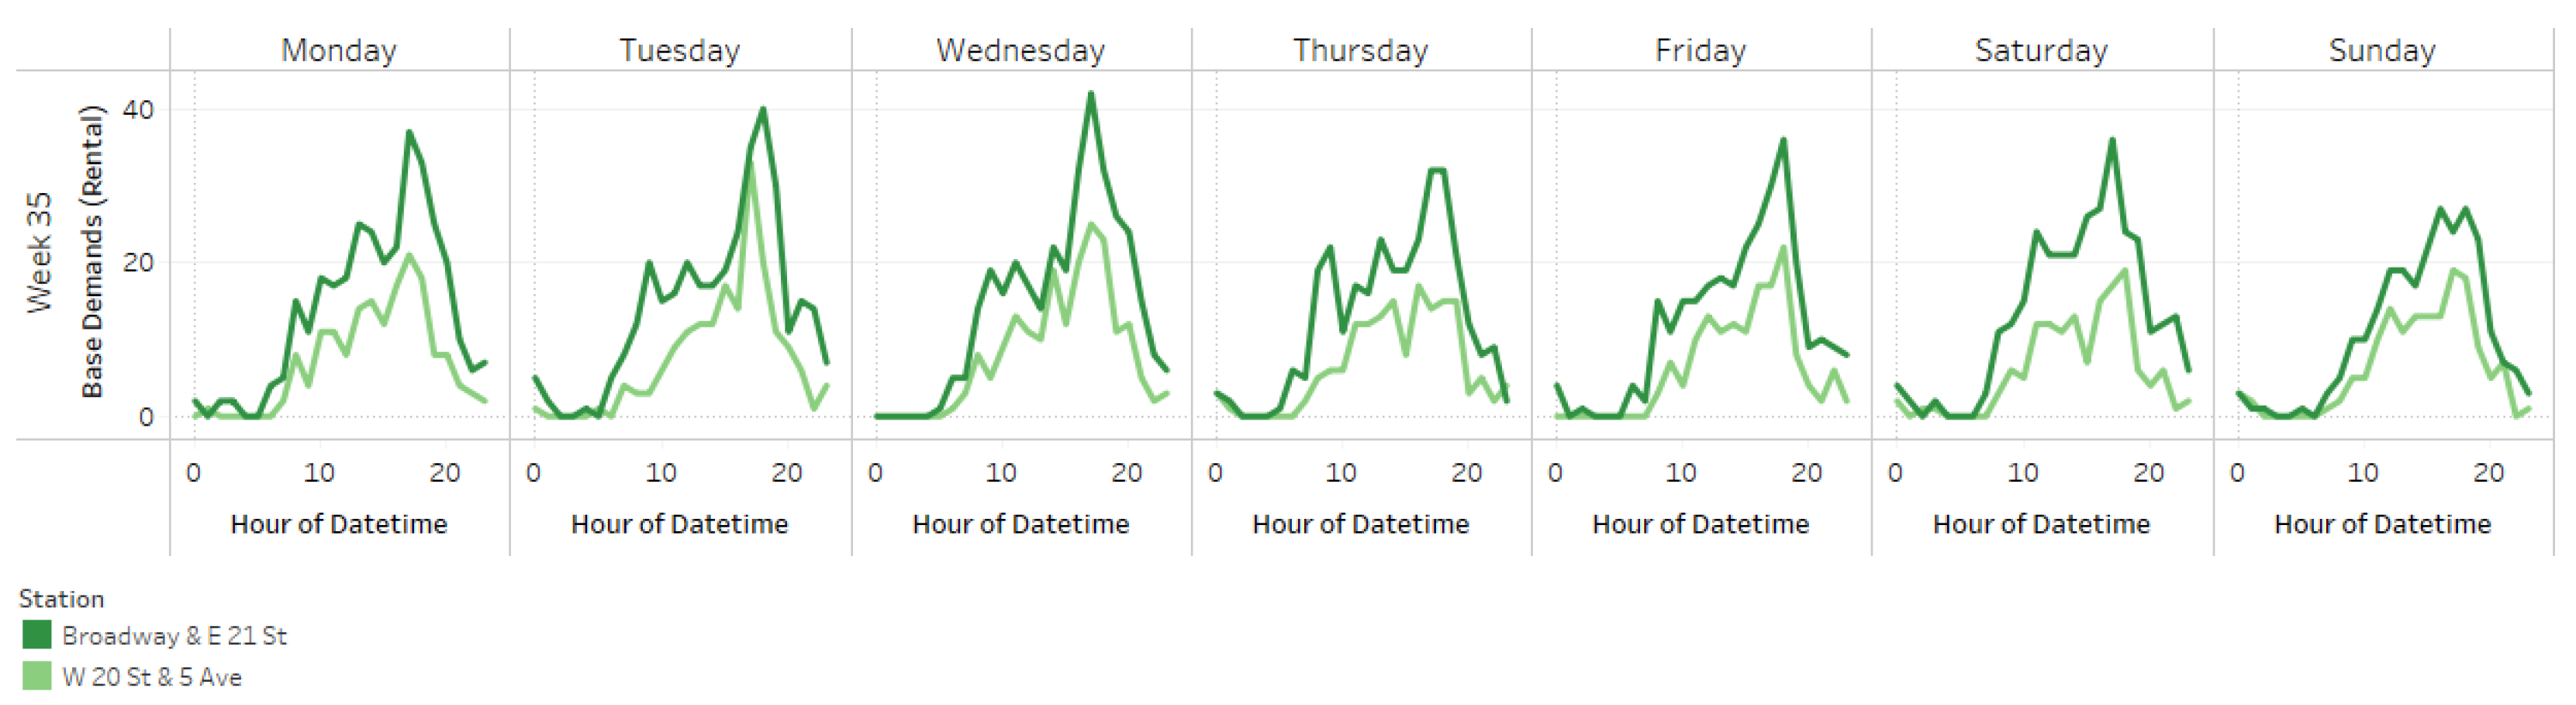
Figure 9.
Analysis of the causal impact of incentives on rental demands.
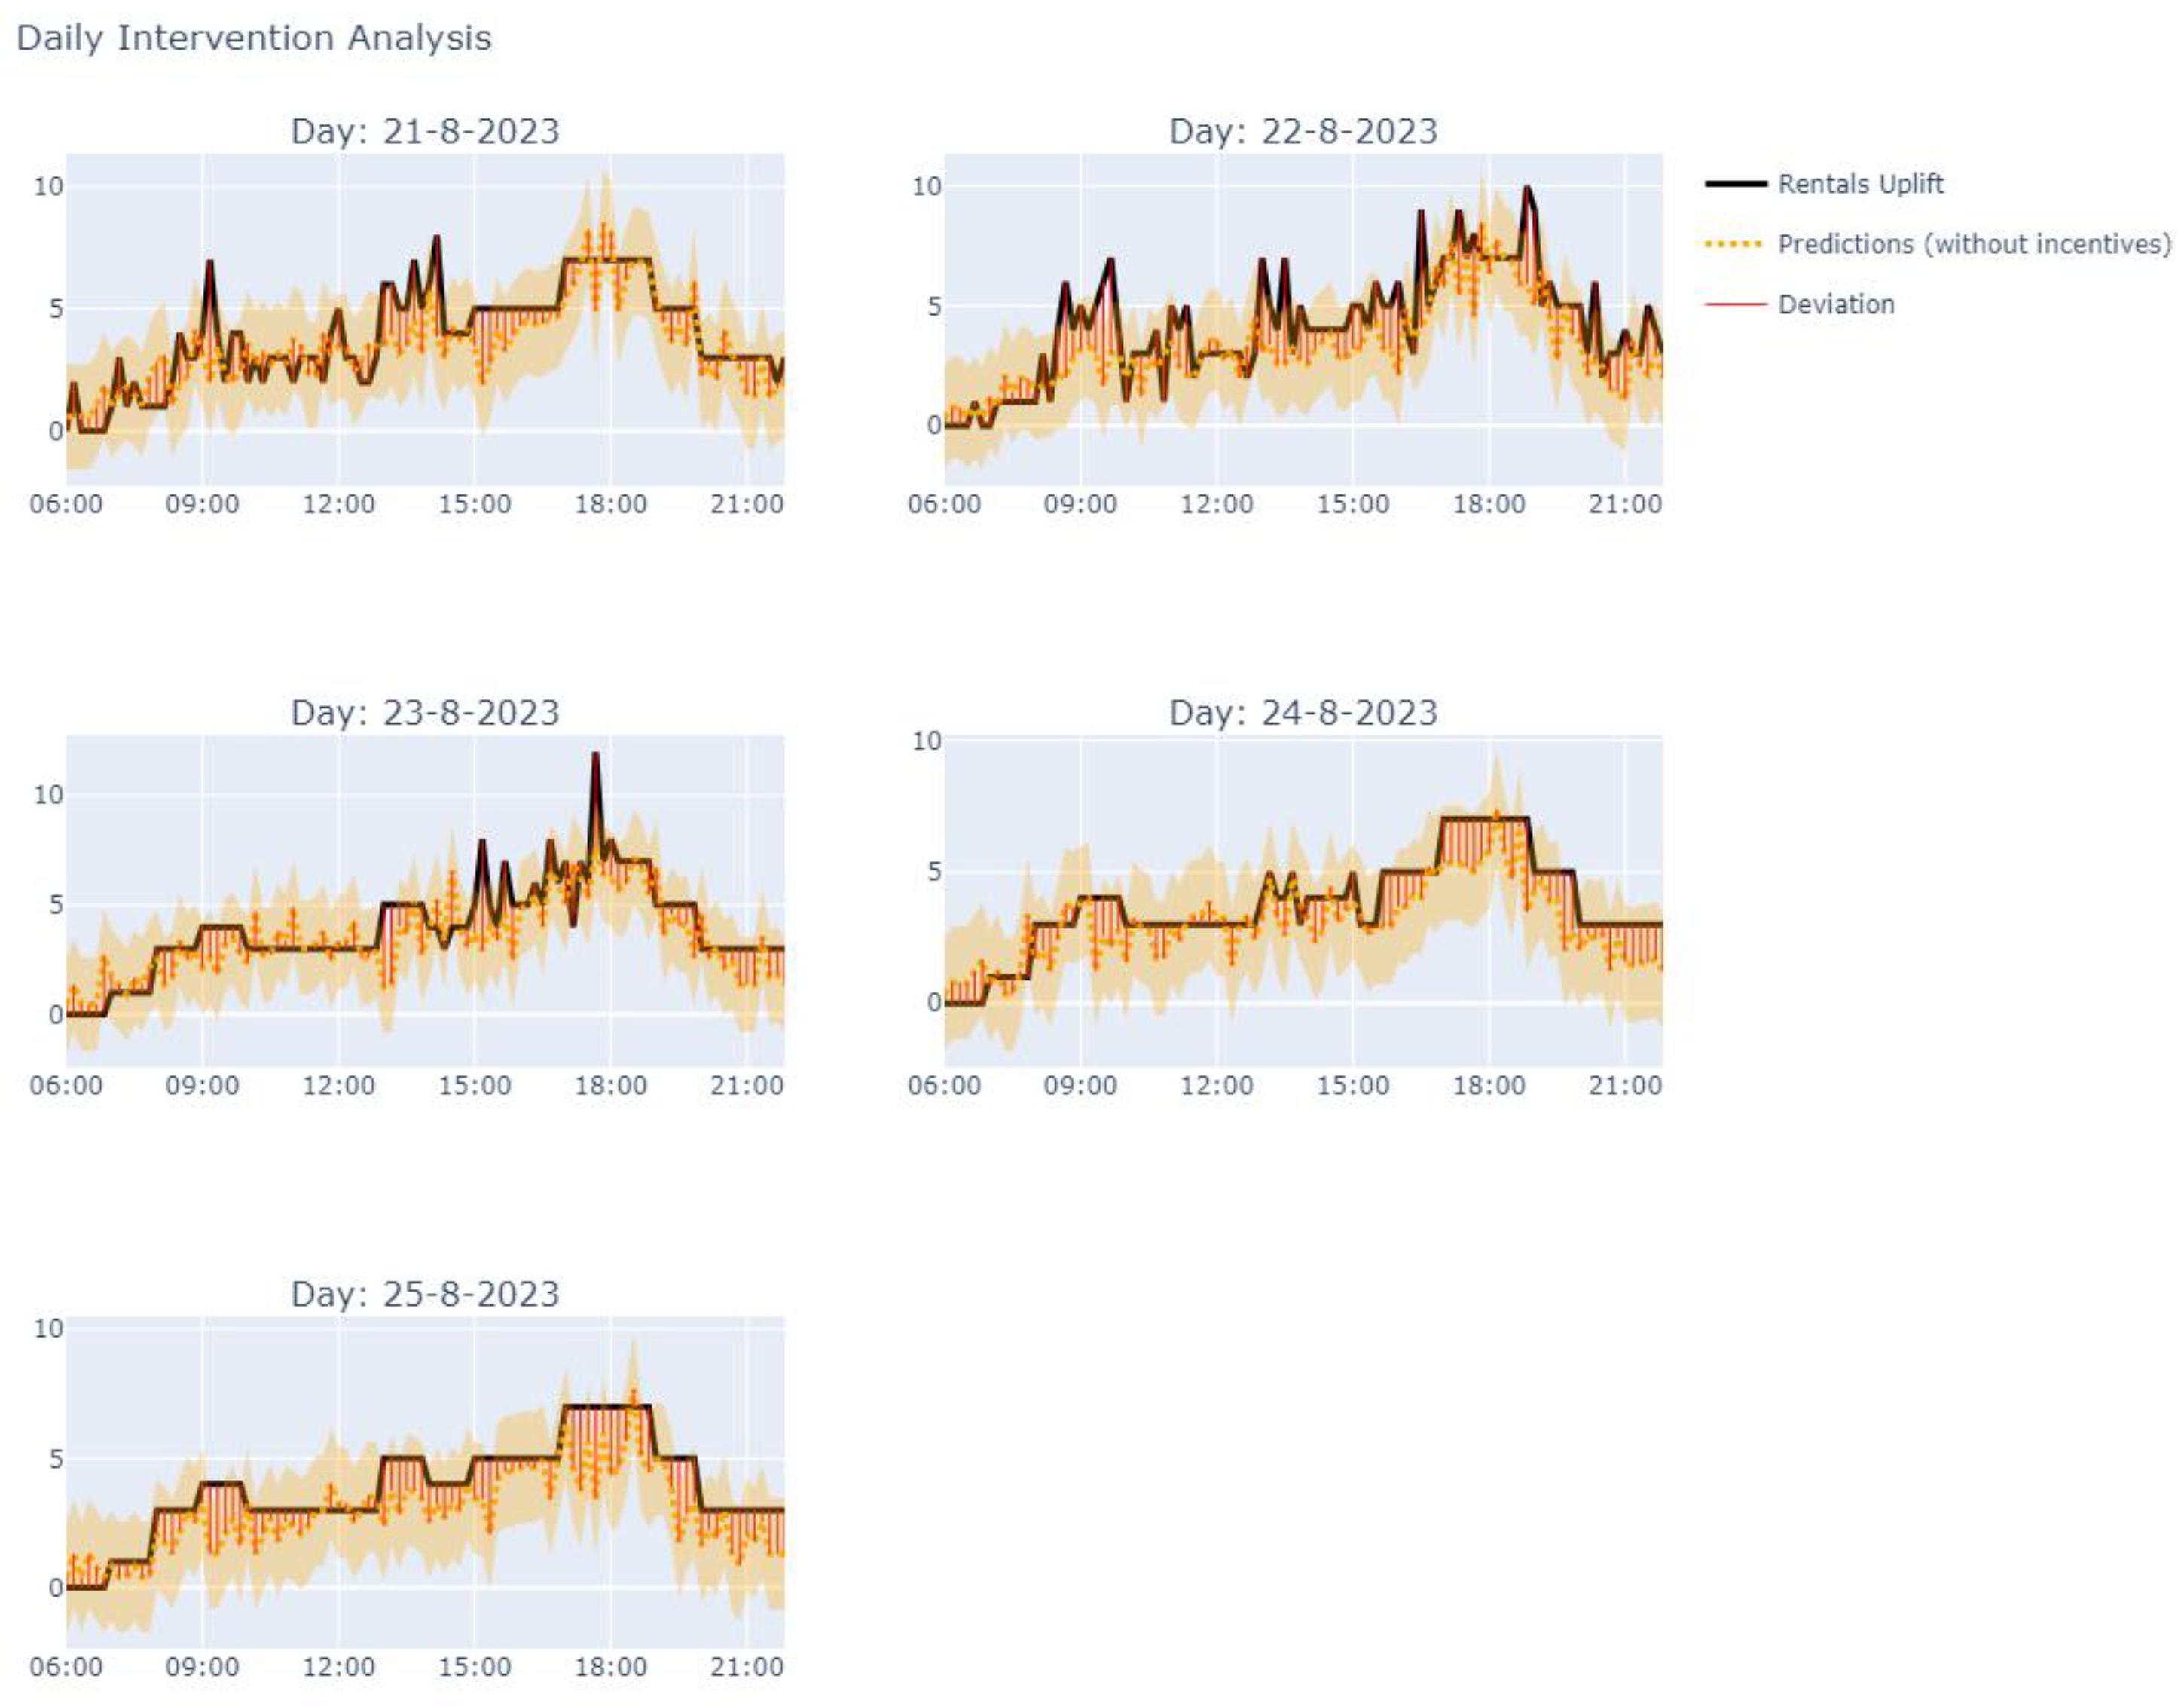
Figure 10.
Stocks and flows structure.
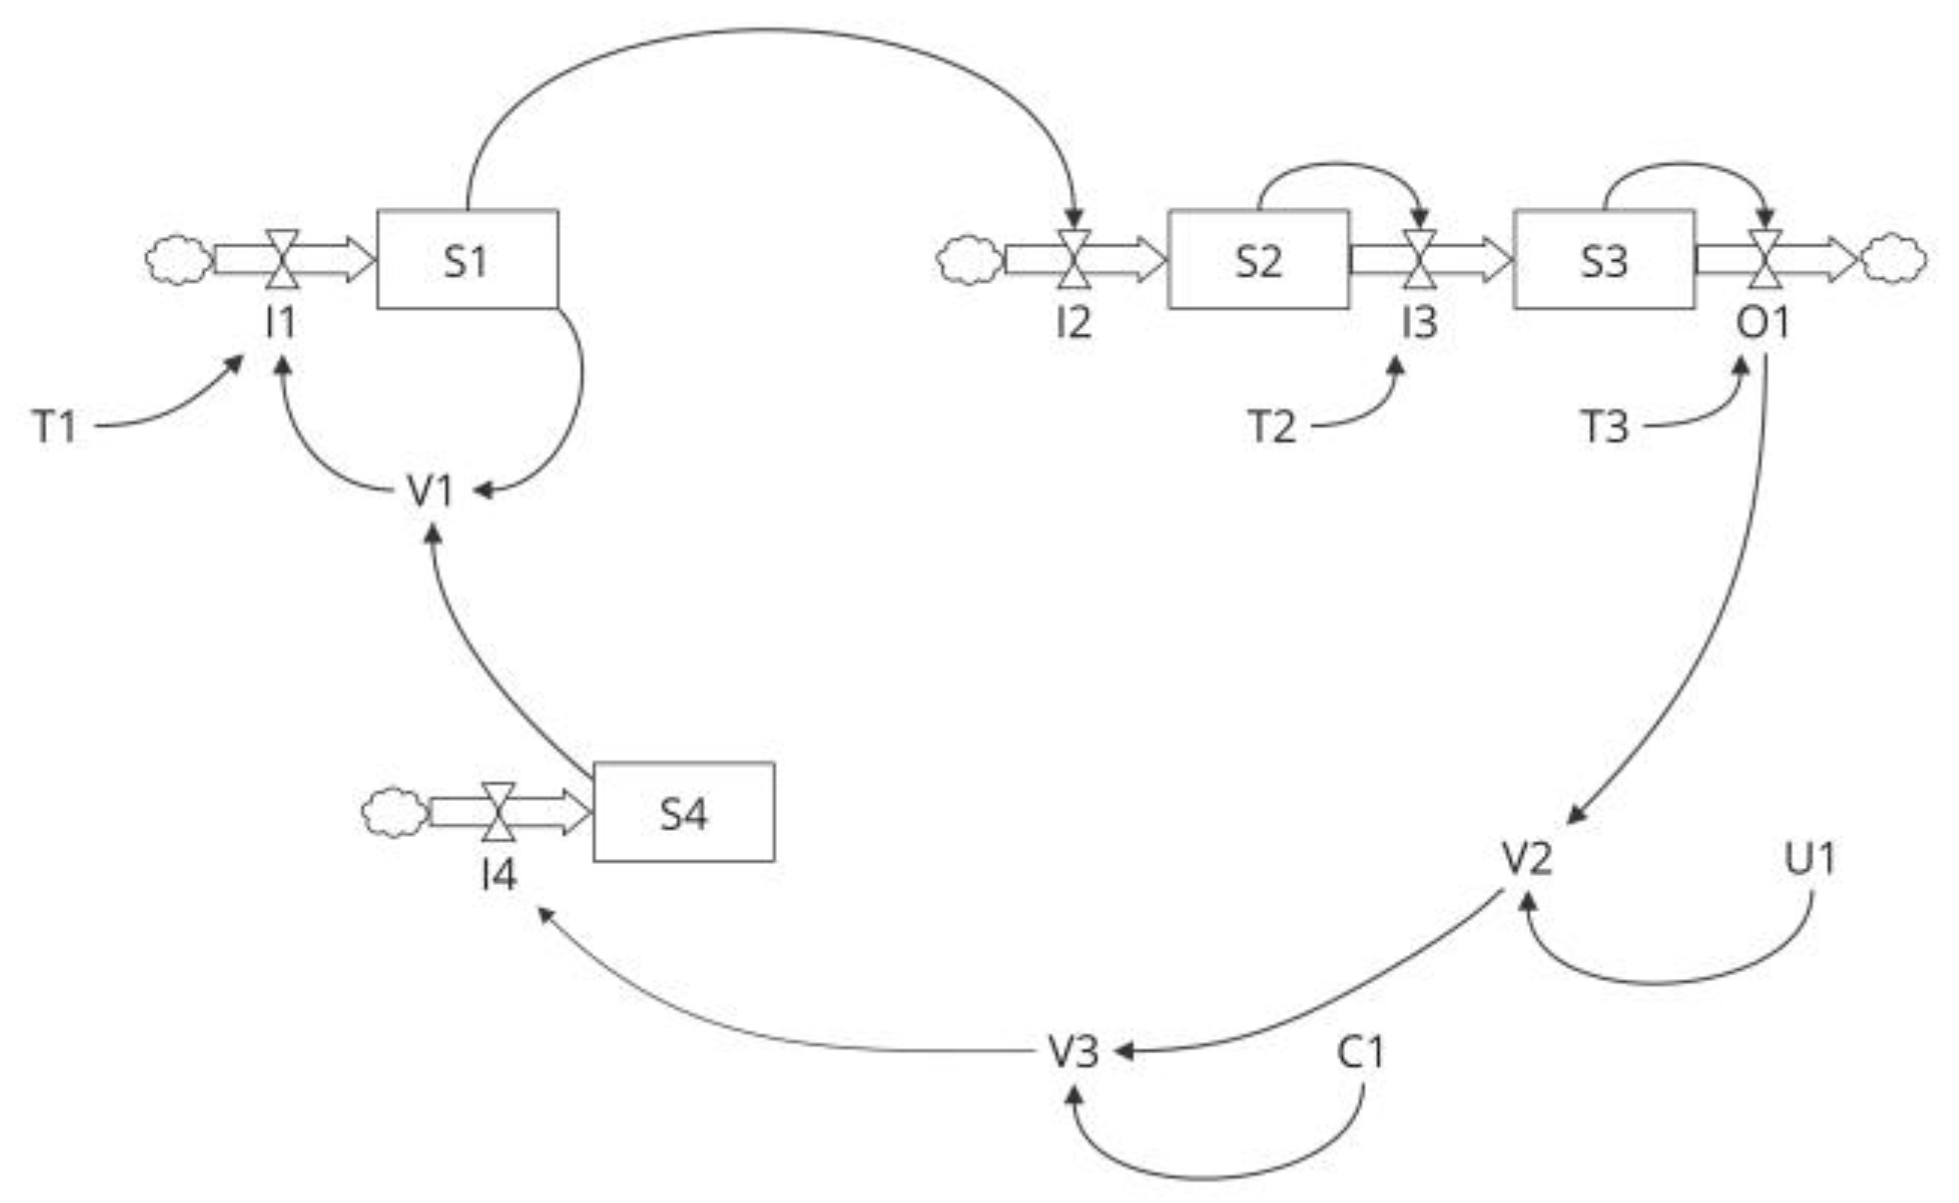
Figure 11.
Bike-share model, inventory management.
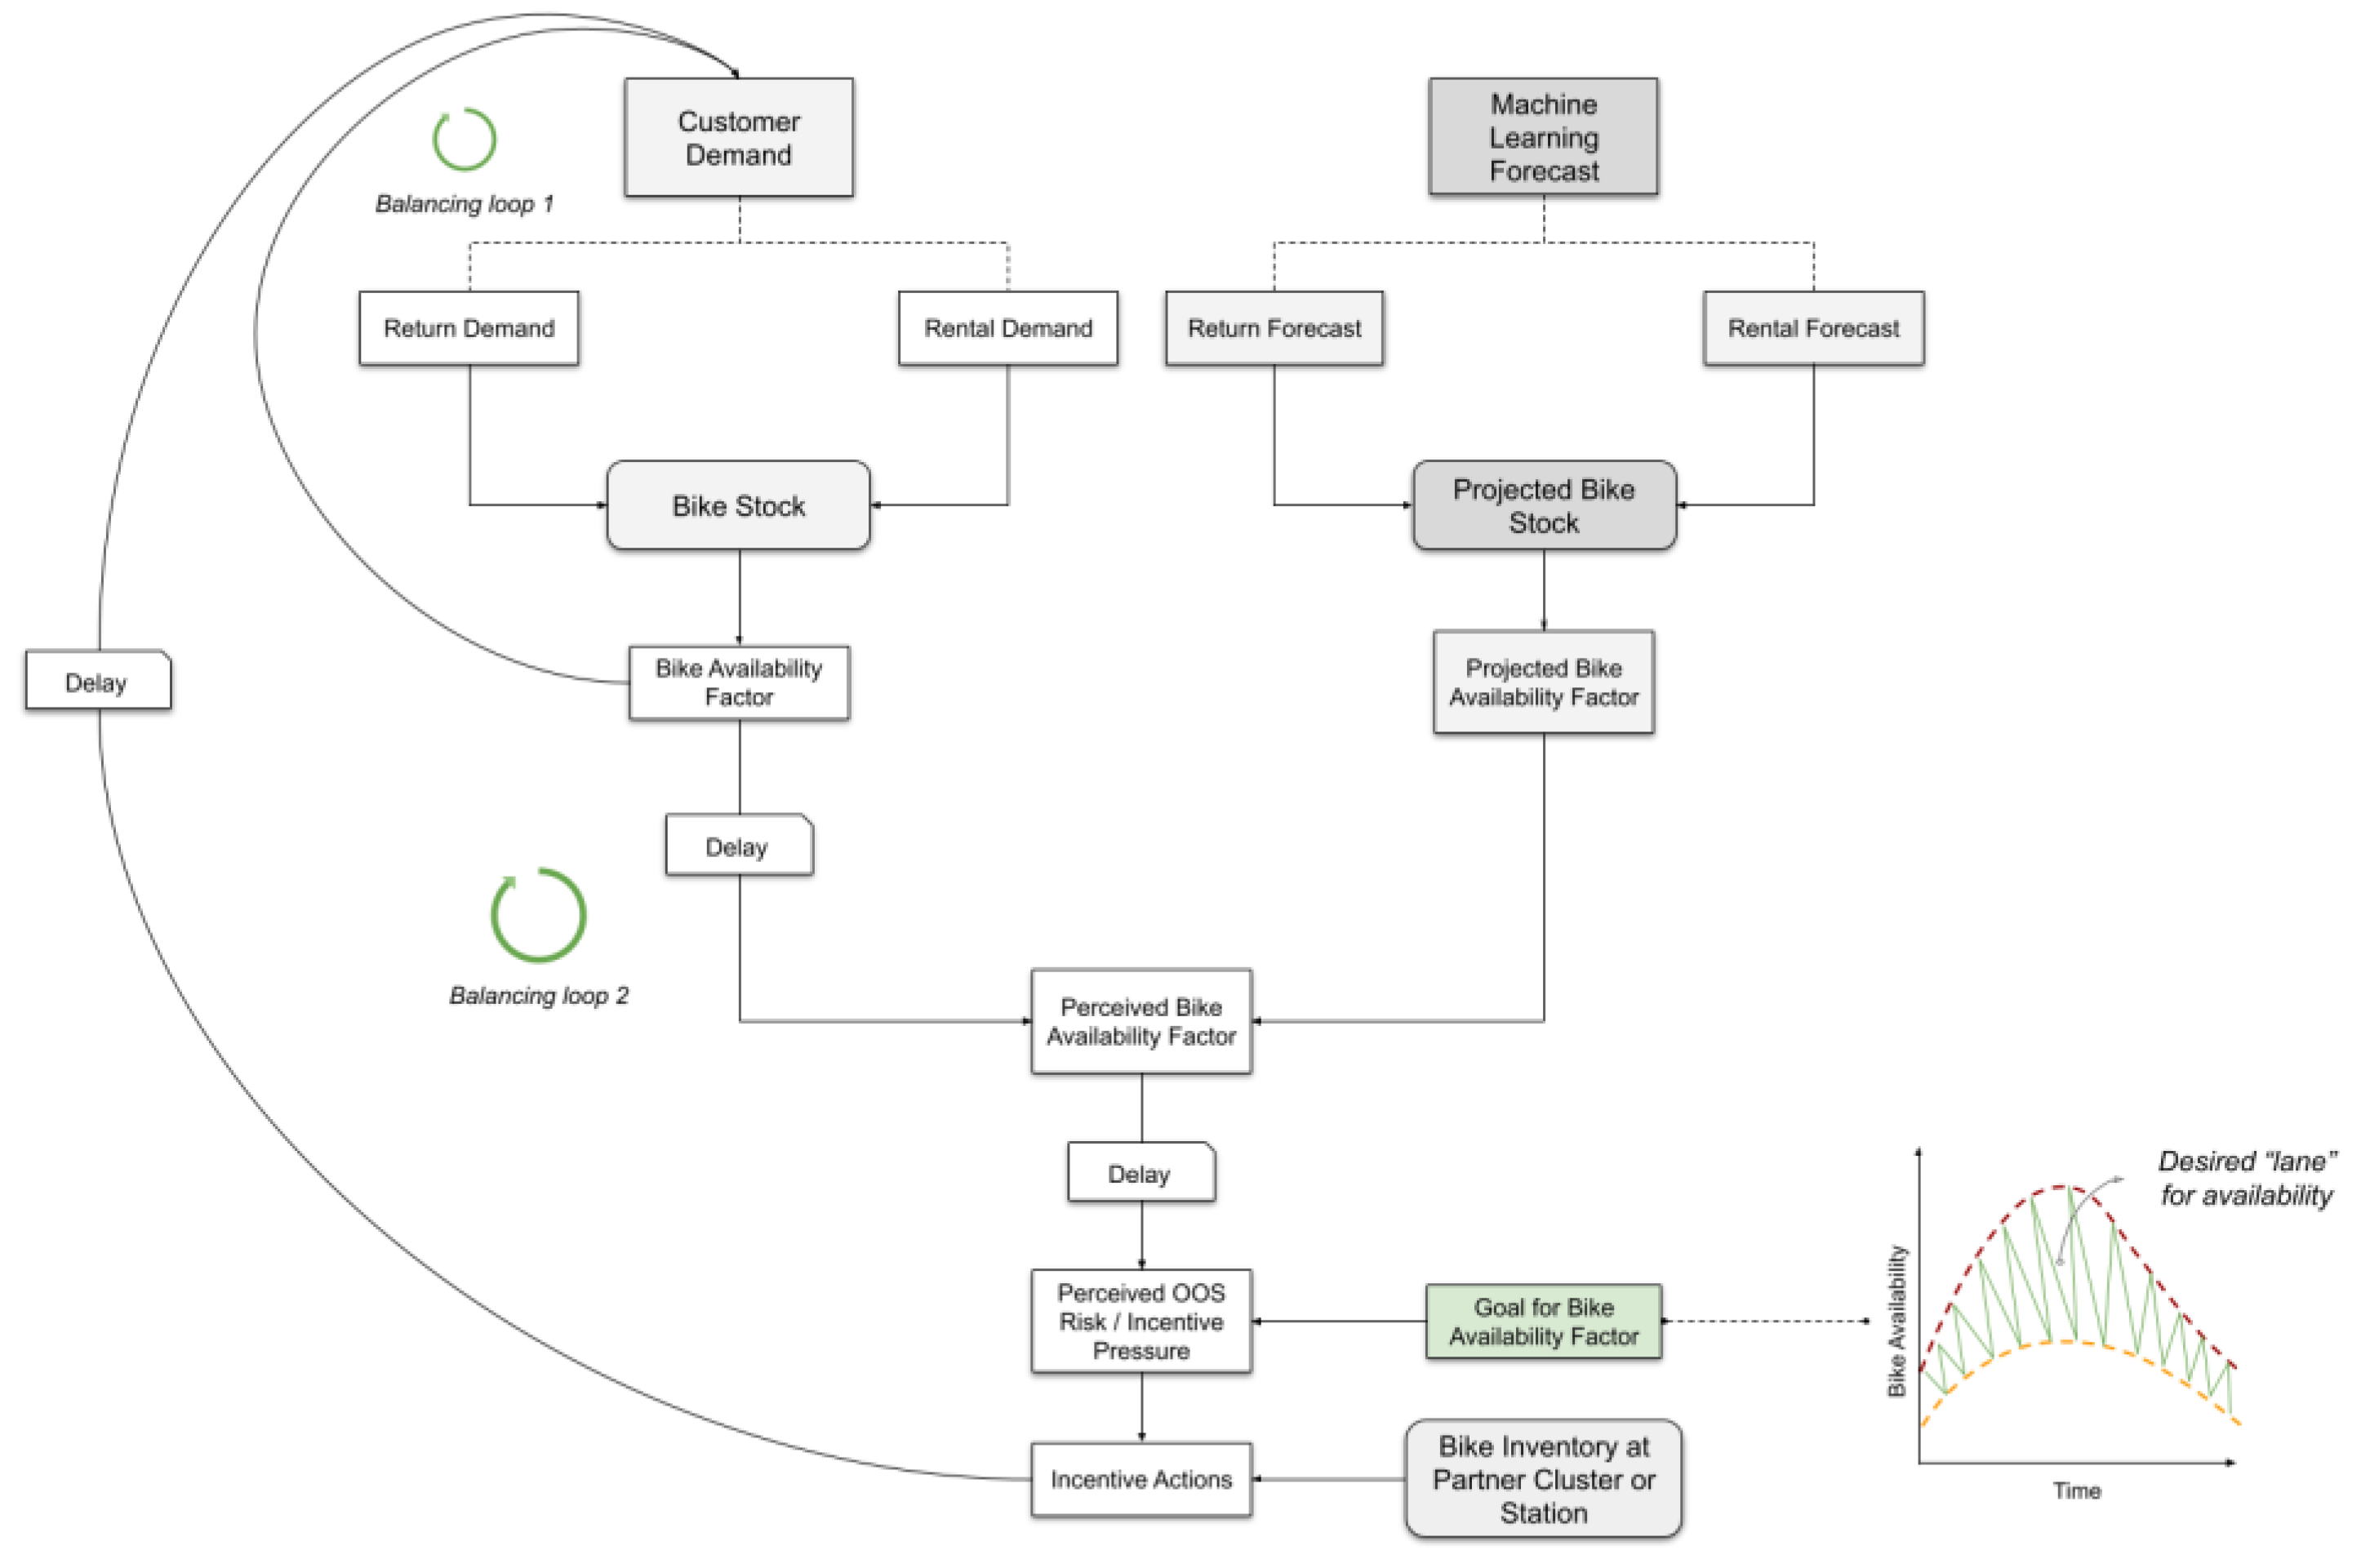
Figure 12.
Stocks and flows (single station, zoomed in on returns).
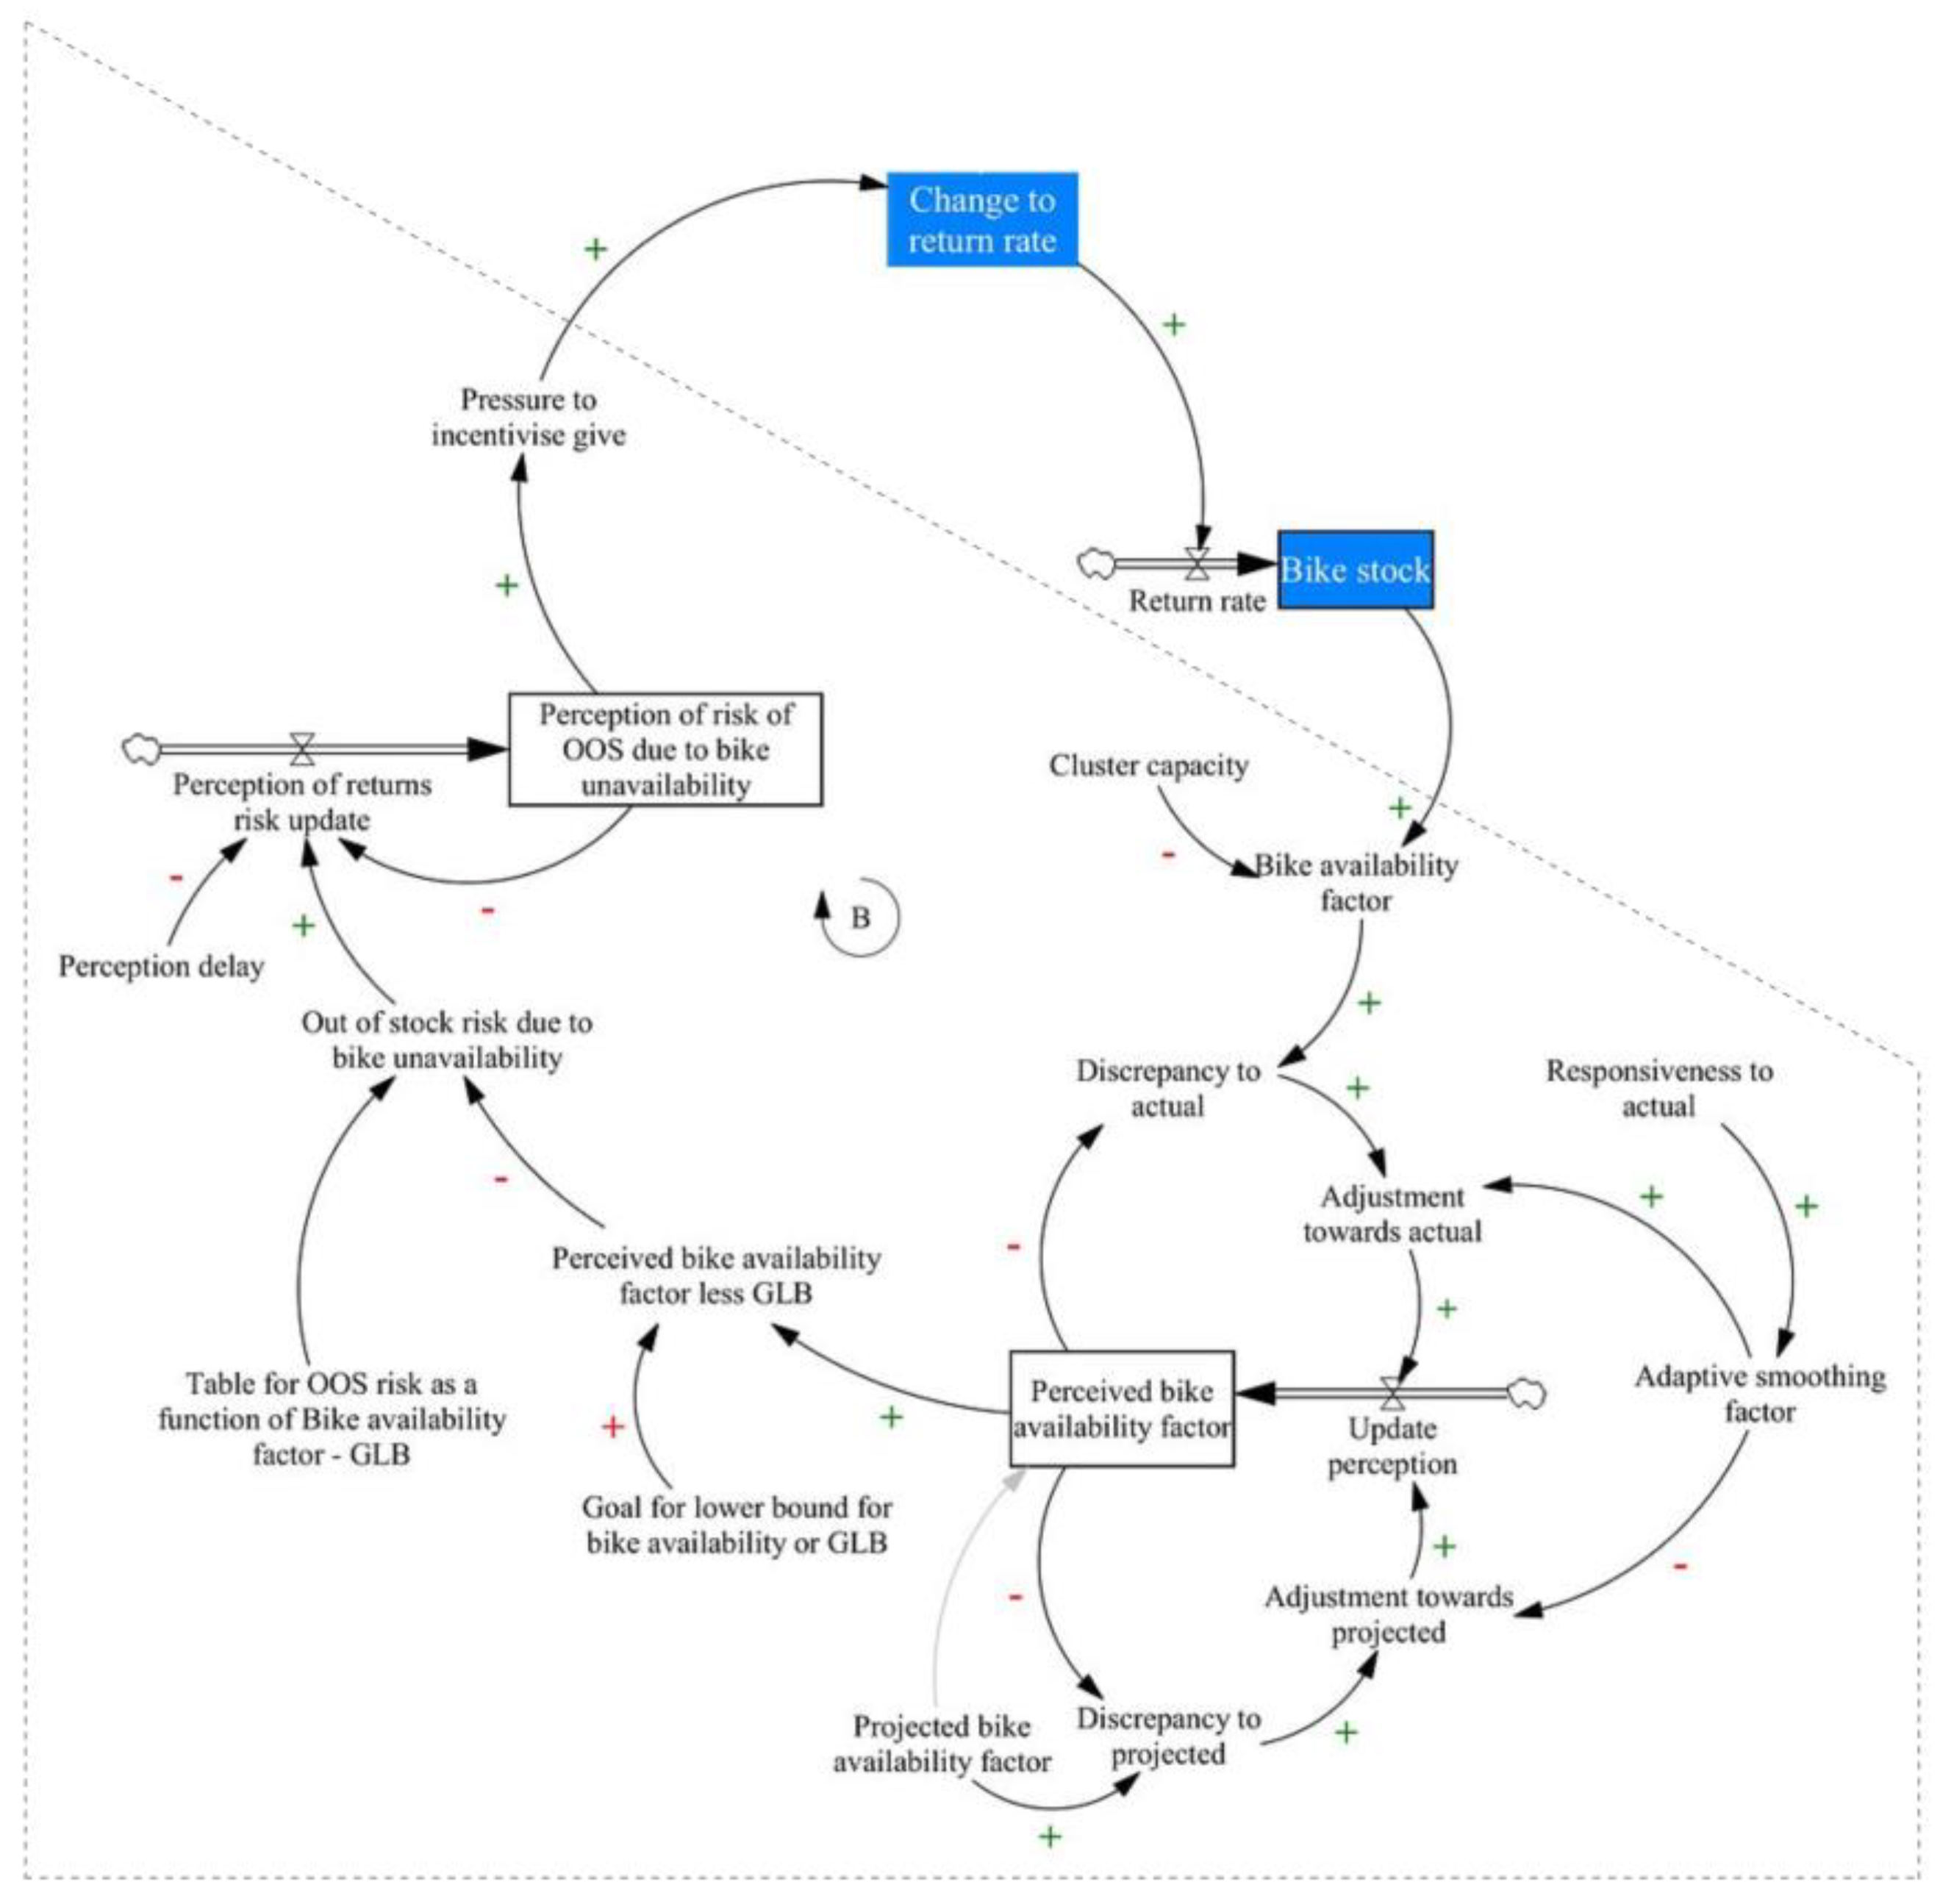
Figure 13.
Online planning approach.
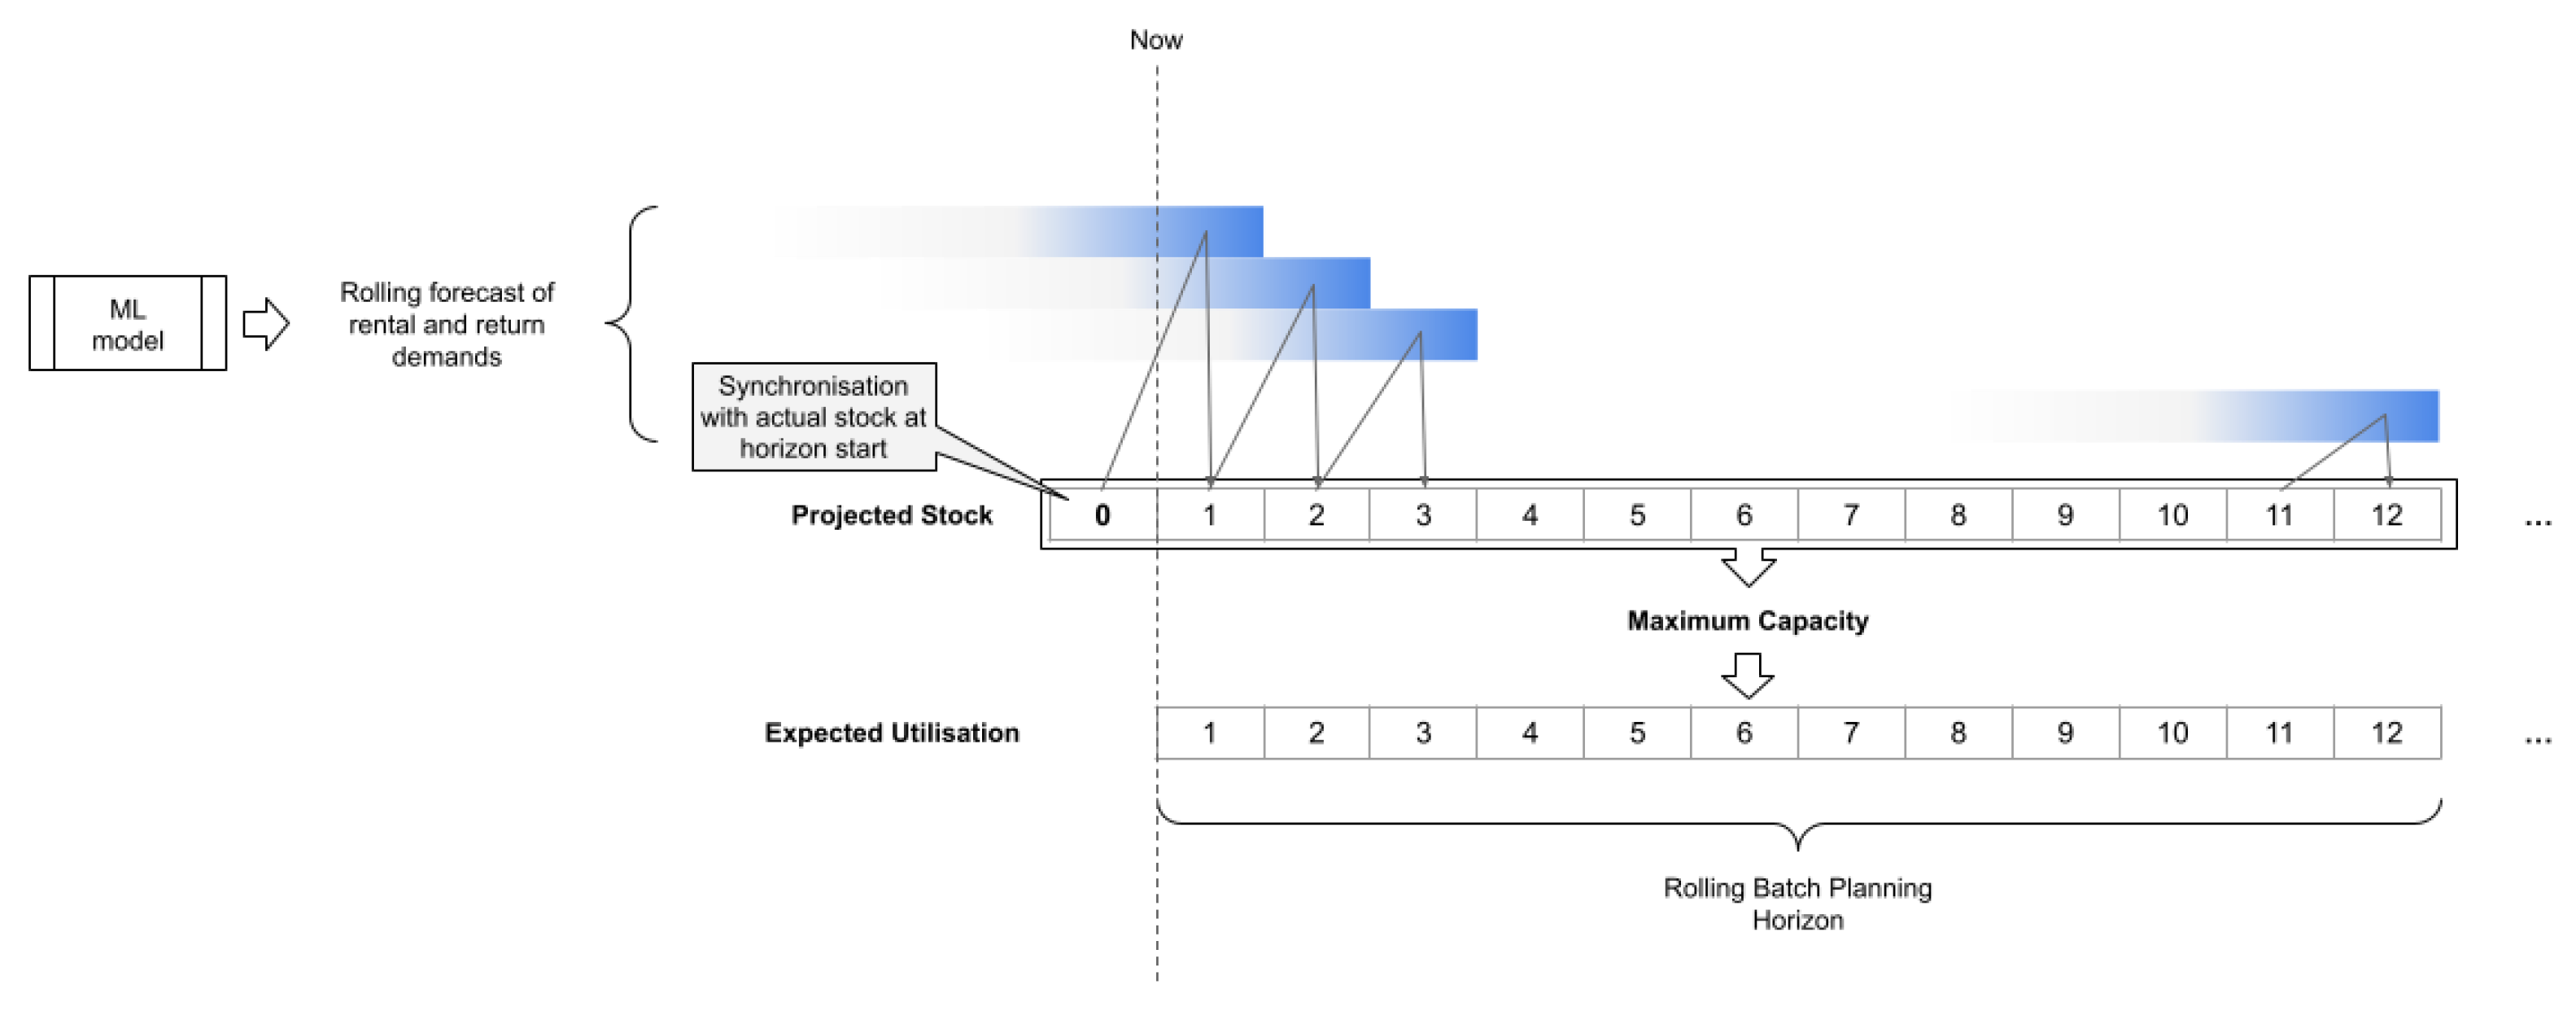
Figure 14.
Comparing the impact of responsiveness on availability factor curves.
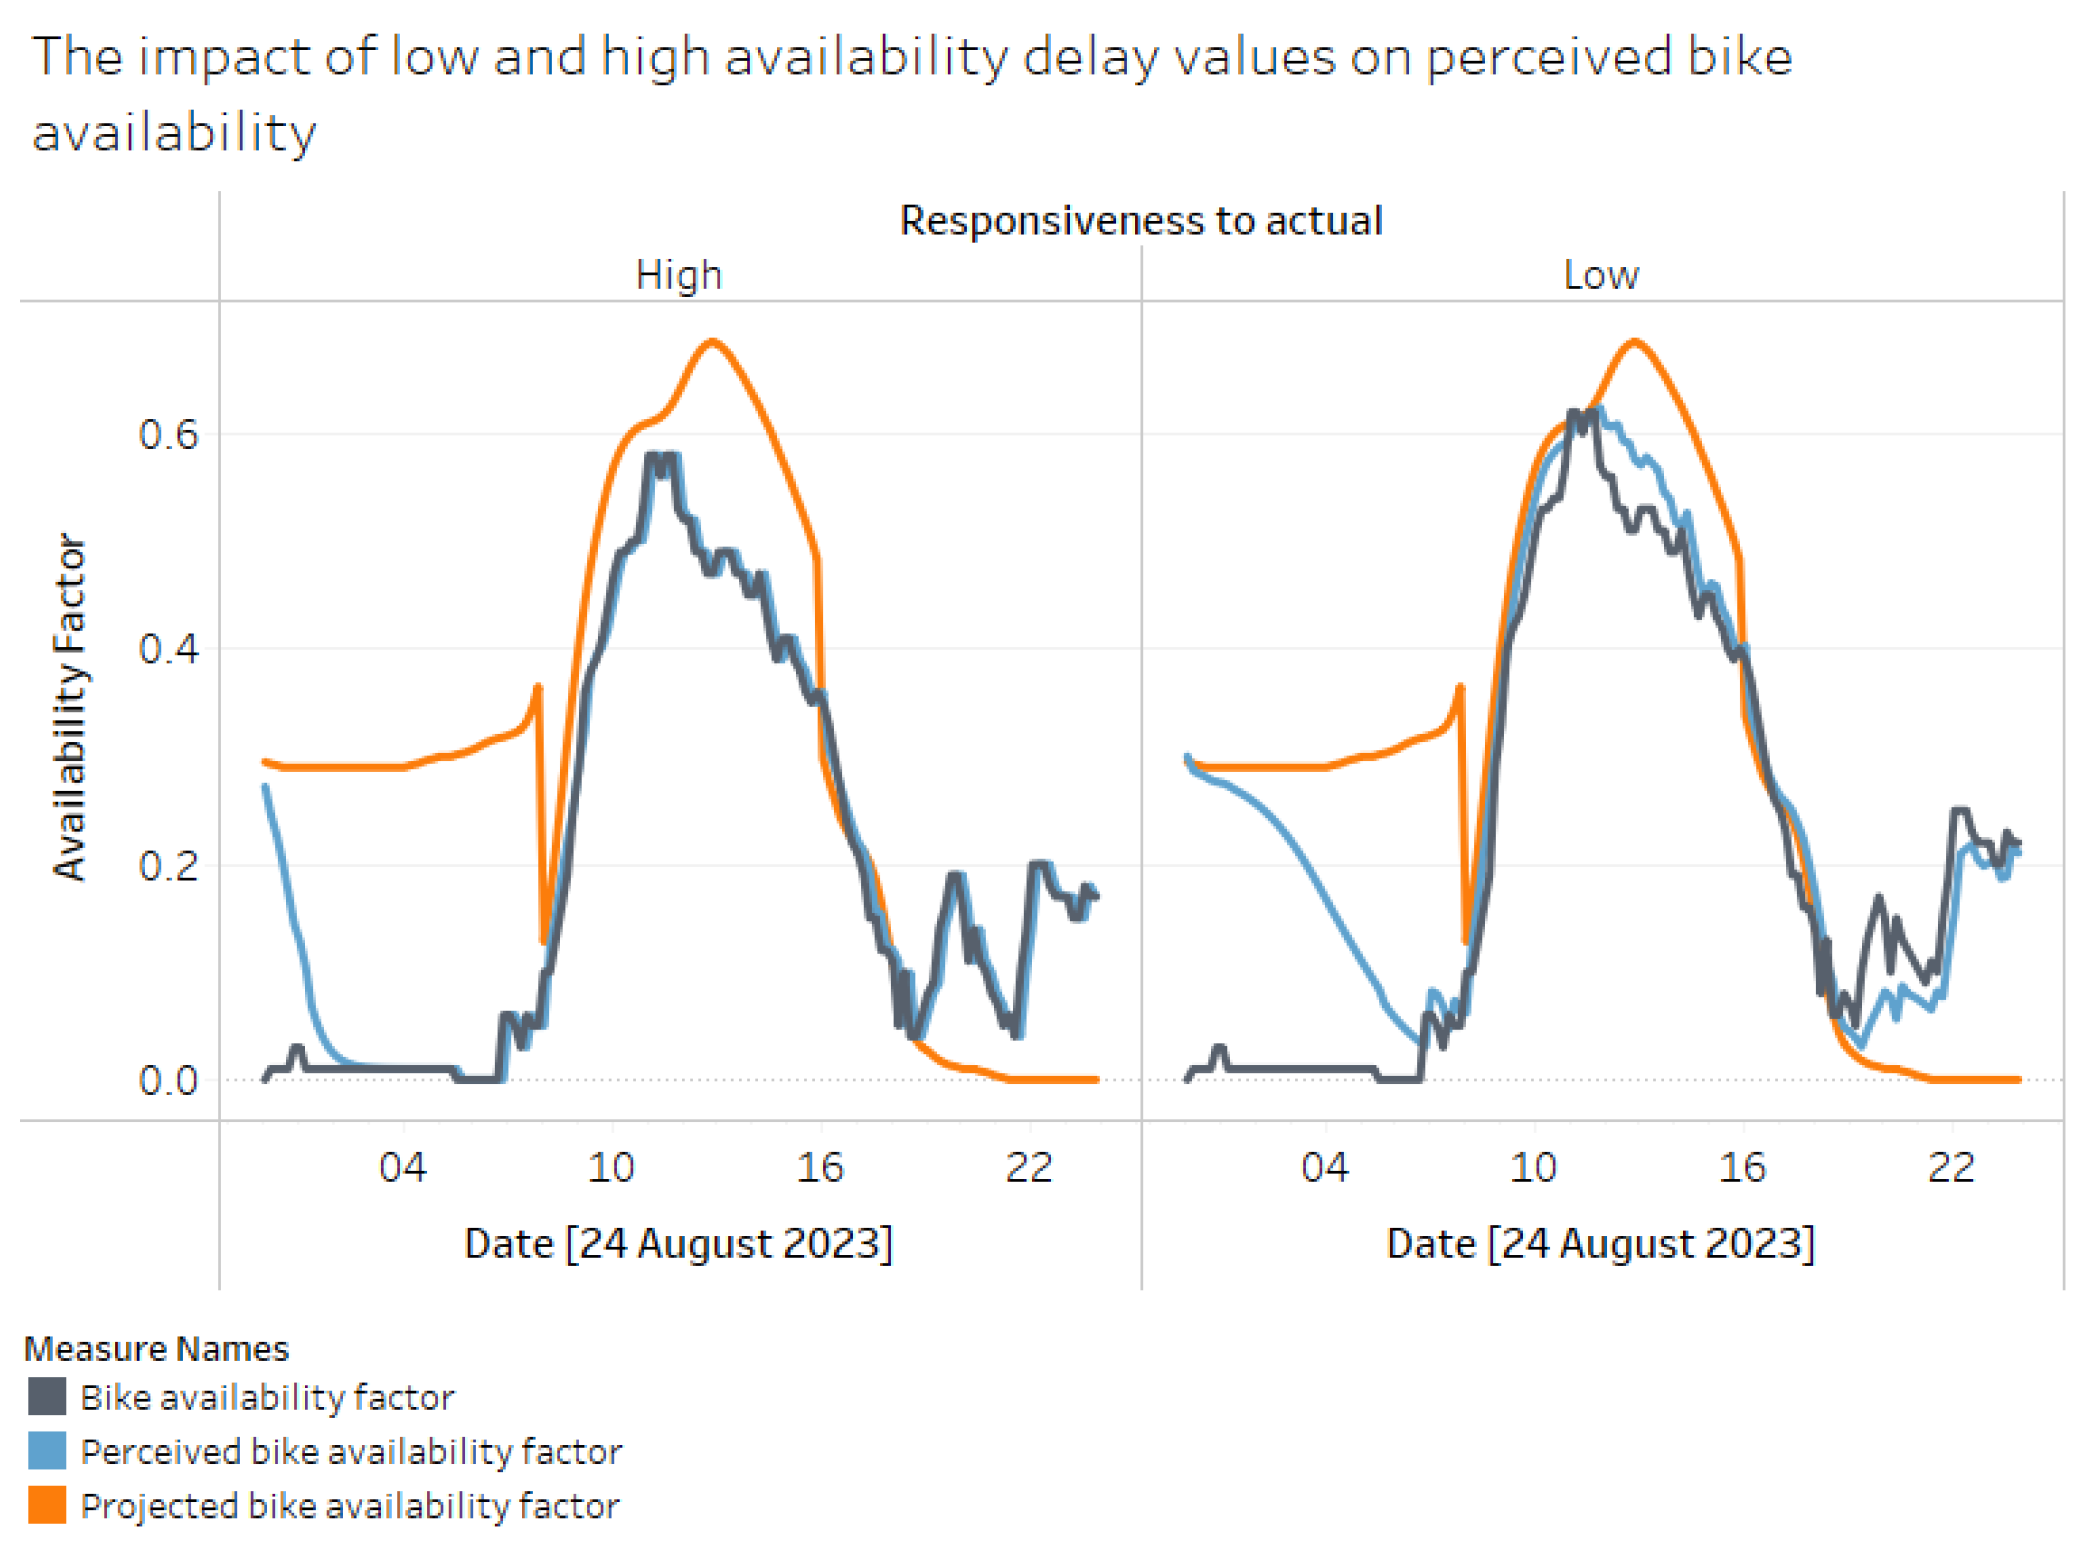
Figure 15.
Comparing the impact of responsiveness on risk perception.
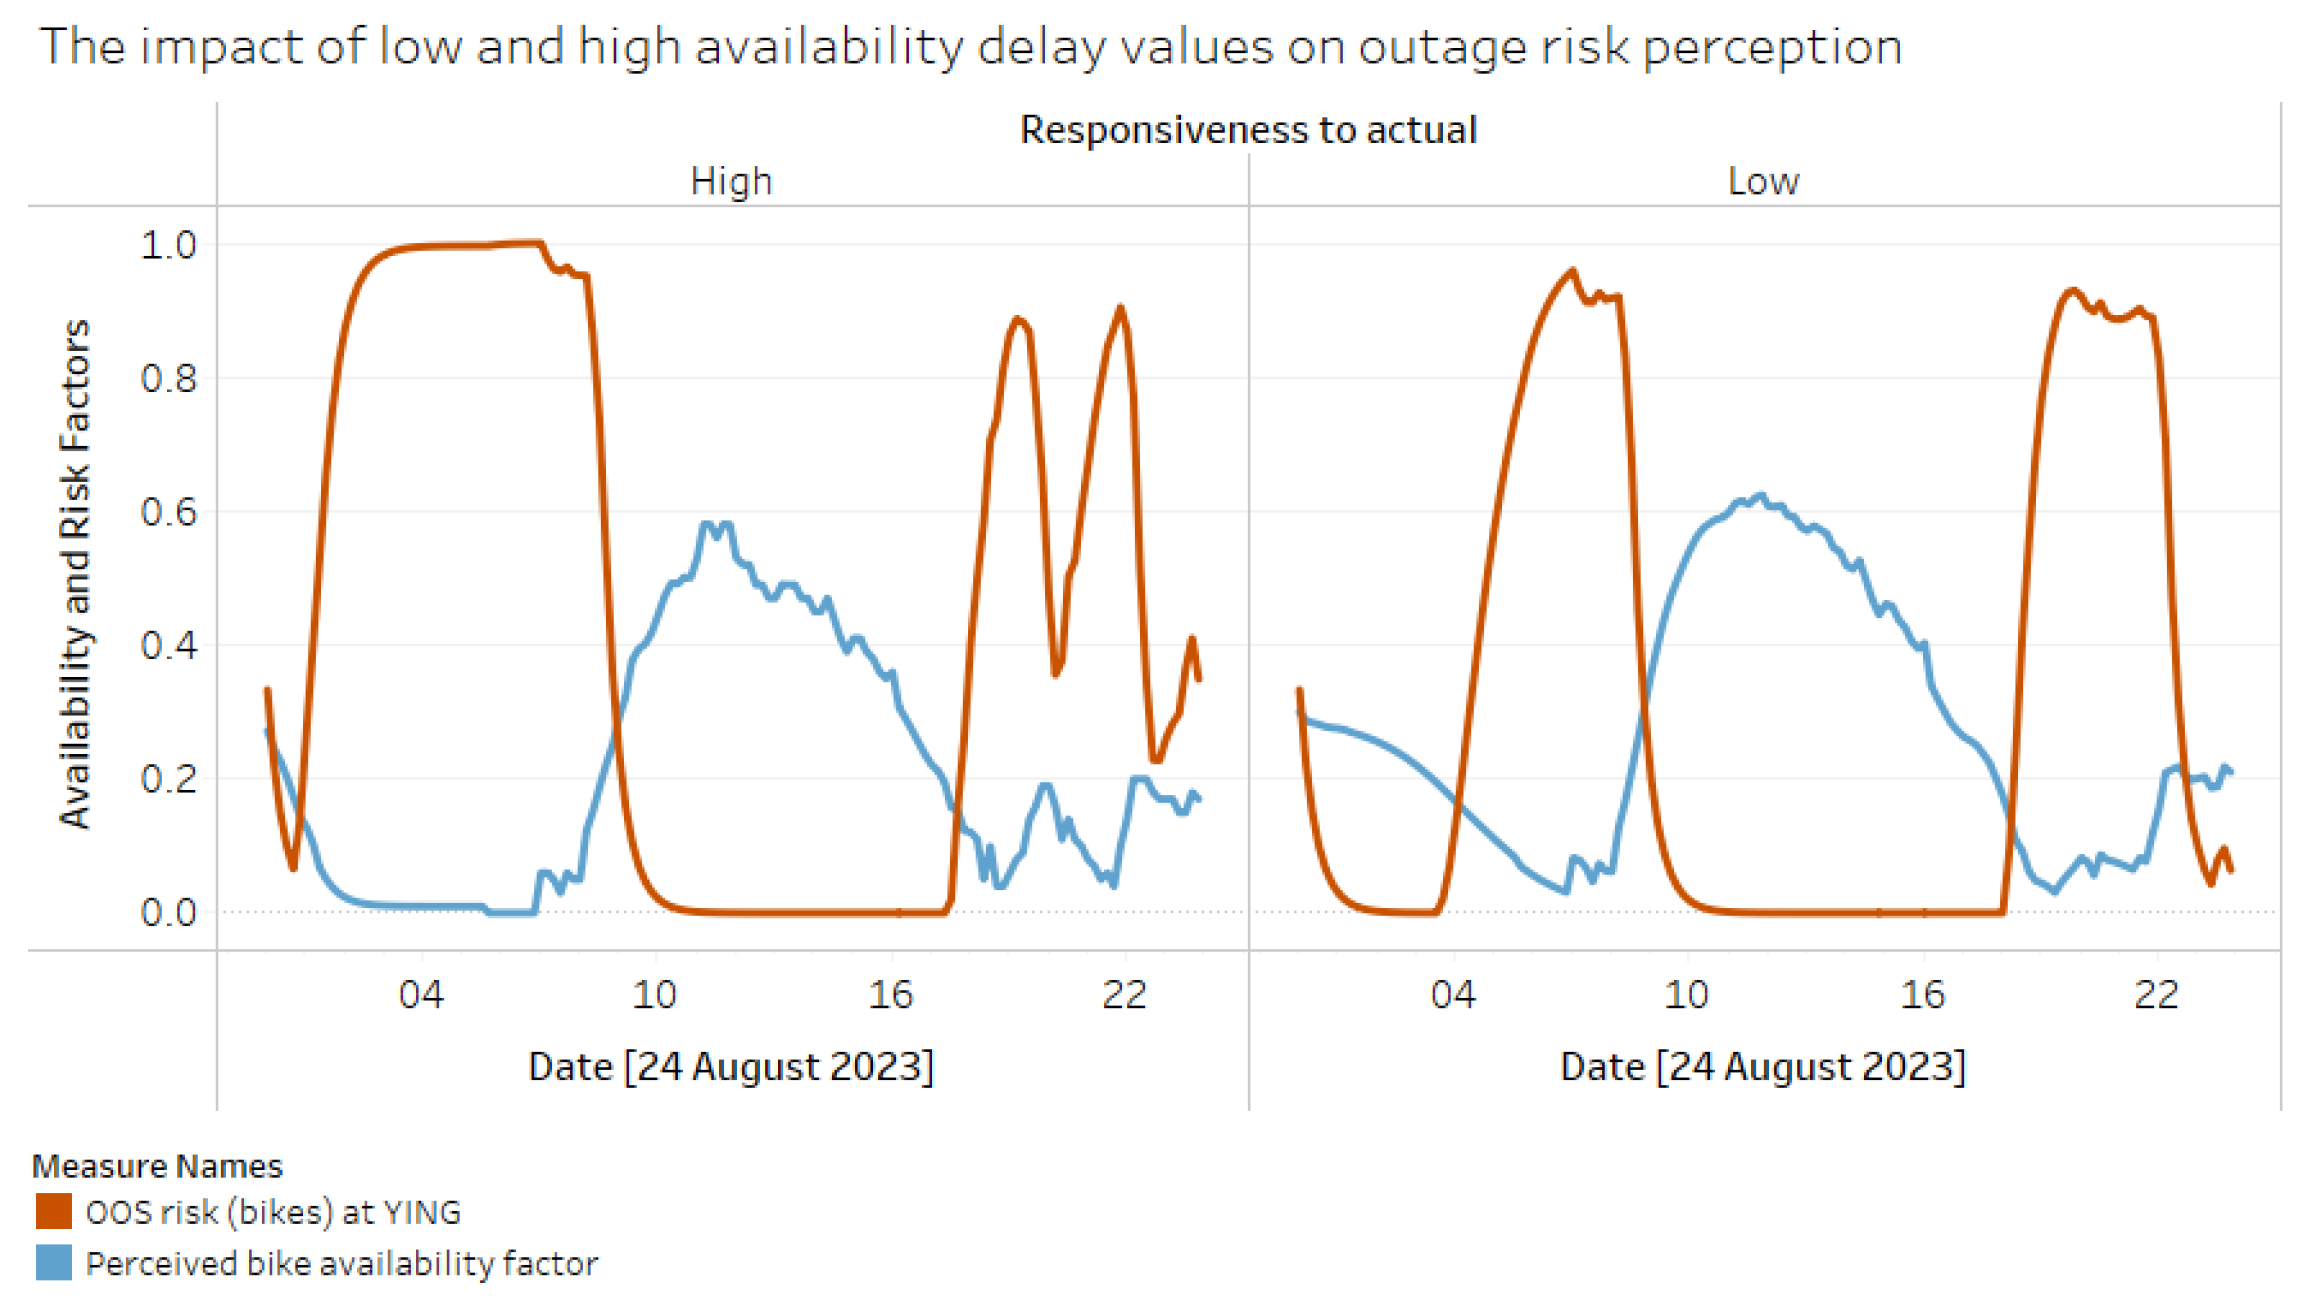
Figure 16.
Partial testing model.
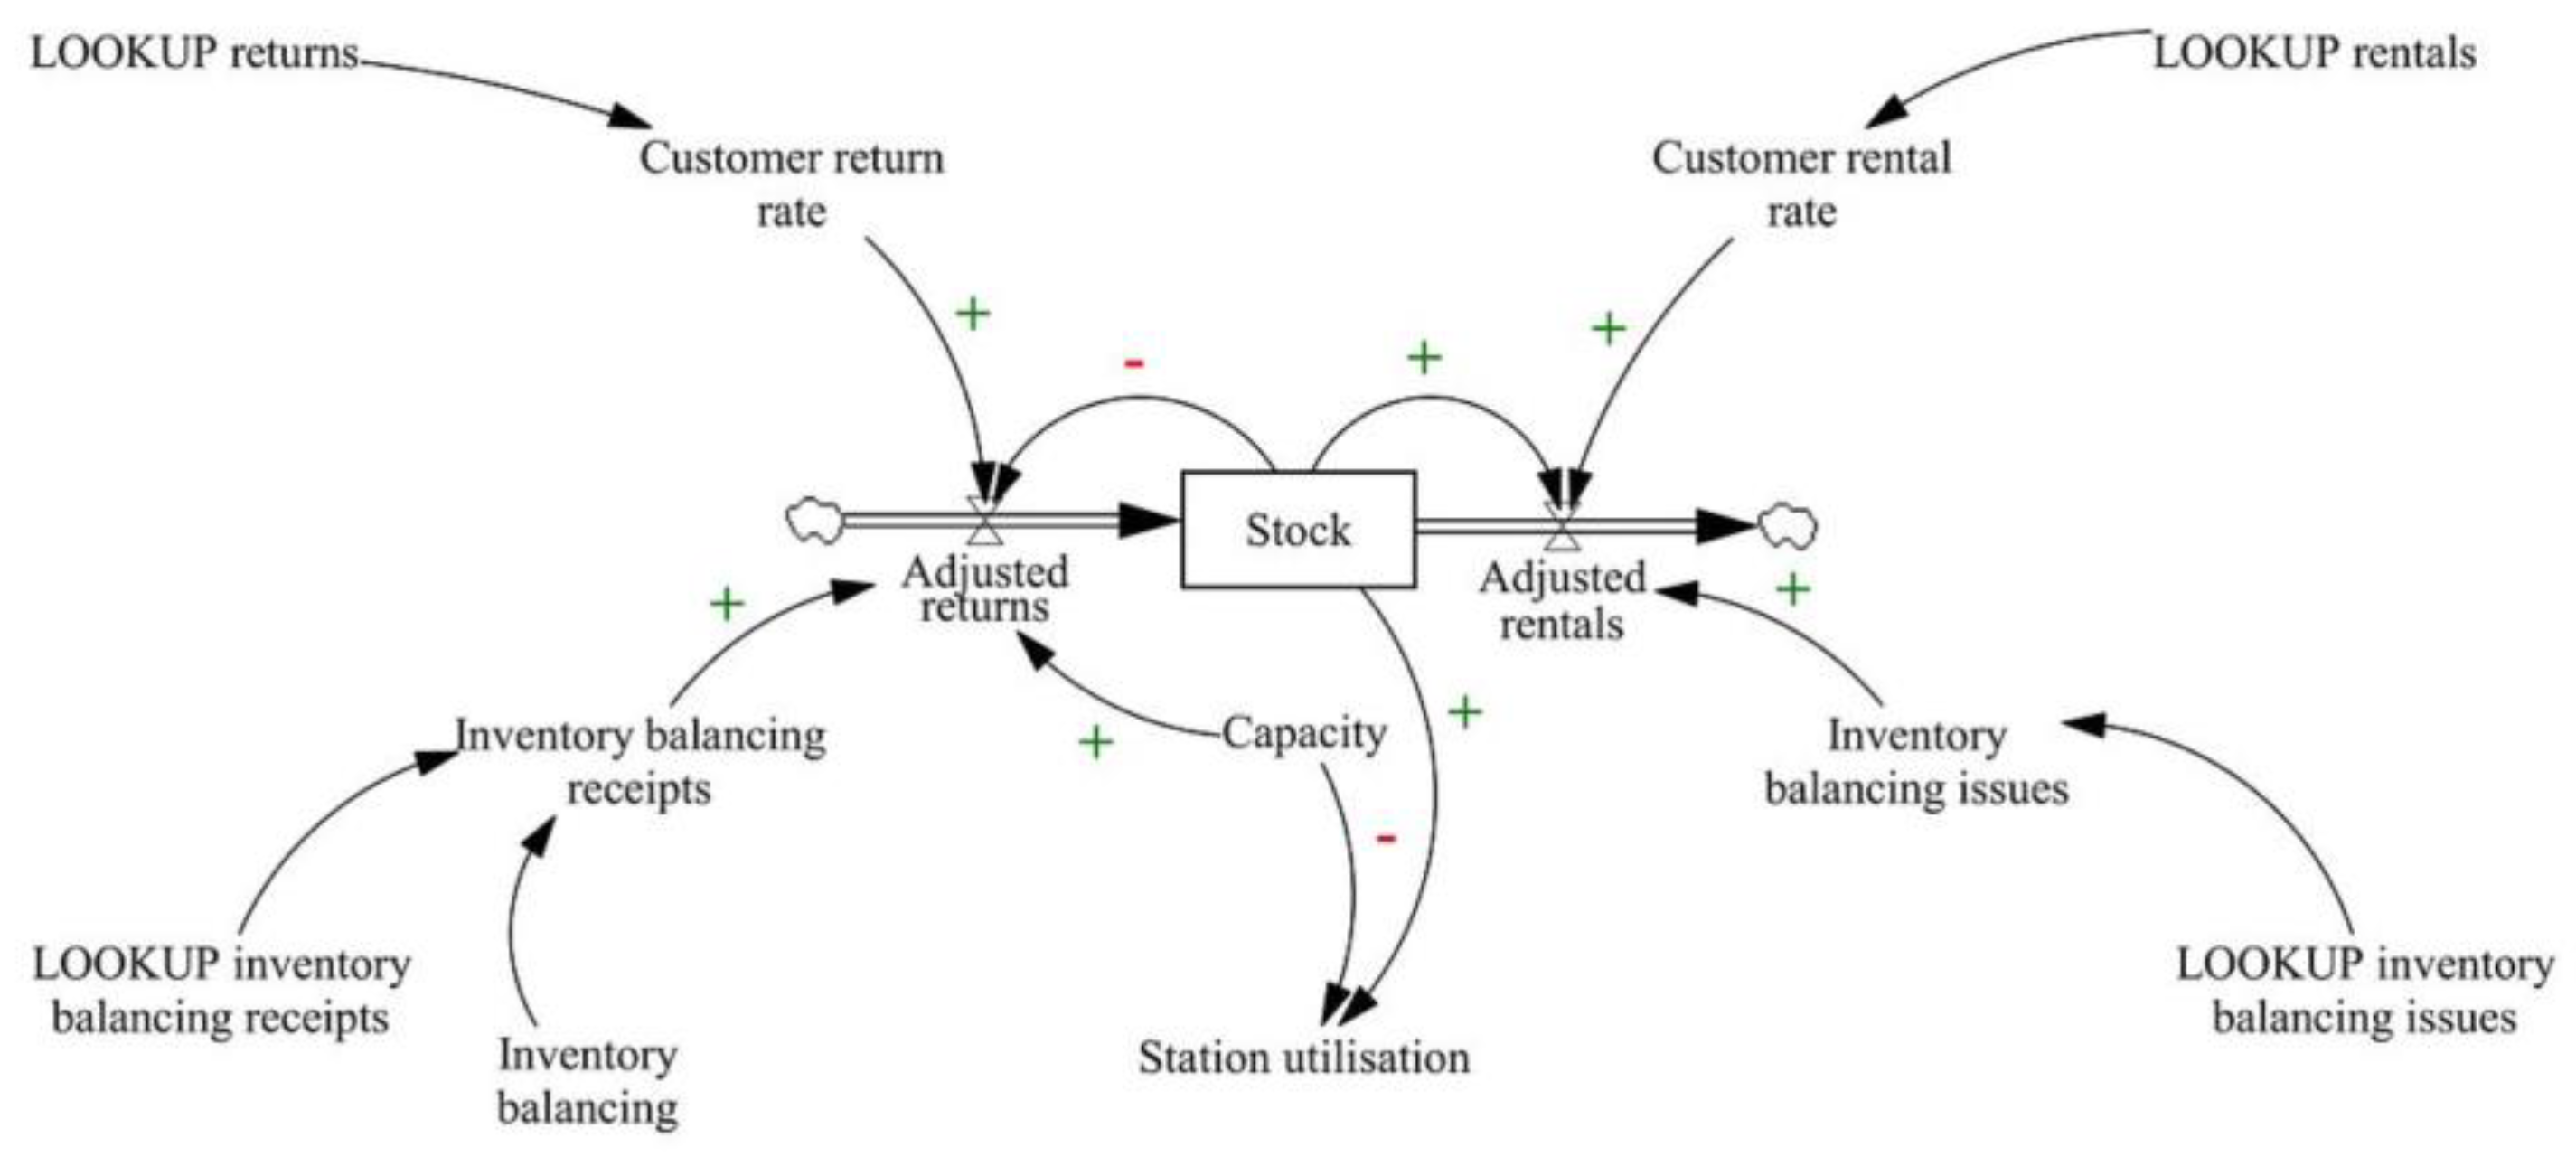
Figure 17.
Partial testing bias correction.
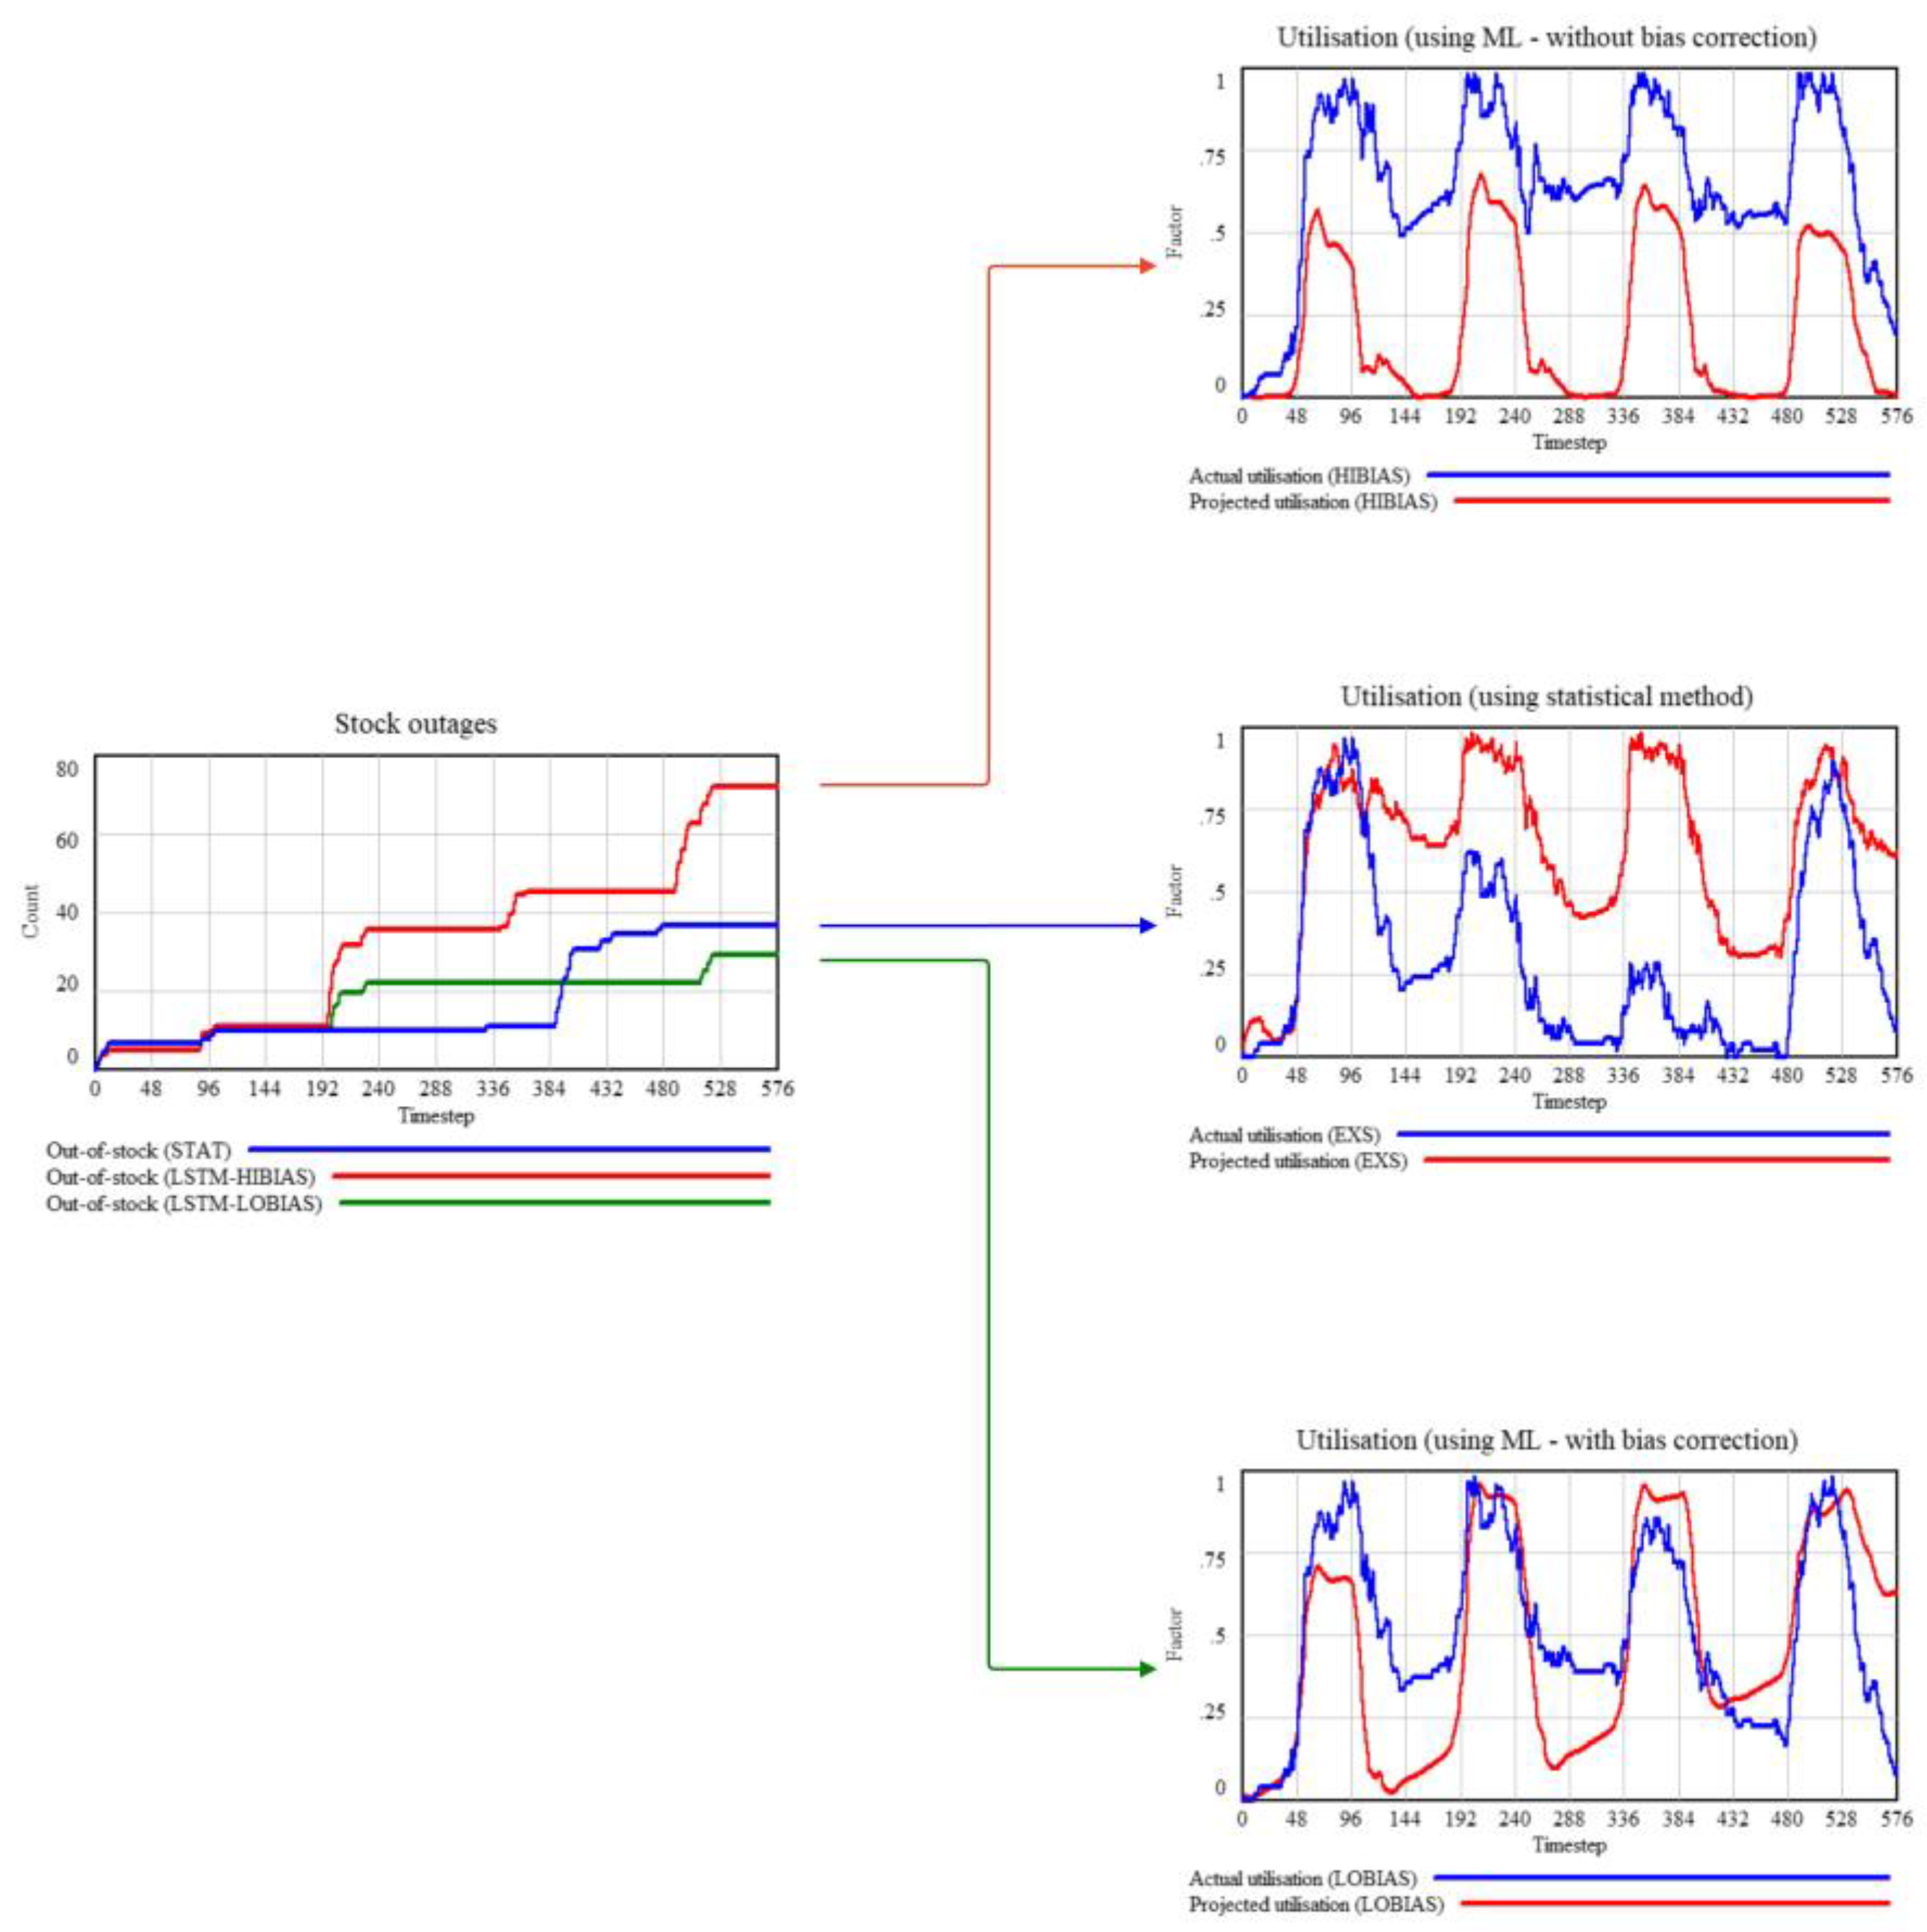
Figure 18.
Demand variability scenarios.
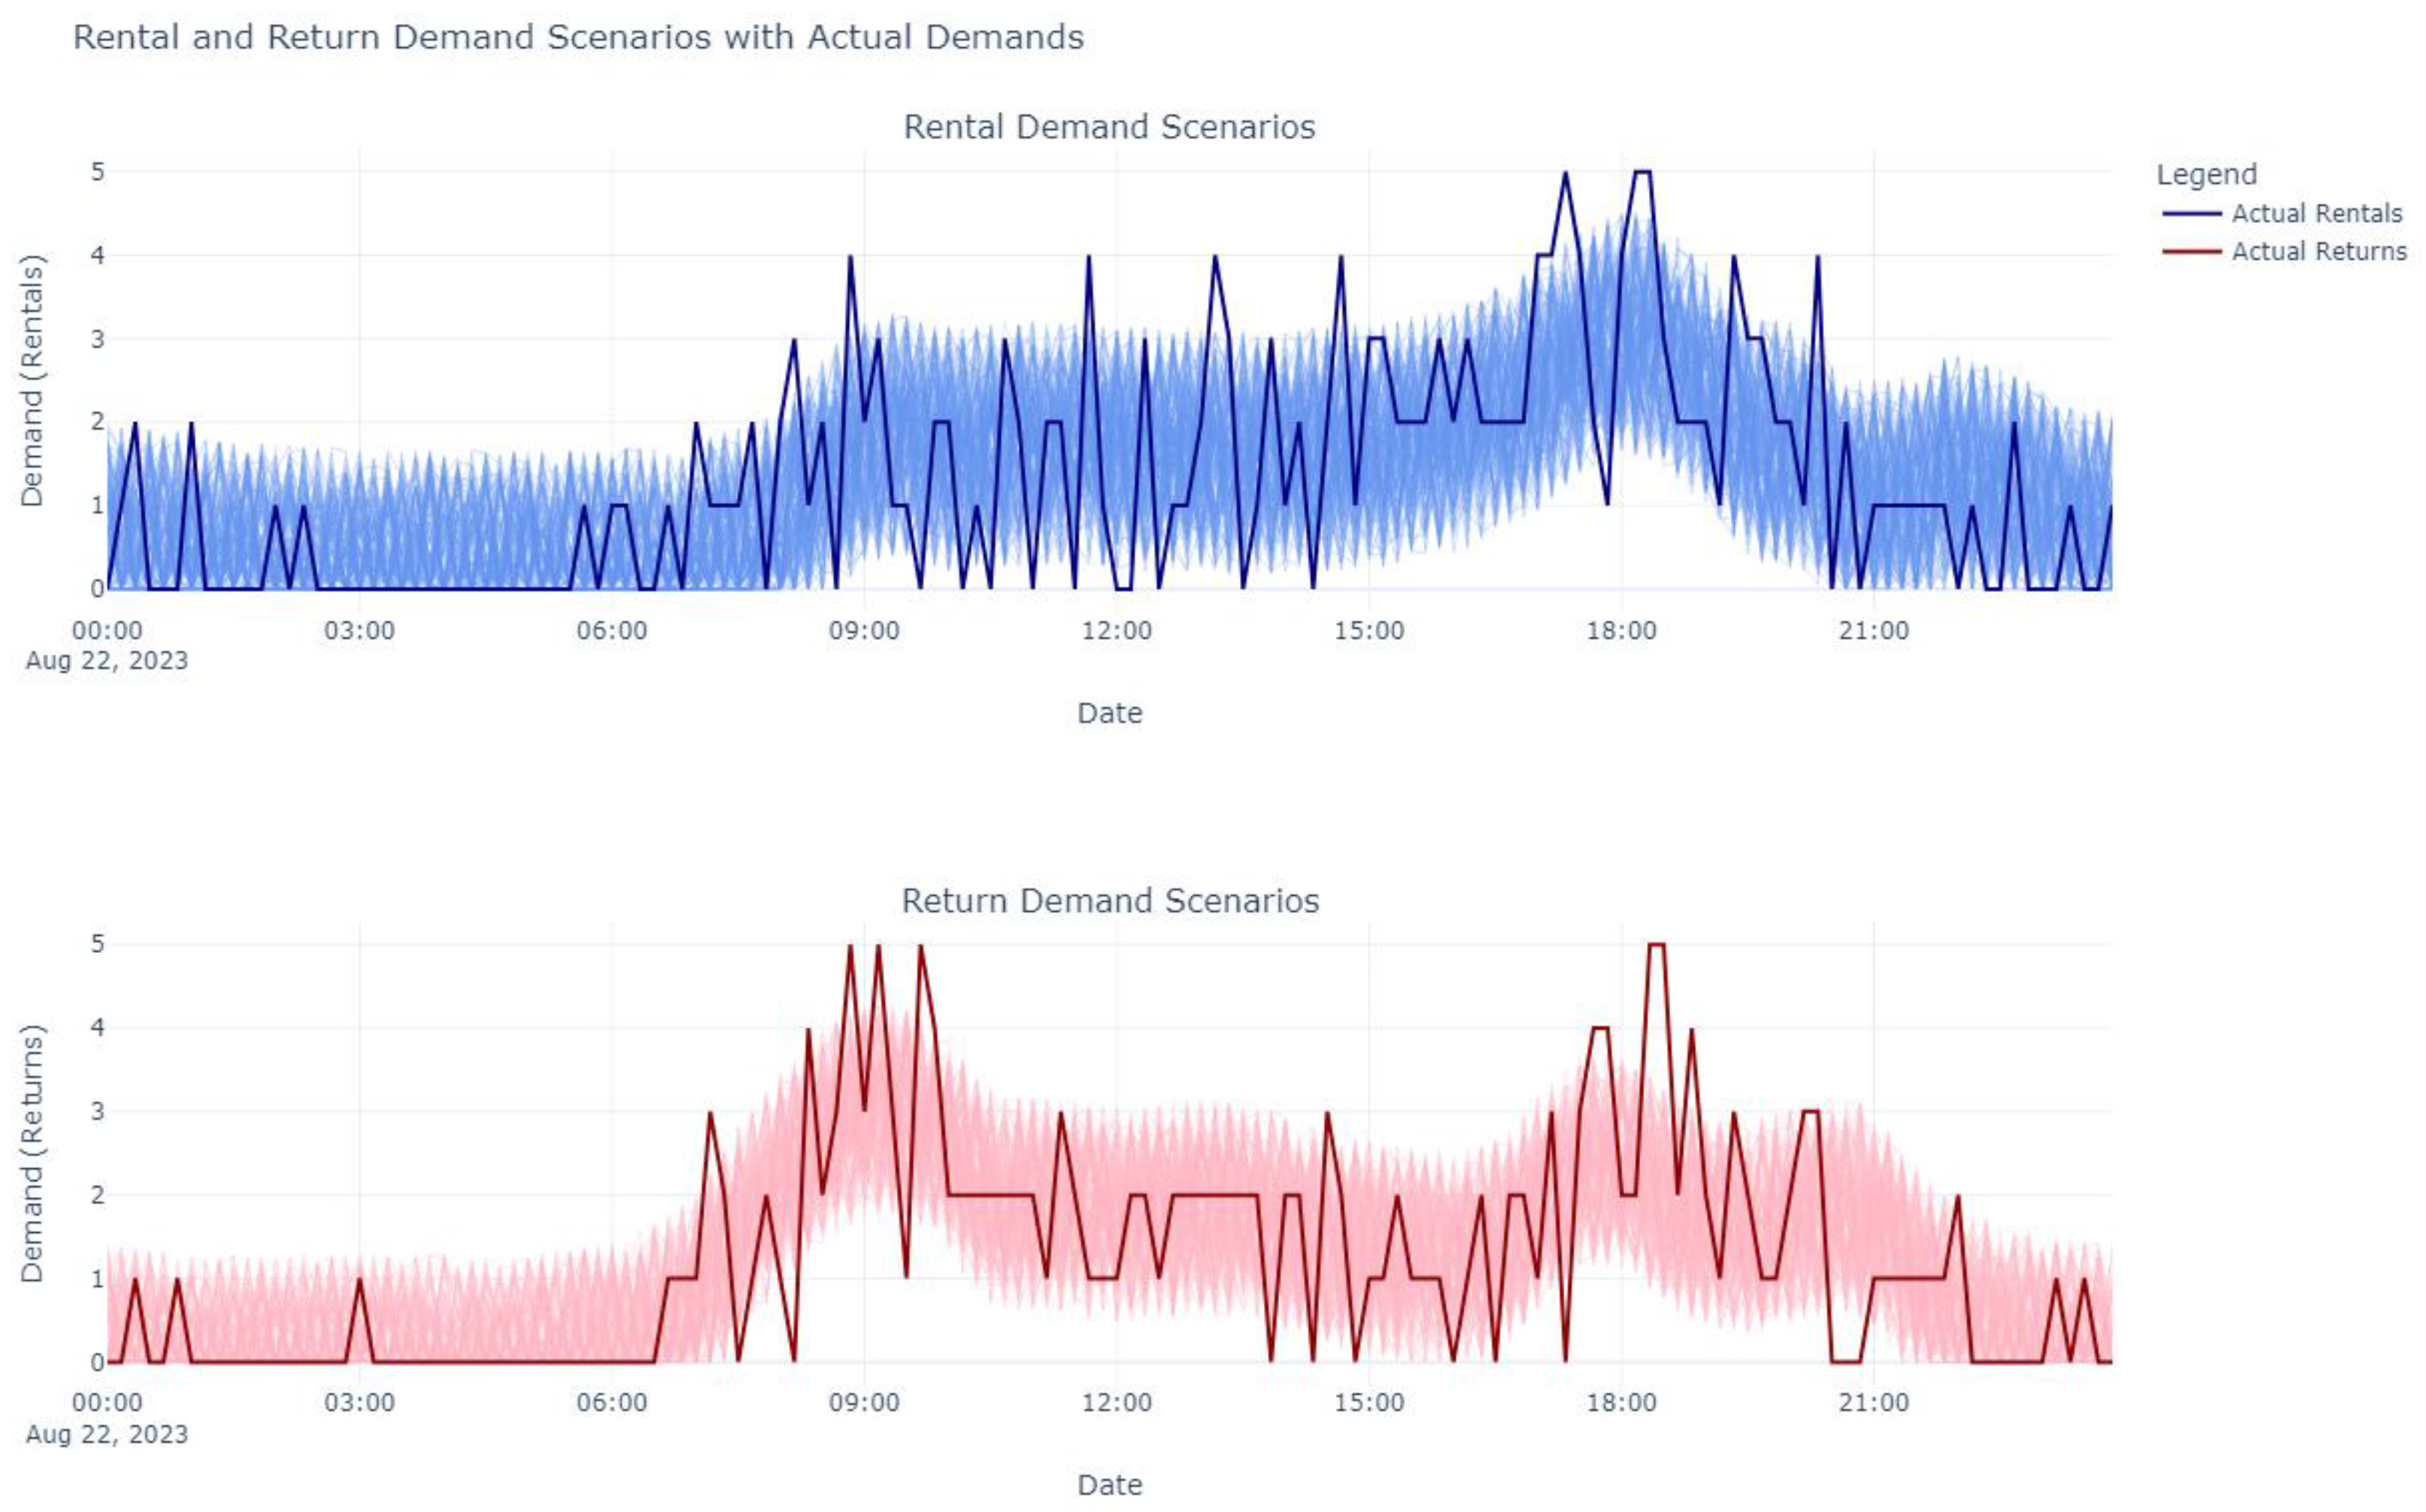
Figure 19.
Results of simulation runs with decision variables taking values from their respective domains.
Figure 19.
Results of simulation runs with decision variables taking values from their respective domains.
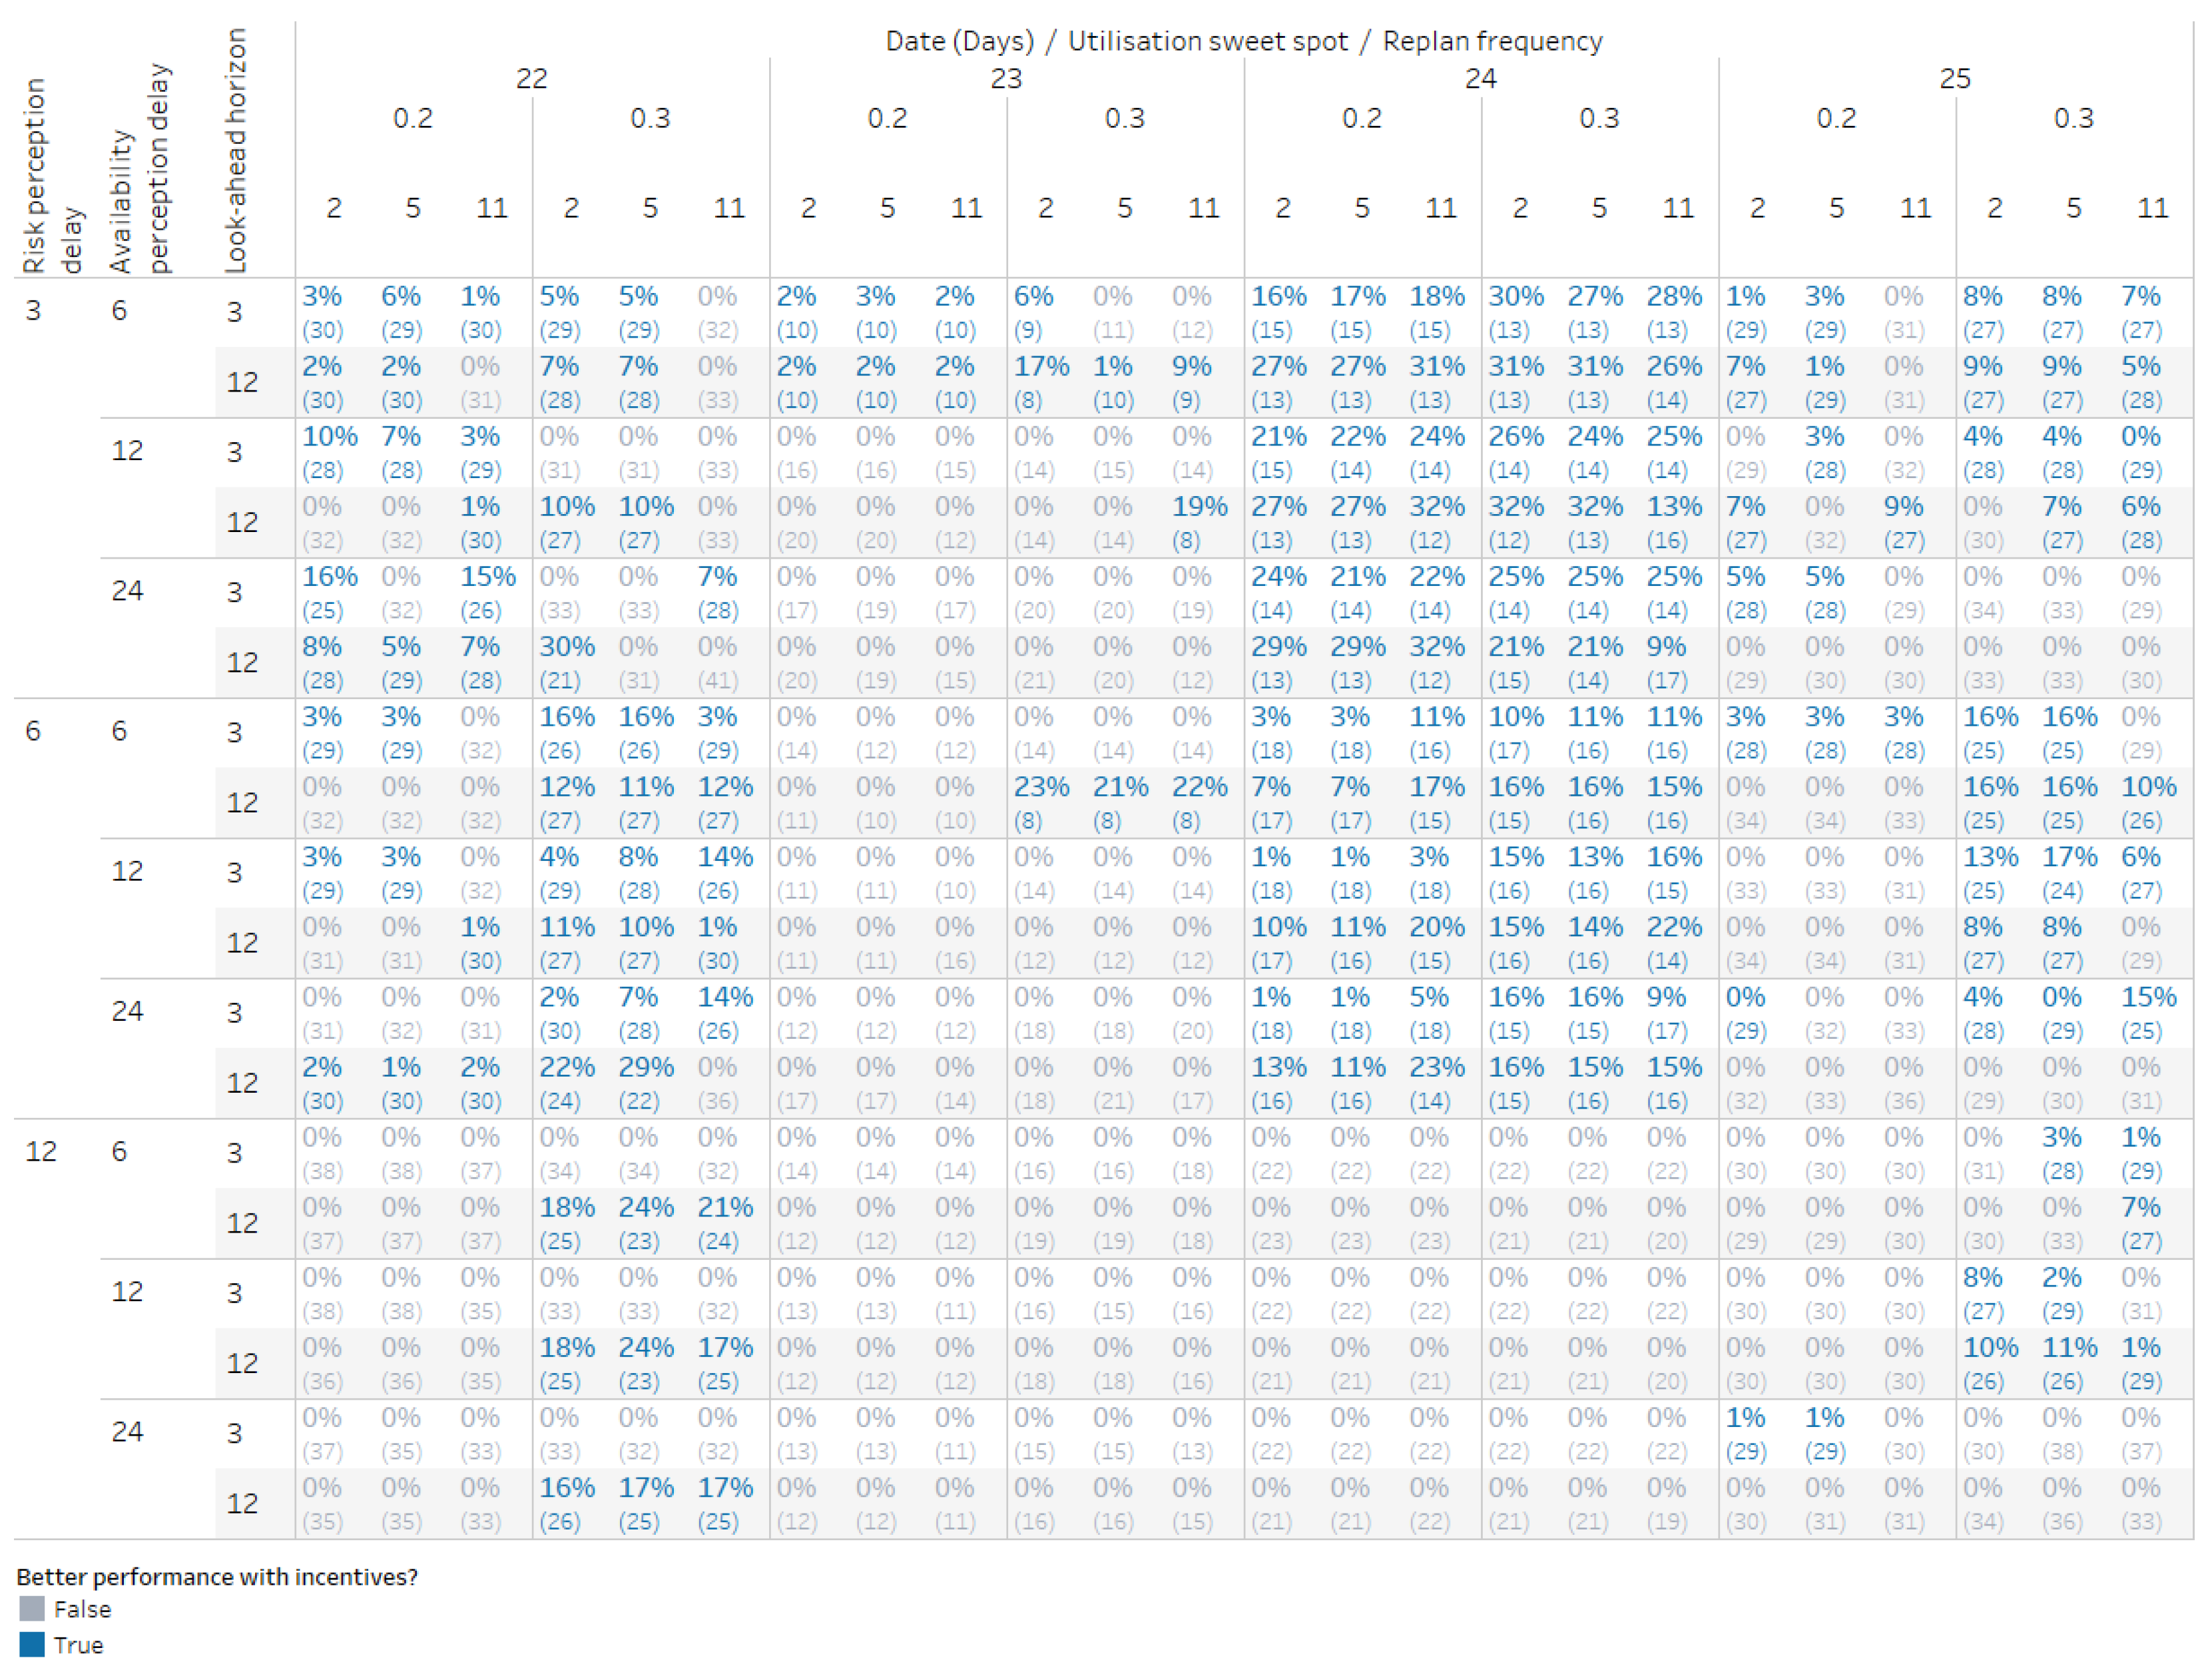
Figure 20.
Analysis of key stock and flow variables influencing performance at two different risk perception delay values (orange for the yin cluster, grey for the yang cluster).
Figure 20.
Analysis of key stock and flow variables influencing performance at two different risk perception delay values (orange for the yin cluster, grey for the yang cluster).
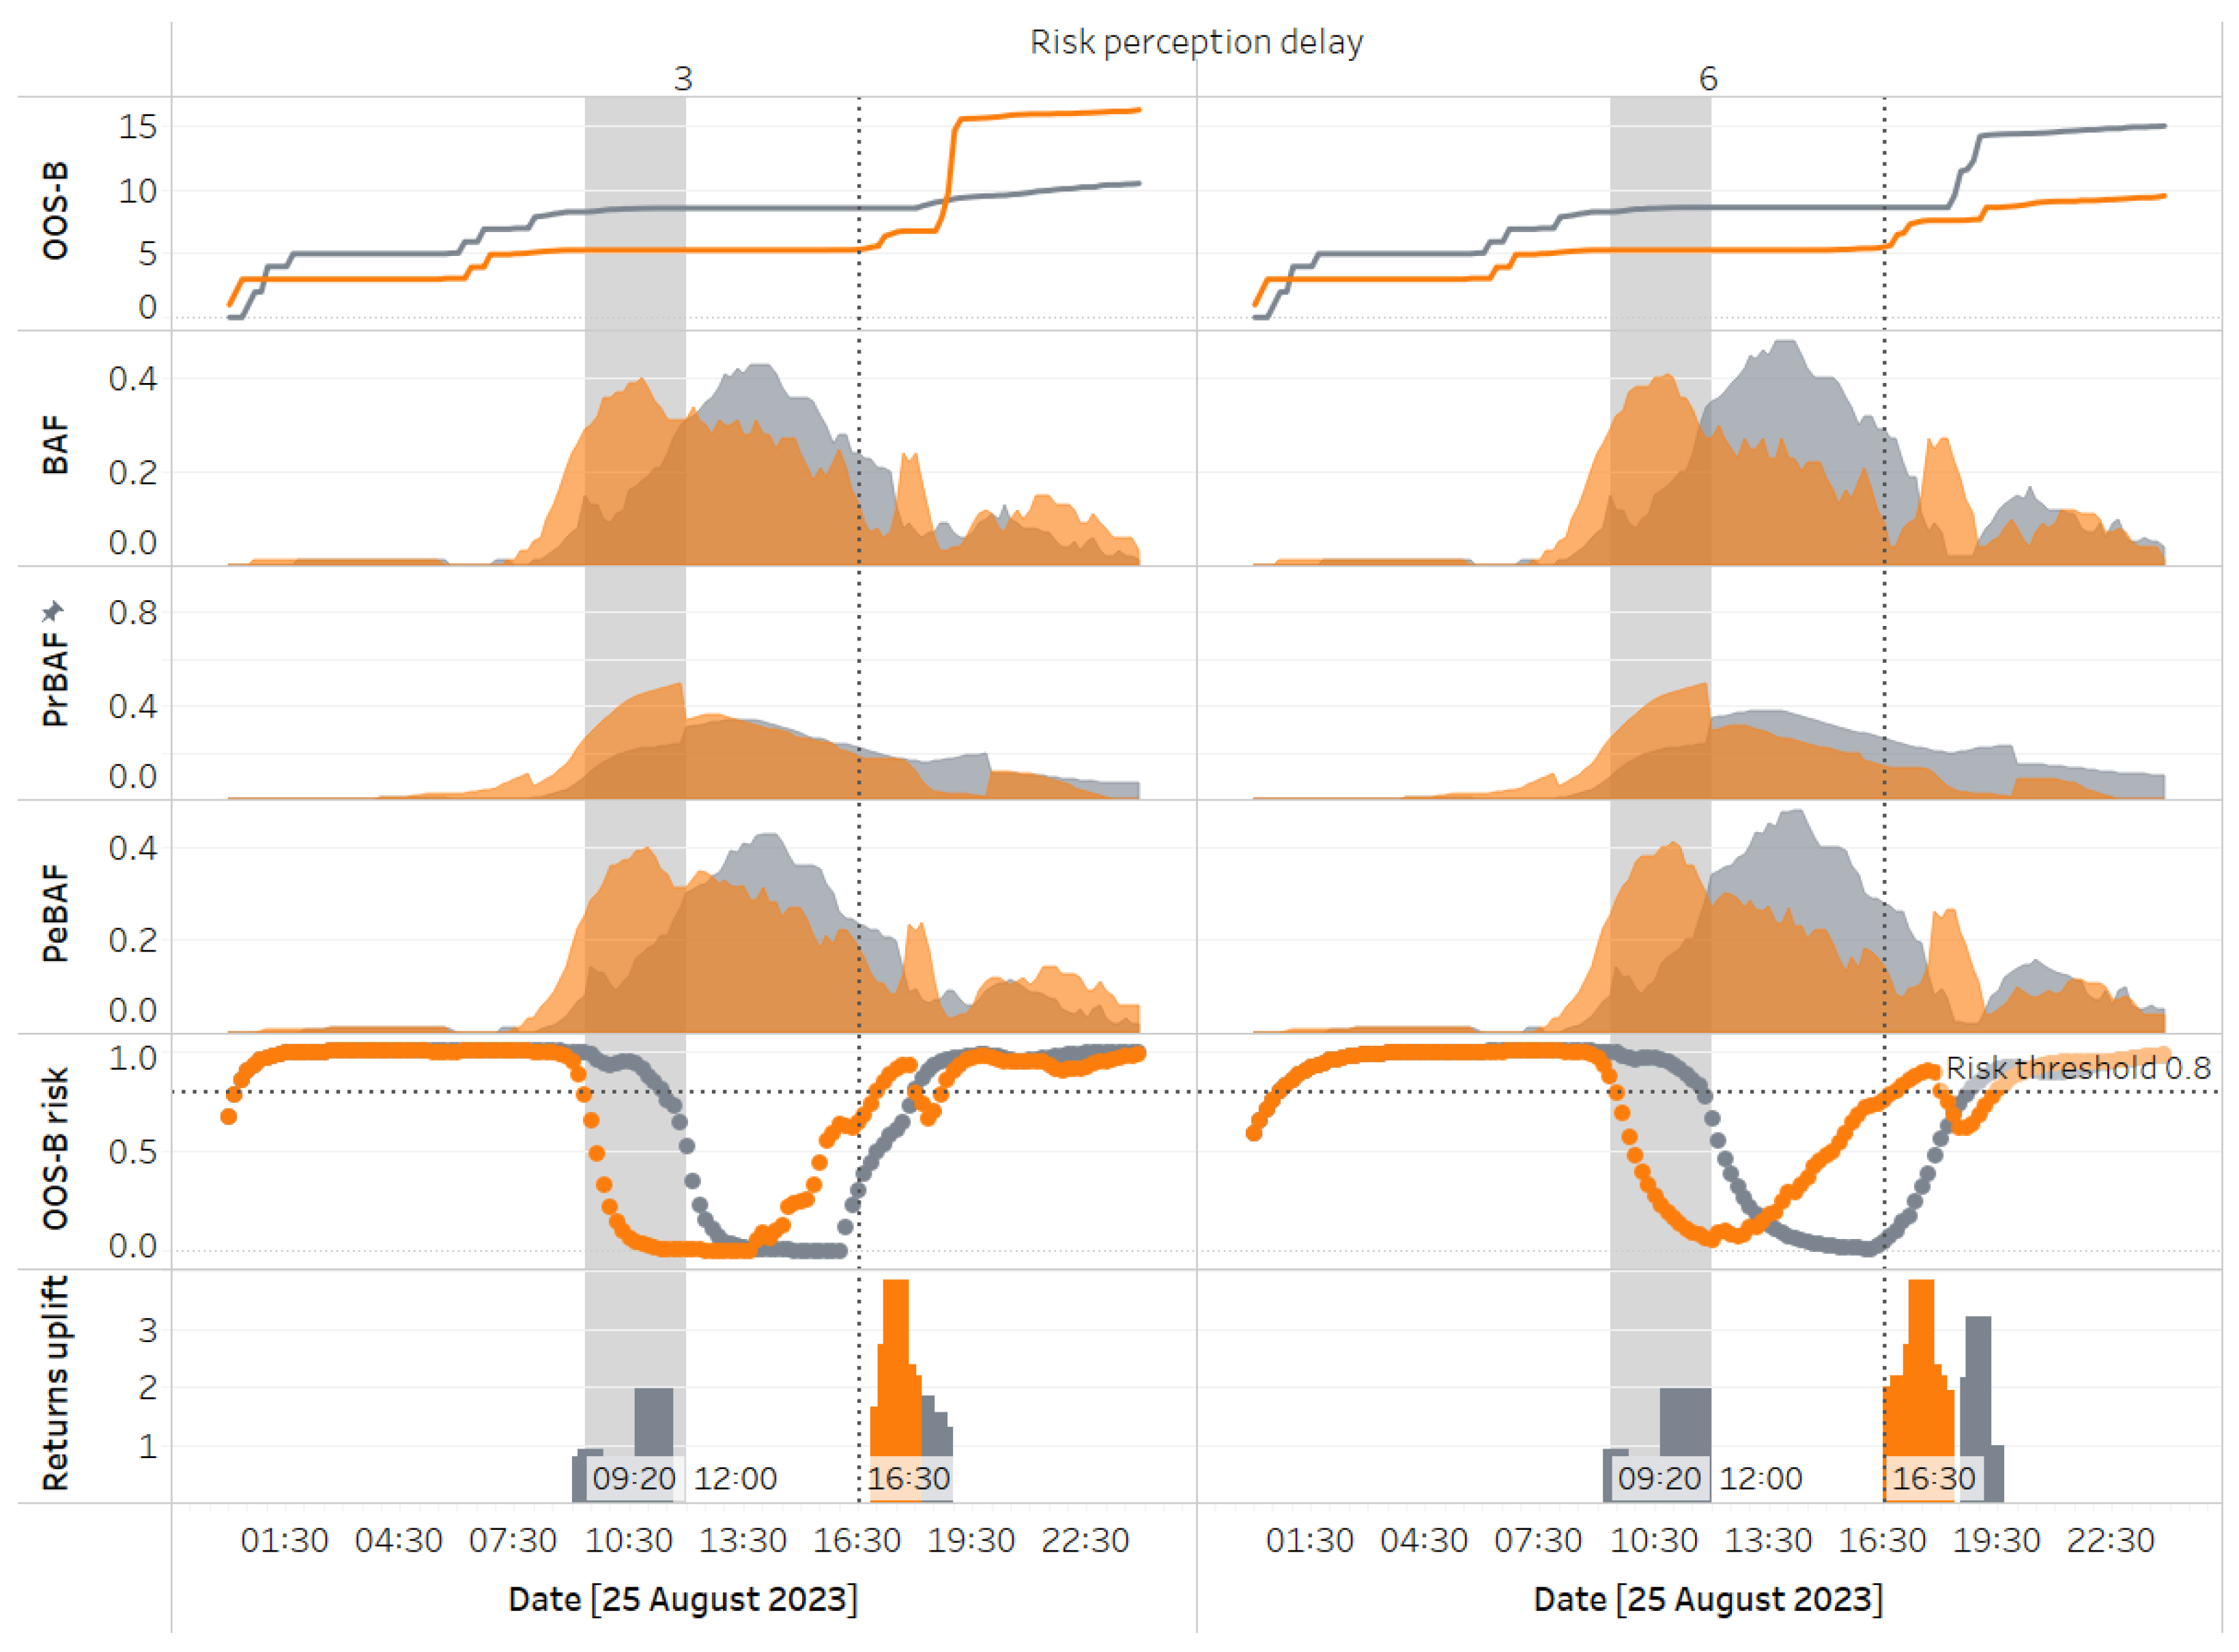
Figure 21.
Analysis of key stock and flow variables influencing performance at two different availability perception delay values (orange for the yin cluster, grey for the yang cluster).
Figure 21.
Analysis of key stock and flow variables influencing performance at two different availability perception delay values (orange for the yin cluster, grey for the yang cluster).
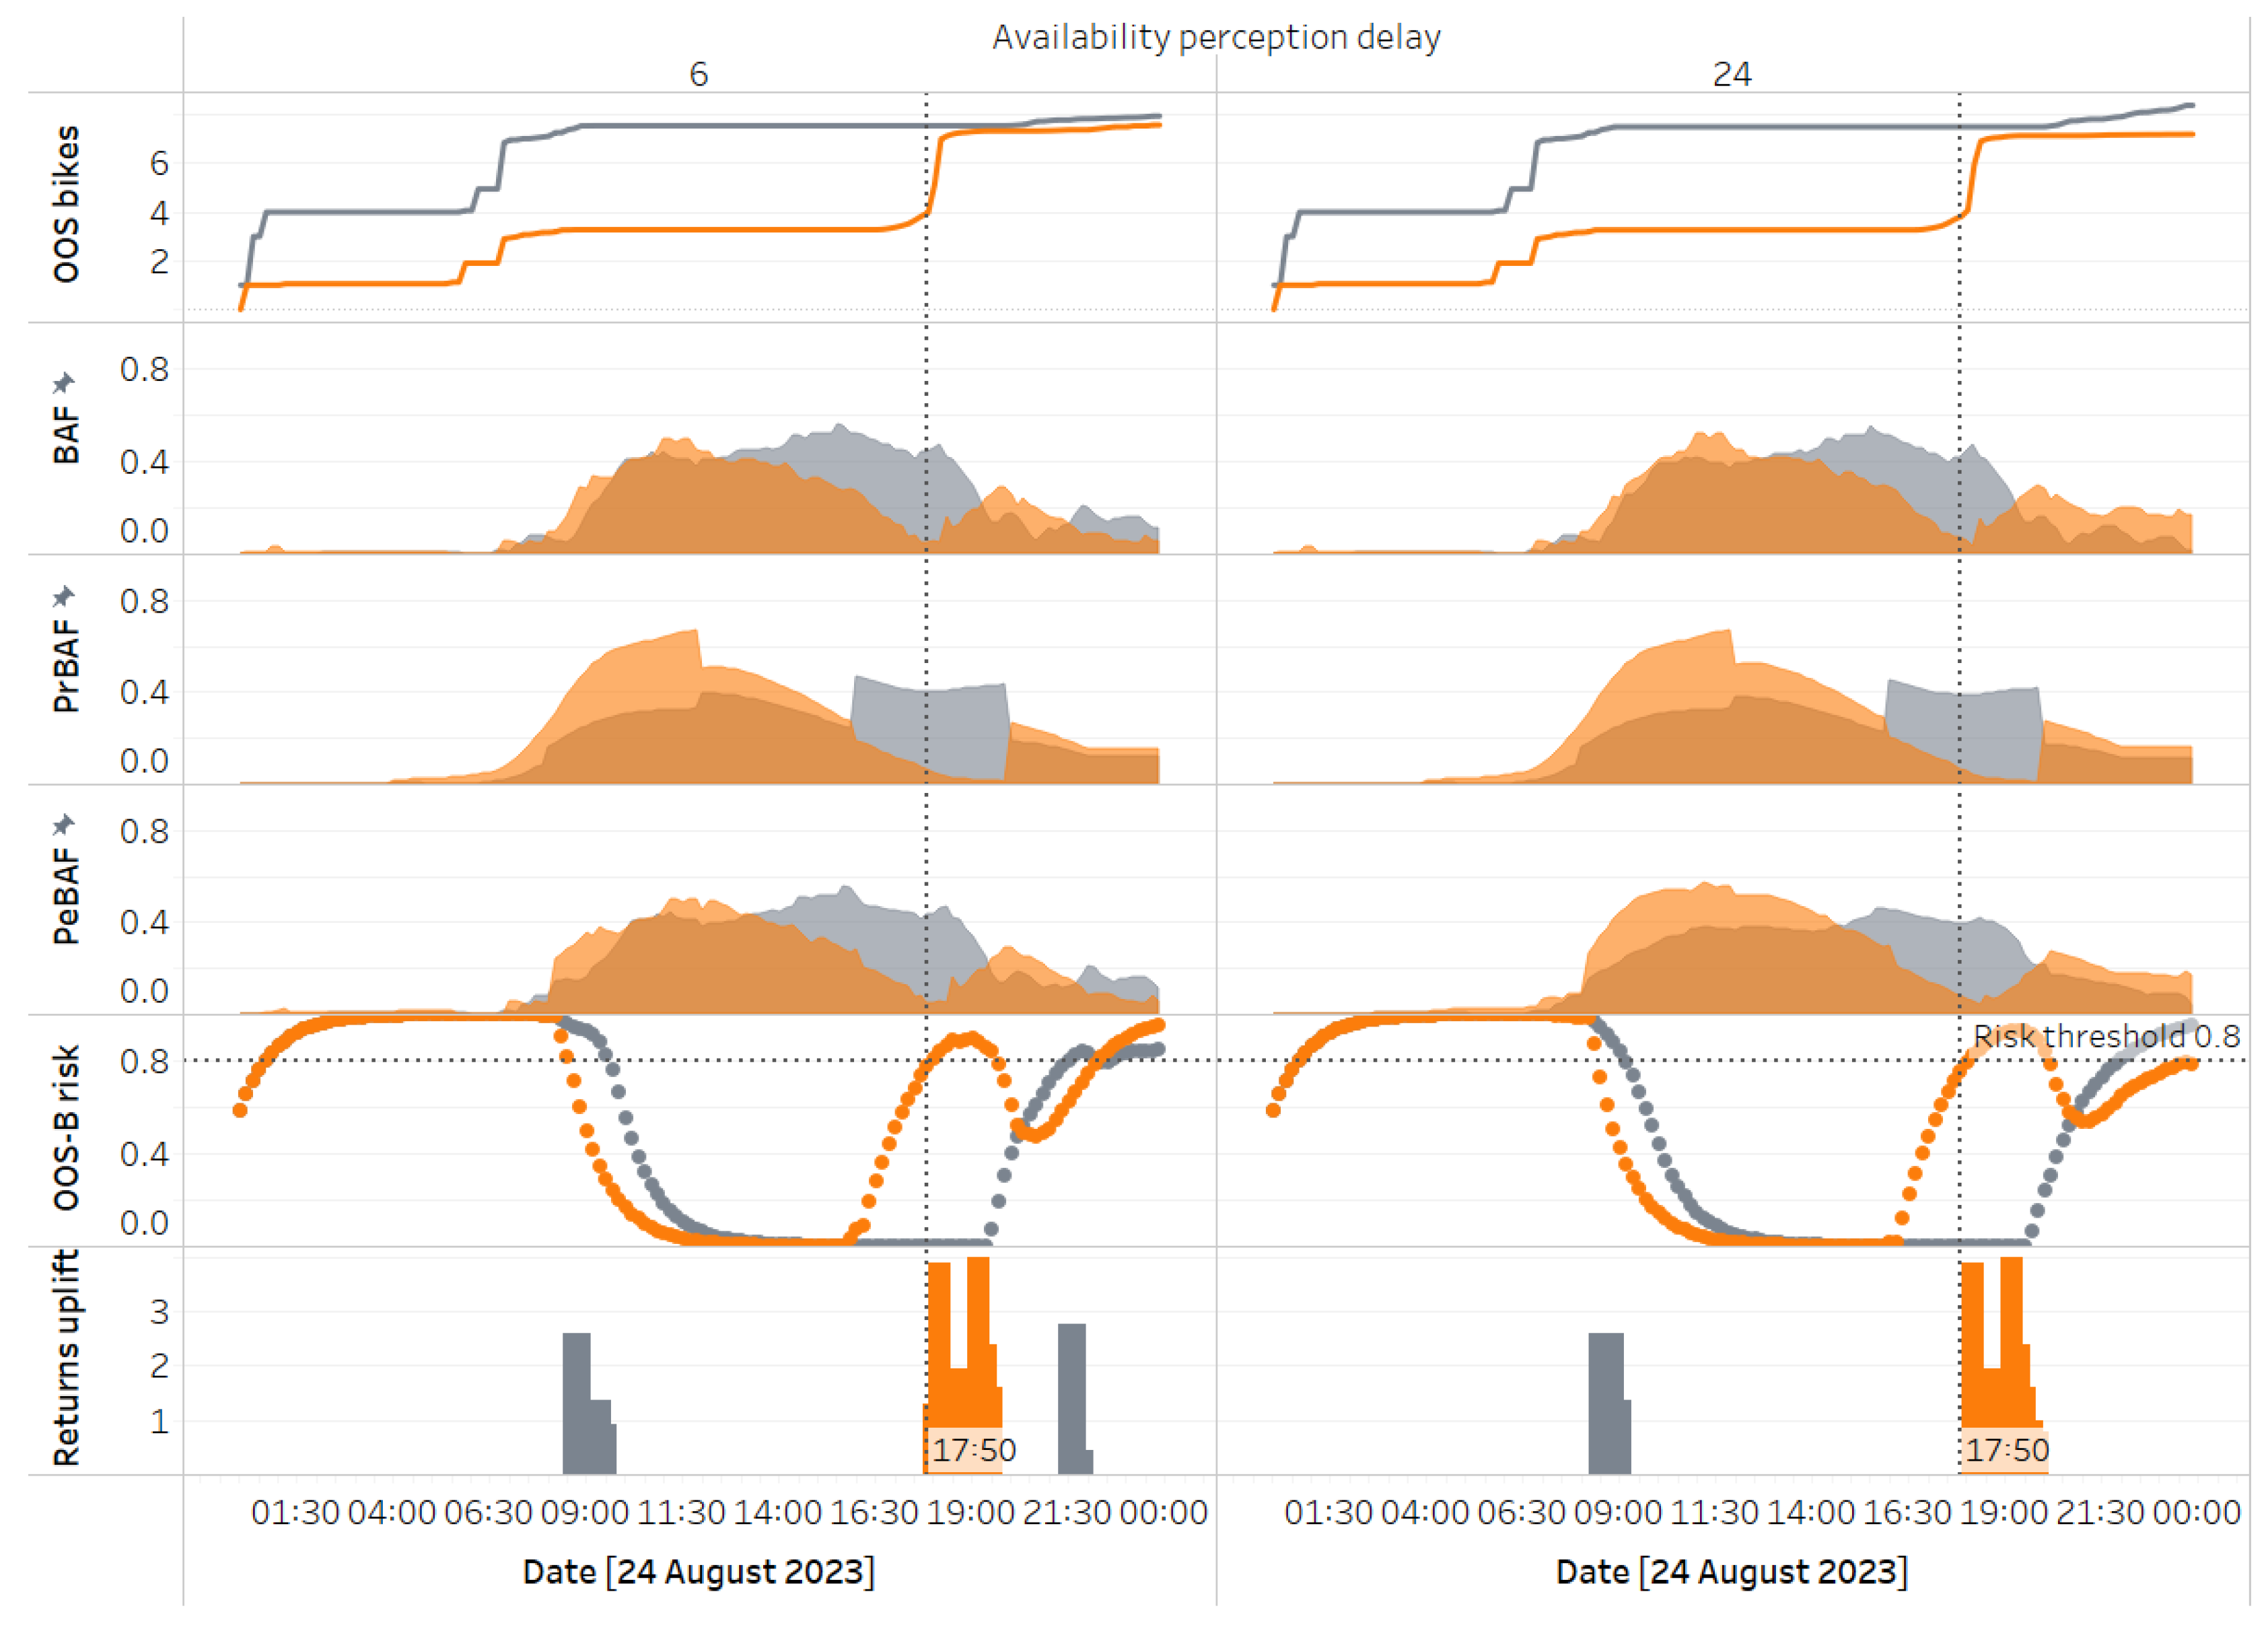
Figure 22.
Perturbing demands on the 24th by lifting rental demands until 10:00 and distributing it to the remaining periods.
Figure 22.
Perturbing demands on the 24th by lifting rental demands until 10:00 and distributing it to the remaining periods.
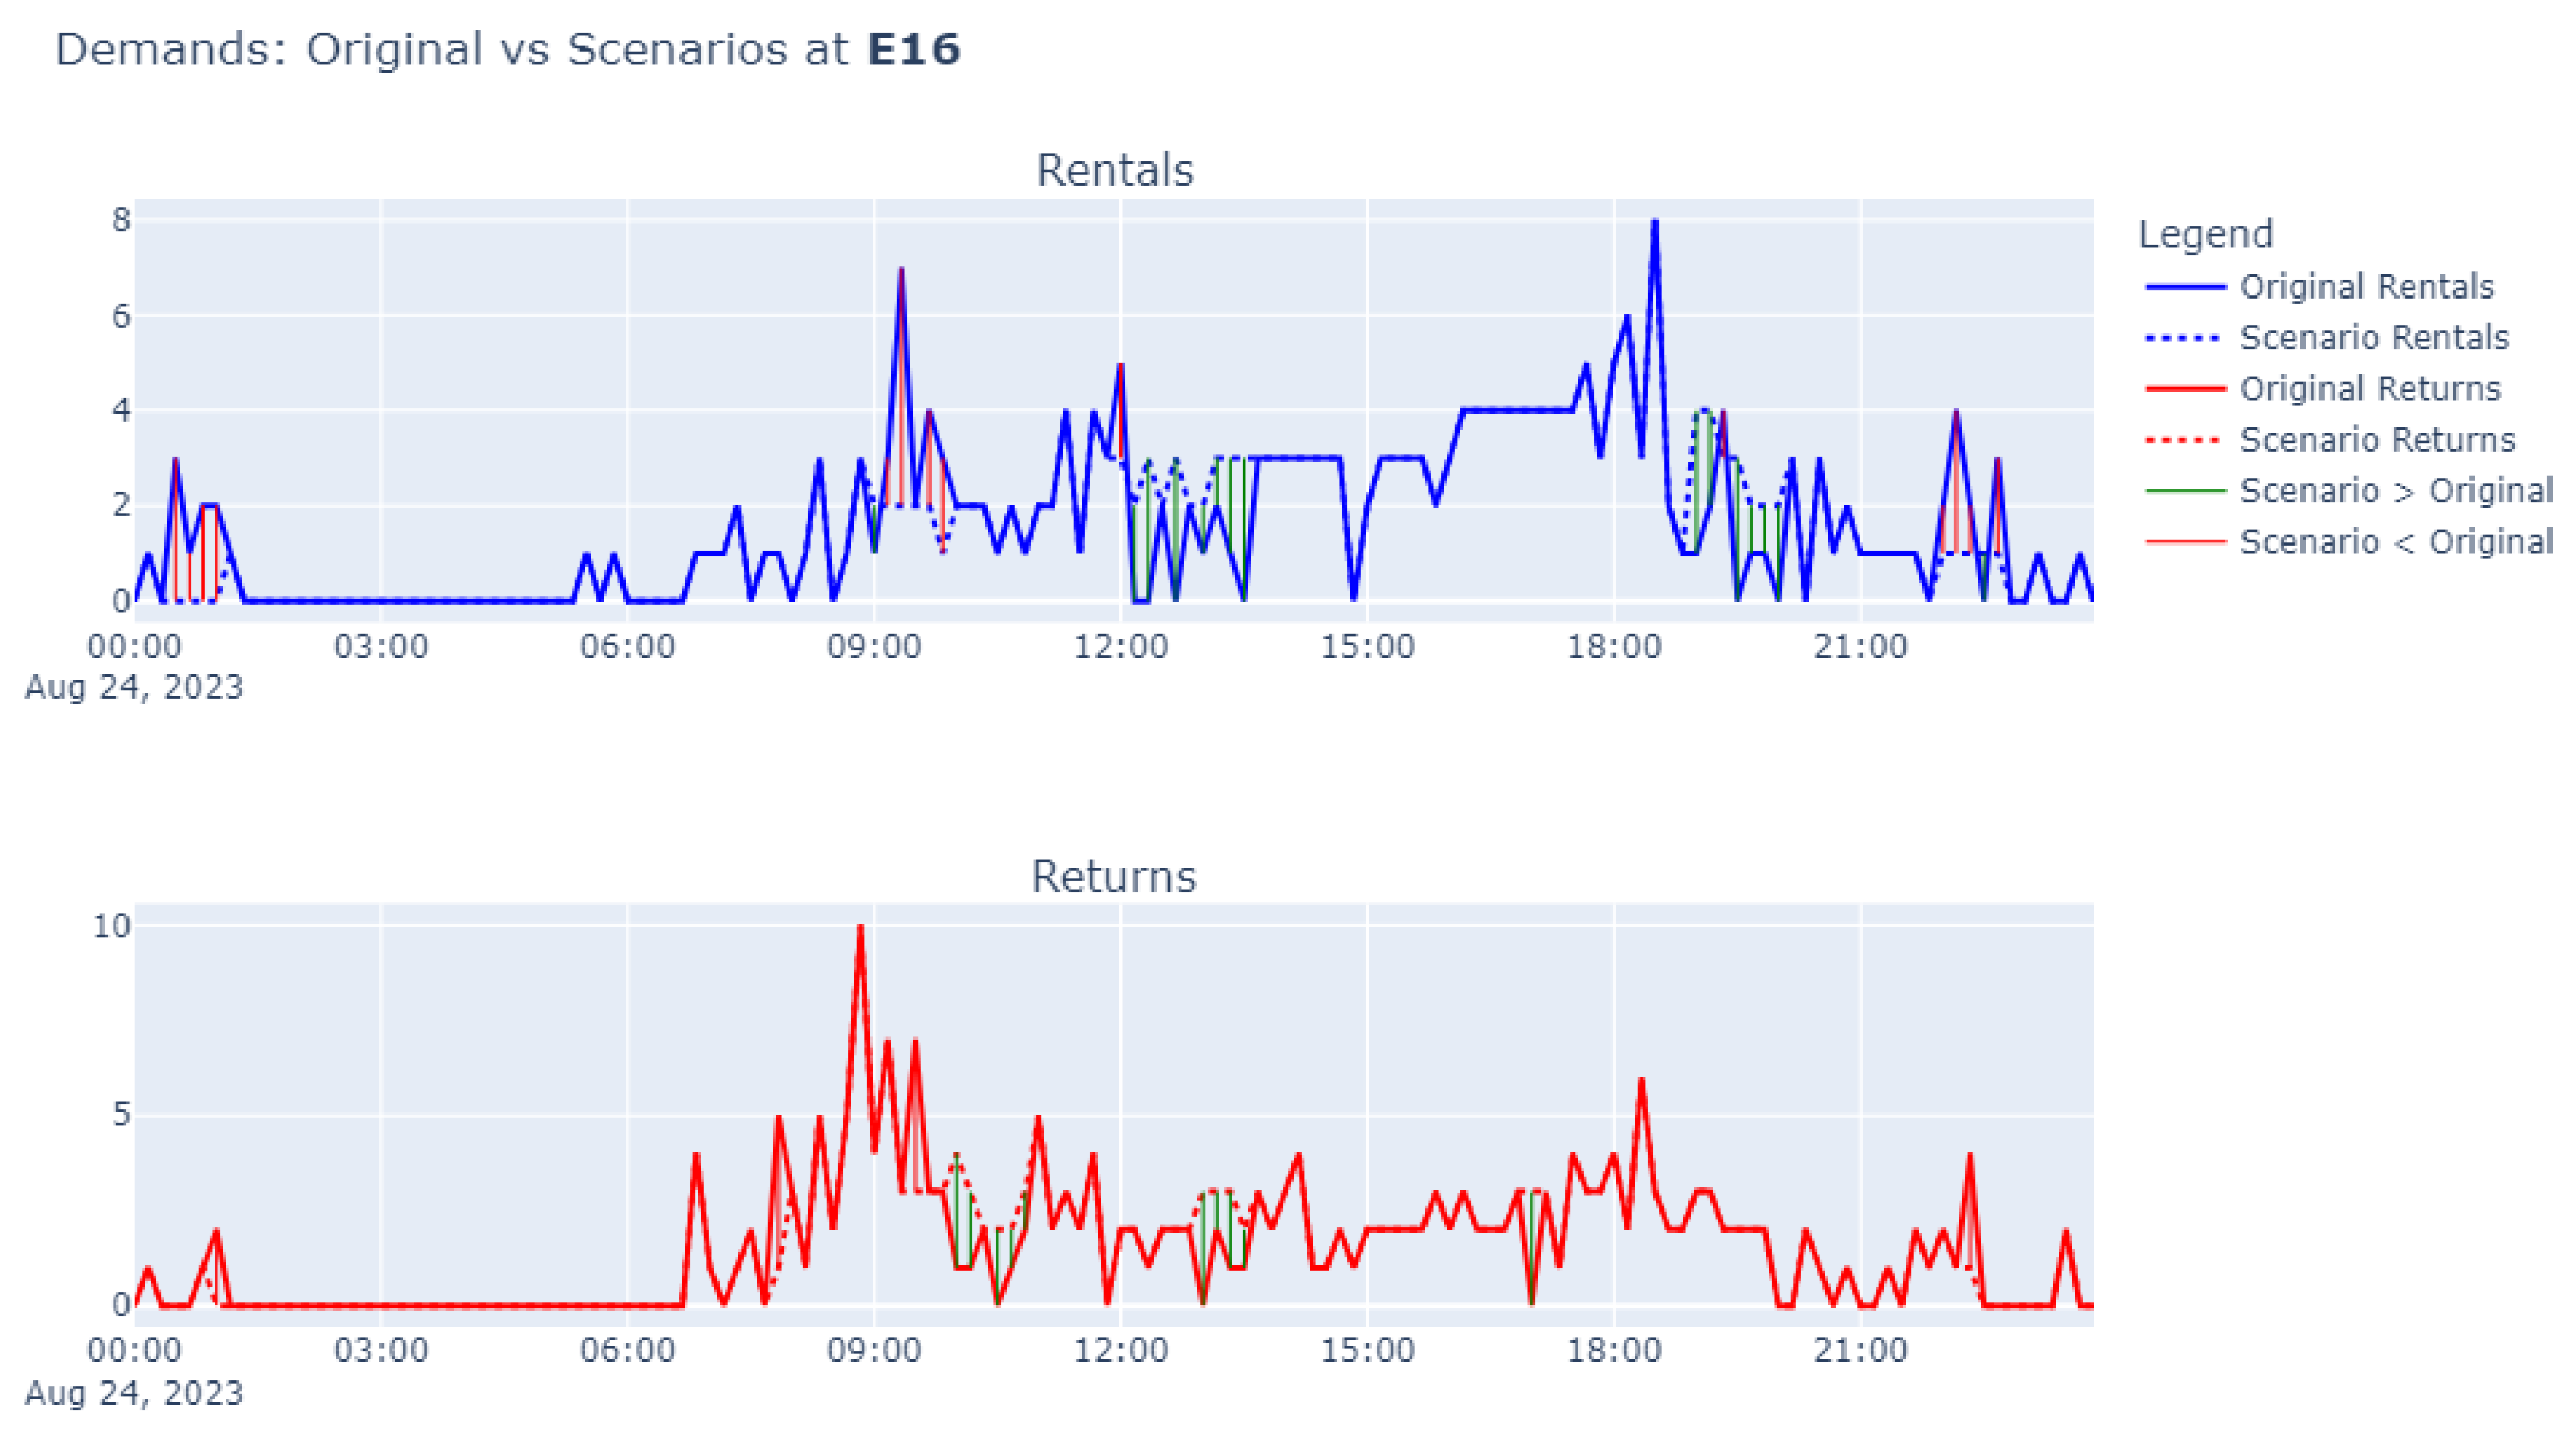
Table 3.
Overview of Adjustments to the LSTM Model for Bias Correction.
| Procedure | Description |
| Bias Correction Layer | |
| 1. Initialize the Layer | Create a trainable bias term initialized to zero. |
| 2. Forward Pass (Call Method) | For each prediction, adjust it by adding the bias term. |
| 3. Configuration Retrieval | Return the layer configuration. |
| Asymmetric Hybrid Loss Function | |
| 1. Initialize the Loss Function | Parameters: alpha: Weight for combining MSE and MAE. lambda_bias: Penalty for bias correction. lambda_over: Penalty for over-predictions. lambda_under: Penalty for under-predictions. local_corr: Whether to compute bias correction locally (per sample) or globally (batch-wise). |
| 2. Compute the Loss | Calculate prediction errors: . Separate errors into over-predictions (positive) and under-predictions (negative). Calculate MAE with different penalties for over- and under-predictions. Calculate MSE for all errors. Combine MSE and MAE using the weighting parameter α. |
| 3. Bias Correction | Calculate the bias correction term, either locally (sample-wise) or globally (batch-wise). Add a penalty for bias to the loss, scaled by λ bias. |
| 4. Return Final Loss | Final loss is the weighted sum of MSE, MAE, and the bias correction penalty. |
| 5. Configuration Retrieval | Return the loss function configuration, including all hyperparameters. |
Table 4.
Accuracy and Bias Metrics for the Three Scenarios in Partial Model Testing.
| Model | MSE Rentals | MSE Returns | Bias Rentals | Bias Returns |
|---|---|---|---|---|
| STAT | 1.46 | 1.27 | 0 | 59 |
| ML HI-B | 1.05 | 1.03 | 18 | -59 |
| ML LO-B | 1.05 | 1.02 | 17 | 29 |
Disclaimer/Publisher’s Note: The statements, opinions and data contained in all publications are solely those of the individual author(s) and contributor(s) and not of MDPI and/or the editor(s). MDPI and/or the editor(s) disclaim responsibility for any injury to people or property resulting from any ideas, methods, instructions or products referred to in the content. |
© 2024 by the authors. Licensee MDPI, Basel, Switzerland. This article is an open access article distributed under the terms and conditions of the Creative Commons Attribution (CC BY) license (http://creativecommons.org/licenses/by/4.0/).
Copyright: This open access article is published under a Creative Commons CC BY 4.0 license, which permit the free download, distribution, and reuse, provided that the author and preprint are cited in any reuse.