Submitted:
23 October 2024
Posted:
23 October 2024
You are already at the latest version
Abstract
The purpose of this paper is to determine the polycyclic aromatic hydrocarbons (PAHs) from medicinal plants and infusions prepared on them, as well as the assessment of the transfer of these contaminants from plants to infusions. The separation of compounds was achieved using microwave extraction for dryed plants and liquid-liquid extraction in the case of infusions. The extracts were cleaned by solid phase extraction, and compounds analysed by gas chromatography coupled with mass spectrometry (GC-MS). The risks related to the consumption of the infusions from the analysed plants were also evaluated by calculating the exposure contribution to the infusion consumption (EDI, ng/Kg.bw/day) and Margins of Exposure (MOEs). The average total content of PAHs varied from 277.22±12.78 to 2466.46±203.45µg/kg in dry plants, and benzo[b]fluoranthene and benzo[a]pyrene are the compounds present in all samples. In the herbal tea infusions, the average total PAHs content varied between 612.55±46.12ng/L and 2292.2±140.24ng/L. Statistical analysis showed that only BabF shows a significant strong correlation between the content of individual PAHs in plants and their infusions, while BaP, 4PAHs and HMW-compounds showed weak correlations. Average transfer rates of ∑16PAHs from plants to infusions varied from 7.25 to 32.86%. The MOEs of BaP and 4PAHs in herbal tea infusions with the highest PAH content confirmed that the consumption of medicinal teas presents a low risk to contamination with PAHs.
Keywords:
PAHs
; medicinal plants
; tea infusions
; MOEs
1. Introduction
Polycyclic aromatic hydrocarbons (PAHs) are a group of chemical compounds that have as a common structural characteristic the presence of several condensed aromatic rings, with or without heteroatoms. They have become ubiquitous in the natural environment due to the high degree of pollution, being present in air, water, soil and implicitly in food. There are a number of 15 PAHs considered genotoxic, mutagenic and carcinogenic. Among these, the European Food Safety Agency (EFSA) selected benzo[a]anthracene, chrysene, benzo[b]fluoranthene and benzo[a]pyrene (4PAH) as indicators of the presence of PAHs in food products [1].
The European Commission, following the opinions expressed by EFSA, has determined strict limits for 4PAHs in food products, as well as in dried plants and spices [2].
Among the four, benzo[a]pyrene is considered one of the most dangerous compounds, being classified in group 1 (carcinogenic to humans), according to the International Agency for Research on Cancer [3].
For people who do not smoke or who are not exposed to high levels of PAHs due to the nature of their occupation, the primary source of PAHs in the body is food, but also other ingested products, including phytotherapeutic products - infusions and decoctions prepared from medicinal plants collected from the natural environment.
Existing studies show that traditional medicine is still widespread in the world, with the use of medicinal plants and natural remedies increasing [4,5].
Thus, the quality and effectiveness of these products can be seriously affected, phytotherapy becoming in these conditions rather a procedure with harmful effects. Taking into account the fact that phythoterapy is a practice that is more and more frequently approached as a means of treating some minor ailments, the mentioned risks extend to an ever-increasing number of people.
These are numerous studies attesting the presence of significant amounts of PAHs in dried medicinal plants, or in other plant products intended for the preparation of infusions and widely consumed throughout the world [6,7].
Also, these are studies on the content of PAHs in Chinese tea (Camelia sinensis) processed in different ways, or in mate (Ilex paraguariensis St. Hil), which prove the existence of significant amounts of this group of compounds both in the dry leaves and prepared infusions [8,9,10,11].
Fewer and recent studied highlight the transfer of PAHs from dried medicinal plants to infusions intended for consumption [12,13].
In order to improve the quality of phytotherapy products, there is a need to evaluate not only the content of PAHs and other contaminants (organochlorine pesticides, heavy metals) from dried medicinal plants, but also the transfer of these substances into preparations intended for human consumption (infusions, decoctions, tinctures etc.). In this sense, it is worth noting that the accumulation of PAHs and their transfer in extracts can differ from one plant species to other.
The purpose of the hereby study is to determine the amount of transfer of PAH compounds from dried medicinal plants in the infusions prepared and consumed for therapeutic purposes. In order to estimate the amounts of PAHs that pass into the infusion from dried plants, we referred to eight well-known and traditionally used plant species for phytotherapy in Europe, all of which have monographs in the European Pharmacopoeia [14].
Some of them come from natural environment, not being cultivated (Hypericum perforatum; Artemisia absinthium; Tilia sp.; Achillea millefolium; Taraxacum officinale; Crataegus monogyna), others can come from both the natural environment and cultures (Matricaria chamomilla), one species being cultivated (Calendula officinalis). Taking into study these eight plants purchased from the pharmaceutical market in Romania, from which we prepared infusions following exactly the instructions on the package, we determined by gas chromatography the main PAHs, in parallel from the dried plants and from the prepared infusions. Although the risk analysis, assessed by MOE values obtained on the infusions, indicated a low risk to health, according to EFSA regulations, these amounts must still be taken into account, as they are added to those taken daily from other sources.
Through this approach, we want to show that it is necessary to carry out systematic research on the differentiated way in which various species of plants used for medicinal purposes accumulate PAHs from the environment and to develop quality standards regarding the concentration of PAHs in medicinal plants, transferable to infusions, so that phytotherapy does not turn from a beneficial action into a danger for humans.
2. Materials and Methods
2.1. Reagents
The reagents used for analysis -dichloromethane (DCM), hexane, florisil, silica gel (60 –200 mesh) and anhydrous sodium sulphate were obtained from BDH (Poole, UK), Merck (KGaA, Germany), Fluka (Buchs, Switzerland), Loba Chemie (India) and Sigma-Aldrich (Gillingham, UK). A standard mixture containing 16 priority PAHs were purchased from LGS Standards GmbH (Poland). Deionised water, helium) 99.99%) and nitrogen gases were purchased from Foshan Huate Gas Co. Ltd. (China).
2.2. Sampling
Samples from eight different types of dried medicinal plants were selected from local markets from Romania: Hypericum perforatum (St. John's wort); Artemisia absinthium (wormwood, absinthe); Tilia sp. (Linden); Matricaria chamomilla (chamomile); Achillea millefolium (yarrow); Taraxacum officinale (dandelion); Calendula officinalis (marigold); Crataegus monogyna (hawthorn). For each type of plant, three samples were purchased. All samples were grounded to homogenise before extraction and clean-up.
2.3. Preparation, Extraction and Clean-Up Procedure of Teas and Tea Infusions
PAHs were extracted from dried plant by microwave method with 30 mL mixture of acetone/hexane (1:1) (v:v), and from infusion by liquid-liquid using hexane/dichloromethane (7:3) (v:v) mixture. 2.5 g of dried material were added into a receptacle with 30 mL solvent. The samples were submitted to microwave extraction at E(w)=1000 and 1200C for 50 min, in a MILESTONE START E (Italy) equipment and filtered through filter paper.
The infusions were prepared according to the indications mentioned by the manufacturer. For this purpose, 5 g of dried plant were submerged in 0.600 L of boiling-hot tap water. The infusion was brewed under cover for 10 min, and PAHs were extracted with 25 mL hexane/dichloromethane (7:3) (v:v) mixture. The both extracts were filtered on anhydrous sodium sulphate cleaned by solid phase extraction (SPE) using columns filled with 1g of florisil. Finally, the obtained extracts were concentrated up to 2 mL on water bath using (Kuderna-Danish concentrator) and nitrogen flow and analysed by GC-MS technique. The internal standards 9,10-dihydroanthracene for PAHs were added to the samples for quantifying the overall recovery on the analytical procedures [15].
The transfer percentage of PAHs from plant to infusion was calculated using formula (1):
Where: Cti-concentration (ng/L) of PAHs in the infusion; Vti- volume (L) of the infusion; Cdt-concentration (ng/g) of PAHs in dry tea; Wdt-weight (g) of dry plant prepared for making infusion.
2.4. GC-MS Analysis of PAHs
PAHs were determined using a GC apparatus (Perkin Elmer CLARUS 690 (USA) with a MS detector, using an Elite 35MS capillary column (5% diphenyl 95% dimethyl polysiloxane; 30 m length × 0.32 mm i.d. × 0.25 µm film thickness). Helium was used as the carrier gas at a flow rate of 1.0mL/min. After being held at 1000C for 1 min, the over temperature was increased to 2500C at a rate of 60C/min. The temperature was raised to 3300C at a rate of 100C/min and held for 10 min. The mass spectrometric was using the selective ion monitor (SIM) with the electron ionisation (EI) at 70eV; the temperatures if ion source and interface were 2700C and 3300C respectively. The range of m/z was measured from 47 to 450, and for each compound, the maximum abundant ion from the molecular ion cluster was measured. The quantification of the specific polycyclic aromatic hydrocarbons was achieved by comparing the retention times of the sample peaks to those of known standards (Table 1). Sixteen PAHs were analysed: naphthalene (Na), acenaphthylene (Ac), acenaphthene (Ace), fluorene (Flu), phenanthrene (Ph), anthracene (An), fluoranthene (Fln), pyrene (Pyr), benzo[a]anthracene (BaA), chrysene (Chr), benzo[b]fluoranthene (BbF), benzo[k]fluoranthene (BkF), benzo[a]pyrene (BaP), benzo[g,h,i]perylene (Bghi), dibenzo[a,h]anthracene (DahA), and indeno[1,2,3 –cd] pyrene (IP).
The performance parameters of the methods used were verified by evaluating the following parameters: linearity, limit of detection (LOD) and accuracy. The limits of detection were calculated three times the standard deviation of the blanks, and the values were 0.0001µg/g (dried plant) and 0.0001µg/L (infusion). Linearity was checked by constructing the calibration curves using spiked model solutions at different concentration levels. The calibration plots based on the linear regression analysis revealed good linear relationships between peak area and concentrations with correlation coefficients over 0.9900. Accuracy expressed as percentage recovery was evaluated by the analysis of filters spiked with a known concentration of standard PAH compounds and the values were found in the range of 90-95%.
All experiments were carried out triplicate and the data were presented as mean ± standard deviation. To describe the strength of a linear association between dried teas and their infusions, Pearson’s correlation coefficient (r) was calculated. In the case of correlation analysis “strong” correlation means if | r | ≥ 0.7, weak correlation is 0.7 > | r | ≥ 0.3.
3.5. Risk Assessment
The health risk was assessed using BaP and 4PAHs as markers for the presence of these compounds in the infusions [1].
Calculations for the intake of exposure to herbal tea consumption (EDI, ng/Kg.bw./day) were performed by multiplying the average concentration of BaP and 4PAHs (ng/L) by the daily consumption of infusion (200mL) relative to an average body weight of 70 kg. Values for Margins of Exposure (MOEs), were calculated using as values the lower confidence limit of the reference dose (BMDL10) for BaP (0.07mg/kg.bw/day) and 4PAHs (0.34mg/kg.bw/day) [16].
3. Results and Discussion
3.1. PAHs in Dried Medicinal Plants and Infusions
Table 2 shows the average individual concentrations of PAHs in the investigated medicinal plant samples. The results show that, high molecular weight compounds (HMW-PAHs) predominate in the analysed plants. Among them, benzo[b]fluoranthene (BbF) and benzo[a]pyrene (BaP) were present in all the analysed plants, while chrysene (Chr) and dibenzo[a,h]anthracene (DahA) were found in 25% of samples.
Regarding low molecular weight compounds (LMW-PAHs), fluorene (Flu) was present in most samples, in amounts varying from 1.72±0.63 to 302.88±14.30µg/kg. Also, phenanthere (Ph), is one of the LMW-PAHs compound present in large quantities in the plants Taraxacum officinale, Calendula officinalis and Matricaria chamomilla (180.46±12.40; 195.71±12.10 and 223.33±16.23µg/kg). These PAHs have not been classified as carcinogenic by the International Agency for Research on cancer [17]. The European Food Safety Authority (EFAS, 2008) defined the compounds BaP and ∑4PAHs (benzo[a]anthracene, chrysene, benzo[b]fluoranthene and benzo[a]pyrene) as indicators of PAHs in food [1]. In the present study, the sum of the four PAHs compounds showed higher values in most plants, with the exception of Matricaria chamomilla and Calendula officinalis. The concentrations measured by us exceed the maximum values established by the European Commission for BaP and 4PAHs, [2] being higher compared to those reported by Ciemniak et al. 2019 and Georgieva et al, 2023 in chamomile (Matricaria chamomilla L.), and linden (Tilia tomentosa Moench) [12,13].
Regarding the total content of PAHs (Σ16PAHs), the variation was highlighted in the following order: Matricaria chamomilla< Artemisia absinthium< Calendula officinalis< Crataegus monogyna< Hypericum perforatum< Tilia sp.< Achillea millefolium< Taraxacum officinale. This trend indicates that plants collected from natural areas, such as Achillea millefolium and Taraxacum officinale present the highest concentration of Σ16PAHs (1626.51±65.92 and 2466.46±203.45µg/kg, respectively), while Matricaria chamomilla, which grows both in the wild, as well as in cultures, has the lowest concentration of 277.22±12.78µg/kg.
The obtained data shows that the studied plants accumulated high levels of PAHs. Several studies showed that a series of factors such as plant species, age, environmental characteristics in which they grew, aerial deposition, can determine the presence of compounds in plants [18,19,20]. Simonich and Hites (1995), mentioned that PAHs absorption from soil is very reduced, the respective compounds accumulate in plants mainly through the air-plant path, rather than through the soil-root path [21].
At the same time, Moeckel C et al., (2009), showed that in the case of HMW- compounds, the root systems of plants prove to be major pathways involved in their absorption [22].
Taking into account the aspects mentioned above, we can conclude that in this study, the concentrations of PAHs are especially influenced by the species and the characteristics of the environment in which the plant developed. Also, taking into account the quality criteria regarding medicinal plants, we could exclude the age of the leaves, because young plants are collected for therapeutic purposes. On the other hand, in our study, we can exclude the aspects reported by some authors, who analysed green, black and yerba mate tea, processed in various ways (steaming, smoking, exposure to the sun, fermentation or heating in ovens) [23,24,25,26]. In the case of medicinal plants, according to the protocol, drying is carried out in dry spaces protected from light, possibly with ventilation, which would not bring additional amounts of PAHs.
Results on the Table 3 show the PAHs levels in plants influence their concentrations in infusions, showing different values of the individual compounds. The presence of both LMW-PAHs (Flu, Ph) and HMW-PAHs (BaP, BabF) compounds is also observed, especially in Achillea millefolium.
The infusions analysed revealed the presence of 16PAHs in the following order: Achillea millefolium> Tilia sp> Calendula officinalis> Taraxacum officinale> Hypericum perforatum> Crataegus monogyna> Matricaria chamomilla> Artemisia absinthium.
The data presented show that the dominant compound in both dried plants and infusions is BaP, which has been considered for many years as a marker of PAHs contamination in food. Its concentration varies from 22.18±2.81ng/L (Matricaria chamomilla) to 436.21±12.56ng/L (Crataegus monogyna).
Similarly, fluorene and phenanthrene were also present in infusions, in high concentrations, in Hypericum perforatum (510.0±32.14ng/L), and Calendula officinalis (512.95±38.21ng/L), respectively.
Statistical analysis showed that among the individual compounds only BabF shows a significant strong correlation between the content of individual PAHs in plants and their infusions (r = 0.837). In contrast, BaP and 4PAHs and HMW-compounds showed weak correlations, with values of the coefficients r = 0.618; 0.618 and 0.547, respectively. At the same time, the results indicated that there was no correlation between the Flu and LMW-PAHs in plants and infusions (r = 0.222 and 0.251, respectively).
Some authors indicated as possible reasons for the weak correlations, the influence of different PAH absorption and transformation processes by different plant species [27]. This was also shown in our study, in the cases of Taraxacum officinale and Artemisia absinthium, where the dry product were heavily contaminated, while the infusions had a relatively lower content of PAHs. This discrepancy confirms that there is no obvious relationship between the levels of contamination of the dried plant ant its infusion. The level itself depends on parameters such as the type and composition of the plant from which the infusion was prepared.
The average total PAHs content (∑16PAHs) in infusions varied between 612.55±46.12 and 2292.2±140.24ng/L. These values are higher than the data reported by Ciemniak et al., (2019), [12] for herbal infusions (153-253ng/L), but lower than those reported by Girelly et al., (2017), of 3471-3120 ng/L [28].
3.2. Transfer rate (%) of PAHs
This study also determined the percentage of PAHs transfer from the dried plants to the infusions, and the results are shown in Figure 1. It can be seen that the sum of the 16 PAH compounds shows similar percentages (22.13%, 26.51% and 22.89%, respectively), for the plants Hypericum perforatum, Matricaria chamomilla and Crataegus monogyna, while for Taraxacum officinale and Achillea millefolium, the percentages were significantly lower (7.21% and 16.91%). At the same time, it can be seen that the transfer rate of PAHs in the case of Taraxacum officinale is much lower compared to Matricaria chamomilla, even if the content of these compounds in the dry plant was higher.
Regarding the LMW- and HMW- compounds, the presence of both groups in infusions can be observed, the percentage of transfer varying from 6.64% to 37.50% and 7.42 to 31.72%, respectively (Figure 2). Data reported in the literature indicate that HMW- compounds present a lower solubility in water that those with low molecular weight [29]. This can be observed in our case with Artemisia absinthium, where the HMW-compounds did not pass into the infusions. On the other hand, our results may show that not only water solubility determines the number of PAHs transferred from the dried plant to the solubility. Numerous studies have mentioned that most PAHs are deposited on the surface of the leaves, they can easy pass into infusions, and on the other hand some lipophilic compounds from plants (e.g. essential oils) can facilitate the passage of PAHs into aqueous infusions. Zachara et al., (2018) and Lin et al., (2005) suggest that essential oils can act as co-solvents for many lipophilic substances and therefore can influence the solubility of these compounds in water [30,31]. Another factor that could affect transfer rate is the way the infusion is prepared. Duedahl-Olesen et al., (2015) studied different tea infusion times and obtained different PAH transfer percentages [32].
In the case of 4PAHs the transfer percentages varied between 9.56% and 29.78% for Taraxacum officinale and Calendula officinalis, respectively, the contribution being especially given by the BabF and BaP compounds. The average percentage transferred was 22.54%. Compared to other studies, transfer rates were higher than those reported in herbal teas [12,13].
2.3. Health Risk Evaluation
Herbal therapy, as an alternative to classical medicinal therapies, is increasingly successful among the population in all areas of the globe. The increased consumption of herbal medicinal products (infusions, decoctions, macerations, etc.) determines the need for studies on the risk of consumption of these products, with reference to possible contamination with PAHs, pesticides or heavy metals.
In this study, the health risk posed by PAHs from the consumption of herbal infusions was assessed using BaP and 4PAHs as markers for the presence of these compounds in the infusions [1]. Calculations for the intake of exposure to herbal tea consumption (EDI, ng/kg.bw/day) were performed using the average concentrations of BaP and 4PAHs (ng/L) by daily consumption of tea (200mL) relative to an average body weight of 70kg.
Values for Margins of Exposure (MOEs), [1] were calculated, as being the ratio of lower confidence limit of the reference dose (BMDL10) to the estimated daily intake (EDI). According to EFSA (Panel on Dietetic Products et al, 2016), health concerns associated with dietary exposure to PAHs may occur at MOE values close to or below 10,000 [33]. Table 4 presents the EDI and MOE values of the average concentrations of BaP and 4 PAHs in the types of tea infusion.
The exposure intake values for medicinal tea consumption (EDI) were between 0.063 and 1.246 (ng/kg.bw/day) for BaP and between 0.254 and 2.268 (ng/kg.bw/day) for 4PAHs. At the same time, the results for Margins of Exposure (MOEs) ranged from 56179 to 1111110 for BaP and from 149911 to 1343873 for 4PAHs, the values being well above the reference value of 10,000.
The MOE values obtained in this study are different from those reported by Ciemniaket al., (2019); Lan-Anh et al, (2020) and Roszko et al., (2018), for herbal teas [13,25,34].
Based on these results, we can conclude that PAHs exposure through the consumption of medicinal teas poses a low health risk. However, taking into account the fact that the intake of PAHs from food is also added to that from “health products”, we consider it necessary to control medicinal plants and medicinal preparations, as well as food.
5. Conclusions
In this study, the content of PAHs in dried medicinal plants and their infusions were analysed. In dried plants, HMW- compounds predominate, among which benzo[b]fluoranthene (BbF) and benzo[a]pyrene (BaP) were present in all samples.
The total PAHs content (∑16PAH) varied significantly both in dried plants and in infusions. The statistical analysis showed that these were strong and weak correlations between the content of individual PAHs in the dried plants and their infusions.
The average transfer rates of BaP and 4PAHs as markers of PAHs contamination varied between 8.59 - 28.82% and 9.56 - 29.78%, respectively, the highest values being obtained for Hypericum perforatum. In the case of ∑16PAH compounds, the transfer percentages varied from 7.25% (Taraxacum officinale) to 32.86% (Calendula officinalis).
The risk analysis for consumption, evaluated by the MOE values obtained, well above the reference value established by EFSA (2016), showed that the consumption of medicinal teas presents a low risk to health.
However, taking into account the fact the daily intake of PAHs from food and other sources (smoking, harmful environment, drinking water) is also added to that from “health products”, we believe that it is necessary to control plants and herbal medicinal preparations, as well as the food.
Author Contributions
Conceptualization, M.M.B. and S.B.; methodology, V.C.; software, N.A.D; validation, A.D.D.; formal analysis, S.B..; investigation, N.A.D.; resources, V.C.; writing—original draft preparation, S.B.; writing—review and editing, M.M.B.; visualization, E.R..; supervision, V.C; All authors have read and agreed to the published version of the manuscript.
Funding
This research received no external funding.
Data Availability Statement
The original contributions presented in the study are included in the article, further inquiries can be directed to the corresponding author.
Acknowledgments
National Institute for Marine Research and Development “Grigore Antipa”.
Conflicts of Interest
The authors declare no conflicts of interest.
References
- European Food Safety Authority (EFSA). Polycyclic aromatic hydrocarbons in food scientific opinion of the panel on contaminants in the food chain. EFSA J. 2008, 724, 1–114EF.
- European Commission (EU), Commission Regulation No.2015/1933 of 27 October 2015 amending Regulation (EC) No1881/2006 as regards maximum levels for polycyclic aromatic hydrocarbons in cocoa fibre, banana chips, food supplements, dried herbs and dried spices. Off J Eur Union L. 2015. 282, 11–13.
- International Agency for Research on Cancer (IARC). Some non-heterocyclic polycyclic aromatic hydrocarbons and some related exposures. Monographs on the Evaluation of Carcinogenic Risks to Humans. 2010, 92, 1–868. Retrieved from https://publications.iarc.fr/110. [Google Scholar]
- Ijeabuonwu, A.C.M.; Bernatoniene, J.; Pranskuniene, Z. Medicinal Plants Used to Treat Skin Diseases and for Cosmetic Purposes in Norway. Plants. 2024, 13, 2821. [Google Scholar] [CrossRef] [PubMed]
- Ajayi, O.E.; Yoon, S.Y. ; Moon,S. ; Kim,K.H.; Kim,J.H.; Chung, J-W.; Jang, K-I.; Hyun, T.K. Variability in Phytochemical Contents and Biological Activities among Adenophora triphylla Genotypes. Appl. Sci. 2023, 13, 11184. [Google Scholar]
- Borah, P.; Deka, H. Polycyclic aromatic hydrocarbon (PAH) accumulation in selected medicinal plants: a mini review. Environ Sci Pollut R. 2024, 31, 36532–50. [Google Scholar] [CrossRef]
- Bratu. M.M.; Birghila, S.; Coatu, V.; Danilov, D.A.; Radu, M.D.; Birghila, C. Polycyclic Aromatic Hydrocarbons (PAHs) in Some Commercial Herbal Teas. Polycycl Aromat Comp. 2023, 43, 2269–82. [Google Scholar] [CrossRef]
- Cacho, J.I.; Campillo, N.; Viñas, P.; Hernández-Córdoba, M. Use of headspace sorptive extraction coupled to gas chromatography–mass spectrometry for the analysis of volatile polycyclic aromatic hydrocarbons in herbal infusions. J Chromatogr A. 2014, 1356, 38–44. [Google Scholar] [CrossRef]
- Thea, A.E.; Ferreira, D.; Brumovsky, L.A.; Schmalko, M.E. Polycyclic aromatic hydrocarbons (PAHs) in yerba mate (Ilex paraguariensis St. Hil) traditional infusions (mate and terere). Food Control, 2016; 60, 215–220. [Google Scholar]
- Sadowska-Rociek, A.; Surma, M. Levels and risk assessment of polycyclic aromatic hydrocarbons, acrylamide and 5-hydroxymethylfurfural in yerba mate and its infusions. Food Control. 2023, 152, 109860. [Google Scholar] [CrossRef]
- Schulz, C.M; Fritz, H.; Ruthenschror, A. Occurrence of 15 + 1 EU priority polycyclic aromatic hydrocarbons (PAH) in various types of tea (Camellia sinensis) and herbal infusions. Food Addit Contam A. 2014, 3, 1723–35. [Google Scholar] [CrossRef]
- Ciemniak, A.; Kuzmicz, K.; Rajkowska-Mysliwiec, M.; Cadena, M.F. Assessing the contamination levels of dried teas and their infusions by polycyclic aromatic hydrocarbons (PAHs). J Consum Prot Food S. 2019, 14, 263–74. [Google Scholar] [CrossRef]
- Georgieva, S.K.; Georgieva, A.; Peteva, Z.V.; Trifonova, T.P. Polycyclic aromatic hydrocarbons contamination levels of dried herbal teas and their infusions. Eur Food Res Technol. 2023, 249, 3001–9. [Google Scholar] [CrossRef]
- European Pharmacopoeia (EP). Monographs on herbal drugs and herbal drug preparations. Council of Europe. 2019, 1, 1289–1675. [Google Scholar]
- Training Manual on the Measurement of Organochlorine and Petroleum Hydrocarbons in Environmental Samples; “IAEA-MEL” Monaco, 1995.
- Agency Risk Assessment Forum. US EPA Washington, DC. 2005.
- European Commission (EU), Commission Regulation No 835/2011 of 19 August 2011 amending regulation (EC) No 1881/2006 as regards maximum levels for polycyclic aromatic hydrocarbons in foodstuffs. Official Journal of the European Union L. 2011, 215, 9–16.
- Bensona, N.U.; Fred-Ahmadua, O.H.; Olugbuyirob, J.A.O.; Anakea. W.U.; Adedapoa, A.E.; Olajire, A.A. Concentrations, sources and risk characterisation of polycyclic aromatic hydrocarbons (PAHs) in green, herbal and black tea products in Nigeria. J Food Compos Anal. 2018, 66, 13–22. [Google Scholar] [CrossRef]
- Malik, J.; Frankova, A.; Drabek, O.; Szakova, J.; Ash, C.; Kokoska, L. Aluminium and other elements in selected herbal tea plant species and their infusions. Food Chem. 2013, 139, 728–34. [Google Scholar] [CrossRef] [PubMed]
- Elallem, K.A.; Bakrim, W.B.; Yasri, A.; Boularbah, A. Growth, Biochemical Traits, Antioxidant Enzymes, and Essential Oils of Four Aromatic and Medicinal Plants Cultivated in Phosphate-Mine Residues. Plants. 2024, 13, 2656. [Google Scholar] [CrossRef]
- Simonich, S.L.; Hites, R.A. Organic pollutant accumulation in vegetation. Environ Sci Technol. 1995, 29, 2905–14. [Google Scholar] [CrossRef]
- Moeckel, C.; Nizzetto, L.; Strandberg, B.; Lindroth, A.; Jones, K.C. Air−Boreal forest transfer and processing of polychlorinated biphenyls. Environ Sci Technol. 2009, 43, 5282–89. [Google Scholar] [CrossRef]
- Pincemaille, J.; Schummer, C.; Heinen, E.; Moris, G. Determination of polycyclic aromatic hydrocarbons in smoked and non-smoked black teas and tea infusions. Food Chem. 2014, 145, 807–13. [Google Scholar] [CrossRef]
- Tan, J.; Engelhard, U.H.; Lin, Z.; Kaiser, N.; Maiwald, B. Flavonoids, phenolic acids, alkaloids and theanine in different types of authentic Chinese white tea samples. J Food Compos Anal. 2017, 57, 8–15. [Google Scholar] [CrossRef]
- Lan-Anh, P.T.; Nguyen, T.N.; Nguyen, T.Q.; Nguyen, V.T.; Truong, T.K.; Duong, H.A.; Pham, H.V. Polycyclic aromatic hydrocarbons (PAHs) in dry tea leaves and tea infusions in Vietnam: contamination levels and dietary risk assessment. Environ Geochem Health. 2020, 42, 2853–63. [Google Scholar]
- Lin, D.; Zhu, L. Polycyclic aromatic hydrocarbons: Pollution and source analysis of a black tea. J. Agric. Food Chem. 2004, 52, 8268–71. [Google Scholar] [CrossRef] [PubMed]
- Adisa, A.; Jimenez, A.; Woodham, C.; Anthony, K.; Nguyen, T.; Saleh, M.A. Determination of polycyclic aromatic hydrocarbons in dry tea. J. Environ. Sci. Health B. 2015, 50, 552–59. [Google Scholar] [CrossRef] [PubMed]
- Girelli, A.M.; Apriceno, A.; Tarola, A.M.; Tortora, F. Determination of polycyclic aromatic hydrocarbons in tea infusions samples by high performance liquid chromatography with fluorimetric detection. J Food Quality. 2017, 7, 1076876. [Google Scholar] [CrossRef]
- da Silva Pinto, M. Tea: A new perspective on health benefits. Food Res Int. 2013, 53, 558–67. [Google Scholar] [CrossRef]
- Zachara, A.; Gałkowska, D.; Juszczak, L. Contamination of Tea and Tea Infusion with Polycyclic Aromatic Hydrocarbons. Int. J. Environ. Res. Public Health. 2018, 15, 45. [Google Scholar]
- Lin, D.; Tu, Y,; Zhu, L. Concentrations and health risk of polycyclic aromatic hydrocarbons in tea. Food Chem Toxicol. 2005, 43, 41–8. [Google Scholar] [CrossRef]
- Duedahl-Olesen, L.; Navaratnam, M.A.; Jewula, J.; Jensen, A.H. PAH in some brands of tea and coffee. Polycycl Aromat Comp. 2015, 35, 74–90. [Google Scholar] [CrossRef]
- Turck, D.; Bresson, J.L.; Burlingame, B.; Dean, T.; Fairweather-Tait, S.; Heinonen, M.; Hirsch-Ernst, K.I; Mangelsdorf, I.; McArdle, H. Panel on Dietetic Products, Nutrition and Allergies (EFSA). Guidance on the preparation and presentation of the notification and application for authorisation of traditional foods from third countries in the context of regulation (EU) 2015/2283. EFSA Journal. 2016, 14, e04590. [Google Scholar]
- Roszko, M.; Kaminska, M.; Szymczyk, M.; Je˛drzejczak, R. Dietary risk evaluation for 28 polycyclic aromatic hydrocarbons (PAHs) in tea preparations made of teas available on the Polish retail market. J Environ Sci Health B. 2018, 53, 25–34. [Google Scholar] [CrossRef]
Figure 1.
Transfer rate (%) of PAHs - no transfer to infusion was taken into account when the PAHs in tea leaves are <LOD;.
Figure 1.
Transfer rate (%) of PAHs - no transfer to infusion was taken into account when the PAHs in tea leaves are <LOD;.
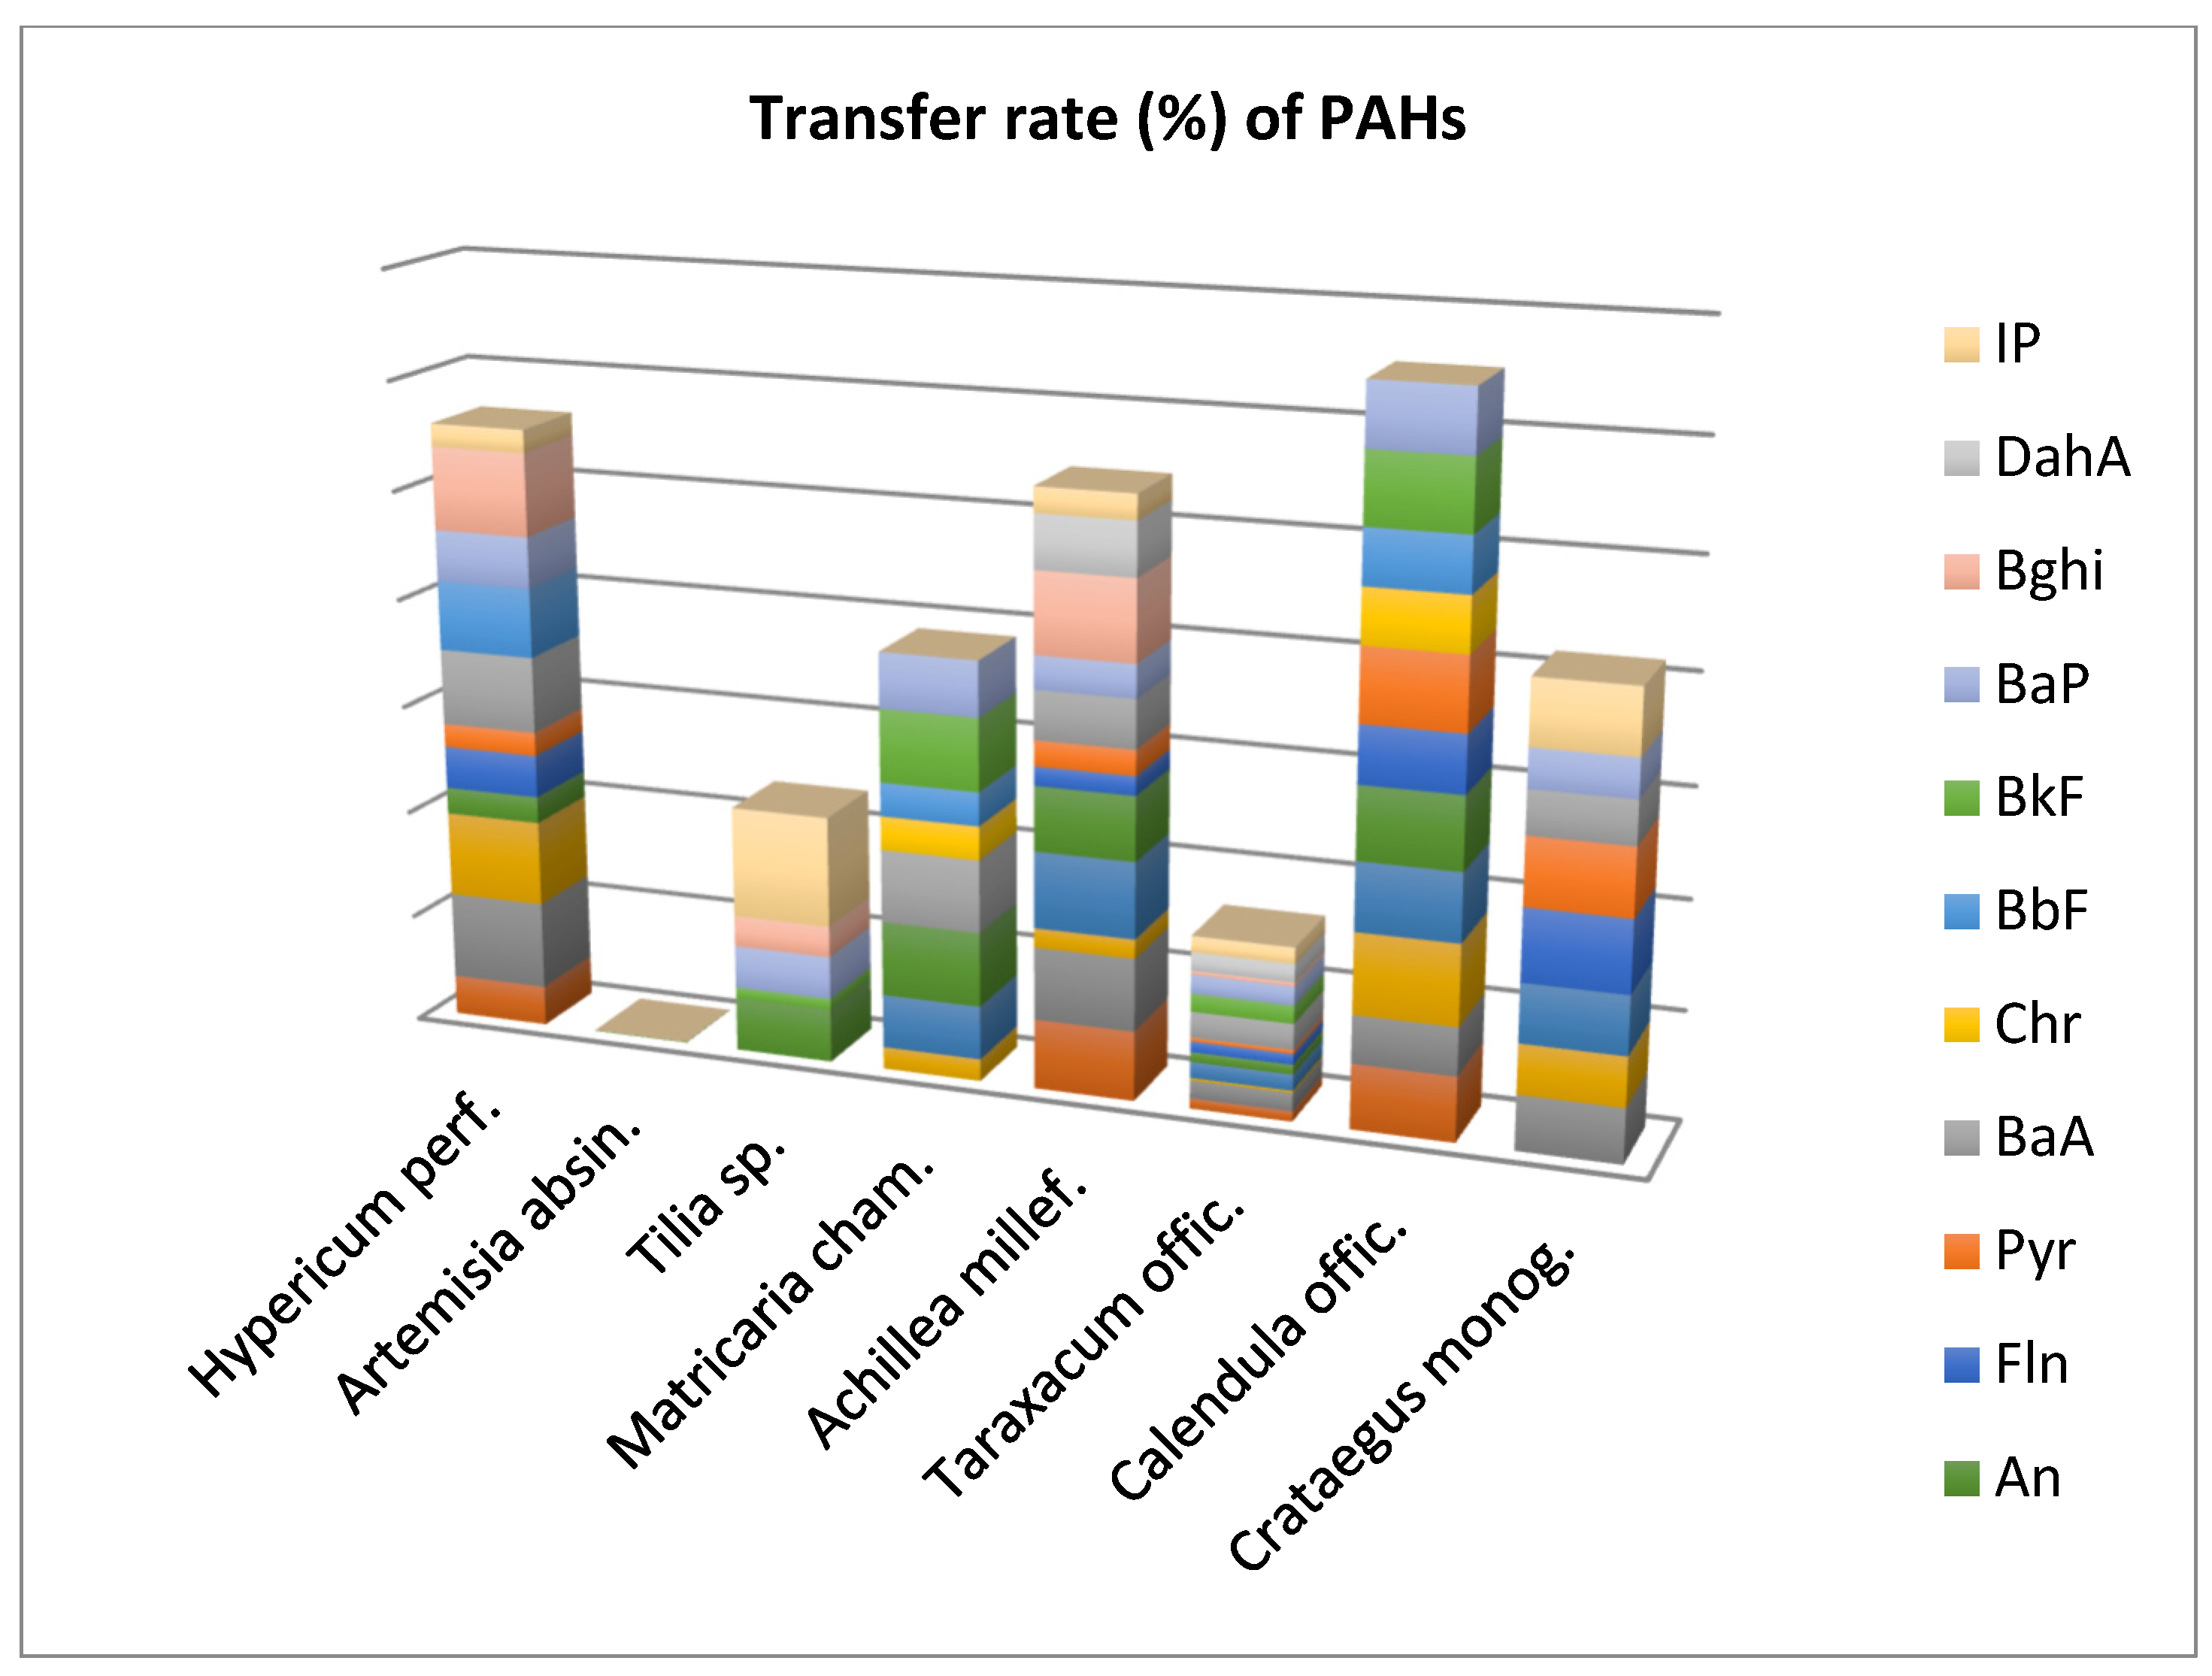
Figure 2.
Transfer rate (%) of 4PAHs, LMW- and HMW- compounds.
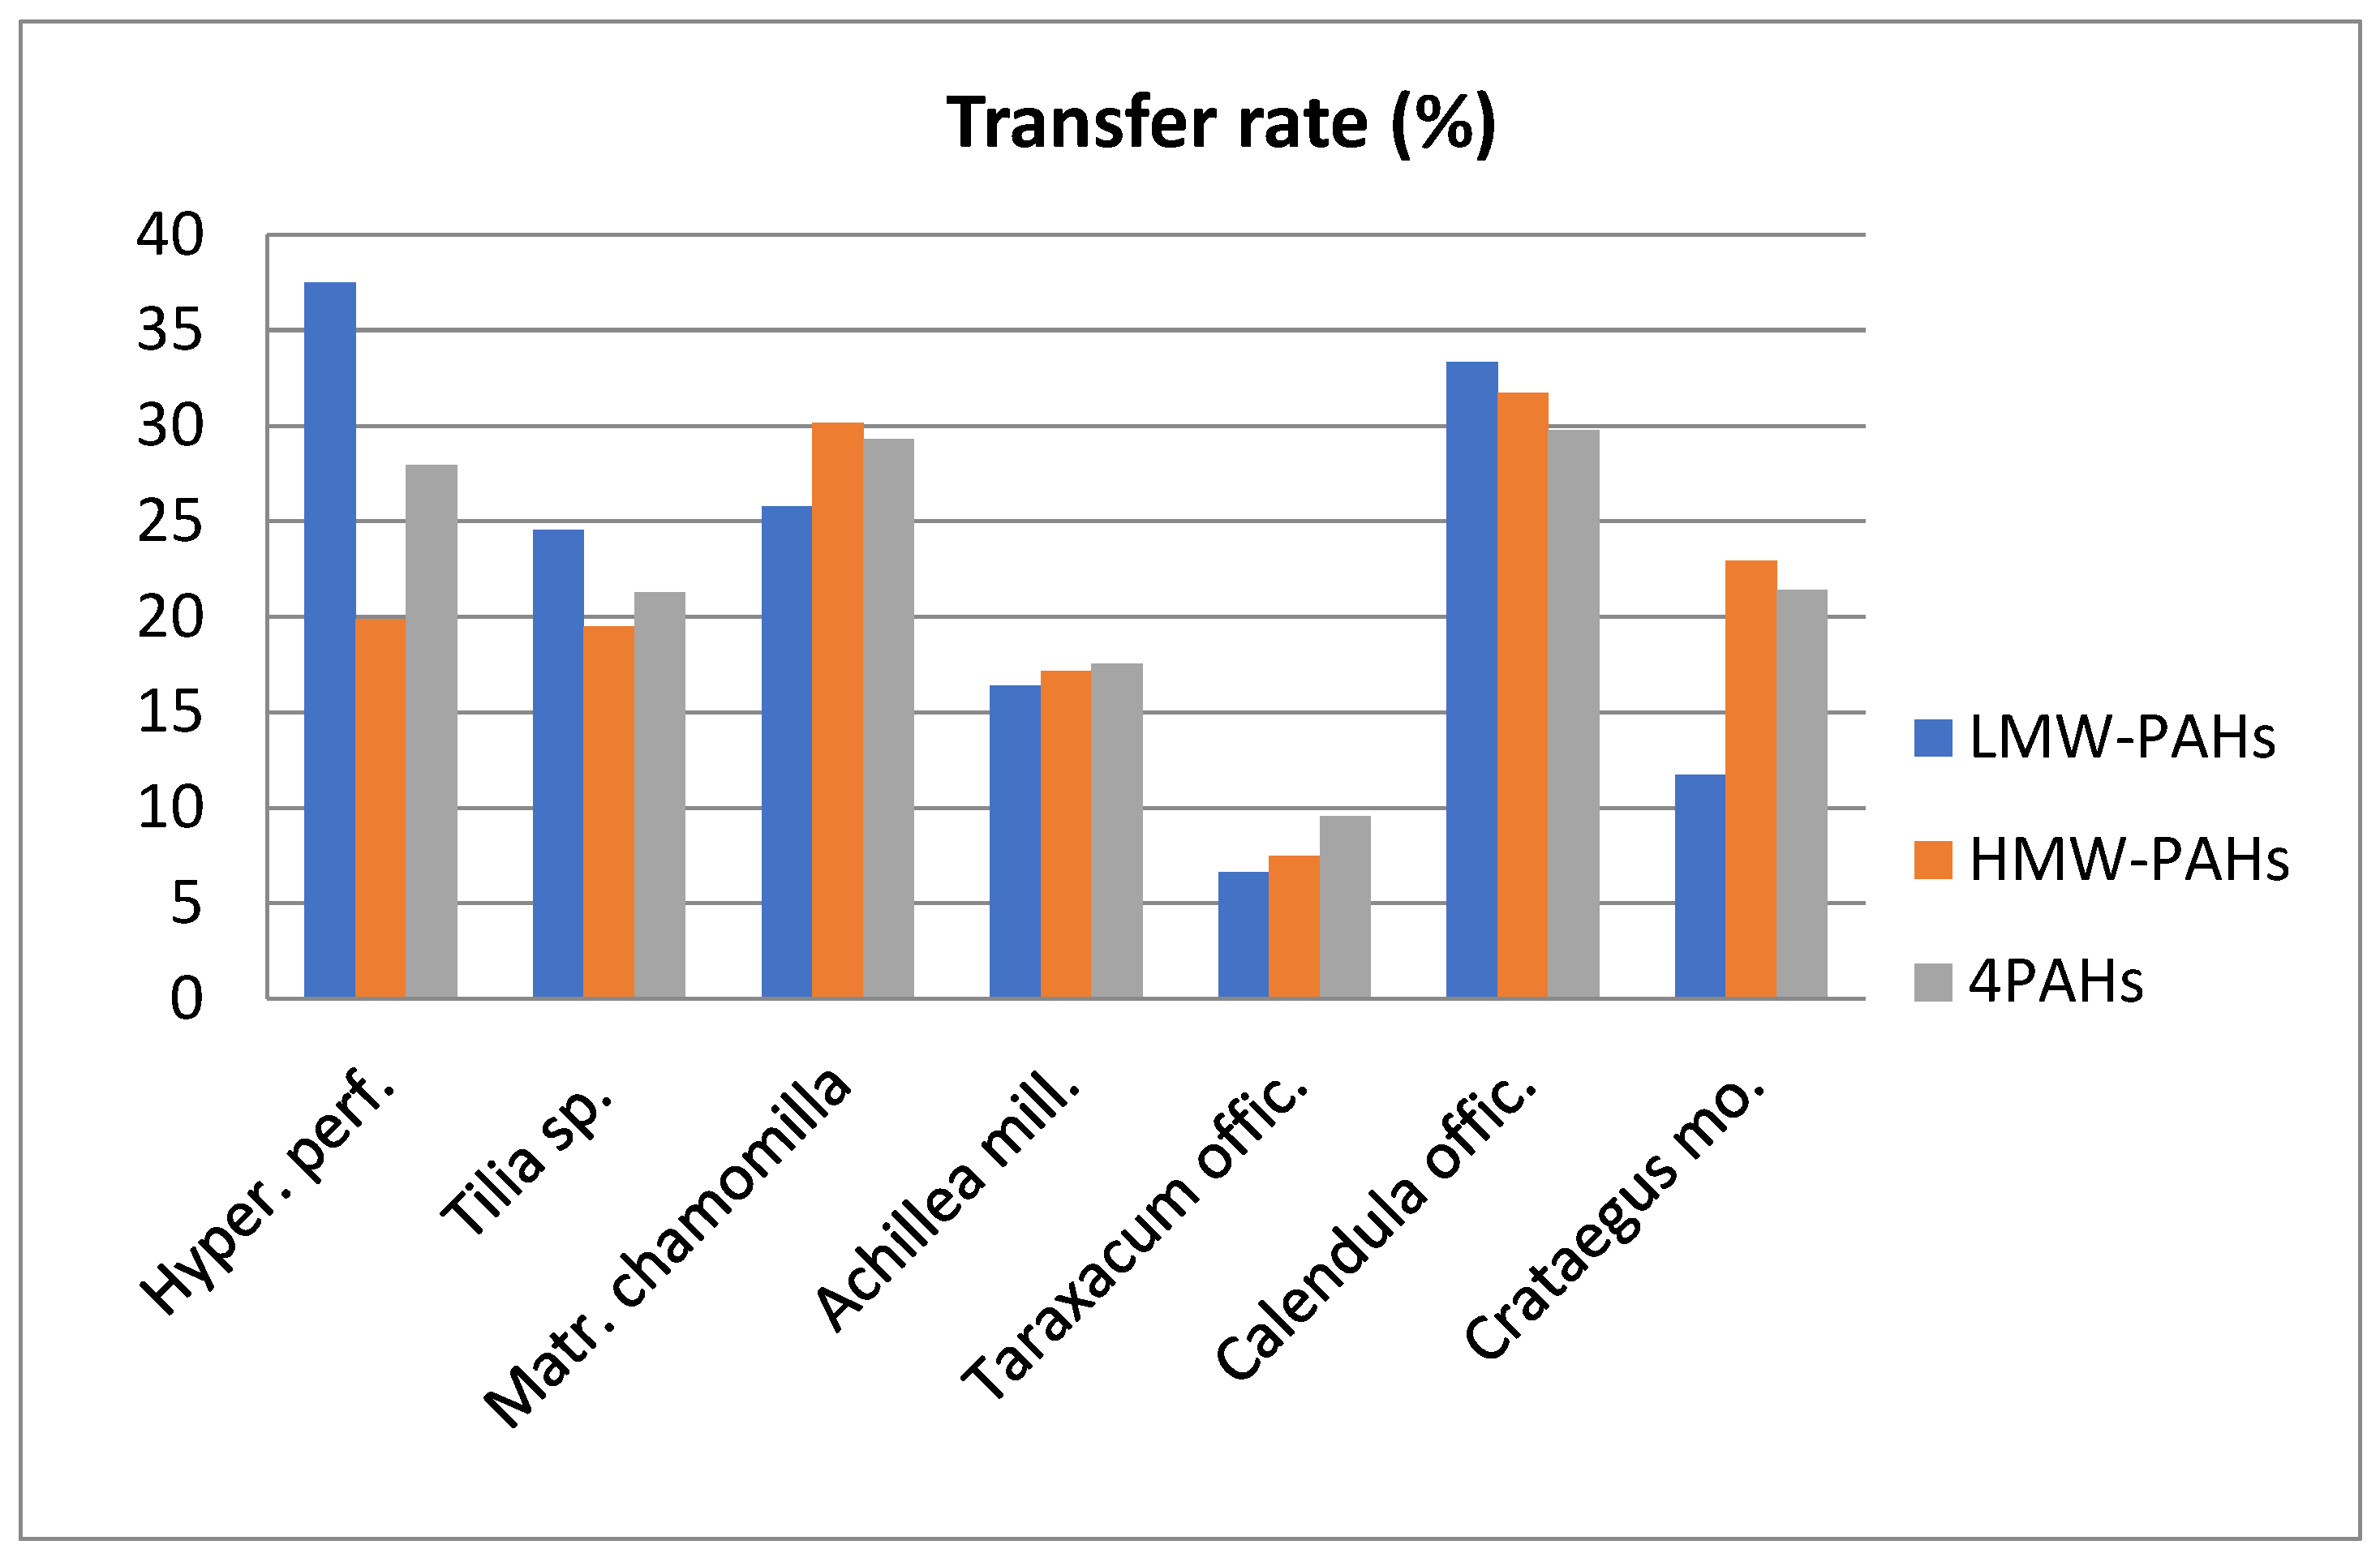

Table 1.
Retention time, monitored ion, linearity, and limits of detection (LOD) of PAHs.
| PAHs | Retention Time | m/z | Linearity (R2) | LOD (µg/g) dwt |
|---|---|---|---|---|
| Na | 7.25 | 128 | 0.9885 | 0.0001 |
| Ac | 13.70 | 152 | 0.9937 | 0.0001 |
| Ace | 14.50 | 154 | 0.9933 | 0.0001 |
| Flu | 16.57 | 166 | 0.9945 | 0.0001 |
| Ph | 20.36 | 178 | 0.9922 | 0.0001 |
| An | 20.56 | 178 | 0.9968 | 0.0001 |
| Fln | 25.04 | 202 | 0.9923 | 0.0001 |
| Pyr | 25.87 | 202 | 0.9980 | 0.0001 |
| BaA | 30.74 | 228 | 0.9972 | 0.0001 |
| Chr | 30.90 | 228 | 0.9946 | 0.0001 |
| BbF | 33.80 | 252 | 0.9840 | 0.0001 |
| BkF | 34.00 | 252 | 0.9734 | 0.0001 |
| BaP | 34.68 | 252 | 0.9858 | 0.0001 |
| Bghi) | 37.20 | 276 | 0.9765 | 0.0001 |
| DahA | 37.40 | 278 | 0.9823 | 0.0001 |
| IP | 37.74 | 276 | 0.9756 | 0.0001 |
Table 2.
PAH levels (µg/kg) in medicinal plants (n=3)
| Hypericum perforatum | Artemisia absinthium | Tilia sp. | Matricaria chamomilla | Achillea millefolium | Taraxacum officinale | Calendula officinalis | Crataegus monogyna | |
|---|---|---|---|---|---|---|---|---|
| Na | BLD | BLD | BLD | BLD | 57.32±7.25 | 3.53±1.02 | BLD | BLD |
| Ac | 0.5 8±0.01 | 2.23±0.45 | BLD | BLD | 5.72±1.05 | 33.96±6.14 | 0.57±0.01 | BLD |
| Ace | 7.61±0.82 | 0.10±0.001 | BLD | BLD | 110.08±10.11 | 64.59±9.12 | 6.02±1.13 | 9.82±1.89 |
| Flu | 157.08±10.23 | 16.46±3.87 | BLD | 1.72±0.63 | 302.8±14.30 | 191.65±10.78 | 137.30±6.89 | 21.09±3.12 |
| Ph | BLD | 9.93±1.90 | BLD | 223.3±16.23 | 27.02±4.38 | 180.46±12.40 | 195.71±12.10 | 6.74±1.24 |
| An | 10.26±1.14 | BLD | 4.64±0.76 | 6.37±1.89 | 56.53±10.12 | 57.91±5.75 | 14.76±3.65 | BLD |
| Fln | 4.29±0.70 | 58.80±8.12 | BLD | BLD | 25.05±4.87 | 36.38±6.12 | 0.51±0.02 | 8.62±2.01 |
| Pyr | 5.08±1.12 | 92.12±10.32 | BLD | BLD | 18.76±3.19 | 136.68±10.12 | 72.07±5.89 | 6.94±1.78 |
| BaA | 0.24±0.01 | BLD | BLD | 10.14±2.03 | 32.86±5.23 | 166.46±8.45 | BLD | 1.56±0.34 |
| Chr | BLD | BLD | BLD | 1.00±0.02 | BLD | BLD | 0.67±0.03 | BLD |
| BbF | 109.04±12.20 | 201.12±12.38 | 224.52±18.23 | 14.8±2.78 | 203.04±16.12 | 117.91±6.23 | 32.20±5.60 | 147.91±10.12 |
| BkF | BLD | BLD | 324.80±20.12 | 9.37±1.53 | BLD | 446.32±25.70 | 48.31±4.73 | BLD |
| BaP | 102.87±17.12 | 148.46±9.12 | 220.06±15.10 | 10.40±2.02 | 212.39±9.24 | 379.00±16.26 | 52.87±10.12 | 295.23±15.76 |
| Bghi | 5.10±1.35 | BLD | 52.81±7.14 | BLD | 93.42±10.11 | 124.30±8.15 | BLD | BLD |
| DahA | BLD | BLD | BLD | BLD | 55.87±4.56 | 131.56±12.01 | BLD | BLD |
| IP | 186.20±15.21 | BLD | 66.93±8.23 | BLD | 425.57±27.12 | 395.75±24.17 | BLD | 76.53±6.89 |
| ∑4PAHs | 212.15±12.14 | 349.58±25.62 | 444.56±20.15 | 36.43±9.24 | 448.29±18.24 | 603.37±35.26 | 85.74±9.80 | 444.7±32.69 |
| LMW-PAHs | 174.95±16.10 | 28.72±4.25 | 4.64±0.28 | 231.42±12.56 | 559.55±30.10 | 532.1±17.89 | 354.36±40.12 | 37.6±5.85 |
| HMW-PAHs | 412.82±19.31 | 500.5±34.20 | 889.12±50.42 | 45.8±8.10 | 1066.96±101.12 | 1934.36±101.30 | 206.63±12.34 | 536.79±38.12 |
| ∑16PAHs | 587.77±32.45 | 529.22±25.12 | 893.66±38.19 | 277.22±12.78 | 1626.51±65.92 | 2466.46±203.45 | 560.99±45.70 | 577.44±23.18 |
BLD – Below limit of detection.
Table 3.
PAH levels (ng/L) in herbal tea infusions (n=3)
| Hypericum perforatum | Artemisia absinthium | Tilia sp. | Matricaria chamomilla |
Achillea millefolium |
Taraxacum officinale |
Calendula officinalis |
Crataegus monogyna | |
|---|---|---|---|---|---|---|---|---|
| Na | BLD | BLD | BLD | BLD | BLD | BLD | BLD | BLD |
| Ac | 0.9±0.01 | BLD | BLD | BLD | 15.3±2.67 | 13.33±1.89 | 1.42±0.11 | BLD |
| Ace | 25.4 ±2.72 | BLD | BLD | BLD | 306.3±19.30 | 45±4.38 | 11.07±2.04 | 20.68±3.42 |
| Flu | 510.0±32.14 | BLD | BLD | 1.46±0.45 | 223.7±24.15 | 103.04±10.12 | 423.81±56.12 | 39.13±2.97 |
| Ph | BLD | BLD | BLD | 477.8±26.12 | 78.8±5.78 | 111.73±7.90 | 512.95±38.21 | 15.07±3.01 |
| An | 10.5±1.09 | BLD | 9.5±1.79 | 18.19±3.08 | 140.0±10.01 | 21.66±2.78 | 41.0±5.10 | BLD |
| Fln | 7.23 ±1.01 | 1.49±0.10 | BLD | BLD | 18.0±2.89 | 15.0±2.68 | 1.12±0.09 | 23.79±3.02 |
| Pyr | 4.6±0.76 | BLD | BLD | BLD | 18.3±1.90 | 20.33±3.0 | 201.76±10.7 | 17.93±4.4 |
| BaA | 0.7±-.01 | BLD | BLD | 28.18±4.79 | 61.6±4.06 | 105±11.20 | BLD | 2.62±0.18 |
| Chr | BLD | BLD | BLD | 1.29±0.10 | BLD | BLD | 1.40±0.12 | BLD |
| BbF | 290.6±23.61 | BLD | 427.0±19.24 | 37.27±5.14 | 342.1±45.12 | 111±9.57 | 84.44±12.20 | 355.17±54.29 |
| BkF | BLD | BLD | 412.5±16.18 | 26.18±3.29 | BLD | 310±19.20 | 130.53±16.41 | BLD |
| BaP | 202.9±27.14 | BLD | 360.7±14.21 | 22.18±2.81 | 270.0±15.67 | 280±31.28 | 126.97±9.27 | 436.21±12.56 |
| Bghi | 16.3±2.11 | BLD | 62.75±8.14 | BLD | 290.6±20.11 | 17.75±2.78 | BLD | BLD |
| DahA | BLD | BLD | BLD | BLD | 115.9±8.90 | 91.81±5.11 | BLD | BLD |
| IP | 162.2±17.82 | BLD | 282.79±13.12 | BLD | 411.3±19.24 | 245.28±34.10 | BLD | 190.98±10.31 |
| ∑4PAHs | 494.2±19.47 | - | 787.7±32.10 | 88.92±11.26 | 655.7±110.34 | 496±45.21 | 212.81±10.2 | 794±129.12 |
| LMW-PAHs | 546.8±23.15 | - | 9.5±1.78 | 497.45±32.65 | 764.1±68.12 | 294.76±30.23 | 990.25±135.12 | 74.88±4.64 |
| HMW-PAHs | 684.3±20.02 | - | 1445.74±89.25 | 115.1±10.28 | 1528.1±70.11 | 1196.17±120.34 | 546.22±65.25 | 1026.7±98.14 |
| ∑16PAHs | 1231.1±101.12 | 1.49±0.10 | 1555.64±78.13 | 612.55±46.12 | 2292.2±140.24 | 1490.93±68.34 | 1536.47±101.34 | 1101.58±100.34 |
BLD – Below limit of detection.
Table 4.
Margins of Exposure (MOEs) values for BaP and 4PAHs in tea infusions
|
Plants |
BaP | 4PAHs | ||||
|---|---|---|---|---|---|---|
| C | EDI | MOEs | C | EDI | MOEs | |
| Hypericum perforatum | 202.9 | 0.579 | 120898 | 494 | 1.411 | 240963 |
| Artemisia absinthium | - | - | - | - | - | - |
| Tilia sp. | 360.7 | 1.030 | 69961 | 787.7 | 2.25 | 1338582 |
| Matricaria chamomilla | 22.18 | 0.063 | 1111110 | 88.92 | 0.254 | 1343873 |
| Achillea millefolium | 270 | 0.771 | 90791 | 655.7 | 1.873 | 181526 |
| Taraxacum officinale | 280 | 0.8 | 87500 | 496 | 1.417 | 239943 |
| Calendula officinalis | 126.97 | 0.362 | 193370 | 212.81 | 0.608 | 559210 |
| Crataegus monogyna | 436.21 | 1.246 | 56179 | 794 | 2.268 | 149911 |
C (ng/L); EDI (ng/Kg.bw./day).
Disclaimer/Publisher’s Note: The statements, opinions and data contained in all publications are solely those of the individual author(s) and contributor(s) and not of MDPI and/or the editor(s). MDPI and/or the editor(s) disclaim responsibility for any injury to people or property resulting from any ideas, methods, instructions or products referred to in the content. |
© 2024 by the authors. Licensee MDPI, Basel, Switzerland. This article is an open access article distributed under the terms and conditions of the Creative Commons Attribution (CC BY) license (https://creativecommons.org/licenses/by/4.0/).
Copyright: This open access article is published under a Creative Commons CC BY 4.0 license, which permit the free download, distribution, and reuse, provided that the author and preprint are cited in any reuse.


