
Submitted:
15 October 2024
Posted:
16 October 2024
You are already at the latest version
Abstract
Tire wear particles (TWP) are among the most relevant sources of microplastic pollution of the environment. Nevertheless, common analytical methods like IR- and Raman spectroscopy are highly impaired by additives and filler materials, leaving only thermo-gravimetric methods for chemical analysis of TWP in most cases. We herein present quantitative NMR spectroscopy (qNMR) as an alternative tool for the quantification of the polymeric material used for the production of tires including natural rubber (NR), styrene-butadiene-copolymer (SBR), polyethylene-polypropylene-copolymer (EPR) and polybutadiene (BR). Limits of quantification between 3 µg and 43 µg per sample and recovery rates of 72-92% are achieved for all tested polymer types. The first results of combining these measurements with Soxhlet extraction as a sample preparation tool are presented alongside the qNMR experiments.
Keywords:
quantitative NMR spectroscopy
; microplastic
; Soxhlet extraction
; natural rubber
; styrene-butadiene-copolymer
; polyethylene-polypropylene-copolymer
; polybutadiene
1. Introduction
The abundance of microplastic particles (MP) is a well-known issue for most environmental scientists. However, recent research gave rise to the fact, that the majority of MP might originate from tires and roads. In 2021 Brahney et al. published a study indicating that up to 84% of airborne MP stems from this source, mainly deriving from resuspended road dust [1]. Depending on the study, around 0.2-5.5 kg per year and capita are estimated as global emissions [2]. At the same time, different from regular MP, polymers usually form various kinds of agglomerates at the tire-road interface, thus the resulting particles only partially consist of rubber material, while the rest is made up of mineral-based road dust and various tire additives [3,4,5]. In consequence, several interchangeable terms for these kinds of particles are in use, sometimes including every type of material incorporated into these particles and sometimes only focusing on the rubber-based material. The most common terms are “tire and road wear particles” (TWRP) and “tire wear particles” (TWP or TP) [2,3,5,6,7]. In the following, we will use the term TWP to describe all forms of TWRP and TWP, but will mainly focus on their polymer-based components. Nevertheless, due to this heterogeneity, TWP and TWRP are not always considered MP, and comparing them with regular forms of MP is difficult due to the additional lack of necessary data [5,8].
TWP analysis or even quantification therefore is much more difficult than for regular MP. Although traditional standard methods for MP analysis like IR and Raman spectroscopy can be used, they are highly impaired due to irradiation-absorbing filler materials or fluorescent additives [9,10,11]. Hence, most analyses are performed by other common methods like optical identification, which, however, tends to be biased, or more frequently by thermogravimetric methods like pyrolysis coupled with gas chromatography-mass spectrometry (pyr-GC/MS), which often struggle with the selection of appropriate marker substances [2,5,6,9,11]. For this reason, we hereby introduce quantitative nuclear magnetic resonance spectroscopy (qNMR) for the quantification of the polymer-based part of TWP. In recent years, our group and others have shown that qNMR represents a highly useful tool in the quantification of MP [12,13,14,15,16,17,18,19]. qNMR combines chemical identification with mass-based quantification and to some extent spectral separation of sample components. At the same time measurements are fast and in contrast to thermo-gravimetric methods non-destructive [9,14].
In addition, sample preparation techniques are a key step in the transfer of measuring solutions spiked with the corresponding polymeric material as model samples to real environmental samples. So far, density separation, optical sorting and with certain limitations also chemical extraction are used to separate TWP from the surrounding matrix [2,6,7]. As discussed earlier, optical identification and separation methods inherit high biases in most cases, which makes them easy to perform but at the same time lowers their overall quality. Density separation on the other hand is already well known from traditional MP analysis. Various saline solutions are available, depending on the desired density for separation, but with increasing costs and hazards at greater densities [20]. The results are less biased but tend to differ significantly between studies [21]. A common difficulty poses the change in the density of MP due to weathering and fouling [22]. This issue seems to be even more pronounced in case of TWP, as mineral-based constituents significantly alter the polymer-specific density [3]. Therefore, more and more extraction-based methods are introduced in classic MP separation [19,21,23,24]. However, their adaption to TWP is not as easy, as e.g., vulcanisation of rubbers hinders proper dissolution in respective solvents. Instead, most often only leachable proportions are extracted and analysed [6].
2. Results and Discussion
2.1. qNMR Validation
A first requirement when measuring multiple polymer types in one common sample by qNMR is finding a suitable solvent, which can dissolve all targeted compounds. As especially synthetic polymers vary in their dissolution properties, we performed several preliminary tests for this purpose, leading us to THF as our preferred solvent for tire wear related polymers. In previous publications, we could already demonstrate the suitability of THF for measurements of PS, BR and even SBR [16]. Since many tire related polymers like PIR and NR share structural similarities with BR, foremost the presence of carbon carbon double bonds in the backbone of the polymer, we expected that THF would also work in this experiments. Moreover, these expectations were exceeded, when our preliminary tests showed that THF readily dissolves EPR polymers as well, albeit their homopolymers polyethylene and polypropylene are known to be generally insoluble at room temperature and atmospheric conditions [24,25,26]. Apart from sole solubility, also economic and practical aspects were considered leading to the use of non-deuterated THF as the solvent of choice for our qNMR studies on tire related polymers as it has already been shown that qNMR also works in non-deuterated solvents [15].
A second requirement, when using non-deuterated solvents like THF for qNMR, is selecting an internal standard, which is inert to all other compounds within the solution and at the same time gives sharp signals, which do not overlap with any other peaks. Although we were using HMDSO for that purpose in our previous research, we this time expected the HMDSO signal to be too close to other signals originating from EPR [16]. Therefore, we selected DMF as an internal standard instead. DMF depicts three signals within the spectra, two singlets at 2.78 ppm and 2.89 ppm and a third one at 7.91 ppm. All three signals do not interfere with any other signal, however, the singlet at 7.91 ppm is less likely to be affected by possible matrix signals in real environmental samples and was therefore selected as the internal standard of our validation experiments. DMF itself also inherits a very high boiling point of 153 °C, thus evaporation and by that changes in its concentration are not expected [27].
Figure 1 shows the 1H-NMR spectra of two samples containing tire related polymers. The upper spectrum shows signals for PS, BR, PIR, EPR and of course the internal standard DMF whereas the lower spectrum consists of signals representing SBR (with its components PS and BR) and NR next to DMF. EPR only consists of methylene groups and methyl groups in its propylene units. These groups generate two signals in total, one at 0.87 ppm for the methyl group and one at 1.31 ppm for the methylene group. Theoretically, a third signal for a single proton next to the methyl group could be expected around 1.5 ppm, however, the strong overlap with one of both THF signals impairs any further analysis in this region [28]. Unfortunately, both signals are rather unspecific. Especially methylene groups occur in almost every other polymer related to tire wear as well as in many naturally present organic compounds. A precise quantification of ethylene units is therefore not possible. The signal of the methyl groups in the propylene units of EPR, on the other hand, could be used for quantifications if two requirements are met. First, any other polymer must not contain a significant number of methyl groups and second, a proper sample preparation must ensure, that no matrix signal overlaps with that signal. However, a small overestimation of the propylene content is therefore expected.
Next to EPR also PIR and NR signals are shown in the upper and lower NMR spectrum of Figure 1. Usually, both polymers mainly consist of cis-1,4-polyisoprene. The major difference between both polymer types is that NR is a naturally occurring polymer whereas PIR is its synthetic counterpart. Thus, NR depending on its source might contain small traces of other compounds and can vary in its composition [3,29]. In terms of NMR analysis, almost the same signals are expected from NR and PIR. Aside from various methylene and methyl groups, slightly shifted by the nearby double bond, for quantification purposes, the most important signal derives from the single proton attached to the carbon carbon double bond at 5.15 ppm. Although this signal is very close to the BR-specific signal, they do not overlap due to the neighboring methyl groups in PIR and NR, which shift the signal in NR/PIR to slightly lower ppm values compared to the corresponding signal in BR.
BR on the other hand does not contain methyl groups. Fortunately, its signal corresponding to the single proton attached to the carbon carbon double bond is observed at 5.38 ppm and may therefore be quantified independently from the signals of NR and PIR. Together with aromatic PS signals between 6.30 ppm and 7.20 ppm, BR allows the quantification of SBR as demonstrated previously [16]. Therefore, PS, although not a typical tire polymer, was included in our investigation.
Comparing the calibration data listed in Table 1, for all selected polymers a linearity >0.999 was achieved, at the same time having low RMSD values. These data are in good correlation to calibration data for other types of MP measured by qNMR. In comparison, Peez et al. achieved linearities of 0.994-0.999 at concentrations of 0.03-3.20 mg/ml for common MP types, including PS [12]. LOD and LOQ are values mainly depending on the number of scans and the peak shape. Hence, BR and EPR, which both form sharp singlets, result in very low limits in the low µg/ml range. Here as well, Peez et al. determined a LOD of 1 µg/ml and a LOQ of 2 µg/ml using the same number of scans for PET, a polymer type, which also forms sharp singlets [15]. PS, on the contrary, gives slightly elevated LOD and LOQ values, as the signal for aromatic hydrogen atoms is much broader and therefore results in a lower SNR. If necessary, SNR values may be easily increased by accumulating more scans in each measurement, thus improving the LOD and LOQ as well. Unfortunately, the SNR will only improve by a factor of that way.
As depicted in Table 2, due to the usage of an internal standard for normalization, high precision was achieved in all measurements, aligning with former qNMR studies at values between 99.9 and 98.9% [12,13,14,15,16,17,18,19]. As the accuracy is given in relative numbers, in general, better values are obtained for greater masses. However, within the calibrated concentration range, all polymer types achieved accuracies between 89.0 and 104.5%, which represent sufficient values for trace analytical purposes.
Table 3 and Table 4 present separate calibration sets also for SBR and NR. Unfortunately, the SBR reference material was of technical quality only, leading to rather imprecise composition data for prepared samples. Hence, any mass difference of PS and BR within the SBR material due to certain filling materials like carbon black or a varying styrene and butadiene ratio would affect calculations by PS or BR calibration data. A similar issue is faced when using PIR calibration data in the quantification of NR, being a natural product showing corresponding impurities of natural origin. Therefore, using the same polymer type for calibration and quantification should avoid imprecise calculations within the extraction analysis depicted in the next paragraph. However, quantification of both polymer types SBR and NR should be possible by either homopolymeric calibrations of PS and BR or calibrations by the use of synthetic variants like PIR. In our previous work, we already demonstrated the use of PS and BR calibrations for SBR quantification [16]. A similar strategy can be used for NR. Table 5 compares the accuracies of the calculated NR and PIR mass of the control samples, either by using the same material for calibration or the respective other one. In general, better results are obtained when using the same material for calibration. Nevertheless, only a difference of around 10% can be observed in using the alternative material for calibration. As explained, the presence of small impurities in NR compared to PIR might account for that difference, as they add to the overall mass of NR material, but not to its NMR signal. This is further underlined, as the masses of NR calculated by PIR calibration data underestimate the actual masses and vice versa.
2.2. TWP Extraction
As to this point, non-deuterated THF has already proven to be a suitable solvent in qNMR measurements of SBR, BR, EPR, PIR and NR. Hence, in the following, we wanted to test the applicability of qNMR measurements in combination with TWP extraction. For this purpose, we performed a Soxhlet extraction, which was already applied as a sample preparation technique in other MP quantification procedures. For example, Castelvetro et al. extracted PE, PP PS and PET in a 3 h Soxhlet process using DCM as a solvent to analyze MP in fishmeal [30]. In our case, THF was selected as it allows easy handling within the process. After extraction, evaporation of the liquid is necessary to enable reconstitution of the sample in a defined volume of NMR solvent and thus allow for a precise calculation. Hereby the moderate boiling point of THF facilitates this process. At the same time, the required temperature to maintain a continuous reflux is kept at a minimum. Finally, extraction and measurement can be performed in the same solvent, so the process is not affected by possible differences concerning the solubility of the extracted material.
The extraction process aimed for recovery rates between 80% and 120%, as considered suitable for trace analytics [23]. Unfortunately, this target was only achieved for SBR and BR (Table 6). Both polymer types resulted in recoveries of 87.8-91.5%, which fits well to former studies on MP extraction. In extractions reported by Dierkes et al. recovery rates of 77-118% for PE, 85-95% for PP and 114-131% for PS were achieved [24]. However, they were using the pressurized liquid extraction method, which due to potential decomposition of rubbers is not suitable for TWP related polymers [31]. Results in a narrower range were obtained in the extractions by Castelvetro et al. [30], who observed MP like PS and PET to be recovered at rates between 95.3% and 106.4%. However, the applied polymer masses were at least twice as high as in our investigations.
EPR on the other hand seemed to have just exceeded the acceptable limit for recovery rates. (Table 6) In comparison with blank samples, an overlap with impurities—presumably originating from the use of cellulose extraction thimbles—could be observed. In theory, also impurities within the sea sand are a possible source, but since annealed sea sand was used, organic impurities are rather unlikely. Nevertheless, to circumvent this issue, we subtracted the average integral, calculated from the designated region of the EPR signal within the blank samples, from the actual integral of the EPR-containing samples [32,33]. The thus obtained recovery rate of 90.9% now perfectly meets the requirements. Unfortunately, the method is not straightforward and poses the risk of miscalculations, especially as the quantity of impurities and thus their signal intensity might change depending on the applied thimbles. Further optimization of the EPR extraction conditions is therefore necessary in our future work. The addition of a prewashing step for the thimbles or the use of other thimble materials like glass fiber are conceivable solutions.
Finally, NR and PIR although extracted at greater quantities, did not reach the required 80% recovery, but 77.2% and 78.3% respectively. This is surprising, as the former NMR measurements did not show any sign of insufficient solubility in THF. However, similar to BR, both PIR and NR contain various double bonds, which might have crosslinked at elevated temperatures during the extraction [31]. Another reason could be the technical grade of the NR and PIR reference material. Impurities or non-dissolvable constituents of the PIR or NR material would add to the weighed masses but not to the NMR results, thus reducing the calculated recovery rates. The similarity in these rates, however, further underlines their shared chemical structure and therefore highly related properties. Nevertheless, further optimization of the process, including the test for shorter extraction times as well as the need for certified reference materials in the field of MP and TWP research will be performed in due course [34].
4. Materials and Methods
Materials. Polyethylene-co-propylene (EPR) containing approximately 39% propylene, polystyrene-co-butadiene (SBR) containing 23.5% styrene, polybutadiene (BR) and polyisoprene (PIR) containing 96% cis-1,4-polyisoprene were provided by WAGU Gummitechnik GmbH, Germany. Natural rubber (NR) also containing 96% cis-1,4-polyisoprene was provided by Weber & Schaer GmbH & Co. KG, Germany. Polystyrene (PS) was supplied by Kissenwelt, Germany. EPR, SBR, BR, PIR and NR were cut from bulk into particles of around 2.5 mg. Polystyrene was present as expanded beads of 0.5-1 mm in diameter. Tetrahydrofuran (THF) ≥99.5% was purchased from Carl Roth GmbH & Co. KG, Germany. N,N-Dimethylformamide (DMF) >99% was purchased from Thermo Scientific Inc., Germany. Extraction thimbles (MN 645, cellulose) were purchased from Macherey-Nagel GmbH & Co. KG, Germany.
Calibration samples. Two different fractions were examined. The first one contains PS, BR, EPR and PIR. The second one contains NR and SBR. As NMR solvent THF containing 0.1% DMF is utilized. For each fraction, five calibration samples were prepared from stock solutions at concentration ranges as listed in Table 1. Additionally, three control samples were produced for both compositions, by dissolving a previously weighed amount of polymer in 1 ml NMR solvent.
Soxhlet process. SBR, BR, PIR, NR and EPR are weighed separately into extraction thimbles at masses of approximately 2.5 mg, mixed into 0.2 g of annealed sea sand acting as a model for an inorganic matrix. For the extraction process, a thimble is then placed into a Soxhlet apparatus before adding 50 ml THF as extraction solvent. The process is kept under reflux for 24 hours. Afterwards, the extract is reduced to approximately 5 ml of volume using a rotary evaporator, followed by being transferred into 20 ml glass vials. The remaining solvent is then evaporated at 60 °C under a continuous stream of air. The thus precipitated polymers are again dissolved in 1 ml of NMR solvent for measurement. Three blind samples containing only sea sand, but no polymers, were treated the same way.
NMR measurements. Measurements were performed at room temperature on a Jeol® 500 spectrometer with a 500-MHz 5-mm TH ATM probe head. For all samples an automated 1H WET [target: THF; signals: 2] sequence provided by Jeol was selected, using the following parameters: flip angle=90°, number of scans=16, acquired size=32768, spectral width=15 ppm, receiver gain= fixed at 42, relaxation delay=15 s, acquisition time= 4.36767 s. For each sample, 700 µl were filled into respective NMR tubes, being measured three times.
Data processing. NMR spectra were processed within the software “MestReNova”[35]. Spectra were referenced to the most shifted DMF signal at 7.91 ppm. Phase correction and baseline correction were manually performed. Apodization was set to 1 Hz. Integrals were determined within the following regions: 0.77-0.97 ppm for EPR (CH3), 5.02-5.18 ppm for PIR, 5.04-5.26 ppm for NR, 5.27-5.50 ppm for BR, 6.32-7.40 ppm for PS, 5.19-5.47 ppm for SBR (BR), 6.95-7.32 ppm for SBR (PS) and 7.73-8.07 ppm for DMF. Further calculations were performed in “Excel”. Integrals were normalized and used for calculating respective linear regressions according to the method described by Peez et al. [12]. Accuracy is expressed as bias, by dividing the calculated mass determined by NMR by the initially weighed mass for all model samples. Precision is expressed as relative standard deviation based on replicates of the model samples as well. The limit of detection (LOD) and limit of quantification (LOQ) were determined based on the respective signal-to-noise ratio in analogy to the procedure from Peez et al. [12].
5. Conclusions
With this research we were able to show the applicability of qNMR in TWP analytics, enabling the quantification of up to five different types of polymers dominant in this specific material. The technique not only allows quantification of environmentally relevant quantities but also is unaffected by most additives, which would hinder common TWP analyzing methods. For example, carbon black, usually blocking any infrared radiation, does not create any proton NMR signal and also fluorescence properties, typically hampering e.g., Raman spectroscopic quantification of MP, are not relevant in NMR measurement. Accuracy and precision as well as LOD and LOQ data were observed at values that are suitable for trace analytics. A critical requirement still is the dissolution of the polymeric material, especially of NR, BR and/or PIR. Thus, in case of real TWP particles further research on devulcanization or likewise controlled cleavage of crosslinking groups is necessary to bring qNMR of TWP to its full potential.
In addition, first insights into the combination of TWP extraction and qNMR were presented as an ideal method for matrix removal and sample preparation. For most selected polymer types, sufficient extraction rates between 87.8% and 91.5% were achieved, with only the polyisoprene-containing types being slightly below 80% recovery rate. However, we discussed promising ways of further optimization, thus sufficient extraction should be possible.
Supplementary Materials
The following supporting information can be downloaded at the website of this paper posted on Preprints.org, Table S1: Concentrations of calibration and control samples for EPR, PIR, BR and PS in THF; Table S2: Absolute intensities of calibration and control samples of EPR, PIR, BR and PS; Table S3: Concentrations and absolute intensities of calibration and control samples of NR; Table S4: Concentrations and absolute intensities of calibration and control samples of SBR; Table S5: Weighed-in concentrations and absolute intensities of extraction samples of EPR, BR, PIR, NR and SBR.
Author Contributions
Conceptualization, Wolfgang Imhof; Investigation, Marcel Günther and Gizem Kirimlioglu Sayilik; Methodology, Marcel Günther and Wolfgang Imhof; Project administration, Wolfgang Imhof; Validation, Marcel Günther; Writing—original draft, Marcel Günther; Writing—review & editing, Wolfgang Imhof.
Funding
This research received no external funding.
Institutional Review Board Statement
Not applicable.
Data Availability Statement
The original contributions presented in the study are included in the article/supplementary material, further inquiries can be directed to the corresponding author.
Conflicts of Interest
The authors declare no conflicts of interest.
References
- Brahney, J.; Mahowald, N.; Prank, M.; Cornwell, G.; Klimont, Z.; Matsui, H.; Prather, K.A. Constraining the atmospheric limb of the plastic cycle. PNAS 2021, 118, e2020719118. [CrossRef]
- Baensch-Baltruschat, B.; Kocher, B.; Stock, F.; Reifferscheid, G. Tyre and road wear particles (TRWP)—A review of generation, properties, emissions, human health risk, ecotoxicity, and fate in the environment. Sci. Total Environ. 2020, 733, 137823.
- Wagner, S.; Klöckner, P.; Reemtsma, T. Aging of tire and road wear particles in terrestrial and freshwater environments—A review on processes, testing, analysis and impact. Chemosphere 2022, 288, 132467.
- Sommer, F.; Dietze, V.; Baum, A.; Sauer, J.; Gilge, S.; Maschowski, C.;. Gieré, R. Tire Abrasion as a Major Source of Microplastics in the Environment. AAQR 2018, 18, 2014–2028.
- Goßmann, I.; Halbach, M.; Scholz-Böttcher, B.M. Car and truck tire wear particles in complex environmental samples—A quantitative comparison with “traditional” microplastic polymer mass loads. Sci. Total Environ. 2021, 773, 145667.
- Klöckner, P.; Seiwert, B.; Eisentraut, P.; Braun, U.; Reemtsma, T.; Wagner, S. Characterization of tire and road wear particles from road runoff indicates highly dynamic particle properties. Water Res. 2020, 185, 116262. [CrossRef]
- Ziajahromi, S.; Lu, H.-C.; Drapper, D.; Hornbuckle, A.; Leusch, F.D.L. Microplastics and Tire Wear Particles in Urban Stormwater: Abundance, Characteristics, and Potential Mitigation Strategies. Environ. Sci. Technol. 2023, 57, 12829–12837. [CrossRef]
- Mennekes, D.; Nowack, B. Tire wear particle emissions: Measurement data where are you? Sci. Total Environ. 2022, 830, 154655.
- Primpke, S.; Christiansen, S.H.; Cowger, W.; De Frond, H.; Deshpande, A.; Fischer, M.; Holland, E.B.; Meyns, M.; O’Donnell, B.A.; Ossmann, B.E.; Pittroff, M.; Sarau, G.; Scholz-Böttcher, B.M.; Wiggin, K.J. Critical Assessment of Analytical Methods for the Harmonized and Cost-Efficient Analysis of Microplastics. Appl. Spectrosc. 2020, 74, 1012–1047. [CrossRef]
- Kovochich, M.; Liong, M.; Parker, J.A.; Oh, S.C.; Lee, J.P.; Xi, L.; Kreider, M.L.; Unice, K.M. Chemical mapping of tire and road wear particles for single particle analysis. Sci. Total Environ. 2021, 757, 144085. [CrossRef]
- Rødland, E.S.; Gustafsson, M.; Jaramillo-Vogel, D.; Järlskog, I.; Müller, K.; Rauert, C.; Rausch, J.; Wagner, S. Analytical challenges and possibilities for the quantification of tire-road wear particles. TrAC 2023, 165, 117121. [CrossRef]
- Peez, N.; Janiska, M.C.; Imhof, W. The First Application of Quantitative 1H-NMR-Spectroscopy as a Simple and Fast Method of Identification and Quantification of Microplastic Particles (PE, PET and PS). Anal. Bioanal. Chem. 2019, 411, 823–833. [CrossRef]
- Peez, N.; Becker, J.; Ehlers, S.M.; Fritz, M.; Fischer, C.B.; Koop, J.H.E.; Winkelmann, C.; Imhof, W. Quantitative Analysis of PET Microplastics in Environmental Model Samples Using Quantitative NMR Spectroscopy: Validation of an Optimized and Consistent Clean-up Method. Anal. Bioanal. Chem. 2019, 411, 7409–7418. [CrossRef]
- Peez, N.; Imhof, W. Quantitative 1H-NMR Spectroscopy as an Efficient Method for Identification and Quantification of PVC, ABS and PA Microparticles. Analyst 2020, 145, 5363–5371.
- Peez, N.; Rinesch, T.; Kolz, J.; Imhof, W. Applicable and cost-efficient microplastic analysis by quantitative 1H-NMR spectroscopy using benchtop NMR and NoD methods. Magn. Res. Chem. 2022, 60, 172–183.
- Günther, M.; Imhof, W. Simultaneous quantification of microplastic particles by NoD 1H-qNMR from samples comprising different polymer types. Analyst 2023, 148, 1151–1161.
- Seghers, J.; Günther, M.; Breidbach, A.; Peez, N.; Imhof, W.; Emteborg, H. Feasibility of using quantitative 1H-NMR spectroscopy and ultra-micro balances for investigation of a PET microplastics reference material. Anal. Bioanal. Chem. 2023, 415, 3033-3040.
- Günther, M.; Imhof, W. Highly selective solid liquid extraction of microplastic mixtures as a pre-preparation tool for quantitative nuclear magnetic resonance spectroscopy studies. Analyst, in press. [CrossRef]
- Nelson, T.F.; Remke, S.C.; Kohler, H.-P.E. McNeill, K.; Sander, M. Quantification of Synthetic Polyesters from Biodegradable Mulch Films in Soils. Environ. Sci. Technol. 2020, 54, 266–275. [CrossRef]
- Bellasi, A.; Binda, G.; Pozzi, A.; Boldrocchi, G.; Bettinetti, R. The extraction of microplastics from sediments: An overview of existing methods and the proposal of a new and green alternative. Chemosphere 2021, 278, 130357. [CrossRef]
- He, D.; Zhang, X.; Hu, J. Methods for separating microplastics from complex solid matrices: Comparative analysis. J. Hazard. Mater. 2021, 409, 124640. [CrossRef]
- Cashman, M.A.; Ho, K.T.; Boving, T.B.; Russo, S.; Robinson, S.; Burgess, R.M. Comparison of microplastic isolation and extraction procedures from marine sediments. Mar. Pollut. Bull. 2020, 159, 111507. [CrossRef]
- Fuller, S.; Gautam, A. A Procedure for Measuring Microplastics using Pressurized Fluid Extraction. Environ. Sci. Technol. 2016, 50, 5774–5780. [CrossRef]
- Dierkes, G.; Lauschke, T.; Becher, S.; Schumacher, H.; Földi, C.; Ternes, T. Quantification of microplastics in environmental samples via pressurized liquid extraction and pyrolysis-gas chromatography. Anal. Bioanal. Chem. 2019, 411, 6959–6968. [CrossRef]
- Macko, T.; Pasch, H.; Wang, Y. Liquid Chromatographic Separation of Olefin Oligomers and its Relation to Separation of Polyolefins—an Overview. Macromol. Symp. 2009, 282, 93–100. [CrossRef]
- Steinmetz, Z.; Kintzi, A.; Muñoz, Schaumann, G.E. A simple method for the selective quantification of polyethylene, polypropylene, and polystyrene plastic debris in soil by pyrolysis-gas chromatography/mass spectrometry. JAAP 2020, 147, 104803. [CrossRef]
- Comins, D.L.; Joseph, S.P. in Encyclopedia of Reagents for Organic Synthesis, John Wiley & Sons Ltd., Chichester, UK, 2001.
- Hero, D.; Kali, G. New, Aqueous Radical (Co)Polymerization of Olefins at Low Temperature and Pressure. Processes 2020, 8, 688. [CrossRef]
- Rolere, S.; Liengprayoon, S.; Vaysse, L.; Sainte-Beuve, J.; Bonfils, F. Investigating natural rubber composition with Fourier Transform Infrared (FT-IR) spectroscopy: A rapid and non-destructive method to determine both protein and lipid contents simultaneously. Polym. Test 2015, 43, 83–93. [CrossRef]
- Castelvetro, V.; Corti, A.; Bianchi, S.; Giacomelli, G.; Manariti, A.; Vinciguerra, V. Microplastics in fish meal: Contamination level analyzed by polymer type, including polyester (PET), polyolefins, and polystyrene. Environ. Pollut. 2021, 273, 115792. [CrossRef]
- Chiantore, O.; di Cortemiglia, M.P.L.; Guaita, M.; Rendina, G. Makromol. Chem. 1989, 190, 3143–3152.
- Rhieu, S.Y.; Urbas, A.A.; Lippa, K.A.; Reipa, V. Quantitative measurements of glutathione in yeast cell lysate using 1H NMR. Anal. Bioanal. Chem. 2013, 405, 4963–4968. [CrossRef]
- Barthlott, L.; Scharinger, A.; Golombek, P.; Kuballa, T.; Lachenmeier, D.W. A Quantitative 1H NMR Method for Screening Cannabinoids in CBD Oils. Toxics 2021, 9, 136. [CrossRef]
- Rauert, C.; Rødland, E.S.; Okoffo, D.; Reid, M.J.; Meland, S.; Thomas, K.V. Challenges with Quantifying Tire Road Wear Particles: Recognizing the Need for Further Refinement of the ISO Technical Specification. Environ. Sci. Technol. Lett. 2021, 8, 231–236. [CrossRef]
- MestReNova, Version 14.1.1—24571, Mestrelab ResearchS.L. 2019.
Figure 1.
1H-NMR spectra of A) PS, BR, PIR and EPR as well as B) SBR and NR in THF containing DMF as an internal standard.
Figure 1.
1H-NMR spectra of A) PS, BR, PIR and EPR as well as B) SBR and NR in THF containing DMF as an internal standard.
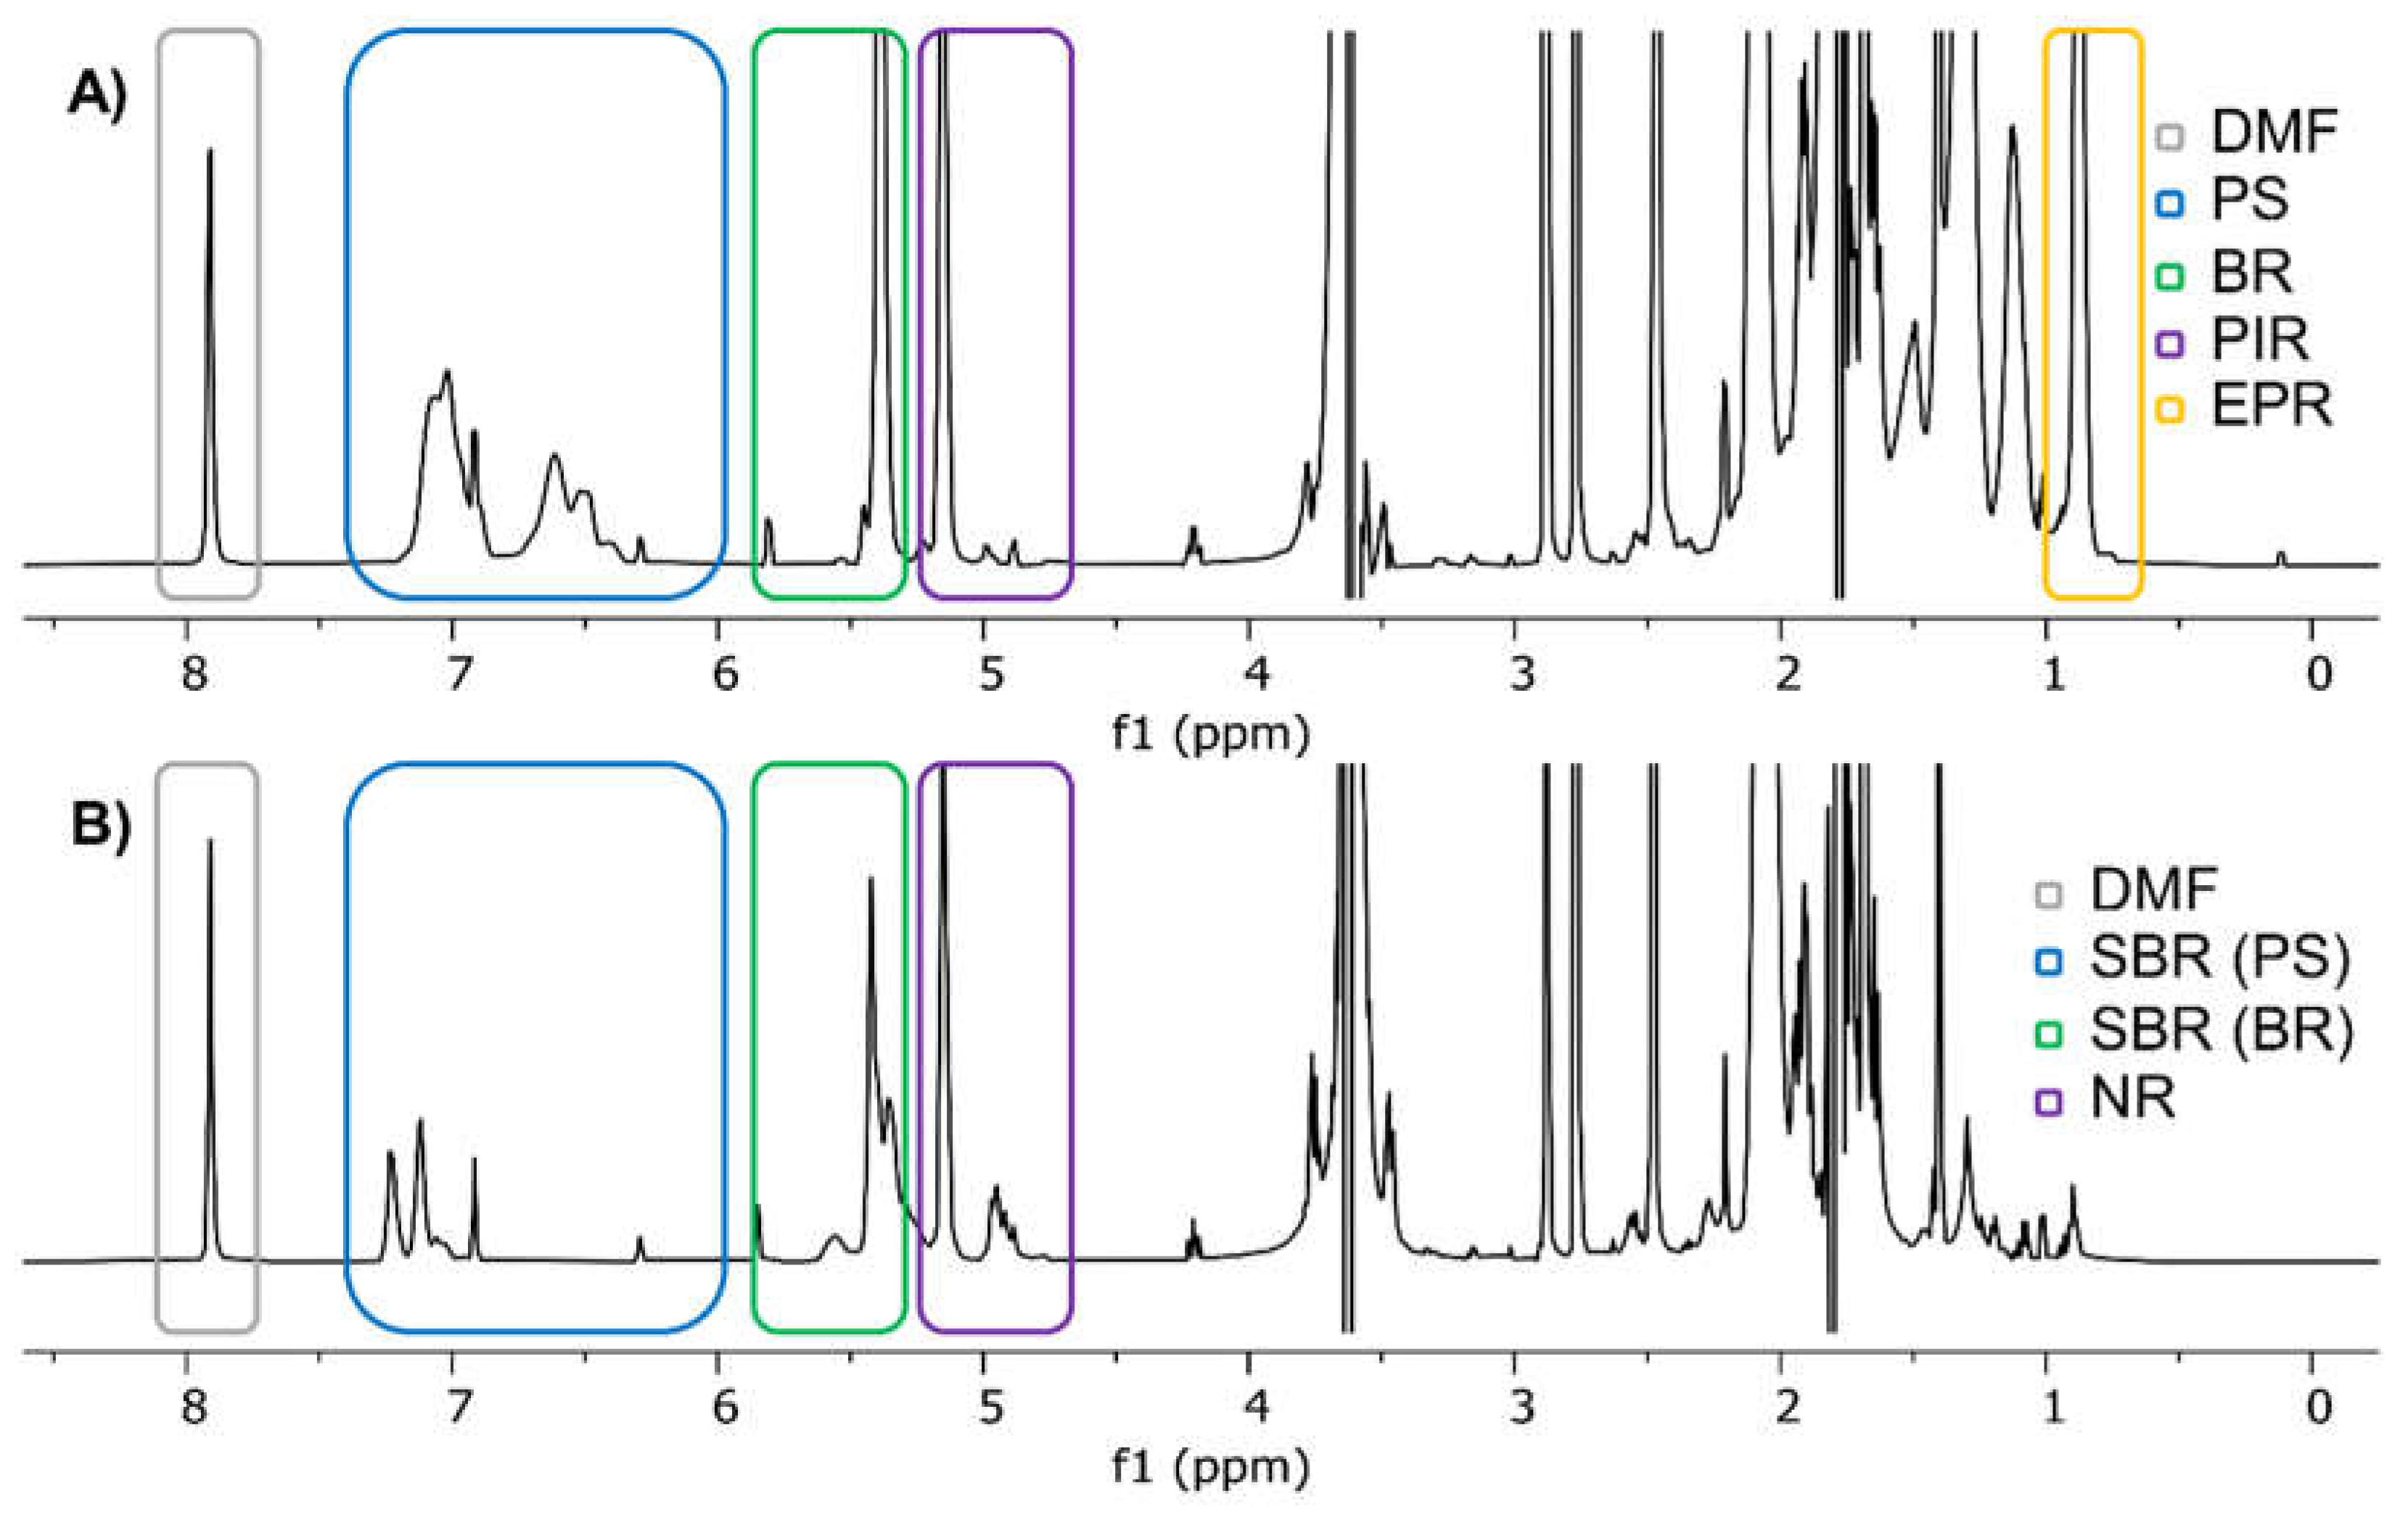

Table 1.
Calibration data for PS, BR, PIR and EPR in THF, including linearity expressed as R², root mean square deviation RMSD, limits of detection (LOD) and limits of quantification (LOQ).
Table 1.
Calibration data for PS, BR, PIR and EPR in THF, including linearity expressed as R², root mean square deviation RMSD, limits of detection (LOD) and limits of quantification (LOQ).
| MP type | Range c [mg/ml] | Linearity R² | RMSD | LOD [µg/ml] | LOQ [µg/ml] |
|---|---|---|---|---|---|
| PS | 0.30-1.51 | 0.99994 | 0.00002 | 12.84 | 42.80 |
| BR | 0.50-2.49 | 0.99995 | 0.00003 | 1.87 | 6.23 |
| PIR | 0.50-2.50 | 0.99983 | 0.00002 | 5.37 | 17.89 |
| EPR (PP) | 0.20-0.98 | 0.99952 | 0.00016 | 1.09 | 3.63 |
Table 2.
Control sample data for PS, BR, PIR and EPR, including accuracy as bias and precision as relative standard deviation of three repetitions. Massgrav. represents the weighed mass and Masscalc. represents the mass determined by qNMR.
Table 2.
Control sample data for PS, BR, PIR and EPR, including accuracy as bias and precision as relative standard deviation of three repetitions. Massgrav. represents the weighed mass and Masscalc. represents the mass determined by qNMR.
| MP type | Massgrav. [mg] | Masscalc. [mg] | Accuracy [%] | Precision [%] |
|---|---|---|---|---|
| PS | 1.34 | 1.32 | 98.6 | 99.8 |
| 1.02 | 1.00 | 98.0 | 99.7 | |
| 0.46 | 0.48 | 104.5 | 99.9 | |
| BR | 2.42 | 2.35 | 97.3 | 99.8 |
| 1.46 | 1.41 | 96.5 | 99.8 | |
| 0.85 | 0.82 | 96.7 | 99.9 | |
| PIR | 2.20 | 2.15 | 97.6 | 99.3 |
| 1.68 | 1.64 | 97.3 | 99.0 | |
| 0.65 | 0.62 | 95.9 | 98.9 | |
| EPR (PP) | 0.85 | 0.83 | 97.3 | 99.9 |
| 0.57 | 0.56 | 97.6 | 99.1 | |
| 0.27 | 0.24 | 89.0 | 99.4 |
Table 3.
Calibration data for SBR separated for its styrene and butadiene subunits and NR in THF, including linearity expressed as R², root mean square deviation RMSD, limits of detection (LOD) and limits of quantification (LOQ).
Table 3.
Calibration data for SBR separated for its styrene and butadiene subunits and NR in THF, including linearity expressed as R², root mean square deviation RMSD, limits of detection (LOD) and limits of quantification (LOQ).
| MP type | Range c [mg/ml] | Linearity R² | RMSD | LOD [µg/ml] | LOQ [µg/ml] |
|---|---|---|---|---|---|
| SBR (PS) | 0.12-0.59 | 0.99956 | 0.00004 | 23.09 | 76.97 |
| SBR (BR) | 0.38-1.91 | 0.99979 | 0.00010 | 8.89 | 29.63 |
| NR | 0.50-2.50 | 0.99830 | 0.00047 | 5.11 | 17.04 |
Table 4.
Control sample data for SBR separated for its styrene and butadiene subunits and NR, including accuracy as bias and precision as relative standard deviation of three repetitions. Massgrav. represents the weighed-in mass and Masscalc. Represents the mass determined by qNMR.
Table 4.
Control sample data for SBR separated for its styrene and butadiene subunits and NR, including accuracy as bias and precision as relative standard deviation of three repetitions. Massgrav. represents the weighed-in mass and Masscalc. Represents the mass determined by qNMR.
| MP type | Massgrav. [mg] | Masscalc. [mg] | Accuracy [%] | Precision [%] |
|---|---|---|---|---|
| SBR (PS) | 0.38 | 0.38 | 98.7 | 99.2 |
| 0.59 | 0.58 | 98.4 | 99.7 | |
| 0.57 | 0.56 | 97.8 | 99.9 | |
| SBR (BR) | 1.23 | 1.19 | 96.4 | 98.5 |
| 1.91 | 1.86 | 97.3 | 99.3 | |
| 1.84 | 1.78 | 96.5 | 99.7 | |
| NR | 2.34 | 2.29 | 97.7 | 99.4 |
| 1.74 | 1.73 | 99.2 | 99.7 | |
| 0.81 | 0.80 | 99.2 | 99.5 |
Table 5.
Accuracy as bias and Masscalc. for control samples of NR and PIR, calculated by calibration data obtained from the same reference material (orig.) or the respective other reference material (alt.), meaning PIR control samples Masscalc.,alt. are based on NR calibration data and vice versa. In addition, the initially weighed Massgrav. is given.
| MP type | Massgrav. [mg] | Masscalc., orig. [mg] | Accuracyorig. [%] | Masscalc., alt. [mg] | Accuracyalt. [%] |
|---|---|---|---|---|---|
| NR | 2.34 | 2.29 | 97.7 | 2.10 | 89.7 |
| 1.74 | 1.73 | 99.2 | 1.60 | 91.8 | |
| 0.81 | 0.80 | 99.2 | 0.74 | 91.2 | |
| PIR | 2.20 | 2.15 | 97.6 | 2.33 | 110.3 |
| 1.68 | 1.64 | 97.3 | 1.75 | 109.6 | |
| 0.65 | 0.62 | 95.9 | 0.68 | 109.8 |
Table 6.
Extraction data of SBR (separately for PS and BR repeating units), BR, NR, PIR and EPR (EPR* representing the values corrected by blind sample data) given as recovery rate, calculated by dividing the mass determined by qNMR (Masscalc.) by the mass weighed into the extraction thimble (Massgrav.) as well as precision expressed as relative standard deviation based on three repetitive measurements.
| MP type | Massgrav. [mg] | Masscalc. [mg] | Recovery rate [%] | Precision [%] |
|---|---|---|---|---|
| SBR (PS) | 0.57 | 0.52 | 91.3 | 98.4 |
| SBR (BR) | 1.86 | 1.63 | 87.8 | 99.8 |
| BR | 2.46 | 2.25 | 91.5 | 99.2 |
| NR | 2.47 | 1.91 | 77.2 | 98.7 |
| PIR | 2.47 | 1.93 | 78.3 | 99.5 |
| EPR (PP) | 0.96 | 1.15 | 120.1 | 94.1 |
| EPR (PP)* | 0.96 | 0.87 | 90.9 | 92.4 |
Disclaimer/Publisher’s Note: The statements, opinions and data contained in all publications are solely those of the individual author(s) and contributor(s) and not of MDPI and/or the editor(s). MDPI and/or the editor(s) disclaim responsibility for any injury to people or property resulting from any ideas, methods, instructions or products referred to in the content. |
© 2024 by the authors. Licensee MDPI, Basel, Switzerland. This article is an open access article distributed under the terms and conditions of the Creative Commons Attribution (CC BY) license (http://creativecommons.org/licenses/by/4.0/).
Copyright: This open access article is published under a Creative Commons CC BY 4.0 license, which permit the free download, distribution, and reuse, provided that the author and preprint are cited in any reuse.


