
Submitted:
12 October 2024
Posted:
15 October 2024
You are already at the latest version
Abstract
The tactile Internet (TI) characterises the transformative paradigm that aims to support real-time control and haptic communication between humans and machines, heavily relying on a dense network of sensors and actuators. Non-orthogonal multiple access (NOMA) is a promising enabler of TI that enhances interactions between sensors and actuators, which are collectively considered as users, thus supports multiple users simultaneously in sharing the same resource block (RB), consequently offering remarkable improvements in spectral efficiency and latency. This article proposes a novel downlink power domain NOMA (PD-NOMA) communication scenario for TI by considering multiple users and a base station. The signal-to-interference noise ratio (SINR), sum rate, and fair power allocation (PA) coefficients are mathematically derived in the NOMA system model. The simulations are performed with two-user and three-user scenarios to evaluate the system performance in terms of bit error rate (BER), sum rate and latency between NOMA and traditional orthogonal multiple access (OMA) schemes. Moreover, outage probability is analysed with varying fixed power allocation (PA) coefficients in the NOMA scheme. Finally, we present the outage probability, sum rate and latency analyses for fixed and derived fair PA coefficients, thus promoting dynamic PA and user fairness by efficiently utilising the available spectrum.
Keywords:
5G
; B5G
; Power domain
; NOMA
; Tactile Internet
1. Introduction
The tactile Internet (TI) in the fifth-generation communication infrastructure (5G) and beyond 5G (B5G) has been considered a potential enabler for service categories such as Enhanced Mobile Broadband (eMBB) communication, Massive Machine-Type Communication (mMTC) and Ultra-Reliable Low Latency Communication (URLLC) [1] to allow the interactions between humans, machines and Internet of Things (IoT) devices with audio and/or visual haptic feedback over a certain remote distance [2,3]. The TI communication infrastructure demands significantly high performance concerning ultra-low latency (≤ 1 ms), high bandwidth (30–300) GHz, ultra-high availability (), ultra-reliable and high data rate support for augmented reality/virtual reality (AR/VR) applications.
Considering key enabling TI technologies such as software-defined networking (SDN), network slicing (NS), network function virtualisation (NFV), network coding (NC) and multiple access (MA) techniques, the TI communication infrastructure aims to improve their immersive, responsive and interactive services/applications. Thus, these technologies facilitate necessary dynamic infrastructure, optimising resource allocation and utilisation, offloading computational capabilities, and improving spectral efficiency, quality of service (QoS) and quality of experience (QoE).
According to the Ericsson Mobility Report [4], a significant surge was observed in mobile network data traffic between the 4th quarter of 2022 and 2023, reaching a monthly consumption of 152 exabytes, contributing to approximately billion mobile subscribers. In addition, the Cisco annual Internet report (2018–2023) [5] stated that by 2023, global Internet users were estimated to touch billion, constituting of the world’s population. IoT devices will exceed three times the population, totalling billion, whereas M2M (machine-to-machine) (a.k.a IoT) connections constitute half. The user devices surpassed the total connections, representing , whereas the IoT applications forecasted substantial growth with a compound annual growth rate (CAGR).
Despite the technological advancements in 5G communication infrastructure compared to first to fourth generations (1G - 4G) ones, the system capacity and spectral efficiency improvement fall short of the increase mentioned in the International Mobile Telecommunications - 2020 (IMT - 2020) vision [6].
To improve the system capacity and spectral efficiency, the mobile and wireless communication infrastructure have employed several MA techniques from 1G to 4G, such as 1G - Frequency Division Multiple Access (FDMA), second generation (2G) - Time Division Multiple Access (TDMA), third generation (3G) - Code Division Multiple Access (CDMA), and 4G - Orthogonal Frequency Division Multiple Access (OFDMA), or combinations of these MA techniques. These MA techniques are adopted to share the available bandwidth among multiple users and reply on the resource (time/frequency) orthogonalisation, thus assigning different resources to individual users. Moreover, the bandwidth is wasted due to users’ utilisation of separate orthogonal resource blocks (RBs) using traditional MA techniques. These MA techniques are examples of orthogonal multiple access (OMA) schemes. Hence, these traditional MA techniques lack the competencies to serve multiple users having sensors and actuators simultaneously, rendering them unsuitable for a 5G communication infrastructure. In general, MA techniques can be structurally classified into OMA for 1G to 4G and non-orthogonal multiple access (NOMA) for 5G.
As mentioned, one of the high-performance enablers concerning parameters for TI communication infrastructure in 5G, the MA techniques, viz., NOMA, are complementing 5G New Radio (NR) robust, flexible and scalable framework. However, integrating NOMA can further resolve challenges and serve the demands of the proliferation of users, whether sensors or actuators, by utilising the same RB, according to 3GPP standardisation [7]. This integration facilitates high system capacity, enhances spectral efficiency, supports massive connectivity, and reduces latency in the network [8]. This technique concurrently assigns non-orthogonal resources amongst the multiple users whilst having some interference on the receiver side. In contrast, the traditional OMA techniques assign orthogonal resources solely to individual users, thus incurring challenges in achieving the required system capacity and spectral efficiency in 5G.
Figure 1 depicts the pictorial representation of NOMA when compared to OMA. Considering each user a sensor or an actuator, the power with respect to the resource graph is plotted to understand how the resources are allocated to the users in both cases. Figure 1a represents the OMA scheme - how the users are orthogonal to each other and have a dedicated/assigned RB for each user (, , ..., ). On the other hand, Figure 1b represents the NOMA scheme - how multiple users share a single RB, as the available bandwidth is not split across the users and assigns a single frequency channel to multiple users. Hence, the bandwidth wastage is minimised, and the system throughput is increased since the entire frequency spectrum is accessible to each user for transmission.
Consequently, it can be inferred that the NOMA environment is crucial and allows a dense deployment of sensors and actuators from users to share the assigned single RB, thus increasing the spectral efficiency and capacity compared to traditional OMA. Moreover, NOMA offers improved user fairness and QoS by having flexibility in power allocation (PA) and allowing users to be prioritised for stricter latency requirements by allocating them more power for faster data transmission. There are fewer waiting times to access the resources as users are sharing the resources concurrently. So this leads to overall reduced latency in data transmission. Finally, NOMA can effectively support heterogeneous networks with diverse user requirements and traffic characteristics. These benefits suit TI applications [1], such as enhanced mobile broadband, massive connectivity and latency-sensitive applications.
In addition, NOMA techniques can be categorised into power-domain NOMA (PD-NOMA) and code-domain NOMA (CD-NOMA). In PD-NOMA, multiple users share the same RB. However, each user (whether a sensor or an actuator) is identified or allocated with varying power levels (coefficients) for transmission according to the channel conditions and distance from the base station (BS). Users with high channel gain (near BS) are allocated low power levels, whereas users with low channel gain (far from BS) are allocated high power levels. It utilises superposition coding (multiplexing) at BS and performs successive interference cancellation (SIC) at the receiver to detect and extract the users’ original data signals and vice versa. In CD-NOMA, multiple users share the same RB and are assigned distinct non-orthogonal codes, such as low-density spreading (LDS), sparse code multiple access (SCMA) and multi-user shared access (MUSA) [9]. Increasing the number of users in CD-NOMA requires sophisticated algorithms for multi-user reception when non-orthogonal codes are adopted.
Furthermore, in PD-NOMA, both uplink (UL) and downlink (DL) transmissions play crucial roles in facilitating seamless message exchange between the user (whether a sensor or an actuator) and BS. Considering UL PD-NOMA, the simultaneous transmission happens from user to BS using the same RB and is distinguished by varying power levels. Conversely, for DL PD-NOMA, the simultaneous transmission happens from BS to the user, where BS assigns the proportion of power levels to multiple users based on the channel conditions and distance between BS and the user. Therefore, these PD-NOMA concepts enhance system capacity and optimise spectral efficiency, thus accommodating more sensors and actuators and reducing congestion in the TI communication infrastructure. Based on a sensor or actuator’s priority, channel conditions and power requirements, it can empower low-power communication to conserve energy and extend the battery life with less frequent need to replace it.
1.1. Research Challenges
While the PD-NOMA is broadly considered a promising multiple access technique which enhances the existing 5G-NR framework and B5G, several challenges [10,11] demand further investigation into implementing NOMA to improve capacity, spectral efficiency and latency. Considering resource allocation in NOMA, multiple users having sensors and actuators share the same RB. They are paired based on the distinct (strong and weak) channel gains, resulting in different PAs. At BS, the user signals are superimposed and transmitted, whereas at the user’s location, SIC is applied to received user signals to decode and extract the original signal. However, decoding the superimposed signal using SIC considering a perfect channel state information (CSI) can be challenging. Assuming a perfect CSI can pose real-time channel estimation errors, which may degrade the system’s performance [12]. Therefore, new hybrid techniques and algorithms can be developed to yield a practical channel estimation.
In addition, NOMA’s system performance reduction may arise due to an imperfect SIC receiver [13]. This imperfection depends on building efficient hardware to reduce computational complexity. The efficient PA among multiple users can pose another challenge in the NOMA system. Inefficient PA may lead to interference in the received user signal, unfairness among paired users and higher outage probability, thus resulting in performance degradation. Moreover, most researchers focus on adopting a two-user pairing or sensor clustering for easy superimposition at BS and to reduce SIC complexity at the receiver’s end. To cater to the growing demands of mMTC devices, multi-user pairing strategies or sensor clustering must be formed to take complete advantage of NOMA systems. Finally, due to the heterogeneous wireless network, a need for hybrid-NOMA (NOMA with other multiple access techniques) arises to address the diverse needs of devices through BS. Integrating NOMA with other multiple access techniques can be challenging, optimising the system’s performance.
1.2. Motivation
PD-NOMA offers several significant benefits over traditional MA techniques, such as enhancing capacity, increasing spectral efficiency, improving user fairness and QoS, mitigating interference and serving multiple users with the same RB, thus addressing shortcomings of current communication infrastructure and directing future networks. Therefore, PD-NOMA flexible PA enables and prioritises eMBB, mMTC and URLLC TI applications/services with required resources for seamless operation. However, research in PD-NOMA is needed to improve system performance further and address the aforementioned challenges, such as PA algorithms, hardware impairments, receiver design with imperfect SIC and CSI, and integration of PD-NOMA with other MA techniques to cater to the diverse needs of user devices. Subsequently, it is driven by the need for an efficient, flexible, and user-centric communication infrastructure that meets the ever-growing demands of future networks.
1.3. Research Contributions
In accordance with the findings from the literature review and to the best of our knowledge, the research still lacks in the field of PD-NOMA for TI applications. The performance analysis and evaluation of PD-NOMA in TI have not been comprehensively conducted in the past. Therefore, in this research, we have developed a novel downlink PD-NOMA communication scenario for TI employing multiple sensors and actuators (e.g. users), focusing on transmitted signals from a BS and processed received signals at the user’s end. Furthermore, the key performance indicators (KPIs) are derived, discussed, and evaluated to compare the performance characterisation of NOMA and OMA schemes. The main contributions of this paper are highlighted below.
- We developed an analytical system model incorporating signal-to-interference and noise ratio (SINR), sum rate, fair power allocation (PA) coefficients and latency among the available NOMA users.
- We compared and analysed BER for NOMA and OMA schemes with varying path loss exponent and fixed PA coefficients using two- and three-user scenarios. To this end, we compared the achievable sum rate and latency trends for NOMA and OMA schemes for fixed PA coefficients.
- Finally, the outage probability, achievable sum rate and latency trends are compared and analysed for fixed and fair PA coefficients. To this end, the performance trend of outage probability for NOMA users in varying fixed PA coefficients is also analysed.
1.4. Structure of the Article
The rest of the article is organised as follows. Section 2 presents the literature review relevant to the NOMA scheme used in the network. Section 3 describes the proposed system model for the downlink PD-NOMA communication scenario for TI. This section also includes the derivation and analysis of SINR, achievable sum rate, fair PA and latency. The performance evaluation is presented in Section 4. The simulation results are also presented in this section. Section 5 concludes our work with future directions. Finally, Table A1 lists the abbreviations and their explanation (see Appendix).
2. Related Work
Several research studies have been conducted on NOMA to enhance system capacity, improve spectral efficiency and reduce latency. In [14], NOMA is adopted on 5G communication infrastructure (test-bed) with the objective of minimising latency and optimising resource allocation for autonomous vehicles (AVs). Also, some challenges for implementing and adopting NOMA for 5G-based applications are highlighted for researchers and AV manufacturers. A novel cloud-based queuing model for TI is proposed in [15] by utilising the PD-NOMA strategy. This model uses a baseband processing unit (BBU) and radio remote head (RRH) queuing delays for tactile end-users. Resource allocation is formulated to reduce the latency between tactile end-users. The transmit power is reduced by choosing a dynamic approach of fronthaul and access delays rather than a fixed approach. Finally, the energy efficiency of PD-NOMA and OFDMA is compared.
In [13], the critical features of NOMA are reviewed and highlighted merits and demerits against other OMA strategies. The features of several NOMA schemes, such as PD-NOMA, SCMA, MUSA and pattern division multiple access (PDMA), have been discussed. In addition, the KPIs such as sum rate, energy efficiency, and BER are compared between NOMA strategies. Thus, NOMA has the potential to achieve the objectives of the required KPIs. On the other hand, the authors in [16] have proposed deep learning-based grant-free NOMA to tackle and minimise the ultra-low latency and ultra-reliability requirements in massive access scenarios. They mentioned that the combination of grant-free access and NOMA can be leveraged and is a promising approach for tactile IoT. However, random interference is caused, which lowers the system’s reliability. Hence, a grant-free NOMA-based neural network model and a novel multi-loss function are considered highly suited for automated applications in tactile IoT. Simulation results of the proposed model outperform the traditional grant-free NOMA strategies.
Moreover, in [17], the NOMA in mobile edge computing (MEC) enabled wireless tactile IoT scenario is investigated and optimisation algorithms for system and user performance. The proposed network model incorporates an MEC server at the access point, thus supporting computation for two sensor clusters. The system and cluster heads’ performance using the successful computation probability (SCP) is assessed, mainly focusing on high signal-to-noise ratios (SNRs) for a comprehensive understanding. The simulation results of the proposed network model outperform and boost system performance compared to traditional OMA strategies. The authors in [18] explore and analyse the application-specific NOMA-based communication infrastructure for TI, allowing the non-orthogonal RB sharing among 5G generic services such as eMBB, mMTC and URLLC devices to a shared BS. A comparative analysis of NOMA and OMA is shown concerning the sum rate and number of users. Various NOMA variants are discussed to check the feasibility of future low-latency TI applications/services.
To meet the requirements of high spectral efficiency, ultra-low latency, and multi-user connectivity, the authors in [8] have considered NOMA a potential solution which allows some degree of interference on the receiver side. In contrast, the OMA technique may not meet the strict previously mentioned requirements. Here, they have focussed on providing a novel NOMA model, including uplink (UL) and downlink (DL) transmissions in multiple input multiple output (MIMO) and cooperative communication scenarios. Hence, the performance of NOMA and OMA are compared to analyse the system in terms of spectral efficiency, sum rate, and BER. In [19], authors have predominantly investigated the implementation of NOMA on a software-defined radio (SDR) platform. They have highlighted SDR as a flexible platform for testing and implementing 5G and B5G technologies. In addition, various SIC receivers such as Ideal SIC, Symbol-level SIC, Codeword-level SIC, and Log Likelihood Ratio (LLR) based receivers are mathematically evaluated and analysed. When NOMA is compared with OMA with simulation results, NOMA showcases its superiority over OMA in terms of KPIs.
Furthermore, a survey on the NOMA system is presented in [20], focussing on error rate analysis. The enhanced NOMA strategies, which consist of constellation diagrams, multicarrier systems, and detector designs, are discussed, along with research problems and future directions. In [21], a discussion of a deep learning technique for the NOMA systems is presented. The emphasis is given to deep learning-based NOMA systems for solving communication issues. These NOMA systems can be integrated with potential technologies such as MEC, MIMO, Intelligent Reflecting Surfaces (IRSs) and simultaneous wireless and information power transfer (SWIPT). Also, the focus has been given to KPIs such as SIC, CSI, user fairness, and other valuable parameters.
Considering the IRS, [22] has addressed the issues related to harnessing the performance of wireless networks in 1G to 5G propagation environments. The issues can be resolved in the sixth generation (6G) by employing the IRS with NOMA. The designs and challenges related to IRS-based NOMA systems are comprehensively discussed with a detailed analysis of the communication framework. In [23], a survey is conducted based on combining the benefits of NOMA and cell-free massive MIMO systems and a detailed review of how the performance can be increased. Moreover, the challenges of combining cell-free massive MIMO systems with other potential technologies are discussed.
Visible light communication is a potential solution for high-speed data communications. In [24], the authors have conducted a comprehensive review of NOMA techniques with the involvement of visible light communication systems. They also discussed the limitations and challenges of integrating NOMA with visible light communication systems and the role of machine learning and physical layer security. The authors in [25] have reviewed NOMA-enabled MEC systems in depth, focusing on the issues, challenges, and shortcomings that arise. They have claimed that integrating NOMA with MEC will bring umpteen performance characteristics to 5G and B5G communication infrastructure, such as energy efficiency, latency, throughput and massive end-user connectivity.
To overcome the issues related to poor channel quality and disconnected communication from BS to users, the work in [26] has analysed the BER and outage probability for multi-hop decode and forward relay-assisted NOMA systems. The BER and outage probability equations are also derived by considering imperfect SIC and CSI. The proposed model’s simulation results depict the superiority over traditional OMA systems. The authors in [9] have focussed on the efficient strategies to integrate NOMA in 5G and 6G systems. This integration can be beneficial for UL and DL application environments under the 3rd Generation Partnership Project (3GPP) standardisation.
The author in [27] has focussed on optimising PA coefficients to gain optimum proportional fairness in PD-NOMA transmission with complete or limited SIC. The numerical results illustrate the impact of complete or limited SIC on the system performance with sum rate loss due to proportional fairness. Similarly, [28] considers a hybrid automatic repeat request protocol for PD-NOMA with proportional fairness on the fading channel. It analyses the system performance for different symmetric and asymmetric scenarios concerning throughput, outage probabilities and delays with varying PA.
3. System Model
A NOMA-based power-domain multiplexing system model is considered mathematically, consisting of a BS with users (, , ..., ). Here, we are considering a downlink NOMA communication scenario. At the transmitter side, the users’ messages are multiplexed using superposition coding, whereas, at the receiver end, the received users’ messages are demultiplexed (decoded) to retrieve the original message and perform successive interference cancellation (SIC) to remove interference from other user’s messages.
3.1. Downlink PD-NOMA Communication Scenario
Figure 2 represents the downlink power-domain communication scenario in TI. Let , , ..., denote users’ messages to be transmitted from the BS with transmitted power as . Let the PA coefficients be , , ..., with the corresponding channel coefficients as , , ..., .
Let us consider to be the farthest user, followed by to be the nearest user to the BS.
As superposition coding is performed at the BS, the transmitted signal () from BS is given by,
In short, at user can be written as,
Therefore, the received signal () at user is given by,
Comparing Eqs. 2 and 3, can be written as,
where, is additive white Gaussian noise (AWGN) with mean 0 and variance .
By considering Eq. 4, the for User 1 ( = farthest user), where , will be,
As User 1 is allocated with the highest power coefficients (), the component of User 1 is the desired and dominant signal, and other components are considered undesired (interference).
Along the same lines, for User 2 ( = relatively near to BS), where , will be,
As User 2 is allocated with a relatively lower power coefficient (), the component of User 2 is considered as desired but not dominant. The dominant signal is still the User 1 signal component, which is considered undesired (interference), along with other remaining user signal components. Hence, SIC is performed on the to decode/retrieve the user’s original message/signal to remove undesired (interference) signal components.
3.2. SINR Analysis
To retrieve the original message from the received signal (), the particular users’ received signal must be directly decoded, considering other signal components as interference.
Therefore, to decode signal for User 1 from Eq. 5, the instantaneous SINR for User 1 is given as,
where, is channel gain for User 1.
Similarly, to decode signal for User 2 from Eq. 6, the must decode the User 1 signal and perform SIC as User 1’s received signal component is an undesired but dominant signal. Hence, after performing SIC, the resulting will be,
Once User 1’s dominant signal component is removed from Eq. 6, resulting in Eq. 8, the signal can be directly decoded so that User 2 can have the desired and dominant signal after SIC. Hence, other remaining user signal components can be treated as interference. Hence, the instantaneous SINR for User 2 is given as,
where, is channel gain for User 2.
Therefore, the SINR for user can be expressed as,
where, is channel gain for user.
3.3. Sum Rate Analysis
The achievable sum rate of user for downlink NOMA can be computed as,
Therefore, the overall achievable sum rate for NOMA downlink can be expressed as,
To evaluate NOMA scheme at higher SNR, the variance tends to 0 (). Hence, from Eq. 13, the achievable sum rate can be approximated as,
3.4. Fair PA Analysis
The fair PA in NOMA downlink communication is crucial to ensure that all system users (, , ..., ) have a guaranteed QoS and maximise the sum rate. Thus, fair PA promotes user fairness, balances interference (undesired signal components), and enhances spectral efficiency.
Moreover, the PA coefficients (, , ..., ) are directly dependent on channel conditions. Without considering the channel conditions, the fixed PA coefficients are used, where the outage probabilities of the users are higher with a lower sum rate (bps/Hz).
Considering the CSI, the PA coefficients can be fairly optimised to improve the system performance. The fair PA focuses on the far user (User 1 in our case), as the far user is weak and located relatively away from BS compared to other users.
To better evaluate the NOMA scheme, let us consider two users (User 1 – far user and User 2 – near user) presented in the system. From Eq. 12, the achievable sum rate for Users 1 and 2, respectively, can be given as,
Hence, in this case, the PA coefficients ( and ) are designed/derived by setting up the target rate () for the far user (User 1), which is less than or equal to the sum rate, i.e., , from Eq. 15. Once for User 1 is met, the optimised PA coefficients can be derived instead of having a fixed PA.
Let us consider
We know that the sum of the PA coefficients is equal to 1 as we have two users (User 1 and User 2 having PA coefficients and , respectively), . Therefore, Eq. 18 implies,
Hence, Eq. 19 can be also written as,
Once the PA coefficient () of a far user (User 1) is calculated, the PA coefficient () of a near user (User 2) can be calculated using,
In this case, if the calculation for the term (let us consider 20), then , which does not satisfy the condition .
If is designed to have 20, then User 1 will meet the target rate (). But, if , User 1 will not meet , leading to an outage condition. Moreover, cannot hold the value 20, which violates the condition . Consequently, even if User 1’s holds the value 1 (not meeting the considered condition ), User 1 will be in an outage situation.
In contrast, if , then will be 0. This infers that User 2 will not have any PA coefficient. Hence, User 2 will also be in an outage condition.
The solution for this outage problem of Users 1 and 2 can be resolved by setting up as 0 (no PA) and as 1 (entire PA). To keep User 1 away from the outage situation, the considered value of must be kept at 20. But, the ideal value of cannot exceed 1, i.e., for , User 1 will still be in an outage and not meet the desired target rate. Therefore, allocating the entire PA to User 2 () can be considered to a point where allocating any PA to User 1 will not matter or affect the outage condition, i.e., User 1 will be in outage condition even if PA is done. Thus, User 2 will not be in the outage, achieving a higher sum rate (bps/Hz).
3.5. Latency Analysis
In the downlink power-domain communication scenario in TI, latency can be defined as the delay incurred when the signal (ts) is transmitted from BS until it is received by users (, , ..., ). This latency includes delays such as transmission delay, propagation delay, queuing delay and processing delay.
The transmission delay () is the time required to transmit data packets over the communication channel. This delay considers the sum rate (Eq. 15 and Eq. 16) or set target rate (Eq. 17) of users and the amount of data to be sent (packet size). Thus, is given by,
where, transmission rate = sum rate in (bps/Hz) × system bandwidth (Hz).
Moreover, the propagation delay () is the time required for the data packets to travel the physical distance between the BS and the user. This delay also relies on the transmission rate of the signal and thus is given by,
where, speed of light = m/s.
The queuing delay () is the time required to wait in queues at the BS before data packet transmission. This delay may arise due to network congestion or scheduled multiple users based on channel conditions. On the other hand, the processing delay () is the time required to process superposition coding (multiplexing) at the BS and SIC decoding at the receiver’s side.
Hence, the overall latency () for a particular user will be given by,
4. Performance Evaluation
4.1. Simulation Environment
To evaluate the performance of the NOMA system model, the MATLAB 2024a [29] platform is used along the 5G communication toolbox and required packages to carry out the simulations. This platform models the transmitter (BS), receiver (users) and channel condition of the NOMA system. Particularly, it can also model fading channels, such as Rayleigh fading, and simulate the path loss to mimic real-world propagation conditions.
Moreover, Monte Carlo simulation is applied to generate Rayleigh fading channels using random complex Gaussian variables, add AWGN to received signals at the receiver end, and run multiple simulation runs to achieve statistically meaningful numerical results.
4.2. Simulation Results and Discussions
To critically compare and analyse our proposed NOMA system in TI, we observe and measure KPIs, such as bit error rate (BER), achievable sum rate and outage probability. The fixed PA coefficient pairs are used to calculate the trend of the mentioned KPIs. Furthermore, an analysis of performance comparisons for BER and achievable sum rates is made between NOMA and OMA to infer meaningful insights. In addition, the effect of fair PA on certain users is also considered whilst being compared against the fixed PA to see the outage probability trend of the users. The simulation results reported in this paper showed steady-state behaviour with a relative statistical error of at a confidence level. Table 1 lists the simulation parameters used in the proposed NOMA-based TI system.
4.2.1. Performance Comparison and Analysis of bit Error Rate (BER) between NOMA and OMA
To study the effect of varying path loss exponent () with fixed PA coefficient values, the performance comparison of BER is observed and measured for NOMA and OMA schemes using two-user and three-user scenarios, with the following cases: a, b, c and d. The PA coefficients for Users 1, 2 and 3 are denoted as , and , respectively. The varying allows system behaviour analysis under different environmental conditions. When increases, the system represents the received signal’s faster decay with distance.
Case (a): Considering a two-user scenario with and fixed PA coefficient pairs as ( & ) and ( & ).
The BER performance trend is observed in Figure 3a against a varying signal-to-noise ratio (SNR) in decibels (dB) for NOMA and OMA schemes having a two-user scenario with and fixed PA coefficient pairs as ( & ) and ( & ) for Users 1 and 2. User 1 (weak user) is located far away from BS, whereas User 2 (strong user) is located near BS. It is observed that User 1 with having has incurred more BER than User 1 with having , at an SNR = 80 dB. This performance trend is because more power has been allocated to User 1, with than User 1, with . In contrast, even though higher power is allocated to User 2 with , it shows a higher BER than User 2, with . This is mainly due to cross-user interference between User 1 with and User 2 with . Thus, there is less interference between Users 1 with and 2 with . Keeping constant, when the BER performance trend with the NOMA scheme is compared with the OMA scheme, it is seen that lower BER is noted for the user pairs (with & ) and (with & ). In the NOMA scheme, the extra signal processing complexity is added at the receiver end, i.e., decoding and performing SIC of received signals, thus leading to higher BER than in the OMA scheme.
Case (b): Considering a two-user scenario with and fixed PA coefficient pairs as ( & ) and ( & ).
On similar lines, the BER performance trend is observed in Figure 3b with the same fixed PA coefficient pairs as ( & ) and ( & ) for Users 1 and 2, but changing from 2 to 4. For this simulation case, the effect of increasing is noted for BER performance for Users 1 and 2. In Figure 3b, we observe that a slightly lower BER is encountered for User 1, with than for User 1, with at an SNR = 150 dB. In contrast, a similar trend is observed for Case (a), followed by User 2, which has a lower BER of , than User 2, which has . Moreover, in the OMA scheme, smaller BER is observed than in proposed NOMA scheme. Considering a constant , as the SNR increases, BER tends to improve as the received signal becomes more distinguishable than the noise signal. Hence, improvement in BER performance is observed when is increased from 2 to 4, and the PA coefficient pairs are kept fixed. Consequently, a trade-off is observed in BER performance to strike a balance between and PA coefficients to optimise the communication performance.
Case (c): Considering a three-user scenario with and fixed PA 3-tuple coefficients as (, & ) and (, & ).
The BER performance trend is observed in Figure 4a against varying signal-to-noise ratio (SNR) in decibels (dB) for NOMA and OMA schemes having a three-user scenario with and fixed PA 3-tuple coefficients as (, & ) and (, & ) for Users 1, 2 and 3. In this three-user scenario, User 1 is located far away from the BS, whereas User 3 is located near the BS. User 2 is located in the middle of User 1 and User 3. We observe that User 1, with , has incurred higher BER than User 1, with , at SNR = 90 dB. This is because less power () is allocated to User 1 than to User 1 with . Contrarily, lower BER is observed for User 2 with than User 2 with , even though higher power is allocated to User 2 with . In both cases, cross-user interference is observed between the User 2 for PA coefficients are and , respectively. For User 3 (with and ), almost the same BER is noted. As is also kept constant for OMA scheme users, it can be clearly perceived that the BER performance trend is relatively less than NOMA scheme users, as OMA users do not have to undergo decoding and SIC operations for received signals.
Case (d): Considering a three-user scenario with and fixed PA 3-tuple coefficients as (, & ) and (, & ).
On the same note, Figure 4b shows the BER performance trend for (instead of 2) and the same fixed PA 3-tuple coefficients as (, & ) and (, & ). The same BER performance is observed for Case (c) with User 1 (with and ) at an SNR = 140 dB. However, User 2, with , has shown higher BER than User 2, with . User 2, with , has experienced more cross-user interference with User 1 with , while User, 2 with , has experienced less cross-user interference with User 1 with . Approximately the same BER is observed for User 3 (with and ). When OMA scheme users are compared to NOMA users, lower BER is noted for far, middle, and near users with higher SNR values. It can be inferred that when is increased from 2 to 4 in a three-user scenario, the degradation (increment) of BER performance is observed with at higher SNR when compared with due to increased interference.
4.2.2. Performance Comparison and Analysis of Achievable sum Rate between NOMA and OMA
Figure 5 shows the achievable sum rate in bps/Hz with respect to SNR values for NOMA vs OMA. Considering a three-user scenario, Users 1, 2 and 3 have been allocated with fixed PA coefficients as (), () and () and path loss exponent as . It can be observed that the achievable sum rate in the OMA performs slightly better than the NOMA at low SNR values. Due to cross-user interference and simulation transmission using the same RB, the achievable sum rate in the NOMA scheme suffers when compared to the OMA scheme at low SNR values.
However, as SNR increases, the achievable sum rate in the proposed NOMA scheme outperforms the OMA scheme.
4.2.3. Performance analysis of outage probability in NOMA
The performance analysis of outage probability in the NOMA scheme is carried out using a two-user scenario with fixed PA coefficient pairs as ( & ) and ( & ) and path loss exponent . To plot the outage probabilities, let us consider the target rates for Users 1 and 2 as bps/Hz and bps/Hz. These considered target rates are now compared with the achievable sum rate calculated in Eqs. 15 and 16. If the calculated achievable sum rates drop below the respective considered target rates of Users 1 and 2, the individual counters will be incremented. Hence, the outage probability is plotted as a function of power transmitted for both Users 1 and 2.
From Figure 6, it can be observed that User 1, with , has more outage probability than User 1, with . On the other hand, User 2, with , has a lower outage probability than User 2, with . Therefore, it can be concluded that the outage probability depends on the power percentage allocated to the particular user. Thus, in this case, User 1, with and User 2, with , have shown less outage probability than User 1 with and User 2 with , respectively.
4.2.4. Performance comparison and analysis of fair PA with fixed PA
The outage probability with fair PA and fixed PA are plotted against the target rate in a two-user scenario with (Figure 7a and Figure 7b). For this simulation, the achievable sum rate derived in Eq. 15 for User 1 (far from BS) is considered the same as the target rate for User 1 (far). The PA coefficients & are calculated using derived Eqs. 19 and 20 for fair PA. The fixed PA coefficients for Users 1 and 2 are used as and , respectively (for the transmitted power of 40 dBm).
By looking at Figure 7a, one can observe that Users 1 and 2 in fixed PA coefficients are in outage condition when the target rate is greater than 2 bps/Hz. This means that Users 1 and 2 in fixed PA will not experience an outage if the target rate is less than 2 bps/Hz. To infer, users in fixed PA are poorly performing and saturated to 1, as fixed PA neither considers the user’s target rate requirements nor utilises instantaneous CSI conditions. Hence, it is not an optimal strategy to allocate power to users in the network. On the other hand, for a fair PA case, coefficients & are derived by considering target rate requirements dependent on the achievable sum rate of User 1 (far), i.e. CSI. As the target rate increases, User 1 (far) gradually goes into an outage condition, thus increasing the outage probability. However, User 2 (near) shows a sudden change in the outage probability trend when the target rate is between 5 bps/Hz and bps/Hz. After bps/Hz, User 2 also goes into an outage condition.
Figure 7b shows the improved outage probability for a fair PA case for the required target rate. The improved outage probability trend is achieved by forcefully setting User 1 (far) and User 2 (near) PA coefficients as and . This setting is done when it does not affect the outage condition of User 1. When the target rate is less than bps/Hz, derived PA coefficient is assigned to User 1 (far) without bothering about User 2 (near), thus focussing more on User 1’s performance. However, when the target rate is above bps/Hz, the PA coefficient is assigned to User 2 (near), thus allocating the whole power to it and focussing on User 2’s performance. Hence, User 2’s outage probability is improved from bps/Hz. User 1 has left no power (), which does not affect its outage condition.
Figure 8 shows that the achievable sum rate for having a fair PA is higher than having a fixed PA when plotted against transmitted power. Because of varying CSI conditions, the fair PA coefficients & are calculated to meet the desired target rate requirements, thus achieving an improved achievable sum rate in a fair PA case.
4.2.5. Performance Comparison and Analysis of Latency
The performance comparison in terms of latency is conducted and observed with a fixed in the following cases: a and b. In our simulation, the transmission and processing delays are the major contributors to the latency for the users, whereas queuing and propagation delays are considered negligible. For the queuing delay to be negligible, the simulation does not consider multiple users sending traffic simultaneously. Considering 2- and 3-user scenarios, the likelihood of traffic congestion is quite low without queueing the packets on the BS side, thus creating less traffic demand at the BS. Since the propagation delay depends on the distance between the BS and the user, the simulation scenario considers user distances from the BS, such as 1000 m, 500 m, and 200 m. Hence, the propagation delay will be in the order of s, thus treating it as negligible.
Case (a): Considering a three-user scenario and comparing the latency trend for NOMA and OMA schemes. The latency trend is observed in Figure 9 as a function of SNR for NOMA and OMA schemes having a three-user scenario with and fixed PA coefficients (, & ). The latency is plotted for each user in both cases, i.e., NOMA and OMA. This figure represents how the latency varied with varying SNR (signal quality) having three different user distances from the BS. We observe that the latency decreases with increasing SNR. At low SNR, the latencies in NOMA show higher latency than in OMA as the system consumes more time to multiplex (superposition coding) and decode (SIC) the signal. However, as the signal improves with increasing SNR and negligible noise, the rapid reduction of latencies in NOMA is observed around 5 dB to 10 dB due to appropriate PA and simultaneous access to RB. As User 1 is located farthest from the BS and most likely goes to an outage condition, more power () is allocated to ensure efficient sharing of resources, thus contributing to the higher latency than User 2 () and User 3 () in NOMA.
The signal quality is poor for OMA at low SNR, leading to higher BER, as observed in Figure 4a. Hence, frequent retransmissions are required, increasing each user’s latencies. Figure 9 represents that at low SNR, the latencies for each user are higher. However, as SNR improves, the decreasing trend of latencies for each user is observed as SNR increases from 15 dB. Moreover, the latencies depend on users’ respective distances from the BS, as a similar trend is observed for NOMA users’ latency. To compare the performance in terms of latency, NOMA outperforms OMA as SNR increases.
Case (b): Considering a two-user scenario and comparing the latency trend for fair and fixed PAs in NOMA.
Figure 10 represents the latency trend for fair (derived in Eqs. 19 and 20) and fixed ( & ) PAs as a function of the transmitted power in NOMA. The latency trends for fair and fixed PA cases decrease with increasing transmitted power. However, the decrease in latency for fair PA is more pronounced than in fixed PA, as fair PA dynamically adjusts the power allocated to NOMA users based on channel conditions. Such fair PA adjustments most likely provide better latency performance because of the efficient utilisation of resources. On the contrary, for fixed PA, users are allocated a fixed proportion of power independent of channel conditions, thus leading to inefficient use of the available power. In comparison, better latency performance is observed in fair PA than in fixed PA as the transmitted power increases.
4.3. Model Assessment and Validation
This section assesses and validates the robustness of our system model by comparing it with existing work done in incorporating NOMA in TI wireless networks.
To the best of our author’s knowledge, no existing works have focussed and analysed mathematically derived SINR, achievable sum rate and fair PA coefficients altogether to meet the TI user’s stringent requirements. Most of the existing work done in [8,12,16,20,26] have focused on and shared primitive analyses on downlink PD-NOMA, considering mostly two users in a scenario. The NOMA performance has not been rigorously evaluated and analysed on varying network parameters, such as PA coefficients and , to observe users’ performance effects. Moreover, the comparison between NOMA and traditional OMA concerning BER, sum rate and latency trends with varying parameters mentioned earlier with a two-user and a three-user scenario has not been studied well in the networking literature.
Nonetheless, the fair PA analysis in terms of outage probability presented in our work has focussed on deriving PA coefficients to meet the stringent target rates of users under TI communication. Therefore, the PA coefficients can be precisely calculated and tuned to meet a specific NOMA user’s target rate requirement. In addition, the achievable sum rate and latency with calculated PA coefficients are compared with fixed PA coefficients, which was also missing from previous works.
However, this research did not focus on machine intelligence with imperfect SIC conditions, which can be considered for future research directions.
5. Conclusion
A novel downlink PD-NOMA communication scenario for TI employing multiple sensors and actuators, collectively treated as users and a base station, is proposed in this paper. We have developed an analytical system model comprising SINR, achievable sum rate, fair power allocation (PA) coefficients, and latency for NOMA users to study the system performance. The system model is validated by simulation scenarios in varying path loss exponent and fixed PA coefficient. We have evaluated and validated the analytical model by simulation. A higher BER is achieved for NOMA users than the OMA scheme due to additional signal processing to decode and perform successive interference cancellations (SIC) for received signals. In contrast, the achievable sum rate and latency trends for the proposed PD-NOMA have outperformed the OMA scheme for higher SNR. The outage probability of NOMA is also analysed with varying fixed PA coefficients. Finally, to promote dynamic PA and user fairness of the proposed PD-NOMA scheme, we have compared the outage probability, achievable sum rate and latency for fixed and derived fair PA coefficients. Thus, it maximised the spectral efficiency while minimising the power consumption and latency by efficiently utilising the available spectrum/resources. Developing a deep learning-based NOMA algorithm is suggested as future research work. This deep-learning NOMA will help detect SIC-received signals and consequently improve system performance.
Author Contributions
We are writing to confirm with you that the work presented in this paper is an original contribution. Conceptualisation, V.F.; Methodology, V.F. and N.I.S.; Discussion, V.F., N.I.S. and A.A.-A.; Implementation, V.F.; Validation, V.F. and N.I.S.; Empirical evaluation, V.F. and N.I.S.; Writing—original draft preparation, V.F.; Writing—review and editing, V.F., N.I.S. and A.A.-A.; Project supervision, N.I.S. and A.A.-A.; Correspondence author, N.I.S.; Responded to reviews, V.F. and N.I.S. All authors have read and agreed to the published version of the manuscript.
Funding
This research received no external funding.
Conflicts of Interest
The authors declare no conflict of interest. We also confirm that our survey paper has not been previously published and is not currently under consideration by any other journals. All authors involved have approved the contents of this paper and have agreed to the Journal of MDPI Sensors submission policies.
Appendix A A List of Abbreviations
Table A1 lists the abbreviation and explanation used in this paper.

Table A1.
A list of abbreviations and their explanations.
| Abbreviation | Explanation | Abbreviation | Explanation |
|---|---|---|---|
| 1G | First Generation | mMTC | Massive Machine Type Communication |
| 4G | Fourth Generation | MUSA | Multi-User Shared Access |
| 5G | Fifth Generation | NOMA | Non-Orthogonal Multiple Access |
| 6G | Sixth Generation | OFDMA | Orthogonal Frequency Division Multiple Access |
| AV | Autonomous Vehicle | OMA | Orthogonal Multiple Access |
| B5G | Beyond 5G | PA | Power Allocation |
| BER | Bit Error Rate | PD | Power Domain |
| BS | Base Station | QoS | Quality of Service |
| CD | Code Domain | RB | Resource Block |
| CSI | Channel State Information | SCMA | Sparse Code Multiple Access |
| DL | Downlink | SIC | Successive Interference Cancellation |
| eMBB | Enhanced Mobile Broadband | SINR | Signal-to-Interference Noise Ratio |
| IoT | Internet of Things | SNR | Signal-to-Noise Ratio |
| IRS | Intelligent Reflecting Surface | TI | Tactile Internet |
| MEC | Mobile Edge Computing | UL | Uplink |
| MIMO | Multiple Input Multiple Output | URLLC | Ultra-Reliable Low Latency Communication |
References
- Fanibhare, V.; Sarkar, N.I.; Al-Anbuky, A. A survey of the tactile Internet: Design issues and challenges, applications, and future directions. Electronics 2021, 10, 2171. [Google Scholar] [CrossRef]
- Fettweis, G.P. The tactile Internet: Applications and challenges. IEEE Vehicular Technology Magazine 2014, 9, 64–70. [Google Scholar] [CrossRef]
- Fettweis, G.; Boche, H.; Wiegand, T.; Zielinski, E.; Schotten, H.; Merz, P.; Hirche, S.; Festag, A.; Häffner, W.; Meyer, M.; others. The tactile Internet-ITU-T technology watch report. Int. Telecom. Union (ITU), Geneva 2014. Available: https://www.itu.int/dms_pub/itu-t/opb/gen/T-GEN-TWATCH-2014-1-PDF-E.pdf (accessed on 19 September 2024).
- Ericsson mobility report, Q4 2023 update. Available: https://www.ericsson.com/4923b9/assets/local/reports-papers/mobility-report/documents/2023/emr-q4-2023-update.pdf, 2024. (accessed on 19 September 2024).
- Cisco annual Internet report (2018 - 2023). Available: https://www.cisco.com/c/en/us/solutions/collateral/executive-perspectives/annual-internet-report/white-paper-c11-741490.pdf, 2023. (accessed on 19 September 2024).
- M.2083-0, R.I.R. IMT Vision– Framework and overall objectives of the future development of IMT for 2020 and beyond. Available: https://www.itu.int/dms_pubrec/itu-r/rec/m/R-REC-M.2083-0-201509-I!!PDF-E.pdf, 2015. (accessed on 19 September 2024).
- The 3rd generation partnership project (3GPP), Release 16. Available: https://www.3gpp.org/specifications-technologies/releases/release-16, 2020. (accessed on 19 September 2024).
- Aldababsa, M.; Toka, M.; Gökçeli, S.; Kurt, G.K.; Kucur, O.; others. A tutorial on nonorthogonal multiple access for 5G and beyond. Wireless communications and mobile computing 2018, 2018. [Google Scholar] [CrossRef]
- Al-Dulaimi, O.M.K.; Al-Dulaimi, A.M.K.; Alexandra, M.O.; Al-Dulaimi, M.K.H. Strategy for non-orthogonal multiple access and performance in 5G and 6G networks. Sensors 2023, 23, 1705. [Google Scholar] [CrossRef]
- Akbar, A.; Jangsher, S.; Bhatti, F.A. NOMA and 5G emerging technologies: A survey on issues and solution techniques. Computer Networks 2021, 190, 107950. [Google Scholar] [CrossRef]
- Abd-Elnaby, M.; Sedhom, G.G.; El-Rabaie, E.S.M.; Elwekeil, M. NOMA for 5G and beyond: Literature review and novel trends. Wireless Networks 2023, 29, 1629–1653. [Google Scholar] [CrossRef]
- Safia, B.; Abdellatif, K. Performance analysis of the NOMA network under joint hardware impairment and imperfect channel state information. Telecommunications and Radio Engineering 2023, 82. [Google Scholar] [CrossRef]
- Hussain, M.; Rasheed, H. Nonorthogonal multiple access for next-generation mobile networks: A technical aspect for research direction. Wireless Communications and Mobile Computing 2020, 2020, 1–17. [Google Scholar] [CrossRef]
- Tanwar, S.; Tyagi, S.; Budhiraja, I.; Kumar, N. Tactile Internet for autonomous vehicles: Latency and reliability analysis. IEEE Wireless Communications 2019, 26, 66–72. [Google Scholar] [CrossRef]
- Gholipoor, N.; Parsaeefard, S.; Javan, M.R.; Mokari, N.; Saeedi, H.; Pishro-Nik, H. Cloud-based queuing model for tactile Internet in next generation of RAN. IEEE 91st Vehicular Technology Conference (VTC - Spring). IEEE, 2020, pp. 1–6. [CrossRef]
- Ye, N.; Li, X.; Yu, H.; Wang, A.; Liu, W.; Hou, X. Deep learning aided grant-free NOMA toward reliable low-latency access in tactile Internet of Things. IEEE Transactions on Industrial Informatics 2019, 15, 2995–3005. [Google Scholar] [CrossRef]
- Van Truong, T.; Nayyar, A.; Bilal, M.; Kwak, K.S. System design and optimization of mobile edge computing in the NOMA wireless wactile Internet of Things network. Alexandria Engineering Journal 2023, 73, 737–749. [Google Scholar] [CrossRef]
- Budhiraja, I.; Tyagi, S.; Tanwar, S.; Kumar, N.; Rodrigues, J.J. Tactile Internet for smart communities in 5G: An insight for NOMA-based solutions. IEEE Transactions on Industrial Informatics 2019, 15, 3104–3112. [Google Scholar] [CrossRef]
- Reddy, B.S.K.; Mannem, K.; Jamal, K. Software defined radio based non-orthogonal multiple access (NOMA) systems. Wireless Personal Communications 2021, 119, 1251–1273. [Google Scholar] [CrossRef]
- Yahya, H.; Ahmed, A.; Alsusa, E.; Al-Dweik, A.; Ding, Z. Error rate analysis of NOMA: Principles, survey and future directions. IEEE Open Journal of the Communications Society 2023. [Google Scholar] [CrossRef]
- Mohsan, S.A.H.; Li, Y.; Shvetsov, A.V.; Varela-Aldás, J.; Mostafa, S.M.; Elfikky, A. A survey of deep learning based NOMA: State of the art, key aspects, open challenges and future trends. Sensors 2023, 23, 2946. [Google Scholar] [CrossRef]
- Sarkar, D.; Yadav, S.S.; Pal, V.; Kumar, N.; Patra, S.K.; others. A comprehensive survey on IRS-assisted NOMA-based 6G wireless network: Design perspectives, challenges and future directions. IEEE Transactions on Network and Service Management 2024. [Google Scholar] [CrossRef]
- Apiyo, A.; Izydorczyk, J. A survey of NOMA-aided cell-free massive MIMO systems. Electronics 2024, 13, 231. [Google Scholar] [CrossRef]
- Mohsan, S.A.H.; Sadiq, M.; Li, Y.; Shvetsov, A.V.; Shvetsova, S.V.; Shafiq, M. NOMA-based VLC systems: A comprehensive review. Sensors 2023, 23, 2960. [Google Scholar] [CrossRef]
- Ogundokun, R.O.; Awotunde, J.B.; Imoize, A.L.; Li, C.T.; Abdulahi, A.T.; Adelodun, A.B.; Sur, S.N.; Lee, C.C. Non-orthogonal multiple access enabled mobile edge computing in 6G communications: A systematic literature review. Sustainability 2023, 15, 7315. [Google Scholar] [CrossRef]
- Khennoufa, F.; Abdellatif, K.; Kara, F. Bit error rate and outage probability analysis for multi-hop decode-and-forward relay-aided NOMA with imperfect SIC and imperfect CSI. AEU-International Journal of Electronics and Communications 2022, 147, 154124. [Google Scholar] [CrossRef]
- Taricco, G. Fair power allocation policies for power-domain non-orthogonal multiple access transmission with complete or limited successive interference cancellation. IEEE Access 2023, 11, 46793–46803. [Google Scholar] [CrossRef]
- Taricco, G. Optimum power allocation for HARQ aided NOMA with proportional fairness on fading channels. IEEE Access 2024. [Google Scholar] [CrossRef]
- MATLAB. Available: https://au.mathworks.com/products/matlab.html. (accessed on 19 September 2024).
Figure 1.
Illustrating of OMA and NOMA schemes.
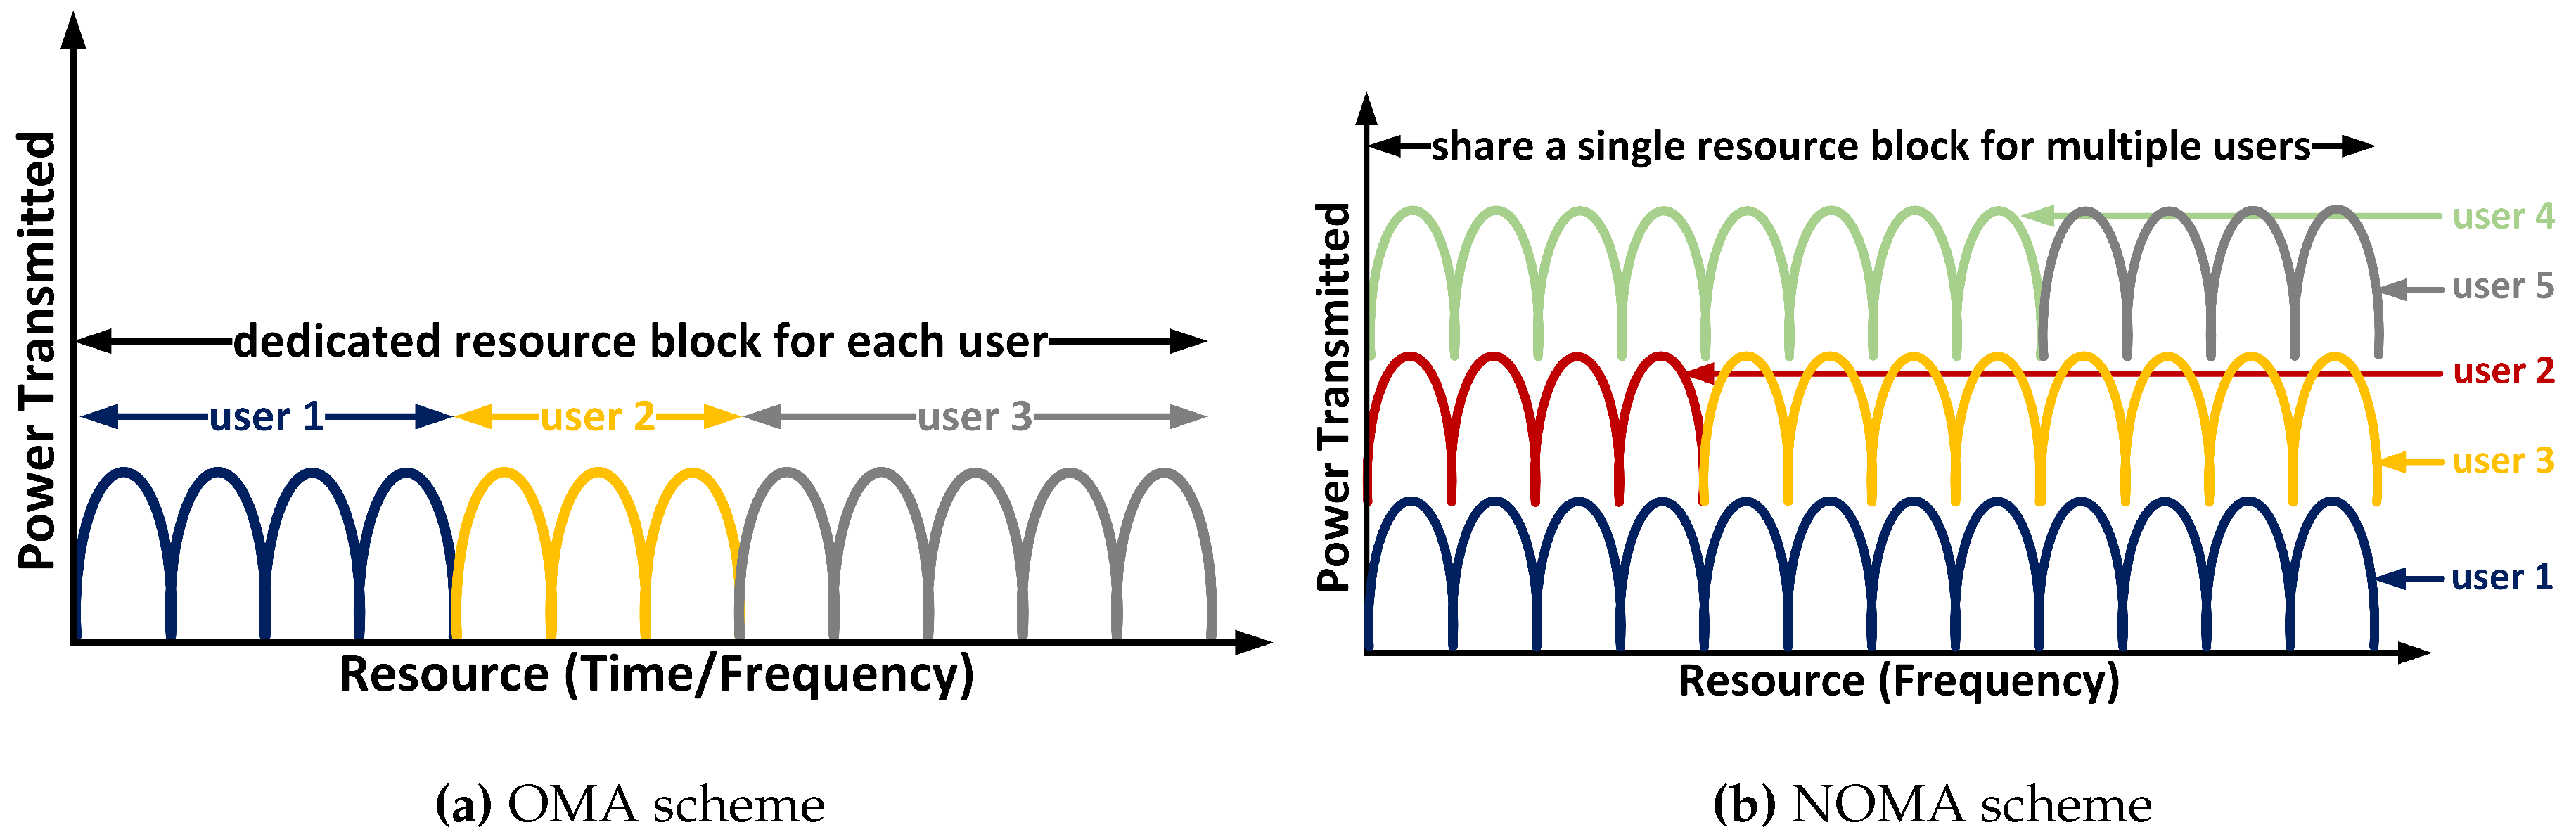
Figure 2.
Downlink power-domain communication scenario in TI.
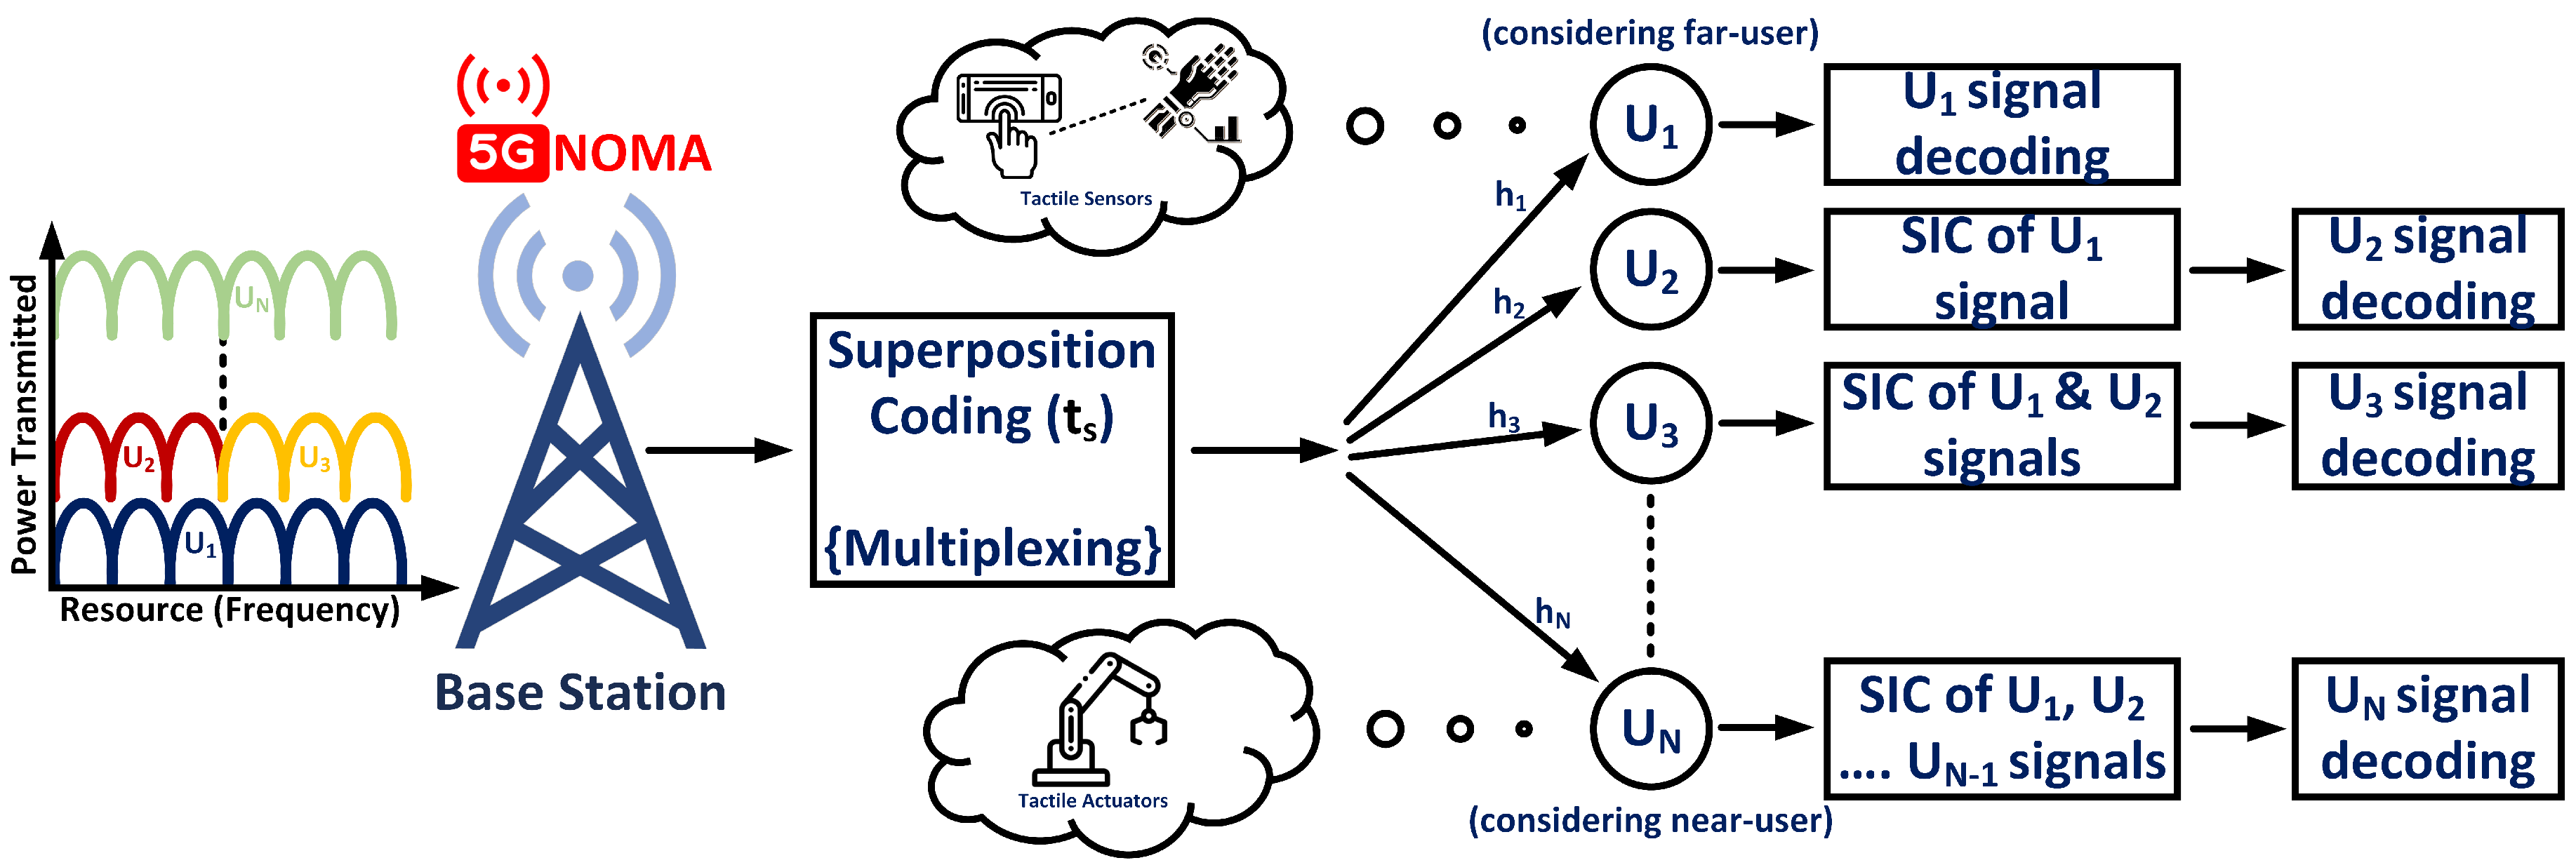
Figure 3.
BER comparison between NOMA and OMA with = 2 & 4, and fixed PA coefficient pairs as ( & ) and ( & ).
Figure 3.
BER comparison between NOMA and OMA with = 2 & 4, and fixed PA coefficient pairs as ( & ) and ( & ).
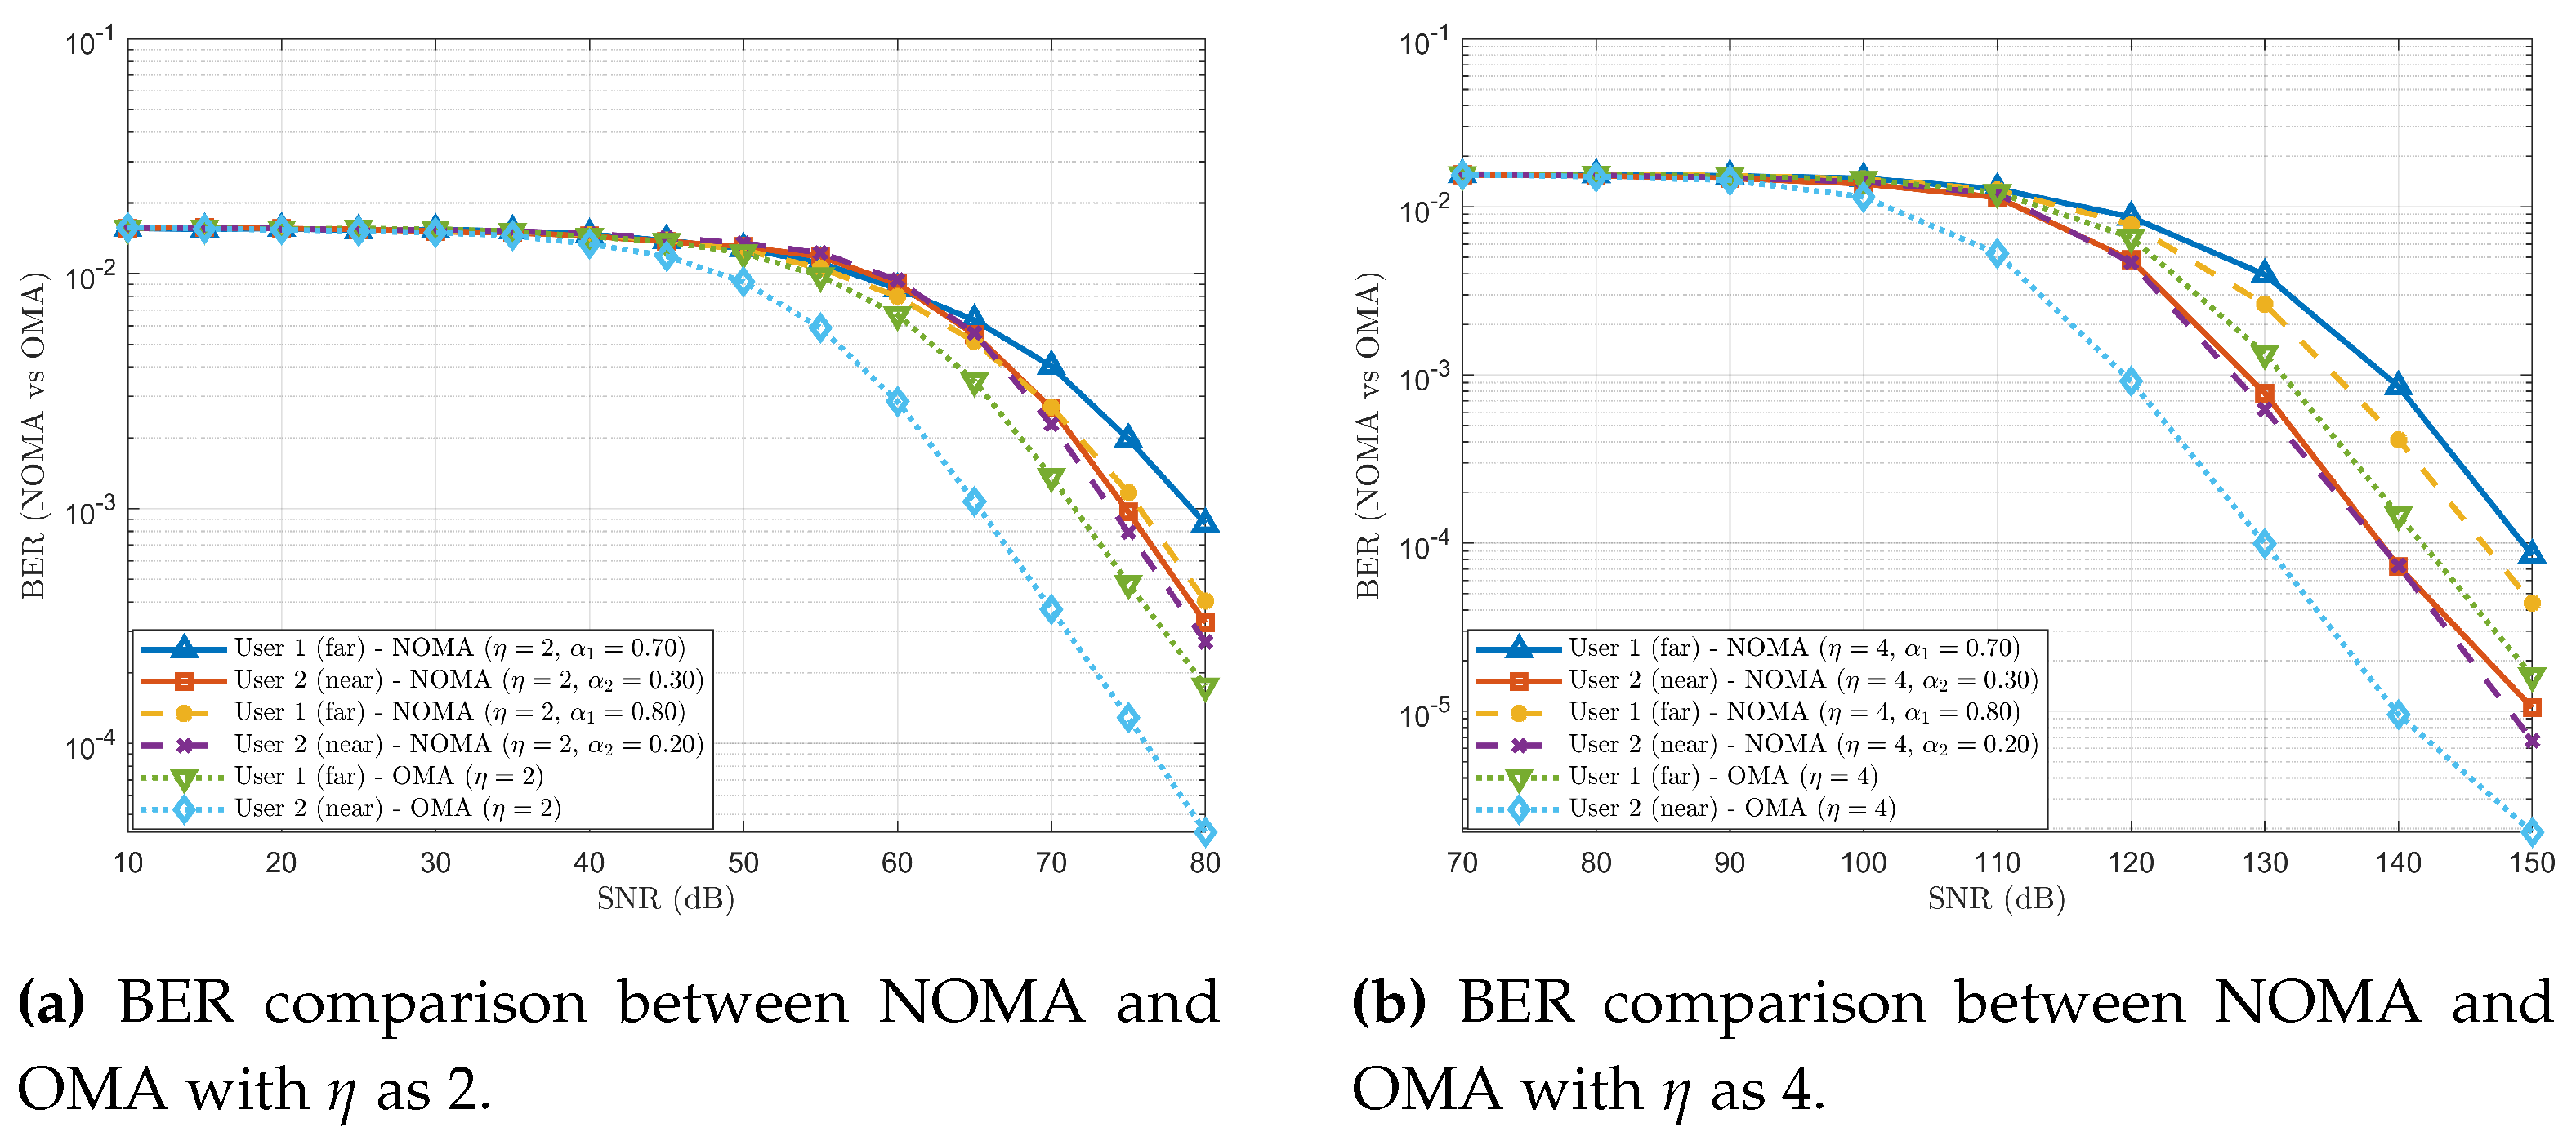
Figure 4.
BER comparison between NOMA and OMA with = 2 & 4, and fixed PA coefficient pairs as (, & ) and (, & ).
Figure 4.
BER comparison between NOMA and OMA with = 2 & 4, and fixed PA coefficient pairs as (, & ) and (, & ).
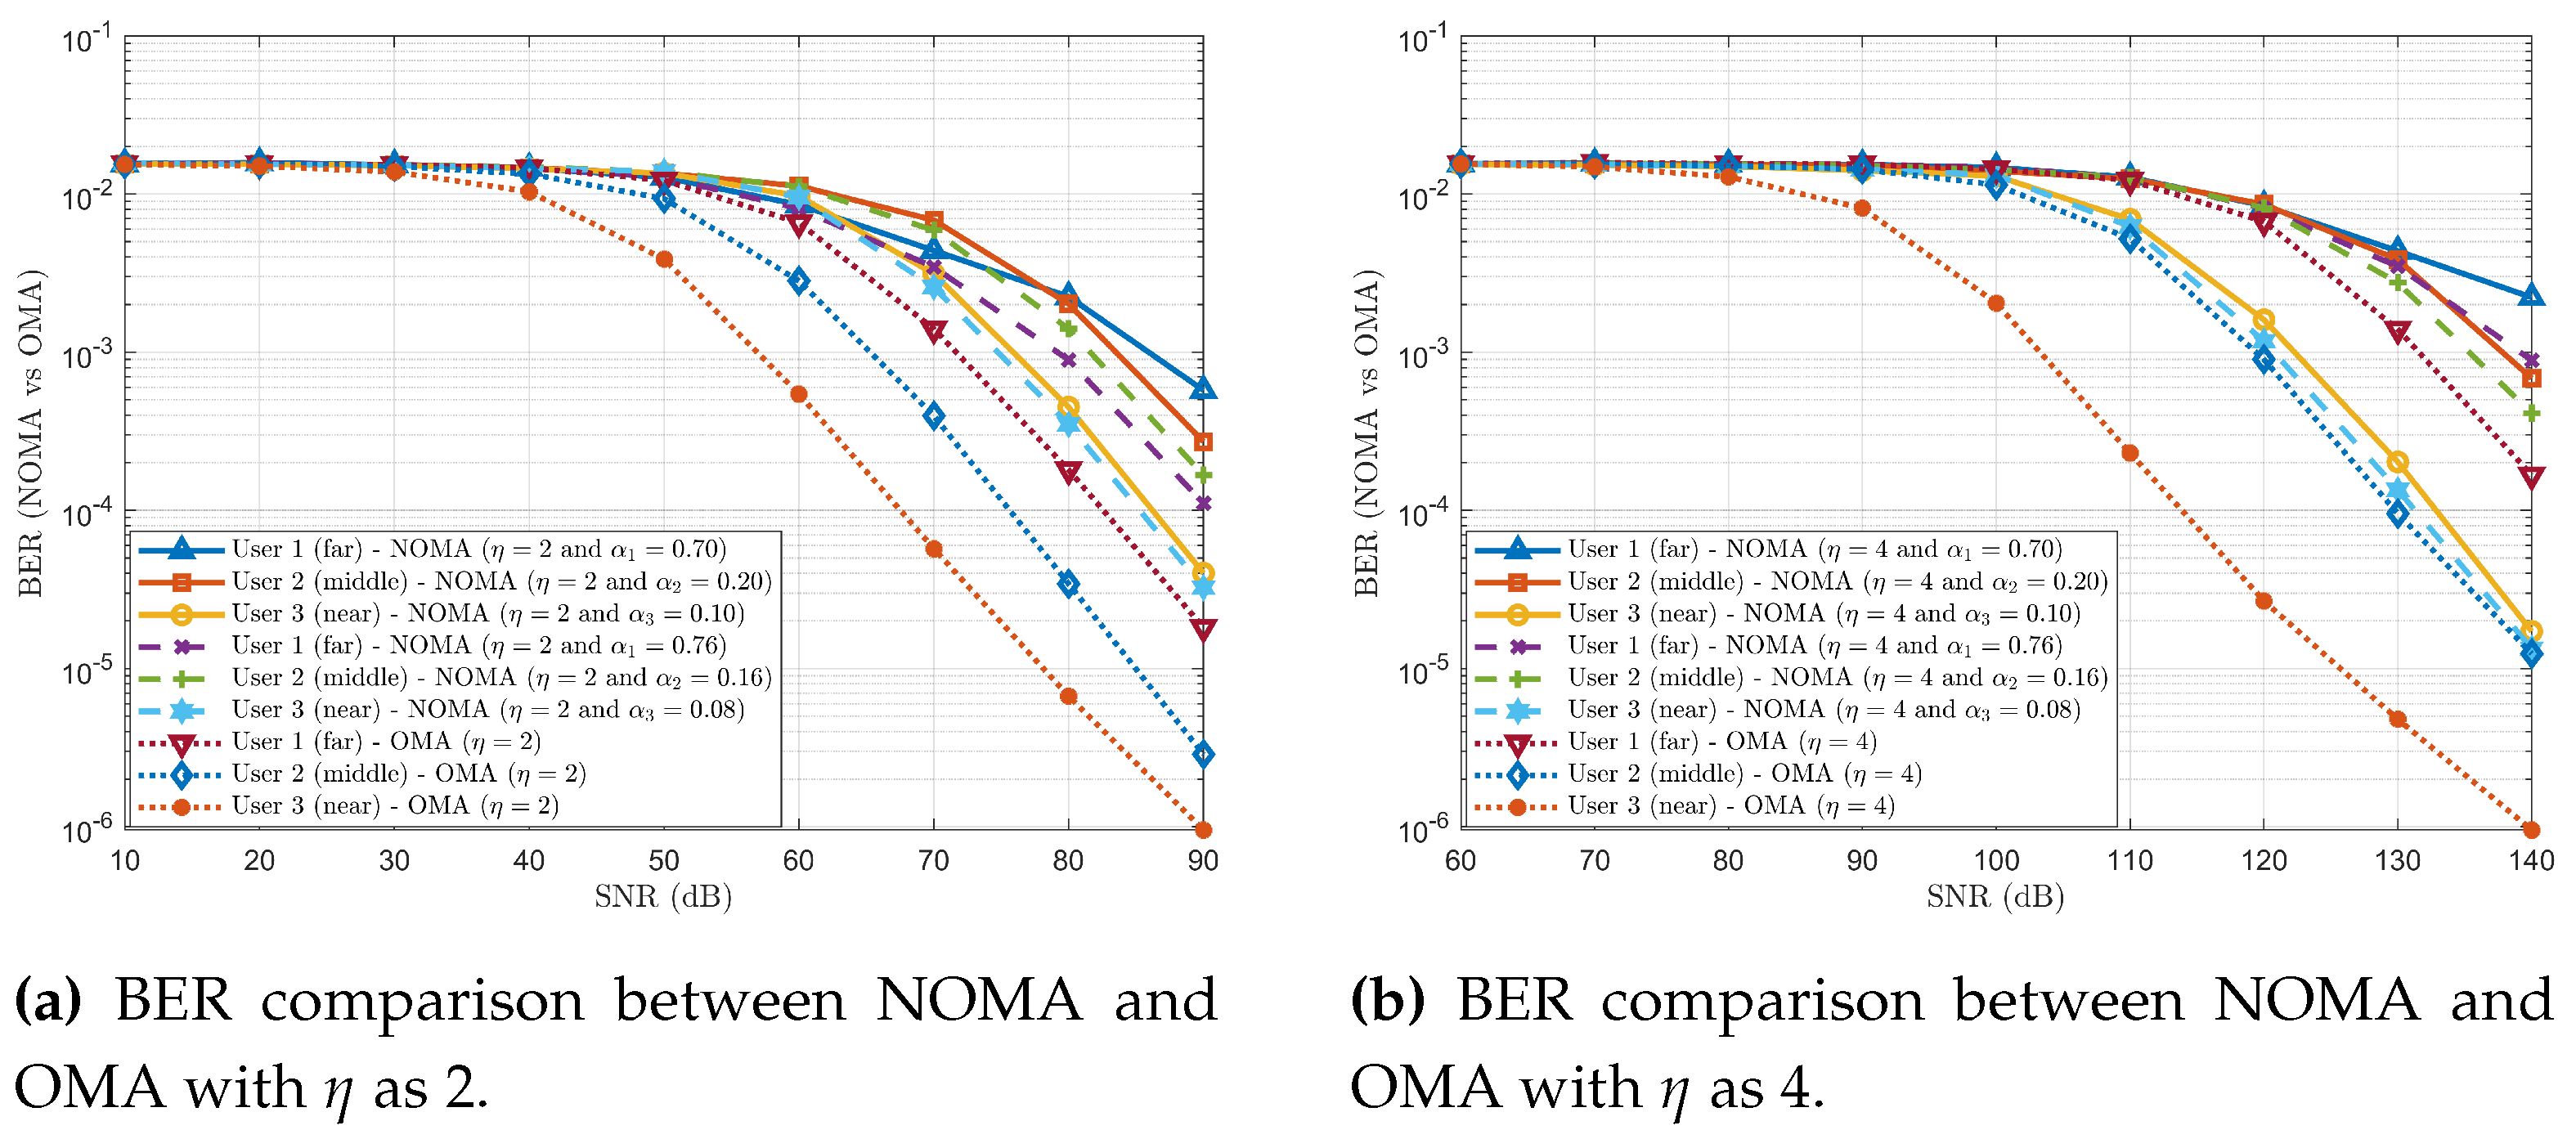
Figure 5.
Achievable sum rate comparison between NOMA vs OMA.
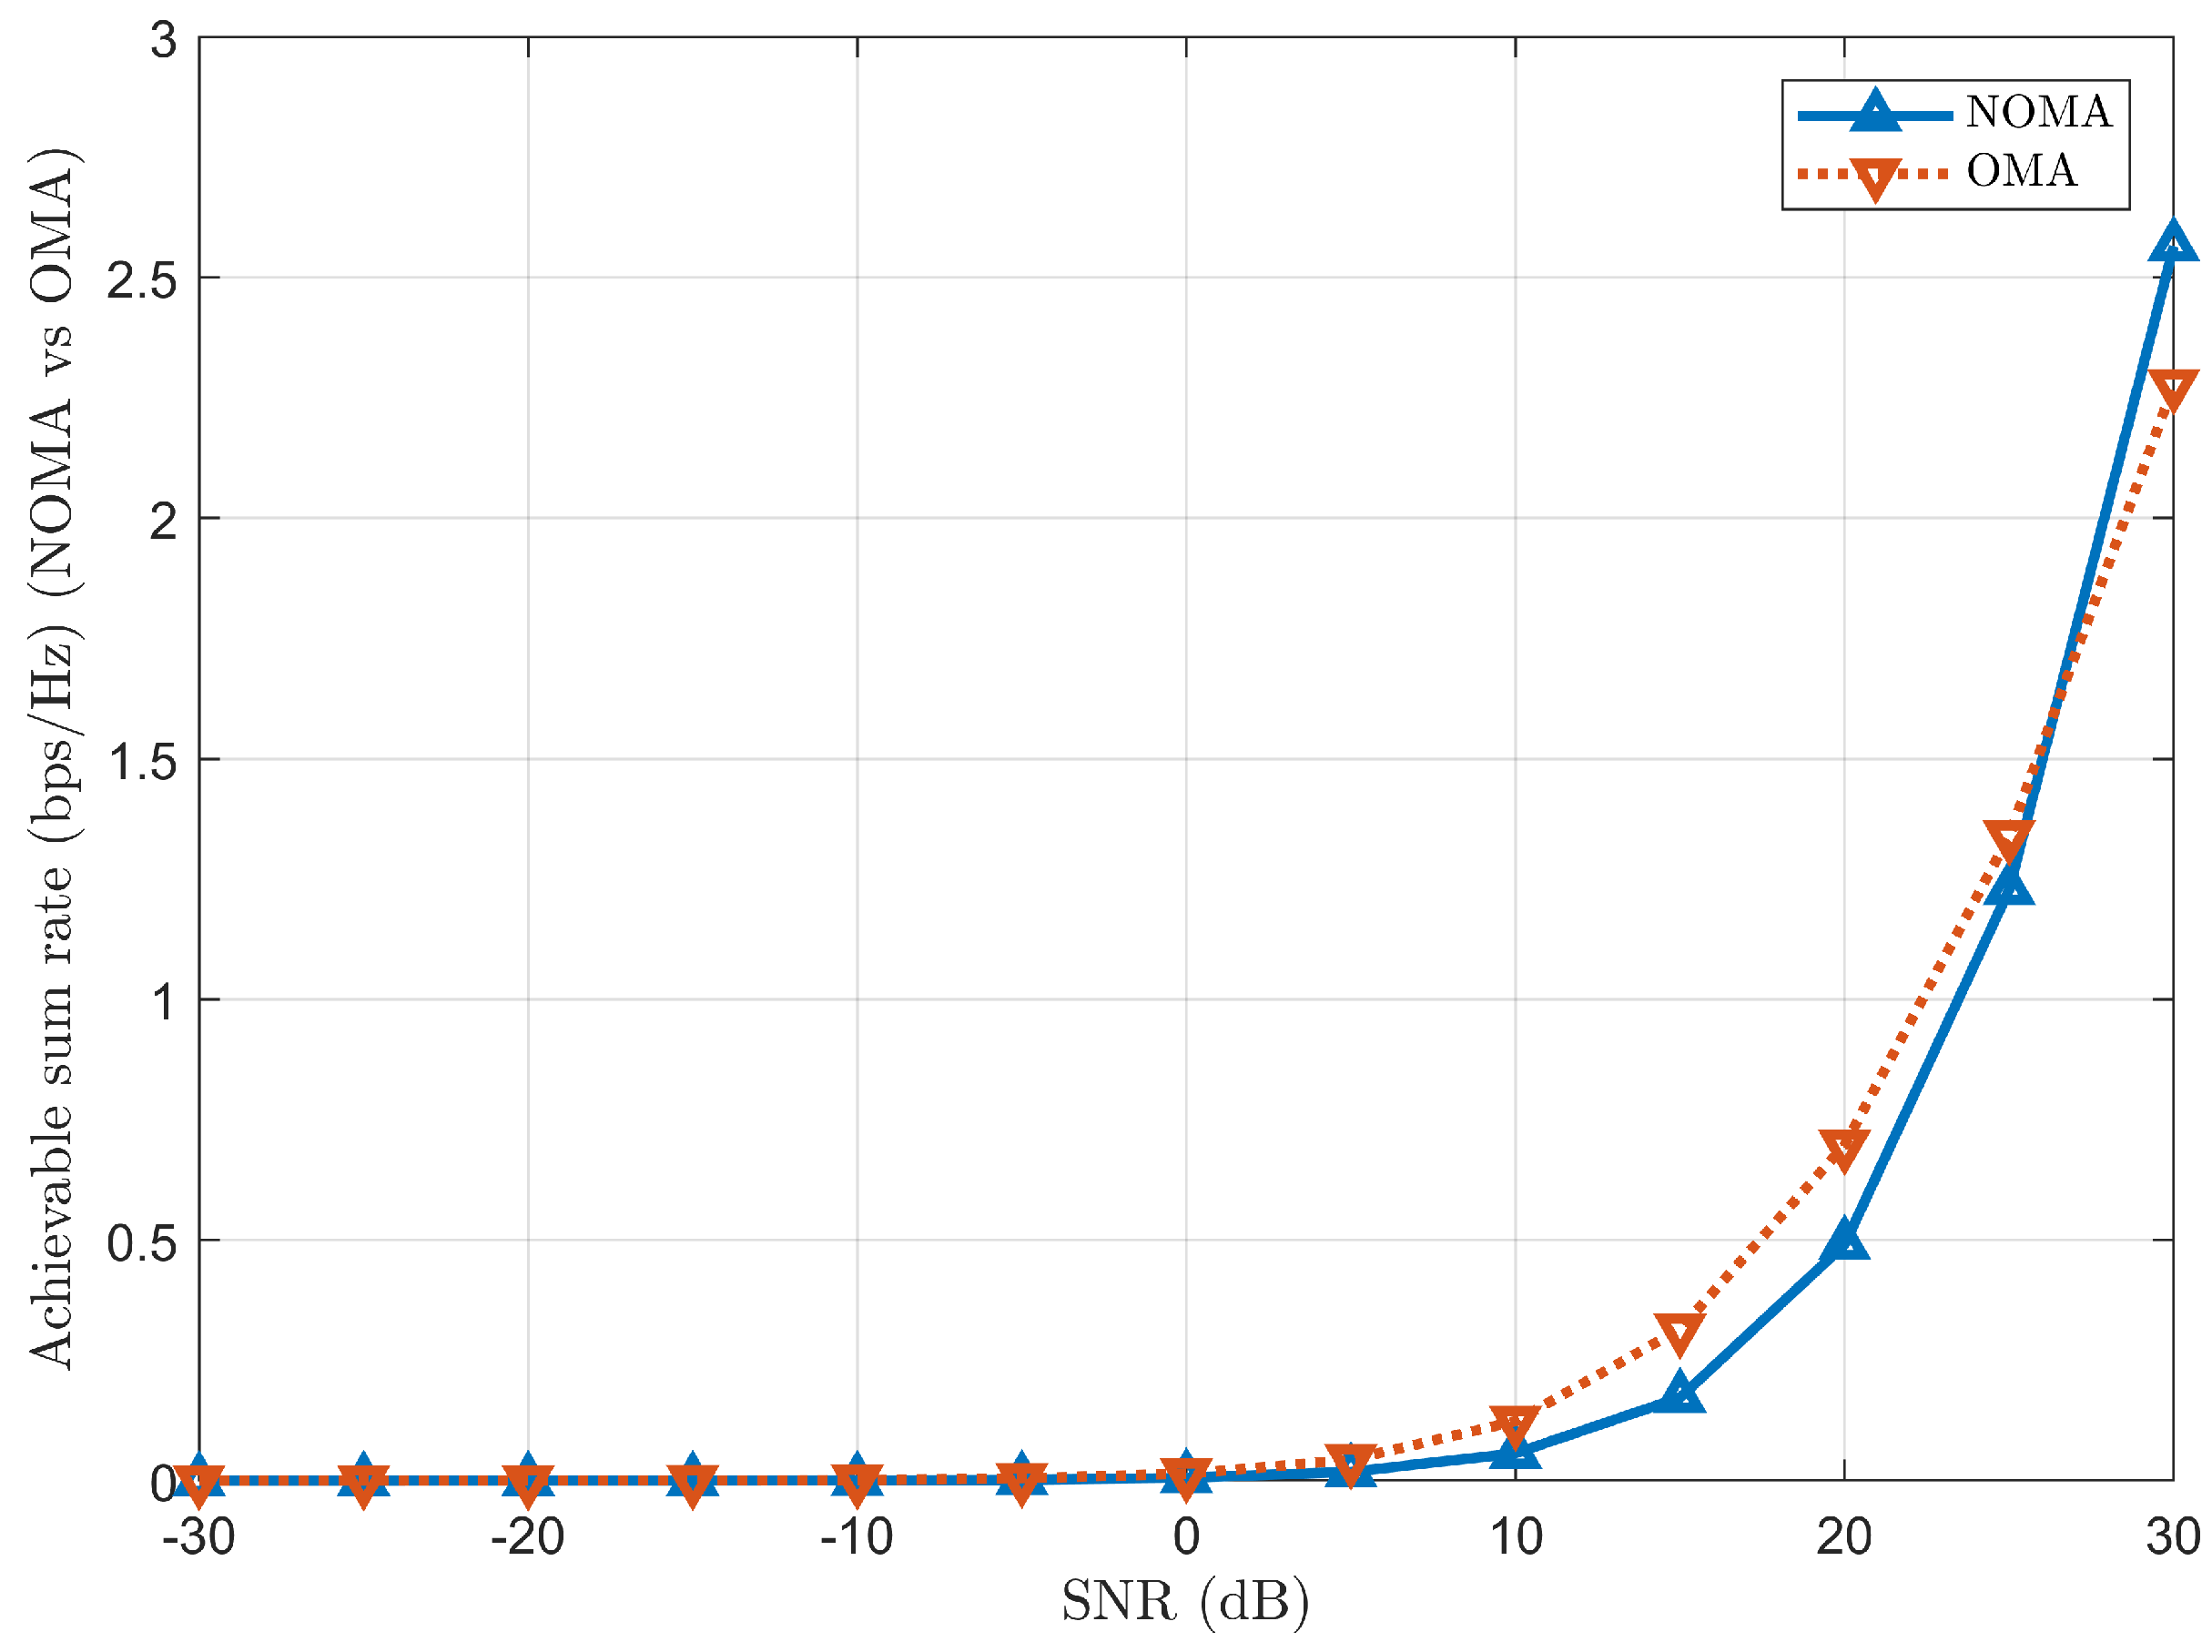
Figure 6.
Outage probability of NOMA scheme.
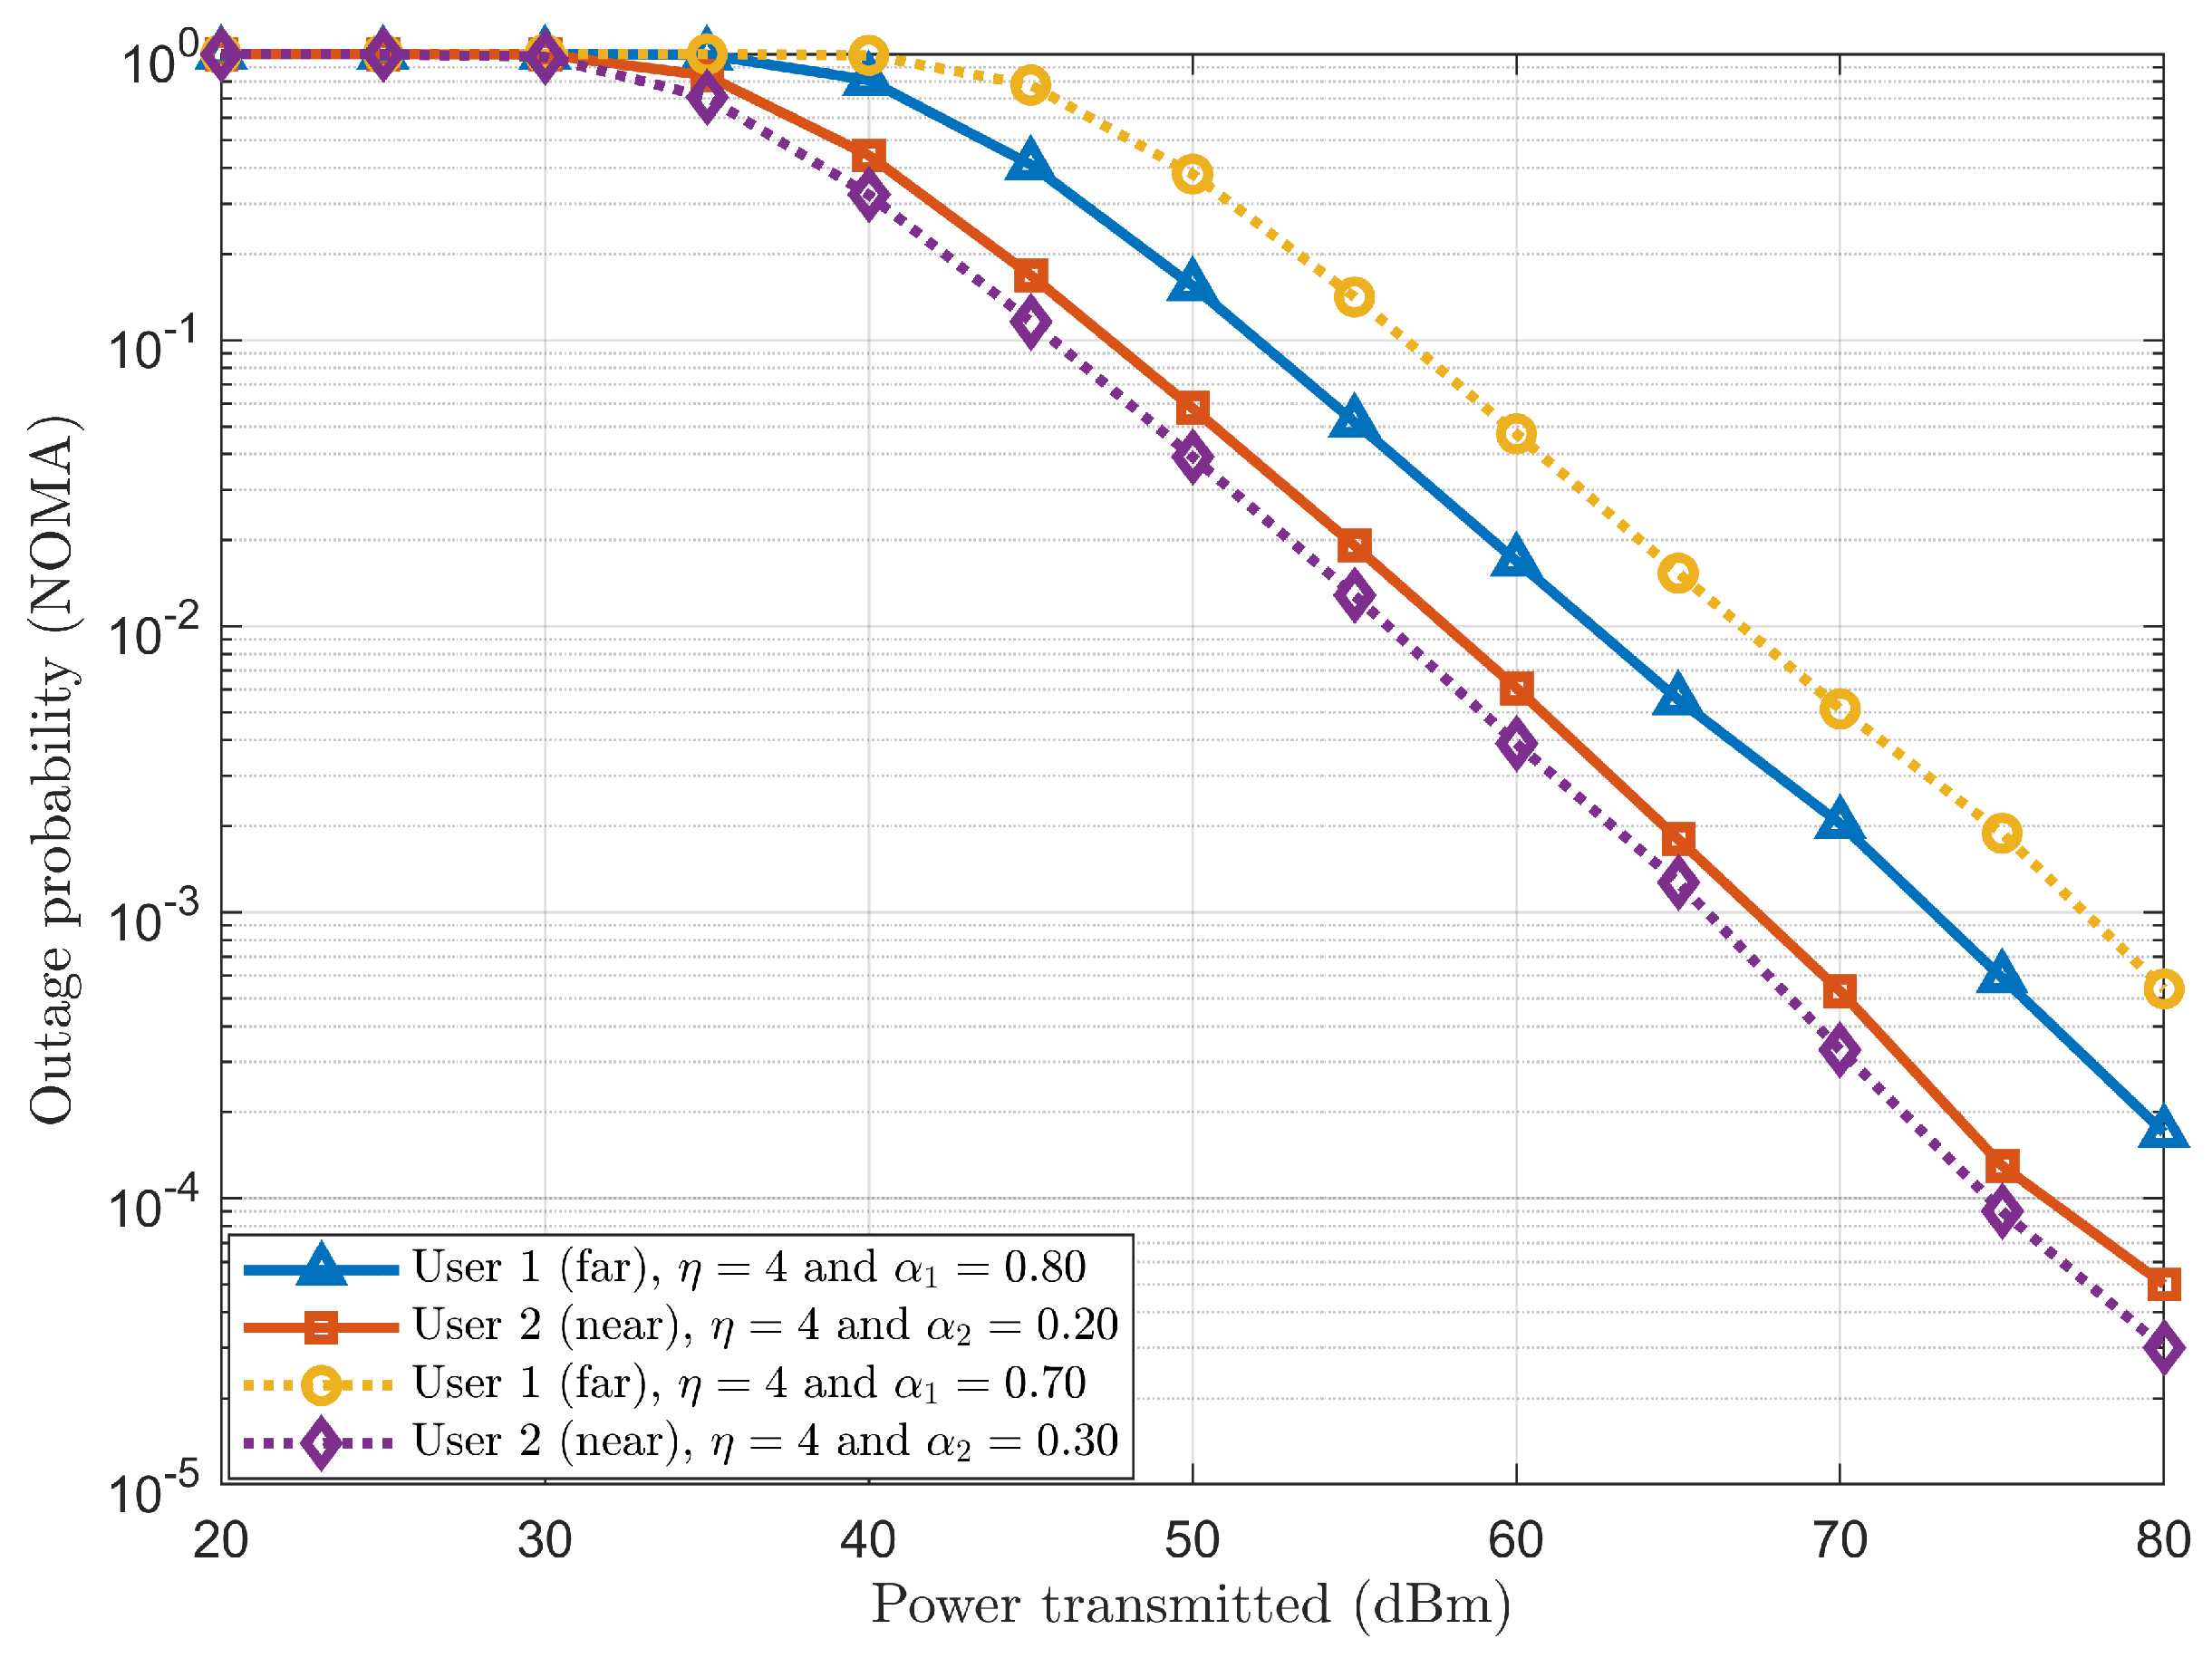
Figure 7.
Outage probability of fair PA with a two-user scenario.
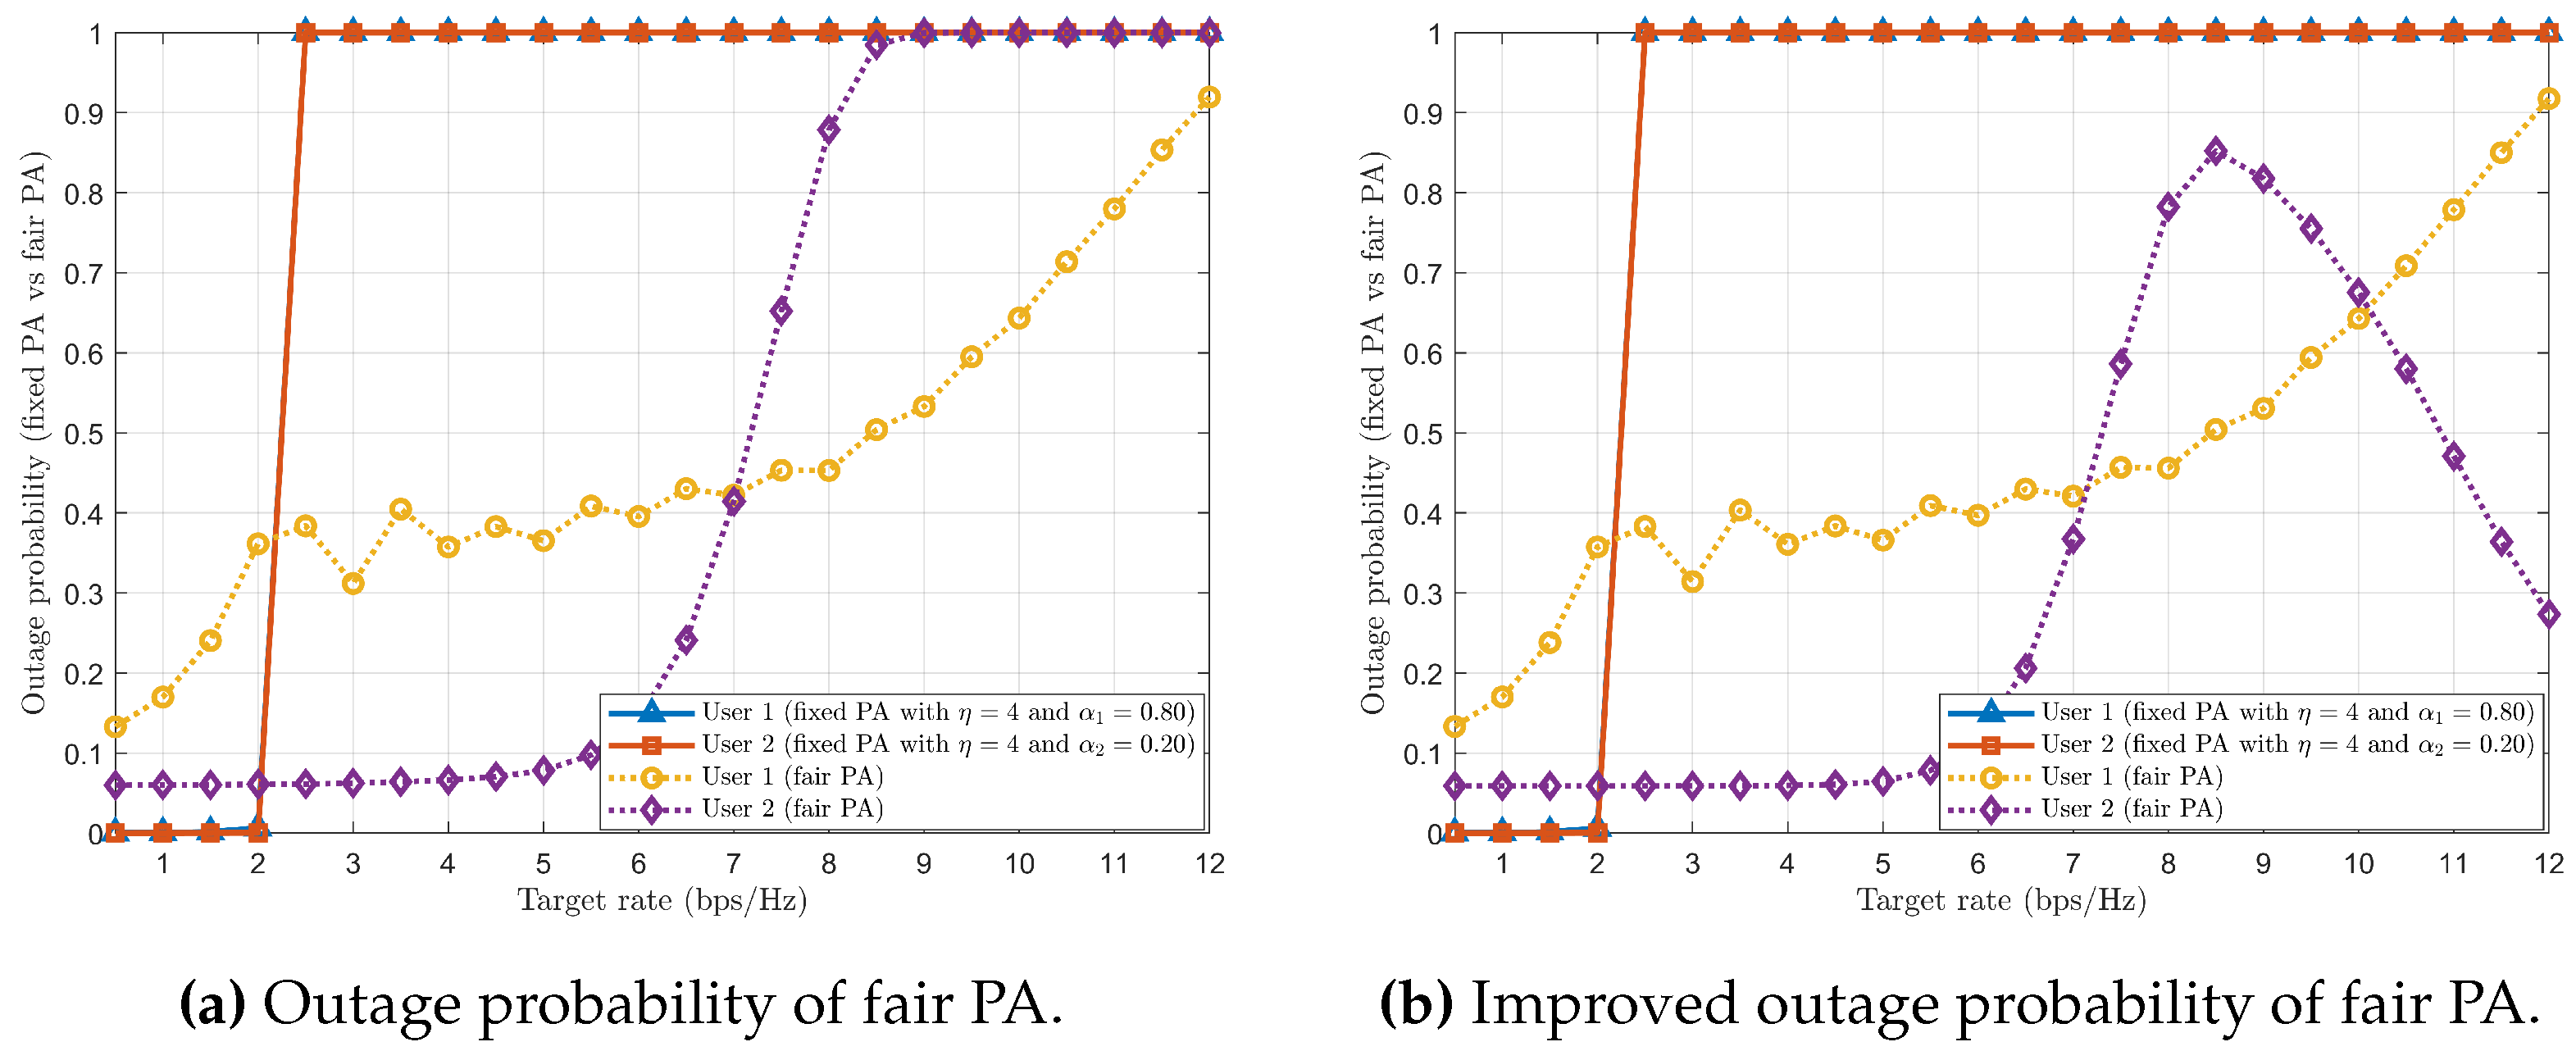
Figure 8.
Achievable sum rate comparison between fair and fixed PAs.
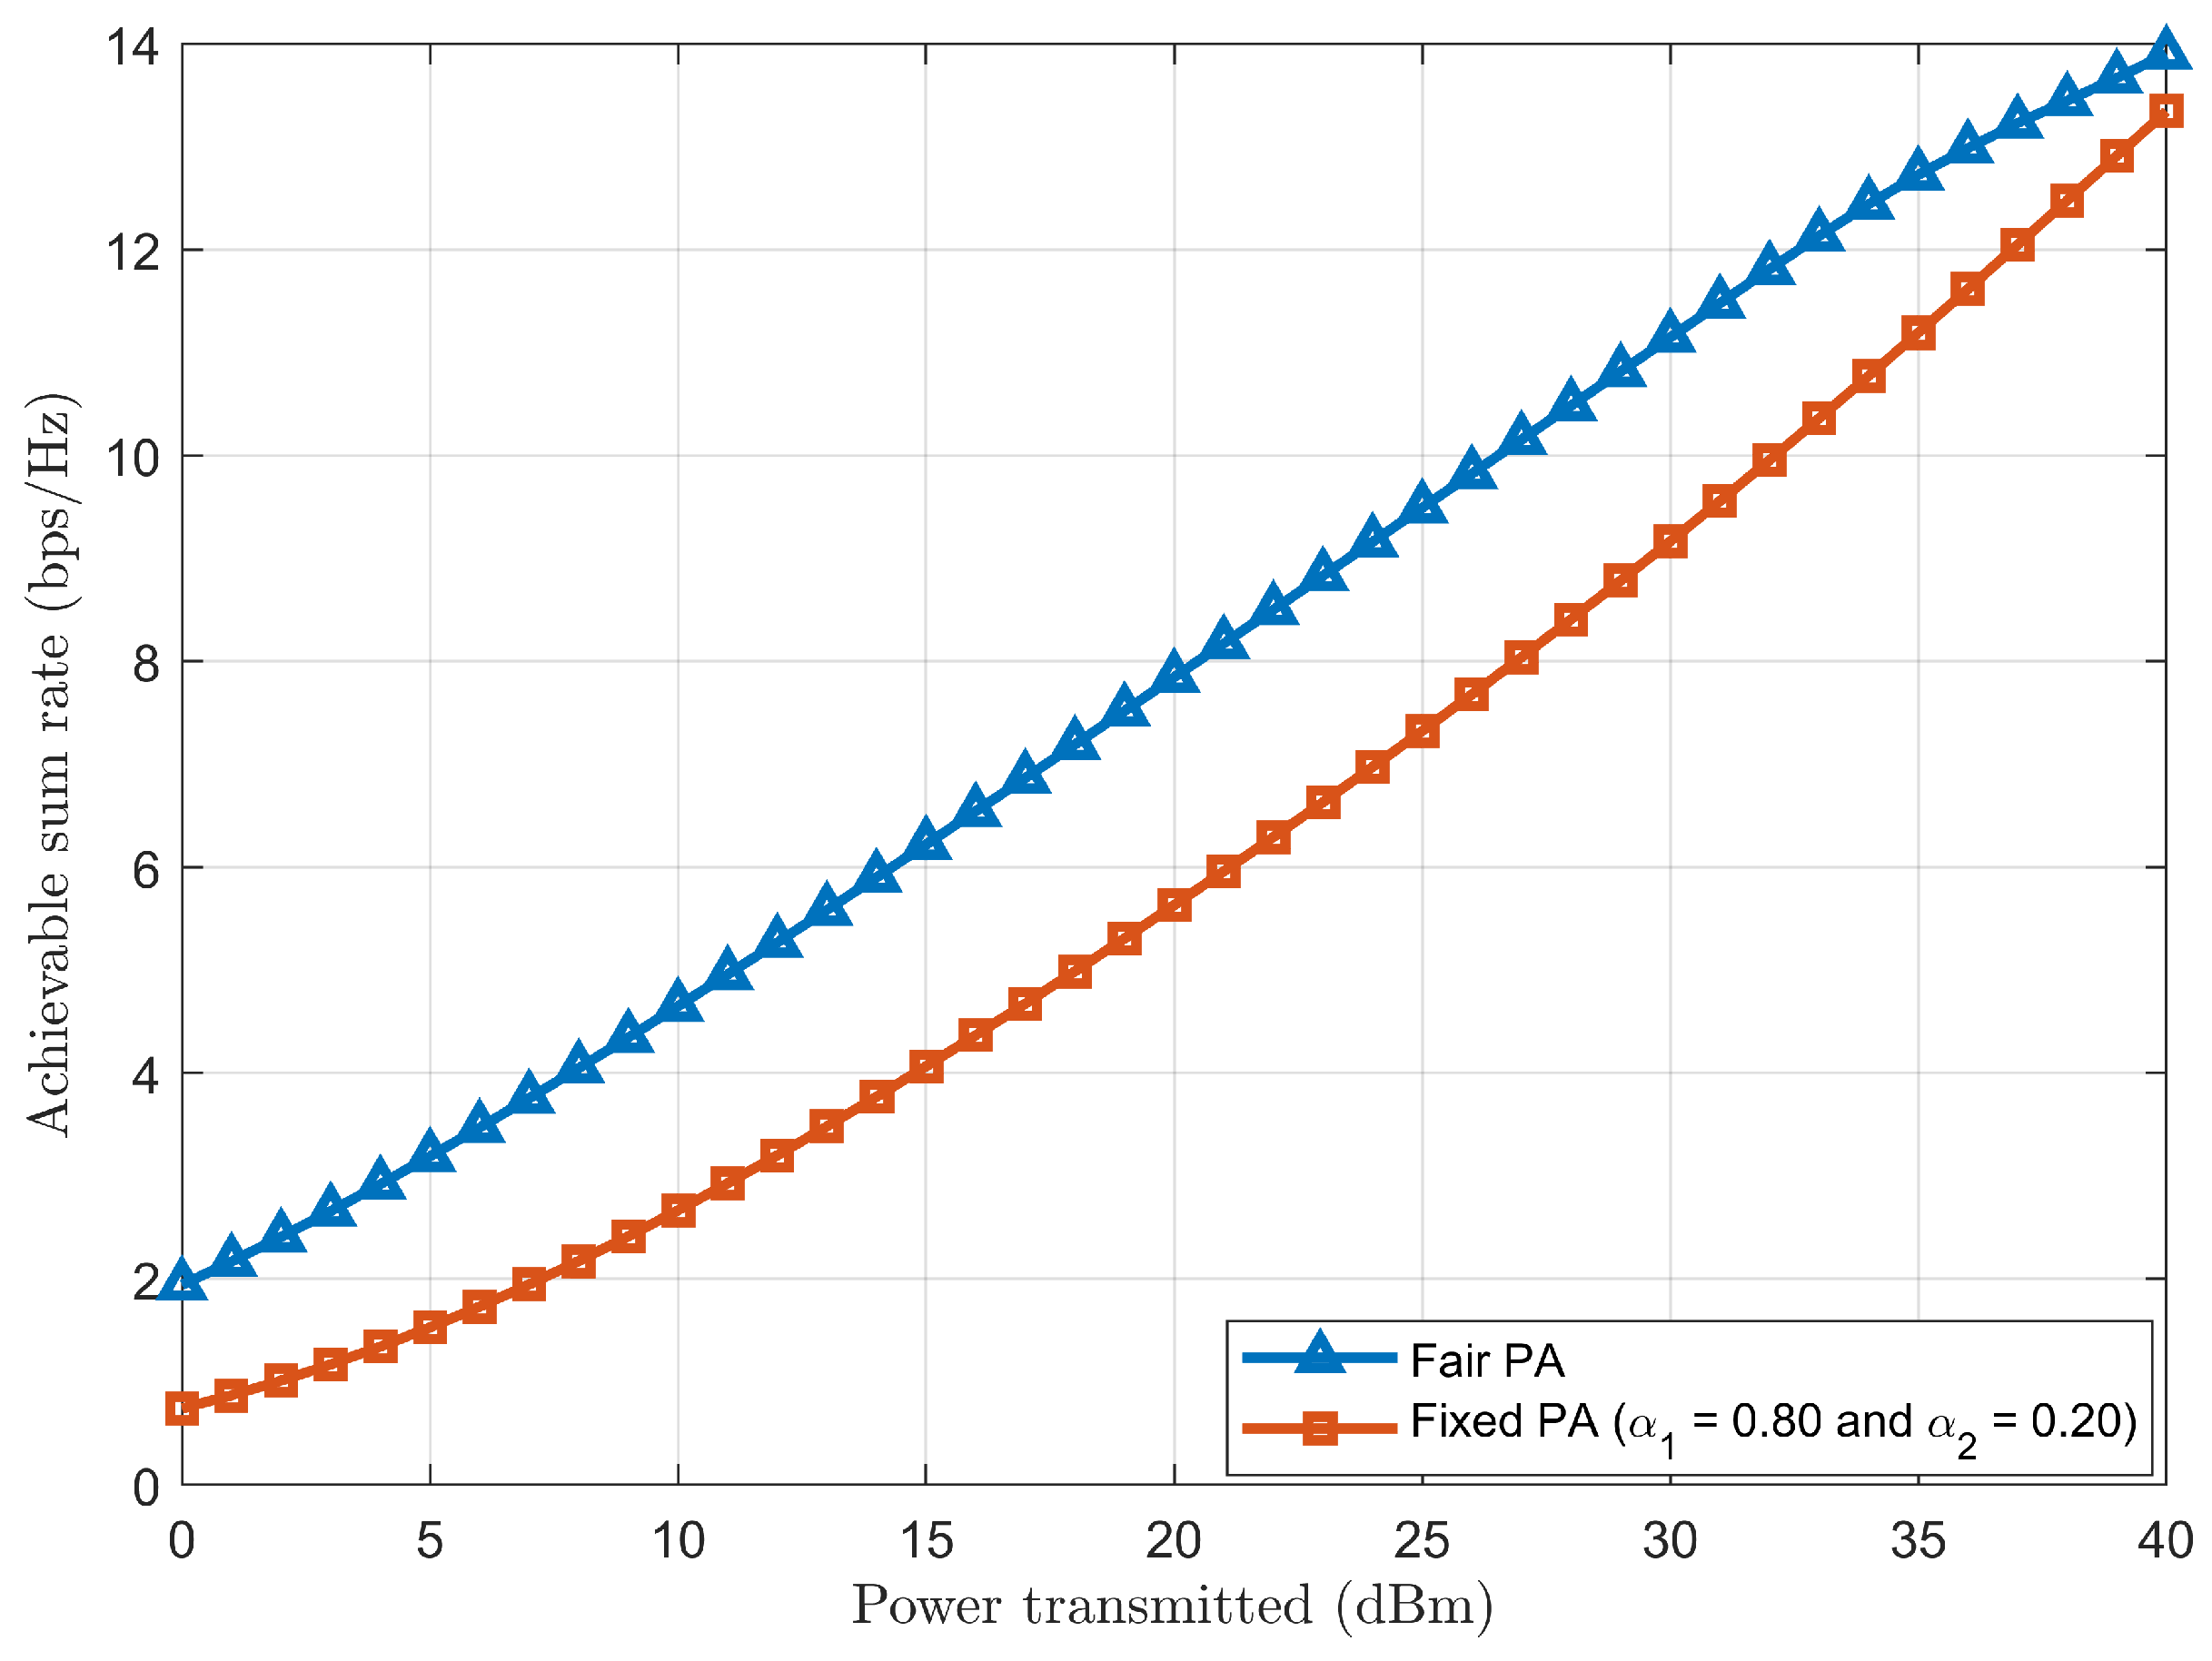
Figure 9.
Latency comparison between NOMA and OMA with = 2 and fixed PA coefficient (, & ).
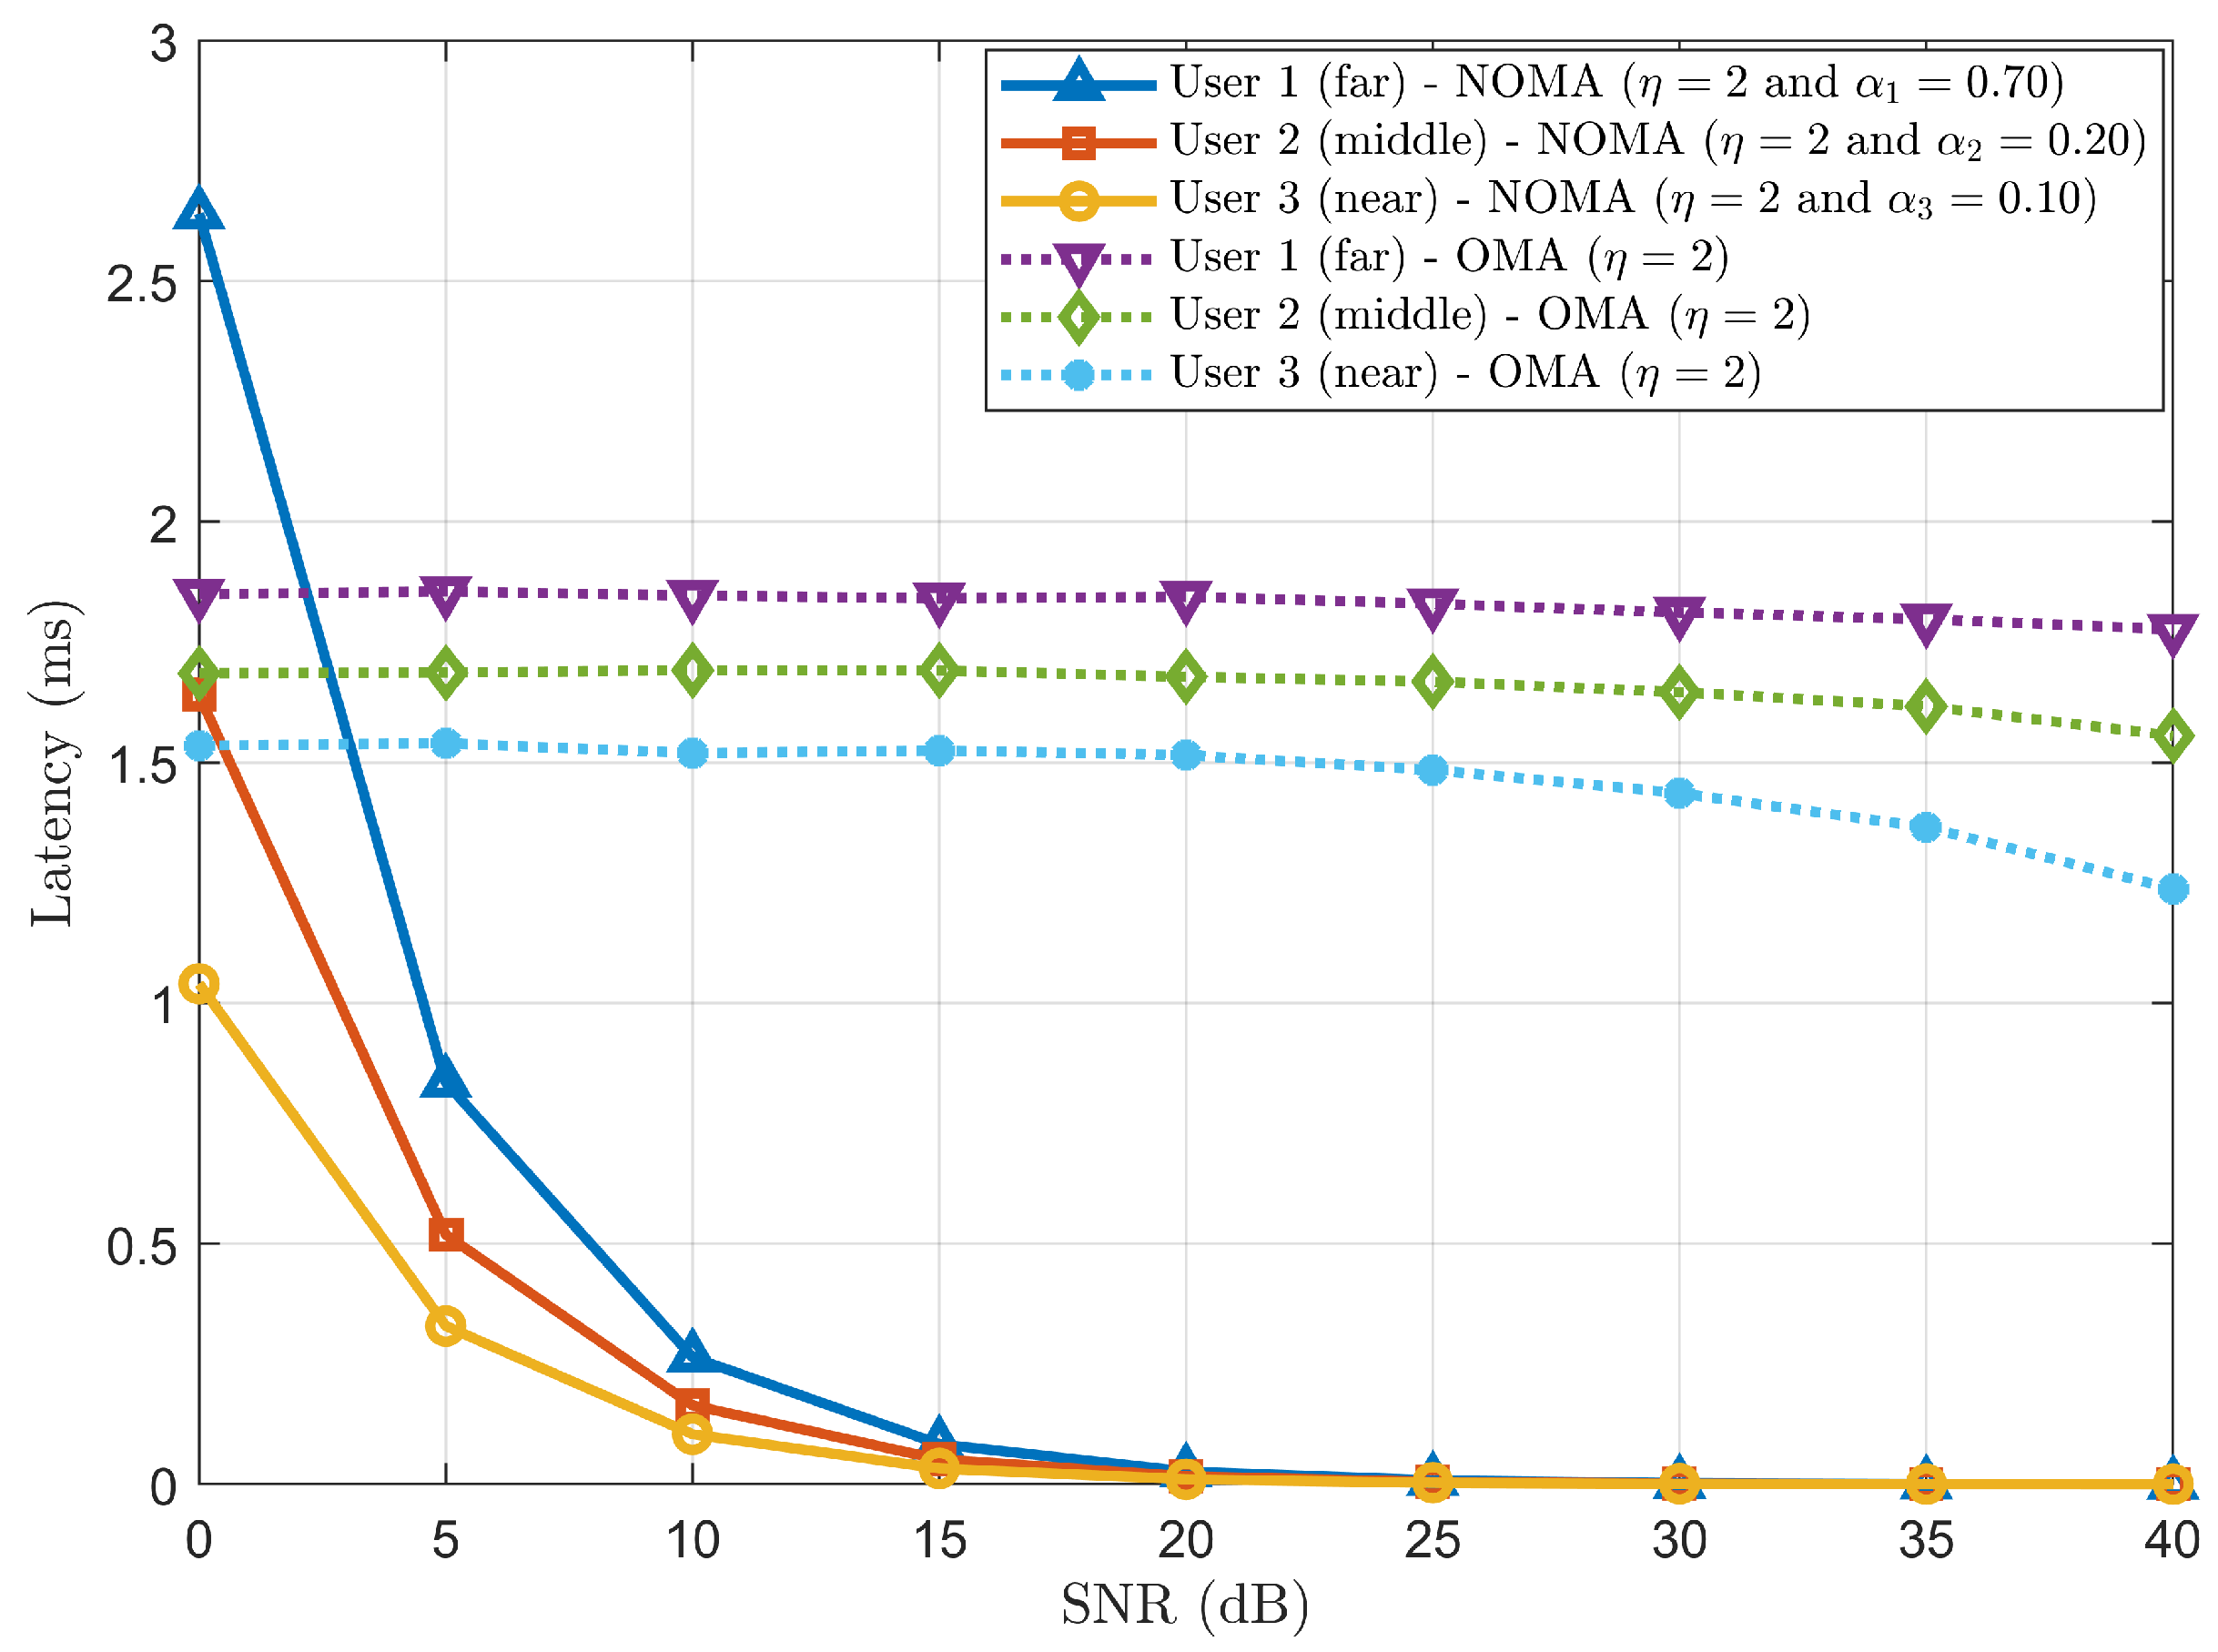
Figure 10.
Latency comparison between fair and fixed PAs in NOMA.
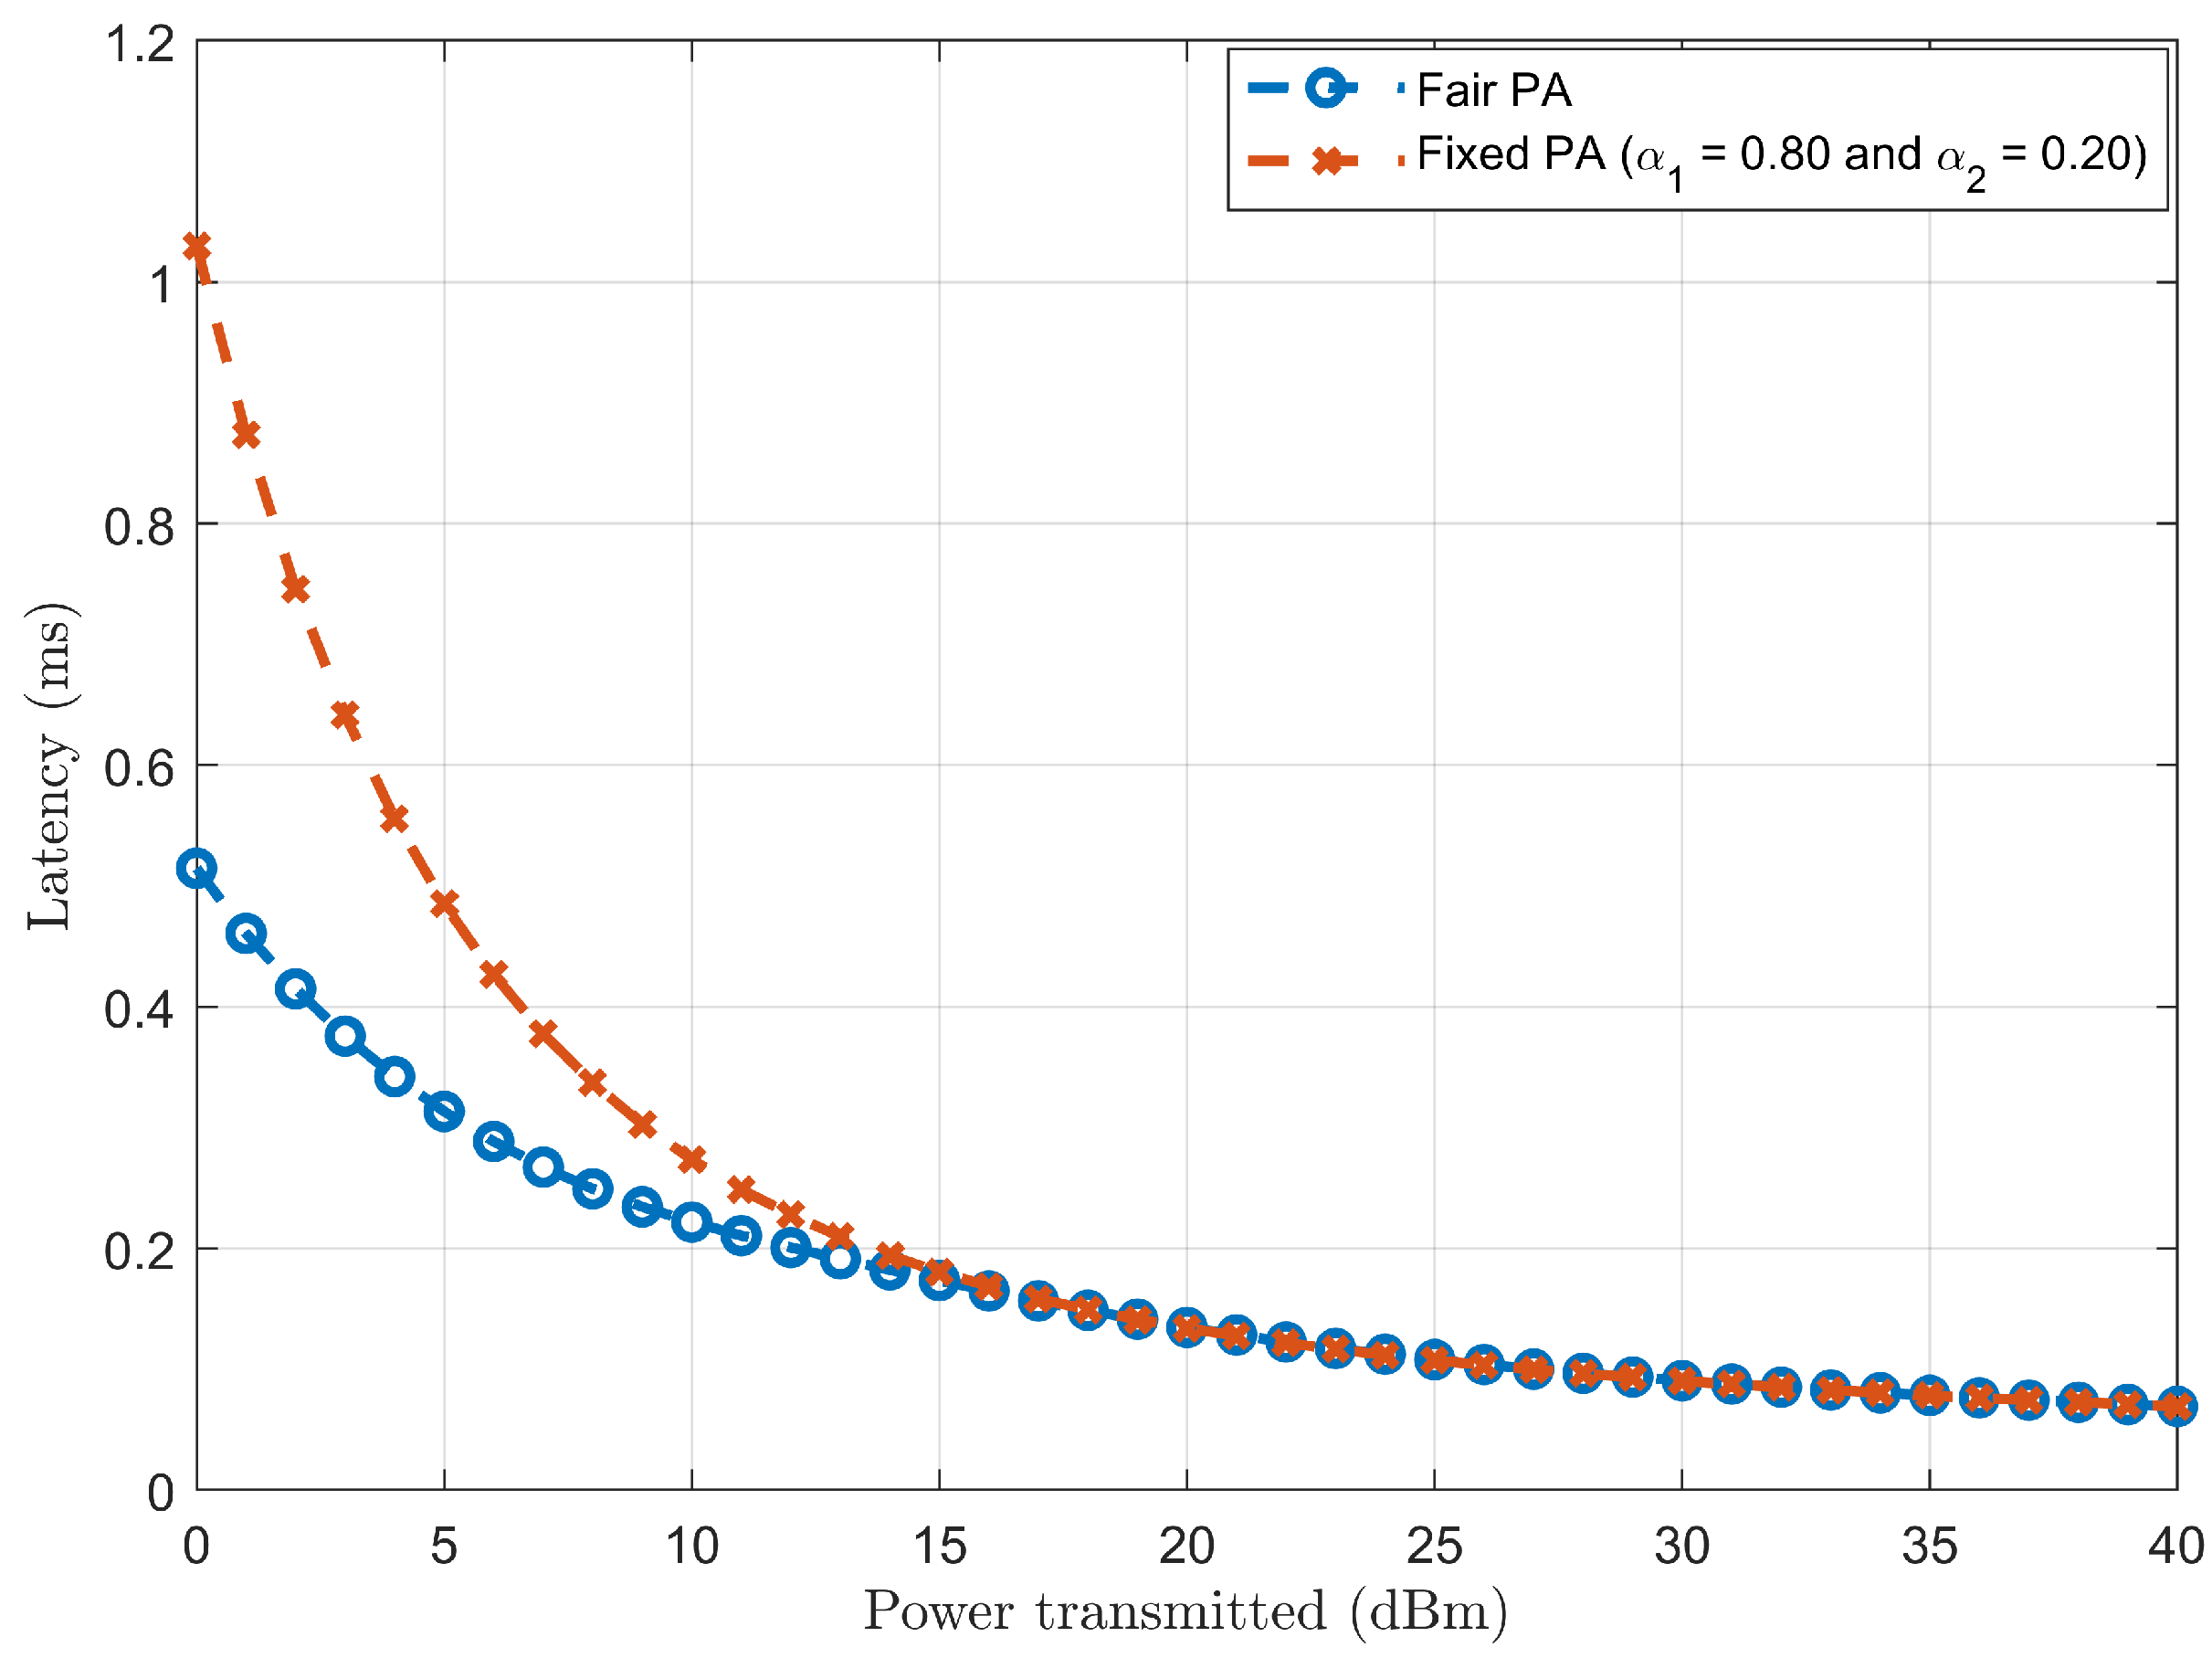
Table 1.
Parameters used in the simulation.
| Parameter | Value |
|---|---|
| Users 1, 2 and 3 distance from BS | 1000, 500 and 200 metres, respectively |
| For a two-user scenario, PA coefficients ( & ) | (70% & 30%) and (80% & 20%), respectively |
| For a three-user scenario, PA coefficients (, & ) | (70%, 20% & 10%) and (76%, 16% and 8%), respectively |
| Modulation scheme | Binary phase shift keying (BPSK) |
| Path loss exponent () | 2 and 4 |
| Channel | Rayleigh Fading |
| Number of OFDM subcarriers | 128 |
| Packet size | 128 bytes |
| Noise | AWGN |
| System bandwidth | 1 GHz |
| Power transmitted from BS | 40 dBm |
Disclaimer/Publisher’s Note: The statements, opinions and data contained in all publications are solely those of the individual author(s) and contributor(s) and not of MDPI and/or the editor(s). MDPI and/or the editor(s) disclaim responsibility for any injury to people or property resulting from any ideas, methods, instructions or products referred to in the content. |
© 2024 by the authors. Licensee MDPI, Basel, Switzerland. This article is an open access article distributed under the terms and conditions of the Creative Commons Attribution (CC BY) license (http://creativecommons.org/licenses/by/4.0/).
Copyright: This open access article is published under a Creative Commons CC BY 4.0 license, which permit the free download, distribution, and reuse, provided that the author and preprint are cited in any reuse.


