

Submitted:
08 October 2024
Posted:
08 October 2024
You are already at the latest version
Abstract
This study applied the principal-agent model to interpret the impact of routine biased technological change (RBTC) on the structure of employment relations. RBTC increases the proportion of routine tasks in work activities, due to their fixed procedural nature, routine tasks reduce uncertainties in the principal-agent problem. Employers, being able to predict work contingencies and to verify employee efforts, find the benefit of offering standard labor contracts is reduced, thereby increasing the ratio of non-standard employment. This study applied logistic regression based on the Program for the International Assessment of Adult Competencies (PIAAC) survey data to verify this framework. The results indicated that with each standard deviation increased in routine task intensity, the odds ratio of non-standard employment increased by 13.6%. This effect was heterogeneous in various institutional contexts. This study expends the toolkit for analyzing employment relations problems, and extends the scope of RBTC to employment relations.
Keywords:
routine biased technological change
; principal-agent model
; non-standard employment
; routine task
Introduction
From the late 20th to the early 21st
century, developed countries experienced a labor market polarization, which was
characterized by a dual decline in both the job opportunities and income of the
middle-income group (Autor et al., 2006; Goos and
Manning, 2007). A rising theoretical framework, RBTC, interprets this
trend through the lens of the biased nature of technological change (Autor, 2010; Goos et al., 2014; Cortes, 2016).
During the same period, the structure of employment relations has been changed
as well. The ratio of standard employment decreased sharply, and the proportion
of various forms of non-standard employments increased (Kalleberg,
2000, 2003). Although foundings of RBTC effectively explained the
mechanisms behind the labor market polarization, literature so far falls short
in discussing changes in the structure of employment relations. Considering
that the employment and wage structure have been changed dramatically, the
structure of employment relations is hardly remaining unchanged. Since the
middle-income group such as accountants, bank tellers, and blue-collar workers constitutes
the core of standard employment, it could be inferred that if RBTC has impact
on middle-income group’s employment and wage structure, the structure of
employment relations should be also affected by RBTC. Has the RBTC was one of
the reason of shifting of non-standard employment? This study is trying to
answer this question.
We built a framework through the principal-agent
model to explain the rise of non-standard employment based on RBTC. We proposed
that for work dominated by routine tasks, employers are well-prepared with
protocols for emergency responses and effort assessments even before the
beginning of work. This preparedness diminishes uncertainties, reducing the
cost happened with employees’ morality hazard, therefore lessening the
necessities of motivating and constraining employees through standard labor
contract. The technological change increased the proportion of routine tasks,
therefore, it leads to a reluctance among employers to offer standard labor
contracts, and the ratio of non-standard employment was rising.
The marginal contributions of the study are:
1. Through the principal-agent model, this study constructed a framework to illustrate the impact of technological change on employment relations, and using quantitative method to check it, which expend the toolkit for employment relations analyzing.
2. While RBTC researches have an outstanding achievement to illustrate the impact of technological change on job and wage structures, this study is the first one that extending the scope of RBTC’s impact on employment relations.
The remainder of this study is structured as
follows. Section two provides literature review and Hypothesis, discussing how
RBTC and non-standard employment are interconnected under the principal-agent
model. Section three describes the data and methods. Section four presents the
regression results and robustness check. Section five offers conclusions,
implications and future directions.
Literature Review and Hypothesis
Task Approach and RBTC
It is widely accepted that a job can be viewed as a
bundle of tasks (Wong and Campion, 1991; Lazear,
1995; Autor et al., 2003; Acemoglu and Restrepo, 2018). By definition, a
task is “the smallest unit of work activity” (Acemoglu
and Autor, 2011)(pp. 19). Autor et al. (2003) introduced the task
approach, categorizing tasks into routine/non-routine and cognitive/manual.
They suggested that "a task is 'routine' if it can be accomplished by
machines following explicit programmed rules (pp.1283)." Based on the task
approach, RBTC posits that technological progress has transformed more tasks
into routine tasks, which are predominant in the jobs of middle-income groups.
Routine tasks are more easily to handle by machine or off-shored to cheaper
foreign workers, leading to a reduction in job opportunities and wages for
these groups, resulting in labor market polarization (Autor
et al., 2006; Ebenstein et al., 2014; Cortes, 2016; Bárány and Siegel, 2018;
Acemoglu and Restrepo, 2022). Economists have described and explained
labor market polarization in various countries based on the logic of RBTC (Goos et al., 2014; Akcomak et al., 2015;
Fernández-Macías and Hurley, 2017; Fonseca et al., 2018; Reijnders and de
Vries, 2018).
However, these studies focused primarily on job and
income structures, but did not discuss the impact of technological change on
employment relations. While the job and income structures have dramatically
changed, the structure of employment relations is expected to be reconstructed
as well.
Technological Change and Non-Standard Employment
Since the late 20th century, the
proportion of non-standard employment had increased sharply in developed
countries (Kalleberg, 2000; Connelly and Gallagher,
2004; Harvey et al., 2017). Technological change is also considered a
key impetus. Non-standard employment primarily refers to those employees with
limited attachment to their employers in terms of time, space, and
subordination (Pfeffer and Baron, 1988).
These limited attachments makes non-standard employment more flexible than
traditional standard employment. Technological change has accelerated the
deindustrialization process, and the work in the third industry, e.g. the
service industry, is more flexible and fragmented, which has led to an increase
in requirement of non-standard employment (Lee,
2005; Barbieri and Scherer, 2009; Kollmeyer, 2018). Even within
industrial sectors, the growing demand for flexible production has similarly
driven the increase in non-standard employment (Taplin,
1995; Blair, 2001; Kalleberg, 2003).
These research findings are substantial, but mainly
focusing on observing the fact of changing flexibility, overlooking the
changing nature of work activities, which should be the origin of changing
flexibility. It leads to fall in digging out the mechanism between
technological change and employment relations. Routine tasks, due to their
lower uncertainty, reduce instances of moral hazard behavior in the workplace.
Even with minimal connection between employees and employers, employer’s
interests could be ensured. Although Taplin (1995) interviewed managers of
textile firms in North Carolina, identifying the routinization of work due to
technological change as one of the reasons for the rise in non-standard
employment (pp.432), the mechanism was not illustrated clearly.
The Principal-Agent Model, Routine Tasks, and Research Design
The principal-agent model provides a framework for
understanding the interactions between routine tasks and non-standard
employment. The model suggests that the uncertainties during the work
activities may give employees an informational advantage over employers. Since
the interests of employers and employees often do not align, employees with an
informational advantage may intentionally or unintentionally harm the
employer's interests, leading to moral hazard and incurring additional costs (Cahuc et al., 2014) (pp. 328). Therefore,
employers (principals) often choose to offer long term or fixed term contracts
- which is a standard labor contract - to employees (agents). These contracts
emphasize a subordinate relationship between employer and employee. When uncertainties
arise, such as unexpected events or unverifiable work efforts, the advantage of
labor contracts lies in their ability to motivate and regulate employees to
align their actions with the employer's interests, thereby reducing the costs
associated with moral hazard.
However, the concept of routine task challenges the
assumption that all works involve uncertainties. The procedural and systematic
nature of routine tasks implies that any unexpected event during the work
process has predetermined solutions. These solutions should explicitly enough
to be executed by machines following fixed procedures. The outcomes of routine
tasks should be necessarily explicit enough to be identified and calculated by
fixed procedures; otherwise, any uncertainties that require human intervention
may break the fixed procedure executed by machines. The content of routine task
could be complicated, but has to be extremely logical and explicit for computer
comprehension. It means that for routine tasks, employers are fully aware of
the context, handling methods, and results of all the activities in the work
before it even begins. Therefore, Assumption 1 was raised :
Assumption 1: The routine task intensity (RTI)
measure the uncertainties during the work (inverse).
In the scenario of high RTI, the uncertainty in
work significantly decreases, reducing the necessities of offering standard
labor contract, leading to a increasing of non-standard employment. Research
has found that RBTC reduces employees’ discretion in their work, and various
institutional contexts play a significant role (Holman
and Rafferty, 2018). From the perspective of the task approach, lower
discretion is equivalent to a higher proportion of routine tasks. Therefore,
Hypothesis 1 was proposed :
Hypothesis 1: An increase in the RTI would raises
the ratio of non-standard employment.
It would be more straightforward if employment is
just an economic agreement between employers and employees. Under ideal
conditions, the employer would package routine tasks and allocate them to
non-standard employees, while assigning all non-routine tasks to standard
employees. As the RTI increase, more non-standard employees would be hired.
However, the prevailing labor laws and institutional settings predominantly
hinge on the paradigm of standard employment (Barley
et al., 2017). In many countries, a formal labor contract is closely
linked to a range of labor market policies such as labor protection, labor
union threshold, social welfare, or employment subsidies (Holman and Rafferty, 2018). It means that the
institutional social significantly influences how employers hire, which may
affect non-standard employment ratio and the impact of RTI on non-standard
employment. Therefore, Hypothesis 2 and 3 were raised :
Hypothesis 2: The non-standard employment ratio is
different in various social contexts.
Hypothesis 3: the social contexts have a
heterogeneous effect of the impact of RTI on the ratio of non-standard
employment. 1
Data and Methods
Data
PIAAC is a large-scale international survey
conducted by the OECD in 2012. The advantages of using the PIAAC database are:
1. The PIAAC database includes multiple questions about the task
characteristics. Economists have used this database to construct an effective
cross-national RTI (Marcolin et al., 2019; Rica et al., 2020), which facilitates this study2; 2. PIAAC datasets collect information from various countries, which is
beneficial for testing Hypothesis 2 and 3.3
The study constructed a dummy variable as the
response variable: workers who have not had a long-term or fixed-term labor
contract, are considered to be non-standard employees. In total of 73,993 employee
(gets a salary or wage from an employer or a temporary employment agency) samples
of 24 countries were gathered from PIAAC datasets. The RTI was constructed as
the core independent variables. As shown in Table 1:
The study controlled a series controls to avoid
omitted variable bias. The control variables are in three level: individual,
organizational and country. Individual control variables include gender (Casey and Alach, 2004; Booth and van Ours, 2013),
education (Biemann et al., 2012), age (Loughlin and Barling, 2001; Macdonald and Giazitzoglu,
2019), income (Uzzi and Barsness, 1998;
Kalleberg, 2000), marital and offspring status (Horemans,
2016), migrant and native speaker (Anderson,
2010), parents education background (Caro et
al., 2015), education and skill mismatch (Esposito
and Scicchitano, 2022, 2023), and other task information from PIAAC, 23
individual controls in total. Table 2 presents descriptive statistics of dependent variable, RTI and individual
control variables:
The sample has a nearly balanced gender
distribution, with a slight male majority (51.3%). Education levels indicate a
fairly educated sample with a tilt towards high school and over. The
predominant age group is 25-54 years, which corresponds to prime working age.
Most samples are living with partner (75.6%), two third of samples are having
child (66.9%). Samples work between 40 and 50 hours per week, and the income
distribution suggests moderate economic diversity.
For organizational controls, the study uses 4
variables, which are the firm size (Uzzi and
Barsness, 1998; Kalleberg and Marsden, 2005), the ownership of the firm (Olsen and Kalleberg, 2004), part time job (Busilacchi et al., 2024) and manage status. For
country level controls, the study uses 9 controls that may affect labor
relations: strictness of labor protection, union density, social expenditure
and whether the country is developed country (Holman
and Rafferty, 2018), GDP per-capita, CPI, unemployment rate,
unemployment duration, internet permeability. The descriptive statistics of
organizational and country controls are shown in appendix Table B2 and B3. Furthermore,
different industry may have different characters that impact the ratio of
non-standard employment (such as flexibility which was mentioned before), the
study controls the two-digit industry fixed effect.
To test Hypothesis 2 and 3, the study categorizes
all countries into five groups - Anglo Saxon, South West Europe, Middle East
Europe, East Asia, and Nordic. Each of them has its unique institutional,
economy, cultural and social context. Given the variation in the structure of
routine tasks among different EU countries (Hardy
et al., 2018), EU countries was separated into South West Europe and
Middle East Europe. Table 3 shows the
country groups:
Methods
The logistic model is suitable for analyzing dummy
response variable:
(1)
In equation (1), where indicating that the probability of an employee has
no long-term or fixed-term labor contract. represents the standardized form of the RTI of
individual . represents individual controls, represents organizational controls, represents country controls, represents
industry fixed effects. According to Hypothesis 1, it could be expected a
significant positive value of , meaning the RTI is positively correlated with the
odds-ratio of non-standard employment.
(2)
In equation (2), represents the country group. We interact and RTI to analyze the heterogeneous of the
impact of RTI on the ratio of non-standard employment. According to Hypothesis
2 and 3, it could be expected a significant and , but the direction is not assure.
Results and Robustness Check
Regression Results
Table 4 represents the regression results of Equation (1). Columns 1-5 respectively
represent results by one independent variable RTI, controlling individual
variables, controlling organizational variables, controlling country variables,
and controlling industry fixed effect. For ease of reading, the results are
displayed in the form of indices, which interpret the odds ratio of
non-standard employment (the probability of the individual is a non-standard
employee over standard employee). For ease of reading, the results of control
variables was omitted, the complete results are shown in Appendix Table B5. The regression results of
control variables are constant with the findings of related literature, indirectly validate the effectiveness of regression.
The findings of Table 4 are:
(1) With the increase in the number of control variables (especially country control variables), the Pseudo R2 increases, the log likelihood (LL) increases (the base number is -24298.36), the AIC indicator decreases, indicating that the effectiveness of the regression equation is improving. After controlling industry fixed effects, the Pseudo R2 is 0.408, means that 40.8% of the variation of non-standard employment could be explained by the equation.
(2) RTI has a significant positive impact on the odds ratio of non-standard employment. The regression results are positively significant in Columns 1-5, the RTI increases one standard deviation, the odds ratio of non-standard employment increases by 12.4%-26.4%. In column 5, after controlling for all control variables, the odds ratio of non-standard employment increases by 12.40%. The result is consistent with Hypothesis 1.
Table 5 represents the regression results of equation (2).
The findings of Table 5 are:
(1) By adding country group variables, the pseudo R2 and LL keep increase, and AIC indicator keep decrease. The explanation power of regression are keeping rising. The column 3 shows that after controlling social context controls, every increase of the standard deviation of RTI may lead to the odds-ratio of non-standard employment increase by 13.6%, which is still constant with Hypothesis 1.
(2) In Column 1-4, compared to Nordic countries, the odds ratio of employees in other groups are significant lower. In column 4, it shows that Anglo Saxon is about 98.4% lower; Middle East Europe is about 99.1% lower; East Asia is about 98.7% lower ; and South West EU is about 98.66% lower. This huge gap may coming from the Nordic countries’ typical social, institutional and even geographic context. The result is consistent with Hypothesis 2.
(3) In Column 4, the impact of the RTI on non-standard employment is heterogeneous in various groups. In Nordic countries, every standard deviation increase in the RTI raises the odds ratio of non-standard employment by 43.5% (first row), in Anglo Saxon countries by 9.9% (calculated by 1.4354×0.7654), in Middle East EU countries by 13%, in East Asian countries by 10.1%, in South West EU countries by 13.2%. Compared to the results in Column 3 (13.6%), Nordic countries have a positive heterogeneous effect, Anglo Saxon and East Asia countries have a negative heterogeneous effect, while South West EU and Middle East EU countries have a slightly negative heterogeneous effect. The result is consistent with Hypothesis 3.
Robustness Check
Employers would always prefer non-standard employment for it’s lower cost, but non-standard employment could generate more cost in non-routine task. Employers offer different types of contracts based on the characteristics of various tasks. Workers may accept or reject these offers. However, regardless of what the workers' personal preferences are, they will ultimately choose a contract that maximizes their utility, thereby becoming employees. The employees’ choices reflect the relationship between task characteristics and the employment relations. Therefore, the self-selection bias has limited effects in the model.
Firstly, Marcolin et al. (2019) built another equation to calculate routine task intensity based on PIAAC data. The study changed the method of calculating the RTI followed Marcolin et al. (2019), with everything else remaining unchanged. The results changed very little, as shown in appendix Table B6. Secondly, the study applied the binary probit regression instead of logit regression to run the model. The results are shown in Table B7, which are constant with Hypothesis 1, 2 and 3. Lastly, the study used liner probability model (LPM), and Oster test to check the endogenous of omitted variables (Oster, 2019). The results of LPM are shown in Table B8, which are still constant with Hypothesis 1, 2 and 3. The result of Oster check is shown as Table 6:
Table 6 shows that after controlling all the controls in LPM, the explanation power of model is increased (R2 increased from 0.005 to 0.357). In the assumption of the model could explain 80% of the variation of the dependent variable at most (input R-max=0.8), and under the premise that the adjustment coefficient is 0.1 (input beta=0.1), the estimation results are still robust even if the potential omitted variables are considered (delta>1), which means that the model is robust after considering the endogenous of omitted variables.
Conclusions, Implications and Future Directions
Conclusions
This study suggests that there is a positive correlation between routine task intensity and non-standard employment. This impact is heterogeneous in various institutional contexts. This study builds a framework to illustrate this correlation based on the principle-agent model, and applying the PIAAC database to test it. Regression results explain the trend of non-standard employment from the perspective of RBTC, which expending the toolkit for analyzing employment relations problem. And this study is the first one that illustrates the changing structure of employment relations by the RBTC framework, expending the scope of RBTC into employment relations.
Implications
The implications of this study include two aspects: 1. From a micro perspective, firms should choose employment relationships properly based on the level of routine task intensities. Although non-standard employment is prevalent, non-routine tasks without the constraints of standard labor contracts may incur potential moral hazard costs that exceed the savings from not offering a standard labor contract. 2. From a macro perspective, the government should not force companies to complete routine tasks in the form of standard employment. It would lose efficiency and reduce the competitiveness of domestic firms. To better protect employees, the government should incorporate the density of routine tasks in major jobs in society into its decision-making process, and develop corresponding regulations based on the different types of tasks that employees engage in.
Future Directions
Directions for future studies include: 1. This study found that institutional contexts have a heterogeneous effect on the relationship between routine task intensity and non-standard employment, but did not clarify the underlying mechanisms. Future analyses could reveal how the specific contextual factors, such as culture or labor law regulations, affect the costs associated with moral hazard. 2. RBTC literature provides a method to measure the potential impact of AI techniques on the labor market (Frey and Osborne, 2017; Eloundou et al., 2023; Korinek, 2023). Analyzing and predicting how the application of AI technologies, such as ChatGPT, affects standard and non-standard employment by changing the routine task intensity, could outline how AI technologies will influence employment relations in the future.
| 1 | To illustrate this intuition clearly, a simple formula derivation of Assumptions and Hypothesis was raised in Appendix A in the end of the text. |
| 2 | Some studies applied U.S. datasets O*NET to calculate RTI (Autor and Dorn, 2013; Cortes, 2016). However, task data from O*NET was gathered from few incumbents or experts (around 20-50) based on working information merely in U.S.. Further more, O*NET RTI was hinged on U.S. occupation code SOC, while PIAAC data used ISCO occupation code. There might be loss of accuracy when transforming occupation code if applying O*NET RTI. Since the study aims to test a universal impact of RTI on employment relations and to test heterogeneous effect of various social contexts, the author decided not to use O*NET and to use PIAAC to calculate RTI. |
| 3 | PIAAC also has datasets in 2014 and 2017. However, numbers of survey countries are much lower: 9 in 2014 and 6 in 2017, compare to 24 in 2012. Though the data is relatively old, recent studies used it for it high quality (Hämäläinen et al., 2021; Van Nieuwenhove and De Wever, 2022). Therefore, the study uses 2012 datasets to test Hypothesis. |
Appendix A: The Formula Derivation of Intuition
Denoting the uncertainties inherent in the work process is , which could only be addressed by labor. The cost associated with managing uncertainties of standard employment and non-standard employment are denoted by and , which are the monotonically increasing function of . The fixed costs of contracts are and . Therefore, Assumption A1 was raised:
Assumption A1: .
Assumption A1 illustrates that the legal, textual, and social costs of offering standard employment contracts are usually higher than non-standard employment contracts (Tilly, 1991; George and Chattopadhyay, 2015). Therefore,
Assumption A2: .
Assumption A2 illustrate that when uncertainties arise, the cost of morality hazard are different between various employment relations. By emphasizing the employer's control over employees during unexpected events, standard employment has an advantage in reducing costs associated with moral hazard compared to non-standard employment.
Therefore, the probability of non-standard employment, , hinges on the trade-off between the costs of uncertainties and the fixed costs associated with each type of contract. As shown in Figure A1:
Figure A1.
The probability of non-standard employment and uncertainties.
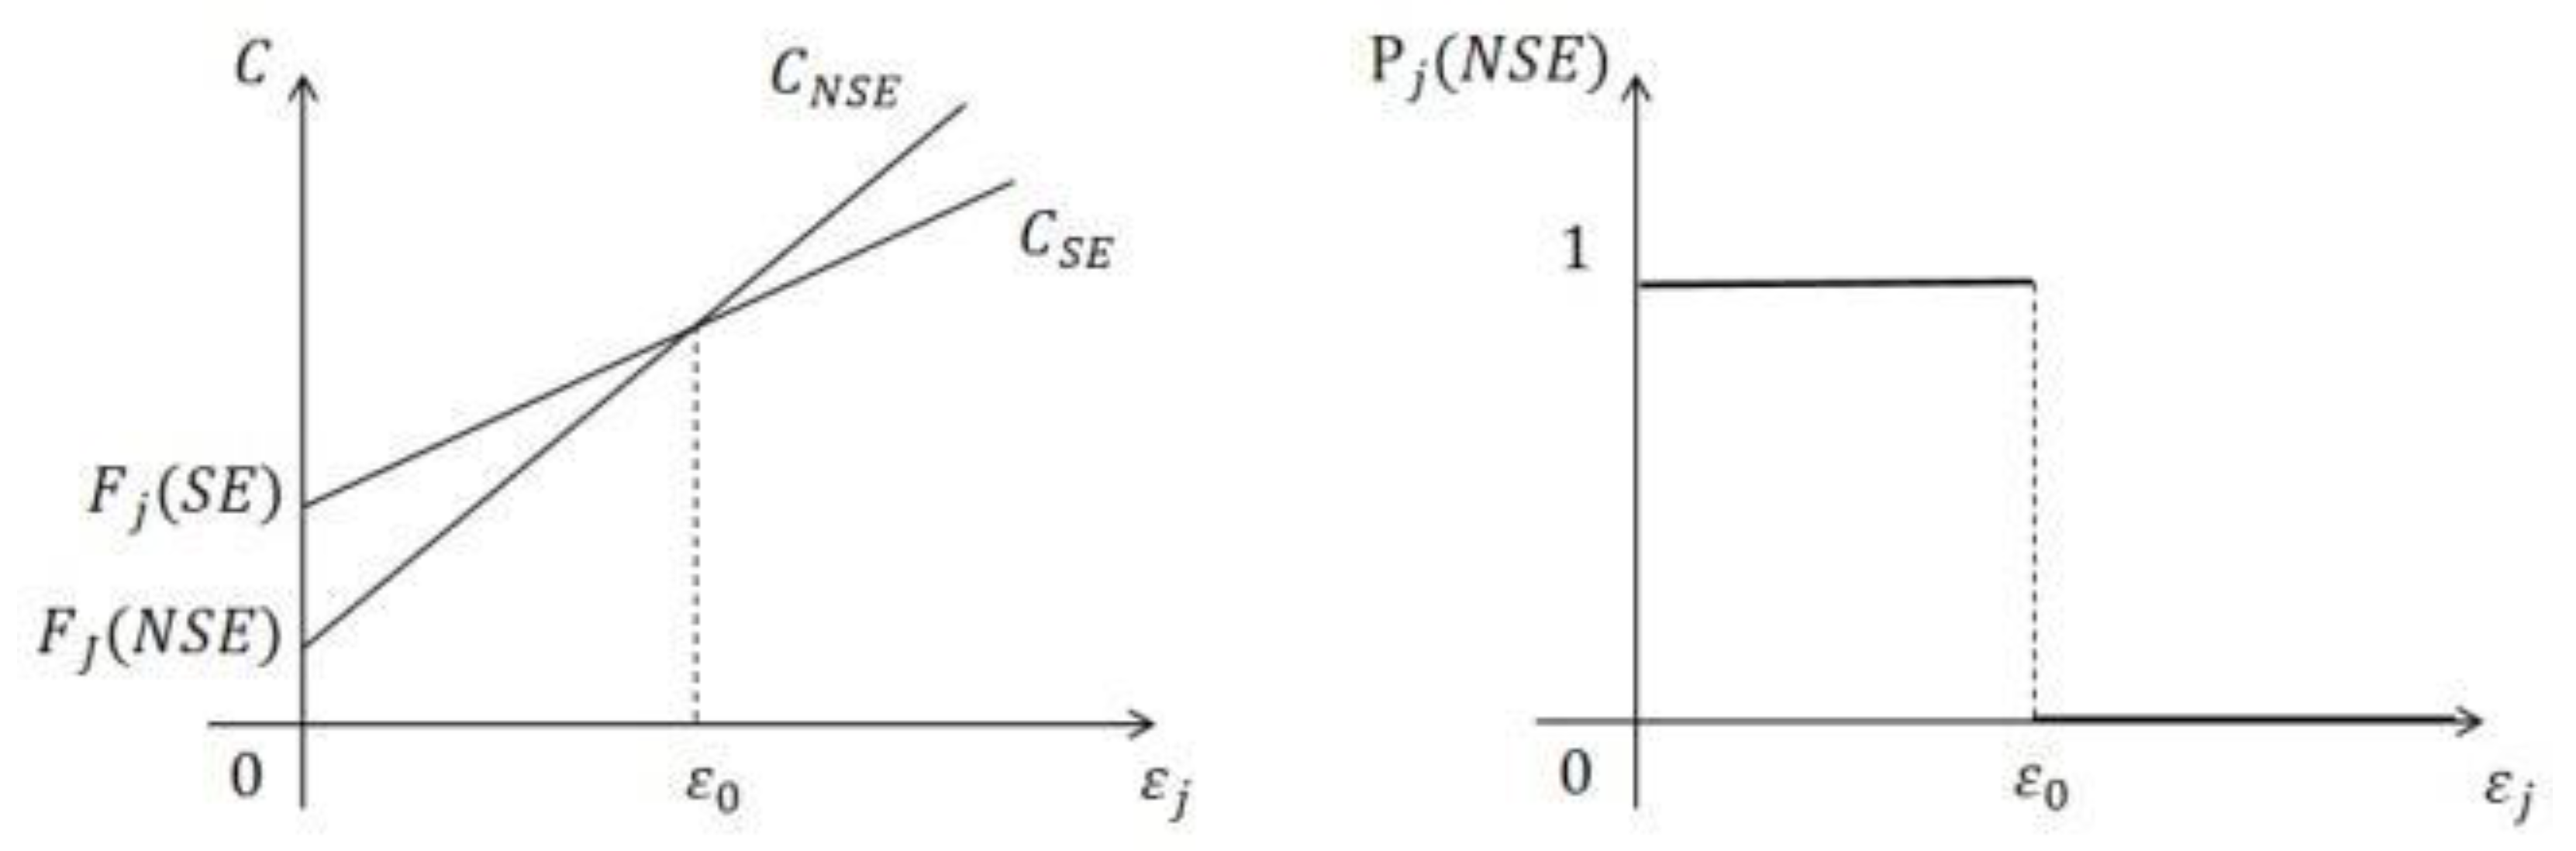
From 0 to , it is shown that when the cost of drafting a labor contract is higher than the advantages it brings in dealing with uncertainties. In this scenario, non-standard employment has a cost advantage relative to standard employment. When , offering a labor contract reduces the cost of uncertainties to a greater extent than it of drafting the contract, giving standard employment a cost advantage relative to non-standard employment. Figure A1 illustrate the logic of trading-off between standard and non-standard employment.
From 0 to shows when the cost of drafting a standard labor contract is higher than the advantages it brings in. In this scenario, non-standard employment has a cost advantage relative to standard employment, =1. When , offering a standard labor contract reduces the cost of uncertainties to a greater extent than it of drafting the contract, giving standard employment a cost advantage relative to non-standard employment, =0. Figure A1 illustrate the logic of trading-off between standard and non-standard employment.
Assuming occupation has two different tasks, and . These two tasks have different fixed costs and moral hazard costs, therefore . Denoting as the sum of uncertainties of the occupation , . Whether offering a standard labor contract or not is depended on the gap between total fixed costs and moral hazard costs.Therefore:
Figure A2.
The odds-ratio of non-standard employment of an occupation.
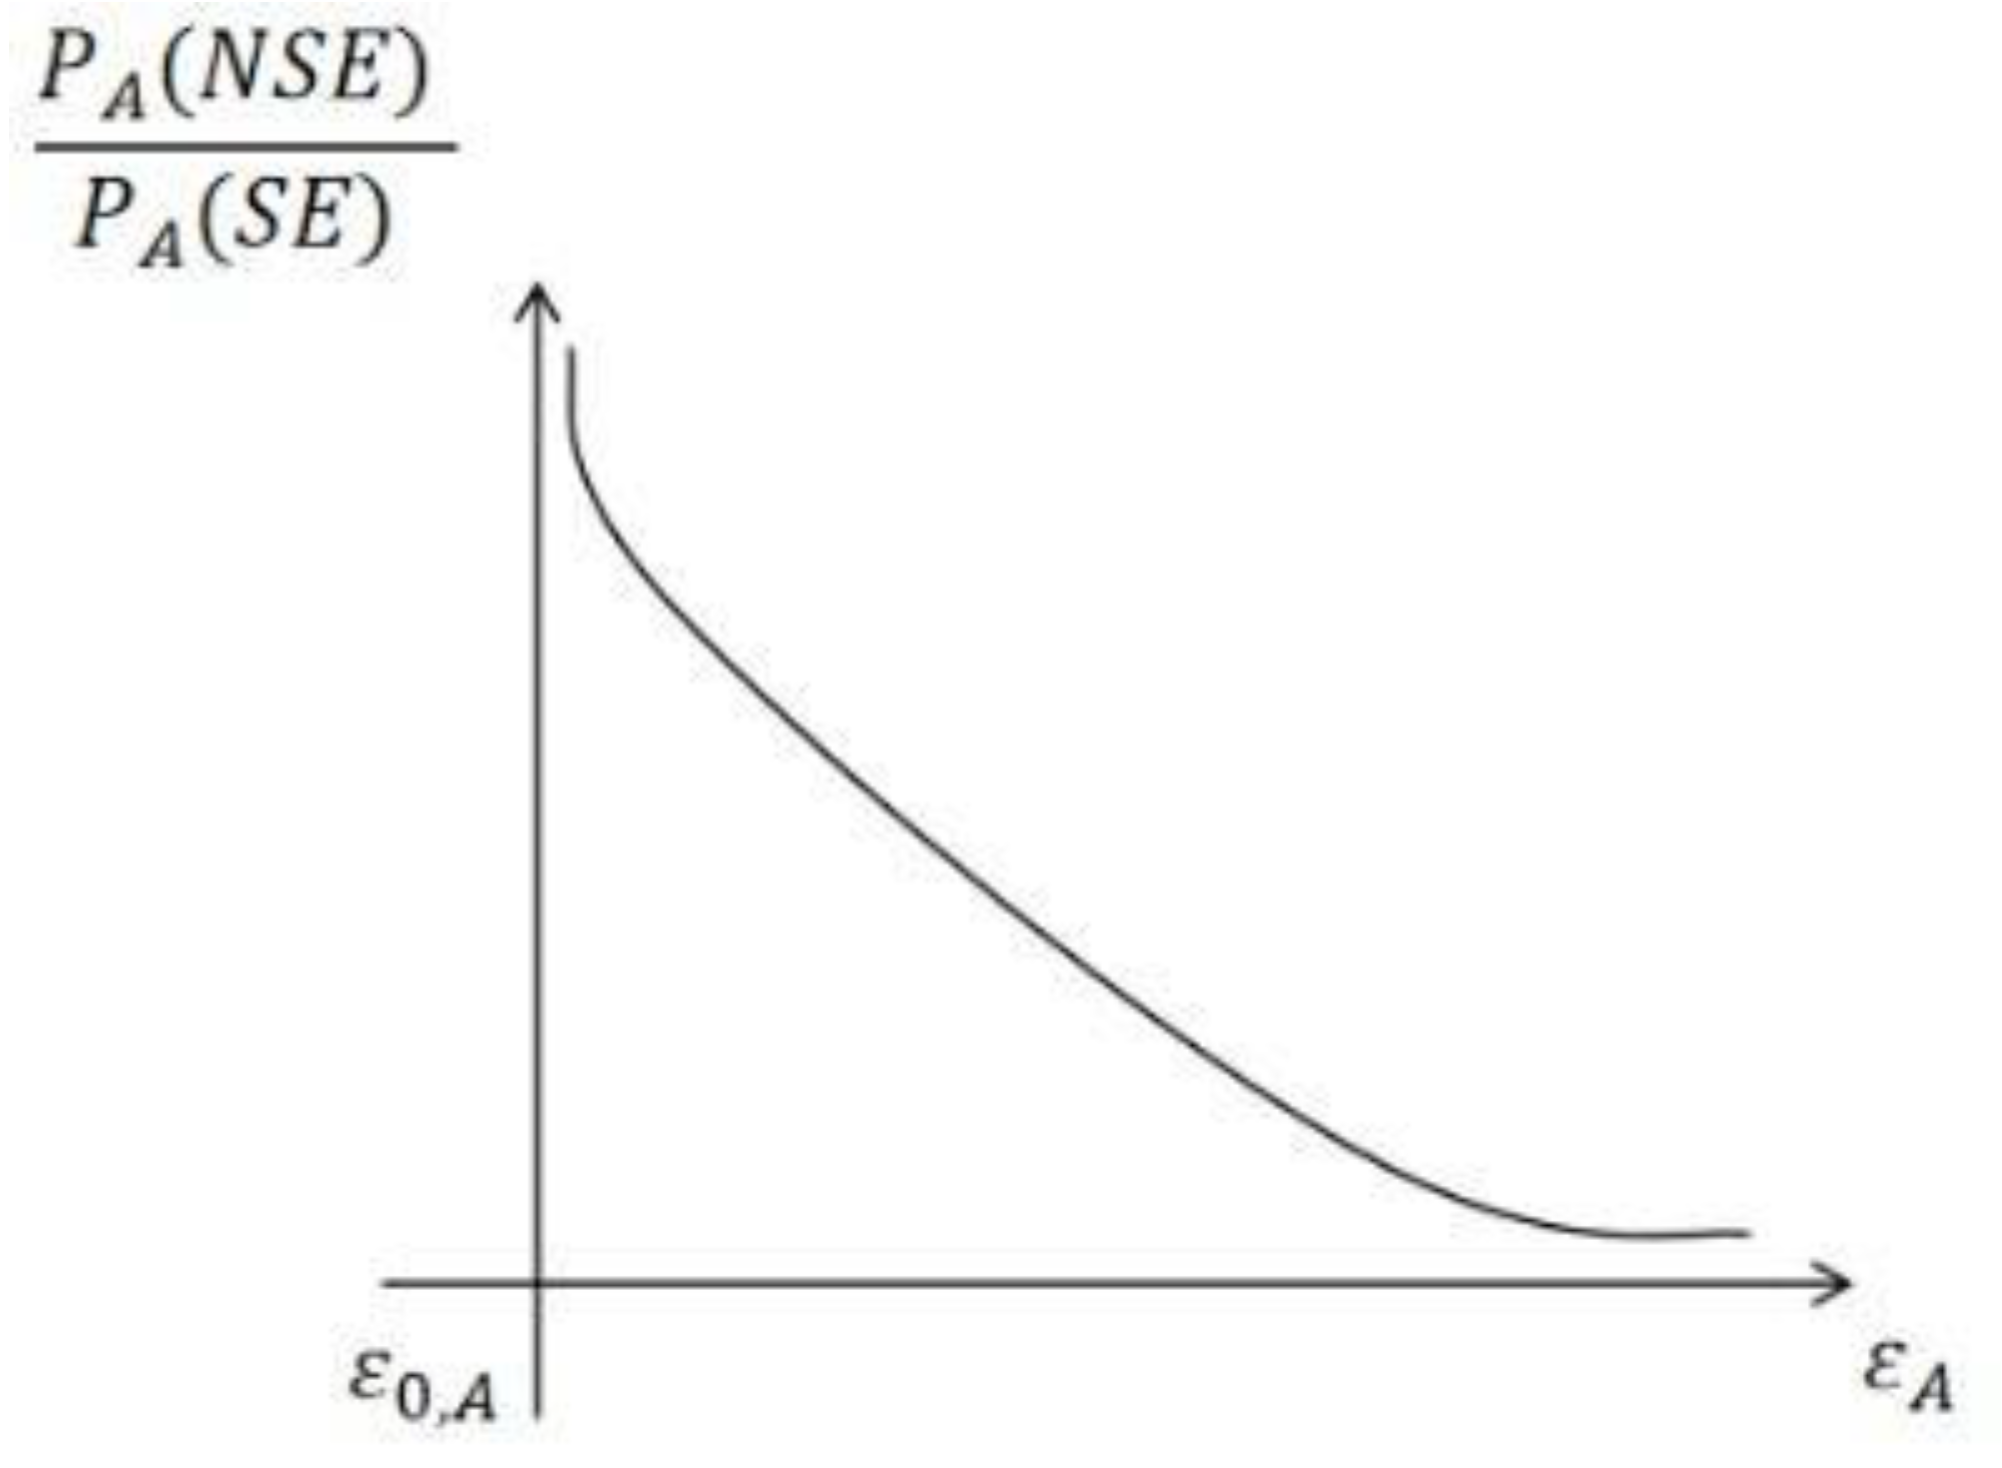
The relationship of the odds-ratio of non-standard employment (the probability of non-standard employment over standard employment) of the occupation , , and uncertainties of the occupation was shown as Figure A2. Employers consider the sum of uncertainties of each task in the occupation , weight the cost and benefit of each type of employment. As the uncertainties rising, the costs of moral hazard increases, heightening the need for standard employment to reduce these costs, thereby reducing the odds-ratio of non-standard employment. If all the uncertainties converge to , there are almost no uncertainties the odds-ratio of non-standard employment would be extremely high.
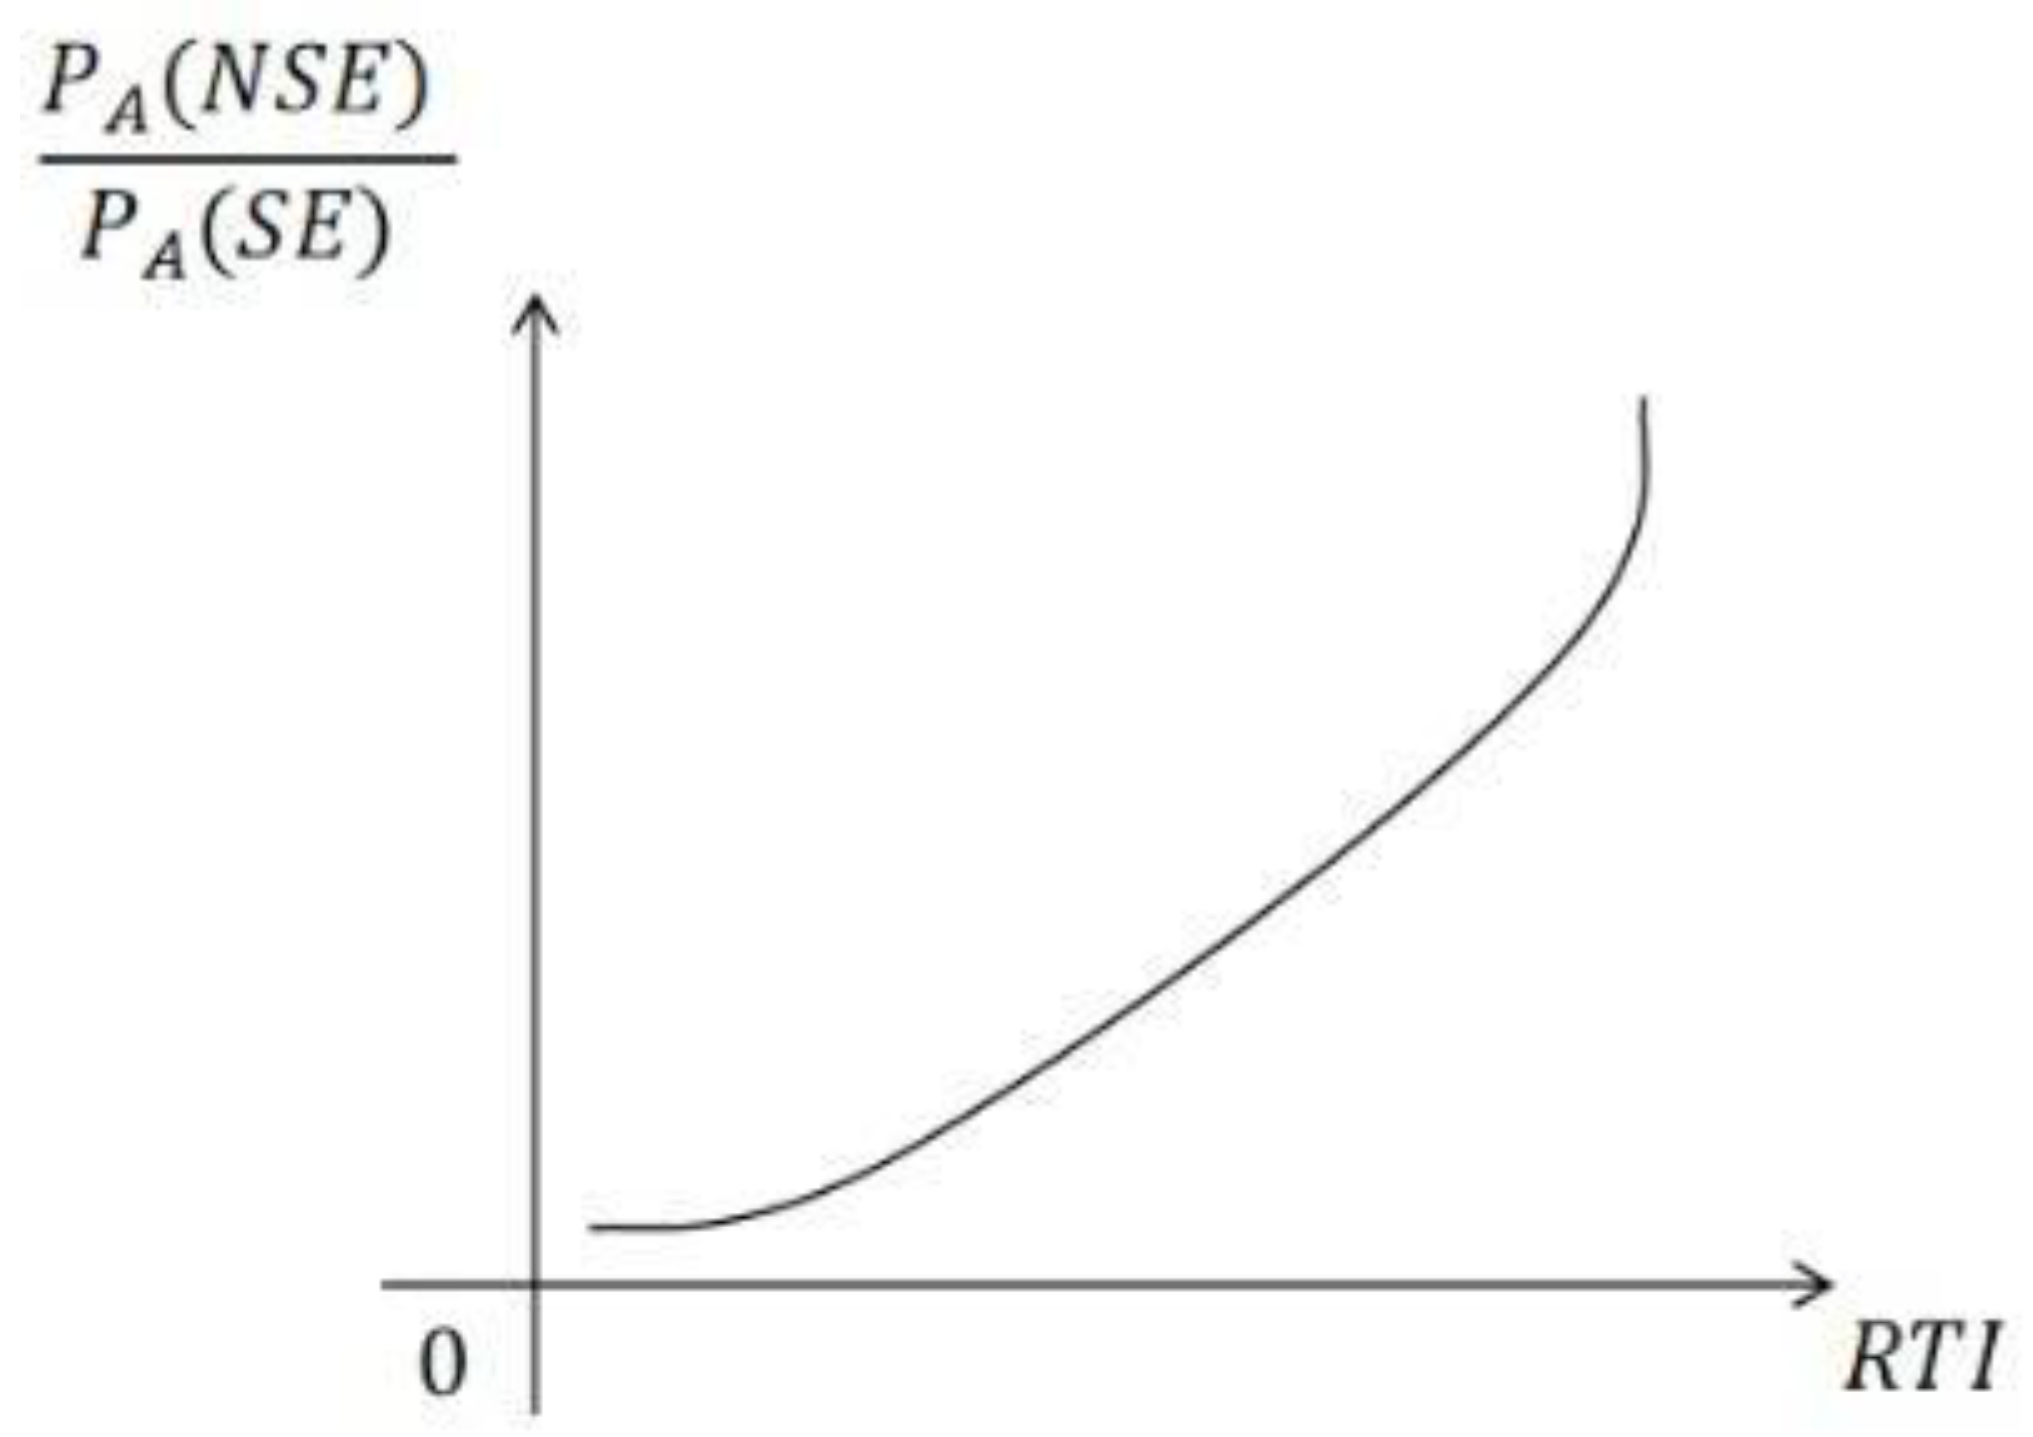
As assumed in the main study, the concept of routine task indicating that routine task has no uncertainties, the RTI could measure the uncertainties in the work (inverse). Therefore, Hypothesis 1 was raised:
Hypothesis 1: An increase in the RTI would raises the ratio of non-standard employment.
As shown in Figure A3:
Figure A3.
The odds-ratio of non-standard employment of an occupation and RTI.
The institutional context significantly influences how employers hire, which may affect non-employment ratio through changing fixed labor contract costs, leading to a intercept effect. As shown in Figure A4:
Figure A4.
Changing fixed costs of standard employment.
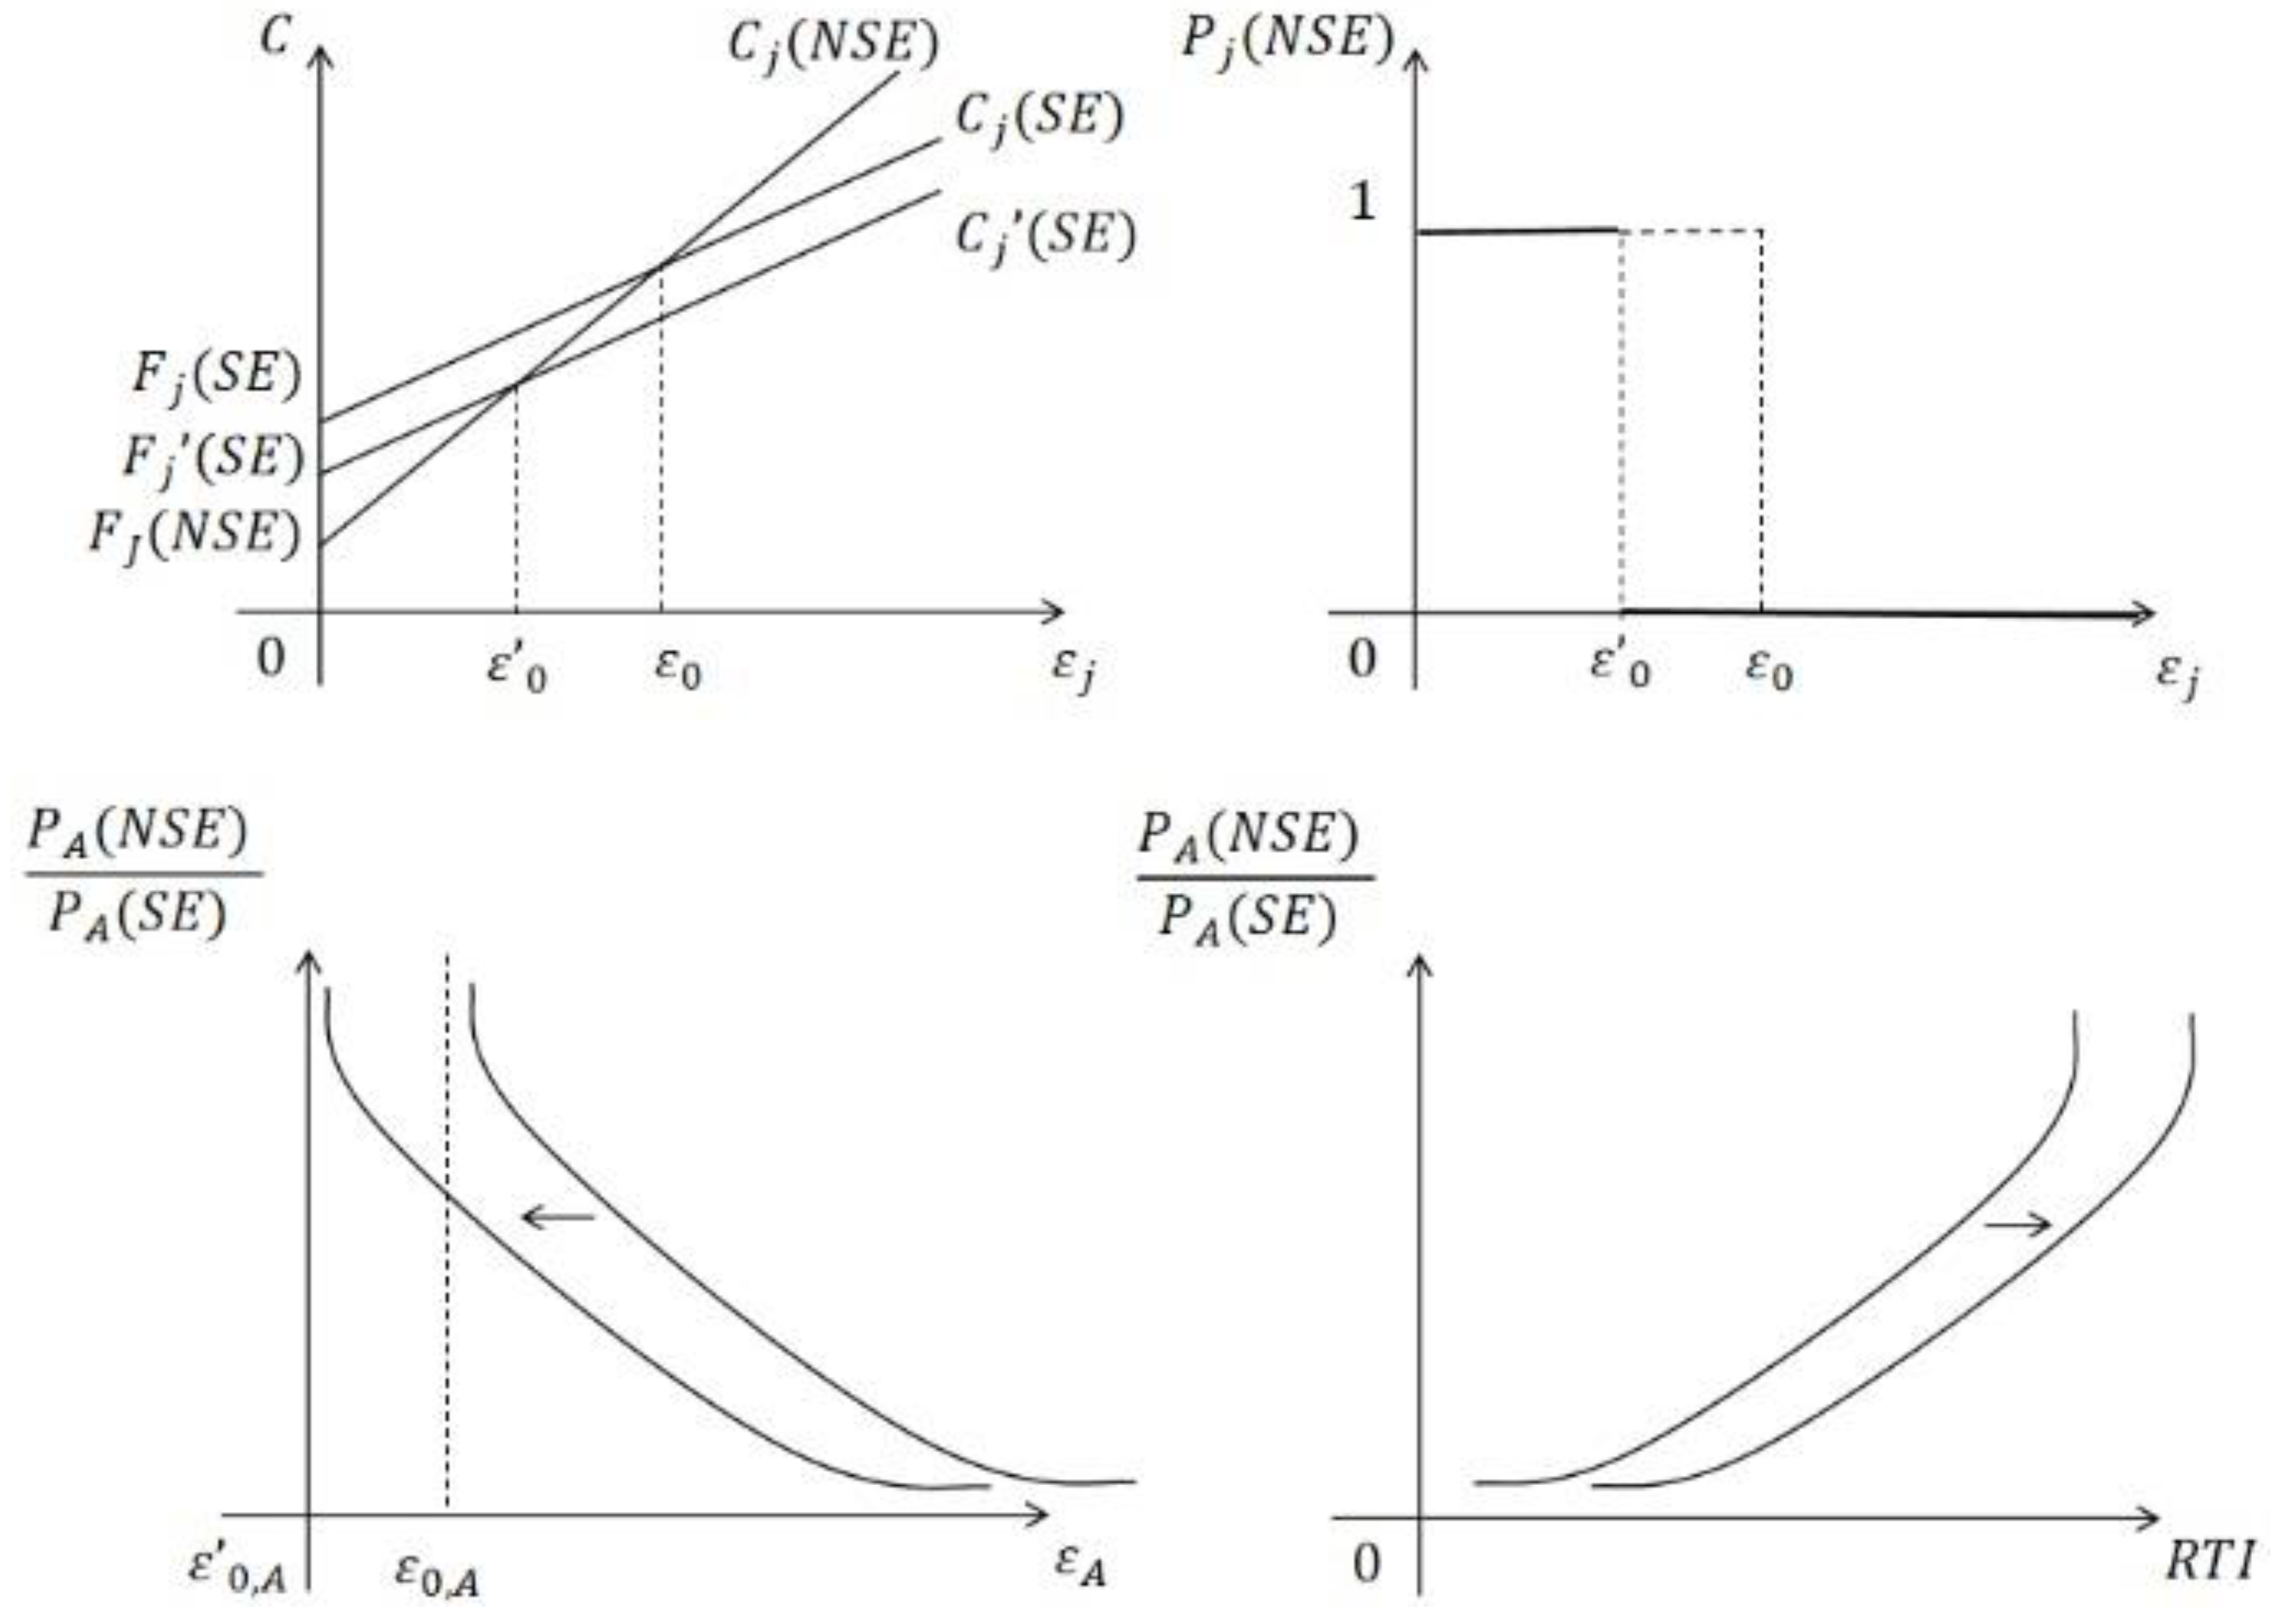
In Figure A4 it denoted as and . Then the cost curve moves to , leads to move to . It brings more cost advantages of standard employment, then the odds-ratio of non-standard employment is decreased. Therefore, Hypothesis 2 was proposed.
Hypothesis 2: The non-standard employment ratio is different in various social contexts.
Similarly, different institutional contexts may affect the and through various task discretion (Minardi et al., 2023), attitude towards new technologies (Holman and Rafferty, 2018) or labor law execution (Barbieri and Scherer, 2009). The impact of RTI on odds-ratio of non-standard employment may heterogeneously between different contexts, leading to a slop effect. As shown in Figure A5:
Figure A5.
Changing cost saving of standard employment.
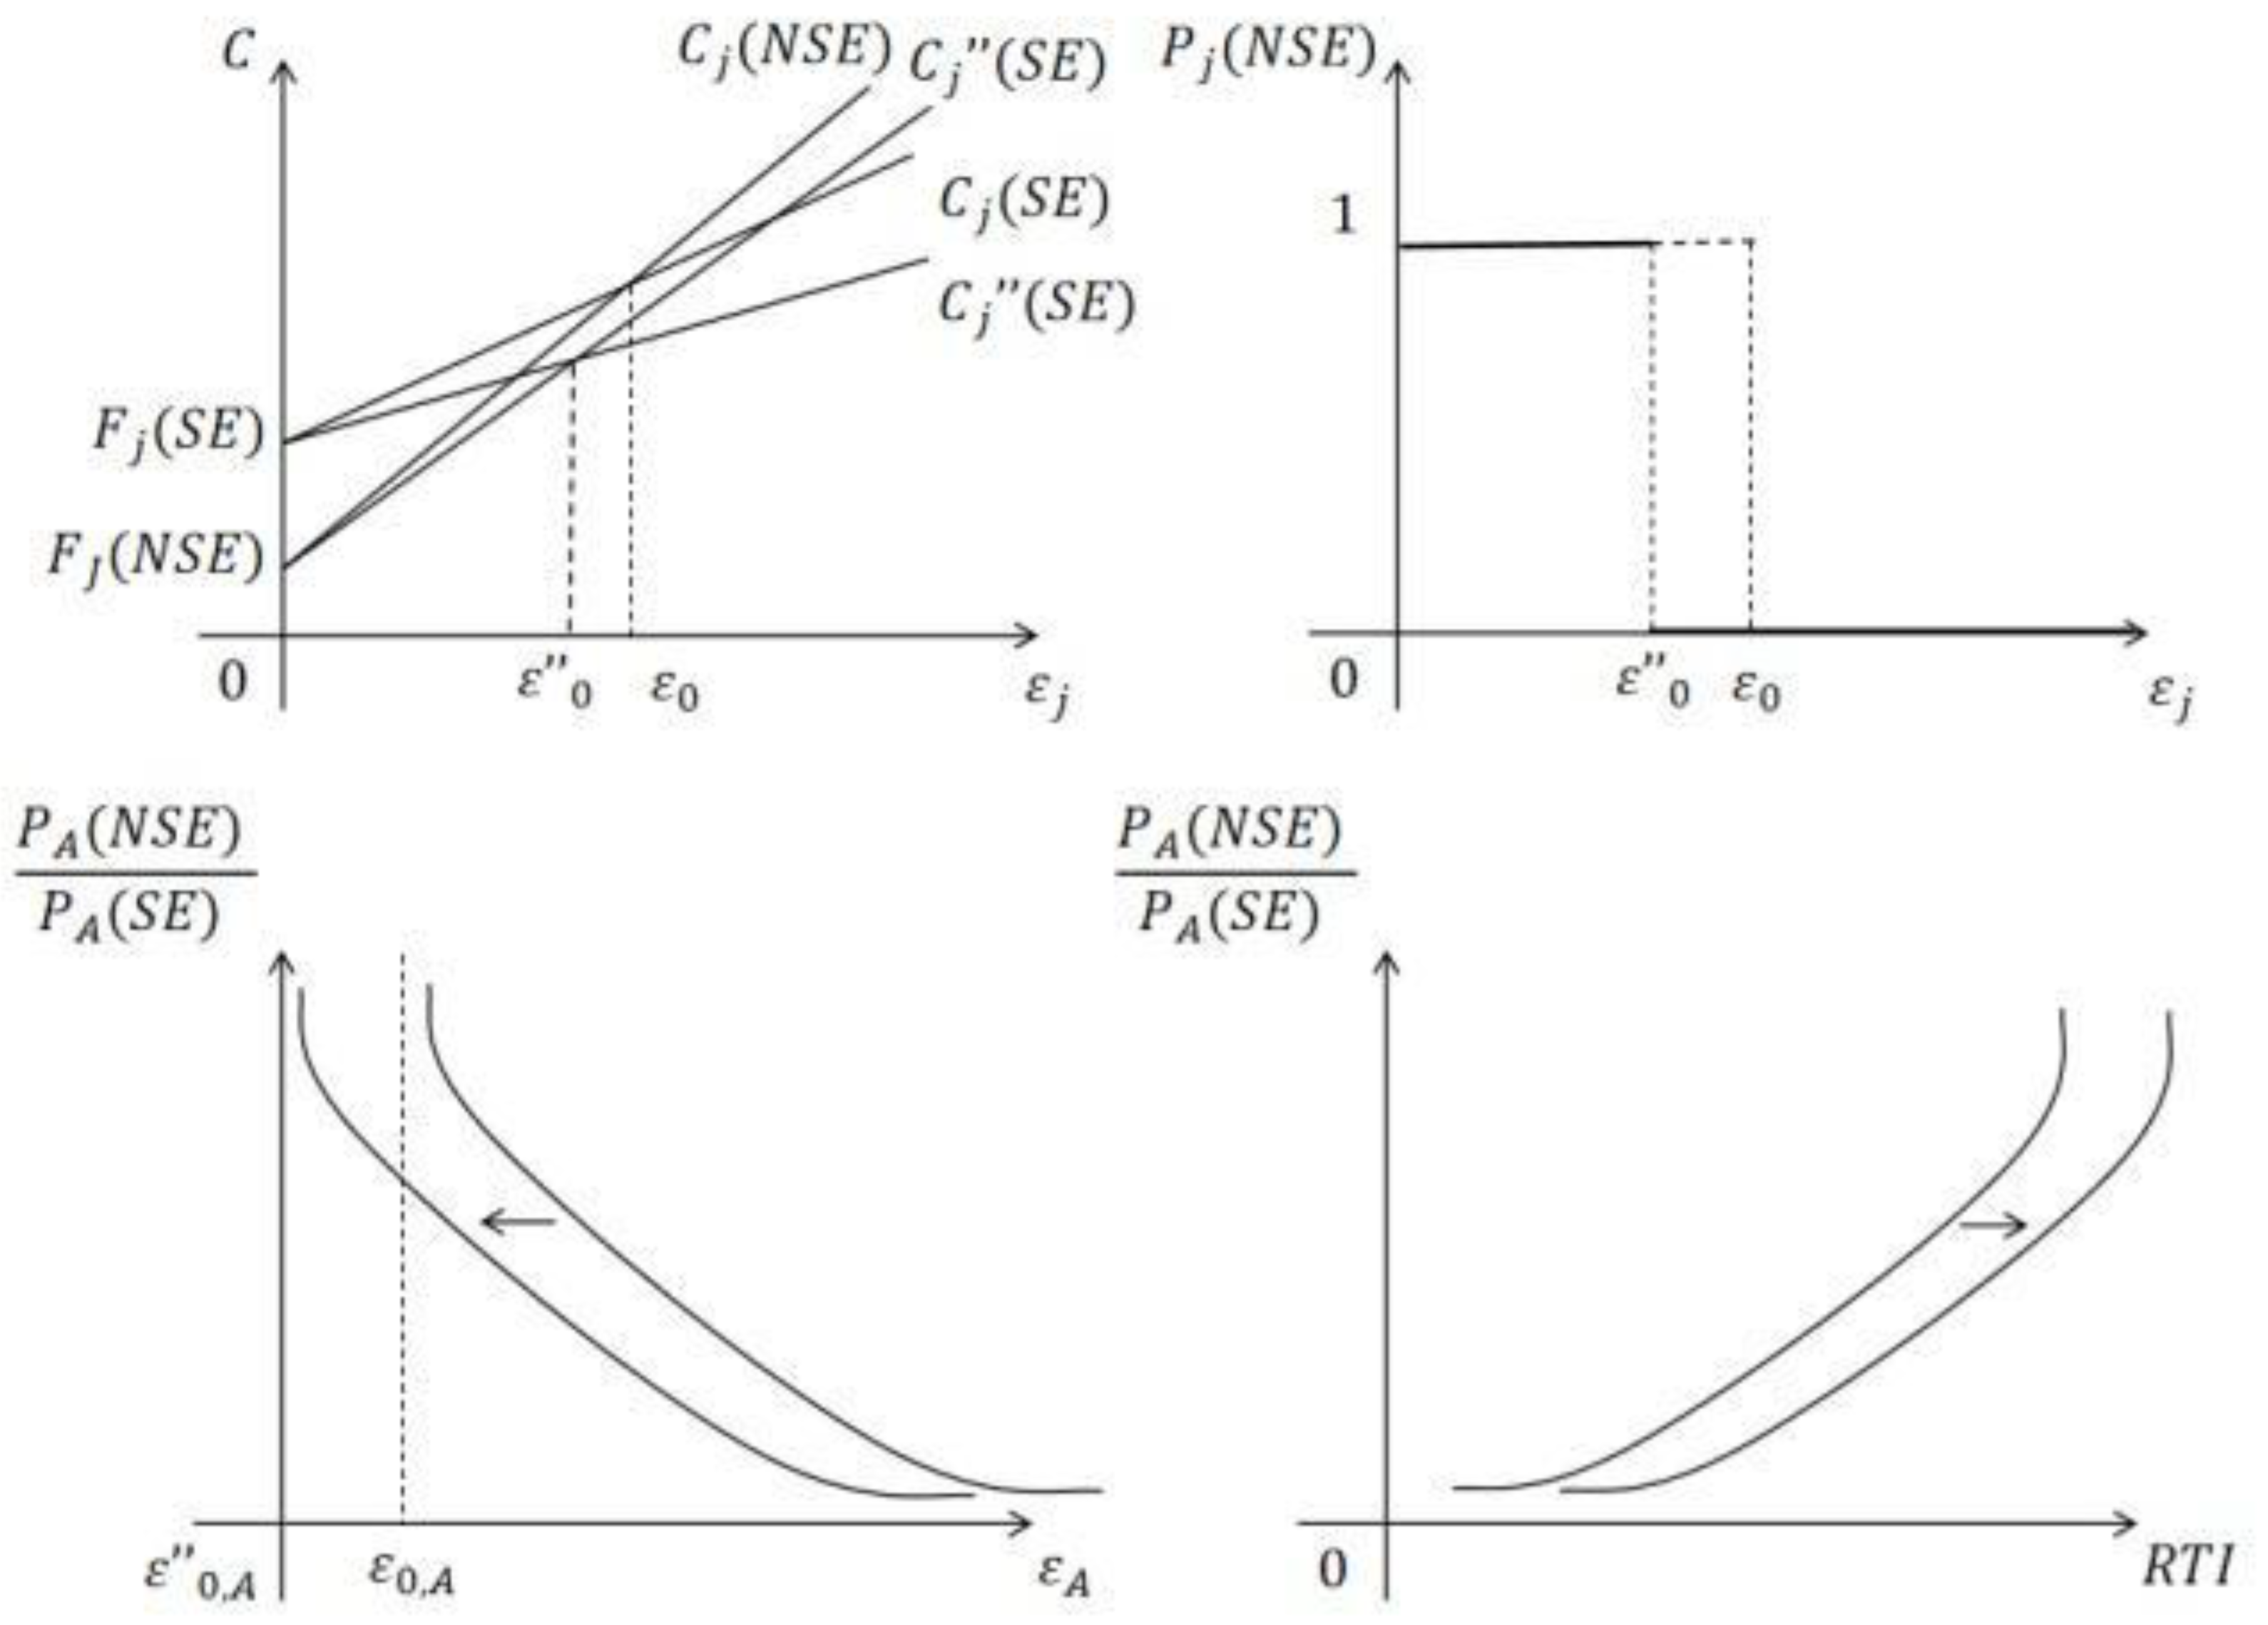
In some countries, the cost saving of standard employment may lower than other countries. In Figure A5 it denoted as and , and . The different between and determines the moving direction of compare to , then changes the odds-ratio of non-standard employment. Therefore, Hypothesis 3 was proposed.
Hypothesis 3: the social contexts have a heterogeneous effect of the impact of RTI on the ratio of non-standard employment.
References
- Acemoglu D and D H Autor. (2011). Skills, Tasks and Technologies: Implications for Employment and Earnings. Handbook of Labor Economics (1043-1171). Elsevier Science Ltd.
- Acemoglu D and P Restrepo. The Race Between Man and Machine: Implications of Technology for Growth, Factor Shares, and Employment. American Economic Review 2018, 6, 1488–1542. [Google Scholar] [CrossRef]
- Acemoglu D and P Restrepo. Tasks, Automation, and the Rise in U.S. Wage Inequality. Econometrica 2022, 90, 1973–2016. [Google Scholar] [CrossRef]
- Akcomak S, S Kok and H Rojas-Romagosa. Technology Offshoring and the Task Content of Occupations in the United Kingdom. International Labour Review 2015, 155, 201–230. [Google Scholar] [CrossRef]
- Anderson, B. Migration, Immigration Controls and the Fashioning of Precarious Workers. Work Employment and Society 2010, 24, 300–317. [Google Scholar] [CrossRef]
- Autor D H and D Dorn. The Growth of Low-Skill Service Jobs and the Polarization of the Us Labor Market. American Economic Review 2013, 5, 1553–1597. [Google Scholar] [CrossRef]
- Autor D H, F Levy and R J Murnane. The Skill Content of Recent Technological Change: An Empirical Exploration. Quarterly Journal of Economics 2003, 118, 1279–1333. [Google Scholar] [CrossRef]
- Autor D H, L F Katz and M S Kearney. The Polarization of the U.S. Labor Market. American Economic Review 2006, 2, 189–194. [Google Scholar] [CrossRef]
- Autor, D. The Polarization of Job Opportunities in the U.S. Labor Market: Implications for Employment and Earnings. Center for American Progress and the Hamilton Project 2010, 6, 11–19. [Google Scholar]
- Bárány Z L and C Siegel. Job Polarization and Structural Change. American Economic Journal. Macroeconomics 2018, 10, 57–89. [Google Scholar] [CrossRef]
- Barbieri P and S Scherer. Labour Market Flexibilization and its Consequences in Italy. European Sociological Review 2009, 25, 677–692. [Google Scholar] [CrossRef]
- Barley S R, B A Bechky and F J Milliken. The Changing Nature of Work: Careers, Identities, and Work Lives in the 21St Century. Academy of Management Discoveries 2017, 2, 111–115. [Google Scholar] [CrossRef]
- Biemann T, H Zacher and D C Feldman. Career Patterns: A Twenty-Year Panel Study. Journal of Vocational Behavior 2012, 81, 159–170. [Google Scholar] [CrossRef]
- Blair, H. 'You're Only as Good as Your Last Job': The Labour Process and Labour Market in the British Film Industry. Work Employment and Society 2001, 15, 149–169. [Google Scholar] [CrossRef]
- Booth A L and J C van Ours. Part-Time Jobs: What Women Want? Journal of Population Economics 2013, 26, 263–283. [Google Scholar] [CrossRef]
- Busilacchi G, G Gallo and M Luppi. I would Like to but I Cannot: What Influences the Involuntariness of Part-Time Employment in Italy. Social Indicators Research 2024, 1–35. [CrossRef]
- Cahuc P, S Carcillo and A Zylberberg. (2014). Labor Economics The MIT Press.
- Caro D H, K S Cortina and J S Eccles. Socioeconomic Background, Education, and Labor Force Outcomes: Evidence From a Regional U.S. Sample. British Journal of Sociology of Education 2015, 36, 934–957. [Google Scholar] [CrossRef]
- Casey C and P Alach. 'Just a Temp?' - Women, Temporary Employment and Lifestyle. Work Employment and Society 2004, 18, 459–480. [Google Scholar] [CrossRef]
- Connelly C E and D G Gallagher. Emerging Trends in Contingent Work Research. Journal of Management 2004, 30, 959–983. [Google Scholar] [CrossRef]
- Cortes G, M. Where Have the Middle-Wage Workers Gone? A Study of Polarization Using Panel Data. Journal of Labor Economics 2016, 34, 63–105. [Google Scholar] [CrossRef]
- Ebenstein A, A Harrison, M McMillan and S Phillips. Estimating the Impact of Trade and Offshoring on American Workers Using the Current Population Surveys. Review of Economics and Statistics 2014, 96, 581–595. [Google Scholar] [CrossRef]
- Eloundou T, S Manning, P Mishkin and D Rock. (2023). GPTs are GPTs: An Early Look at the Labor Market Impact Potential of Large Language Models. Arxiv, arXiv:2303.10130.
- Esposito P and S Scicchitano. Educational Mismatch and Labour Market Transitions in Italy: Is there an Unemployment Trap? Structural Change and Economic Dynamics 2022, 61, 138–155. [Google Scholar] [CrossRef]
- Esposito P and S Scicchitano. Drivers of Skill Mismatch Among Italian Graduates: The Role of Personality Traits. Applied Economics 2023, 55, 4642–4663. [Google Scholar] [CrossRef]
- Fantom N J and U Serajuddin. (2016). The World Bank's Classification of Countries by Income. World Bank Policy Research Working Paper Series.
- Fernández-Macías E and J Hurley. Routine-Biased Technical Change and Job Polarization in Europe. Socio-Economic Review 2017, 3, 563–585. [Google Scholar] [CrossRef]
- Fonseca T, F Lima and S C Pereira. Job Polarization, Technological Change and Routinization: Evidence for Portugal. Labour Economics 2018, 51, 317–339. [Google Scholar] [CrossRef]
- Frey C B and M A Osborne. The Future of Employment: How Susceptible are Jobs to Computerisation? Technological Forecasting and Social Change 2017, 114, 254–280. [Google Scholar] [CrossRef]
- George E and P Chattopadhyay. (2015) Non-Standard Work and Workers: Organizational Implications. ILO Geneva, Switzerland.
- Goos M and A Manning. Lousy and Lovely Jobs:the Rising Polarization of Work in Britain. Review of Economics and Statistics 2007, 89, 118–133. [Google Scholar] [CrossRef]
- Goos M, A Manning and A Salomons. Explaining Job Polarization: Routine-Biased Technological Change and Offshoring. American Economic Review 2014, 104, 2509–2526. [Google Scholar] [CrossRef]
- Hämäläinen R, K Nissinen, J Mannonen, J Lämsä, K Leino and M Taajamo. Understanding Teaching Professionals' Digital Competence: What Do PIAAC and TALIS Reveal About Technology-Related Skills, Attitudes, and Knowledge? Computers in Human Behavior 2021, 117, 106672. [Google Scholar] [CrossRef]
- Hardy W, R Keister and P Lewandowski. Educational Upgrading, Structural Change and the Task Composition of Jobs in Europe. Economics of Transition 2018, 26, 201–231. [Google Scholar] [CrossRef]
- Harvey G, C Rhodes, S J Vachhani and K Williams. Neo-Villeiny and the Service Sector: The Case of Hyper Flexible and Precarious Work in Fitness Centres. Work, Employment and Society 2017, 31, 19–35. [Google Scholar] [CrossRef]
- Holman D and A Rafferty. The Convergence and Divergence of Job Discretion Between Occupations and Institutional Regimes in Europe From 1995 to 2010. Journal of Management Studies 2018, 55, 619–647. [Google Scholar] [CrossRef]
- Horemans, J. Polarisation of Non-Standard Employment in Europe: Exploring a Missing Piece of the Inequality Puzzle. Social Indicators Research 2016, 125, 171–189. [Google Scholar] [CrossRef]
- Kalleberg A, L. Nonstandard Employment Relations: Part-Time, Temporary and Contract Work. Review of Sociology 2000, 26, 341–365. [Google Scholar] [CrossRef]
- Kalleberg A, L. Flexible Firms and Labor Market Segmentation: Effects of Workplace Restructuring on Jobs and Workers. Work and Occupations 2003, 30, 154–175. [Google Scholar] [CrossRef]
- Kalleberg A L and P V Marsden. Externalizing Organizational Activities: Where and How U.S. Establishments Use Employment Intermediaries. Socio-Economic Review 2005, 3, 389–416. [Google Scholar] [CrossRef]
- Kollmeyer, C. Trade Union Decline, Deindustrialization, and Rising Income Inequality in the United States 2018, 1947 to 2015. Research in Social Stratification and Mobility 2018, 57, 1–10. [Google Scholar] [CrossRef]
- Korinek, A. (2023). Language Models and Cognitive Automation for Economic Research: National Bureau of Economic Research No. w30957.
- Lazear E, P. (1995). Personnel Economics. MIT press.
- Lee, C. International Migration, Deindustrialization and Union Decline in 16 Affluent OECD Countries, 1962-1997. Social Forces, 2005, 84, 71–88. [Google Scholar] [CrossRef]
- Loughlin C and J Barling. Young Workers' Work Values, Attitudes, and Behaviours. Journal of Occupational and Organizational Psychology 2001, 74, 543–558. [Google Scholar] [CrossRef]
- Macdonald R and A Giazitzoglu. Youth, Enterprise and Precarity: Or, What is, and What is Wrong with, the ‘Gig Economy’? Journal of Sociology 2019, 55, 724–740. [Google Scholar] [CrossRef]
- Marcolin L, S Miroudot and M Squicciarini. To be (Routine) Or Not to be (Routine), that is the Question: A Cross-Country Task-Based Answer. Industrial and Corporate Change 2019, 28, 477–501. [Google Scholar] [CrossRef]
- Minardi S, C Hornberg, P Barbieri and H Solga. (2023). The Link Between Computer Use and Job Satisfaction: The Mediating Role of Job Tasks and Task Discretion. British Journal of Industrial Relations 2023. [CrossRef]
- Olsen K M and A L Kalleberg. Non-Standard Work in Two Different Employment Regimes: Norway and the United States. Work Employment and Society 2004, 18, 321–348. [Google Scholar] [CrossRef]
- Oster, E. Unobservable Selection and Coefficient Stability: Theory and Evidence. Journal of Business & Economic Statistics 2019, 37, 187–204. [Google Scholar] [CrossRef]
- Pfeffer J and J N Baron. Taking the Workers Back Out: Recent Trends in the Structuring of Employment. Research in Organizational Behavior 1988, 10, 257–303. [Google Scholar]
- Reijnders L S and G J de Vries. Technology, Offshoring and the Rise of Non-Routine Jobs. Journal of Development Economics 2018, 135, 412–432. [Google Scholar] [CrossRef]
- Rica S D L, L Gortazar and P Lewandowski. Job Tasks and Wages in Developed Countries: Evidence From PIAAC. Labour Economics 2020, 65, 101845. [Google Scholar] [CrossRef]
- Taplin I, M. Flexible Production, Rigid Jobs: Lessons From the Clothing Industry. Work and Occupations 1995, 22, 412–438. [Google Scholar] [CrossRef]
- Tilly, C. Reasons for the Continuing Growth of Part-Time Employment. Monthly Lab. Rev. 1991, 114, 10. [Google Scholar]
- Uzzi B and Z I Barsness. Contingent Employment in British Establishments: Organizational Determinants of the Use of Fixed-Term Hires and Part-Time Workers. Social Forces 1998, 76, 967–1005. [Google Scholar] [CrossRef]
- Van Nieuwenhove L and B De Wever. Why are Low-Educated Adults Underrepresented in Adult Education? Studying the Role of Educational Background in Expressing Learning Needs and Barriers. Studies in Continuing Education 2022, 44, 189–206. [Google Scholar] [CrossRef]
- Wong C and M A Campion. Development and Test of a Task Level Model of Motivational Job Design. Journal of Applied Psychology 1991, 76, 825–837. [Google Scholar] [CrossRef]

Table 1.
Components of RTI .
| Components of routine tasks | Describe | N | mean | std. | min | max |
| Teaching People (inverse) | How often Does your Job usually involve instructing, training or teaching people, individually or in groups? | 73,993 | 3.437 | 1.529 | 1 | 5 |
| Presentations (inverse) | How often Does your Job usually involve making speeches or giving presentations in front of five or more people? | 73,993 | 4.163 | 1.244 | 1 | 5 |
| Advising People (inverse) | How often Does your Job usually involve advising people? | 73,993 | 2.561 | 1.589 | 1 | 5 |
| Planning Own Activities (inverse) | How often Does your Job usually involve planning your own activities? | 73,993 | 2.109 | 1.563 | 1 | 5 |
| Organizing Own Time (inverse) | How often Does your Job usually involve organizing your own time? | 73,993 | 1.976 | 1.548 | 1 | 5 |
| Sequence Tasks (inverse) | To what extent can you choose or change the sequence of your tasks? | 73,993 | 2.701 | 1.285 | 1 | 5 |
| Flexibility (inverse) | To what extent can you choose or change how you do your work? | 73,993 | 2.663 | 1.255 | 1 | 5 |
Table 2.
Descriptive statisticsa.
| VARIABLES | N | Mean | Std. | Min | Max |
| non-standard employment | 73,993 | 0.102 | 0.302 | 0 | 1 |
| RTI | 73,993 | 2.849 | 1.039 | 1 | 5 |
| male | 73,993 | 0.513 | 0.500 | 0 | 1 |
| living_with_partner | 73,993 | 0.756 | 0.429 | 0 | 1 |
| child | 73,993 | 0.669 | 0.471 | 0 | 1 |
| less_than_high_school | 73,993 | 0.109 | 0.311 | 0 | 1 |
| above_high_school | 73,993 | 0.489 | 0.500 | 0 | 1 |
| high_school | 73,993 | 0.402 | 0.490 | 0 | 1 |
| working_hours_40less | 73,993 | 0.373 | 0.484 | 0 | 1 |
| working_hours_40_50 | 73,993 | 0.498 | 0.500 | 0 | 1 |
| working_hours_50_60 | 73,993 | 0.085 | 0.279 | 0 | 1 |
| working_hours_60more | 73,993 | 0.043 | 0.204 | 0 | 1 |
| age_25less | 73,993 | 0.095 | 0.293 | 0 | 1 |
| age_25_54 | 73,993 | 0.749 | 0.434 | 0 | 1 |
| age_55_65 | 73,993 | 0.156 | 0.363 | 0 | 1 |
| income_less10 | 73,993 | 0.093 | 0.291 | 0 | 1 |
| income_10_25 | 73,993 | 0.150 | 0.357 | 0 | 1 |
| income_25_50 | 73,993 | 0.304 | 0.460 | 0 | 1 |
| income_50_75 | 73,993 | 0.217 | 0.412 | 0 | 1 |
| income_75_90 | 73,993 | 0.133 | 0.340 | 0 | 1 |
| income_90more | 73,993 | 0.103 | 0.304 | 0 | 1 |
| father_edu | 73,993 | 1.718 | 0.746 | 1 | 3 |
| mother_edu | 73,993 | 1.619 | 0.725 | 1 | 3 |
| numeracy | 73,993 | 1.577 | 1.217 | 0 | 6.050 |
| reading | 73,993 | 1.914 | 1.054 | 0 | 7.021 |
| migrant | 73,993 | 0.099 | 0.299 | 0 | 1 |
| native_speaker | 73,993 | 0.918 | 0.275 | 0 | 1 |
| overskilled | 73,993 | 0.838 | 0.369 | 0 | 1 |
| underskilled | 73,993 | 0.339 | 0.473 | 0 | 1 |
| overeducated | 73,993 | 0.197 | 0.397 | 0 | 1 |
| undereducated | 73,993 | 0.106 | 0.307 | 0 | 1 |
| shareinfo | 73,993 | 4.312 | 1.164 | 1 | 5 |
| problemsolv | 73,993 | 3.867 | 1.308 | 1 | 5 |
| complex | 73,993 | 2.796 | 1.305 | 1 | 5 |
| physical | 73,993 | 3.038 | 1.811 | 1 | 5 |
| finger | 73,993 | 3.780 | 1.709 | 1 | 5 |
| cooperate | 73,993 | 3.454 | 1.417 | 1 | 5 |
| a:the definition of all variables are shown in Table B1. b: Marital status may affect employment status. The datasets have no marital status, “living with partner” was applied as a proxy. | |||||
Table 3.
Country groupsa.
| Group | Countries | Group | Countries |
| Anglo Saxon | New Zealand | Nodic | Denmark |
| United Kingdom | Norway | ||
| United States | Sweden | ||
| Middle East EU | Czech Republic | South West EU | Austria |
| Estonia | Belgium | ||
| Hungary | Germany | ||
| Lithuania | France | ||
| Poland | Greece | ||
| Slovak Republic | Ireland | ||
| Slovenia | Italy | ||
| East Asia | Japan | Netherlands | |
| Korea Republic | Spain | ||
| a: Detail statistics of non-standard employment and RTI of each groups are shown in Table B4. | |||
Table 4.
Regression results (Eq.1).
| VARIABLES | (1) | (2) | (3) | (4) | (5) |
| z_RTI | 1.264*** | 1.144*** | 1.124*** | 1.133*** | 1.124*** |
| (0.015) | (0.019) | (0.020) | (0.024) | (0.025) | |
| Constant | 0.111*** | 0.049*** | 0.037*** | 1,598.894*** | 821.78*** |
| (0.001) | (0.005) | (0.004) | (567.486) | (316.595) | |
| Individual Controls | √ | √ | √ | √ | |
| Organizational Controls | √ | √ | √ | ||
| Country Controls | √ | √ | |||
| Industry Fixed Effect | √ | ||||
| Observations | 73,993 | 73,993 | 73,993 | 73,993 | 73,993 |
| Pseudo R2 | 0.008 | 0.064 | 0.085 | 0.398 | 0.408 |
| LL | -24112.1 | -22735.72 | -22239.47 | -14634.66 | -14380.49 |
| AIC | 48228.19 | 45537.44 | 44560.93 | 29371.33 | 29038.97 |
| seEform in parentheses; *** p<0.01, ** p<0.05, * p<0.1; the VIF of all independent variables are less than 10. In the e-form of coefficient, the result minus 1 is the changing odds-ratio of dependent variable for every change of independent variable. | |||||
Table 5.
Regression results (Eq.2).
| VARIABLES | (1) | (2) | (3) | (4) |
| z_RTI | 1.145*** | 1.428*** | 1.136*** | 1.435*** |
| (0.025) | (0.096) | (0.026) | (0.098) | |
| Anglo_Saxon | 0.017*** | 0.017*** | 0.016*** | 0.016*** |
| (0.004) | (0.004) | (0.004) | (0.004) | |
| Middle_East_EU | 0.01*** | 0.01*** | 0.01*** | 0.01*** |
| (0.003) | (0.003) | (0.003) | (0.003) | |
| East_Asia | 0.016*** | 0.017*** | 0.013*** | 0.014*** |
| (0.004) | (0.005) | (0.003) | (0.004) | |
| South_West_EU | 0.01*** | 0.011*** | 0.013*** | 0.013*** |
| (0.002) | (0.002) | (0.003) | (0.003) | |
| Nordic (referee group) | - | - | - | - |
| - | - | - | - | |
| Anglo_Saxon_z_RTI | 0.764*** | 0.765*** | ||
| (0.057) | (0.057) | |||
| Middle_East_EU_z_RTI | 0.818*** | 0.787*** | ||
| (0.063) | (0.061) | |||
| East_Asia_z_RTI | 0.781*** | 0.767*** | ||
| (0.060) | (0.060) | |||
| South_West_EU_z_RTI | 0.797*** | 0.788*** | ||
| (0.057) | (0.057) | |||
| Constant | 918,833.084*** | 870,234.058*** | 1825478.453*** | 1740741.184*** |
| (635,962.156) | (604,061.379) | (1287979.406) | (1231838.829) | |
| Individual Controls | √ | √ | √ | √ |
| Organizational Controls | √ | √ | √ | √ |
| Country Controls | √ | √ | √ | √ |
| Industry Fixed Effect | √ | √ | ||
| Observations | 73,993 | 73,993 | 73,993 | 73,993 |
| Pseudo R2 | 0.41 | 0.411 | 0.419 | 0.419 |
| LL | -14329.11 | -14322.05 | -14120.41 | -14113.36 |
| AIC | 28768.21 | 28762.09 | 28526.81 | 28520.71 |
| seEform in parentheses; *** p<0.01, ** p<0.05, * p<0.1 | ||||
Table 6.
The result of Oster test.
| Bound Estimate | Inputs from Regressions | Other Inputs | |||
| delta | Coeff. | R2 | R_max | Beta | |
| 1.07815 | Uncontrolled | 0.02186 | 0.005 | 0.8 | 0.1 |
| Controlled | 0.00498 | 0.357 | |||
Disclaimer/Publisher’s Note: The statements, opinions and data contained in all publications are solely those of the individual author(s) and contributor(s) and not of MDPI and/or the editor(s). MDPI and/or the editor(s) disclaim responsibility for any injury to people or property resulting from any ideas, methods, instructions or products referred to in the content. |
© 2024 by the authors. Licensee MDPI, Basel, Switzerland. This article is an open access article distributed under the terms and conditions of the Creative Commons Attribution (CC BY) license (http://creativecommons.org/licenses/by/4.0/).
Copyright: This open access article is published under a Creative Commons CC BY 4.0 license, which permit the free download, distribution, and reuse, provided that the author and preprint are cited in any reuse.