

Submitted:
11 September 2024
Posted:
11 September 2024
You are already at the latest version
Abstract
Global dust events have become more frequent due to climate change and increased human activity, significantly impacting air quality and human health. Previous studies have often focused on simulating cross-regional dust transport based on atmospheric parameters; however, comprehensive monitoring of dust events remains challenging. Therefore, this study utilized Fengyun-4A (FY-4A) satellite Advanced Geostationary Radiation Imager (AGRI) imagery, Cloud-Aerosol Lidar and Infrared Pathfinder Satellite Observation (CALIPSO) lidar, and other auxiliary data to conduct three-dimensional spatiotemporal monitoring and cross-regional transport analysis of two typical dust events in the Beijing–Tianjin–Hebei (BTH) region of China using four dust intensity indices (Icsd, Dust Detection Index (DDI), Dust value (DV), and Dust Strength Index (DSI)) and the HYSPLIT model. We found that among the four indices, DDI was the most suitable for studying dust in the BTH region, with a detection accuracy (POCD) of > 88% at all times and reaching a maximum of 96.14%. Both the 2021 and 2023 dust events originated from large-scale deforestation in southern Mongolia and the border area of Inner Mongolia, with dust plumes distributed between 2 and 12 km being transported across regions to the BTH area. Further, when dust aerosols are primarily concentrated below 4 km and PM10 concentrations consistently exceed 600 µg/m³, large dust storms are more likely to occur in the BTH region. The findings of this study provide valuable insights into the sources, transport pathways, and environmental impacts of dust aerosols.
Keywords:
dust aerosols
; dust identification index
; FY-4A
; CALIPSO
; HYSPLIT
; Three-dimensional distribution
1. Introduction
With rapid economic and urban development in the Beijing–Tianjin–Hebei (BTH) region, air pollution has become increasingly severe and a focal point of concern. To address environmental issues in this region, China has implemented relevant policies. For example, in 2017, the government designated the “2+26” cities in and around the BTH region as key areas for prevention and control. In 2018, the State Council launched special action plans, such as the “Battle for a Blue Sky,” designating the BTH region as a priority area for pollution control. In recent years, numerous studies have analyzed air pollution in BTH, although most have used aerosol optical depth (AOD) to represent pollution characteristics (Jing et al., 2018; wen, 2022). Owing to the diverse types of aerosols, each with its unique optical properties, using the overall AOD alone to assess the atmospheric pollution status in the BTH region is inaccurate. This is especially true for the frequent dust storms in the region, which are major air pollution phenomena, further highlighting the importance of distinguishing aerosol types.
Dust, a significant atmospheric aerosol, has a large mass load and widespread distribution, with far-reaching impacts on climate and human health. Dust aerosols have a high absorption rate that directly affects the Earth's radiative balance and thermal equilibrium and transport elements, such as nitrogen and iron, over long distances into the oceans, causing eutrophication and significantly influencing the global carbon cycle (Castellanos et al., 2024). Fine dust particles can enter the human respiratory tract and lungs, leading to respiratory and cardiovascular diseases such as asthma and pneumonia (He et al., 2022). Therefore, studying the pollution characteristics of dust aerosols in the BTH region is crucial for addressing environmental issues closely related to human health and everyday life, such as climate change and urban air quality.
Owing to the complexity of dust, dynamic monitoring of dust transport based on ground observations remains challenging. With the advancement of meteorological satellite technology, high-frequency and wide-coverage remote sensing imagery has played a crucial role in dust monitoring (Shin et al., 2021). Dust monitoring primarily relies on polar-orbiting satellites, such as the Moderate Resolution Imaging Spectroradiometer (MODIS) (Borjigin et al., 2024; Cho et al., 2013; Ciren and Kondragunta, 2014; Park et al., 2014) and the Ozone Monitoring Instrument (OMI) (Torres et al., 2007). However, challenges concerning these satellites remain, such as data gaps and low temporal resolution, which limit their ability to study sudden dust events. New-generation geostationary satellites, such as Japan's Himawari 8(She et al., 2018) and China's Fengyun (FY) (Jingning et al., 2015), have been launched. Geostationary satellites have received increasing attention in dust monitoring applications. In particular, Fengyun-4A (FY-4A), with its comprehensive coverage of China, continuous monitoring capabilities, wide spatial coverage, and multiple sensors, is well-suited for dust monitoring in China.
Theoretically, atmospheric dust exhibits different optical characteristics in the ultraviolet (UV), visible (VIS), and infrared (IR) satellite imagery, and IR spectral techniques offer significant advantages for detecting dust at night and over high-albedo surfaces(Ackerman, 1997; Zhou et al., 2024). Dust detection methods are generally categorized into three types based on the channels used: shortwave reflectance-based, IR spectral-based, and combined methods(She et al., 2018). Shortwave reflectance-based methods are sensitive to surface reflectance changes during the day but become less accurate under cloud cover and low solar angles. IR spectral-based methods, such as the brightness temperature difference (BTD) and IR dust difference index (IDDI), perform well at night but are prone to confusion with other surface types during the day, increasing false detection rates.
Previous studies have proposed methods for dust monitoring using the reflective radiative characteristics of the 3.7- and 1.6-µm bands (Zheng et al., 2001; Luo et al., 2003); however, single-band methods have limitations in different environments. Classic dust detection methods such as IR techniques based on BTD and IDDI(Park et al., 2014; Yang et al., 2023) are widely used in geostationary satellite data but often associated with false positives on high-albedo surfaces and difficulties in distinguishing thin clouds from dust. Therefore, methods that combine shortwave reflectance with IR brightness temperature have been developed. These methods integrate the sensitivity of shortwave reflectance to dust features with the discriminative capability of IR spectra under complex surface conditions, thereby improving the accuracy and reliability of dust detection.
Building on previous research, this study developed a dust remote-sensing monitoring method tailored for the BTH region, leveraging the new-generation, all-weather, multi-spectral, and multi-scale observation capabilities of the FY-4A satellite. First, we identified four dust detection indices based on the imaging characteristics of the FY-4A Advanced Geostationary Radiation Imager (AGRI) sensor and determined the most suitable index for monitoring dust in the BTH region through an accuracy assessment. Next, using the HYSPLIT model, we simulated two typical dust events in the BTH region to analyze the sources and long-distance transport characteristics of the dust. Finally, we studied the vertical distribution characteristics of dust aerosols and their environmental impacts using CALIPSO lidar and other auxiliary data. This study provides insights into quantitative dust monitoring in the BTH region and is significant for enhancing regional environmental and air quality monitoring.
2. Material and Methods
2.1. Study Area
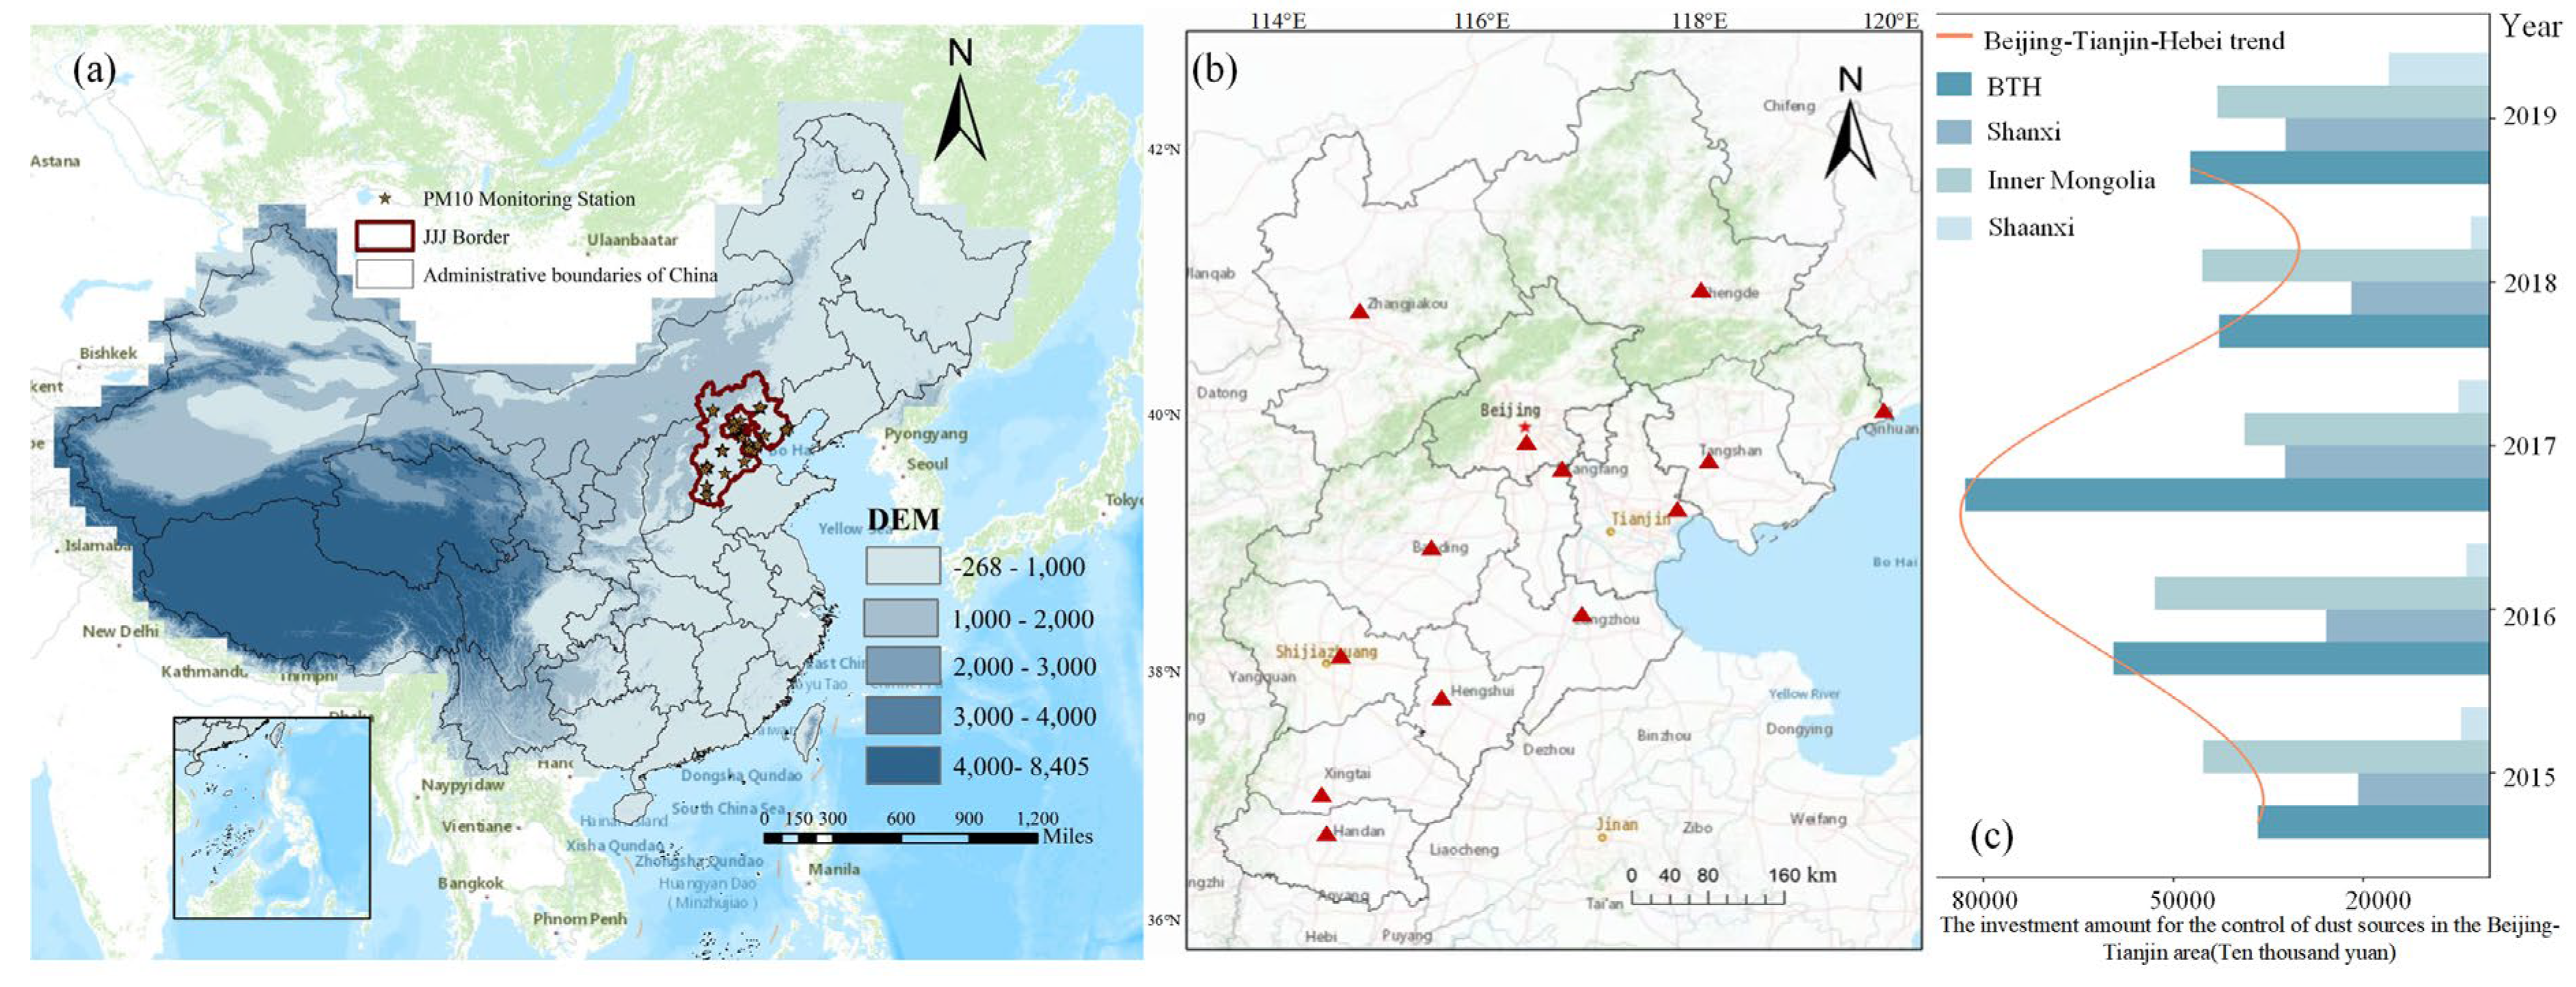
The BTH region, encompassing the Beijing, Tianjin, and Hebei Provinces, is located in northeastern China, adjacent to the Bohai Sea and the Inner Mongolia desert region, and has a predominantly arid to semi-arid climate. With the rapid development of Beijing and Tianjin, the BTH region has become one of the most economically significant and dynamic regions in China(Zhai et al., 2022). However, industrialization and urbanization have substantially enhanced pollutant emissions, especially in spring, when monsoons carry dust from Inner Mongolia and the Loess Plateau in the BTH region. Due to its flat terrain and lack of natural barriers, dust spreads persist in this area, making it one of the most polluted regions in the country. As shown in Figure 1C, investment in dust source management in the BTH region initially increased and then decreased, with investments exceeding 800 million yuan in 2017.
Between 2015 and 2019, the BTH region was consistently ranked among the top two investment regions. Therefore, studying the three-dimensional distribution and cross-regional transport of dust aerosols in the BTH region is crucial for the sustainable and high-quality development of the northern country.
Figure 1.
Administrative Map. (a) National 1 km DEM elevation map. (b) PM10 monitoring station distribution in the Beijing–Tianjin–Hebei Region. (c) Bar chart of dust source management project construction in the Beijing-Tianjin-Hebei Region (2015–2019).
Figure 1.
Administrative Map. (a) National 1 km DEM elevation map. (b) PM10 monitoring station distribution in the Beijing–Tianjin–Hebei Region. (c) Bar chart of dust source management project construction in the Beijing-Tianjin-Hebei Region (2015–2019).
2.2. Experimental Data
(1) FY-4A geostationary satellite
FY-4A is China's latest generation geostationary meteorological satellite and the first three-axis-stabilized remote sensing satellite in a geostationary orbit. It is equipped with an AGRI that features 14 channels and can perform full-disk scans every 15 min in its full-disk scanning mode. Compared with the previous generation of geostationary meteorological satellites, AGRI shows significant improvements in imaging performance and is comparable with its international counterparts (Lu et al., 2017). Data from FY-4A/AGRI can be accessed daily from the National Satellite Meteorological Centre’s data service network, providing 40 full-disk images and 165 regional images of China. It includes six visible/near-IR bands, two water vapor bands, two mid-IR bands, and four long-wave IR bands, enabling the clear identification of different cloud types, high- and mid-level water vapor, and the ability to capture aerosols and snow. The data types include primary data, atmospheric products, and radiative products. This study used FY-4A AGRI full-disk 4 km Level 1 data to explore its application in dust monitoring, primarily relying on shortwave IR, middle IR, and long-wave IR data to study dust intensity indices. Table 1 provides the channel information.
(2) Introduction to CALIPSO data products
The Cloud-Aerosol Lidar and Infrared Pathfinder Satellite Observation (CALIPSO) satellite is a sun-synchronous earth-observing satellite jointly operated by NASA and CNES and is equipped with three main sensors: a Cloud-Aerosol Lidar with Orthogonal Polarization (CALIOP), a wide-field camera (WFC), and an Imaging Infrared Radiometer (IIR) (Jianyu et al., 2022; Shen, 2014). The CALIOP is a key instrument capable of emitting laser beams at 532 and 1,064 nm to obtain vertical aerosol distribution information through backscattering, retrieving the vertical structure of aerosols(Mehta et al., 2018). As an active spaceborne lidar, CALIOP provides information on aerosol vertical distribution, coverage, and type during the day and night and classifies detected aerosols into seven categories: clean ocean, dust, polluted continental, clean continental, polluted dust, smoke, and other. Its aerosol products are categorized into three main types: layer, profile, and Vertical Feature Mask (VFM), of which VFM provides profile information specifically for dust aerosols(Kuang et al., 2015). This study utilized the CALIOP Level 2 VFM products and Level 1 data to compute and analyze dust aerosols' backscattering coefficients and vertical distribution characteristics.
(3) PM10 Station Data Set
The air quality data used in this study were obtained from the National Urban Air Quality Real-Time Release Platform of the China National Environmental Monitoring Center (https://air.cnemc.cn:18007/) and the Beijing Environmental Protection Monitoring Center website (https://www.bjmemc.com.cn/).
These platforms provide nationwide air quality data, including data from multiple monitoring stations in BTH and Inner Mongolia regions. The selection of monitoring stations across different geographic locations aims to cover a range of air quality conditions in the region, allowing for a comprehensive analysis of hourly particulate matter with a diameter of ≤ 10 micrometers (PM10) concentration data. The data acquisition process involves downloading data from specified websites, removing redundant information, and converting it into a standard format for more accurate statistical analysis and model application.
3. Method
This study utilized multi-source data to identify and analyze dust in the BTH region, focusing on its three-dimensional distribution and cross-regional transport characteristics. The content was divided into three main sections: (1) Data collection: this phase involves gathering satellite remote sensing data, meteorological data, environmental monitoring data, and geographic data. (2) Dust identification methodology: in this stage, we applied dust remote sensing monitoring principles and utilized the multi-spectral capabilities of the FY-4A satellite to capture the reflection and emission radiation characteristics of various land covers across different channels. This enables dust identification and development of dust intensity indices. By comparing and analyzing various intensity indices, we verified and determined the most suitable index for dust identification in the BTH region. (3) Analysis of typical dust events: finally, we used the HYSPLIT backward trajectory simulation model and CALIPSO VFM vertical profile characteristics, among other multi-source data, to analyze two typical dust events in the BTH region. This analysis reveals the three-dimensional distribution characteristics of dust and its cross-regional transport pathways. Figure 2 illustrates the process flowchart.
Dust remote-sensing monitoring primarily relies on satellites equipped with visible and IR channels, which can detect reflected and emitted radiation in atmospheric window regions usually unaffected by atmospheric absorption and emissions. However, when large particles such as dust are present in the atmosphere, they significantly scatter solar shortwave radiation backward, altering the Earth's albedo. Similarly, these particles form cloud-like surfaces in the air, which alter the distribution of longwave IR radiation. By analyzing the reflectance and scattering characteristics of dust across different spectral bands and its radiative transfer properties, dust can be effectively distinguished from other remote sensing targets and interference factors. Dust consists of particles of varying sizes, ranging from 1 to 100 μm in radius. High dust concentrations can form thick layers that strongly absorb, reflect, and emit surface and solar radiation. Satellite observations primarily capture the reflectance and emission radiation information of dust layers, which can also indicate the intensity of dust storms (Luo et al., 2015). According to the basic principles of dust remote sensing and reflectance characteristics, the analysis must be conducted using multiple spectral channels. The FY-4A satellite data include spectral channels ranging from visible and near-IR to shortwave, mid-wave, and longwave IR, effectively identifying dust information on the underlying surface.
This study utilized FY-4A AGRI L1 data from three channels to create true color images with a sample taken from a typical dust event in the BTH region on March 15, 2021, UTC 06:00. The dust covered a range of 38°N-39°N and 114°E-116°E; thin clouds covered 40°N-41°N and 114°E-116°E; thick clouds covered 36°N-37°N and 114°E-116°E. We first visually interpreted thin clouds, thick clouds, and dust; then, we used histogram analysis to preliminarily determine the dust value range, and finally applied Otsu's double-threshold method to obtain the exact threshold range.
(1) Icsd
As dust particles are typically rougher and more irregular than other substances in the surrounding environment, they often exhibit higher reflectance in the shortwave IR region, resulting in a brighter signal. By contrast, areas without dust tended to display darker signals. This difference in reflectance can help to distinguish the dust regions. In addition, dust particles can absorb and emit thermal energy in the IR spectrum, making shortwave IR channels effective for the detection of dust. The Icsd primarily utilizes the reflection or radiation information from the 1.61-µm shortwave IR channel.
where is the 1.61 μm channel reflectance, the value of a is 10 and b is 0.8.
2) Dust Detection Index (DDI)
Owing to the differences in the absorption attenuation of dust between the two IR split-window channels, they can be used as the basis for dust detection. This is particularly effective for weak dust areas, where the IR split-window channels exhibit better differentiation than other channels. The ratio index of the IR split-window channels was used as the dust identification criterion. The formula is as follows:
where, represents the brightness of the channel with a central wavelength of 12 μm, and represents the brightness of the channel with a central wavelength of 10.7 μm.
As the 1.61-μm near-IR channel is highly responsive to dust, particularly in cases of severe dust, it is typically used to represent the quantitative intensity of dust using the e index of the 1.61-μm channel reflectance in practical applications. The calculations are as follows:
where represents the reflectance of the 1.61-μm channel.
Combining the accuracy of the two IR split-window channels for weak dust detection and the significant response of the 1.61-μm shortwave IR channel for strong dust detection, the DDI is proposed as a quantitative measure for dust monitoring. This is defined as follows:
(3) Dust value (DV)
The mid-IR 3.75-μm channel has a significant response to dust, especially strong dust. In practical applications, the difference between the 3.75- and 10.7-μm channels, known as the DV, is used as the basis for dust identification. The formula is as follows:
where represents the brightness temperature at the central wavelength of 3.75 μm; represents the brightness temperature at the central wavelength of 10.7 μm.
(4) Dust Strength Index (DSI)
The mid-wave IR channel at 3.75 μm and the long-wave IR channel at 11 μm are typically used to detect clouds and water vapor in the atmosphere. However, the physical and chemical properties of dust particles differ from those of clouds and water vapor, leading to distinct absorption and scattering characteristics. This enables effective atmospheric dust identification. The DSI primarily measures the radiative difference between the mid-wave IR channel and the short-wave IR channel. The calculation method for this index involves determining the difference in radiative values between the two channels and then classifying the surface based on the magnitude of this difference.
where is the reflectance of the 8.5μm channel, and is the reflectance of the 3.75-μm channel.
Based on the histogram results in Figure 3, we set the Icsd threshold between 2.7 and 3.7 and the DDI threshold between 19 and 21.5. However, as both dust and thick clouds exhibit high DSI and DV values, making it difficult to differentiate between dust and clouds, we did not use the DSI and DV indices for dust identification.
To validate the above results, we compared them with true-color dust images from FY-4A AGRI using the probabilities of correct detection (POCD) and false detection (POFD).
In this validation process, True Positive (TP) indicates that both Icsd, DDI, and AGRI identify the area as dust, while False Positive (FP) means that Icsd and DDI identify the area as dust, but AGRI identifies it as non-dust. False Negative (FN) refers to cases where Icsd and DDI identify the area as non-dust, but AGRI identifies it as dust. The POCD represents the probability of correctly detecting the target, and the POFD represents the probability of incorrect detection.
4. Analysis
4.1. Dust Range and Trajectory Identification
(1) Verification results of the Icsd and DDI algorithms
The performances of the two dust detection algorithms (Icsd and DDI) were evaluated using the FY-4A AGRI dust products for the BTH region from 02:00 to 06:00 UTC on March 15, 2021. The results are summarized in Table 2. Overall, the POCD of Icsd remained above 80% across different periods, indicating high accuracy in dust storm detection. However, the FP values of Icsd fluctuated significantly, with a notable peak of 2,421 at 02:00, leading to a high POFD of 49.11% during that time. Despite the excellent performance of Icsd at 04:00, with a POCD of 95.13%, its overall false alarm rate was high, affecting its practical application. In contrast, the DDI demonstrated more stable POCD and lower POFD values during dust storm detection, showing extremely high detection accuracy and extremely low false alarm rates. For instance, DDI's POCD at 03:00 was 93.25%, with a POFD of only 23.09%; at 04:00, the POFD decreased further to 11.71%. By 06:00, DDI's POCD reached 96.14%, indicating excellent accuracy. Overall, DDI's POCD exceeded 88% at all times, and its POFD was below 30% for most periods, demonstrating a more stable detection performance.
Overall, although ICSD performed exceptionally well during certain periods, it had a higher overall false-alarm rate. The DDI provides more stable and accurate dust storm detection results. This stability and high precision make the DDI more advantageous for dust storm detection in the BTH region. Owing to the unique geographical and climatic conditions of the BTH region, dust storms are frequent and pose significant threats. Accurate and reliable dust storm detection is crucial for early regional warning and emergency responses. Therefore, only the DDI was used for the subsequent analysis of typical dust storm events in the BTH region.
(2) Analysis of horizontal movement trajectory and dust intensity in the BTH region
The dust identification and dust intensity index calculation methods are applicable for dust monitoring and analysis in the BTH region. This study used two observation periods in the BTH region as examples to elaborate on dust monitoring methods based on FY-4A satellite data. The example utilizes FY-4A satellite AGRI full-disk 4 km L1 data covering the BTH region from 03:00 to 06:00 UTC on March 15, 2021, and 03:00 to 06:00 UTC on March 22, 2023, to observe the spatial distribution, movement trajectory, and intensity changes of dust phenomena in the region. The AGRI true-color images (Figure 4a and 4c) show the extent of the dust, whereas the DDI index images (Figure 4b and 4d) indicate that values < 19 correspond to thin clouds or non-dust surface features, values > 21.5 correspond to thick clouds, and values between 19 and 21.5 represent different concentrations of dust, with deep brown indicating the highest concentration and light yellow indicating lower concentrations. Figure 4e shows the distribution of DDI values for each period, with wider shapes indicating a higher density of data points within that DDI value range and the graph's overall shape reflecting the data distribution trend.
Case 1: The most severe dust event in the BTH region in the past decade
Based on the analysis in Figure 4, at UTC 03:00 on March 15, 2021, dust weather had already developed in some areas of the BTH (Figure 4a1). At this time, the DDI value in the Langfang area exceeded 21, indicating a high dust concentration (Figure 4b1). One hour later, the dust coverage expanded further, with the area having DDI values between 21 and 21.5 increasing (Figure 4a2 and 4b2). By UTC 05:00 , the dust continued to move southeast, with the DDI values in cities such as Shijiazhuang, Hengshui, and Cangzhou reaching 21–21.5, indicating that the high-concentration dust area had reached its maximum size (Figure 4a3 and 4c3).
However, at UTC 06:00, both the range and intensity of the dust weakened (Figure 4a4 and 4b4), indicating that the impact of dust on the BTH region had begun to decrease. Combining the DDI value statistics from 03:00 to 06:00 UTC on March 15, 2021 (Figure 4e), it is evident that at UTC 05:00, the data were primarily concentrated in higher DDI value ranges, with the percentile and median being the highest, indicating that the dust intensity peaked at this time. Conversely, at UTC 06:00, the data distribution was concentrated in the lower DDI value ranges, indicating that the dusty weather began diminishing.
Case2:Small-scale dust events in the BTH region during spring
On March 22, 2023, at UTC 03:00, the dust primarily affected the Hengshui and Cangzhou areas (Figure 4c1). The DDI values were concentrated between 19 and 20, indicating that the dust concentration and intensity were in their initial stages (Figure 4d1). By UTC 04:00, the impact of the dust expanded to the central-southern and northwestern regions of the BTH area (Figure 4c2), and the area with DDI values between 20.5 and 21 also continued to grow (Figure 4d2). By UTC 05:00, although the extent of the dust impact did not show a significant change (Figure 4c3), the area with DDI values greater than 20.5 increased significantly (Figure 4d3), indicating that the dust intensity reached its peak at this time. By UTC 06:00, both the extent and intensity of the dust had significantly decreased (Figure 4c4 and 4d4). According to the DDI statistics from UTC 03:00 to 06:00 on March 22, 2023 (Figure 4e), the violin plot at UTC 05:00 shows a wider region around DDI values of approximately 19.36 and 20.5, indicating that these DDI values were more concentrated. Moreover, the frequency of DDI values > 20.5 was the highest among the four time periods, confirming that the dust intensity peaked at this time. In contrast, at UTC 06:00, the DDI values decreased sharply, with the maximum not exceeding 21, and the dataset was concentrated in the lower ranges, indicating that the dust impact was significantly weakened.
In summary, analysis of the dust events in the BTH region in 2021 and 2023 revealed that the movement trajectories of the dust in both events were similar. The dust originated from areas above the BTH, gradually moved downward, reached its peak intensity around UTC 05:00, and ultimately accumulated in the southeastern part of the region. This pattern is related to the topographical features of the BTH area, with its higher northwest and lower southeast terrain and the prevailing southeastern winds (Figure 4 a, c, yellow arrows). However, there were significant differences in the dust intensity between the two events. In the 2021 event, the median DDI value was approximately 20, with values exceeding 21 in all four periods. In contrast, the median value of the 2023 event was approximately 19.75, with no values exceeding 21 at UTC 06:00, and All DDI values in the four time periods were lower than those in 2021. This indicates that the dust monitoring method using FY-4A satellite data allows for a detailed understanding of dust spatial distribution, movement trajectories, and intensity changes, providing a scientific basis for atmospheric environment forecasting and prevention.
AGRI true-color images for March 15, 2021, UTC 03:00–06:00 (a1–a4) and DDI distribution maps (b1–b4); AGRI true-color images for March 22, 2023, UTC 03:00–06:00 (c1–c4) and DDI distribution maps (d1–d4); DDI violin and boxplot statistics for March 15, 2021, and March 22, 2023, UTC 03:00–06:00 (e)
4.2. HYSPLIT-4 Backward Trajectory Simulation Analysis
The Lagrangian Hybrid Single-Particle Trajectory Model (HYSPLIT) is a valuable tool in atmospheric sciences widely used for dust storm monitoring and simulation utilizing meteorological data from the Global Data Assimilation System (GDAS). In this study, backward trajectory simulations were performed using HYSPLIT for two events, March 15, 2021, and March 22, 2023, with the starting point set at Beijing (39.91°N, 116.39°E) at 06:00 UTC. The trajectories were initialized at a height of 500 m above the ground and simulated for 48 h to illustrate the transport paths and sources of dust particles.
(1) Study of the most severe dust storm events in the BTH region over the past decade
Around March 15, 2021, the dust originated rapidly from southern Mongolia and the northwestern border of Inner Mongolia in China. Under the guidance of northwesterly winds, dust was transported southeastward, resulting in the most severe dust storms in northern China over nearly a decade. Figure 5a shows the backward trajectories of the BTH region, indicating that the air mass moved rapidly from northern Russia, crossed Mongolia, transported dust into Inner Mongolia and Hebei, and eventually reached Beijing. Research indicates that on March 13, the vertical distribution of dust exceeded 6,000 m. On March 14, the vertical height of the dust decreased from 4,500 to 1,000 m. By March 15, at 04:00 UTC, the dust had descended near the ground, at ≤ 500 m. Figure 5b highlights the dust source regions in Mongolia, Xinjiang, and Inner Mongolia with red circles, indicating that the dust influenced by the air mass entered the BTH region. The study also found that from February 12 to March 12, 2021, the northern regions of China experienced significantly higher temperatures and lower precipitation, which accelerated the expansion of bare surfaces and created favorable conditions for dust storms(Gui et al., 2021; Duan et al., 2021; Guan et al., 2021).
(2) Study on small-scale dust events in the BTH region during spring
Around March 22, 2023, influenced by cold air, a large-scale dust event affected the northeastern part of the northwestern region, Inner Mongolia, northern China, and parts of the northeast. Figure 5c shows that on March 22, 2023, the dust impacting the BTH region originated primarily from central Inner Mongolia and southern Mongolia. The dust particles were lifted from the ground to altitudes between 500 and 5,000 m by wind and transported southward and southeastward. The red circles in Figure 5d indicate the dust sources and drifting-sand conditions in Xinjiang, Inner Mongolia, and Mongolia.
These dust particles were transported into the BTH region by an air mass. Since March 2023, northern China has experienced reduced precipitation, significantly higher temperatures in Mongolia and the northwest, and a lack of snow cover on its surface, which, combined with the intrusion of cold air, has greatly facilitated dusty weather.
Overall, both dust events originated from the border region between Mongolia and Inner Mongolia, and mainly entered China from the central and southern regions of Mongolia. In Inner Mongolia, the dust moves southeast after crossing the Yinshan Mountains, affecting the BTH region. However, there were significant differences between the two events. The 2021 dust event was influenced by high-latitude air masses from Russia, resulting in higher altitudes for the vertical distribution of dust, which generally exceeded that of the 2023 event. By contrast, the 2023 dust event was influenced by lower-latitude air masses, leading to lower dust heights. Although both events were affected by reduced precipitation and lack of snow cover, the different sources and altitudes of the air masses led to variations in the vertical distribution characteristics and transport paths of the dust. These differences directly affected the intensity and extent of dust in the BTH region; the 2021 event had a greater and broader impact, whereas the 2023 event had a relatively smaller effect.
4.3. Analysis of the Vertical Transport Path of Dust Aerosols
The remote sensing dataset used in this analysis was obtained from the VFM product of the CALIPSO satellite, which was generated from the Level 1 B lidar data of the CALIOP sensor. Figure 6 shows the CALIOP vertical profile classification map and backscatter coefficient map for aerosols and clouds, where aerosols are classified into six subcategories: clean continental, clean marine, dust, polluted continental, polluted dust, and smoke (Peng et al., 2023). Additionally, numerous studies have demonstrated the accuracy of the VFM compared to ground-based measurements(Burton et al., 2013; Jiménez, 2020) confirming its reliability in aerosol and cloud monitoring. However, owing to the low temporal resolution of the CALIPSO satellite, PM10 hourly station data were used to further explain the vertical distribution and cross-regional transport characteristics of dust in the BTH and Inner Mongolian regions.
(1) Study on the most intense dust storm events in the BTH region over the past decade
On March 15, 2021, the CALIOP lidar observed the BTH region and Inner Mongolia, revealing that the aerosols in these areas could be classified into six types: clean continental, clean marine, dust, polluted continental, polluted dust, and smoke aerosols (Figure 6a1, 6b1). In the BTH region, dust and polluted dust aerosols accounted for 99.23% of the total aerosol grid counts, predominantly distributed between117.4°N~118.3°N and 118.7°N~119.1°N and concentrated near the surface with heights < 4 km. The corresponding backscatter coefficients were mainly in the range of 0.0025–0.0045 (km·sr)-1 (Figure 6a1, 6a2). In contrast, Inner Mongolia exhibited a larger range and vertical span of cloud and dust distribution. Dust and polluted dust aerosols accounted for > 90% of the grid count. Particularly between 107.5°N and 109.8°N, aerosols had a significant vertical span, with substantial amounts present 2–12 km above the surface. When aerosol pollution was present near the surface, cloud formation was often observed with cloud backscatter coefficients < 0.01 (Figure 6b1, 6b2). This vertical distribution allows the dust to remain suspended in the air for extended periods and facilitates long-distance transport. Combining PM10 concentration data from key monitoring sites in the BTH region and Inner Mongolia (Figure 6a3, 6b3), we found that by 04:00 in Beijing on March 15, 2021, signs of dust initiation were already present in Inner Mongolia. Within 24 h, PM10 concentrations rapidly exceeded 6,000 µg/m³. In comparison, the PM10 concentration surge in the BTH region occurred 8 h later and stabilized only on March 17, whereas in Inner Mongolia, PM10 concentrations stabilized earlier. This indicates that Inner Mongolia was first affected by dust and its propagation path and timing led to a delay in dust pollution in the BTH region. This demonstrates that dust from Inner Mongolia can remain suspended in the air for extended periods and be transported over long distances, significantly impacting air quality in the BTH region.
(2) Research on Small-Scale Spring Dust Events in the BTH Region
From March 20 to 23, 2023, the northern region experienced the largest dust storms of the year. According to CALIPSO VFM and backscatter coefficient data for the BTH and Inner Mongolia regions (Figure 6c1, 6c2, 6d1, 6d2), this dust event featured a diverse range of aerosol types, including smoke, polluted dust, polluted continental, clean continental, dust, and clean marine aerosols, with backscatter coefficients concentrated between 0.0025 and 0.0045 (km·sr)-1. These observations indicate that the dust event involved a mixture of various aerosol types rather than a single type of aerosol dispersion; specifically, polluted continental and clean marine aerosols were mainly concentrated around 2 km above the ground, whereas smoke aerosols typically appeared around 4 km, and clean continental aerosols were found at higher altitudes, generally between 8 and 10 km. The vertical distribution of dust aerosols was extensive, ranging from the ground up to 12 km, allowing dust aerosols to remain suspended in the air for extended periods and travel long distances with the wind. In the BTH and Inner Mongolia regions, dust aerosols accounted for over 65% of the grid counts (Figure 6c1, 6d1), indicating that dust dominated during this event. In contrast, during this period, the dust aerosols in Inner Mongolia were mainly concentrated below 5 km, and a backscatter coefficient of approximately 0.0045 was predominantly in the lower layers. Although dust activity in Inner Mongolia was frequent, its lower vertical distribution resulted in a relatively lower long-distance transport efficiency, thus limiting its impact on other regions (Figure 6d1, 6d2). According to station monitoring data (Figure 6d3), the highest PM10 concentration in Inner Mongolia during this period did not exceed 1,600 µg/m³, indicating a less severe dust storm than more extreme cases. This suggests that dust from Inner Mongolia has a relatively limited impact on the BTH region. Despite this, the BTH region experienced some dust impact, primarily from local and nearby pollutants and dust mixtures.
In the past decade, the BTH region experienced several significant dust events, with dust storms on March 15, 2021, and March 22, 2023, representing long-distance, high-intensity dust events and small-scale spring dust events, respectively. In both events, dust aerosols dominated the BTH and Inner Mongolia regions, but their vertical distribution characteristics differed significantly. During the large dust event in BTH, dust aerosols were concentrated near the surface, with backscatter coefficients primarily in the range of 0.0025–0.0045 (km·sr)-1. This low-altitude, high-concentration distribution significantly impacts ground-level air quality. In contrast, the dust distribution in Inner Mongolia was more extensive, with vertical heights ranging from 2 to 12 km. This broad vertical distribution allowed dust to remain suspended for extended periods and be transported over long distances, significantly affecting air quality in downwind areas. In the small-scale dust event in BTH, dust aerosols had a larger vertical distribution span, with dust present throughout the atmospheric column from the surface to 12 km. Furthermore, the backscatter coefficient remained within a similar range. However, in Inner Mongolia, dust was primarily concentrated below 5 km, resulting in lower long-distance transport efficiency. This vertical distribution suggests that the dust from Inner Mongolia mainly impacted local and neighboring regions. In contrast, the BTH region was affected by a mix of local and external dust types. Notably, when the proportion of dust aerosol grid counts was extremely high, the corresponding PM10 concentrations were also high. This correlation indicates that during dust events, areas with high aerosol concentrations often experience severe air pollution with significant increases in PM10 levels, further exacerbating public health and environmental issues. Therefore, monitoring dust aerosols can provide insights into the spatial distribution and movement of dust and a more accurate assessment of its impact on air quality through changes in PM10 concentrations.
5. Discussion
This study attempted to explore the use of passive and active satellite remote sensing sensors for three-dimensional monitoring of dust storms; however, few limitations remain to be addressed. Clouds were a major interference factor when the FY-4A satellite was used for dust identification. Due to their low optical thickness and high transparency, thin clouds allow light to pass through, scatter, and reflect, interfering with dust signals and leading to false negatives in dust detection. Thick clouds and dust have very similar reflection and absorption characteristics in IR channels, and relying on reflectance and brightness temperature differences for channel combinations may not accurately distinguish between the two; brightness temperature differences mainly reflect the temperature differences between the surface and different atmospheric heights. According to the vertical profiles of clouds and aerosols from CALIPSO shown in Figure 6, high-concentration dust is often accompanied by cloud layers, making the IR radiation responses of thick clouds and highly suspended dust very similar, thereby increasing the risk of misidentifying thick clouds as dust. Shortwave IR band 5 of the Fengyun-4A satellite is sensitive to thick clouds and dust but cannot distinguish thin clouds from other surface types. In contrast, longwave IR bands 12 and 13 are very accurate in identifying thin clouds, although cannot distinguish dust from thick clouds. Therefore, the DDI proposed in this study combines these three channels to reduce the interference of thin and thick clouds during dust identification.
Additionally, this study directly classified clouds and dust through visual interpretation; however, a single pixel observed by a satellite may contain multiple surface types, such as dust, clouds, and land surfaces. This mixed-pixel effect can blur the reflectance and brightness temperature-difference data, making it difficult for simple threshold methods to distinguish between them accurately. Consequently, dust may be missed in areas obscured by thin clouds and misidentified as dust in areas obscured by thick clouds. Moreover, the AGRI instrument on the FY-4A satellite, an optical imaging device, can only capture images during the day by receiving sunlight reflected or scattered from the surface. Consequently, they cannot be used to monitor dust or other surface features at night. Additionally, CALIPSO observations of the same area had long intervals, making it impossible to continuously monitor the 3D movement trajectory of the dust for 24 h. Collectively, these factors affect the accuracy and continuity of dust identification.
Future research on dust detection algorithms will continue to face challenges. First, exploring the application of machine learning methods in dust detection can help to determine whether they can overcome the threshold limitations of experience-based algorithms. Second, detecting dust at night must be a focus to achieve all-weather dust monitoring capabilities.
6. Conclusions
This study used FY-4A satellite AGRI imagery, CALIPSO lidar data, and other auxiliary data to perform three-dimensional spatiotemporal monitoring and cross-regional transport analysis of two typical dust events in the BTH region using four dust intensity indices (Icsd, DDI, DV, and DSI) and the HYSPLIT model. The main conclusions are as follows:
- (1)
- Based on the spectral characteristics of the Fengyun-4A satellite, four dust intensity indices were selected: Icsd, DDI, DSI, and DV. As DSI and DV were ineffective in distinguishing between thick clouds and dust, they were initially excluded. The grid-matching results showed that while Icsd provided good detection performance, it had a high false alarm rate, especially with a POFD of up to 49.11% at 02:00. In contrast, DDI exhibited a stable performance, with POCD exceeding 88% across all periods and a lower false alarm rate. Analysis using the DDI revealed that dust typically moved from the central BTH region toward the southeast, with high-intensity events having a broader impact.
- (2)
- The HYSPLIT model was used to simulate two dust events in the BTH region: one on March 15, 2021, and the other on March 22, 2023. The 2021 event was the strongest in the past decade, with an air mass originating from high-latitude regions in Russia, reaching heights of up to 6,000 m, descending to 500 m by March 15, and covering a wide area. The 2023 event was smaller in scale, with the air mass coming from central Inner Mongolia and southern Mongolia, with vertical heights ranging from 500 m to 5,000 m. Although both events were influenced by higher temperatures and lower precipitation, differences in the origin and height of the air mass led to variations in the vertical distribution and propagation paths of the dust.
- (3)
- In major dust events in the BTH region, dust aerosols account for up to 99%, primarily concentrated below 4 km, with PM10 concentrations exceeding 600 µg/m³. In contrast, dust in Inner Mongolia has a broader distribution, with heights ranging from 2 to 12 km, significantly affecting the BTH region. In small-scale dust events, dust in the BTH region extended from the surface to 12 km, but the PM10 concentrations were lower. Dust in Inner Mongolia is mainly concentrated below 5 km from the surface, with reduced transmission efficiency. Overall, during large events, the near-surface aerosol concentration in the BTH region was higher and the dust from Inner Mongolia had a wider vertical distribution and more severe pollution. In small-scale events, dust concentration and propagation height are reduced, diminishing the impact.
Role of the funding source
This research was funded by the National Natural Science Foundation of China,grant number 42301501,the Tianjin Normal University Research Innovation Project foe Postgraduate Students,grant number 2024KYCX114Y.
References
- Ackerman, S.A., 1997. Remote sensing aerosols using satellite infrared observations. J. Geophys. Res. Atmospheres 102, 17069–17079. [CrossRef]
- Borjigin, A., Bueh, C., Yong, M., Purevjav, G., Xie, Z., 2024. Cross-Border Sand and Dust Storms between Mongolia and Northern China in Spring and Their Driving Weather Systems. Remote Sens. 16, 2164. [CrossRef]
- Burton, S.P., Ferrare, R.A., Vaughan, M.A., Omar, A.H., Rogers, R.R., Hostetler, C.A., Hair, J.W., 2013. Aerosol classification from airborne HSRL and comparisons with the CALIPSO vertical feature mask. Atmospheric Meas. Tech. 6, 1397–1412. [CrossRef]
- Castellanos, P., Colarco, P., Espinosa, W.R., Guzewich, S.D., Levy, R.C., Miller, R.L., Chin, M., Kahn, R.A., Kemppinen, O., Moosmüller, H., Nowottnick, E.P., Rocha-Lima, A., Smith, M.D., Yorks, J.E., Yu, H., 2024. Mineral dust optical properties for remote sensing and global modeling: A review. Remote Sens. Environ. 303, 113982. [CrossRef]
- Cho, H.-M., Nasiri, S.L., Yang, P., Laszlo, I., Zhao, X. “Tom,” 2013. Detection of Optically Thin Mineral Dust Aerosol Layers over the Ocean Using MODIS. J. Atmospheric Ocean. Technol. 30, 896–916. [CrossRef]
- Ciren, P., Kondragunta, S., 2014. Dust aerosol index (DAI) algorithm for MODIS. J. Geophys. Res. Atmospheres 119, 4770–4792. [CrossRef]
- He, Q., Gu, Y., Yim, S.H.L., 2022. What drives long-term PM2.5-attributable premature mortality change? A case study in central China using high-resolution satellite data from 2003 to 2018. Environ. Int. 161, 107110. [CrossRef]
- Jiménez, P.A., 2020. Assessment of the GOES-16 Clear Sky Mask Product over the Contiguous USA Using CALIPSO Retrievals. Remote Sens. 12, 1630. [CrossRef]
- Kuang, Y., Zhao, C.S., Tao, J.C., Ma, N., 2015. Diurnal variations of aerosol optical properties in the North China Plain and their influences on the estimates of direct aerosol radiative forcing. [CrossRef]
- Mehta, M., Singh, N., Anshumali, 2018. Global trends of columnar and vertically distributed properties of aerosols with emphasis on dust, polluted dust and smoke - inferences from 10-year long CALIOP observations. Remote Sens. Environ. 208, 120–132. [CrossRef]
- Park, S.S., Kim, J., Lee, J., Lee, S., Kim, J.S., Chang, L.S., Ou, S., 2014. Combined dust detection algorithm by using MODIS infrared channels over East Asia. Remote Sens. Environ. 141, 24–39. [CrossRef]
- Peng, N., Su, J., Han, X., Deng, X., Lan, W., Wang, J., 2023. Distributions and Direct Radiative Effects of Different Aerosol Types in North China. Remote Sens. 15, 5511. [CrossRef]
- She, L., Xue, Y., Yang, X., Guang, J., Li, Y., Che, Y., Fan, C., Xie, Y., 2018. Dust Detection and Intensity Estimation Using Himawari-8/AHI Observation. Remote Sens. 10, 490. [CrossRef]
- Shin, Y.-R., Sohn, E.-H., Park, K.-H., Ryu, G.-H., Lee, S., Lee, S.-Y., Park, N.-Y., 2021. Improved Dust Detection over East Asia Using Geostationary Satellite Data. Asia-Pac. J. Atmospheric Sci. 57, 787–798. [CrossRef]
- Torres, O., Tanskanen, A., Veihelmann, B., Ahn, C., Braak, R., Bhartia, P.K., Veefkind, P., Levelt, P., 2007. Aerosols and surface UV products from Ozone Monitoring Instrument observations: An overview. J. Geophys. Res. Atmospheres 112, 2007JD008809. [CrossRef]
- Yang, L., She, L., Che, Y., He, X., Yang, C., Feng, Z., 2023. Analysis of Dust Detection Algorithms Based on FY-4A Satellite Data. Appl. Sci. 13, 1365. [CrossRef]
- Zhai, H., Yao, J., Wang, G., Tang, X., 2022. Impact of Land Use on Atmospheric Particulate Matter Concentrations: A Case Study of the Beijing–Tianjin–Hebei Region, China. Atmosphere 13, 391. [CrossRef]
- Zhou, D., Wang, Q., Li, S., Yang, J., 2024. Preliminary Retrieval and Validation of Aerosol Optical Depths from FY-4B Advanced Geostationary Radiation Imager Images. Remote Sens. 16, 372. [CrossRef]
- Jing Yue, Sun Yanling,Fu Hongchen,et al. Temporal and spatial variation of aerosol optical depth and analysis of influencing factors in Beijing-Tianjin-Hebei region from 2010 to 2016[J]. Environmental Science & Technology,2018,41(8):104-113.
- Wen Shaoxin. Study on the Spatiotemporal Variation of AOD and Meteorological Influencing Factors in the Beijing-Tianjin-Hebei Region [D]. Hebei University of Engineering, 2022.
- Jingning L, Zhe X, Yonggang Q. Global dust remote sensing with the FengYun-3 satellite[J]. Journal of Desert Research, 2015, 35(3): 690-698.
- Zheng Xinjiang, Lu Wenjie, Luo Jingning. Study on Monitoring Sandstorms Using Multi-channel Information from Meteorological Satellites [J]. Journal of Remote Sensing, 2001, 5(4): 300-305.
- Luo Jingning, Fan Yida, Shi Peijun, et al. Study on the Comparable Method for Monitoring Sandstorm Intensity Using Multi-source Remote Sensing Data [J]. Journal of Natural Disasters, 2003, 12(2): 28-34.
- Lu Feng, Zhang Xiaohu, Chen Boyang, et al. Imaging Characteristics and Application Prospects of Fengyun-4 Meteorological Satellite [J]. Journal of Marine Meteorology.,2017,37(02):1-12.
- Duan Bolong, Liu Xinwei, Guo Runxia, et al., 2021. Analysis of the Causes of the Strong Sandstorm Weather in Northern China on March 15 [J]. Arid Meteorology, 39(4): 541-553.
- Guan Liang, Zhang Tao, Li Xin, 2021. Atmospheric Circulation and Weather Analysis in March 2021 [J]. Meteorology, 47(6): 767-772.
Figure 2.
Technical flowchart.
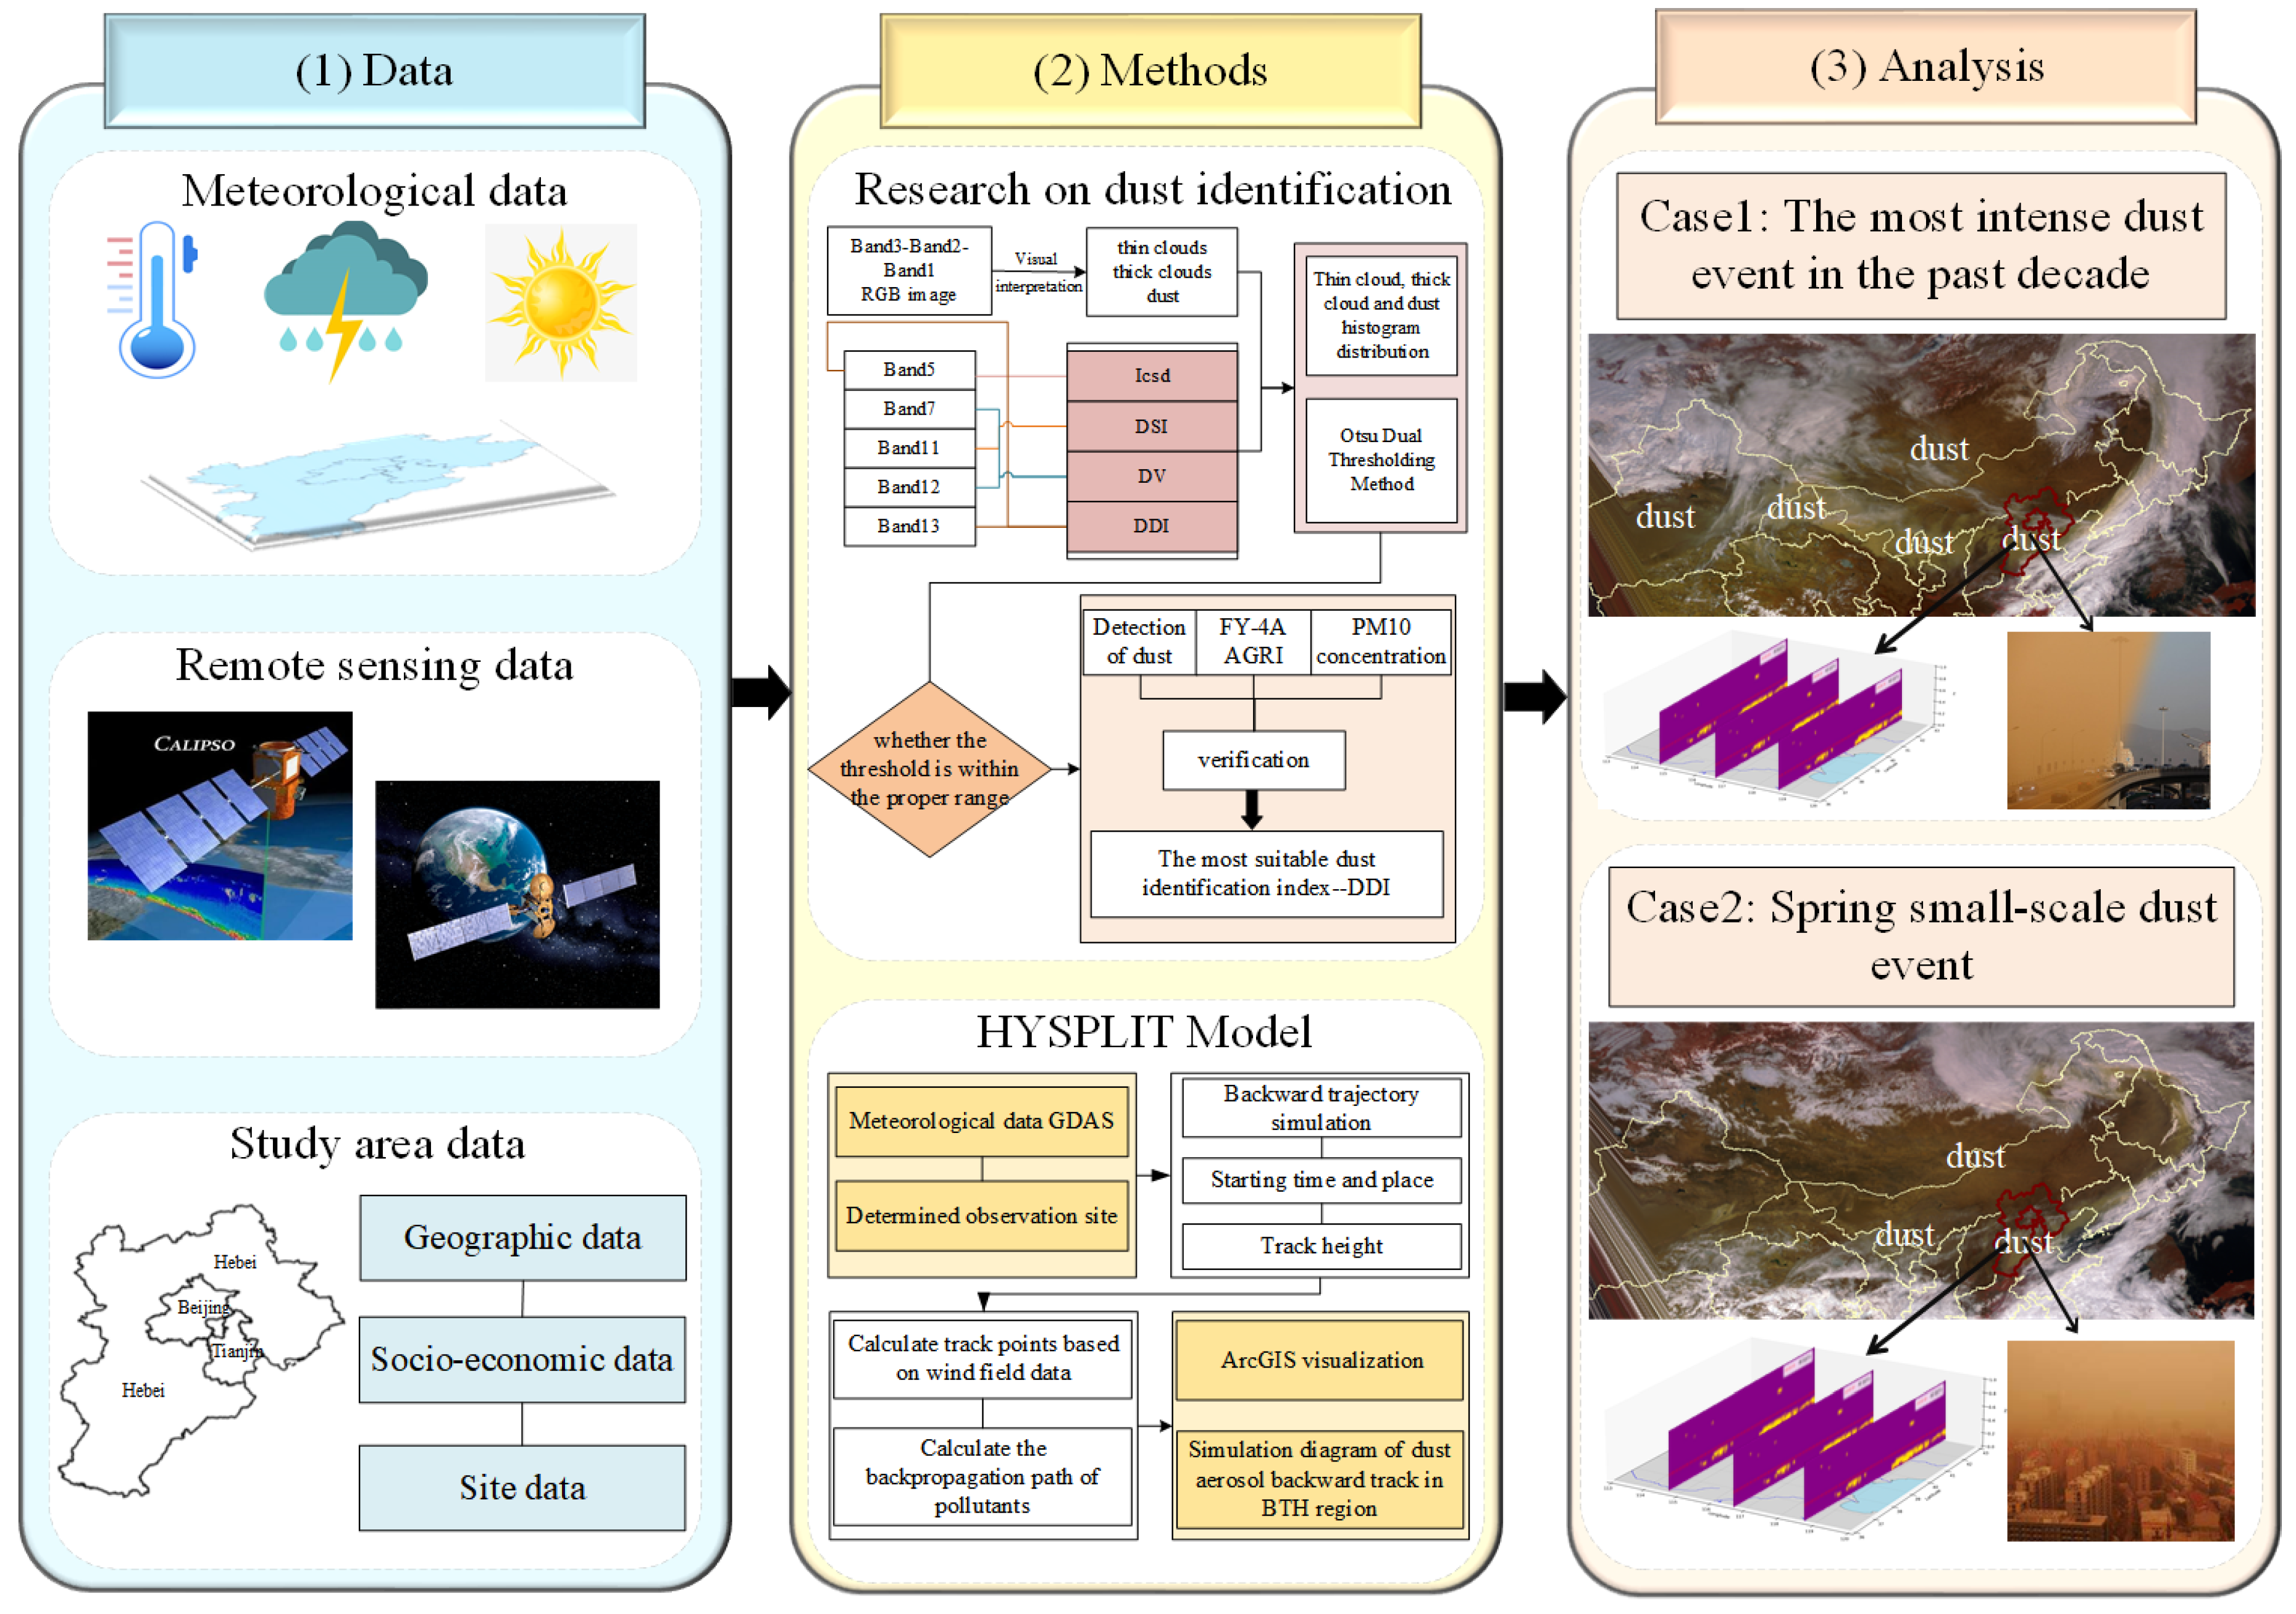
Figure 3.
Histogram of frequency distribution for thin clouds, thick clouds, and dust under four dust intensity indices.
Figure 3.
Histogram of frequency distribution for thin clouds, thick clouds, and dust under four dust intensity indices.
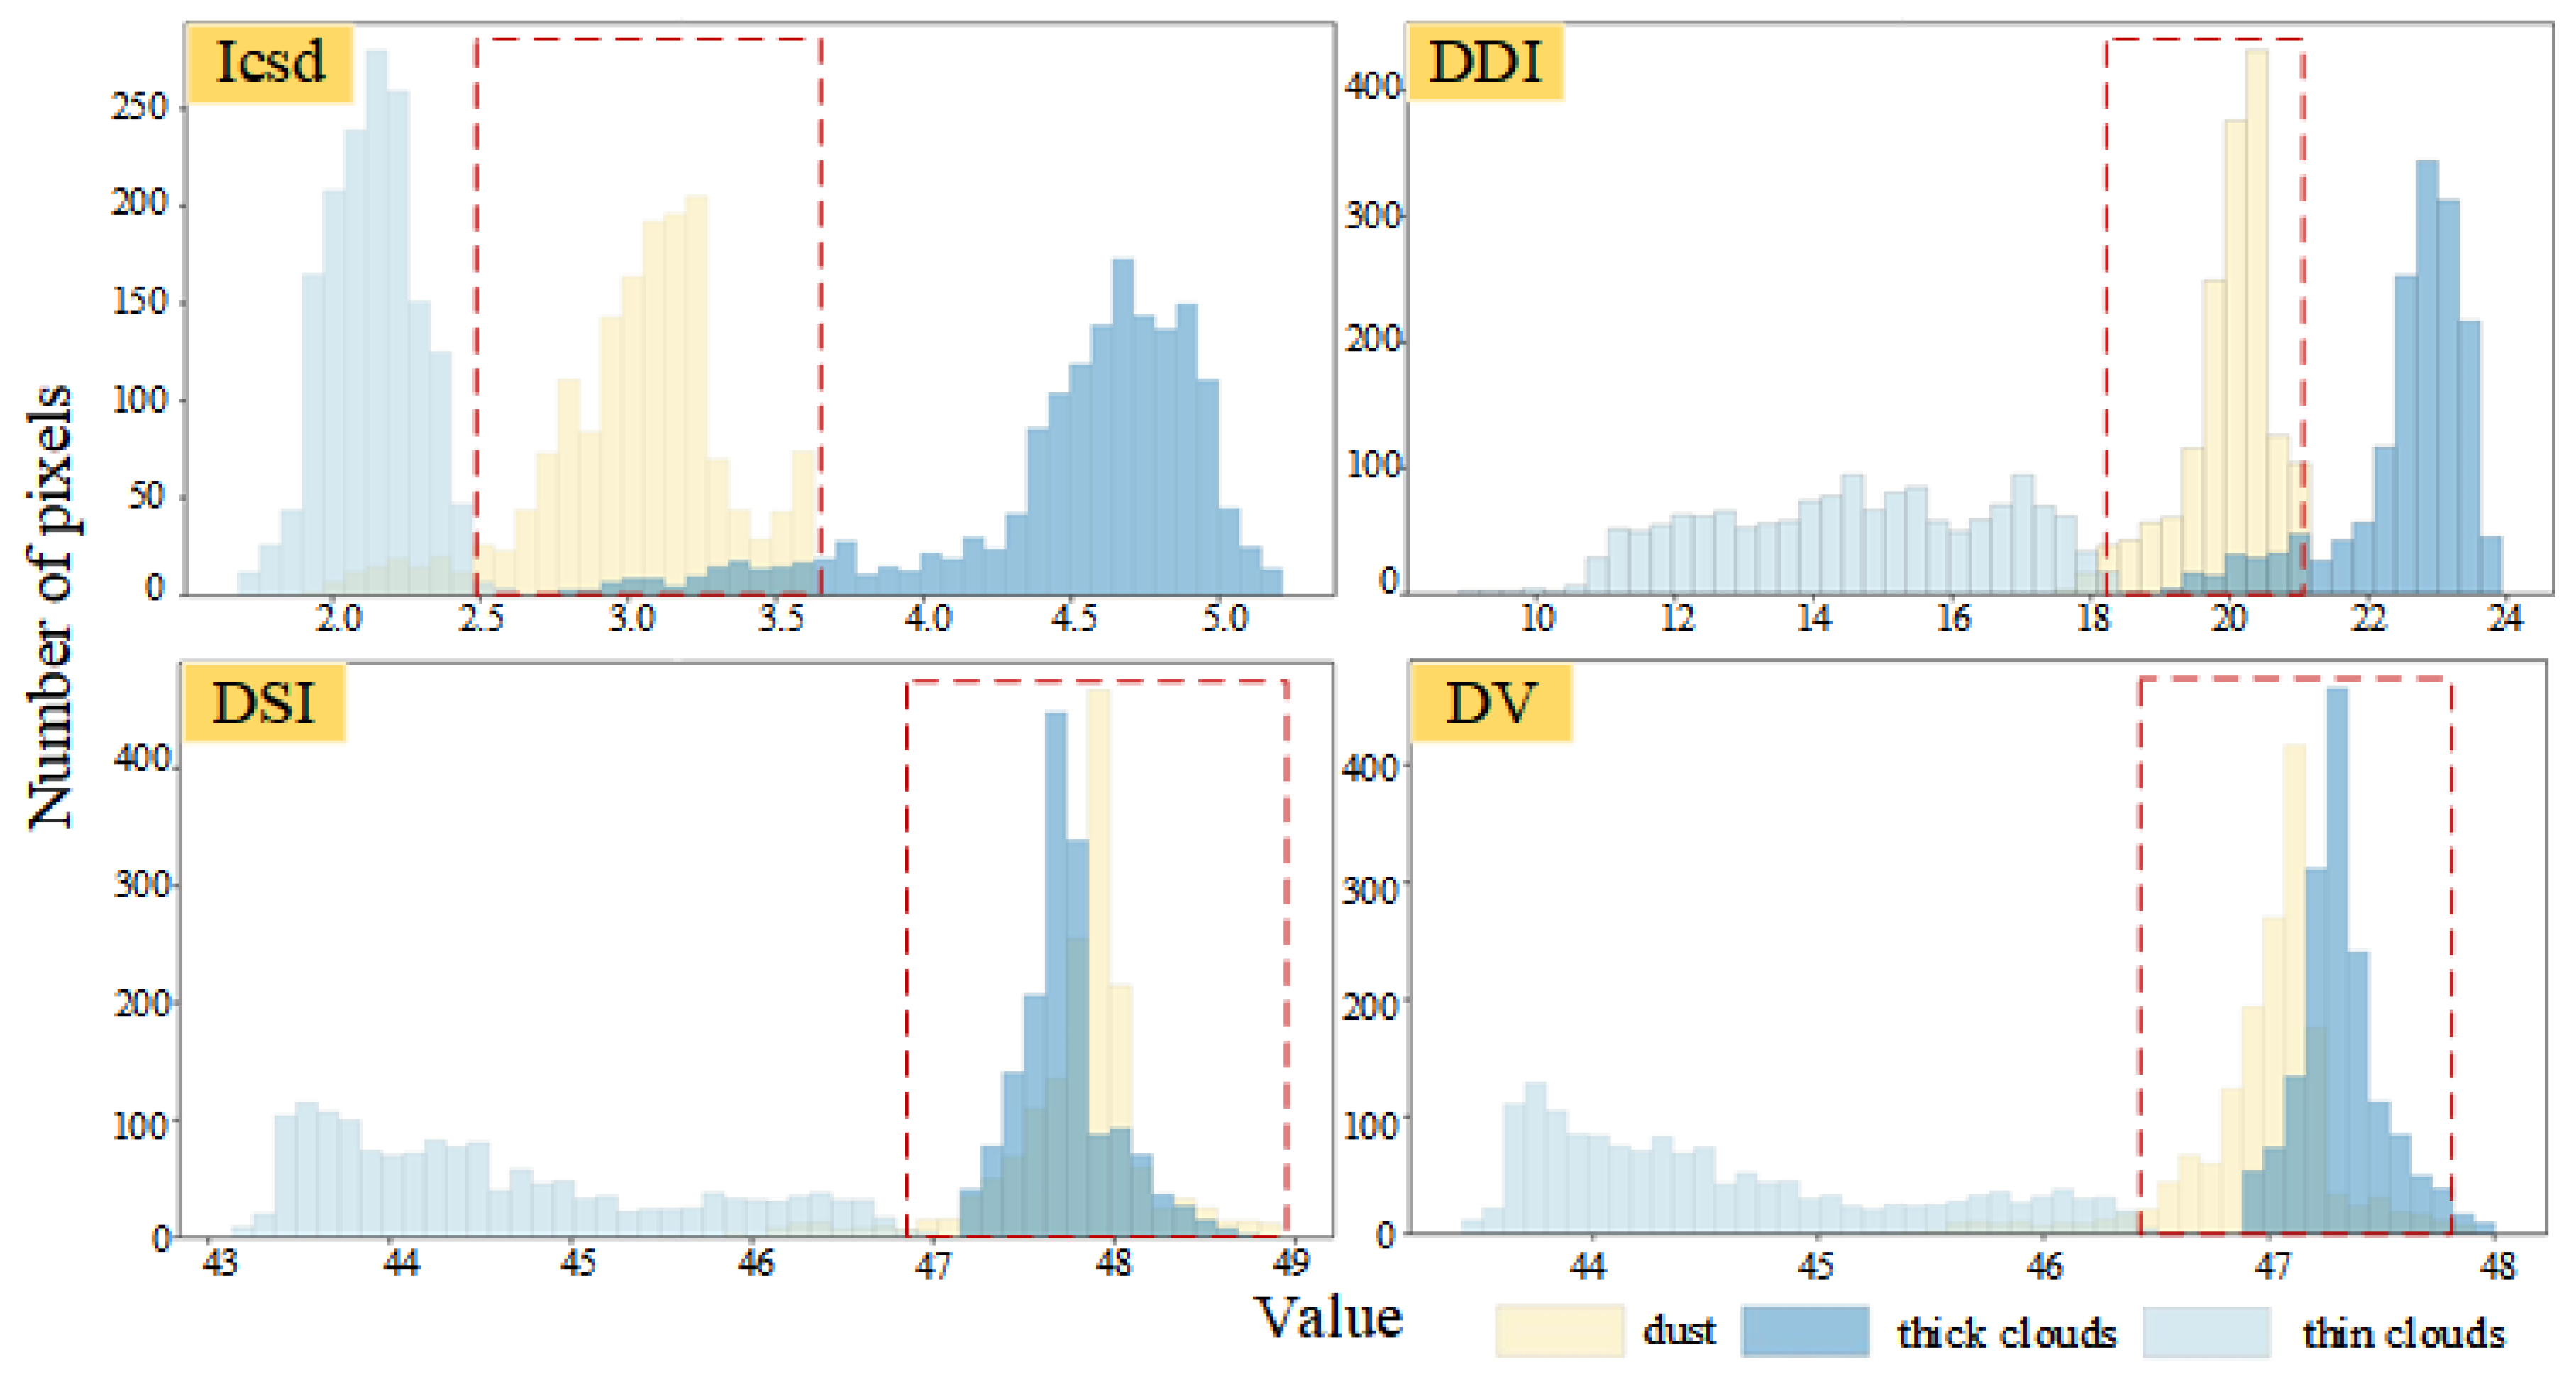
Figure 4.
Dust identification results in the Beijing–Tianjin–Hebei Region.
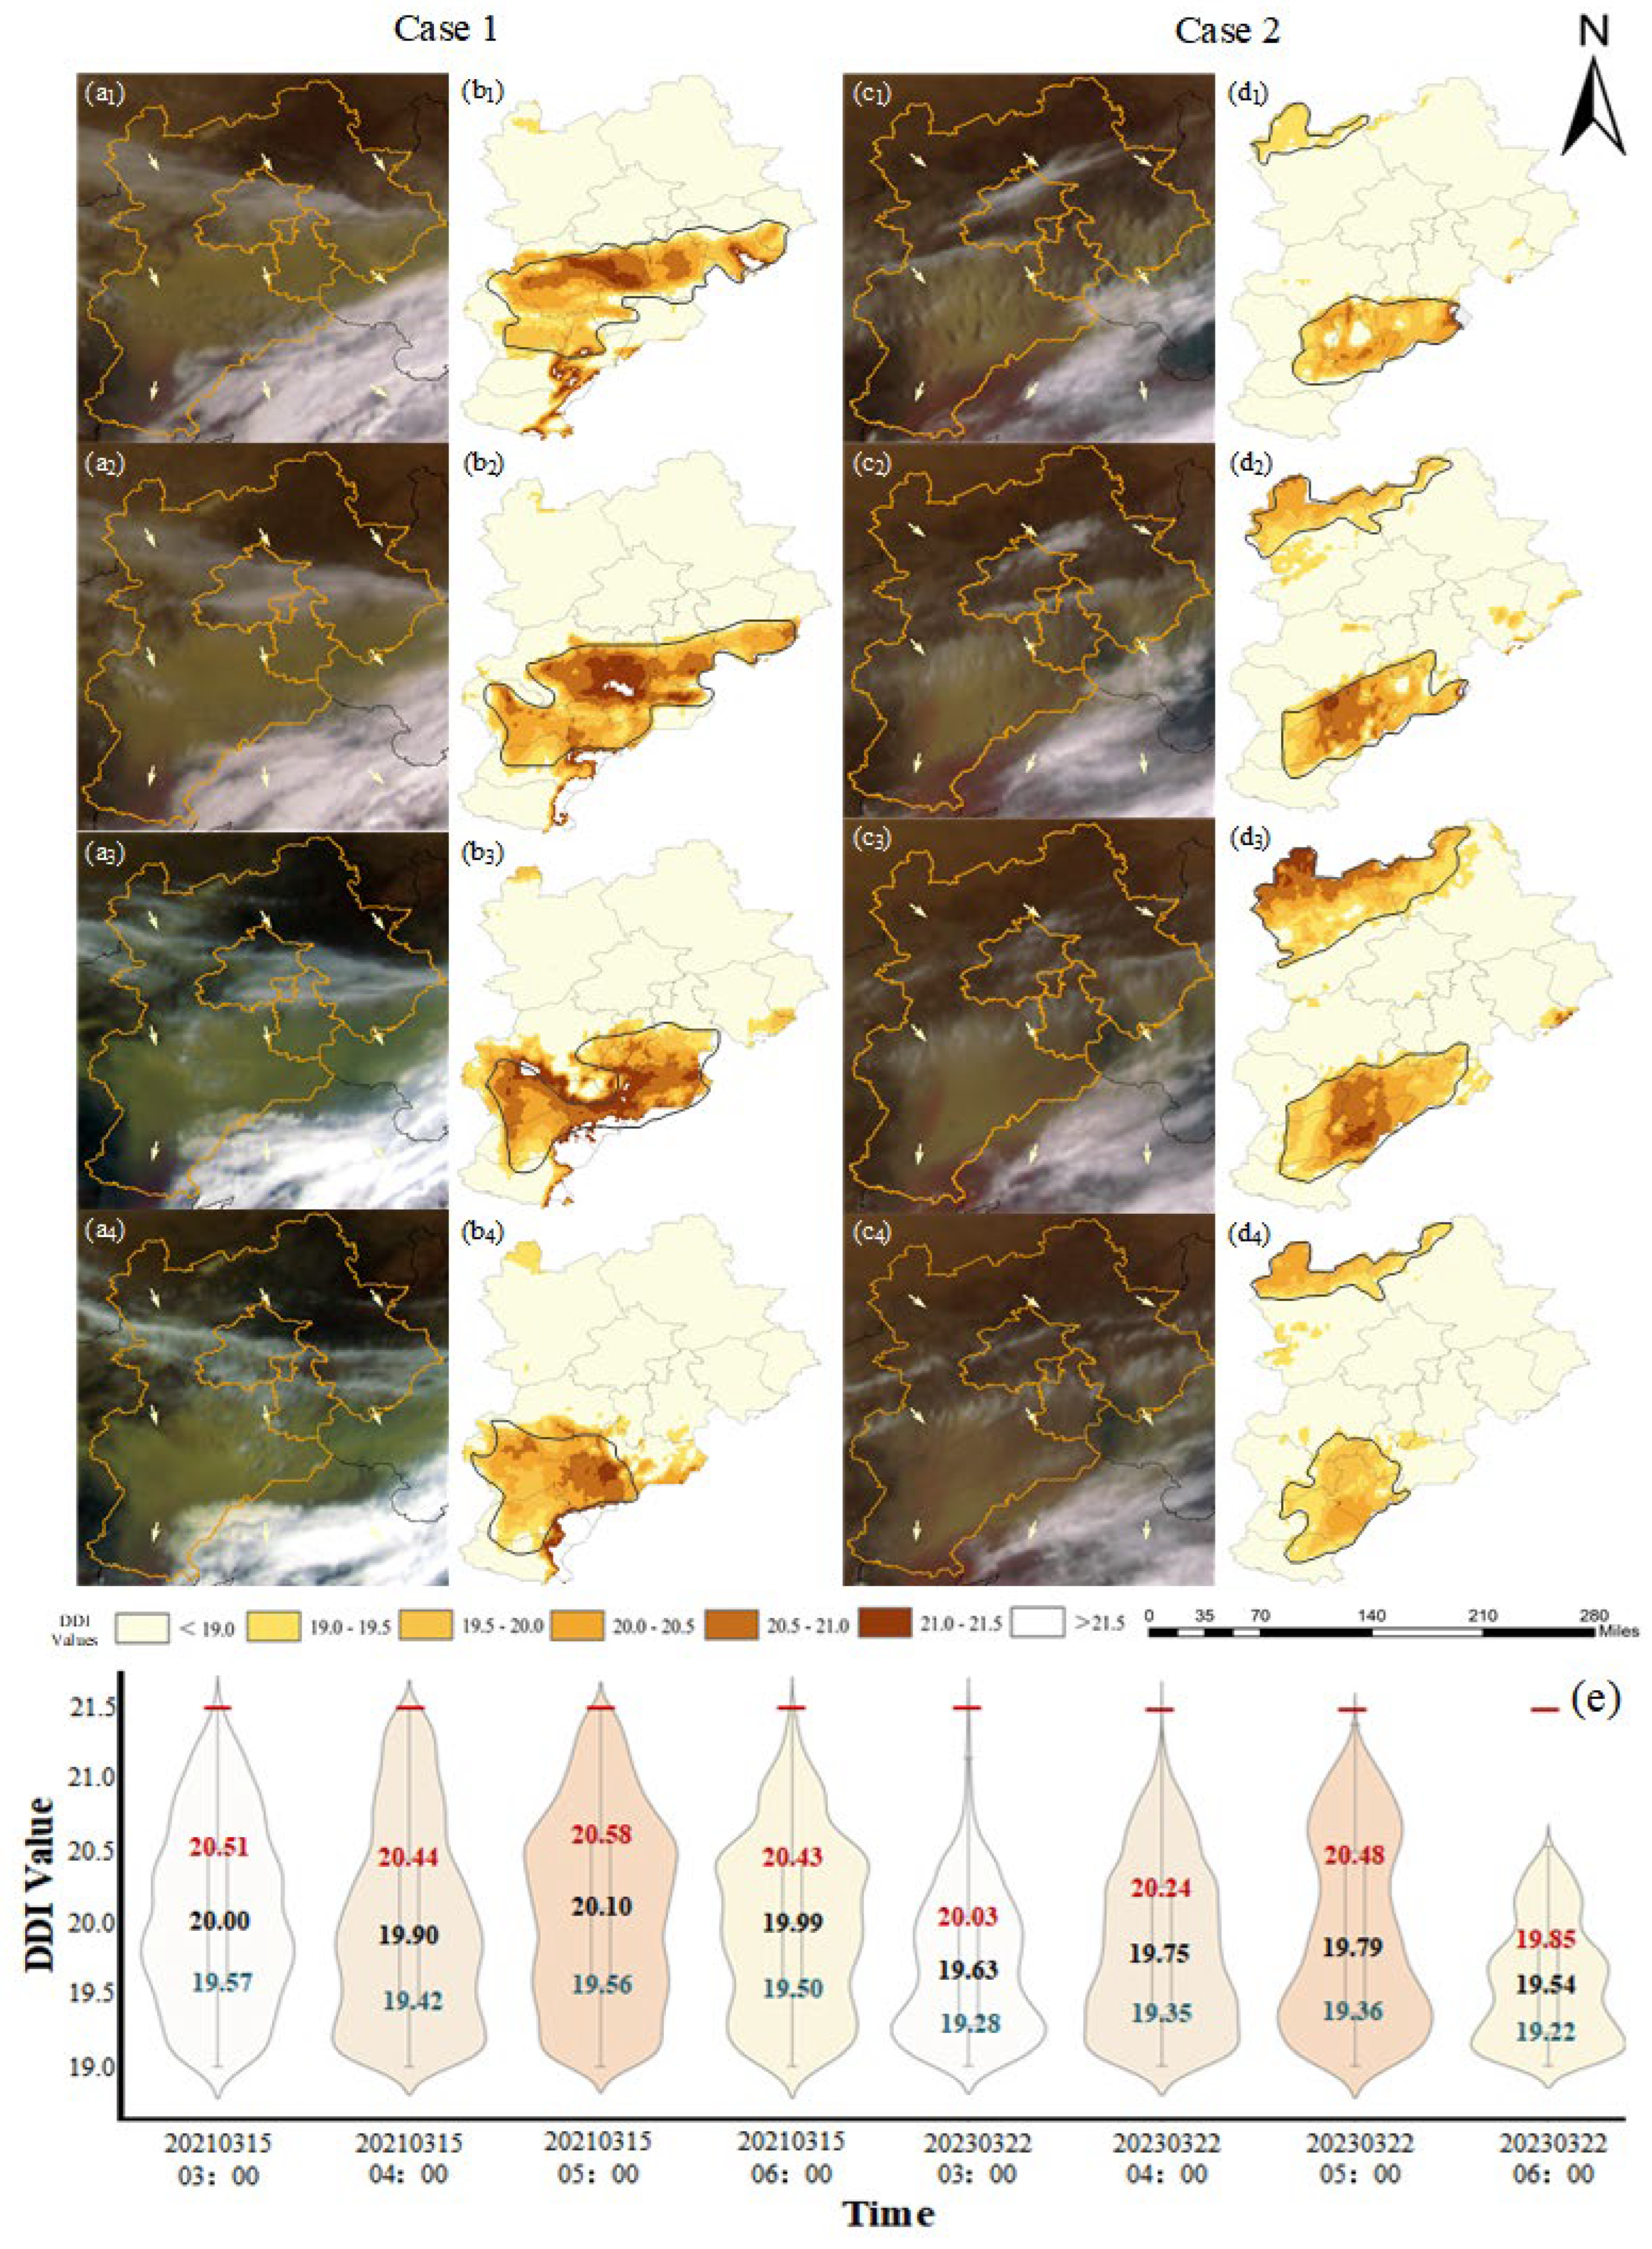
Figure 5.
HYSPLIT backward trajectory simulations and FY-4A true color images for the two dust events: (a) Beijing backward trajectory simulation for March 15, 2021; (c) Beijing backward trajectory simulation for March 22, 2023; (b) FY-4A true color image for March 15, 2021, at UTC 04:00; (d) FY-4A true color image for March 22, 2023, at UTC 04:00.
Figure 5.
HYSPLIT backward trajectory simulations and FY-4A true color images for the two dust events: (a) Beijing backward trajectory simulation for March 15, 2021; (c) Beijing backward trajectory simulation for March 22, 2023; (b) FY-4A true color image for March 15, 2021, at UTC 04:00; (d) FY-4A true color image for March 22, 2023, at UTC 04:00.
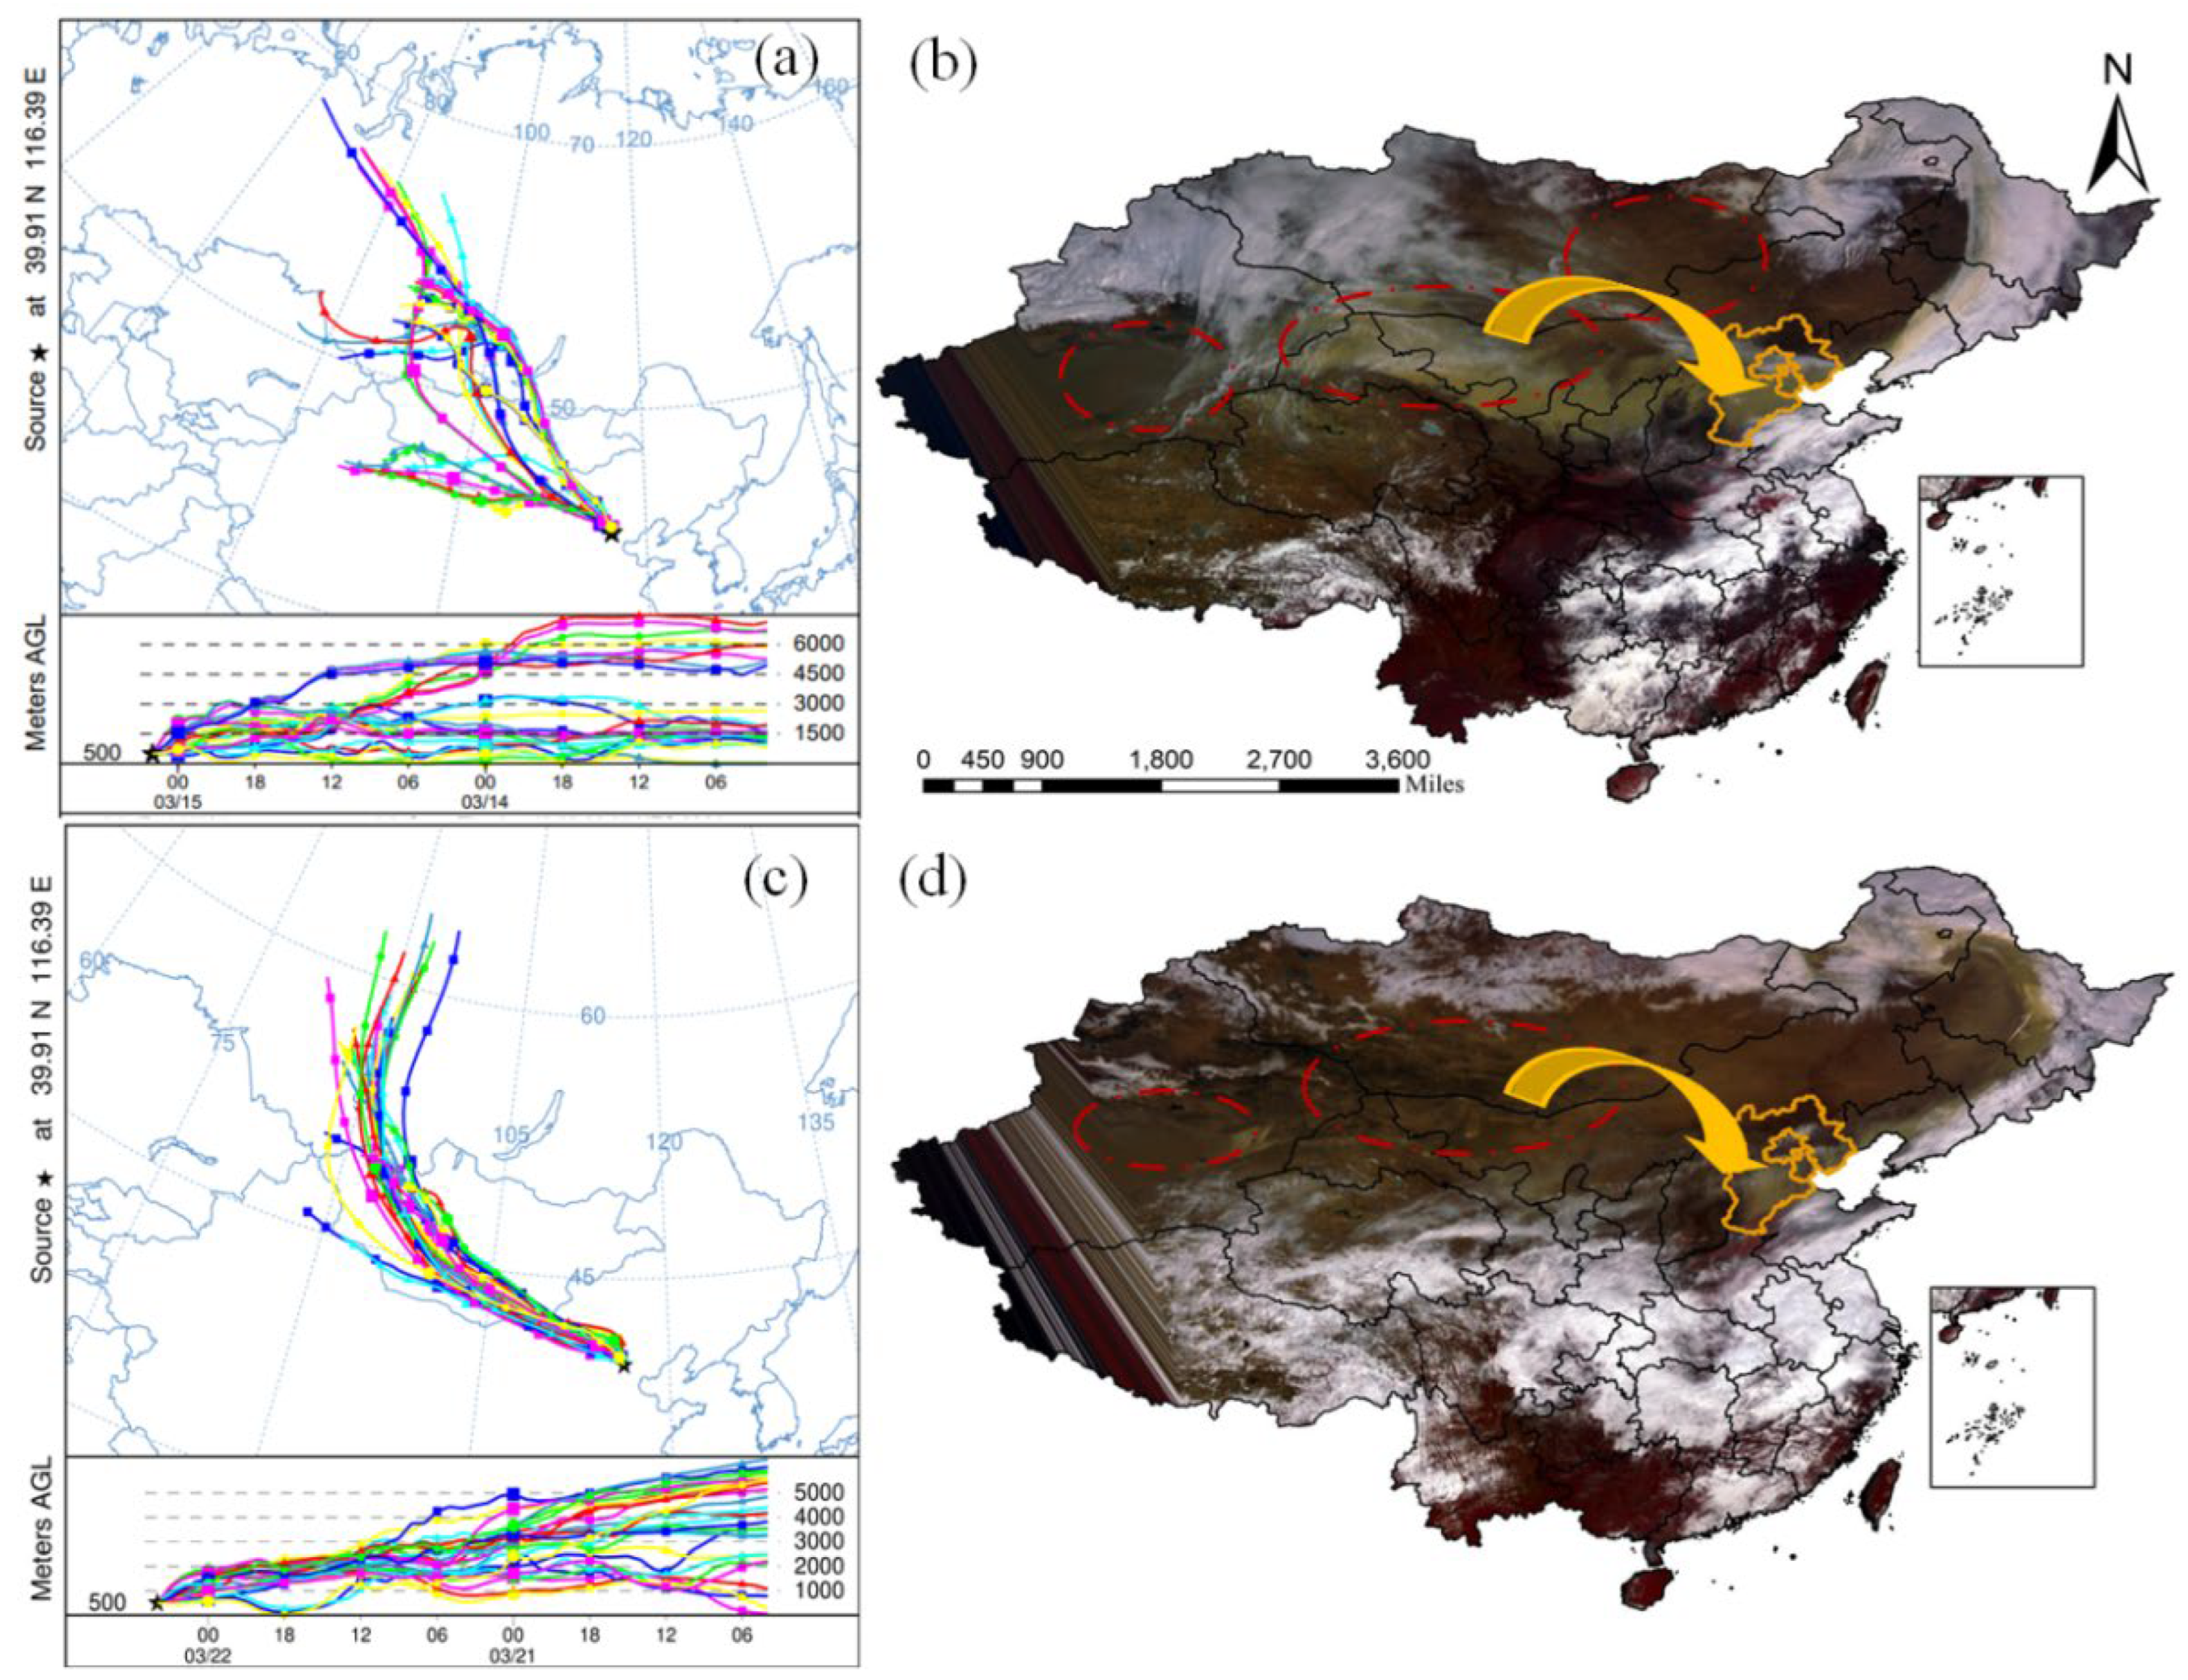
Figure 6.
Vertical distribution characteristics of aerosols and hourly changes in PM10 concentration in the BTH and Inner Mongolia regions. March 15, 2021, BTH and Inner Mongolia regions (a1–a3, b1–b3); March 21, 2023, BTH and Inner Mongolia regions (c1–c3, d1–d3).
Figure 6.
Vertical distribution characteristics of aerosols and hourly changes in PM10 concentration in the BTH and Inner Mongolia regions. March 15, 2021, BTH and Inner Mongolia regions (a1–a3, b1–b3); March 21, 2023, BTH and Inner Mongolia regions (c1–c3, d1–d3).
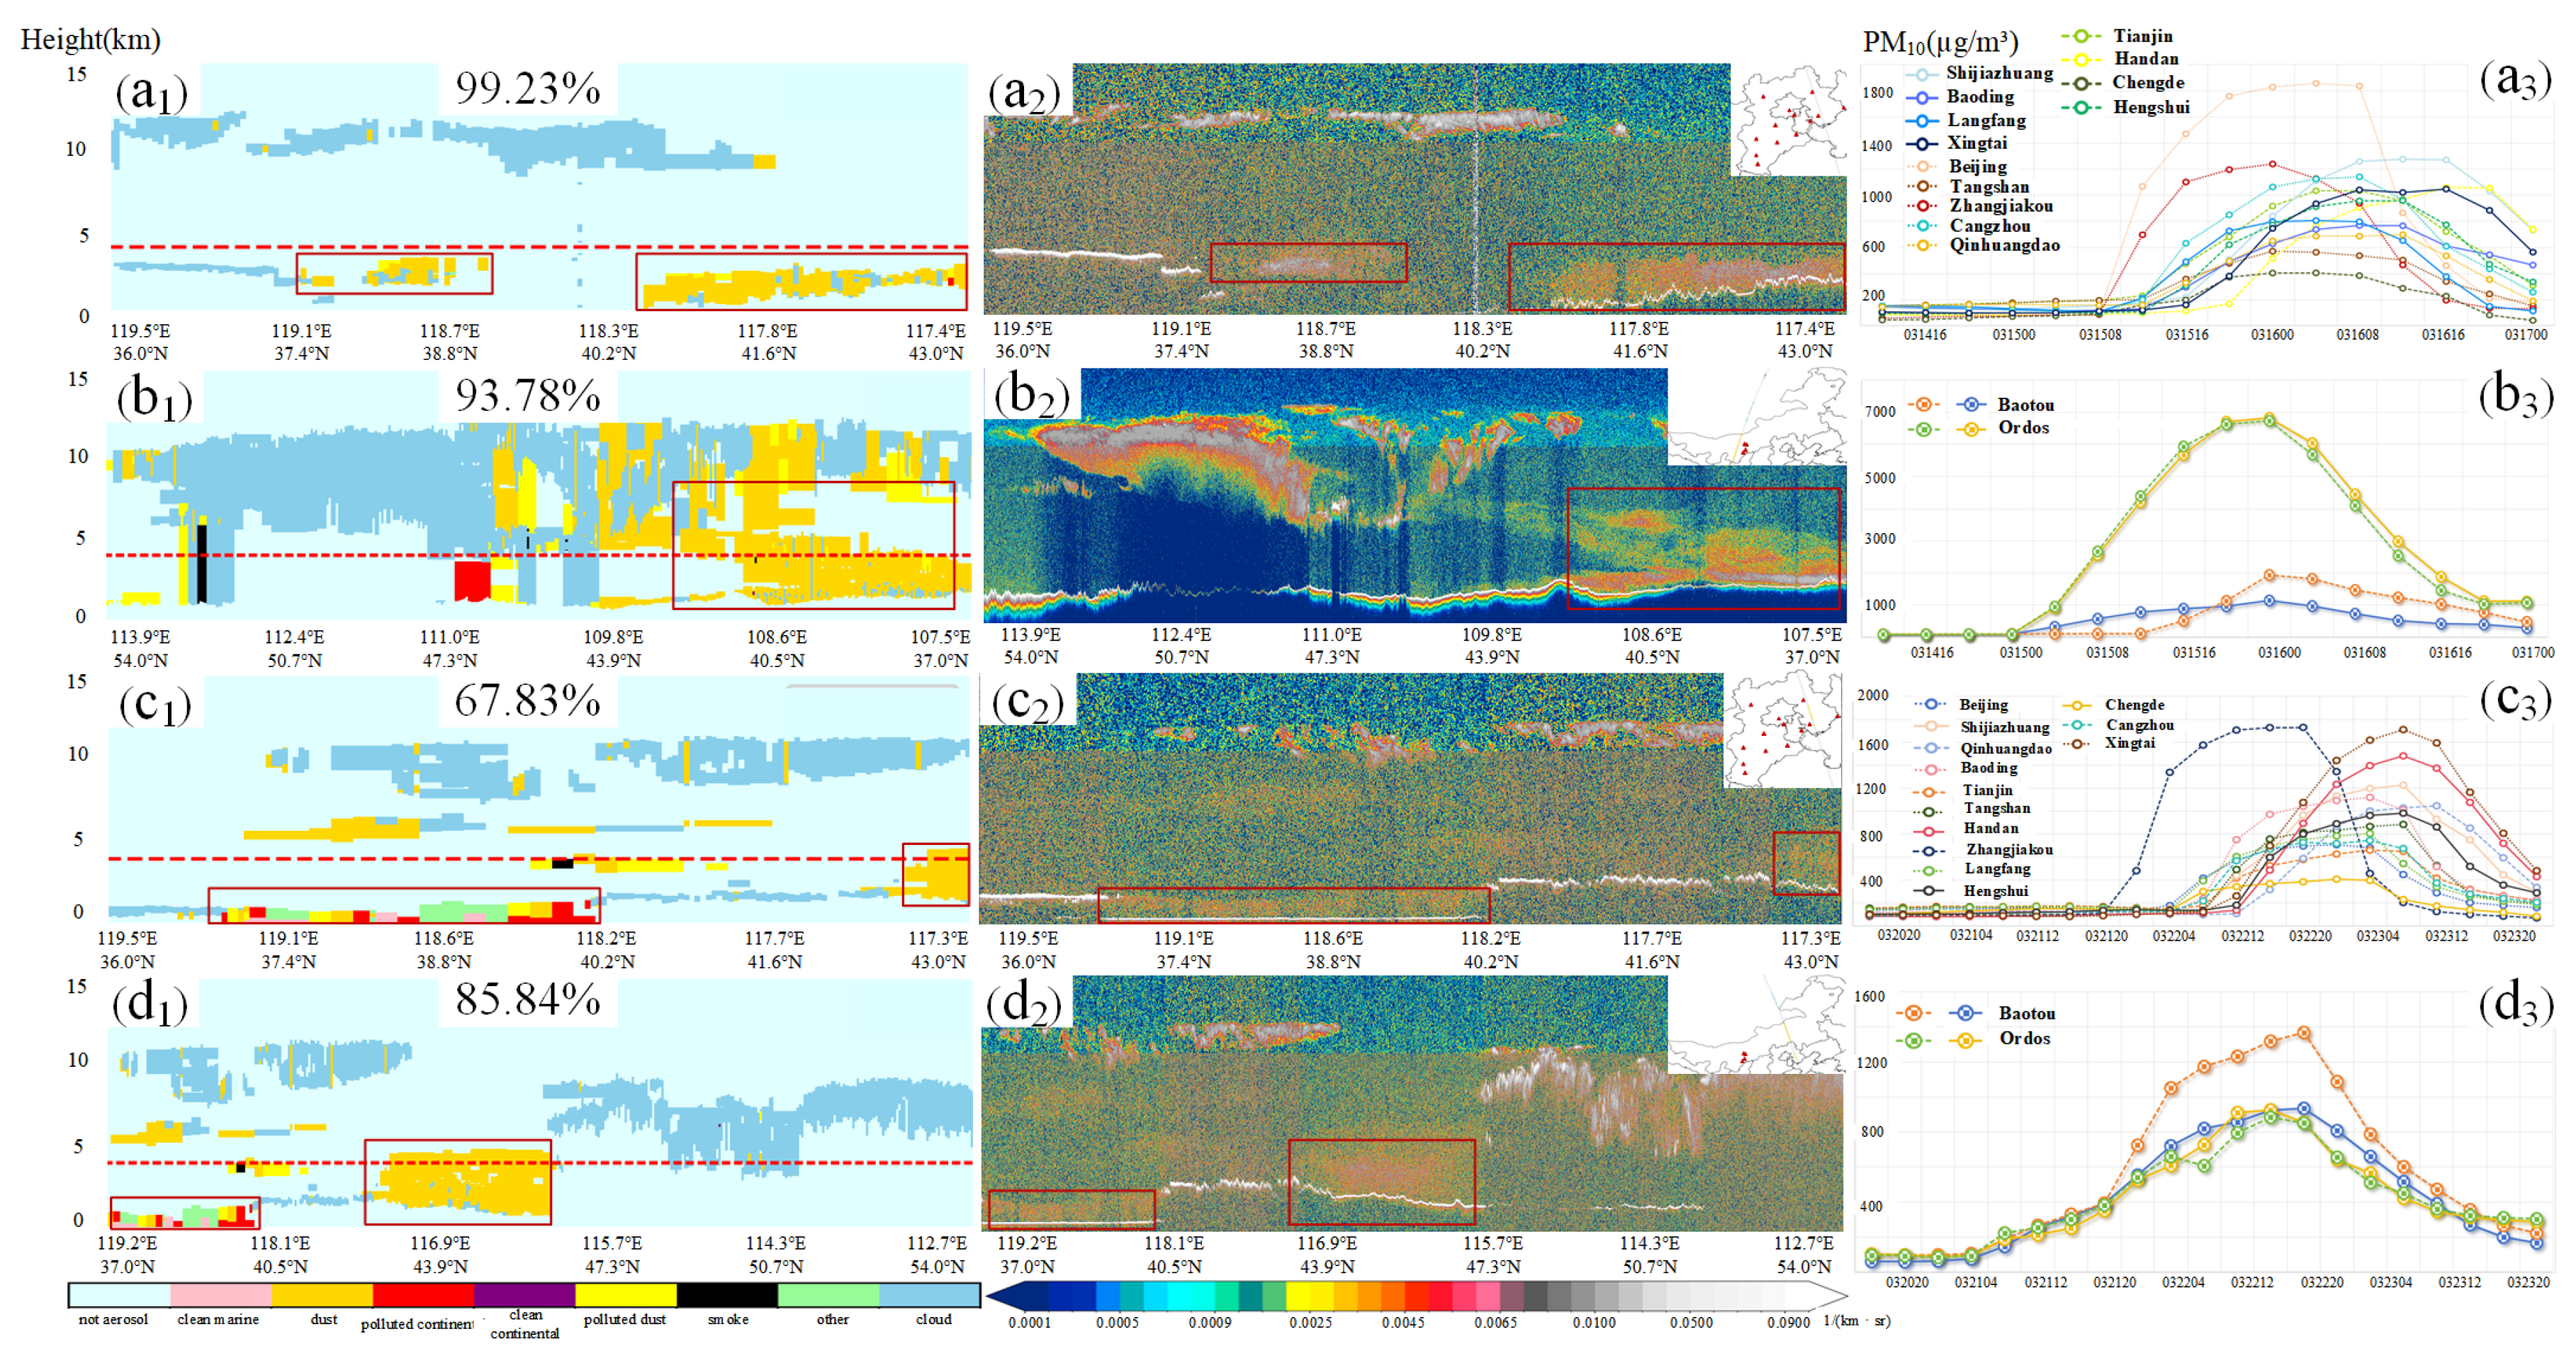

Table 1.
Main channel information of the Fengyun-4A satellite.
| Band | Channel Type | Central Wavelength (µm) |
Spectral bandwidth (µm) |
Spatial resolution (km) |
Primary use |
| 5 | Shortwave IR | 1.61 | 1.58–1.64 | 2 | Identification of low clouds/snow and water/ice clouds |
| 7 | Mid-wave IR | 3.75 | 3.5–4.0 (high) | 2 | Clouds and high albedo targets, fire points |
| 8 | 3.75 | 3.5–4.0 (low) | 4 | Low albedo targets, surface | |
| 11 | Longwave IR | 8.5 | 8.0–9.0 | 4 | Total water vapor, clouds |
| 12 | 10.7 | 10.3–11.3 | 4 | Clouds, surface temperature | |
| 13 | 12.0 | 11.5–12.5 | 4 | Clouds, total water vapor, surface temperature |
Table 2.
Accuracy verification results of Icsd and DDI dust intensity indices.
| Index | UTC | TP | FN | FP | POCD | POFD |
| Icsd | 02:00 | 2,509 | 194 | 2,421 | 92.82% | 49.11% |
| 03:00 | 4,083 | 333 | 2,537 | 92.46% | 38.32% | |
| 04:00 | 4,860 | 249 | 2,488 | 95.13% | 33.86% | |
| 05:00 | 4,025 | 763 | 1,672 | 84.06% | 29.35% | |
| 06:00 | 2,619 | 435 | 1,662 | 85.76% | 38.82% | |
| Index | UTC | TP | FN | FP | POCD | POFD |
| DDI | 02:00 | 2,391 | 312 | 1,795 | 88.46% | 42.88% |
| 03:00 | 4,118 | 298 | 1,236 | 93.25% | 23.09% | |
| 04:00 | 4,720 | 389 | 626 | 92.39% | 11.71% | |
| 05:00 | 4,458 | 330 | 776 | 93.11% | 14.83% | |
| 06:00 | 2,936 | 118 | 1,282 | 96.14% | 30.39% |
Disclaimer/Publisher’s Note: The statements, opinions and data contained in all publications are solely those of the individual author(s) and contributor(s) and not of MDPI and/or the editor(s). MDPI and/or the editor(s) disclaim responsibility for any injury to people or property resulting from any ideas, methods, instructions or products referred to in the content. |
© 2024 by the authors. Licensee MDPI, Basel, Switzerland. This article is an open access article distributed under the terms and conditions of the Creative Commons Attribution (CC BY) license (http://creativecommons.org/licenses/by/4.0/).
Copyright: This open access article is published under a Creative Commons CC BY 4.0 license, which permit the free download, distribution, and reuse, provided that the author and preprint are cited in any reuse.