Submitted:
10 September 2024
Posted:
11 September 2024
You are already at the latest version
Preprints on COVID-19 and SARS-CoV-2
Abstract
A prospective clinical-epidemiological study was conducted to evaluate the dynamics of biomarkers in hospitalized patients with moderate to severe COVID-19 (according to the National Institute of Health severity scale) treated with Anakinra, compared to those receiving standard treatment. The study included 65 patients with a mean age of 75.51±9.54 years, ranging from 44 to 99 years. Among the study participants, 38 (58.5%) were male and 27 (41.5%) were female. The patients were divided into two groups: control group (standard treatment): 24 patients (36.9%) and target group (Anakinra treatment): 41 patients (63.1%). The results showed a significant relationship between the dynamics of leukocytes, ASAT, LDH, D-dimer, ferritin, and IL-6 and the administration of Anakinra. In the control group, no significant dynamics were observed in leukocyte count, D-dimer, ferritin, or IL-6. A statistically significant decrease in ASAT and LDH values in the control group was noted only on Day 7. In the Anakinra group, significantly (or with borderline statistical significance, p<0.1) lower mean values were observed for leukocytes, NLR, D-dimer, ferritin, and IL-6 on Days 3 and 7 compared to the control group. Additionally, significantly lower CRP values were detected in the Anakinra group on Day 7 compared to the control group.
Keywords:
COVID-19
; hyperinflammation
; treatment evaluation
; IL-1 receptor antagonist
1. Introduction
The SARS-CoV-2 pandemic posed a significant challenge to the medical community. Although the infection typically leads to mild to moderate disease, with viral replication generally confined to the upper respiratory tract, severe to critical illness can sometimes develop. These clinical forms of disease often manifest as pneumonia, respiratory failure, and multiple organ failure. These forms typically develop about a week after the initial symptoms, with dyspnea being one of the most observed clinical manifestations, resulting from hypoxemia [1,2], followed by the progression to respiratory failure. Numerous studies have demonstrated the significance of dysregulated immune processes due to SARS-CoV-2 infection in the developing severe and critical COVID-19. The hyperactivation of immune cells (macrophages, NK cells, B and T lymphocytes) leads to abnormal systemic inflammation, with cytokine release syndrome (CRS), which has been identified as a pathogenic mechanism in the progression of severe COVID-19 [3,4,5,6].
Additionally, macrophage activation syndrome (MAS) has been observed, commonly seen in autoimmune and malignant diseases [7,8,9,10,11], as well as in sepsis. This syndrome is characterized by the hyperactivation of tissue macrophages and the overproduction of inflammatory cytokines, such as IL-1, IL-6, and IL-8, and elevated levels of markers of inflammation- C-reactive protein (CRP), ferritin, and coagulation disorders- D-dimer [12,13,14,15,16,17,18,19,20,21]. Dysregulation in immune function is also reflected in leucocytes number, showing leukocytosis, lymphopenia, and an increased neutrophil-to-lymphocyte ratio (NLR) [22,23], with a correlation established between lymphopenia and an elevated NLR on one side, and the severity of COVID-19 on the other. Numerous studies have been conducted on the dynamics of various biomarkers throughout SARS-CoV-2 infection. Changes in specific biomarkers have been identified as strong indicators of the degree of immune dysfunction, and the severity of infection, and have high prognostic value for the outcome of the disease. These include elevated ferritin levels (a result of macrophage activation), increased NLR, elevated levels of aspartate aminotransferase (ASAT) and lactate dehydrogenase (LDH), indicative of liver involvement, increased D-dimer due to coagulation abnormalities, and elevated CRP and IL-6, indicative of hyperinflammation [24,25,26,27,28].
The dysregulation of immune function in severe and critical clinical forms of COVID-19 provides a rationale for including medications in the treatment regimen that modulate the immune response through various mechanisms.
In 2021, the European Medicines Agency (EMA), and in 2022, the U.S. Food and Drug Administration (FDA) approved the use of Anakinra for COVID-19 [29,30,31]. Anakinra is a recombinant human IL-1 receptor antagonist that binds to IL-1α and IL-1β receptors. Studies have demonstrated a connection between the early initiation of Anakinra therapy in hospitalized COVID-19 patients and the positive dynamics of examined biomarkers, including the reduction of CRP, ferritin, D-dimer, and NLR [32,33,34,35,36,37].
Considering the above, a study was conducted to evaluate the dynamics of biomarkers in the treatment of hospitalized patients with moderate to severe COVID-19 using Anakinra, compared to those receiving standard care.
2. Materials and Methods
2.1. Study Population
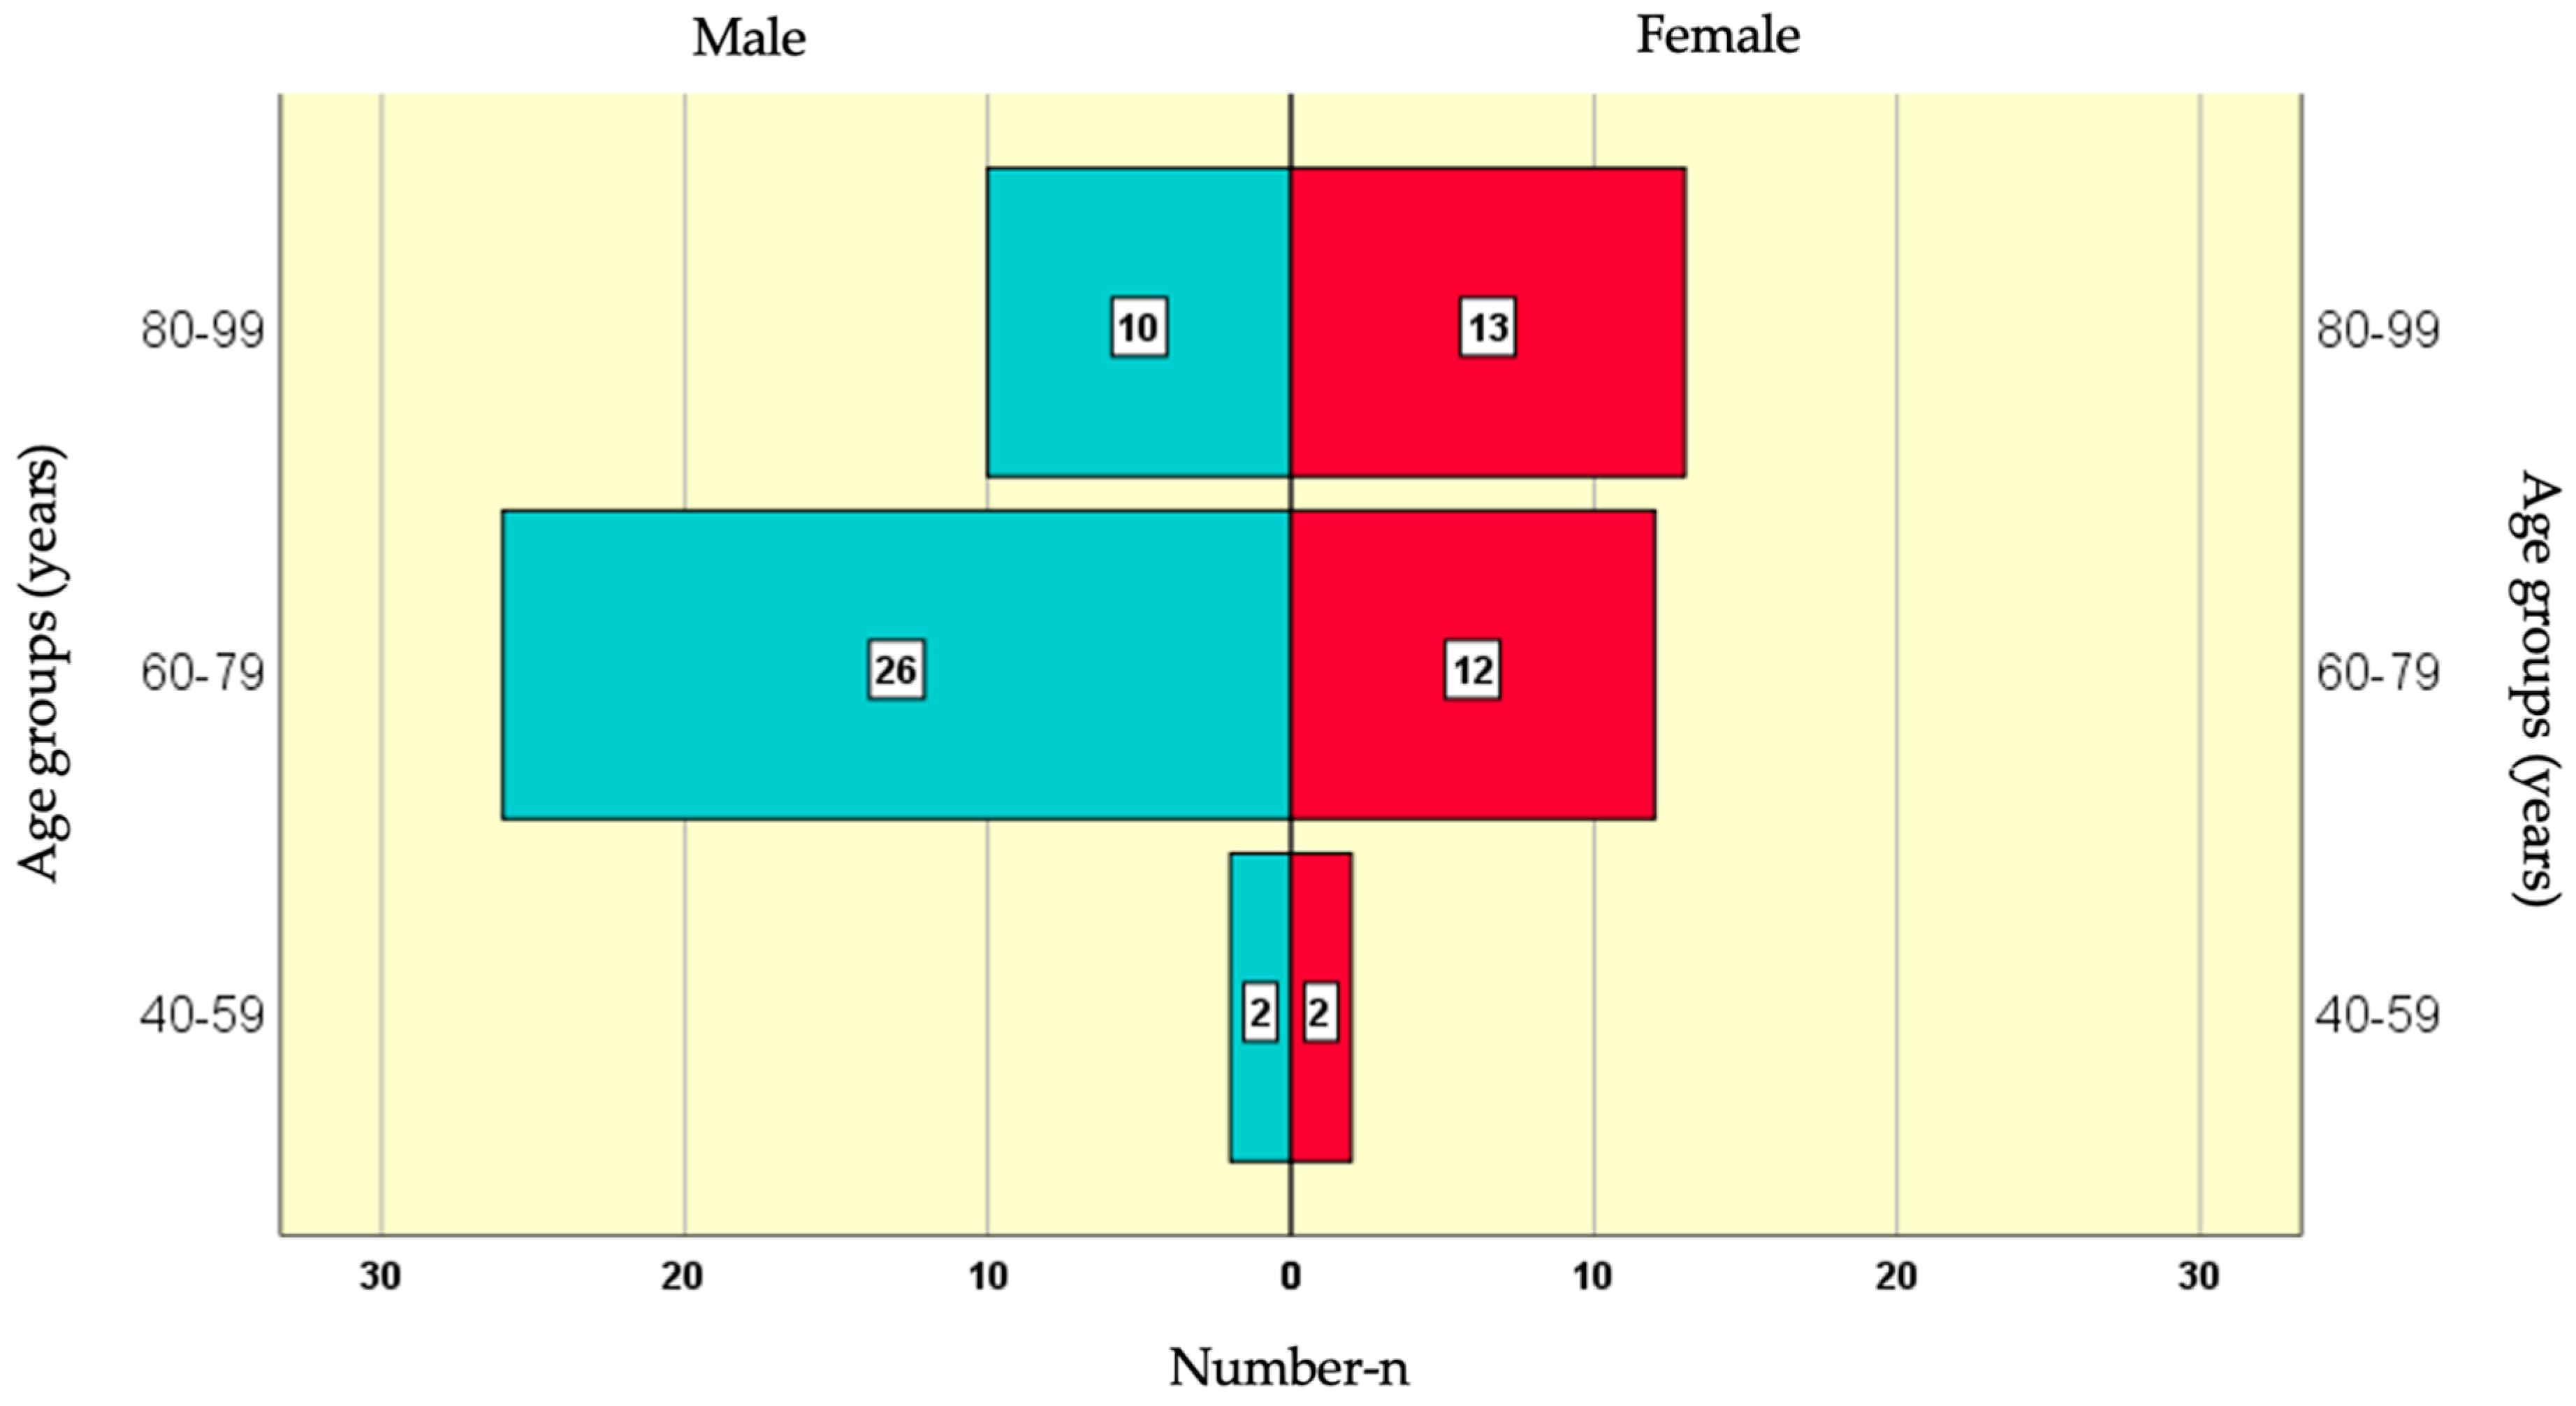
A prospective clinical-epidemiological study was conducted, involving 65 patients with moderate to severe clinical forms of SARS-CoV-2 infection (according to the National Institute of Health NIH severity scale) who were hospitalized at the Specialized Hospital for Active Treatment of Infectious and Parasitic Diseases "Prof. Ivan Kirov", Sofia with COVID-19 during the period from November 2022 to November 2023. The average age of the study population was 75.51±9.54 years, ranging from 44 to 99 years. Among the participants in the study sample, 38 (58.5%) were men and 27 (41.5%) were women.
The age group with the highest number of male participants (26) was 60-79 years, followed by 80-99 years with 10 participants, and the smallest group (2) was 40-59 years. Among female participants, the largest age group (13) was 80-99 years, followed by 60-79 years with 12 participants, and the smallest group (2) was 40-59 years (Figure 1).
For this study, the patients were divided into two groups:
Control Group (Standard treatment)- n=24 (36.9%)
Target Group (Anakinra treatment) - n=41 (63.1%)
General Characteristics of the Groups
The two study groups were statistically balanced regarding the key confounding factors of gender and age, which is a strong basis for the accuracy of subsequent comparisons. The control and target groups did not show statistical differences in the following variables: antibiotic treatment, dexamethasone administration, clinical form, 28-day survival rate, and duration of hospitalization.
2.2. Specimen Sampling and Biomarker Measurement
The diagnosis of COVID-19 was etiologically confirmed by qualitatively detecting the genetic material of SARS-CoV-2 in samples taken from epithelial cells of the upper respiratory tract (nasopharyngeal swabs). A multiplex qualitative RT-PCR (Real-Time Polymerase Chain Reaction) analysis was used to detect the viral RNA (SARS-CoV-2 RNA).
The PCR diagnostic system for SARS-CoV-2 contains specific oligonucleotide primers, fluorescently labeled probes targeting specific regions of the viral genes, and the matrix RNA (mRNA) of human ribonuclease P. The system also included the reverse transcriptase enzyme (DNA polymerase), a human ribonuclease inhibitor, free deoxynucleotides (dNTPs), and a positive control. The reaction proceeded through the following steps: 1. Extraction of viral RNA 2. Reverse transcription of complementary DNA 3. Amplification of specific sections of complementary DNA using specific oligonucleotide primers, the reverse transcriptase enzyme, and free deoxynucleotides as building blocks of complementary DNA. 4. Visualization of the PCR products (amplicons).
The PCR diagnostic system simultaneously detected three different regions of the SARS-CoV-2 viral genome: the Nucleocapsid gene (N), the Envelope gene (E), and the RNA-dependent RNA polymerase gene (RdRP), as well as the matrix RNA (mRNA) of human ribonuclease P (RNase P). The detection of RNase P mRNA was an internal control to monitor the RNA extraction and amplification processes, reducing false-negative results.
In addition to the internal control, the Real-Time RT-PCR reaction included positive and negative controls. For each target gene, the reaction was considered positive if the fluorescence curve for the corresponding gene crossed the threshold line by the 40th cycle (Ct < 40). The result was considered positive if at least two of the three SARS-CoV-2 genes tested positive. If only one of the three target genes was positive, the result was considered indeterminate, and a new test was required.

Table 1.
PCR result interpretation.
| N gene | E gene | RdRP gene | RNase P gene (internal control) |
Result |
|---|---|---|---|---|
| One of the three SARS-CoV-2 target genes is positive | + / - | Indeterminate | ||
| Two or three SARS-CoV-2 genes are positive | + /- | Positive | ||
| - | - | - | + | Negative |
| - | - | - | - | Invalid |
The analysis was conducted using the Tianlong® Real-Time PCR System. Reagents from the SOLIScript® SARS-CoV-2 RT-qPCR Multiplex Assay by Solis BioDyne were used for the RT-PCR analysis of SARS-CoV-2 RNA. These reagents comply with ISO 9001 and ISO 13485 standards.
For the patients included in the study, hematological (WBC, NLR), biochemical (CRP, ASAT, LDH, ferritin), coagulation (D-dimer), and immunological (IL-6) parameters were measured on days 1, 3, and 7.
Blood samples for testing the parameters in blood and serum were collected using vacutainer tubes—closed vacuum tubes. Hematological parameters (WBC, neutrophils, lymphocytes) were determined using the automated hematology analyzer Arcus 380. Whole blood collected with EDTA anticoagulant was used for this analysis. For biochemical (CRP, ASAT, LDH, ferritin) and immunological (IL-6) parameter measurements, vacutainer tubes with a clot activator, which accelerates the blood clotting process and separates serum needed for the analysis, were used. The analyses were conducted on the Selectra pro S automated biochemical analyzer, while IL-6 was measured using the Cobas e 411 automated analyzer. Plasma was used as the sample material for D-dimer testing. Vacutainer tubes containing sodium citrate were used, and the testing was performed on the Finecare Fia Meter Wondfo.
The measurements of hematological parameters (WBC, neutrophils, lymphocytes) and biochemical parameters (CRP, ASAT, LDH, ferritin, and D-dimer) were conducted immediately after sample collection. Following centrifugation of the blood samples, the separated sera for IL-6 measurement were stored at -80°C until analysis.
2.3. Statistical Methods
Data were entered and processed using the statistical software packages IBM SPSS Statistics 25.0, MedCalc Version 19.6.3, and Excel Office 2021. Differences with p-values less than 0.05 were considered statistically significant.
The following statistical methods were applied: descriptive analysis – frequency distribution of the observed variables was presented in tabular form; graphical analysis was used for visualizing the obtained results; Comparison of Relative Shares; Fisher’s Exact Test, Fisher-Freeman-Halton Exact Test and Chi-square χ2 for testing hypothesis for dependency between categorical variables; Kolmogorov-Smirnov and Shapiro-Wilk Nonparametric Tests were used to test the normality of distributions. Student’s T-Test for testing hypotheses regarding the differences between the means of two independent samples; Mann-Whitney Nonparametric Test was used for testing hypotheses regarding the differences between two independent samples; Repeated measures ANOVA – analysis of variance to compare arithmetic averages in multiple comparisons; Mauchly’s Test was performed to check the assumptions of sphericity in repeated measures ANOVA; Friedman Nonparametric Test for testing hypotheses regarding differences between multiple dependent samples; Wilcoxon Nonparametric Test for testing hypotheses regarding differences between two dependent samples.
3. Results
This section may be divided by subheadings. It should provide a concise and precise description of the experimental results, their interpretation, as well as the experimental conclusions that can be drawn.
In the following Table 2, Table 3, Table 4, Table 5, Table 6, Table 7, Table 8, Table 9, Table 10, Table 11, Table 12, Table 13, Table 14, Table 15, Table 16 and Table 17, the grey color highlights the differences between measurements taken on Day 3 and Day 7 compared to the baseline values (both in absolute terms and percentages) where the dynamics are statistically significant. The yellow color indicates higher values in comparisons between male and female groups, as well as across different age groups.
3.1. Dynamics of WBC
Table 2.
Dynamics of WBC by Gender and Age in the Control Group.
| Indicator | Group | n | Day of the examination | |||||
|---|---|---|---|---|---|---|---|---|
| 1 | 3 | 7 | ||||||
 |
SD | |
SD | |
SD | |||
| Total | 24 | 7.92a | 4.23 | 8.26a | 3.69 | 8.60a | 4.34 | |
| Difference | (absolute) | 0.34 | 3.06 | 0.68 | 4.01 | |||
| Difference | % | 21.4 | 92.4 | 27.4 | 102.2 | |||
| Male | 15 | 8.10a | 4.04 | 8.29a | 4.04 | 8.91a | 4.81 | |
| Difference | (absolute) | 0.18 | 1.35 | 0.81 | 2.42 | |||
| Difference | % | 4.3 | 15.1 | 11.4 | 29.7 | |||
| Female | 9 | 7.61a | 4.77 | 8.21a | 3.26 | 8.06a | 3.63 | |
| Difference | (absolute) | 0.60 | 4.85 | 0.45 | 5.99 | |||
| Difference | % | 50.0 | 150.6 | 54.0 | 165.0 | |||
| P= | 0.428 | 0.815 | 0.861 | |||||
| Age Group | 60 – 79 | 13 | 7.86a | 4.19 | 8.11a | 4.26 | 8.42a | 4.42 |
| Difference | (absolute) | 0.25 | 1.45 | 0.56 | 2.19 | |||
| Difference | % | 5.4 | 17.0 | 11.0 | 30.6 | |||
| Age Group | 80 – 99 | 9 | 8.71a | 4.68 | 9.06a | 3.03 | 9.36a | 4.75 |
| Difference | (absolute) | 0.35 | 4.86 | 0.65 | 6.22 | |||
| Difference | % | 45.3 | 151.8 | 50.1 | 166.1 | |||
| P= | 0.662 | 0.292 | 0.695 | |||||
* - Identical letters across the horizontal rows indicate no statistically significant difference, while different letters indicate the presence of a statistically significant difference (p<0.05). ** - Changes are measured on Day 3 and Day 7, compared to the baseline values on Day 1.
3.1.1. Dynamics of WBC in the Control Group
No statistically significant dynamic changes in WBC values were observed for the entire sample, nor in the subgroups formed based on gender and age. Additionally, no statistically significant differences were observed between the subgroups at any of the three control time points (Table 2).
Table 3.
Dynamics of WBC by Gender and Age in the Target Group.
| Indicator | Group | n | Day of the examination | |||||
|---|---|---|---|---|---|---|---|---|
| 1 | 3 | 7 | ||||||
|
SD | |
SD | |
SD | |||
| Total | 41 | 7.23a | 3,.9 | 5.69bc | 2.80 | 6.02ac | 2.35 | |
| Difference | (absolute) | -1.53 | 3.28 | -1.21 | 3.87 | |||
| Difference | % | -14.9 | 38.5 | -5.2 | 44.6 | |||
| Male | 23 | 7.39a | 3.64 | 5.65bc | 3.19 | 5.93ac | 2.47 | |
| Difference | (absolute) | -1.74 | 3.69 | -1.46 | 4.20 | |||
| Difference | % | -18.8 | 39.2 | -9.5 | 40.7 | |||
| Female | 18 | 7.02a | 2.86 | 5.75a | 2.29 | 6.13a | 2.27 | |
| Difference | (absolute) | -1.27 | 2.74 | -0.88 | 3.51 | |||
| Difference | % | -9.8 | 38.1 | 0.3 | 49.8 | |||
| P= | 0.813 | 0.478 | 0.655 | |||||
| Age Group | 60 – 79 | 25 | 7.30a | 2.94 | 6.19a | 3.16 | 6.49a | 2.41 |
| Difference | (absolute) | -1.11 | 3.12 | -0.80 | 3.34 | |||
| Difference | % | -11.7 | 36.5 | -2.3 | 40.2 | |||
| Age Group | 80 – 99 | 14 | 7.51a | 3.99 | 5.07a | 2.07 | 5.50a | 2.18 |
| Difference | (absolute) | -2.44 | 3.69 | -2.01 | 4.94 | |||
| Difference | % | -21.0 | 45.0 | -9.2 | 55.1 | |||
| P= | 0.919 | 0.361 | 0.195 | |||||
* - Identical letters across the horizontal rows indicate no statistically significant difference, while different letters indicate the presence of a statistically significant difference (p<0.05). ** - Changes are measured on Day 3 and Day 7, compared to the baseline values on Day 1.
3.1.2. Dynamics of WBC in the Target Group
A statistically significant decrease in WBC values was observed on Day 3 for the entire sample, as well as in the male subgroup. The absolute decrease ranged from 1 to 3 units, while the percentage decrease was between -15% and -32%. No significant differences were observed between the subgroups (Table 3).
3.2. Dynamics of NLR
Table 4.
Dynamics of NLR by Gender and Age in the Control Group.
| Indicator | Group | n | Day of the examination | |||||
|---|---|---|---|---|---|---|---|---|
| 1 | 3 | 7 | ||||||
|
SD | |
SD | |
SD | |||
| Total | 24 | 8.27a | 7.04 | 6.70a | 5.82 | 5.49b | 4.39 | |
| Difference | (absolute) | -1.58 | 5.08 | -2.78 | 6.24 | |||
| Difference | % | -3.1 | 61.9 | -1.3 | 95.2 | |||
| Male | 15 | 7.21a | 5.11 | 6.73a | 6.40 | 5.21a | 4.61 | |
| Difference | (absolute) | -0.48 | 3.87 | -2.00 | 4.97 | |||
| Difference | % | -9.3 | 44.2 | -11.2 | 81.0 | |||
| Female | 9 | 10.04a | 9.54 | 6.64a | 5.08 | 5.95a | 4.21 | |
| Difference | (absolute) | -3.40 | 6.47 | -4.09 | 8.09 | |||
| Difference | % | 7.1 | 86.1 | 15.3 | 118.6 | |||
| P= | 0.428 | 0.318 | 0.411 | |||||
| Age Group | 60 – 79 | 13 | 8.84a | 5.44 | 6.99a | 5.93 | 4.97b | 3.50 |
| Difference | (absolute) | -1.85 | 3.49 | -3.87 | 4.73 | |||
| Difference | % | -23.5 | 30.7 | -27.0 | 80.3 | |||
| Age Group | 80 – 99 | 9 | 8.85a | 9.34 | 7.05a | 6.38 | 6.44a | 5.77 |
| Difference | (absolute) | -1.80 | 7.31 | -2.41 | 8.22 | |||
| Difference | % | 14.5 | 86.3 | 12.0 | 99.5 | |||
| P= | 0.695 | 0.948 | 0.744 | |||||
* - Identical letters across the horizontal rows indicate no statistically significant difference, while different letters indicate the presence of a statistically significant difference (p<0.05). ** - Changes are measured on Day 3 and Day 7, compared to the baseline values on Day 1.
3.2.1. Dynamics of NLR in the Control Group
The only statistically significant dynamic change was observed on Day 7, both in the entire sample and in the 60-79 age group. On this day, the measured values were significantly lower by around 3-4 units in absolute terms, and the percentage decrease ranged from 1% in the entire sample to 27% in the younger age group compared to baseline values. No statistically significant differences were found between the subgroups at any of the control checks (Table 4).
Table 5.
Dynamics of NLR by Gender and Age in the Target Group.
| Indicator | Group | n | Day of the examination | |||||
|---|---|---|---|---|---|---|---|---|
| 1 | 3 | 7 | ||||||
|
SD | |
SD | |
SD | |||
| Total | 41 | 8.97a | 7.71 | 5.01b | 5.91 | 4.26b | 4.50 | |
| Difference | (absolute) | -3.97 | 7.83 | -4.71 | 8.36 | |||
| Difference | % | -26.7 | 66.2 | -16.3 | 112.4 | |||
| Male | 23 | 10.60a | 8.84 | 6.09b | 6.89 | 4.95b | 4.79 | |
| Difference | (absolute) | -4.51 | 9.76 | -5.65 | 9.47 | |||
| Difference | % | -23.1 | 73.4 | -20.0 | 95.8 | |||
| Female | 18 | 6.89a | 5.53 | 3.62b | 4.13 | 3.39b | 4.07 | |
| Difference | (absolute) | -3.28 | 4.47 | -3.51 | 6.75 | |||
| Difference | % | -31.2 | 57.5 | -11.6 | 133.5 | |||
| P= | 0.172 | 0.062 | 0.217 | |||||
| Age Group | 60 – 79 | 25 | 9.69a | 8.15 | 6.46ac | 7.04 | 4.72bc | 4.51 |
| Difference | (absolute) | -3.23 | 8.42 | -4.97 | 8.18 | |||
| Difference | % | -18.0 | 59.3 | -20.6 | 73.6 | |||
| Age Group | 80 – 99 | 14 | 8.38a | 7.44 | 2.85bc | 2.26 | 3.86ac | 4.79 |
| Difference | (absolute) | -5.53 | 7.31 | -4.52 | 9.52 | |||
| Difference | % | -38.7 | 80.9 | -1.2 | 167.9 | |||
| P= | 0.534 | 0.044 | 0.149 | |||||
* - Identical letters across the horizontal rows indicate no statistically significant difference, while different letters indicate the presence of a statistically significant difference (p<0.05). ** - Changes are measured on Day 3 and Day 7, compared to the baseline values on Day 1.
3.2.2. Dynamics of NLR in the Target Group
In this group, the dynamics of NLR were much more pronounced (Table 5):
- Day 3: A significant decrease was observed in the entire sample, as well as in the male subgroup, female subgroup, and the 80-99 age group.
- Day 7: A statistically significant decrease was seen in the entire sample, as well as in the male subgroup, female subgroup, and the 60-79 age group.
- In absolute terms, the significant decrease ranged from 3 to 6 units, while the percentage decrease ranged from 11% to 45%.
- Day 3: Statistically significant differences (or borderline significance, p<0.1) were observed between male and female subgroups (with higher average values in men) and between age groups (with higher average values in younger patients).
- Day 7: No significant differences were found between the subgroups.
3.3. Dynamics of CRP
Table 6.
Dynamics of CRP by Gender and Age in the Control Group.
| Indicator | Group | n | Day of the examination | |||||
|---|---|---|---|---|---|---|---|---|
| 1 | 3 | 7 | ||||||
|
SD | |
SD | |
SD | |||
| Total | 24 | 161.04a | 103.51 | 87.75b | 76.56 | 43.69c | 42.28 | |
| Difference | (absolute) | -73.29 | 59.62 | -117.35 | 90.67 | |||
| Difference | % | -40.9 | 39.9 | -60.5 | 69.2 | |||
| Male | 15 | 176.07a | 112.68 | 97.74b | 87.90 | 40.28c | 40.22 | |
| Difference | (absolute) | -78.32 | 64.07 | -135.79 | 103.02 | |||
| Difference | % | -37.6 | 46.9 | -58.4 | 87.1 | |||
| Female | 9 | 135.99a | 86.36 | 71.09b | 53.22 | 49.38c | 47.44 | |
| Difference | (absolute) | -64.90 | 53.91 | -86.61 | 57.97 | |||
| Difference | % | -46.4 | 25.9 | -64.0 | 22.2 | |||
| P= | 0.238 | 0.379 | 0.770 | |||||
| Age Group | 60 – 79 | 13 | 188.06a | 117.53 | 100.38b | 92.78 | 46.78c | 44.36 |
| Difference | (absolute) | -87.68 | 71.07 | -141.28 | 113.19 | |||
| Difference | % | -37.4 | 51.2 | -51.6 | 93.8 | |||
| Age Group | 80 – 99 | 9 | 140.90a | 80.39 | 79.16b | 55.84 | 44.51c | 44.94 |
| Difference | (absolute) | -61.74 | 40.21 | -96.39 | 42.26 | |||
| Difference | % | -46.8 | 22.9 | -72.0 | 13.7 | |||
| P= | 0.110 | 0.616 | 0.920 | |||||
* - Identical letters across the horizontal rows indicate no statistically significant difference, while different letters indicate the presence of a statistically significant difference (p<0.05). ** - Changes are measured on Day 3 and Day 7, compared to the baseline values on Day 1.
3.3.1. Dynamics of CRP in the Control Group
The results from Table 6 show that a statistically significant decrease in CRP values was observed:
- Both control checks (Day 3 and Day 7): A significant reduction was observed in the entire sample and all subgroups.
- The absolute decrease ranged from 61 to 141 units, with a greater reduction on Day 7. In percentage terms, the decrease ranged from 37% to 73%.
- No significant differences were found between the subgroups.
Table 7.
Dynamics of CRP by Gender and Age in the Target Group.
| Indicator | Group | n | Day of the examination | |||||
|---|---|---|---|---|---|---|---|---|
| 1 | 3 | 7 | ||||||
|
SD | |
SD | |
SD | |||
| Total | 41 | 146.95a | 54.34 | 68.12b | 62.17 | 17.28c | 24.96 | |
| Difference | (absolute) | -78.83 | 44.46 | -129.67 | 38.84 | |||
| Difference | % | -56.4 | 27.0 | -89.8 | 9.2 | |||
| Male | 23 | 147.79a | 65.06 | 83.78b | 76.57 | 22.13c | 31.82 | |
| Difference | (absolute) | -64.01 | 46.05 | -125.66 | 41.74 | |||
| Difference | % | -48.3 | 30.7 | -87.8 | 11.2 | |||
| Female | 18 | 145.89a | 38.31 | 48.12b | 27.43 | 11.09c | 9.11 | |
| Difference | (absolute) | -97.77 | 35.05 | -134.79 | 35.28 | |||
| Difference | % | -66.8 | 16.8 | -92.4 | 5.1 | |||
| P= | 0.694 | 0.156 | 0.415 | |||||
| Age Group | 60 – 79 | 25 | 144.01a | 62.25 | 71.68b | 71.40 | 17.22c | 27.90 |
| Difference | (absolute) | -72.33 | 46.99 | -126.78 | 43.50 | |||
| Difference | % | -54.0 | 29.1 | -90.0 | 8.9 | |||
| Age Group | 80 – 99 | 14 | 155.18a | 41.34 | 63.90b | 47.67 | 18.16c | 21.55 |
| Difference | (absolute) | -91.27 | 41.74 | -137.01 | 31.80 | |||
| Difference | % | -60.2 | 24.6 | -89.3 | 10.6 | |||
| P= | 0.228 | 0.919 | 0.988 | |||||
* - Identical letters across the horizontal rows indicate no statistically significant difference, while different letters indicate the presence of a statistically significant difference (p<0.05). ** - Changes are measured on Day 3 and Day 7, compared to the baseline values on Day 1.
3.3.2. Dynamics of CRP in the Target Group
From Table 7, it is evident that a statistically significant reduction in CRP values was observed:
- Both control checks (Day 3 and Day 7): A significant reduction was seen in the entire sample and all subgroups.
- The absolute decrease ranged from 64 to 145 units, with a larger reduction on Day 7. In percentage terms, the decrease ranged from 48% to 92%.
- No significant differences were found between the subgroups.
3.4. Dynamics of ASAT
Table 8.
Dynamics of ASAT by Gender and Age in the Control Group.
| Indicator | Group | n | Day of the examination | |||||
|---|---|---|---|---|---|---|---|---|
| 1 | 3 | 7 | ||||||
|
SD | |
SD | |
SD | |||
| Total | 24 | 44.08a | 32.62 | 38.04a | 31.12 | 31.83b | 17.84 | |
| Difference | (absolute) | -6.04 | 15.24 | -12.25 | 23.35 | |||
| Difference | % | -10.6 | 32.6 | -18.4 | 37.4 | |||
| Male | 15 | 43.07a | 36.41 | 41.93a | 37.49 | 32.80a | 18.98 | |
| Difference | (absolute) | -1.13 | 12.96 | -10.27 | 23.09 | |||
| Difference | % | -1.4 | 35.5 | -15.6 | 23.3 | |||
| Female | 9 | 45.78a | 27.10 | 31.56a | 15.76 | 30.22a | 16.72 | |
| Difference | (absolute) | -14.22 | 15.92 | -15.56 | 24.80 | |||
| Difference | % | -26.0 | 20.9 | -23.0 | 55.1 | |||
| P= | 0.770 | 0.815 | 1.000 | |||||
| Age Group | 60 – 79 | 13 | 43.62a | 38.51 | 42.00a | 39.82 | 33.38a | 18.91 |
| Difference | (absolute) | -1.62 | 14.44 | -10.23 | 26.96 | |||
| Difference | % | -2.1 | 40.4 | -9.7 | 46.1 | |||
| Age Group | 80 – 99 | 9 | 46.44a | 26.43 | 32.78b | 14.27 | 28.00c | 12.20 |
| Difference | (absolute) | -13.67 | 15.76 | -18.44 | 19.06 | |||
| Difference | % | -23.5 | 16.5 | -33.7 | 17.1 | |||
| P= | 0.695 | 0.896 | 0.462 | |||||
* - Identical letters across the horizontal rows indicate no statistically significant difference, while different letters indicate the presence of a statistically significant difference (p<0.05).** - Changes are measured on Day 3 and Day 7, compared to the baseline values on Day 1.
3.4.1. Dynamics of ASAT in the Control Group
From Table 8, a statistically significant decrease in ASAT values was observed:
- Day 3: A significant reduction was seen in patients from the higher age subgroup.
- Day 7: A significant decrease was observed in the entire sample, as well as in patients from the higher age subgroup.
- The absolute decrease ranged from 4 to 18 units, with a larger reduction on Day 7. In percentage terms, the decrease ranged from 10% to 34%.
- No significant differences were observed between the subgroups.
Table 9.
Dynamics of ASAT by Gender and Age in the Target Group.
| Indicator | Group | n | Day of the examination | |||||
|---|---|---|---|---|---|---|---|---|
| 1 | 3 | 7 | ||||||
|
SD | |
SD | |
SD | |||
| Total | 41 | 45.85a | 26.71 | 41.07b | 24.93 | 32.20c | 16.42 | |
| Difference | (absolute) | -4.78 | 24.32 | -13.66 | 25.62 | |||
| Difference | % | -4.1 | 45.2 | -20.3 | 37.0 | |||
| Male | 23 | 45.43a | 27.31 | 42.78a | 24.24 | 34.17b | 19.53 | |
| Difference | (absolute) | -2.65 | 20.31 | -11.26 | 26.02 | |||
| Difference | % | -1.0 | 33.5 | -16.8 | 38.7 | |||
| Female | 18 | 46.39a | 26.69 | 38.89a | 26.31 | 29.67b | 11.33 | |
| Difference | (absolute) | -7.50 | 29.06 | -16.72 | 25.49 | |||
| Difference | % | -8.1 | 57.6 | -24.7 | 35.3 | |||
| P= | 0.554 | 0.554 | 0.772 | |||||
| Age Group | 60 – 79 | 25 | 43.12a | 24.43 | 39.76a | 24.11 | 31.12b | 16.18 |
| Difference | (absolute) | -3.36 | 18.36 | -12.00 | 21.89 | |||
| Difference | % | -4.6 | 36.4 | -21.2 | 35.0 | |||
| Age Group | 80 – 99 | 14 | 44.00a | 25.66 | 40.43ac | 27.61 | 31.00bc | 14.19 |
| Difference | (absolute) | -3.57 | 31.08 | -13.00 | 27.30 | |||
| Difference | % | 0.2 | 60.4 | -16.9 | 41.1 | |||
| P= | 0.874 | 0.828 | 0.942 | |||||
* - Identical letters across the horizontal rows indicate no statistically significant difference, while different letters indicate the presence of a statistically significant difference (p<0.05). ** - Changes are measured on Day 3 and Day 7, compared to the baseline values on Day 1.
3.4.2. Dynamics of ASAT in the Target Group
From Table 9, it is evident that a statistically significant reduction in ASAT values was observed:
- Day 3: A significant decrease was observed in the entire sample.
- Day 7: A significant reduction was seen in the entire sample, both genders, and both age subgroups.
- The absolute decrease ranged from 5 to 19 units, with a larger reduction on Day 7. In percentage terms, the decrease ranged from 4% to 30%.
- No significant differences were observed between the subgroups.
3.5. Dynamics of LDH
Table 10.
Dynamics of LDH by Gender and Age in the Control Group.
| Indicator | Group | n | Day of the examination | |||||
|---|---|---|---|---|---|---|---|---|
| 1 | 3 | 7 | ||||||
|
SD | |
SD | |
SD | |||
| Total | 24 | 337.00ac | 115.27 | 317.63a | 122.88 | 284.46bc | 137.08 | |
| Difference | (absolute) | -19.38 | 126.95 | -52.54 | 140.56 | |||
| Difference | % | -1.4 | 38.7 | -12.4 | 32.4 | |||
| Male | 15 | 312.80a | 90.67 | 315.67a | 110.31 | 277.40a | 90.87 | |
| Difference | (absolute) | 2.87 | 114.85 | -35.40 | 97.95 | |||
| Difference | % | 5.7 | 44.3 | -7.1 | 29.5 | |||
| Female | 9 | 377.33a | 144.53 | 320.89a | 148.65 | 296.22a | 198.30 | |
| Difference | (absolute) | -56.44 | 144.13 | -81.11 | 196.32 | |||
| Difference | % | -13.3 | 24.8 | -21.2 | 36.8 | |||
| P= | 0.190 | 0.861 | 0.815 | |||||
| Age Group | 60 – 79 | 13 | 310.62a | 85.48 | 324.54a | 110.29 | 286.92a | 90.81 |
| Difference | (absolute) | 13.92 | 112.66 | -23.69 | 95.89 | |||
| Difference | % | 8.8 | 45.6 | -3.6 | 29.7 | |||
| Age Group | 80 – 99 | 9 | 371.44a | 152.96 | 307.78a | 153.15 | 278.00a | 202.15 |
| Difference | (absolute) | -63.67 | 152.33 | -93.44 | 199.17 | |||
| Difference | % | -14.0 | 28.5 | -24.4 | 37.5 | |||
| P= | 0.245 | 0.292 | 0.209 | |||||
* - Identical letters across the horizontal rows indicate no statistically significant difference, while different letters indicate the presence of a statistically significant difference (p<0.05). ** - Changes are measured on Day 3 and Day 7, compared to the baseline values on Day 1.
3.5.1. Dynamics of LDH in the Control Group
The results from Table 10 show that no statistically significant dynamic changes in LDH values were observed. Additionally, no significant differences were found between the subgroups.
Table 11.
Dynamics of LDH by Gender and Age in the Target Group.
| Indicator | Group | n | Day of the examination | |||||
|---|---|---|---|---|---|---|---|---|
| 1 | 3 | 7 | ||||||
|
SD | |
SD | |
SD | |||
| Total | 41 | 343.59a | 139.06 | 302.93b | 173.60 | 286.83b | 209.91 | |
| Difference | (absolute) | -40.66 | 142.97 | -56.76 | 171.43 | |||
| Difference | % | -8.8 | 33.1 | -16.8 | 38.9 | |||
| Male | 23 | 331.65a | 145.01 | 326.52ac | 215.41 | 306.13bc | 267.32 | |
| Difference | (absolute) | -5.13 | 150.89 | -25.52 | 202.89 | |||
| Difference | % | -1.4 | 35.8 | -12.4 | 47.3 | |||
| Female | 18 | 358.83a | 133.59 | 272.78b | 95.61 | 262.17b | 100.23 | |
| Difference | (absolute) | -86.06 | 121.42 | -96.67 | 113.45 | |||
| Difference | % | -18.1 | 27.4 | -22.5 | 24.8 | |||
| P= | 0.331 | 0.723 | 0.713 | |||||
| Age Group | 60 – 79 | 25 | 332.40a | 136.07 | 305.28a | 141.47 | 276.72a | 165.61 |
| Difference | (absolute) | -27.12 | 127.62 | -55.68 | 143.75 | |||
| Difference | % | -3.4 | 33.7 | -15.7 | 40.2 | |||
| Age Group | 80 – 99 | 14 | 358.79a | 156.85 | 300.50a | 234.50 | 308.29a | 288.27 |
| Difference | (absolute) | -58.29 | 177.23 | -50.50 | 226.00 | |||
| Difference | % | -16.2 | 33.2 | -16.8 | 39.9 | |||
| P= | 0.586 | 0.553 | 0.761 | |||||
* - Identical letters across the horizontal rows indicate no statistically significant difference, while different letters indicate the presence of a statistically significant difference (p<0.05). ** - Changes are measured on Day 3 and Day 7, compared to the baseline values on Day 1.
3.5.2. Dynamics of LDH in the Target Group
Statistically significant reductions in LDH values were observed (Table 11):
- Day 3: A significant decrease was noted in the entire sample and the female subgroup.
- Day 7: A significant decrease was observed in the entire sample and both gender subgroups (male and female).
- The absolute decrease ranged between 40 and 105 units, with a higher reduction on Day 7. In percentage terms, the decrease ranged from 9% to 30%.
- No significant differences were observed between the subgroups.
3.6. Dynamics of D-Dimer
Table 12.
Dynamics of D-dimer by Gender and Age in the Control Group.
| Indicator | Group | n | Day of the examination | |||||
|---|---|---|---|---|---|---|---|---|
| 1 | 3 | 7 | ||||||
|
SD | |
SD | |
SD | |||
| Total | 24 | 1.76a | 1.59 | 1.87a | 1.71 | 1.69a | 1.80 | |
| Difference | (absolute) | 0.12 | 1.13 | -0.06 | 1.67 | |||
| Difference | % | 25.5 | 80.4 | 9.2 | 99.6 | |||
| Male | 15 | 1.61ac | 1.62 | 1.46a | 1.30 | 1.10bc | 0.97 | |
| Difference | (absolute) | -0.16 | 0.86 | -0.52 | 1.04 | |||
| Difference | % | 20.1 | 80.2 | -10.5 | 63.4 | |||
| Female | 9 | 2.00a | 1.59 | 2.56a | 2.13 | 2.68a | 2.44 | |
| Difference | (absolute) | 0.57 | 1.43 | 0.69 | 2.26 | |||
| Difference | % | 34.4 | 84.7 | 42.0 | 139.9 | |||
| P= | 0.482 | 0.238 | 0.138 | |||||
| Age Group | 60 – 79 | 13 | 1.60a | 1.76 | 1.34a | 1.39 | 1.14a | 1.12 |
| Difference | (absolute) | -0.27 | 0.86 | -0.46 | 1.15 | |||
| Difference | % | 19.3 | 86.0 | -7.4 | 69.0 | |||
| Age Group | 80 – 99 | 9 | 2.07a | 1.54 | 2.62a | 2.09 | 2.50a | 2.49 |
| Difference | (absolute) | 0.54 | 1.43 | 0.43 | 2.34 | |||
| Difference | % | 28.1 | 84.2 | 29.6 | 142.5 | |||
| P= | 0.209 | 0.082 | 0.186 | |||||
* - Identical letters across the horizontal rows indicate no statistically significant difference, while different letters indicate the presence of a statistically significant difference (p<0.05). ** - Changes are measured on Day 3 and Day 7, compared to the baseline values on Day 1.
3.6.1. Dynamics of D-Dimer in the Control Group
Table 12 shows that no statistically significant dynamic changes were observed in the values of the examined parameter. However, a significant (or borderline statistically significant, p<0.1) difference was found between the age subgroups, with higher average values observed in older patients.
Table 13.
Dynamics of D-dimer by Gender and Age in the Target Group.
| Indicator | Group | n | Day of the examination | |||||
|---|---|---|---|---|---|---|---|---|
| 1 | 3 | 7 | ||||||
|
SD | |
SD | |
SD | |||
| Total | 41 | 1.57a | 1.58 | 1.34b | 1.91 | 0.96c | 1.87 | |
| Difference | (absolute) | -0.24 | 1.32 | -0.61 | 2.23 | |||
| Difference | % | -11.1 | 70.7 | -26.8 | 97.8 | |||
| Male | 23 | 1.88a | 1.98 | 1.70b | 2.44 | 1.24b | 2.45 | |
| Difference | (absolute) | -0.19 | 1.75 | -0.64 | 2.99 | |||
| Difference | % | -8.3 | 83.2 | -15.4 | 127.1 | |||
| Female | 18 | 1.18a | 0.74 | 0.87b | 0.68 | 0.60c | 0.46 | |
| Difference | (absolute) | -0.30 | 0.37 | -0.58 | 0.44 | |||
| Difference | % | -14.7 | 52.7 | -41.4 | 34.5 | |||
| P= | 0.581 | 0.783 | 0.743 | |||||
| Age Group | 60 – 79 | 25 | 1.29a | 1.09 | 0.98b | 1.01 | 0.86b | 1.23 |
| Difference | (absolute) | -0.32 | 0.89 | -0.44 | 1.48 | |||
| Difference | % | -13.6 | 72.1 | -17.1 | 107.6 | |||
| Age Group | 80 – 99 | 14 | 2.12a | 2.25 | 2.07a | 2.91 | 1.24b | 2.79 |
| Difference | (absolute) | -0.05 | 1.96 | -0.88 | 3.34 | |||
| Difference | % | -1.6 | 73.9 | -37.4 | 86.1 | |||
| P= | 0.185 | 0.098 | 0.784 | |||||
* - Identical letters across the horizontal rows indicate no statistically significant difference, while different letters indicate the presence of a statistically significant difference (p<0.05). ** - Changes are measured on Day 3 and Day 7, compared to the baseline values on Day 1.
3.6.2. Dynamics of D-Dimer in the Target Group
A statistically significant reduction in the values of the examined parameter was observed (Table 13):
- Day 3: A significant decrease was noted in the entire sample and all subgroups, except for the 80-99 age group.
- Day 7: A significant decrease was observed in the entire sample and across all subgroups.
- The absolute decrease ranged from 0.19 to 1.03 units, with a higher reduction observed on Day 7. In percentage terms, the decrease ranged from 8% to 53%.
- A significant (or borderline statistically significant, p<0.1) difference was found between the age subgroups, with higher average values observed in older patients.
3.7. Dynamics of Ferritin
Table 14.
Dynamics of Ferritin by Gender and Age in the Control Group.
| Indicator | Group | n | Day of the examination | |||||
|---|---|---|---|---|---|---|---|---|
| 1 | 3 | 7 | ||||||
|
SD | |
SD | |
SD | |||
| Total | 24 | 878.18a | 749.52 | 832.09a | 711.07 | 848.72a | 883.93 | |
| Difference | (absolute) | -46.09 | 234.95 | -29.45 | 525.89 | |||
| Difference | % | 4.4 | 40.2 | 4.5 | 56.5 | |||
| Male | 15 | 974.59a | 798.55 | 879.66a | 746.24 | 944.46a | 1002.22 | |
| Difference | (absolute) | -94.93 | 257.72 | -30.13 | 626.42 | |||
| Difference | % | 0.4 | 42.0 | 1.1 | 53.7 | |||
| Female | 9 | 717.48a | 672.83 | 752.80a | 683.96 | 689.16a | 665.38 | |
| Difference | (absolute) | 35.32 | 174.74 | -28.32 | 329.23 | |||
| Difference | % | 11.2 | 38.6 | 10.1 | 63.9 | |||
| P= | 0.347 | 0.770 | 519 | |||||
| Age Group | 60 – 79 | 13 | 1011.31a | 857.90 | 933.26a | 802.69 | 1037.60a | 1067.67 |
| Difference | (absolute) | -78.05 | 291.34 | 26.29 | 679.18 | |||
| Difference | % | 1.3 | 47.0 | 7.0 | 59.4 | |||
| Age Group | 80 – 99 | 9 | 696.37a | 666.77 | 698.57a | 670.53 | 647.72a | 637.14 |
| Difference | (absolute) | 2.20 | 164.28 | -48.64 | 278.76 | |||
| Difference | % | 11.4 | 35.3 | 10.0 | 58.3 | |||
| P= | 0.357 | 0.556 | 0.512 | |||||
* - Identical letters across the horizontal rows indicate no statistically significant difference, while different letters indicate the presence of a statistically significant difference (p<0.05). ** - Changes are measured on Day 3 and Day 7, compared to the baseline values on Day 1.
3.7.1. Dynamics of Ferritin in the Control Group
No significant dynamic changes in ferritin levels were observed in the control group as a whole, nor in the subgroups formed based on gender or age. Additionally, no statistically significant differences were found between the subgroups at any of the three-time points during the control checks (Table 14).
Table 15.
Dynamics of Ferritin by Gender and Age in the Target Group.
| Indicator | Group | n | Day of the examination | |||||
|---|---|---|---|---|---|---|---|---|
| 1 | 3 | 7 | ||||||
|
SD | |
SD | |
SD | |||
| Total | 41 | 783.42a | 740.26 | 597.65b | 569.24 | 480.10c | 422.31 | |
| Difference | (absolute) | -185.77 | 323.04 | -303.31 | 503.67 | |||
| Difference | % | -20.7 | 32.9 | -29.1 | 43.5 | |||
| Male | 23 | 804.03a | 545.61 | 669.56b | 525.60 | 583.96b | 455.27 | |
| Difference | (absolute) | -134.48 | 245.20 | -220.07 | 350.64 | |||
| Difference | % | -15.4 | 38.3 | -21.5 | 52.0 | |||
| Female | 18 | 757.08a | 950.17 | 505.77b | 623.70 | 347.40c | 343.74 | |
| Difference | (absolute) | -251.31 | 399.53 | -409.68 | 645.33 | |||
| Difference | % | -27.5 | 23.5 | -38.7 | 27.9 | |||
| P= | 0.207 | 0.207 | 0.098 | |||||
| Age Group | 60 – 79 | 25 | 835.43a | 862.68 | 628.08b | 642.91 | 499.52c | 467.20 |
| Difference | (absolute) | -207.35 | 385.75 | -335.91 | 593.29 | |||
| Difference | % | -20.0 | 38.5 | -26.7 | 51.9 | |||
| Age Group | 80 – 99 | 14 | 711.04a | 528.79 | 573.56b | 471.95 | 446.24c | 365.23 |
| Difference | (absolute) | -137.48 | 183.62 | -264.81 | 350.74 | |||
| Difference | % | -21.1 | 22.4 | -33.8 | 28.5 | |||
| P= | 0.919 | 0.828 | 0.851 | .919 | ||||
* - Identical letters across the horizontal rows indicate no statistically significant difference, while different letters indicate the presence of a statistically significant difference (p<0.05). ** - Changes are measured on Day 3 and Day 7, compared to the baseline values on Day 1.
3.7.2. Dynamics of Ferritin in the Target Group
From Table 15, it is evident that a statistically significant reduction in ferritin values was observed:
- Both control checks (Day 3 and Day 7): Significant decreases were observed in the entire sample and all subgroups.
- The absolute decrease ranged from 134 to 409 units, with a greater reduction noted on Day 7. In percentage terms, the decrease ranged from 11% to 40%.
- No significant differences were found between the subgroups.
3.8. Dynamics of IL-6
Table 16.
Dynamics of IL-6 by Gender and Age in the Control Group.
| Indicator | Group | n | Day of the examination | |||||
|---|---|---|---|---|---|---|---|---|
| 1 | 3 | 7 | ||||||
|
SD | |
SD | |
SD | |||
| Total | 24 | 122.65a | 303.71 | 62.99a | 84.18 | 44.67a | 37.06 | |
| Difference | (absolute) | -59.66 | 224.75 | -77.98 | 291.72 | |||
| Difference | % | -9.3 | 45.5 | 0.1 | 100.9 | |||
| Male | 15 | 163.81a | 381.74 | 74.07a | 103.63 | 50.45a | 38.94 | |
| Difference | (absolute) | -89.74 | 282.86 | -113.36 | 367.59 | |||
| Difference | % | -8.5 | 51.2 | 13.1 | 117.2 | |||
| Female | 9 | 54.06a | 41.23 | 44.54a | 31.04 | 35.03a | 33.58 | |
| Difference | (absolute) | -9.52 | 26.17 | -19.03 | 44.09 | |||
| Difference | % | -10.7 | 36.7 | -21.7 | 66.4 | |||
| P= | 0.640 | 0.726 | 0.318 | |||||
| Age Group | 60 – 79 | 13 | 177.91a | 410.07 | 80.81a | 109.74 | 46.81a | 39.58 |
| Difference | (absolute) | -97.10 | 303.91 | -131.11 | 393.62 | |||
| Difference | % | -5.4 | 49.0 | 11.8 | 125.7 | |||
| Age Group | 80 – 99 | 9 | 63.86a | 43.10 | 45.87a | 32.94 | 46.72a | 38.02 |
| Difference | (absolute) | -17.99 | 40.80 | -17.13 | 47.14 | |||
| Difference | % | -14.0 | 47.6 | -11.6 | 70.6 | |||
| P= | 0.896 | 0.471 | 0.948 | |||||
* - Identical letters across the horizontal rows indicate no statistically significant difference, while different letters indicate the presence of a statistically significant difference (p<0.05). ** - Changes are measured on Day 3 and Day 7, compared to the baseline values on Day 1.
3.8.1. Dynamics of IL-6 in the Control Group
No statistically significant dynamic changes in IL-6 values were observed in the control group as a whole, nor in the subgroups formed based on gender and age. Additionally, no significant differences were found between the subgroups at any of the three time points during the control checks (Table 16).
Table 17.
Dynamics of IL-6 by Gender and Age in the Target Group.
| Indicator | Group | n | Day of the examination | |||||
|---|---|---|---|---|---|---|---|---|
| 1 | 3 | 7 | ||||||
|
SD | |
SD | |
SD | |||
| Total | 41 | 120.33a | 184.10 | 34.90b | 66.79 | 12.37c | 22.64 | |
| Difference | (absolute) | -85.43 | 167.64 | -107.96 | 186.07 | |||
| Difference | % | -55.1 | 40.0 | -65.9 | 61.4 | |||
| Male | 23 | 109.90a | 150.47 | 42.88b | 79.62 | 15.99c | 29.44 | |
| Difference | (absolute) | -67.02 | 121.63 | -93.90 | 155.86 | |||
| Difference | % | -54.5 | 40.2 | -60.1 | 76.5 | |||
| Female | 18 | 133.66a | 223.86 | 24.71b | 45.79 | 7.73c | 6.66 | |
| Difference | (absolute) | -108.95 | 214.33 | -125.93 | 222.31 | |||
| Difference | % | -55.8 | 41.0 | -73.3 | 34.4 | |||
| P= | 0.528 | 0.331 | 0.237 | |||||
| Age Group | 60 – 79 | 25 | 139.86a | 208.43 | 44.55b | 80.73 | 13.33c | 27.31 |
| Difference | (absolute) | -95.30 | 185.46 | -126.53 | 211.37 | |||
| Difference | % | -57.0 | 35.9 | -65.4 | 74.0 | |||
| Age Group | 80 – 99 | 14 | 98.53a | 146.72 | 21.54b | 34.75 | 11.76c | 13.74 |
| Difference | (absolute) | -76.99 | 148.43 | -86.78 | 147.65 | |||
| Difference | % | -50.4 | 49.2 | -64.9 | 38.0 | |||
| P= | 0.988 | 0.874 | 0.346 | |||||
* - Identical letters across the horizontal rows indicate no statistically significant difference, while different letters indicate the presence of a statistically significant difference (p<0.05). ** - Changes are measured on Day 3 and Day 7, compared to the baseline values on Day 1.
3.8.2. Dynamics of IL-6 in the Target Group
The results from Table 17 show that a statistically significant reduction in IL-6 values was observed:
- Both control checks (Day 3 and Day 7): A significant decrease was observed in the entire sample and all subgroups.
- The absolute decrease ranged from 55 to 142 units, with a greater reduction on Day 7. In percentage terms, the decrease ranged from 50% to 75%.
- No significant differences were found between the subgroups.
4. Discussion
The relationship between the severity of COVID-19, patient outcomes, and the values and dynamics of biomarkers such as leukocytes, neutrophil-to-lymphocyte ratio (NLR), CRP, ASAT, LDH, D-dimers, ferritin, and IL-6 has been demonstrated in numerous studies.
In their study, Chaudhary et al. (2021) found significantly higher levels of CRP, D-dimers, ferritin, and IL-6 in patients with severe COVID-19 and those with fatal outcomes [14]. These results are consistent with those reported by Ullah et al. (2022), who, in a study of 500 COVID-19 patients, demonstrated a correlation between elevated levels of biomarkers, including CRP, LDH, D-dimers, and IL-6 with the severity of COVID-19 and the likelihood of a fatal outcome [38]. Similar conclusions were drawn by other authors: Yun et al. (2020) observed significantly higher levels of neutrophils, CRP, ASAT, LDH, D-dimers, and lower levels of lymphocytes in patients with severe and critical forms of COVID-19 [17]. Elshazli et al. (2020), in a meta-analysis, also identified similar correlations between elevated biomarker levels, including increased leukocyte counts, and the progression to critical COVID-19 [18]. Wu et al. (2020) highlighted the importance of elevated neutrophil, LDH, and D-dimer levels as risk factors for the development of ARDS and death [16,39].
The hyperactivation of the immune system, resulting in abnormal inflammation and cytokine release syndrome, has been established as a pathogenic mechanism in the development of severe and critical COVID-19. The effect of medications that modulate the immune response on the above-mentioned biomarkers has been examined in multiple studies [5,33,40]. In this context, the role of Anakinra, an interleukin-1 receptor antagonist, has been explored in numerous studies [32,33,34,35,37,41].
In the present study, the values and dynamics of the indicated biomarkers were monitored in patients treated with Anakinra, compared to those who received standard treatment.
The analysis from Table 18 reveals the following findings regarding the dynamics of the studied blood parameters (WBC, NLR, and CRP):
- WBC – The dynamics of WBC significantly depend on the administration of Anakinra. In the Anakinra group, there was a statistically significant decrease in WBC values, whereas no dynamic changes were observed in the control group. Additionally, the Anakinra group showed significantly lower average WBC values during the control checks on Day 3 and Day 7.
- NLR (Neutrophil-to-Lymphocyte Ratio) – Average NLR values are significantly lower in the Anakinra group on Days 3 and 7 compared to the control group.
- CRP (C-reactive Protein) – The dynamics of CRP (specifically the downward trend) were not statistically significantly dependent on Anakinra administration. However, significantly lower average CRP values were observed in the Anakinra group during the control check on Day 7 compared to the control group.
Table 18.
Dynamics of Blood Parameters (WBC, NLR, and CRP) by Group, Gender, and Age.
| Indicator | Group | n | Day of the examination | |||||
|---|---|---|---|---|---|---|---|---|
| 1 | 3 | 7 | ||||||
|
SD | |
SD | |
SD | |||
| WBC | Control Group | 24 | 7.92a | 4.23 | 8.26a | 3.69 | 8.60a | 4.34 |
| Anakinra | 41 | 7.23ac | 3.29 | 5.69b | 2.80 | 6.02bc | 2.35 | |
| P= | 0.639 | 0.002 | 0.012 | |||||
| NLR | Control Group | 24 | 8.27ad | 7.04 | 6.70bd | 5.82 | 5.49c | 4.39 |
| Anakinra | 41 | 8.97a | 7.71 | 5.01b | 5.91 | 4.26b | 4.50 | |
| P= | 0.755 | 0.033 | 0.075 | |||||
| CRP | Control Group | 24 | 161.04a | 103.51 | 87.75b | 76.56 | 43.69c | 42.28 |
| Anakinra | 41 | 146.95a | 54.34 | 68.12b | 62.17 | 17.28c | 24.96 | |
| P= | 0.978 | 0.206 | <0.001 | |||||
* - Identical letters across the horizontal rows indicate no statistically significant difference. Different letters indicate the presence of a statistically significant difference (p<0.05).
From Table 19, the following observations are made regarding the dependence of the dynamics of the studied blood parameters (ASAT, LDH, D-dimer, ferritin, and IL-6):
- ASAT – the dynamics of ASAT are significantly influenced by Anakinra treatment. In the Anakinra group, there is a consistent and statistically significant decrease in ASAT values throughout the study, while in the control group, a statistically significant drop was only observed during the control check on Day 7.
- LDH – The dynamics of LDH also show a significant dependence on Anakinra treatment. In the Anakinra group, a statistically significant decrease occurred as early as Day 3. In the control group, a significant decrease was only observed on Day 7, and this was only when compared to Day 3, not the baseline values.
- D-dimer – The dynamics of D-dimer levels are significantly dependent on Anakinra treatment. The Anakinra group showed a consistent and statistically significant reduction in D-dimer levels, whereas no dynamics were observed in the control group. Furthermore, significantly (or borderline significantly, p<0.1) lower mean D-dimer values were recorded in the Anakinra group on Days 3 and 7.
- Ferritin – There is a significant dependence of the downward trend in ferritin levels on Anakinra treatment. The Anakinra group experienced a consistent and statistically significant decrease in ferritin levels, while no significant changes were observed in the control group. Additionally, borderline significantly lower mean ferritin values were noted in the Anakinra group during the control checks on Days 3 and 7.
- IL-6 – The downward trend in IL-6 levels is significantly influenced by Anakinra treatment. In the Anakinra group, a consistent and statistically significant decrease in IL-6 was observed throughout the study, while no significant changes were detected in the control group. Furthermore, significantly lower IL-6 values were recorded in the Anakinra group during the control checks on Days 3 and 7.
Table 19.
Dynamics of Blood Parameters (ASAT, LDH, D-dimer, Ferritin, and IL-6).
| Indicator | Group | n | Day of the examination | |||||
|---|---|---|---|---|---|---|---|---|
| 1 | 3 | 7 | ||||||
|
SD | |
SD | |
SD | |||
| ASAT | Control Group | 24 | 44.08a | 32.62 | 38.04a | 31.12 | 31.83b | 17.84 |
| Anakinra | 41 | 45.85a | 26.71 | 41.07b | 24.93 | 32.20c | 16.42 | |
| P= | 0.514 | 0.395 | 0.828 | |||||
| LDH | Control Group | 24 | 337.00ac | 115.27 | 317.63a | 122.88 | 284.46bc | 137.08 |
| Anakinra | 41 | 343.59a | 139.06 | 302.93b | 173.60 | 286.83b | 209.91 | |
| P= | 0.930 | 0.135 | 0.324 | |||||
| D-dimer | Control Group | 24 | 1.76a | 1.59 | 1.87a | 1.71 | 1.69a | 1.80 |
| Anakinra | 41 | 1.57a | 1.58 | 1.34b | 1.91 | 0.96c | 1.87 | |
| P= | 0.693 | 0.064 | 0.013 | |||||
| ferritin | Control Group | 24 | 878.18a | 749.52 | 832.09a | 711.07 | 848.72a | 883.93 |
| Anakinra | 41 | 783.42a | 740.26 | 597.65b | 569.24 | 480.10c | 422.31 | |
| P= | 0.532 | 0.097 | 0.054 | |||||
| IL-6 | Control Group | 24 | 122.65a | 303.71 | 62.99a | 84.18 | 44.67a | 37.06 |
| Anakinra | 41 | 120.33a | 184.10 | 34.90b | 66.79 | 12.37c | 22.64 | |
| P= | 0.876 | <0.001 | <0.001 | |||||
* - Identical letters across the horizontal rows indicate no statistically significant difference. Different letters indicate the presence of a statistically significant difference (p<0.05).
5. Conclusions
The experience from the SARS-CoV-2 pandemic, alongside the current state of infection spread and its global consequences, demonstrates that COVID-19 remains a significant public health issue and is likely to continue as such in the future. The findings of this study underscore the need for ongoing research into the therapeutic effects of Anakinra, not only concerning the biomarkers analyzed but also regarding its impact on clinical symptoms and long-term outcomes associated with post-COVID syndrome.
Author Contributions
Conceptualization, R.Y. and T.T.; methodology, R.Y.; software, D.S.; validation, T.T.; formal analysis, I.T.; investigation, R.Y., D.S. and D.I.; resources, R.Y. and N.Y.; data curation, R.G.; writing—original draft preparation, R.Y. and I.T..; writing—review and editing, R.S.; visualization, D.I..; supervision, N.Y.; project administration, R.Y.; funding acquisition, R.Y. All authors have read and agreed to the published version of the manuscript.
Funding
This research received no external funding.
Institutional Review Board Statement
The study was conducted in accordance with the Declaration of Helsinki, and ethical guidelines of Specialized Hospital for Active Treatment of Infectious and Parasitic Diseases 'Prof. Ivan Kirov’, Sofia.
Informed Consent Statement
Informed consent was obtained from all participating patients in the study.
Data Availability Statement
Data are contained within the article.
Conflicts of Interest
The authors declare no conflicts of interest.
References
- Wang, D.; Hu, B.; Hu, C.; Zhu, F.; Liu, X.; Zhang, J.; et al. Clinical Characteristics of 138 Hospitalized Patients with 2019 Novel Coronavirus-Infected Pneumonia in Wuhan, China. JAMA 2020, 323, 1061–1069. [Google Scholar] [CrossRef] [PubMed]
- Zhou, F.; Yu, T.; Du, R.; Fan, G.; Liu, Y.; Liu, Z.; Xiang, J.; Wang, W.; et al. Clinical course and risk factors for mortality of adult inpatients with COVID-19 in Wuhan, China: a retrospective cohort study. Lancet 2020, 395, 1054–1062. [Google Scholar] [CrossRef] [PubMed]
- Felsenstein, S.; Herbert, J.A.; McNamara, P.S.; Hedrich, C.M. COVID-19, Immunology and treatment options. Clin. Immunol. (Orlando, Fla.) 2020, 215. [Google Scholar] [CrossRef]
- Hirano, T.; Murakami, M. COVID-19: A New Virus, but a Familiar Receptor and Cytokine Release Syndrome. Immunity. 2020, 52, 731–733. [Google Scholar] [CrossRef] [PubMed]
- Zhang, C.; Wu, Z.; Li, J.W.; Zhao, H.; Wang, G.Q. The cytokine release syndrome (CRS) of severe COVID-19: Interleukin-6 receptor (IL-6R) antagonist Tocilizumab may be the key to reduce the mortality. Int. J. Antimicrob. Agents. 2020, 105954. [Google Scholar] [CrossRef] [PubMed]
- Li, C.; He, Q.; Qian, H.; Liu, J. Overview of the pathogenesis of COVID-19 (Review). Exp Ther Med 2021, 22, 1011. [Google Scholar] [CrossRef]
- Chen, G.; Wu, D.; Guo, W.; Cao, Y.; Huang, D.; Wang, H.; Wang, T.; Zhang, X.; Chen, H.; Yu, H.; Zhang, X.; Zhang, M.; Wu, S.; Song, J.; Chen, T.; Han, M.; Li, S.; Luo, X.; Zhao, J.; Ning, Q. Clinical and immunological features of severe and moderate coronavirus disease 2019. J. Clin. Investig. 2020, 130, 2620–2629. [Google Scholar] [CrossRef]
- Giamarellos-Bourboulis, E.J.; Netea, M.G.; Rovina, N.; Akinosoglou, K.; Antoniadou, A.; Antonakos, N.; Damoraki, G.; Gkavogianni, T.; Adami, M.E.; Katsaounou, P.; Ntaganou, M.; Kyriakopoulou, M.; Dimopoulos, G.; Koutsodimitropoulos, I.; Velissaris, D.; Koufargyris, P.; Karageorgos, A.; Katrini, K.; Lekakis, V.; Lupse, M.; Kotsaki, A.; Renieris, G.; Theodoulou, D.; Panou, V.; Koukaki, E.; Koulouris, N.; Gogos, C.; Koutsoukou, A. Complex Immune Dysregulation in COVID-19 Patients with Severe Respiratory Failure. Cell Host Microbe. 2020, 27, 992–1000.e3. [Google Scholar] [CrossRef]
- Schulert, G.S.; Grom, A.A. Macrophage activation syndrome and cytokine-directed therapies. Best Pract. Res. Clin. Rheumatol. 2014, 28, 277–292. [Google Scholar] [CrossRef]
- Kyriazopoulou, E.; Leventogiannis, K.; Norrby-Teglund, A.; Dimopoulos, G.; Pantazi, A.; Orfanos, S.E.; Rovina, N.; Tsangaris, I.; Gkavogianni, T.; Botsa, E.; Chassiou, E.; Kotanidou, A.; Kontouli, C.; Chaloulis, P.; Velissaris, D.; Savva, A.; Cullberg, J.S.; Akinosoglou, K.; Gogos, C.; Armaganidis, A.; Giamarellos-Bourboulis, E.J. Macrophage activation-like syndrome: an immunological entity associated with rapid progression to death in sepsis. BMC Med. 2017, 15, 172. [Google Scholar] [CrossRef]
- Halyabar, O.; Chang, M.H.; Schoettler, M.L.; Schwartz, M.A.; Baris, E.H.; Benson, L.A.; Biggs, C.M.; Gorman, M.; Lehmann, L.; Lo, M.S. Calm in the midst of cytokine storm: a collaborative approach to the diagnosis and treatment of hemophagocytic lymphohistiocytosis and macrophage activation syndrome. Pediatric Rheumatol. 2019, 17, 7. [Google Scholar] [CrossRef] [PubMed]
- Vasbinder, A.; Padalia, K.; Pizzo, I.; Machado, K.; Catalan, T.; Presswalla, F.; Anderson, E.; Ismail, A.; Hutten, C.; Huang, Y.; Blakely, P.; Azam, T.U.; Berlin, H.; Feroze, R.; Launius, C.; Meloche, C.; Michaud, E.; O'Hayer, P.; Pan, M.; Shadid, H.R.; et al. SuPAR, biomarkers of inflammation, and severe outcomes in patients hospitalized for COVID-19: The International Study of Inflammation in COVID-19. J Med Virol. 2024, 96, e29389. [Google Scholar] [CrossRef] [PubMed]
- Liu, Y.; Zhang, C.; Huang, F.; et al. Elevated plasma levels of selective cytokines in COVID-19 patients reflect viral load and lung injury. Natl Sci Rev. 2020, 7, 1003–1011. [Google Scholar] [CrossRef]
- Chaudhary, R.; Garg, J.; Houghton, D.E.; et al. Thromboinflammatory biomarkers in COVID-19: systematic review and meta-analysis of 17,052 patients. Mayo Clinic Proc Innov Qual Outcome. 2021, 5, 388–402. [Google Scholar] [CrossRef]
- Henry, B.M.; de Oliveira, M.H.S.; Benoit, S.; Plebani, M.; Lippi, G. Hematologic, biochemical and immune biomarker abnormalities associated with severe illness and mortality in coronavirus disease 2019 (COVID-19): a meta-analysis. Clin Chem Lab Med. 2020, 58, 1021–1028. [Google Scholar] [CrossRef]
- Wu, C.; Chen, X.; Cai, Y.; Xia, J.; Zhou, X.; Xu, S.; et al. Risk factors associated with acute respiratory distress syndrome and death in patients with coronavirus disease 2019 pneumonia in Wuhan, China. JAMA Intern Med. 2020, 180, 934–943. [Google Scholar] [CrossRef] [PubMed]
- Yun, L.; Yixiao, L.; Zhiping, Q.; et al. Clinical analysis of risk factors for severe patients with novel coronavirus pneumonia. Chin J Infect Dis. 2020, 38, E023. [Google Scholar]
- Elshazli, R.M.; Toraih, E.A.; Elgaml, A.; et al. Diagnostic and prognostic value of hematological and immunological markers in COVID-19 infection: a meta-analysis of 6320 patients. PLoS ONE. 2020, 15, e0238160. [Google Scholar] [CrossRef]
- Cheng, L.; Li, H.; Li, L.; et al. Ferritin in the coronavirus disease 2019 (COVID-19): a systematic review and meta-analysis. J Clin Lab Anal. 2020, 34, e23618. [Google Scholar] [CrossRef]
- Short, S.A.P.; Gupta, S.; Brenner, S.K.; et al. D-dimer and death in critically ill patients with coronavirus disease 2019. Crit Care Med. 2021, 49, e500–e511. [Google Scholar] [CrossRef]
- Sproston, N.R.; Ashworth, J.J. Role of C-Reactive protein at sites of inflammation and infection. Front Immunol. 2018, 9, 754. [Google Scholar] [CrossRef] [PubMed]
- Huang, C.; Wang, Y.; Li, X.; Ren, L.; Zhao, J.; Hu, Y.; Zhang, L.; et al. Clinical features of patients infected with 2019 novel coronavirus in Wuhan, China. Lancet (London, England) 2020, 395, 497–506. [Google Scholar] [CrossRef]
- Liu, J.; Li, S.; Liu, J.; Liang, B.; Wang, X.; Wang, H.; Li, W.; Tong, Q.; Yi, J.; Zhao, L.; Xiong, L.; et al. Longitudinal characteristics of lymphocyte responses and cytokine profiles in the peripheral blood of SARS-CoV-2 infected patients. EBioMedicine. 2020, 55. [Google Scholar] [CrossRef] [PubMed]
- Webb, B.J.; Peltan, I.D.; Jensen, P.; Hioda, D.; Hunter, B.; Silver, A.; Starr, N.; et al. Clinical criteria for COVID-19-associated hyperinflammatory syndrome: a cohort study. Lancet Rheumatol. 2020, 2, e754–e763. [Google Scholar] [CrossRef] [PubMed]
- Yildirim, M.; Halacli, B.; Yuce, D.; Gunegul, Y.; Ersoy, E.O.; Topeli, A. Assessment of Admission COVID-19 Associated Hyperinflammation Syndrome Score in Critically-Ill COVID-19 Patients. J Intensive Care Med. 2023, 38, 70–77. [Google Scholar] [CrossRef]
- Manson, J.J.; Crooks, C.; Naja, M.; Ledlie, A.; Goulden, B.; Liddle, T.; et al. COVID-19-associated hyperinflammation and escalation of patient care: a retrospective longitudinal cohort study. Lancet Rheumatol. 2020, 2, e594–e602. [Google Scholar] [CrossRef]
- Schneider, M. The Role of Biomarkers in Hospitalized COVID-19 Patients with Systemic Manifestations. Biomarker Insights. 2022, 17, 11772719221108909. [Google Scholar] [CrossRef]
- Chen, C.H.; Lin, S.W.; Shen, C.F.; Hsieh, K.S.; Cheng, C.M. Biomarkers during COVID-19: Mechanisms of Change and Implications for Patient Outcomes. Diagnostics (Basel). 2022, 12, 509. [Google Scholar] [CrossRef]
- Khani, E.; Shahrabi, M.; Rezaei, H.; Pourkarim, F.; Afsharirad, H.; Solduzian, M. Current evidence on the use of anakinra in COVID-19. Int Immunopharmacol. 2022, 111, 109075. [Google Scholar] [CrossRef]
- European Medicines Agency. EMA recommends approval for use of Kineret in adults with COVID-19. 2021 .
- Nguyen, T.; Dima, L.; Willett, K.C. Anakinra-An Interleukin-1 Receptor Antagonist for COVID-19. American Journal of Therapeutics. 2023, 30, e108–e116. [Google Scholar] [CrossRef]
- Amikishiyev, S.; Durak, G.; Yilmaz, A.; Erelel, M.; Deniz, R.; Ince, B.; Çağatay, A.A.; Kose, M.; Gunver, M.G.; Bektas, M.; Koca, N.; Gül, A.; Besisik, S.K.; Aghamuradov, S.; Esen, F.; Canturk, Y. POS1216 Potential Predictors of Outcome for Anakinra Treatment in COVID-19 Patients with Macrophage Activation Syndrome. Annals of the Rheumatic Diseases. 2022, 81 (Suppl 1), 937.2–938. [Google Scholar] [CrossRef]
- Karakike, E.; Dalekos, G.N.; Koutsodimitropoulos, I.; Saridaki, M.; Pourzitaki, C.; Papathanakos, G.; Kotsaki, A.; et al. ESCAPE: An Open-Label Trial of Personalized Immunotherapy in Critically lll COVID-19 Patients. Journal of Innate Immunity. 2022, 14, 218–228. [Google Scholar] [CrossRef] [PubMed]
- Hussein, A.A.R.M.; Sayad, R.; Abdelshafi, A.; Hammam, I.A.; et al. A meta analysis on the utility of Anakinra in severe COVID-19 disease. Cytokine. 2023, 169, 156311. [Google Scholar] [CrossRef] [PubMed]
- Naveed, Z.; Sarwar, M.; Ali, Z.; Saeed, D.; Choudhry, K.; Sarfraz, A.; et al. Anakinra treatment efficacy in reduction of inflammatory biomarkers in COVID-19 patients: A meta-analysis. Journal of Clinical Laboratory Analysis. 2022, 36, e24434. [Google Scholar] [CrossRef]
- Potere, N.; DelBuono, M.G.; Caricchio, R.; Cremer, P.C.; Vecchie, A.; Porreca, E.; Gasperina, D.D.; Dentali, F.; Abbate, A.; Bonaventura, A. Interleukin-1 and the NLRP3 inflammasome in COVID-19: Pathogenetic and therapeutic implications. 2022, 85, 104299.
- Steinhardt, M.J.; Wiebecke, S.; Weismann, D.; Frantz, S.; Tony, H.P.; et al. Biomarker-guided application of low-dose anakinra in an acute respiratory distress syndrome patient with severe COVID-19 and cytokine release syndrome. Scand J Rheumatol. 2020, 49, 414–416. [Google Scholar] [CrossRef]
- Ullah, R.; Khan, J.; Basharat, N.; Huo, D.; Din, A.U.; Wang, G. Evaluation of Cardiac Biomarkers and Expression Analysis of IL-1, IL-6, IL-10, IL-17, and IL-25 among COVID-19 Patients from Pakistan. Viruses. 2022, 14, 2149. [Google Scholar] [CrossRef]
- Chen, N.; Zhou, M.; Dong, X.; Qu, J.; Gong, F.; Han, Y.; et al. Epidemiological and clinical characteristics of 99 cases of 2019 novel coronavirus pneumonia in Wuhan, China: a descriptive study. Lancet. 2020, 395, 507–513. [Google Scholar] [CrossRef]
- Tleyjeh, I.M.; Kashour, Z.; Damlaj, M.; et al. Efficacy and safety of tocilizumab in COVID-19 patients: a living systematic review and meta-analysis, first update. Clin Microbiol Infect. 2021, 27, 1076–1082. [Google Scholar] [CrossRef]
- Kharazmi, A.B.; Moradi, O.; Haghighi, M.; et al. A randomized controlled clinical trial on efficacy and safety of anakinra in patients with severe COVID-19. Immunity, Inflammation and Disease 2022, 10, 201–208. [Google Scholar] [CrossRef]
Figure 1.
Distribution of Study Participants by Gender and Age Groups.
Disclaimer/Publisher’s Note: The statements, opinions and data contained in all publications are solely those of the individual author(s) and contributor(s) and not of MDPI and/or the editor(s). MDPI and/or the editor(s) disclaim responsibility for any injury to people or property resulting from any ideas, methods, instructions or products referred to in the content. |
© 2024 by the authors. Licensee MDPI, Basel, Switzerland. This article is an open access article distributed under the terms and conditions of the Creative Commons Attribution (CC BY) license (http://creativecommons.org/licenses/by/4.0/).
Copyright: This open access article is published under a Creative Commons CC BY 4.0 license, which permit the free download, distribution, and reuse, provided that the author and preprint are cited in any reuse.


