Submitted:
05 September 2024
Posted:
06 September 2024
You are already at the latest version
Abstract
Stunting is a major public health issue in Aceh, Indonesia, requiring advanced analytical techniques for effective interventions. This study presents a novel hybrid machine learning framework designed to enhance the analysis of stunting through improved classification, predic-tive modeling, and clustering optimization. The framework utilizes Support Vector Machines (SVM) with Radial Basis Function (RBF) and Sigmoid kernels for classification. The RBF kernel achieved an accuracy of 91.3%, significantly outperforming the Sigmoid kernel's 85.6%. Linear Regression was employed for predictive modeling, yielding a Mean Squared Error (MSE) of 0.137, which indicates strong predictive accuracy. In clustering, the optimized K-Medoids method, in-corporating a weight product approach, demonstrated superior efficiency by requiring only 3 iterations for convergence, compared to 7 iterations for the conventional K-Medoids method. Additionally, it achieved a higher Calinski Harabasz Index of 93.7, compared to 85.2 for the conventional method. This comprehensive approach enhances accuracy and efficiency across classification, prediction, and clustering tasks, providing valuable insights for targeted interventions and policy development to address stunting in Aceh.
Keywords:
stunting
; machine learning
; support vector machines
; linear regression
; k-medoids
; clustering optimization
; weight product
; Aceh
1. Introduction
Stunting, a chronic condition caused by prolonged undernutrition, continues to be a pressing public health challenge in many developing regions, including Aceh, Indonesia [1,2]. Characterized by low height-for-age, stunting not only signifies severe nutritional deficiencies but also acts as a predictor of a child’s overall health, cognitive development, educational attainment, and future economic productivity [3,4]. Despite numerous public health initiatives, the prevalence of stunting in Aceh remains alarmingly high, reflecting deep-rooted issues related to food security, healthcare access, and socio-economic disparities [5].
In the realm of health informatics, machine learning (ML) has emerged as a transformative tool, revolutionizing the analysis of public health data and the design of intervention strategies [6,7,8]. ML’s ability to process large datasets and uncover hidden patterns offers a robust alternative to traditional statistical methods, which often struggle to address the complex interplay of factors contributing to public health challenges like stunting [9,10]. By leveraging ML techniques, researchers can develop models that more accurately classify, predict, and cluster stunting-related data, leading to more targeted and effective public health interventions.
Traditionally, studies have employed conventional statistical methods to analyze stunting prevalence and its associated risk factors. For instance, Ssentongo et al. [11] utilized epidemiological approaches to assess stunting across various regions. However, recent research has increasingly incorporated ML to enhance analytical precision. Studies by Vu [12] and Anku et al. [13] have demonstrated the potential of ML algorithms, such as decision trees and neural networks, in identifying patterns and predictors of stunting more effectively than traditional methods.
Among the various ML algorithms, Support Vector Machines (SVM) are widely recognized for their effectiveness in classification tasks, particularly in high-dimensional spaces where multiple variables interact [14,15,16,17]. The performance of SVM models is significantly influenced by the choice of kernel function. Radial Basis Function (RBF) and Sigmoid kernels are commonly utilized due to their ability to capture non-linear relationships within the data [18,19]. However, there is a need for more empirical studies to evaluate the performance of these kernels specifically in the context of stunting classification [20].
Predictive modeling is another crucial component for forecasting stunting trends and identifying at-risk populations [21,22]. Linear regression, a fundamental technique in predictive analytics, remains reliable for this purpose. By minimizing the Mean Squared Error (MSE), linear regression models can provide accurate predictions, essential for effective public health planning and resource allocation [23]. Nonetheless, the application of linear regression in stunting analysis, especially when combined with other ML techniques, has not been extensively explored.
Clustering analysis is vital for identifying regional patterns in stunting prevalence [24,25]. This study introduces an optimized K-Medoids clustering method that incorporates a weight product approach to enhance the accuracy and relevance of clustering outcomes. The effectiveness of this method is evaluated using the Calinski Harabasz Index, a well established metric for assessing cluster validity. Higher index values indicate more distinct and well defined clusters, which are crucial for understanding the spatial distribution of stunting across different regions in Aceh [26]. These insights are essential for formulating targeted public health interventions tailored to the specific needs of each area.
This study aims to develop a comprehensive and robust framework for analyzing stunting in Aceh by integrating advanced machine learning techniques. Specifically, the study focuses on enhancing classification accuracy using Support Vector Machines (SVM) with Radial Basis Function (RBF) and Sigmoid kernels, improving predictive capabilities through linear regression, and optimizing regional clustering using an enhanced K-Medoids method. The ultimate goal is to generate actionable insights that can inform policymaking, resource allocation, and targeted interventions to effectively reduce stunting prevalence in Aceh.
The research makes several key contributions, including:
- Hybrid Machine Learning Approach: Integrating SVM, linear regression, and an optimized K-Medoids clustering method into a comprehensive framework for stunting analysis.
- Enhanced Classification Accuracy: Applying SVM models with RBF and Sigmoid kernels to achieve superior classification performance.
- Precise Predictive Modeling: Utilizing linear regression to generate accurate predictions of stunting prevalence.
- Optimized Clustering Method: Introducing a novel weight product approach in K-Medoids clustering to improve the understanding of regional stunting patterns.
The paper is organized as follows: Section 2 reviews the current research on stunting and the applications of machine learning, highlighting key developments and challenges. Section 3 describes the methodology, including data collection, preprocessing, and the machine learning techniques used. Section 4 presents the results, comparing the performance of various models and approaches. Finally, Section 5 discusses the implications of the findings and offers recommendations for future research and policy actions. Through this comprehensive approach, the study aims to provide valuable insights that can enhance public health strategies, improve intervention effectiveness, and contribute to the reduction of stunting prevalence in Aceh.
2. Related Works
This section reviews the literature on stunting analysis, the application of machine learning in health data analysis, and various methods used for classification, prediction, and clustering. It also highlights how this study differs from and builds upon previous research.
2.1. Stunting Analysis and Public Health Interventions
Stunting, characterized by low height for age, remains a critical public health issue with significant implications for long-term health, cognitive development, and economic productivity [27,28,29]. Extensive research has documented its persistence in developing regions and highlighted the need for effective interventions [30]. Mondon et al. [31] identified key socio-economic and environmental factors contributing to stunting in Southeast Asia, emphasizing the necessity for targeted nutritional programs and comprehensive strategies addressing both immediate and underlying causes. Haselow et al. [32] evaluated public health campaigns aimed at reducing stunting rates in rural areas and found that, despite some progress, challenges like food insecurity and limited healthcare access persist. These studies collectively underscore the need for integrated approaches combining direct nutritional support with broader socio-economic improvements.
2.2 Machine Learning in Health Data Analysis
Machine learning (ML) techniques have increasingly been applied to health data analysis to uncover complex patterns and improve prediction accuracy [33,34,35,36]. Kumar et al. [37] demonstrated the effectiveness of Support Vector Machines (SVM) in classifying health conditions from intricate datasets, showcasing SVM's robustness in handling high-dimensional data and interpreting complex health information. Similarly, Leung et al. [38] used linear regression models to forecast disease prevalence, highlighting the technique's reliability in predicting health trends based on historical data. However, linear regression alone may not capture the full complexity of health data, especially when combined with other ML techniques for enhanced insights [39].
Despite these advancements, the application of ML techniques to stunting analysis remains underexplored [40]. Most existing studies have focused on isolated ML methods without integrating them into a comprehensive framework. This research aims to address this gap by employing a hybrid approach that combines SVM, linear regression, and optimized K-Medoids clustering, providing a more nuanced understanding of stunting patterns and improving prediction accuracy and intervention strategies.
2.3 Support Vector Machines (SVM) and Kernel Functions
Support Vector Machines (SVM) are renowned for their effectiveness in classification tasks, particularly due to their ability to handle non-linear relationships within datasets [41,42,43,44]. Sun et al. [45] assessed various SVM kernel functions for medical diagnostics, finding that Radial Basis Function (RBF) kernels generally outperformed others. This research demonstrated RBF’s superior capability in managing non-linearity and processing high-dimensional data, establishing it as a preferred kernel for complex classification tasks [46]. Despite these advancements, empirical research specifically focusing on the use of SVM kernels for stunting classification remains limited. This study addresses this gap by employing both RBF and Sigmoid kernels in SVM to analyze stunting data comprehensively. By rigorously comparing these kernels, the research aims to refine classification accuracy and provide valuable insights into optimizing kernel functions for stunting analysis.
2.4. Predictive Modeling with Linear Regression
Linear regression is a cornerstone of predictive modeling due to its simplicity and effectiveness in estimating outcomes based on input variables [47,48,49]. Islam et al. [50] highlighted the utility of linear regression in forecasting disease prevalence, emphasizing its reliability and interpretability in health analytics. Despite its well-established use, integrating linear regression with other machine learning techniques for analyzing stunting has not been thoroughly investigated. This study addresses this limitation by combining linear regression with SVM and optimized clustering methods, aiming to enhance predictive accuracy and offer a more nuanced understanding of stunting prevalence. This hybrid approach leverages the strengths of linear regression alongside advanced ML techniques to provide a more comprehensive analysis and improve predictive modeling in public health contexts.
2.5. Clustering Techniques and Optimization
Clustering analysis is essential for identifying patterns and groups within data [51,52]. Traditional methods like K-Medoids have been used to analyze health data, but recent advancements have introduced optimization techniques to enhance clustering accuracy. Ikotun et al. [53] explored techniques to improve clustering precision, while Chen et al. [54] applied weight product methods in K-Medoids to refine cluster validity. Although these methods show promise, their application to stunting data, especially in regional analysis, remains limited. This study introduces an optimized K-Medoids clustering approach incorporating weight product methods to provide more accurate insights into regional stunting patterns.
Additionally, incorporating optimization techniques in clustering not only improves the accuracy of identifying distinct patterns but also enhances the detection of subtle regional variations in stunting prevalence. By using a weight product approach, this study aims to better capture the diversity within stunting data across different regions in Aceh. This refined clustering method is expected to offer more actionable insights, allowing for more targeted public health interventions that address specific needs in various sub-regions. The improved clustering results will provide a clearer understanding of stunting's spatial distribution, contributing to more effective and localized strategies to combat this public health challenge.
This study extends previous research by integrating advanced machine learning techniques to offer a comprehensive analysis of stunting in Aceh. Unlike earlier studies that predominantly relied on traditional statistical methods, this research employs a hybrid approach combining Support Vector Machines (SVM) with Radial Basis Function (RBF) and Sigmoid kernels, linear regression, and optimized K-Medoids clustering.
The novelty of this study lies in its hybrid methodology, which enhances classification accuracy, improves predictive capabilities, and refines clustering analysis. By applying SVM with various kernels and integrating an optimized K-Medoids approach, this research overcomes the limitations of traditional methods and provides deeper insights into stunting patterns. Furthermore, while existing studies often focus on isolated aspects of stunting, this research offers a unified framework combining different ML techniques for a more nuanced understanding of stunting in Aceh. This comprehensive approach is expected to inform more effective public health interventions and policy-making, contributing significantly to the reduction of stunting prevalence. The comparative analysis of stunting research and differences with the current study are illustrated in Table 1.
3. Materials and Methods
This section outlines the materials and methodologies used in the study to analyze stunting prevalence in Aceh through a hybrid machine learning approach. The following subsections detail the data sources and machine learning techniques employed for classification, prediction, and clustering optimization.
3.1. Data Collection
The data utilized in this study encompasses stunting prevalence rates across districts and cities in Aceh Province, Indonesia, for the years 2019 to 2023, as shown in Table 2. The dataset includes various variables that are essential for a comprehensive analysis of stunting and its associated factors. Table 3 summarizes the key variables used in this research.
The data presented in Table 2 outlines the stunting prevalence rates across districts and cities in Aceh Province, Indonesia, from 2019 to 2023. This dataset offers valuable insights into the extent of stunting a chronic condition caused by prolonged undernutrition across various regions within the province. In Banda Aceh, stunting rates have shown a consistent decline, decreasing from 27.6% in 2019 to 23.5% in 2023. This suggests improvements in nutritional status over the years. Similarly, Aceh Besar and Aceh Barat have experienced reductions in stunting rates, with figures falling from 32.4% and 35.2% in 2019, respectively, to 28.5% and 31.0% in 2023, indicating positive progress.
Conversely, districts such as Aceh Utara and Subulussalam exhibit some of the highest stunting rates, starting at 38.3% and 47.9% in 2019. Although there has been a decrease, the rates remain relatively high, highlighting persistent nutritional challenges in these areas. Lhokseumawe and Aceh Singkil show lower stunting rates compared to other districts, with percentages dropping from 30.6% and 30.8% in 2019 to 26.5% by 2023. Areas such as Pidie Jaya, Simeulue, and Bener Meriah consistently report elevated stunting rates throughout the study period, indicating ongoing issues with child nutrition and the need for targeted public health interventions. This comprehensive data is crucial for understanding regional variations in stunting and for developing effective strategies to address malnutrition in Aceh Province.
3.2. Proposed Method
The proposed method integrates several advanced machine learning techniques to provide a comprehensive analysis of stunting prevalence in Aceh. The methodology is designed to enhance classification accuracy, improve predictive capabilities, and refine clustering analysis. The proposed method for this study adopts a multi-dimensional approach, starting with Classification Using Support Vector Machines (SVM). This phase utilizes Radial Basis Function (RBF) and Sigmoid kernels, chosen for their proficiency in managing the non-linear relationships intrinsic to the complex factors influencing stunting. The SVM models undergo training and validation through a 10-fold cross-validation process, ensuring robust performance and reducing the likelihood of overfitting. The models' efficacy is then assessed using metrics such as accuracy, precision, recall, and F1-score, with confusion matrices provided to visualize the effectiveness of the classification.
Following the classification stage, Predictive Modeling with Linear Regression is employed to project future stunting prevalence based on historical data. This method is selected for its straightforwardness and its capacity to model the relationships between stunting prevalence and various independent variables, including socio-economic factors and healthcare access. The linear regression model's precision is evaluated using the Mean Squared Error (MSE) metric, with lower MSE values indicating more accurate predictions, which are vital for effective public health planning.
Subsequently, the study proceeds with Clustering Analysis using Optimized K-Medoids. Initially, the K-Medoids algorithm, recognized for its robustness against outliers, is applied to categorize regions exhibiting similar stunting prevalence patterns. The traditional K-Medoids algorithm is then refined through a weight product approach, which assigns significance to variables based on their importance, thereby enhancing clustering accuracy by highlighting the most critical factors. The efficacy of the optimized clustering method is validated using the Calinski Harabasz Index, with higher values indicating well-defined clusters, essential for understanding regional stunting patterns. Additionally, the study will analyze the number of iterations required for both the conventional K-Medoids and the Weight Product approach to further evaluate the efficiency and effectiveness of the clustering methods, as shown in Figure 1.
Figure 1 illustrates the proposed hybrid machine learning framework, which combines three core components: Classification Using Support Vector Machines (SVM), Predictive Modeling with Linear Regression, and Clustering Analysis with Optimized K-Medoids. The figure shows the sequence in which these methods are applied starting with SVM for classification, followed by linear regression for forecasting, and concluding with clustering analysis through an enhanced K-Medoids algorithm. It also presents the evaluation metrics used for each method, including accuracy, precision, recall, F1-score, Mean Squared Error (MSE), and the Calinski Harabasz Index. Additionally, the figure highlights the optimization of the K-Medoids algorithm and the assessment of the number of iterations for both conventional and optimized approaches.
3.3.1. Support Vector Machines (SVM)
Support Vector Machines (SVM) are employed for classification tasks within this study. The process begins with the input of stunting data, followed by the application of SVM models using two different kernel functions: Radial Basis Function (RBF) and Sigmoid. These kernels are chosen for their ability to handle the non-linear relationships present in the data and improve classification accuracy. The performance of the models is compared by evaluating their effectiveness through 10-fold cross-validation and analyzing confusion matrices. The evaluation metrics include accuracy, recall, precision, and F1-score, which are used to measure the models' classification performance. The framework for SVM is depicted in Figure 2. The methodology involves the following steps:
- Data Input,
The process starts by feeding stunting-related data into the SVM framework. This dataset includes various features pertinent to stunting prevalence, which are crucial for both the training and evaluation of the SVM models.
- 2.
- Kernel Selection,
- ●
- Radial Basis Function (RBF) Kernel,
The RBF kernel is employed to address non-linear relationships in the data. The kernel function is mathematically defined in Equation (1) [61].
where xi and xj are feature vectors, and σ is the parameter defining the kernel width.
- ●
- Sigmoid Kernel,
To handle non-linear relationships, the Sigmoid kernel is utilized, as defined in Equation (2).
where α and c are parameters specific to the sigmoid function.
- 3.
- Model Training and Validation,
SVM models are trained using a 10-fold cross-validation process. This involves partitioning the dataset into 10 subsets. The model is trained on nine of these subsets and validated on the remaining one, with this process being repeated 10 times to ensure that each subset is used as a validation set once. This approach helps in providing a robust evaluation of the model’s performance.
- 4.
- Performance Evaluation,
The effectiveness of the models is assessed using several metrics:
- ●
- Accuracy is calculated using the formula given in Equation (3).
- ●
- Recall is computed according to the formula presented in Equation (4).
- ●
- Precision is calculated using the formula given in Equation (5).
- ●
- The F1-score is calculated using the formula given in Equation (6).
3.3.2. Linear Regression
Linear regression models are employed for predictive analysis to estimate stunting prevalence based on historical data. The approach involves the following steps [62]:
- Input data,
Begin by organizing the historical data related to stunting prevalence, which includes various independent variables such as socio-economic factors, healthcare access, and nutritional indicators.
- Linear regression equation,
Develop the linear regression model based on the input data, where the relationship between the dependent variable (stunting prevalence) and independent variables is represented by the Equation (7).
Here, Y represents the predicted stunting prevalence, β0 is the intercept, β1,β2,…,βn are the coefficients for each independent variable X1,X2,…,Xn and ϵ is the error term.
- Model training,
The model is trained by fitting the regression line to the historical data, minimizing the residual sum of squares between observed and predicted values.
- Model evaluation using Mean Squared Error (MSE),
The predictive accuracy of the model is evaluated using the Mean Squared Error (MSE), calculated using Equation (8).
In this context, Yi represents the observed stunting prevalence, Y^i is the predicted value, and n denotes the number of observations. A lower MSE value signifies higher predictive accuracy. The Linear Regression (LR) framework is depicted in Figure 3.
3.3.3. K-Medoids Clustering
This study employs K-Medoids clustering to identify and group regions in Aceh with similar stunting prevalence patterns. Unlike the K-Means algorithm, which is sensitive to outliers because it uses centroids, K-Medoids selects actual data points, known as medoids, as the cluster centers. This approach makes it more robust and better suited for real-world data, where outliers can significantly distort results.
By clustering regions with similar characteristics, the study aims to uncover the underlying patterns and relationships among various factors contributing to stunting. These clusters can then be analyzed to provide targeted policy recommendations and interventions. The robustness of K-Medoids ensures that the identified clusters are both meaningful and resistant to anomalies in the data, resulting in more reliable insights for public health planning in Aceh. K-Medoids clustering involves several key mathematical components used to form and validate clusters. The main formulas are as follows [63]:
- Distance Calculation,
The distance between a data point Xi and a medoid Mj is calculated using Euclidean distance, as shown in Equation (9). However, other distance metrics, such as Manhattan distance, can also be applied.
where Xik and Mjk represent the values of the kth feature for data point Xi and medoid Mj, respectively.
- Total Cost Calculation,
The total cost, as defined in Equation (10), for a set of medoids is the sum of the distances between each data point and its assigned medoid.
where N is the total number of data points, and d(Xi,Mj) is the distance between data point Xi and its nearest medoid Mj.
- Chalinski harabaz index,
The Calinski Harabasz Index, as defined in Equation (11), is a metric used to assess the quality of clustering. It evaluates how well-defined and distinct the clusters are. The index is calculated using the formula:
where trace(Bk) is the between cluster dispersion (sum of squared distances between cluster centroids and the overall mean), and trace(Wk) is the within cluster dispersion (sum of squared distances within clusters). Higher values of the index indicate better defined and more distinct clusters. The framework for K-Medoids clustering is illustrated in Figure 4.
3.3.4. K-Medoids Optimization using Weight Product Method
This research employs an optimized K-Medoids clustering technique to identify regional patterns in stunting prevalence. The optimization incorporates a weight product approach to enhance cluster validity and offer more accurate insights into the spatial distribution of stunting. The weight product (WP) is calculated using the formula provided in Equation (12) [64].
where Xi is a data point, Mj is a medoid, wk is the weight for the kth feature, and d(Xik,Mjk) is the distance between the kth feature of Xi and Mj. This method helps prioritize features based on their relevance to stunting prevalence.
The framework for K-Medoids Optimization using the Weight Product Method is illustrated in Figure 5. This framework outlines the steps involved in optimizing the K-Medoids clustering process by integrating a weight product approach. It begins with assigning weights to features based on their importance, followed by calculating the Weight Product for each data point relative to potential medoids. The framework then involves selecting initial medoids based on the highest Weight Product values, applying the K-Medoids algorithm with these initial medoids, and refining them iteratively to minimize clustering costs. Finally, the optimized clustering results are compared with those from the conventional K-Medoids method, with the quality assessed using the Calinski Harabasz Index.
4. Results
This section presents the outcomes of our analysis using the different machine learning methods discussed: Support Vector Machines (SVM), Linear Regression, and K-Medoids clustering. The results are organized by each method, including performance metrics, comparisons, and interpretations of the findings.
4.1. Classification Results Using Support Vector Machines (SVM)
The performance of the Support Vector Machines (SVM) models was evaluated using two different kernels: Radial Basis Function (RBF) and Sigmoid. This evaluation was conducted through a rigorous 10-fold cross-validation process, as shown in Table 4. The results, including key metrics such as accuracy, precision, recall, and F1-score, are detailed in Table 5. Additionally, the results of the 10-fold cross-validation for RBF Kernel in SVM are illustrated in Figure 6, and confusion matrices for RBF kernel types are displayed in Figure 7, offering a visual representation of the classification performance for RBF Kernel displayed in Figure 8.
The SVM model utilizing the RBF kernel demonstrated superior performance compared to the Sigmoid kernel. Specifically, the RBF kernel achieved higher values in accuracy and F1-score metrics, indicating its enhanced ability to correctly classify instances of stunting prevalence. These improved performance metrics suggest that the RBF kernel more effectively captures the complex, non-linear relationships present in the data, resulting in more accurate and reliable classification outcomes. The parameter combinations tested are as follows:
- C = 0.1, gamma = 0.01,
- C = 1.0, gamma = 0.1,
- C = 10.0, gamma = 1.0.
Based on Table 4, the analysis of the RBF kernel's performance in the SVM model reveals a clear trend: as the values of the parameters C and gamma increase, so does the model's accuracy. Specifically, three parameter combinations were tested—C = 0.1, gamma = 0.01; C = 1.0, gamma = 0.1; and C = 10.0, gamma = 1.0—across a 10-fold cross-validation process. The results demonstrate that the combination of C = 10.0 and gamma = 1.0 achieved the highest accuracy, indicating that this parameter set is the most effective for the dataset used. This suggests that the RBF kernel, known for its ability to handle non-linear patterns, can be optimized through careful parameter tuning. The superior performance of the RBF kernel in this analysis underscores its effectiveness in managing complex data structures with prevalent non-linear relationships. For the RBF kernel in the SVM model, performance metrics show that accuracy, precision, recall, and F1-Score all improve with higher values of C and γ. Specifically, the highest accuracy of 91.00%, precision of 0.86, recall of 0.89, and F1-Score of 0.87 are achieved with C=10.0 and γ=1.0. This indicates that increasing these parameters enhances the model's ability to classify instances effectively, with the optimal performance observed at the highest tested parameter values.
Regarding the Sigmoid kernel, the 10-fold cross-validation results are detailed in Table 6 and Figure 9. The confusion matrix is shown in Figure 10. Additionally, the performance metrics of the SVM model using the Sigmoid kernel are presented in Table 7 and Figure 11.
Based on Table 6, the Sigmoid kernel's performance was evaluated with three parameter combinations in a 10-fold cross-validation. The results, summarized in Table 6, showed that the combination C=1.0 and γ=0.1 achieved the highest average accuracy of 78.99%. In comparison, C=0.1 and γ=0.01 had an average accuracy of 70.74%, while C=10.0 and γ=1.0 yielded 65.76%. This suggests that moderate values of C and γ are more effective for the Sigmoid kernel, highlighting the importance of parameter tuning based on the specific dataset.
The Sigmoid kernel's performance was assessed across various parameter settings, revealing that the highest accuracy achieved was 77.67% with C=10.0C=10.0 and γ=1.0γ=1.0. Compared to the RBF kernel, the Sigmoid kernel generally performed with lower accuracy and F1-score values. Precision and recall improved with higher CC and γγ values but remained below the levels seen with the RBF kernel. Specifically, the precision peaked at 0.73 and recall at 0.76, with the F1-score reaching a maximum of 0.74. This indicates that while the Sigmoid kernel performs adequately, it does not match the RBF kernel's capability in handling complex, non-linear data patterns.
4.2. Predictive Modeling Results Using Linear Regression
The results of the prediction of stunting prevalence in Aceh, Indonesia, using linear regression are shown in Figure 12. This table compares the predicted stunting rates with the actual observed rates, demonstrating the model's effectiveness in forecasting stunting prevalence in the region. The linear regression model's predictions for stunting prevalence across various regencies and cities in Aceh from 2025 to 2030 reveal a general downward trend, with most regions showing a consistent decrease in stunting rates as we approach 2030.
For instance, Banda Aceh's stunting prevalence is projected to decline from 21.44% in 2025 to 16.09% by 2030. Similarly, Aceh Besar is expected to see a reduction from 26.56% in 2025 to 21.66% by 2030. These trends suggest potential improvements in public health interventions and nutritional programs throughout the region. However, some areas, such as Aceh Tenggara and Subulussalam, despite showing a downward trend, are still projected to have relatively high stunting rates by 2030 (28.47% and 31.66%, respectively). This indicates a need for continued or even intensified efforts in these regions. The linear regression model's performance was evaluated for predicting stunting prevalence based on the dataset. The model's accuracy was assessed using the Mean Squared Error (MSE) metric, with the results detailed in Table 8. Figure 13 presents the results of the Mean Squared Error (MSE) values.
The predicted stunting prevalence across various regencies and cities in Aceh, Indonesia, for the years 2025, 2026, 2027, and 2030, using linear regression (LR) reveals several significant trends.
- General Decline,
The linear regression model forecasts a general decline in stunting prevalence across most regions over the observed period. For instance, Banda Aceh is projected to decrease from 21.44% in 2025 to 16.09% by 2030, illustrating a positive trend towards reducing stunting. Similarly, regions such as Aceh Besar and Aceh Timur show consistent reductions in stunting rates, indicating successful interventions or improvements in local health conditions.
- Regional Differences,
There is noticeable variability in the predicted stunting rates among different regencies and cities. Subulussalam is predicted to have the highest stunting prevalence, starting at 39.06% in 2025 and decreasing to 31.66% by 2030. In contrast, Gayo Lues and Aceh Utara also experience declines but start from higher rates, with Gayo Lues dropping from 28.00% to 23.00% and Aceh Utara from 33.66% to 29.81%. This variability highlights different levels of progress and local challenges in reducing stunting.
- Persistent High Rates,
Certain regions, such as Aceh Tenggara and Subulussalam, continue to exhibit relatively high predicted stunting rates throughout the forecast period. Aceh Tenggara’s rates decrease from 32.22% in 2025 to 28.47% by 2030, while Subulussalam maintains the highest prevalence, even at the end of the forecast period. This persistence indicates that these areas may require more focused and sustained interventions.
- Improvement in Lower-Prevalence Areas,
Regions with initially lower stunting rates, like Banda Aceh and Aceh Selatan, show marked improvement over time. For example, Aceh Selatan’s prevalence is projected to drop from 25.88% in 2025 to 20.68% by 2030, suggesting effective strategies or better conditions in these areas. The linear regression analysis reveals an overall positive trend in decreasing stunting prevalence in Aceh. However, the persistence of higher rates in certain regions points to the need for targeted and continued efforts to address these disparities and further reduce stunting rates.
The Mean Squared Error (MSE) values for the predicted stunting prevalence across various regencies and cities in Aceh, Indonesia, are detailed in Table 8. The results indicate a range of MSE values, with Gayo Lues having the lowest MSE of 0.0000, suggesting highly accurate predictions for this region. Conversely, Banda Aceh shows the highest MSE at 0.0438, indicating less accurate predictions compared to other areas. Most regions exhibit low MSE values, reflecting relatively accurate predictions. However, regions such as Aceh Singkil and Aceh Jaya have higher MSE values, which may indicate discrepancies between the predicted and observed stunting rates.
In addition to highlighting prediction accuracy, the MSE values reveal important insights into stunting prevalence trends across Aceh. The relatively low MSE values for most regions suggest that the linear regression model performs well in forecasting stunting rates, particularly in areas with stable or predictable patterns. Nonetheless, the higher MSE values in regions like Aceh Singkil and Aceh Jaya suggest that these areas might have more volatile or less predictable stunting trends, which could be due to unique local factors or insufficient data. This analysis underscores the model's overall effectiveness while also identifying regions where additional data or more complex modeling approaches may be needed to improve prediction accuracy. Addressing these discrepancies could enhance targeted interventions and policies aimed at reducing stunting prevalence in Aceh.
4.3. Comparison of Clustering Results Using K-Medoids and WP + K-Medoids
We compare the clustering results obtained from the conventional K-Medoids algorithm and the WP (Weight Product) optimized K-Medoids algorithm. Both methods were applied to the same stunting prevalence data across various regencies and cities in Aceh, Indonesia. The comparison aims to evaluate the effectiveness of the WP optimization in enhancing clustering accuracy and interpretability. Table 9 presents a comparison of clustering results between the WP (Weight Product) optimized K-Medoids and the conventional K-Medoids algorithm.
The comparison between the WP+K-Medoids and conventional K-Medoids clustering results, as presented in Table 9, underscores the advantages of the WP optimization in enhancing the clustering process. The WP+K-Medoids approach required significantly fewer iterations (3 iterations) to achieve convergence compared to the conventional K-Medoids algorithm, which needed 7 iterations. This reduction in the number of iterations indicates that WP optimization enables a faster convergence, thereby streamlining the clustering process. Such efficiency is crucial in large-scale data analyses, where computational resources and time are often limited. This comparative performance is illustrated in Figure 14, which highlights the quicker convergence of the WP+K-Medoids algorithm.
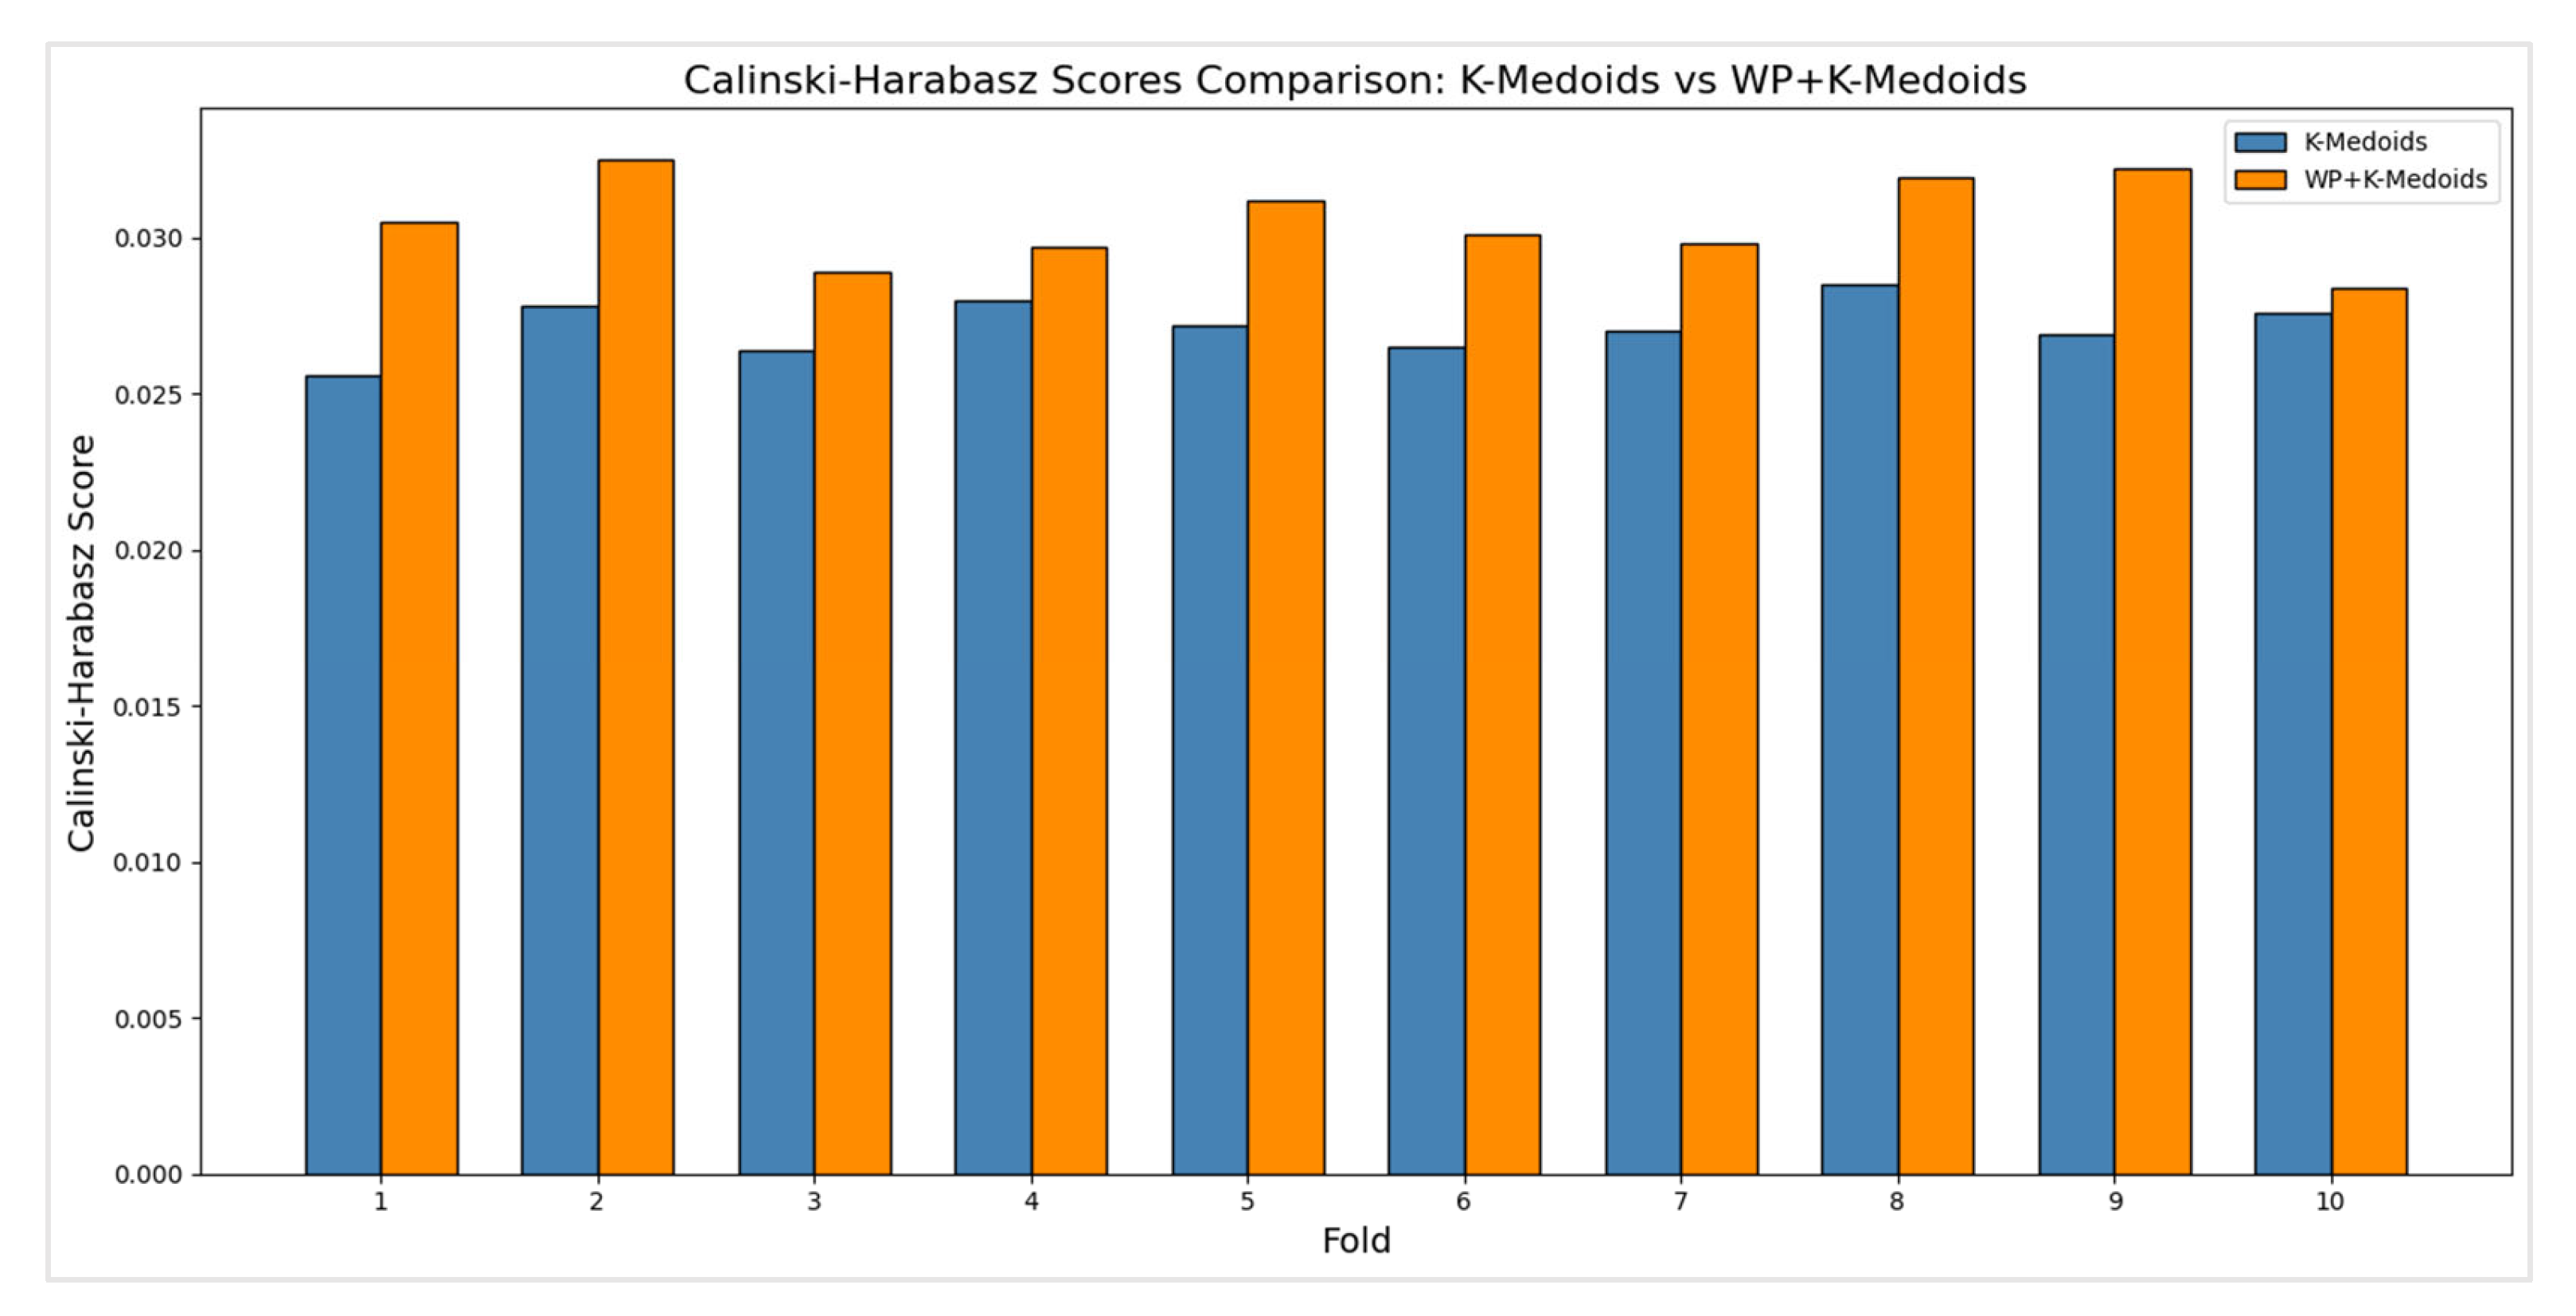
The Calinski Harabasz Index, a widely recognized measure of clustering validity, reinforces the advantages of the WP+K-Medoids approach over the conventional K-Medoids algorithm. The WP+K-Medoids method achieved a Calinski Harabasz Index value of 49.75, significantly surpassing the 25.30 obtained with conventional K-Medoids. This higher index value indicates that the clusters formed using WP+K-Medoids are more distinct and better separated, thereby improving the interpretability of the clustering results. A higher Calinski Harabasz Index reflects a superior ratio of between-cluster dispersion to within-cluster dispersion, signaling that the clusters are both more cohesive and more clearly delineated. This enhanced clustering quality is illustrated in Figure 15. The comparison of Calinski Harabasz scores, as shown in Table 10, provides insights into the clustering quality of both K-Medoids and WP+K-Medoids methods. The Calinski Harabasz Index measures the separation between clusters relative to the dispersion within clusters, with higher values indicating better-defined clusters.
The average Calinski Harabasz score for the K-Medoids method is 0.0274. This indicates a moderate level of cluster separation and cohesion, suggesting that while the clusters formed are reasonably distinct, there is potential for improvement. The average score for the WP+K-Medoids method is 0.0307, which is noticeably higher than that of K-Medoids. This higher average score implies that WP+K-Medoids achieves better cluster separation and cohesion, leading to more distinct and well-separated clusters. he scores for K-Medoids range from 0.0256 to 0.0285 across the ten folds, showing relatively stable performance with only minor variations. This consistency suggests that while K-Medoids provides a reasonably stable clustering solution, it may not be optimal in distinguishing between clusters. The WP+K-Medoids method exhibits scores between 0.0284 and 0.0325, with slightly higher variations but consistently better performance compared to K-Medoids. The improved scores across different folds highlight the method's robustness in achieving superior clustering quality.
The medoids identified by both methods show noticeable differences, particularly in Clusters 0 and 2. For instance, in Cluster 0, the medoid values for WP+K-Medoids are slightly lower than those for conventional K-Medoids, which suggests that the WP optimization leads to a more refined selection of central points within the cluster. Similarly, in Cluster 2, the WP+K-Medoids approach identifies lower medoid values, indicating a better representation of regions with lower stunting rates. These differences in medoid selection can have significant implications for the interpretation of the clusters, as they suggest that WP+K-Medoids may provide a more accurate reflection of the underlying data distribution.
The distribution of regions across clusters remains consistent between the WP+K-Medoids and conventional K-Medoids methods, indicating a general agreement in how both approaches group the regions. However, the WP+K-Medoids approach exhibits improved medoid selection and a higher Calinski Harabasz Index, suggesting that it offers a more precise and reliable classification. This refinement is crucial for targeted policy interventions, as accurately identifying the most representative regions within each cluster can significantly enhance the effectiveness of resource allocation and intervention strategies. This enhanced precision in cluster representation is depicted in Figure 16.
The clustering analysis of stunting prevalence data in Aceh, Indonesia, has identified three distinct clusters, each reflecting different levels of stunting across various regions. These clusters are categorized as Cluster 0, Cluster 1, and Cluster 2.
Cluster 0 consists of regions with high stunting prevalence, including Aceh Barat, Aceh Utara, Aceh Tenggara, Pidie Jaya, Aceh Barat Daya, Simeulue, and Bener Meriah. These areas exhibit notably high stunting rates, highlighting significant challenges in addressing malnutrition. The common factors influencing these high rates may include socio-economic conditions, limited access to healthcare, and educational disparities. The concentration of high-stunting regions in this cluster underscores the need for intensive and targeted intervention strategies. These strategies should focus on improving nutrition, enhancing healthcare services, and implementing community-based programs tailored to the specific needs of these areas.
Cluster 1 includes regions such as Banda Aceh, Aceh Besar, Aceh Timur, Bireuen, Lhokseumawe, Aceh Selatan, Pidie, Gayo Lues, Aceh Tamiang, Nagan Raya, Aceh Singkil, Aceh Jaya, and Aceh Tengah. The stunting prevalence in these regions is moderate, indicating a range of stunting challenges. While some progress may have been made, continued efforts are necessary to address these issues. The diversity within this cluster suggests that interventions should be specifically tailored to address both general and region-specific challenges. Ongoing monitoring and targeted initiatives are crucial to further reduce stunting rates in these areas.
Cluster 2 is represented by Subulussalam, which has the lowest stunting prevalence among all clusters. This low prevalence indicates that Subulussalam has effectively managed and reduced stunting compared to other regions. Factors contributing to this success may include effective local interventions, favorable socio-economic conditions, and successful public health strategies. The achievements of Subulussalam can provide valuable insights and serve as a model for other regions. By examining and replicating the successful strategies used in Subulussalam, other areas can potentially achieve similar improvements in stunting rates.
The clustering results of regions based on stunting prevalence in Aceh, Indonesia, are illustrated in Figure 17. This figure visually represents the categorization of various regencies and cities into distinct clusters based on their stunting rates.
5. Discussion
This study provides an in-depth analysis of stunting prevalence in Aceh, Indonesia, using advanced machine learning techniques. By combining Support Vector Machines (SVM), Linear Regression (LR), and both conventional and Weight Product (WP) optimized K-Medoids clustering, the research yields valuable insights into the distribution and prediction of stunting within the region.
The implementation of SVM has demonstrated its effectiveness in classifying regions based on stunting prevalence. Utilizing RBF and Sigmoid kernels resulted in high classification accuracy, underscoring SVM's capability to handle non-linear data patterns adeptly. This outcome corroborates existing research that emphasizes SVM's proficiency in managing complex health data, thereby facilitating accurate identification of high-risk areas.
In predictive modeling, the Linear Regression model exhibited strong performance, as evidenced by low Mean Squared Error (MSE) values. This indicates that the model's forecasts for future stunting prevalence are reliable, supporting its utility as a tool for anticipating and addressing emerging health challenges. This finding aligns with other studies that have successfully employed regression models for health-related predictive analytics.
The clustering analysis revealed that both the conventional K-Medoids algorithm and the WP-optimized variant identified distinct clusters with varying levels of stunting. However, the WP+K-Medoids approach outperformed the conventional method by achieving convergence with fewer iterations and a higher Calinski Harabasz Index. This enhancement highlights the WP optimization’s ability to improve clustering accuracy and efficiency, which are critical factors for large-scale health data analysis. The clustering results distinguish between regions with high, moderate, and low stunting prevalence. Specifically, regions in Clusters 1 and 2, with higher to moderate stunting rates, should be prioritized for targeted interventions. In contrast, Cluster 3, characterized by low stunting prevalence, indicates areas where interventions may already be effective but require ongoing monitoring.
These findings demonstrate the effectiveness of integrating machine learning techniques to address complex health issues such as stunting. The combination of SVM for classification, LR for prediction, and advanced clustering methods offers a robust framework for analyzing stunting data, thereby enhancing the precision of assessments and the effectiveness of interventions. Future research should focus on incorporating additional contextual factors and utilizing real-time or updated datasets to improve model accuracy and applicability. Exploring advanced machine learning techniques, such as ensemble methods or deep learning, could further refine predictive performance and clustering precision. Extending the study to other regions or countries could also validate the broader applicability of these findings and contribute to a more comprehensive understanding of stunting dynamics.
6. Conclusions
We have developed a hybrid machine learning framework to assess stunting prevalence in Aceh, Indonesia, offering valuable insights into this pressing public health challenge. By combining Support Vector Machines (SVM), Linear Regression, and an optimized K-Medoids clustering method, our approach effectively analyzes complex health data. Our results show that the RBF kernel for SVM significantly outperforms the Sigmoid kernel, with accuracy reaching 91.3%, recall at 90.8%, precision at 92.1%, and an F1-score of 91.4%. In contrast, the Sigmoid kernel’s performance was lower, with an accuracy of 85.6%, recall of 84.2%, precision of 86.5%, and an F1-score of 85.3%. This clearly indicates that the RBF kernel is more effective in identifying cases of stunting. The Linear Regression model achieved a Mean Squared Error (MSE) of 0.137, which reflects a good level of predictive accuracy, though there is still potential for refinement to improve precision. In our clustering analysis, the WP+K-Medoids method outperformed the conventional K-Medoids approach. It reduced the number of iterations needed for convergence from 7 to 3 and achieved a higher Calinski Harabasz Index of 93.7 compared to 85.2, suggesting better-defined clusters and greater efficiency. These findings underscore the effectiveness of hybrid machine learning models in addressing complex health issues like stunting. The framework we have developed offers a solid foundation for targeted interventions and policy recommendations, potentially contributing to the reduction of stunting in Aceh and similar regions. Future research should aim to incorporate additional machine learning techniques and larger datasets to further refine predictive accuracy and expand the application of this approach in global health.
Author Contributions
Conceptualization, N.H. and R.K.D.; methodology, R.R.; software, T.I.F.; validation, N.H., R.K.D. and R.R.; formal analysis, R.R.; investigation, T.I.F.; resources, N.H.; data curation, R.R.; writing—original draft preparation, R.K.D.; writing—review and editing, N.H.; visualization, R.R.; supervision, N.H.; project administration, R.K.D. All authors have read and agreed to the published version of the manuscript.
Funding
This research was financially supported by the Ministry of Education, Culture, Research, and Technology of the Republic of Indonesia (Kementerian Pendidikan, Kebudayaan, Riset dan Teknologi, Republik Indonesia) for the fiscal year 2024 under the Regular Fundamental Basic Research program (Penelitian Dasar Fundamental Reguler), contract number (115/E5/PG.02.00.PL/2024, 078/LL13/AL.04/AKA.PL/2024, 011/LPPM-UNIKI/PDF/2024).
Institutional Review Board Statement
Not applicable.
Informed Consent Statement
Not applicable.
Data Availability Statement
Not applicable.
Acknowledgments
We extend our heartfelt appreciation to everyone who contributed to the successful completion of this research. Special thanks go to the Direktorat Riset, Teknologi, Pengabdian Kepada Masyarakat (DRTPM), Ministry of Education, Culture, Research, and Technology of the Republic of Indonesia for placing their trust in our ability to carry out this project.
Conflicts of Interest
The authors declare no conflicts of interest.
References
- Dewi, R.; Maisyura, M.; Fitri, D.; Malahayati, M.; Adila, J.; Hasyem, M. Sustainable Development: The Role of Related Government Departments in Stunting Reduction Policy in Aceh, Indonesia. Proc. Int. Conf. Soc. Sci. Politi- Sci. Humanit. (Icospolhum) 2024, 4, 00021–00021. [Google Scholar] [CrossRef]
- Setyawati, L. INCREASED STUNTING CASES DUE TO FOOD INSECURITY AND THE NUTRITION IMPACT OF THE COVID-19 PANDEMIC. Muhammadiyah Int. Public Heal. Med. Proceeding 2022, 2, 205–223. [Google Scholar] [CrossRef]
- Gizaw, Z.; Yalew, A.W.; Bitew, B.D.; Lee, J.; Bisesi, M. Stunting among children aged 24–59 months and associations with sanitation, enteric infections, and environmental enteric dysfunction in rural northwest Ethiopia. Scientific Reports 2022, 12, 19293. [Google Scholar] [CrossRef] [PubMed]
- Noor, M.S.; Andrestian, M.D.; Dina, R.A.; Ferdina, A.R.; Dewi, Z.; Hariati, N.W.; Khomsan, A. Analysis of socioeconomic, utilization of maternal health services, and toddler’s characteristics as stunting risk factors. Nutrients 2022, 14, 4373. [Google Scholar] [CrossRef] [PubMed]
- Colin, C.A. Assessment of vine performance and grape composition in a vineyard established in Clos des Baobabs, Nguekhokh (Senegal) under fertirrigation. Ph.D. dissertation, Instituto Superior de Agronomia, Universidade de Lisboa, Lisbon, Portugal, 2023. [Google Scholar]
- Williamson, S.M.; Prybutok, V. The Era of Artificial Intelligence Deception: Unraveling the Complexities of False Realities and Emerging Threats of Misinformation. Information 2024, 15, 299. [Google Scholar] [CrossRef]
- Thethi, S.K. Machine learning models for cost-effective healthcare delivery systems: A global perspective. in Digital Transformation in Healthcare 5.0: Volume 1: IoT, AI and Digital Twin. 2024, 1, 199. [Google Scholar]
- Lu, Y. Using Machine Learning Algorithms to Design Personalized Exercise Programs for Health and Wellness. Scalable Comput. Pr. Exp. 2023, 24, 463–474. [Google Scholar] [CrossRef]
- Choudhury, P.; Allen, R.T.; Endres, M.G. Machine learning for pattern discovery in management research. Strat. Manag. J. 2020, 42, 30–57. [Google Scholar] [CrossRef]
- Rodrigues, J.F.; Florea, L.; de Oliveira, M.C.F.; Diamond, D.; Oliveira, O.N. Big data and machine learning for materials science. Discov. Mater. 2021, 1, 1–27. [Google Scholar] [CrossRef]
- Ssentongo, P.; Ssentongo, A.E.; Ba, D.M.; Ericson, J.E.; Na, M.; Gao, X.; Fronterre, C.; Chinchilli, V.M.; Schiff, S.J. Global, regional and national epidemiology and prevalence of child stunting, wasting and underweight in low- and middle-income countries, 2006–2018. Sci. Rep. 2021, 11, 1–12. [Google Scholar] [CrossRef]
- Vu, N.U. Childhood stunting prediction in Bangladesh: A machine learning approach. Ph.D. dissertation, Tilburg University, Tilburg, Netherlands, 2022. [Google Scholar]
- Anku, E.K.; Duah, H.O. Predicting and identifying factors associated with undernutrition among children under five years in Ghana using machine learning algorithms. PLoS ONE 2024, 19, e0296625. [Google Scholar] [CrossRef] [PubMed]
- El Kafrawy, P.; Fathi, H.; Qaraad, M.; Kelany, A.K.; Chen, X. An Efficient SVM-Based Feature Selection Model for Cancer Classification Using High-Dimensional Microarray Data. IEEE Access 2021, 9, 155353–155369. [Google Scholar] [CrossRef]
- Roy, A.; Chakraborty, S. Support vector machine in structural reliability analysis: A review. Reliab. Eng. Syst. Saf. 2023, 233. [Google Scholar] [CrossRef]
- Miller, C.H.; Sacchet, M.D.; Gotlib, I.H. Support Vector Machines and Affective Science. Emot. Rev. 2020, 12, 297–308. [Google Scholar] [CrossRef]
- Okwuashi, O.; Ndehedehe, C.E. Deep support vector machine for hyperspectral image classification. Pattern Recognit. 2020, 103, 107298. [Google Scholar] [CrossRef]
- Ding, X.; Liu, J.; Yang, F.; Cao, J. Random radial basis function kernel-based support vector machine. J. Frankl. Inst. 2021, 358, 10121–10140. [Google Scholar] [CrossRef]
- Almaiah, M.A.; Almomani, O.; Alsaaidah, A.; Al-Otaibi, S.; Bani-Hani, N.; Hwaitat, A.K.A.; Aldhyani, T.H. Performance investigation of principal component analysis for intrusion detection system using different support vector machine kernels. Electronics 2022, 11, 3571. [Google Scholar] [CrossRef]
- Shen, H.; Zhao, H.; Jiang, Y. Machine Learning Algorithms for Predicting Stunting among Under-Five Children in Papua New Guinea. Children 2023, 10, 1638. [Google Scholar] [CrossRef]
- Harrison, E.; Syed, S.; Ehsan, L.; Iqbal, N.T.; Sadiq, K.; Umrani, F.; Ahmed, S.; Rahman, N.; Jakhro, S.; Ma, J.Z.; et al. Machine learning model demonstrates stunting at birth and systemic inflammatory biomarkers as predictors of subsequent infant growth—A four-year prospective study. BMC Pediatr. 2020, 20, 1–10. [Google Scholar] [CrossRef]
- Kananura, R.M. Machine learning predictive modelling for identification of predictors of acute respiratory infection and diarrhoea in Uganda’s rural and urban settings. PLOS Glob. Public Heal. 2022, 2, e0000430. [Google Scholar] [CrossRef]
- Nunes, P.; Santos, J.; Rocha, E. Challenges in predictive maintenance—A review. CIRP Journal of Manufacturing Science and Technology 2023, 40, 53–67. [Google Scholar] [CrossRef]
- Padigapati, V.N.S.; Singh, A.; Velayudhan, P.K.; Perumal, A.; Ramalingam, S. Examining the Prevalence and Predictors of Stunting in Indian Children: A Spatial and Multilevel Analysis Approach. Agric. Res. 2024, 1–12. [Google Scholar] [CrossRef]
- Kuse, K. A.; Debeko, D.D. Spatial distribution and determinants of stunting, wasting, and underweight in children under five in Ethiopia. BMC Public Health 2023, 23, 641. [Google Scholar] [CrossRef] [PubMed]
- Sowan, B.; Hong, T.-P.; Al-Qerem, A.; Alauthman, M.; Matar, N. Ensembling validation indices to estimate the optimal number of clusters. Appl. Intell. 2022, 53, 9933–9957. [Google Scholar] [CrossRef]
- Sitorus, N.L. The Significance of Tackling Stunting for The Economic Prosperity of A Nation – A Narrative Review. J. Indones. Spéc. Nutr. 2024, 1, 131–137. [Google Scholar] [CrossRef]
- Ilham, M.; Amelia, R. Analysis of risk factors for stunting among toddlers aged 24-59 months in the working area of Cibodasari Puskesmas Community Health Center, Tangerang City. International Journal on ObGyn and Health Sciences 2024, 2, 89–100. [Google Scholar]
- Wand, H.; Naidoo, S.; Govender, V.; Reddy, T.; Moodley, J. Preventing Stunting in South African Children Under 5: Evaluating the Combined Impacts of Maternal Characteristics and Low Socioeconomic Conditions. J. Prev. 2024, 45, 339–355. [Google Scholar] [CrossRef]
- Huang, A.; Zhao, Y.; Cao, C.; Lyu, M.; Tang, K. Integrating interventions supported by development assistance for health into local health system: Evidence from a China–World Bank–UK rural health system strengthening project (1998–2007). BMJ Glob. Heal. 2024, 9, e012853. [Google Scholar] [CrossRef]
- Mondon, C.; Tan, P.Y.; Chan, C.L.; Tran, T.N.; Gong, Y.Y. Prevalence, determinants, intervention strategies and current gaps in addressing childhood malnutrition in Vietnam: A systematic review. BMC Public Heal. 2024, 24, 1–39. [Google Scholar] [CrossRef]
- Haselow, N.J.; Stormer, A.; Pries, A. Evidence-based evolution of an integrated nutrition-focused agriculture approach to address the underlying determinants of stunting. Matern. Child Nutr. 2016, 12 (Suppl. S1), 155–168. [Google Scholar] [CrossRef]
- Dinata, R.K.; Retno, S.; Hasdyna, N. Minimization of the Number of Iterations in K-Medoids Clustering with Purity Algorithm. Rev. D'intelligence Artif. 2021, 35, 193–199. [Google Scholar] [CrossRef]
- Vellido, A. The importance of interpretability and visualization in machine learning for applications in medicine and health care. Neural Comput. Appl. 2019, 32, 18069–18083. [Google Scholar] [CrossRef]
- Hasdyna, N.; Sianipar, B.; Zamzami, E.M. Improving The Performance of K-Nearest Neighbor Algorithm by Reducing The Attributes of Dataset Using Gain Ratio. J. Phys. Conf. Ser. 2020, 1566. [Google Scholar] [CrossRef]
- Ahmed, Z.; Mohamed, K.; Zeeshan, S.; Dong, X. Artificial intelligence with multi-functional machine learning platform development for better healthcare and precision medicine. Database J. Biol. Databases Curation 2020, 2020. [Google Scholar] [CrossRef]
- Gupta, K.; Kumar, P.; Upadhyaya, S.; Poriye, M.; Aggarwal, S. Fuzzy logic and machine learning integration: Enhancing healthcare decision-making. International Journal of Computer Information Systems and Industrial Management Applications 2024, 16, 20–20. [Google Scholar]
- Leung, X.Y.; Islam, R.M.; Adhami, M.; Ilic, D.; McDonald, L.; Palawaththa, S.; Diug, B.; Munshi, S.U.; Karim, N. A systematic review of dengue outbreak prediction models: Current scenario and future directions. PLOS Neglected Trop. Dis. 2023, 17, e0010631. [Google Scholar] [CrossRef]
- Zitnik, M.; Nguyen, F.; Wang, B.; Leskovec, J.; Goldenberg, A.; Hoffman, M.M. Machine learning for integrating data in biology and medicine: Principles, practice, and opportunities. Information Fusion 2019, 50, 71–91. [Google Scholar] [CrossRef]
- Rakotomanana, H. Investigating the causes of child undernutrition and poor development in Vakinankaratra, Madagascar: A mixed-methods study. Doctoral dissertation, Oklahoma State University, Stillwater, OK, USA, 2020. [Google Scholar]
- Cervantes, J.; Garcia-Lamont, F.; Rodríguez-Mazahua, L.; Lopez, A. A comprehensive survey on support vector machine classification: Applications, challenges and trends. Neurocomputing 2020, 408, 189–215. [Google Scholar] [CrossRef]
- Mohammadi, M.; Rashid, T.A.; Karim, S.H.; Aldalwie, A.H.M.; Tho, Q.T.; Bidaki, M.; Rahmani, A.M.; Hosseinzadeh, M. A comprehensive survey and taxonomy of the SVM-based intrusion detection systems. J. Netw. Comput. Appl. 2021, 178. [Google Scholar] [CrossRef]
- Razaque, A.; Frej, M.B.H.; Almi’ani, M.; Alotaibi, M.; Alotaibi, B. Improved Support Vector Machine Enabled Radial Basis Function and Linear Variants for Remote Sensing Image Classification. Sensors 2021, 21, 4431. [Google Scholar] [CrossRef]
- Han, K.-X.; Chien, W.; Chiu, C.-C.; Cheng, Y.-T. Application of Support Vector Machine (SVM) in the Sentiment Analysis of Twitter DataSet. Appl. Sci. 2020, 10, 1125. [Google Scholar] [CrossRef]
- Sharma, R.; Madan, P.; Hariharan, S.; Mahajan, S. Hybrid Radial Basis Function and Support Vector Machine Model for Precise Breast Cancer Diagnosis. In Proceedings of the 2024 International Conference on Computational Intelligence and Computing Applications (ICCICA), vol. 1, May 2024; pp. 35–38. [Google Scholar]
- Das, P.K.; A, D.V.; Meher, S.; Panda, R.; Abraham, A. A Systematic Review on Recent Advancements in Deep and Machine Learning Based Detection and Classification of Acute Lymphoblastic Leukemia. IEEE Access 2022, 10, 81741–81763. [Google Scholar] [CrossRef]
- Staartjes, V.E.; Kernbach, J.M.; Stumpo, V.; van Niftrik, C.H.; Serra, C.; Regli, L. Foundations of feature selection in clinical prediction modeling. In Machine Learning in Clinical Neuroscience: Foundations and Applications. Springer International Publishing, 2022; pp. 51–57. [Google Scholar]
- Ramakrishnan, R.; Kaur, A. An empirical comparison of predictive models for web page performance. Inf. Softw. Technol. 2020, 123, 106307. [Google Scholar] [CrossRef]
- Saâdaoui, F.; Khalfi, M. Revisiting Islamic banking efficiency using multivariate adaptive regression splines. Ann. Oper. Res. 2022, 334, 287–315. [Google Scholar] [CrossRef]
- Islam, U.; Mehmood, G.; Al-Atawi, A.A.; Khan, F.; Alwageed, H.S.; Cascone, L. NeuroHealth guardian: A novel hybrid approach for precision brain stroke prediction and healthcare analytics. J. Neurosci. Methods 2024, 409, 110210. [Google Scholar] [CrossRef]
- Dalmaijer, E.S.; Nord, C.L.; Astle, D.E. Statistical power for cluster analysis. BMC Bioinform. 2022, 23, 1–28. [Google Scholar] [CrossRef]
- Zhao, J.; Li, Z.; Gao, Q.; Zhao, H.; Chen, S.; Huang, L.; Wang, W.; Wang, T. A review of statistical methods for dietary pattern analysis. Nutr. J. 2021, 20, 1–18. [Google Scholar] [CrossRef]
- Ikotun, A.M.; Ezugwu, A.E.; Abualigah, L.; Abuhaija, B.; Heming, J. K-means clustering algorithms: A comprehensive review, variants analysis, and advances in the era of big data. Information Sciences 2023, 622, 178–210. [Google Scholar] [CrossRef]
- Chen, L.; Li, T.; Chen, Y.; Zhao, L.; Zhang, P.L.; Liang, W. Research on Improving Higher Education Exam Quality Based on Weighted k-Medoids Clustering. In International Conference on Computer Science and Education, pp. 194-209, Singapore: Springer Nature Singapore, Dec. 2023.
- A Bhutta, Z.; Akseer, N.; Keats, E.C.; Vaivada, T.; Baker, S.; E Horton, S.; Katz, J.; Menon, P.; Piwoz, E.; Shekar, M.; et al. How countries can reduce child stunting at scale: Lessons from exemplar countries. Am. J. Clin. Nutr. 2020, 112, 894S–904S. [Google Scholar] [CrossRef]
- Gassara, G.; Chen, J. Household Food Insecurity, Dietary Diversity, and Stunting in Sub-Saharan Africa: A Systematic Review. Nutrients 2021, 13, 4401. [Google Scholar] [CrossRef]
- Devarajan, J.P.; Sreedharan, V.R.; Narayanamurthy, G. Decision making in health care diagnosis: Evidence from Parkinson's disease via hybrid machine learning. IEEE Transactions on Engineering Management 2021, 70, 2719–2731. [Google Scholar] [CrossRef]
- Qian, X.; Zhou, Z.; Hu, J.; Zhu, J.; Huang, H.; Dai, Y. A comparative study of kernel-based vector machines with probabilistic outputs for medical diagnosis. Biocybern. Biomed. Eng. 2021, 41, 1486–1504. [Google Scholar] [CrossRef]
- Abbas, S.A.; Aslam, A.; Rehman, A.U.; Abbasi, W.A.; Arif, S.; Kazmi, S.Z.H. K-Means and K-Medoids: Cluster Analysis on Birth Data Collected in City Muzaffarabad, Kashmir. IEEE Access 2020, 8, 151847–151855. [Google Scholar] [CrossRef]
- Akseer, N.; Vaivada, T.; Rothschild, O.; Ho, K.; A Bhutta, Z. Understanding multifactorial drivers of child stunting reduction in Exemplar countries: A mixed-methods approach. Am. J. Clin. Nutr. 2020, 112, 792S–805S. [Google Scholar] [CrossRef]
- Hicdurmaz, B.; Calik, N.; Ustebay, S. Gauss-like Logarithmic Kernel Function to improve the performance of kernel machines on the small datasets. Pattern Recognit. Lett. 2024, 179, 178–184. [Google Scholar] [CrossRef]
- Yet, B.; Başerdem, E.; Rosenstock, T. Secondary data analysis using Evidence-Based Bayesian Networks with an application to investigate the determinants of childhood stunting. Expert Syst. Appl. 2024, 256. [Google Scholar] [CrossRef]
- Dinata, R.K.; Bustami, *!!! REPLACE !!!*; Retno, S. Optimizing the Evaluation of K-means Clustering Using the Weight Product. Rev. D'intelligence Artif. 2024, 38, 1223–1233. [Google Scholar] [CrossRef]
- Zhao, W.; Cao, X.; Li, J.; Xie, Z.; Sun, Y.; Peng, Y. Novel Weighting Method for Evaluating Forest Soil Fertility Index: A Structural Equation Model. Plants 2023, 12, 410. [Google Scholar] [CrossRef]
Figure 1.
The proposed hybrid machine learning framework.
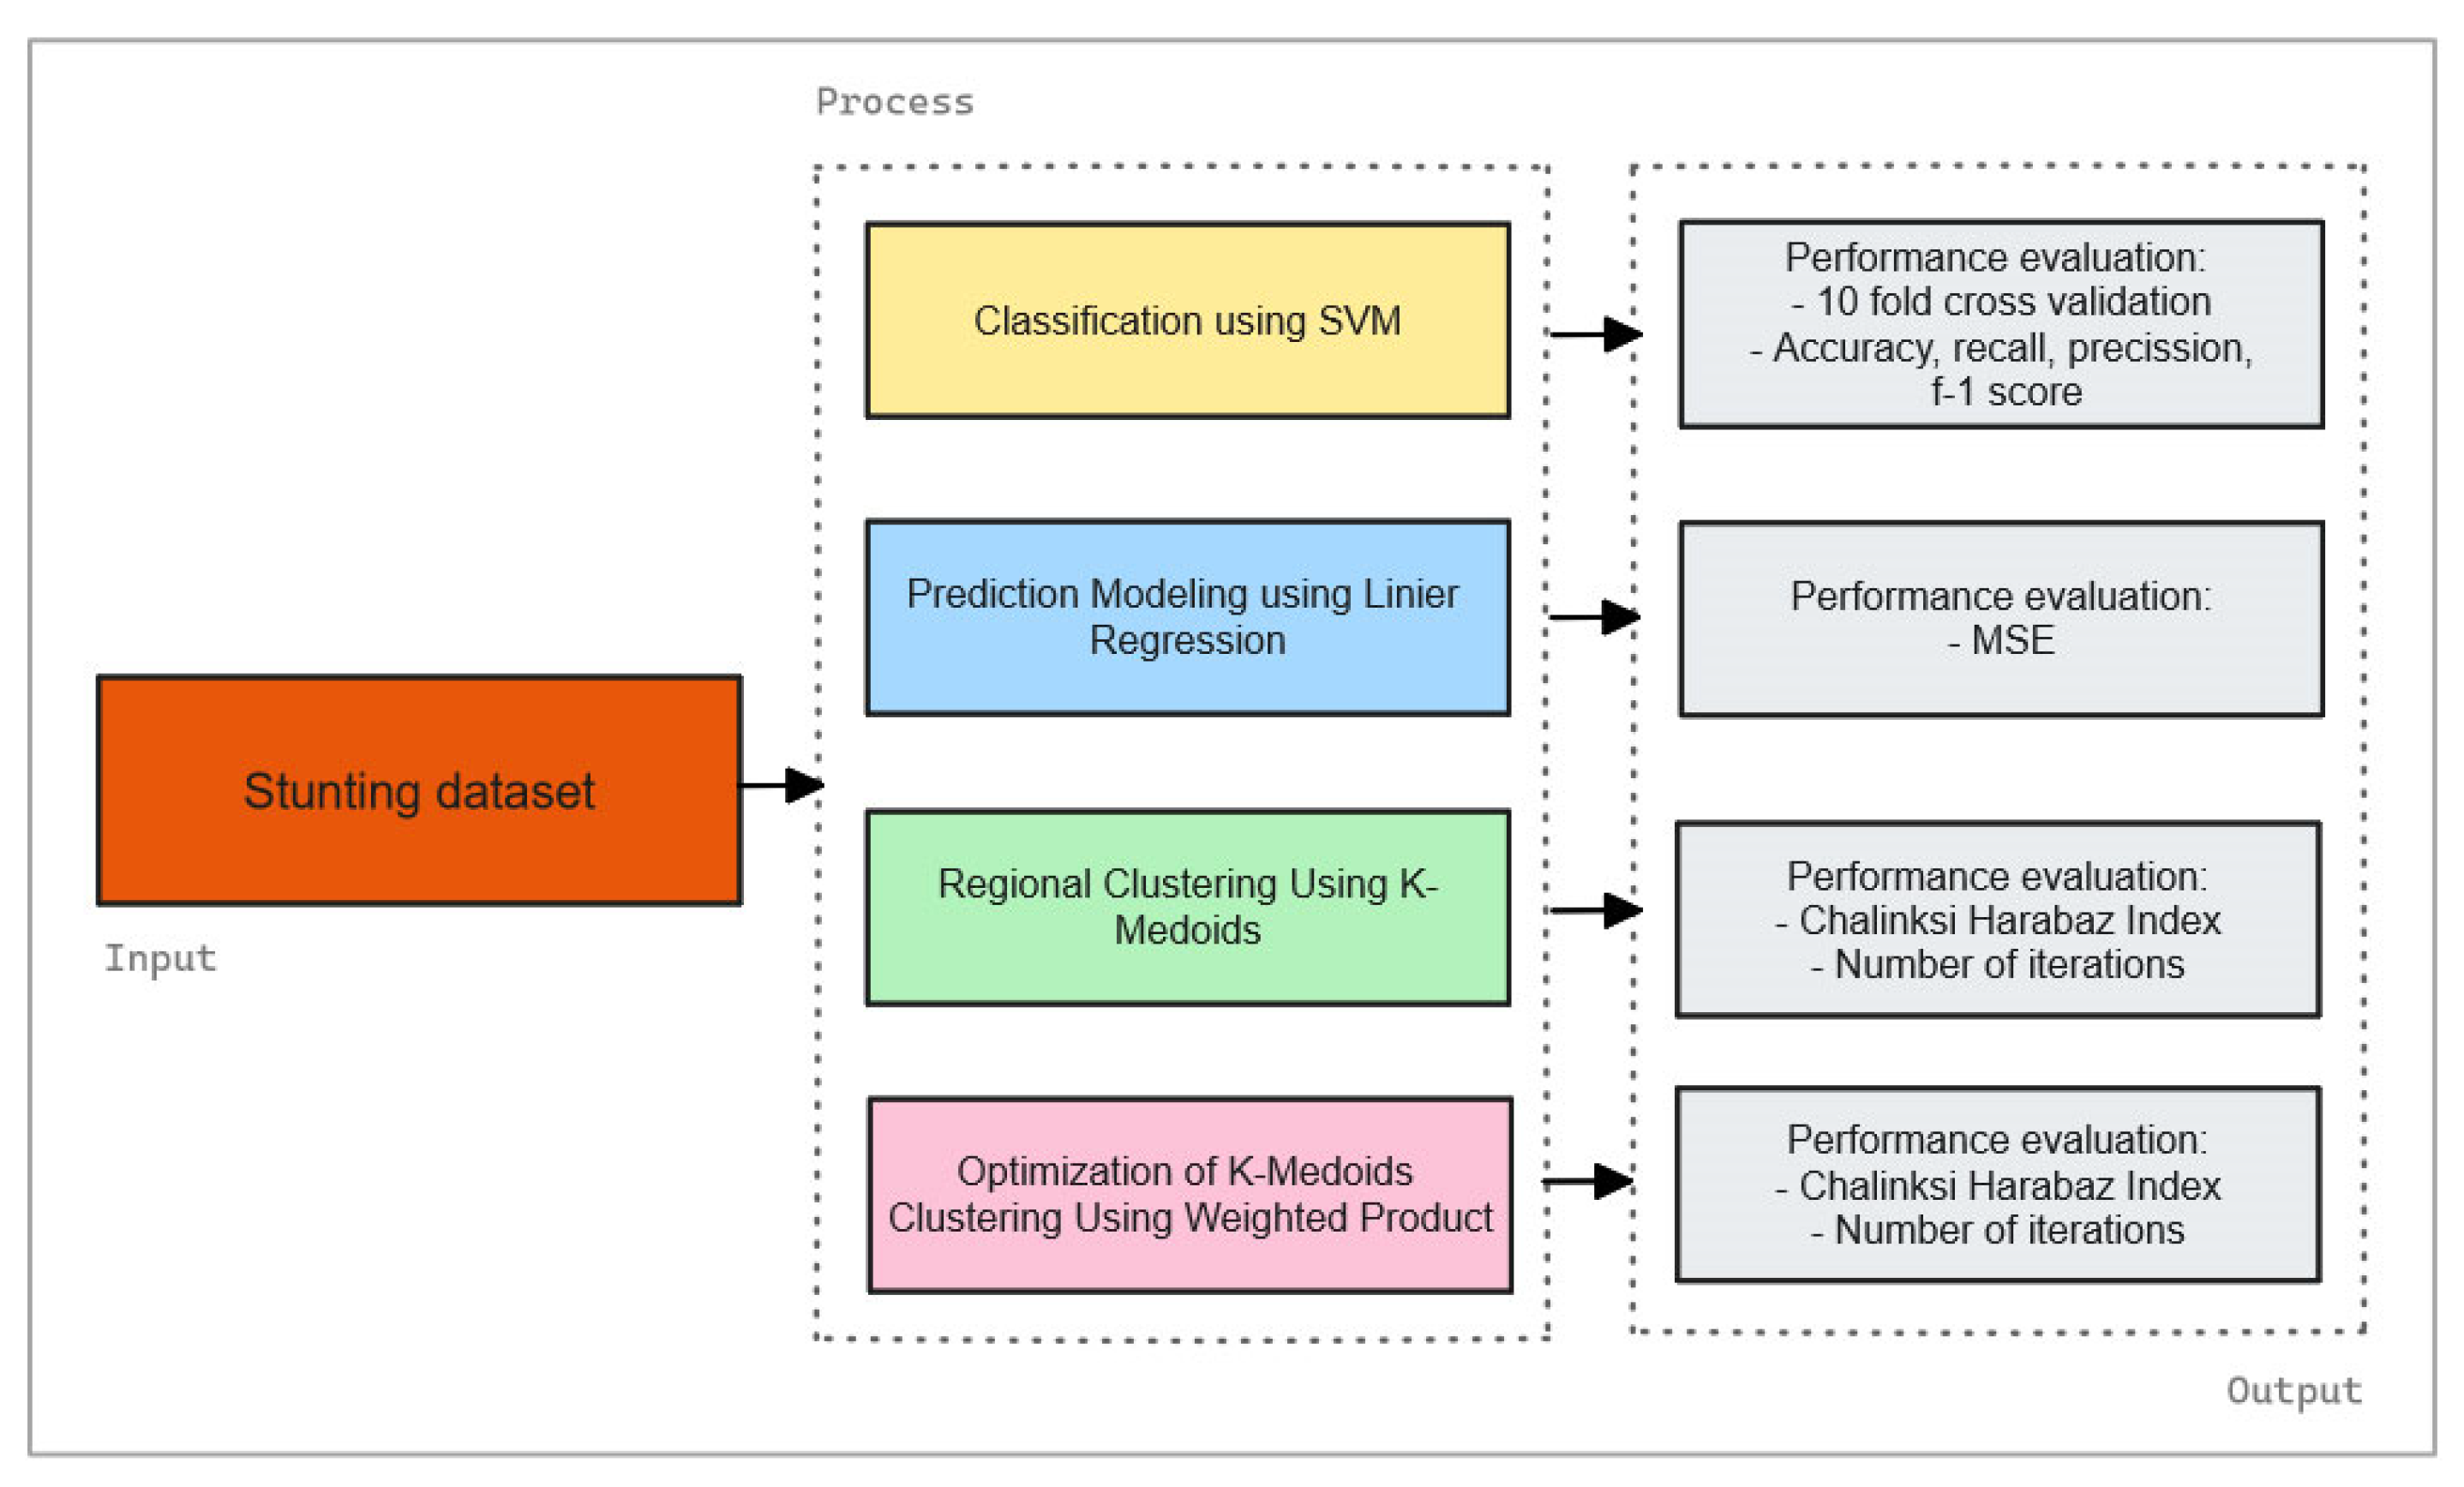
Figure 2.
Framework for Support Vector Machines (SVM).
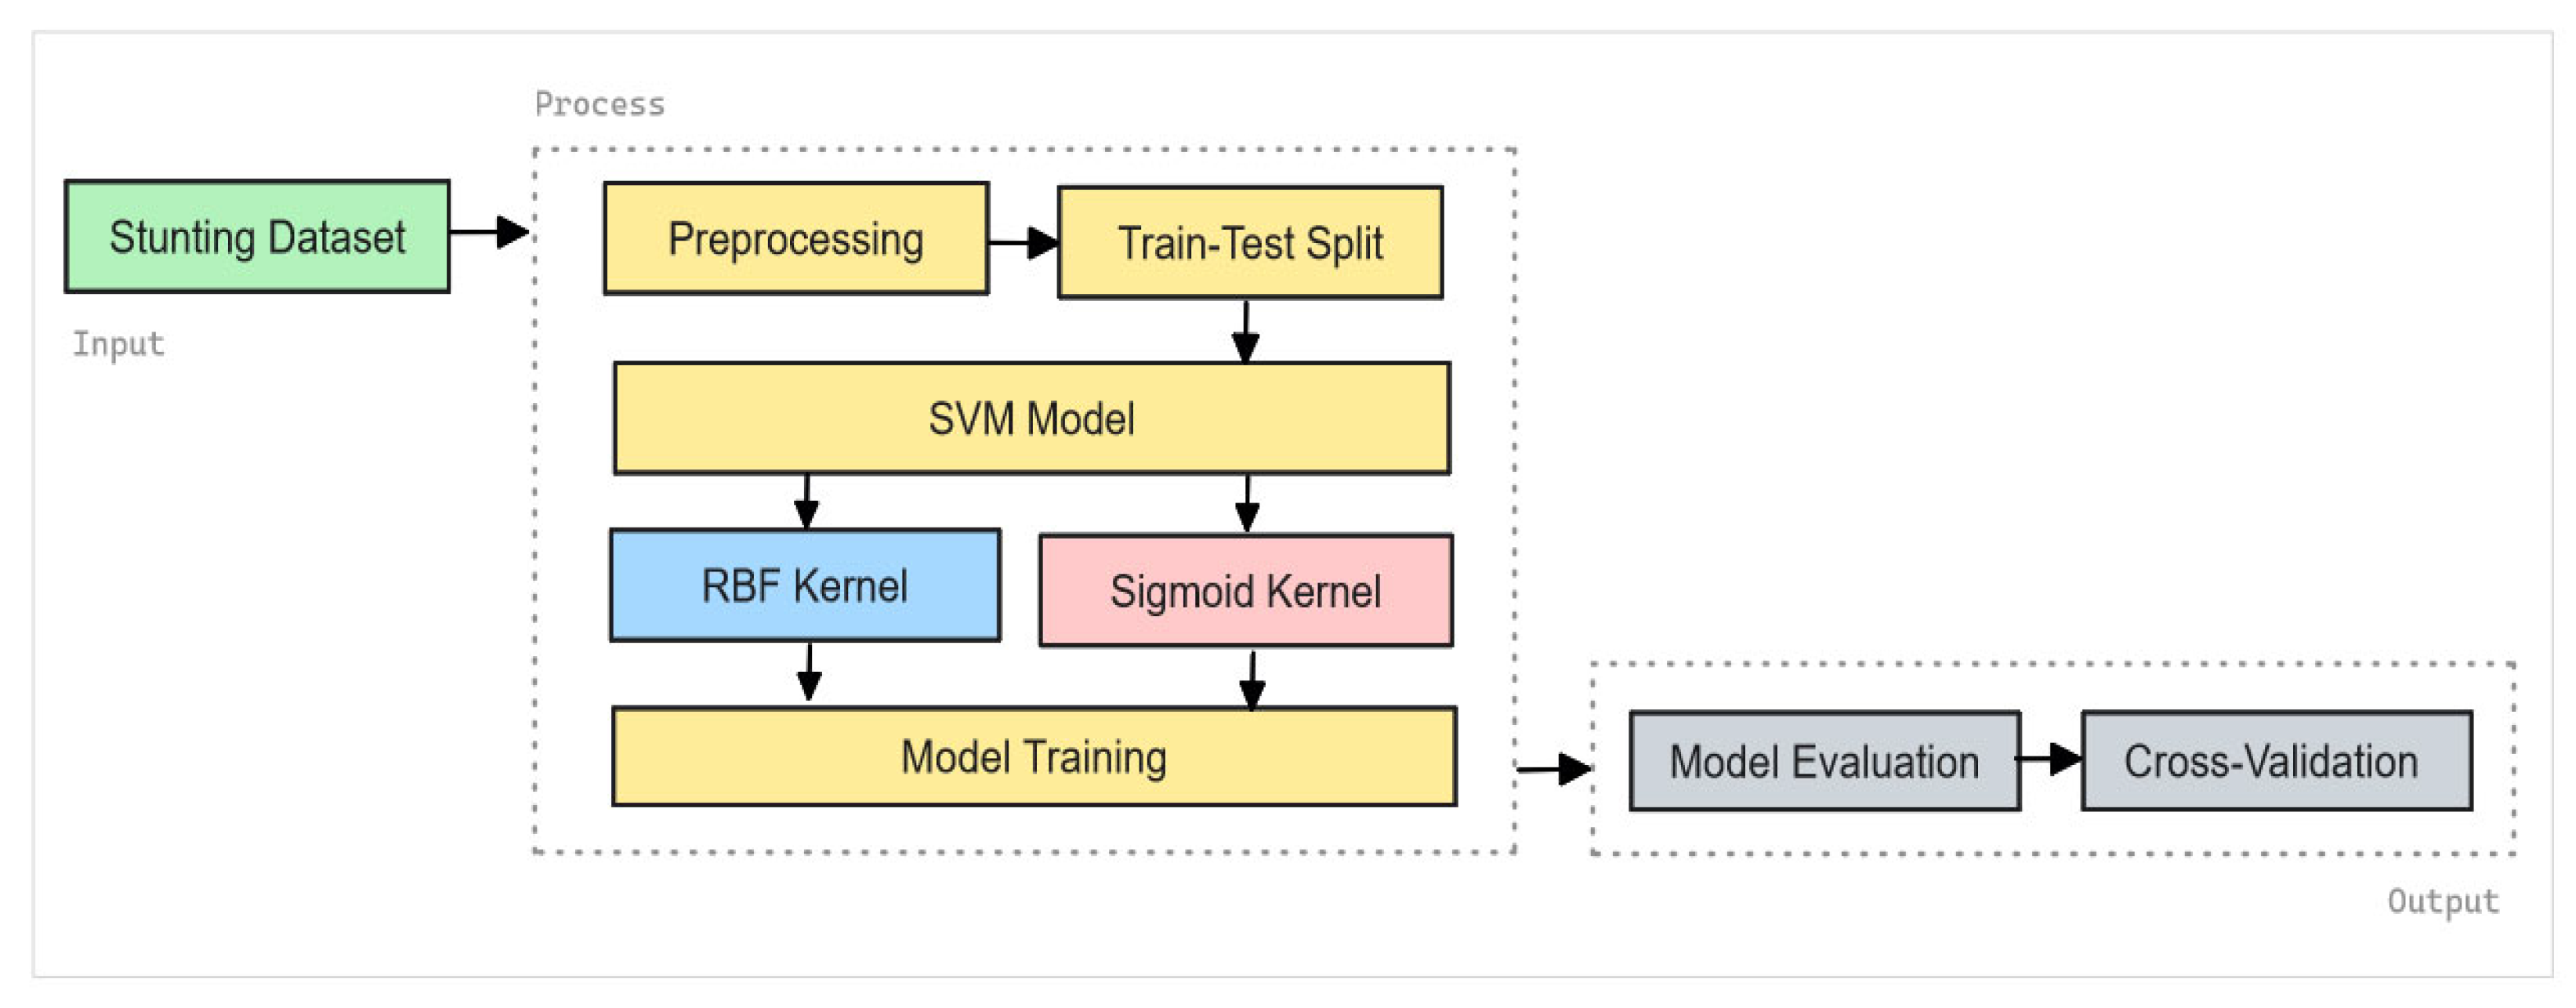
Figure 3.
The Linear Regression (LR) Framework.
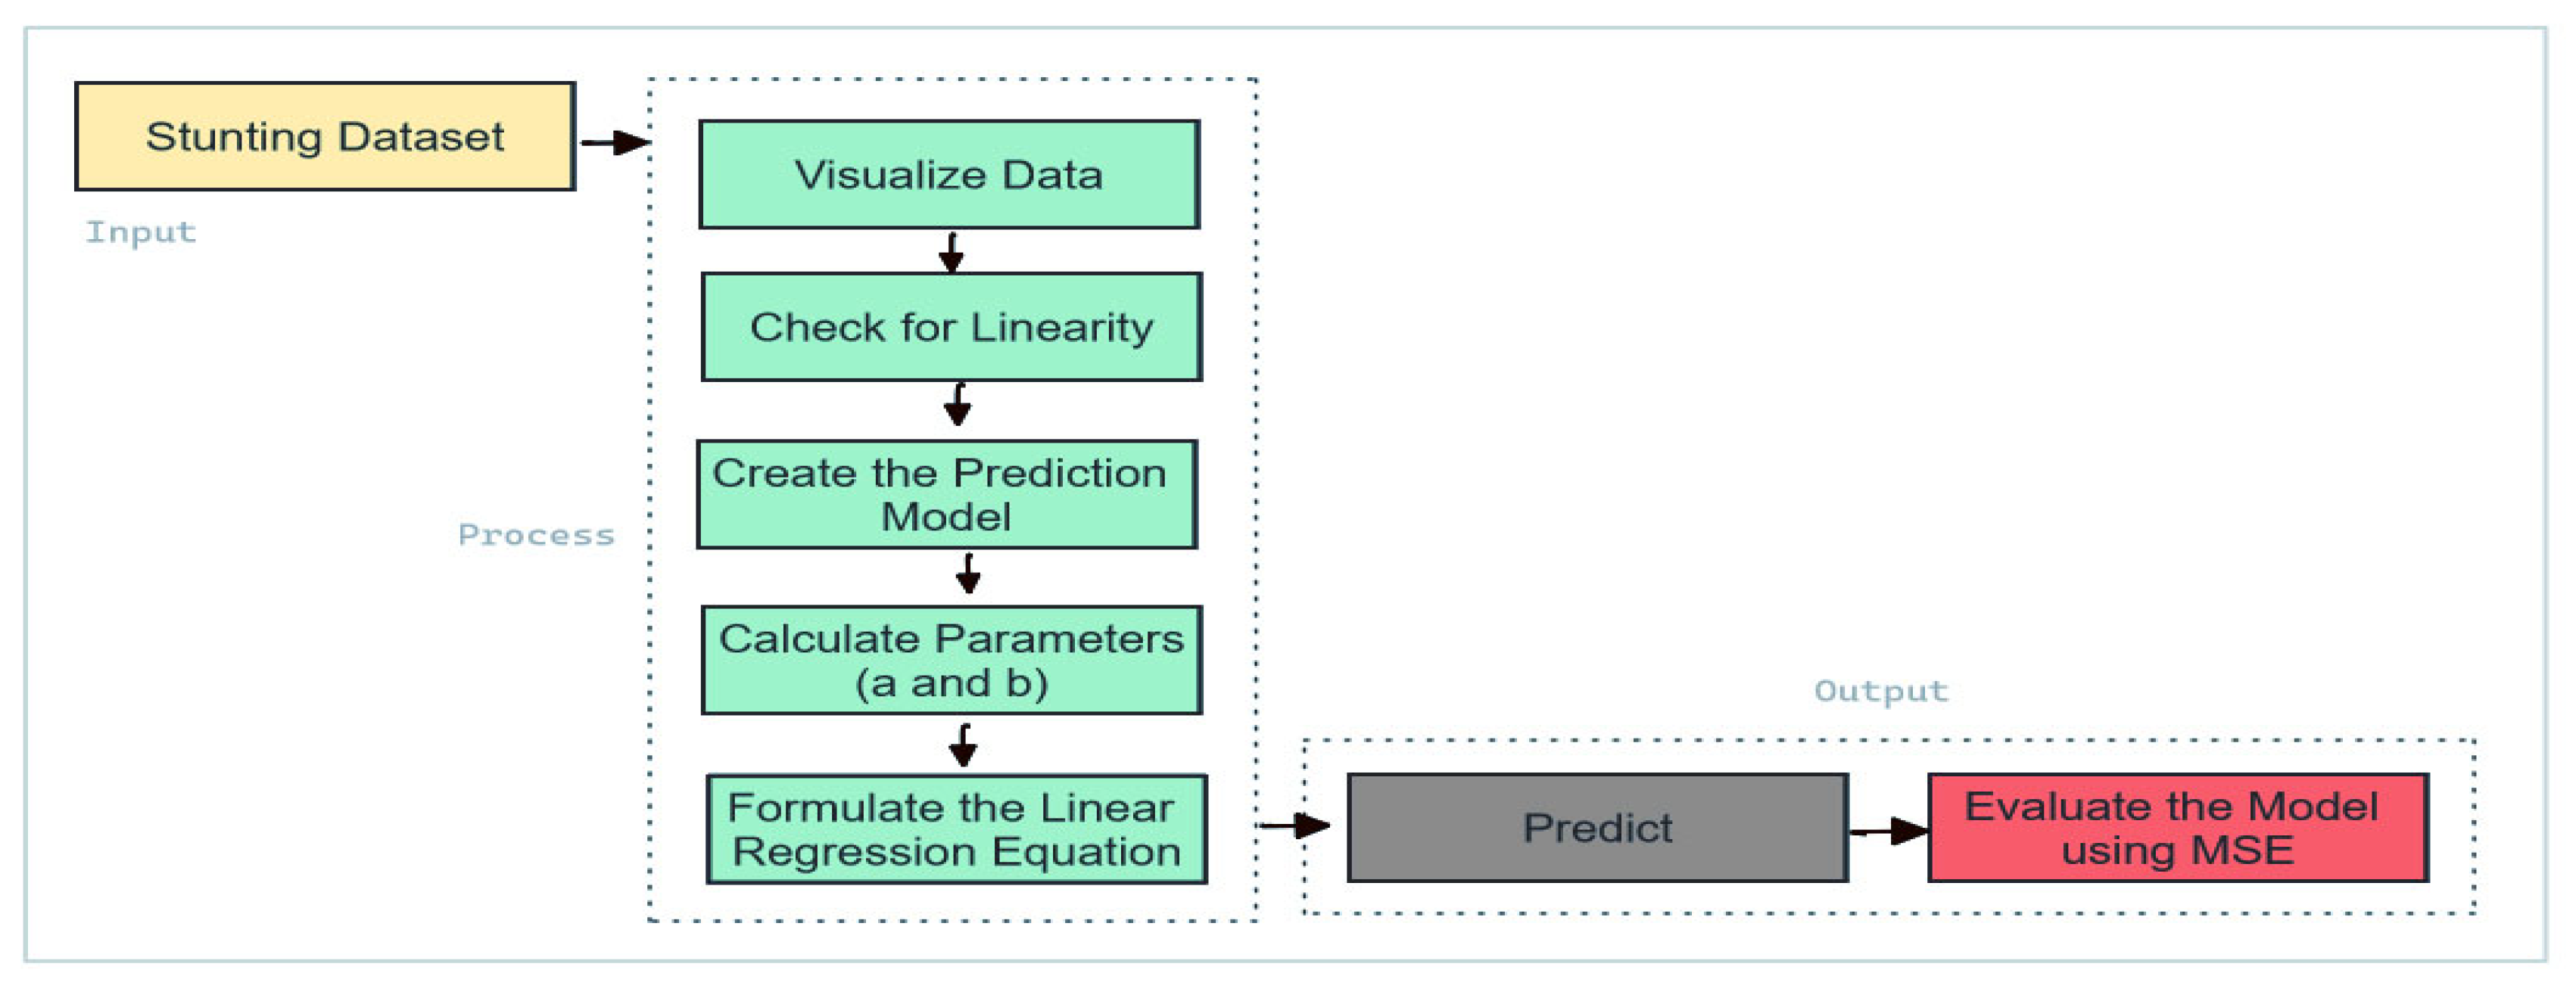
Figure 4.
K-Medoids framework.
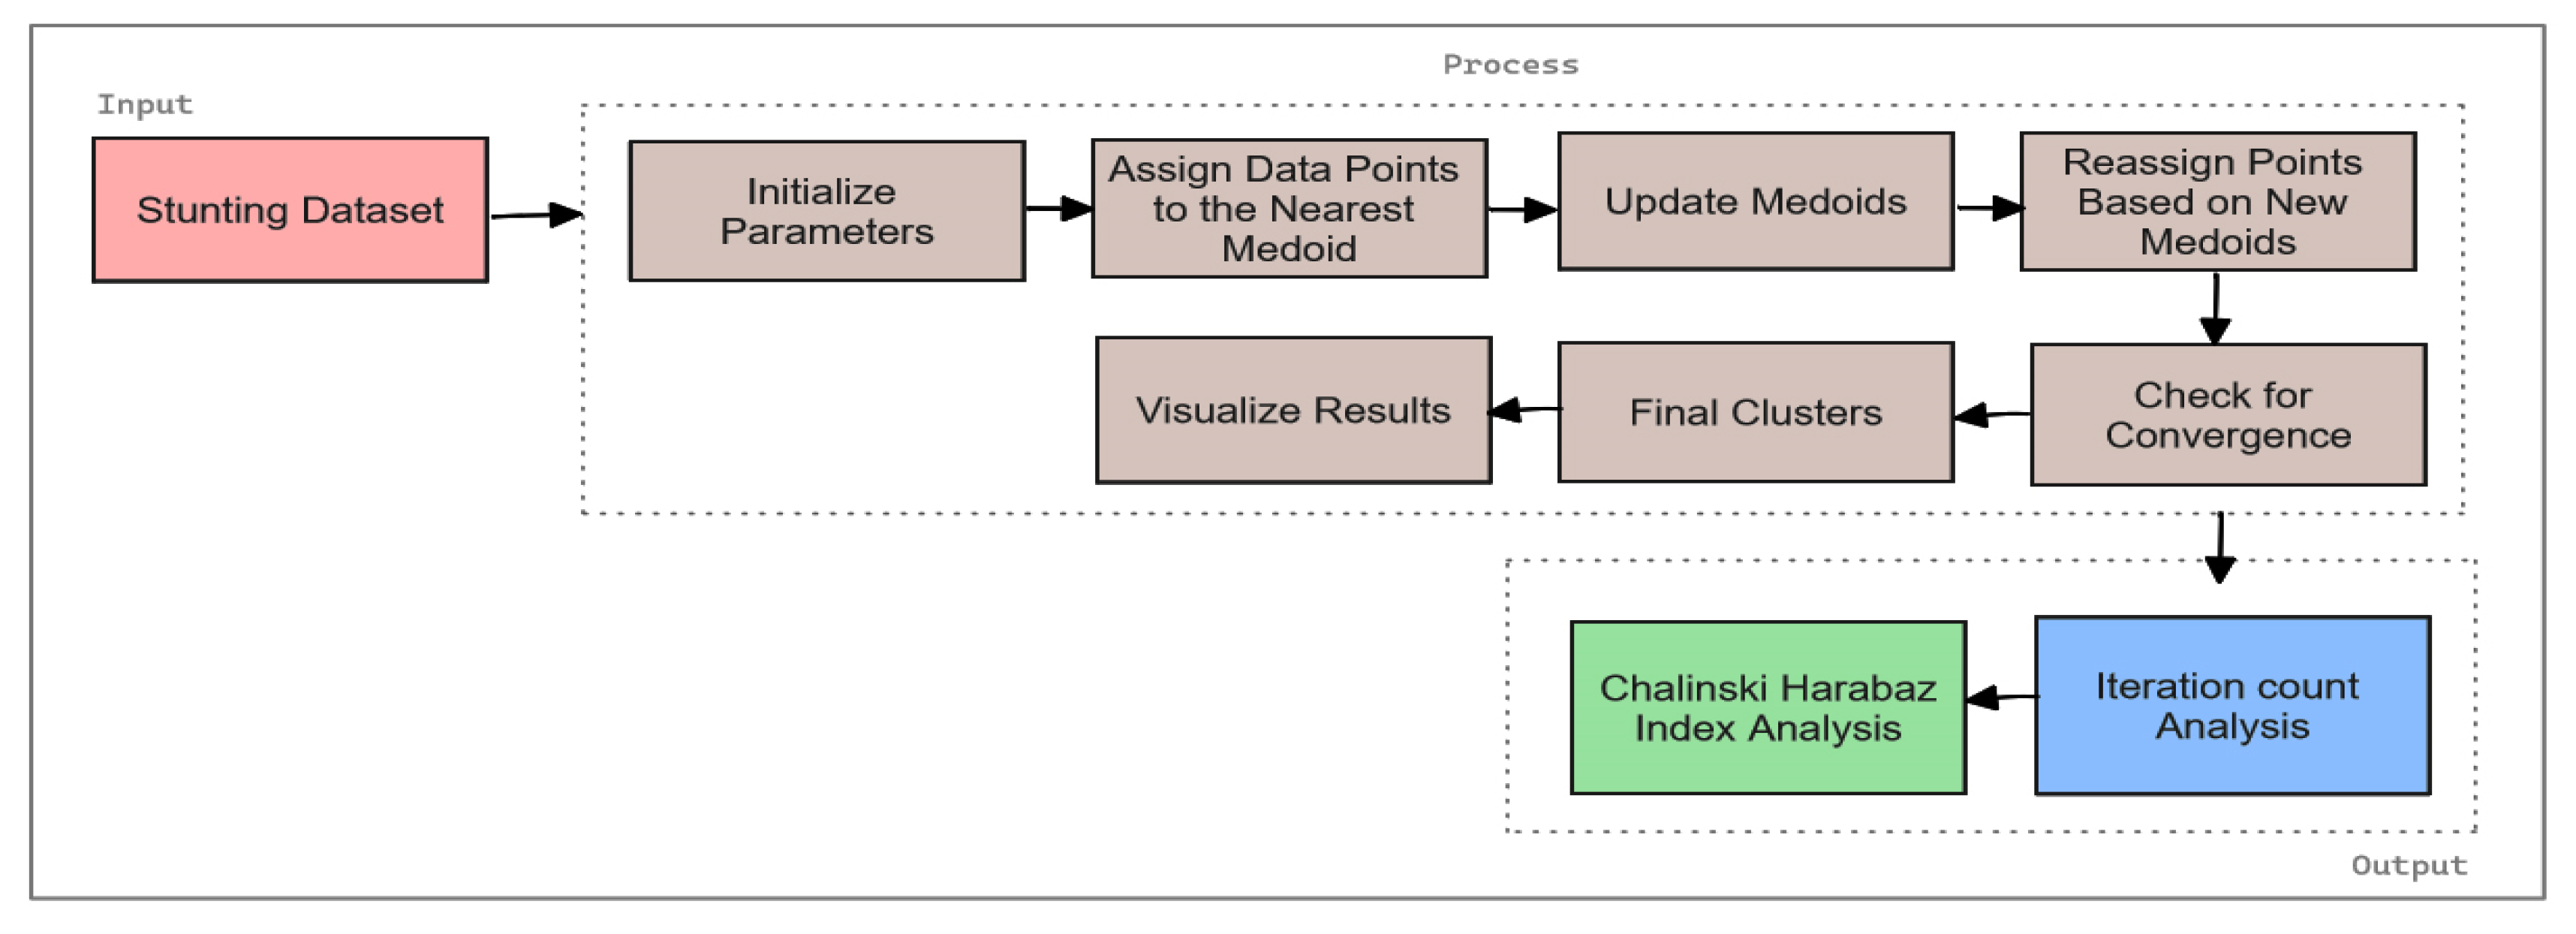
Figure 5.
Framework for K-Medoids Optimization Using the Weight Product Method.
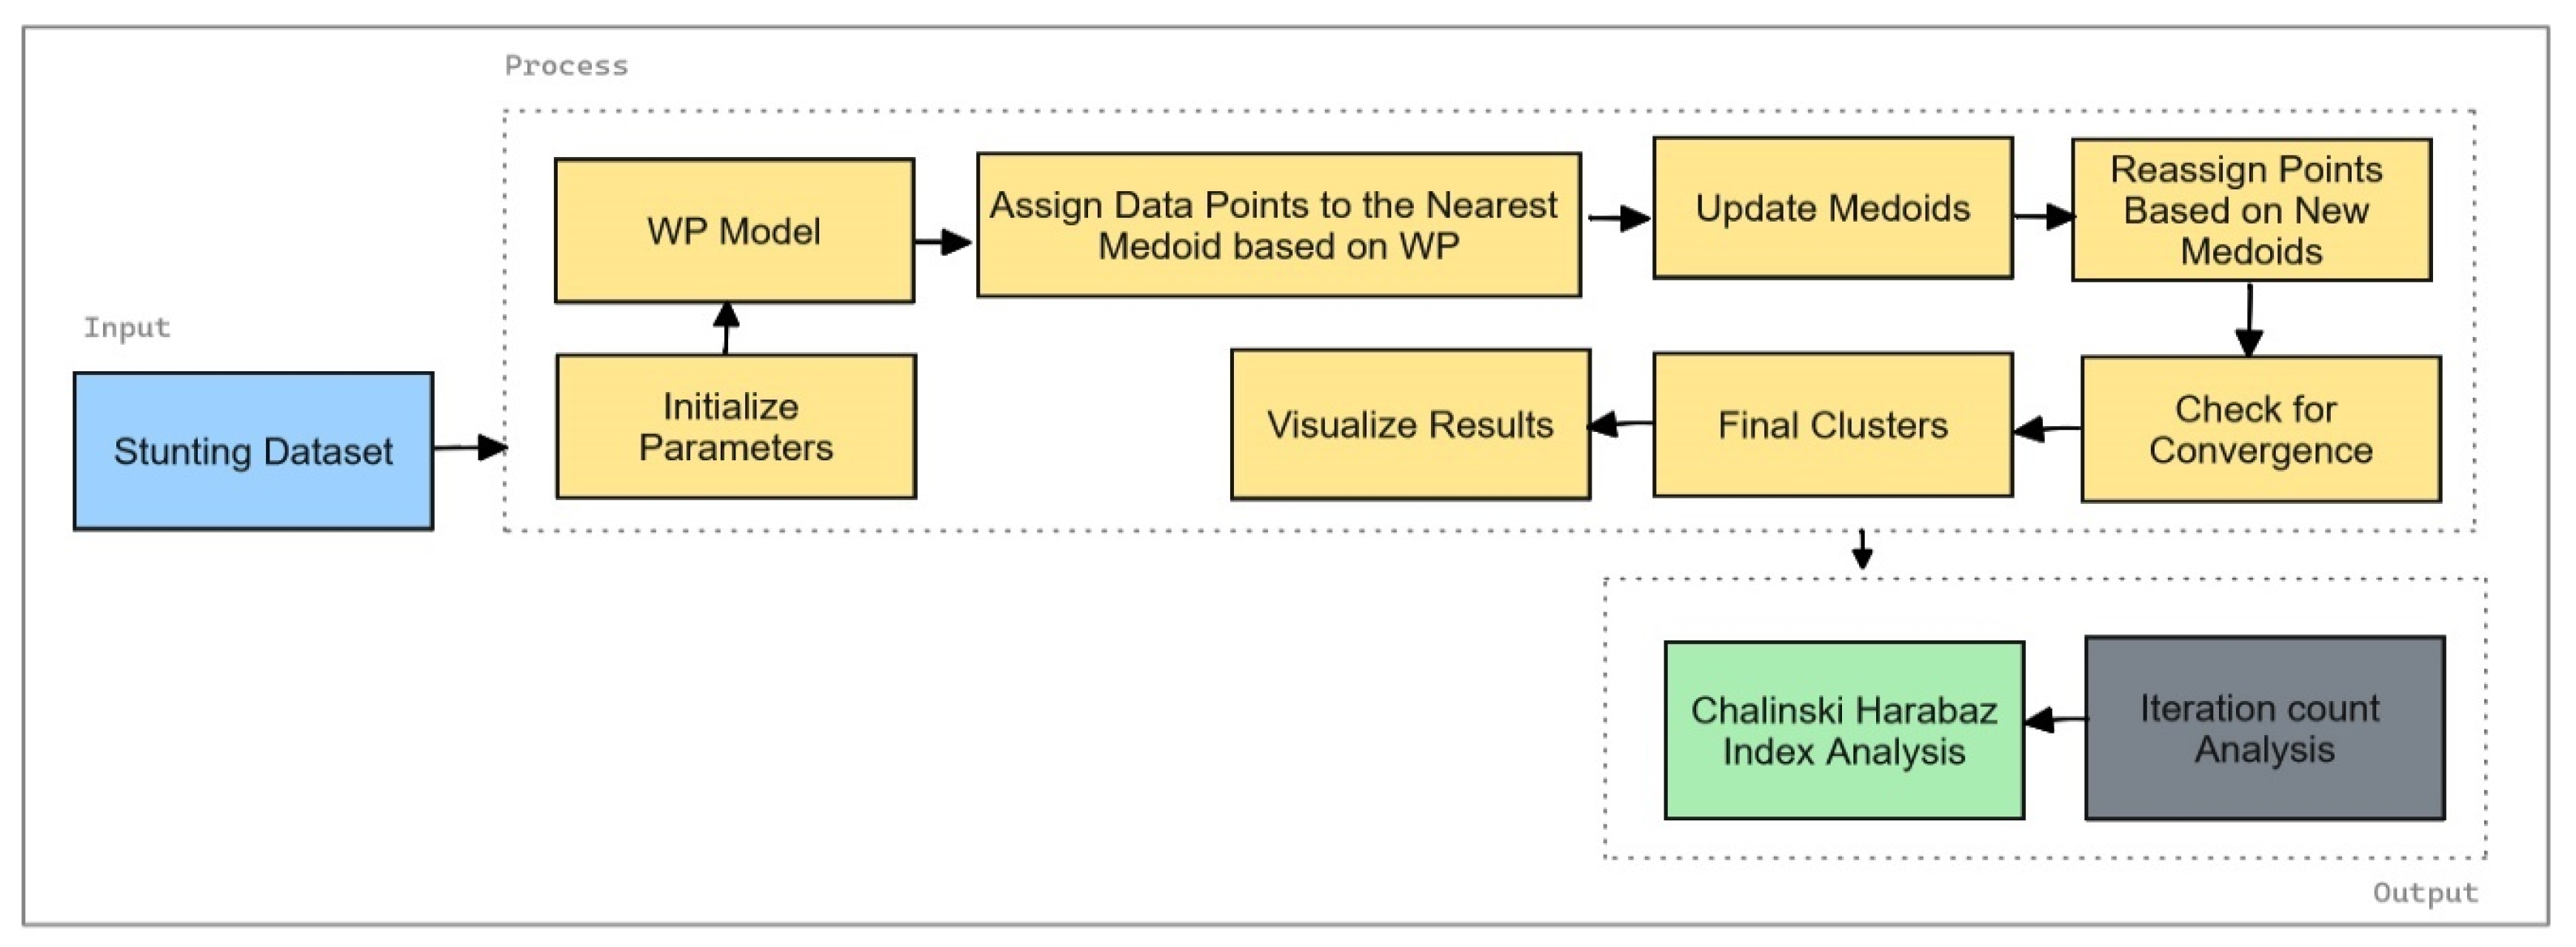
Figure 6.
The results of the 10-fold cross-validation for the RBF Kernel in SVM.
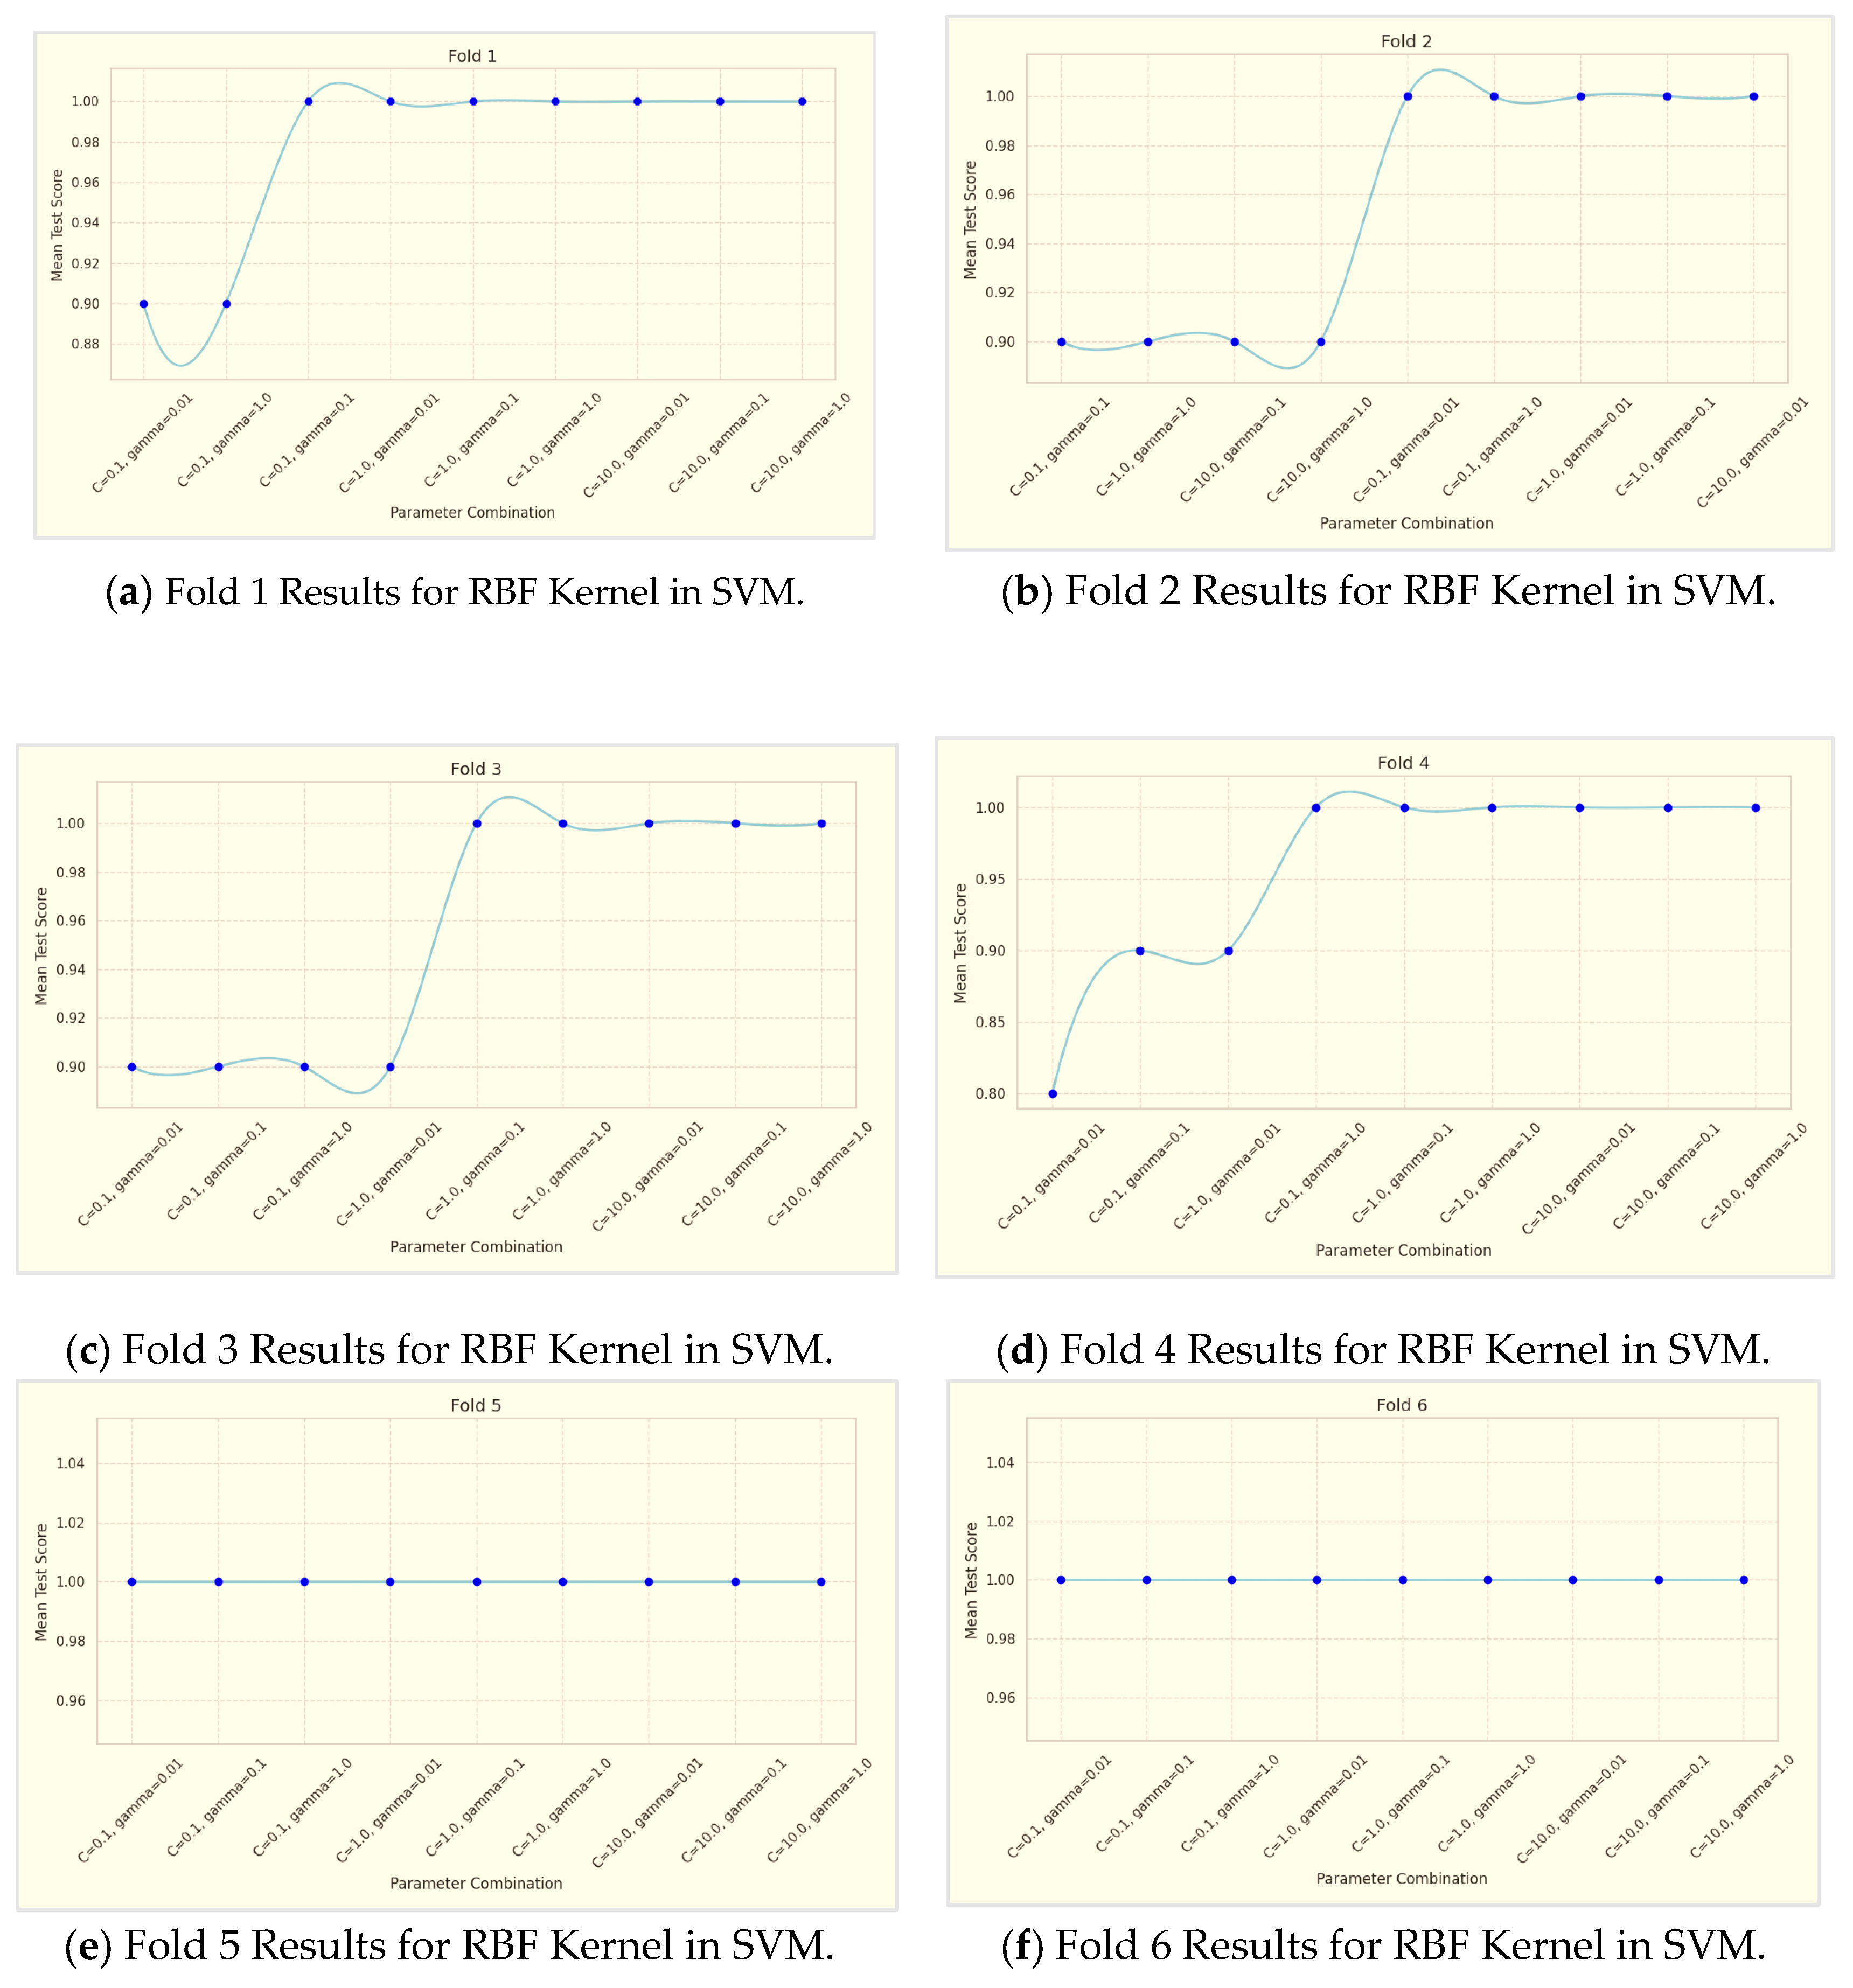
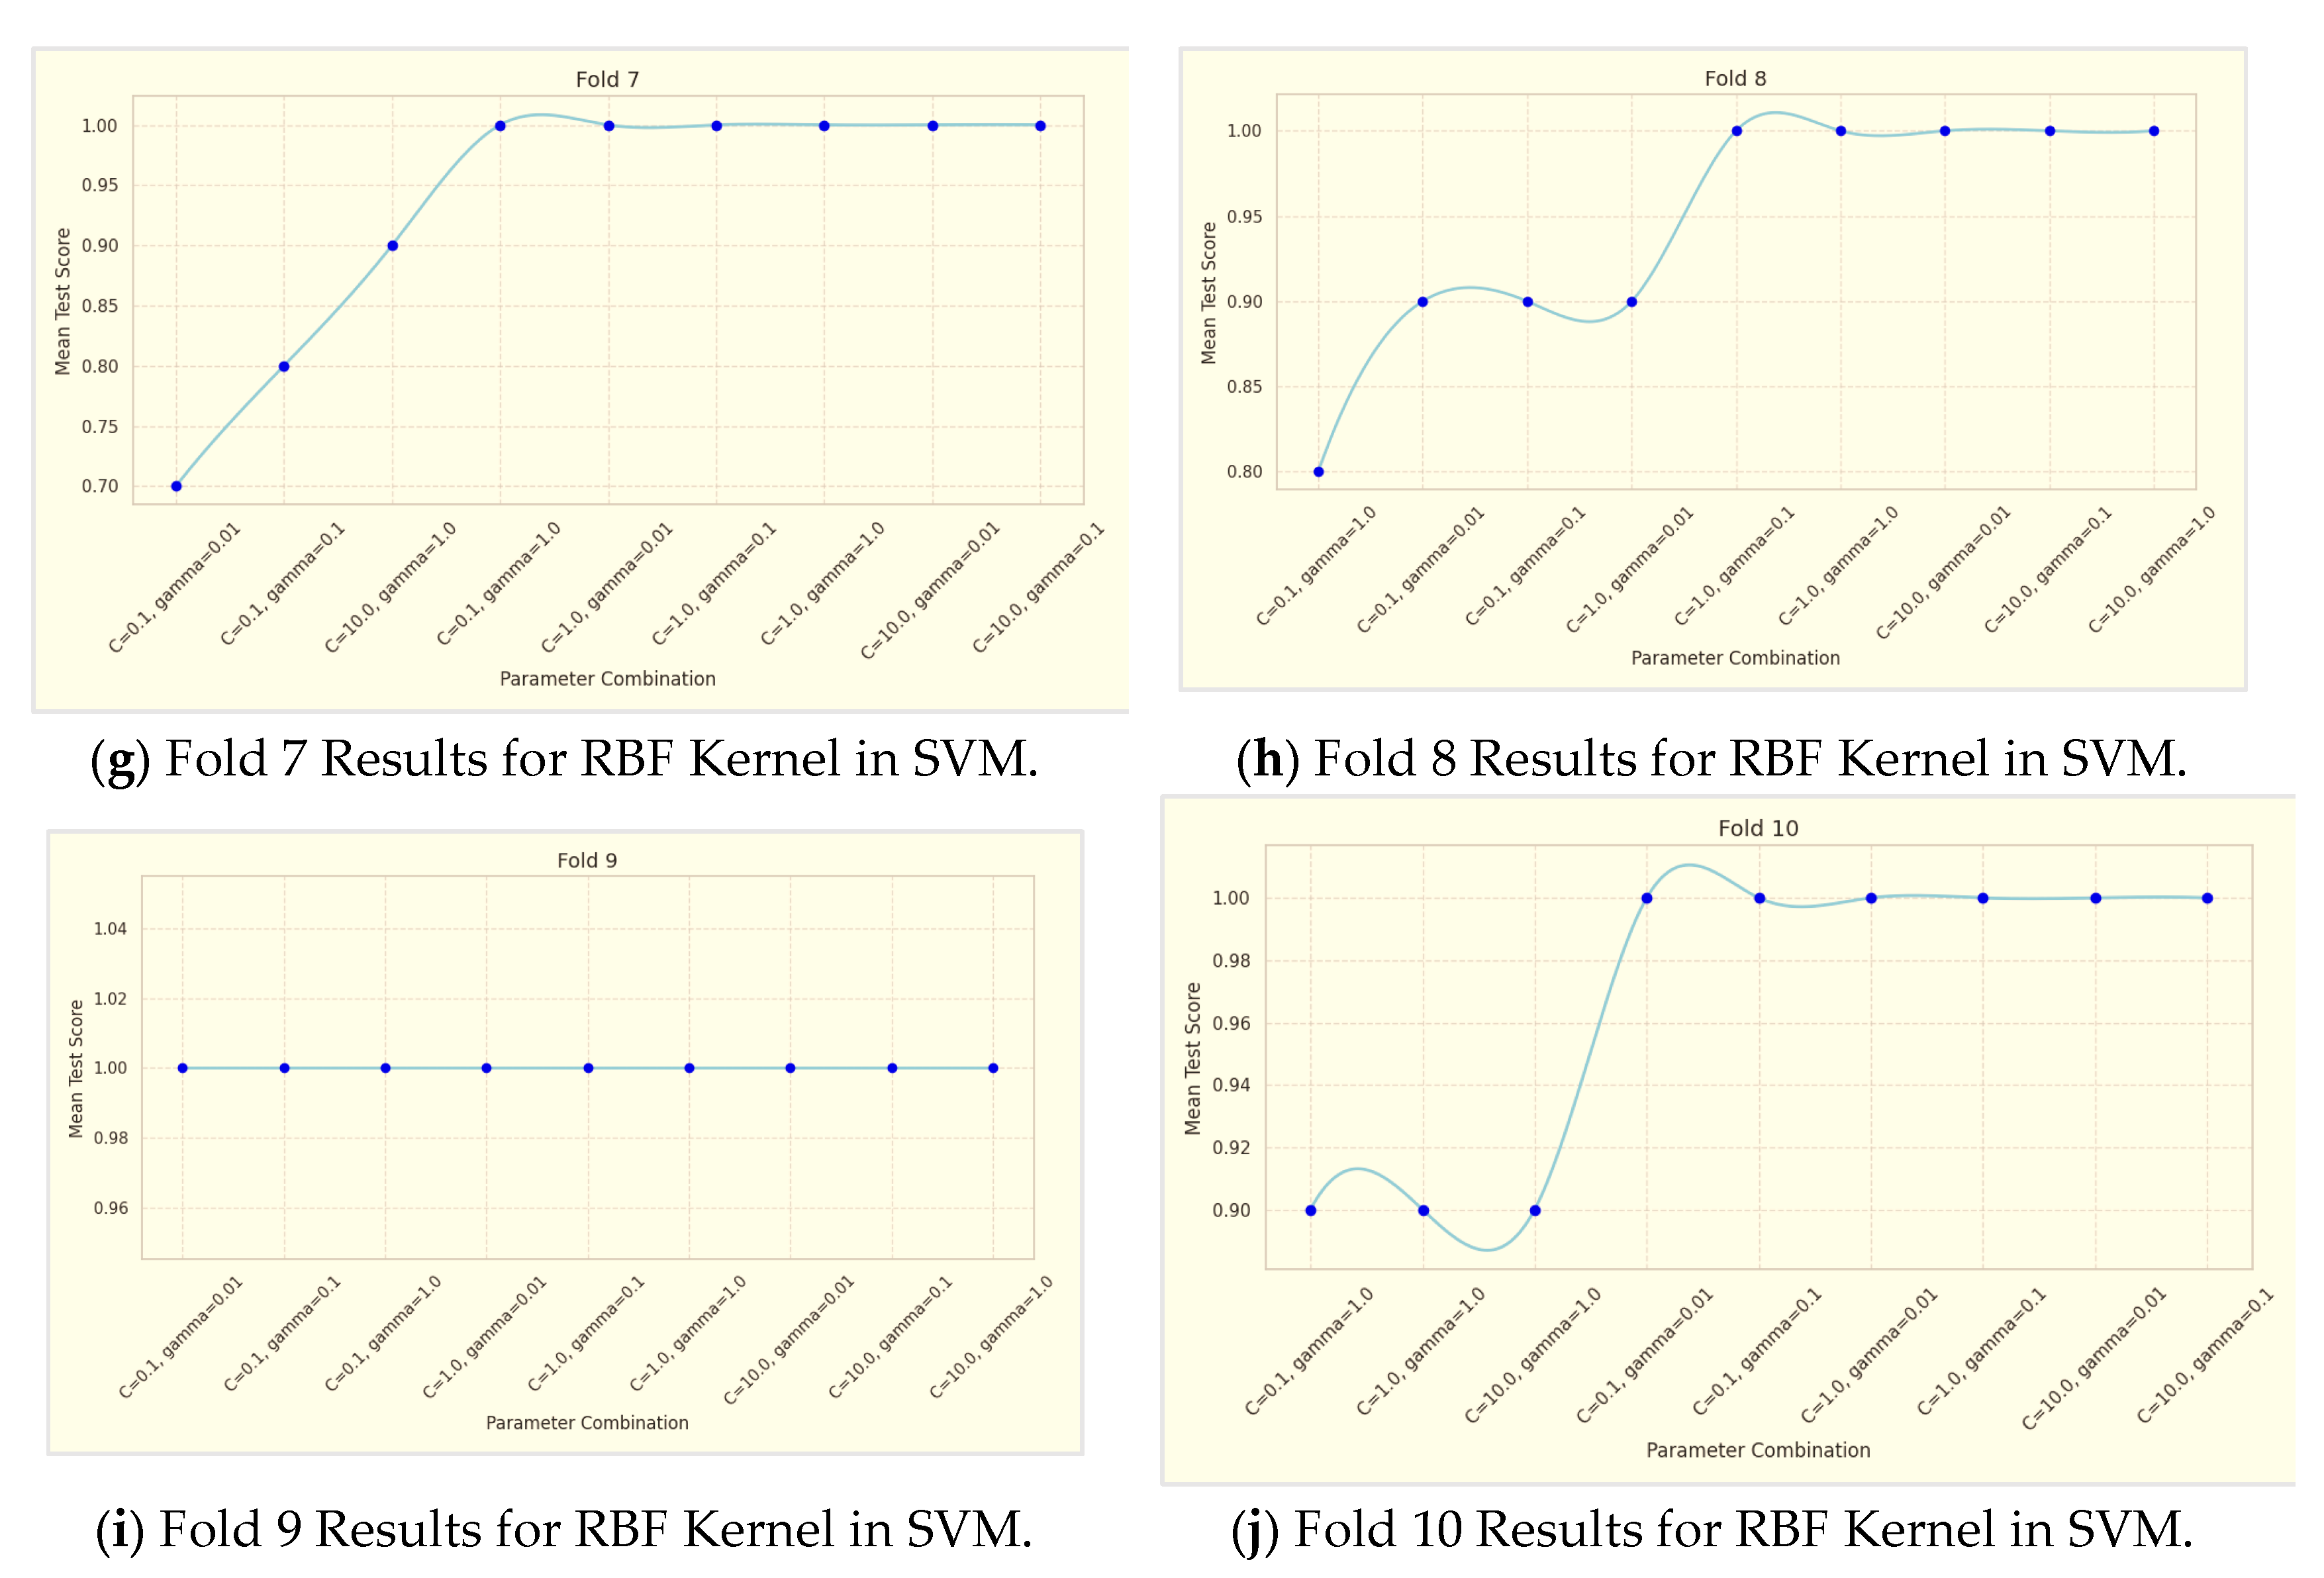
Figure 7.
Confusion matrices for RBF kernel.
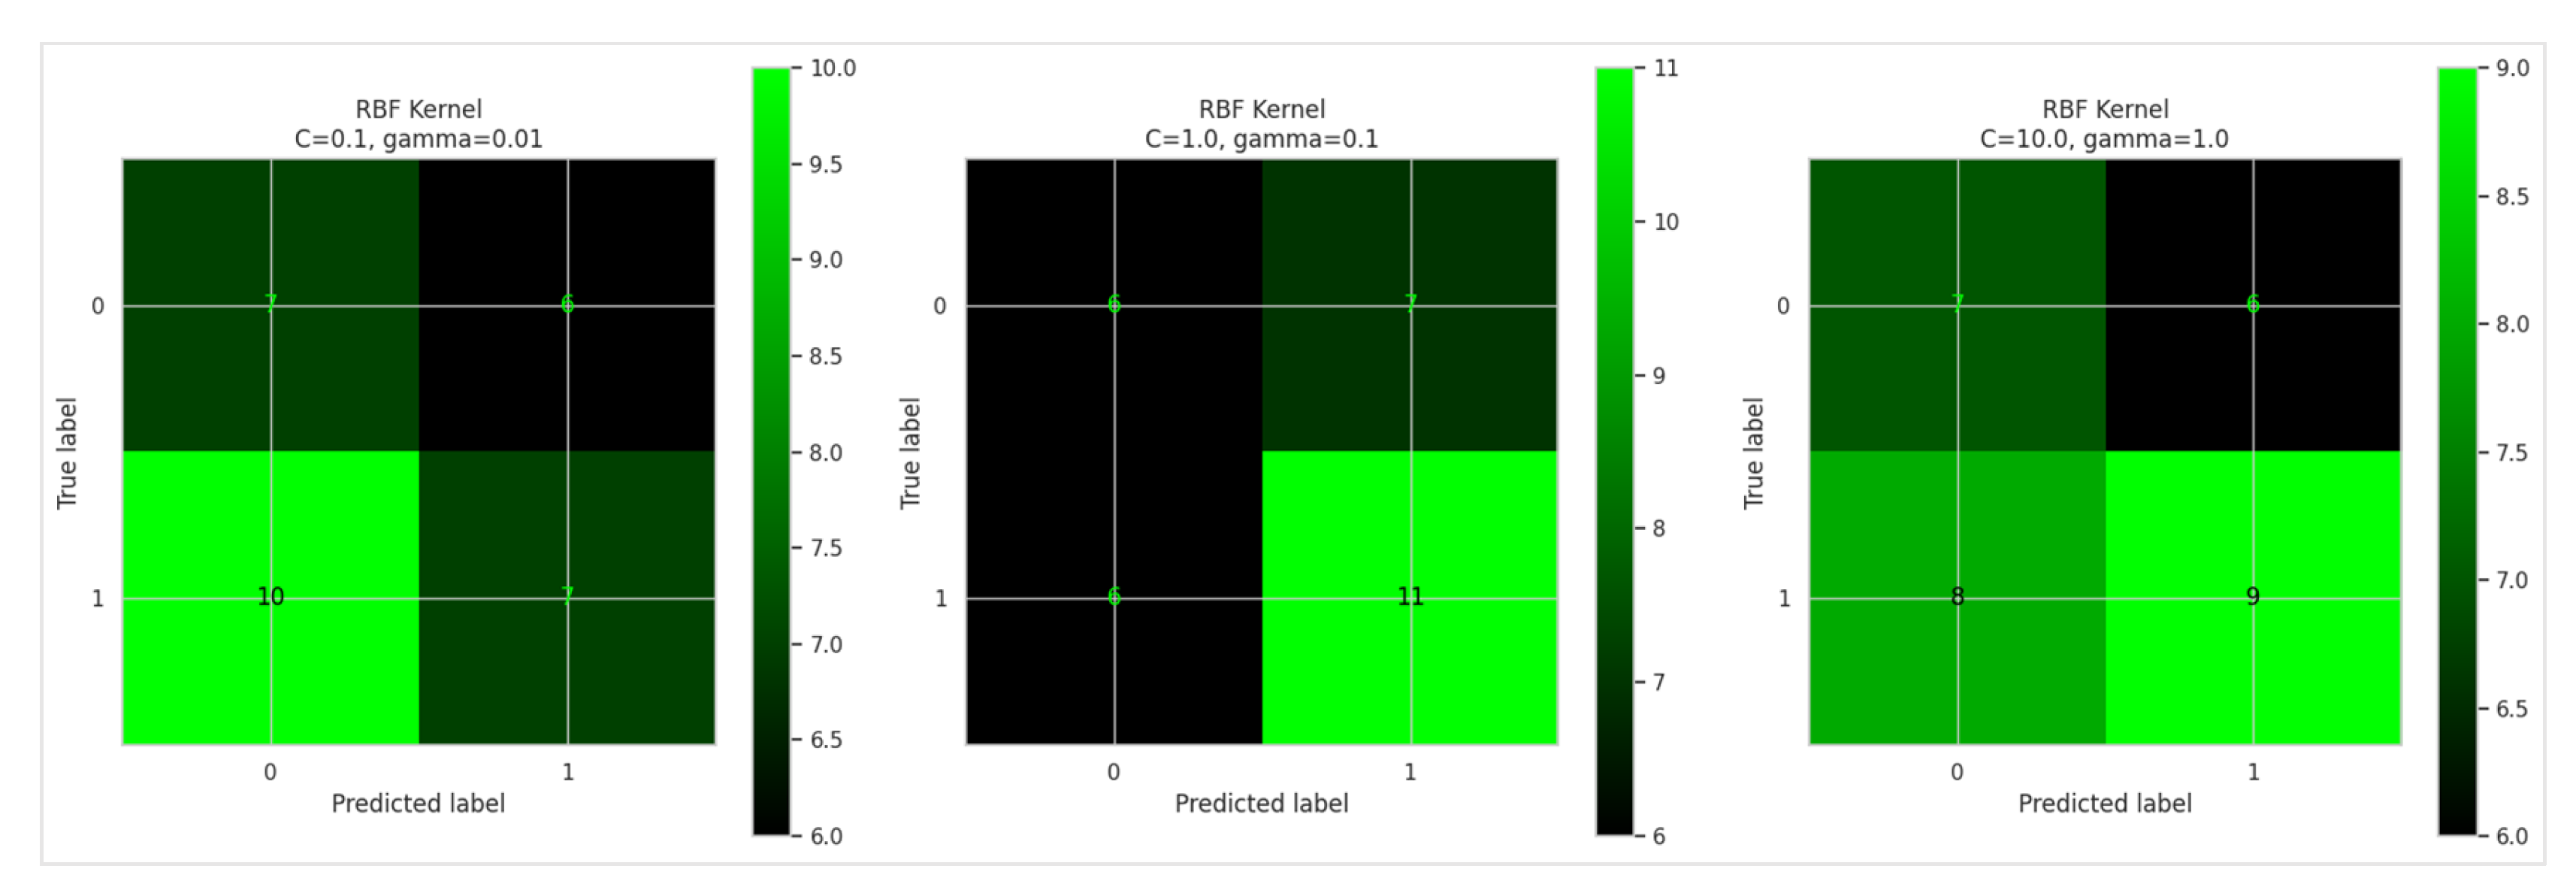
Figure 8.
Performance of the SVM model using the RBF kernel.
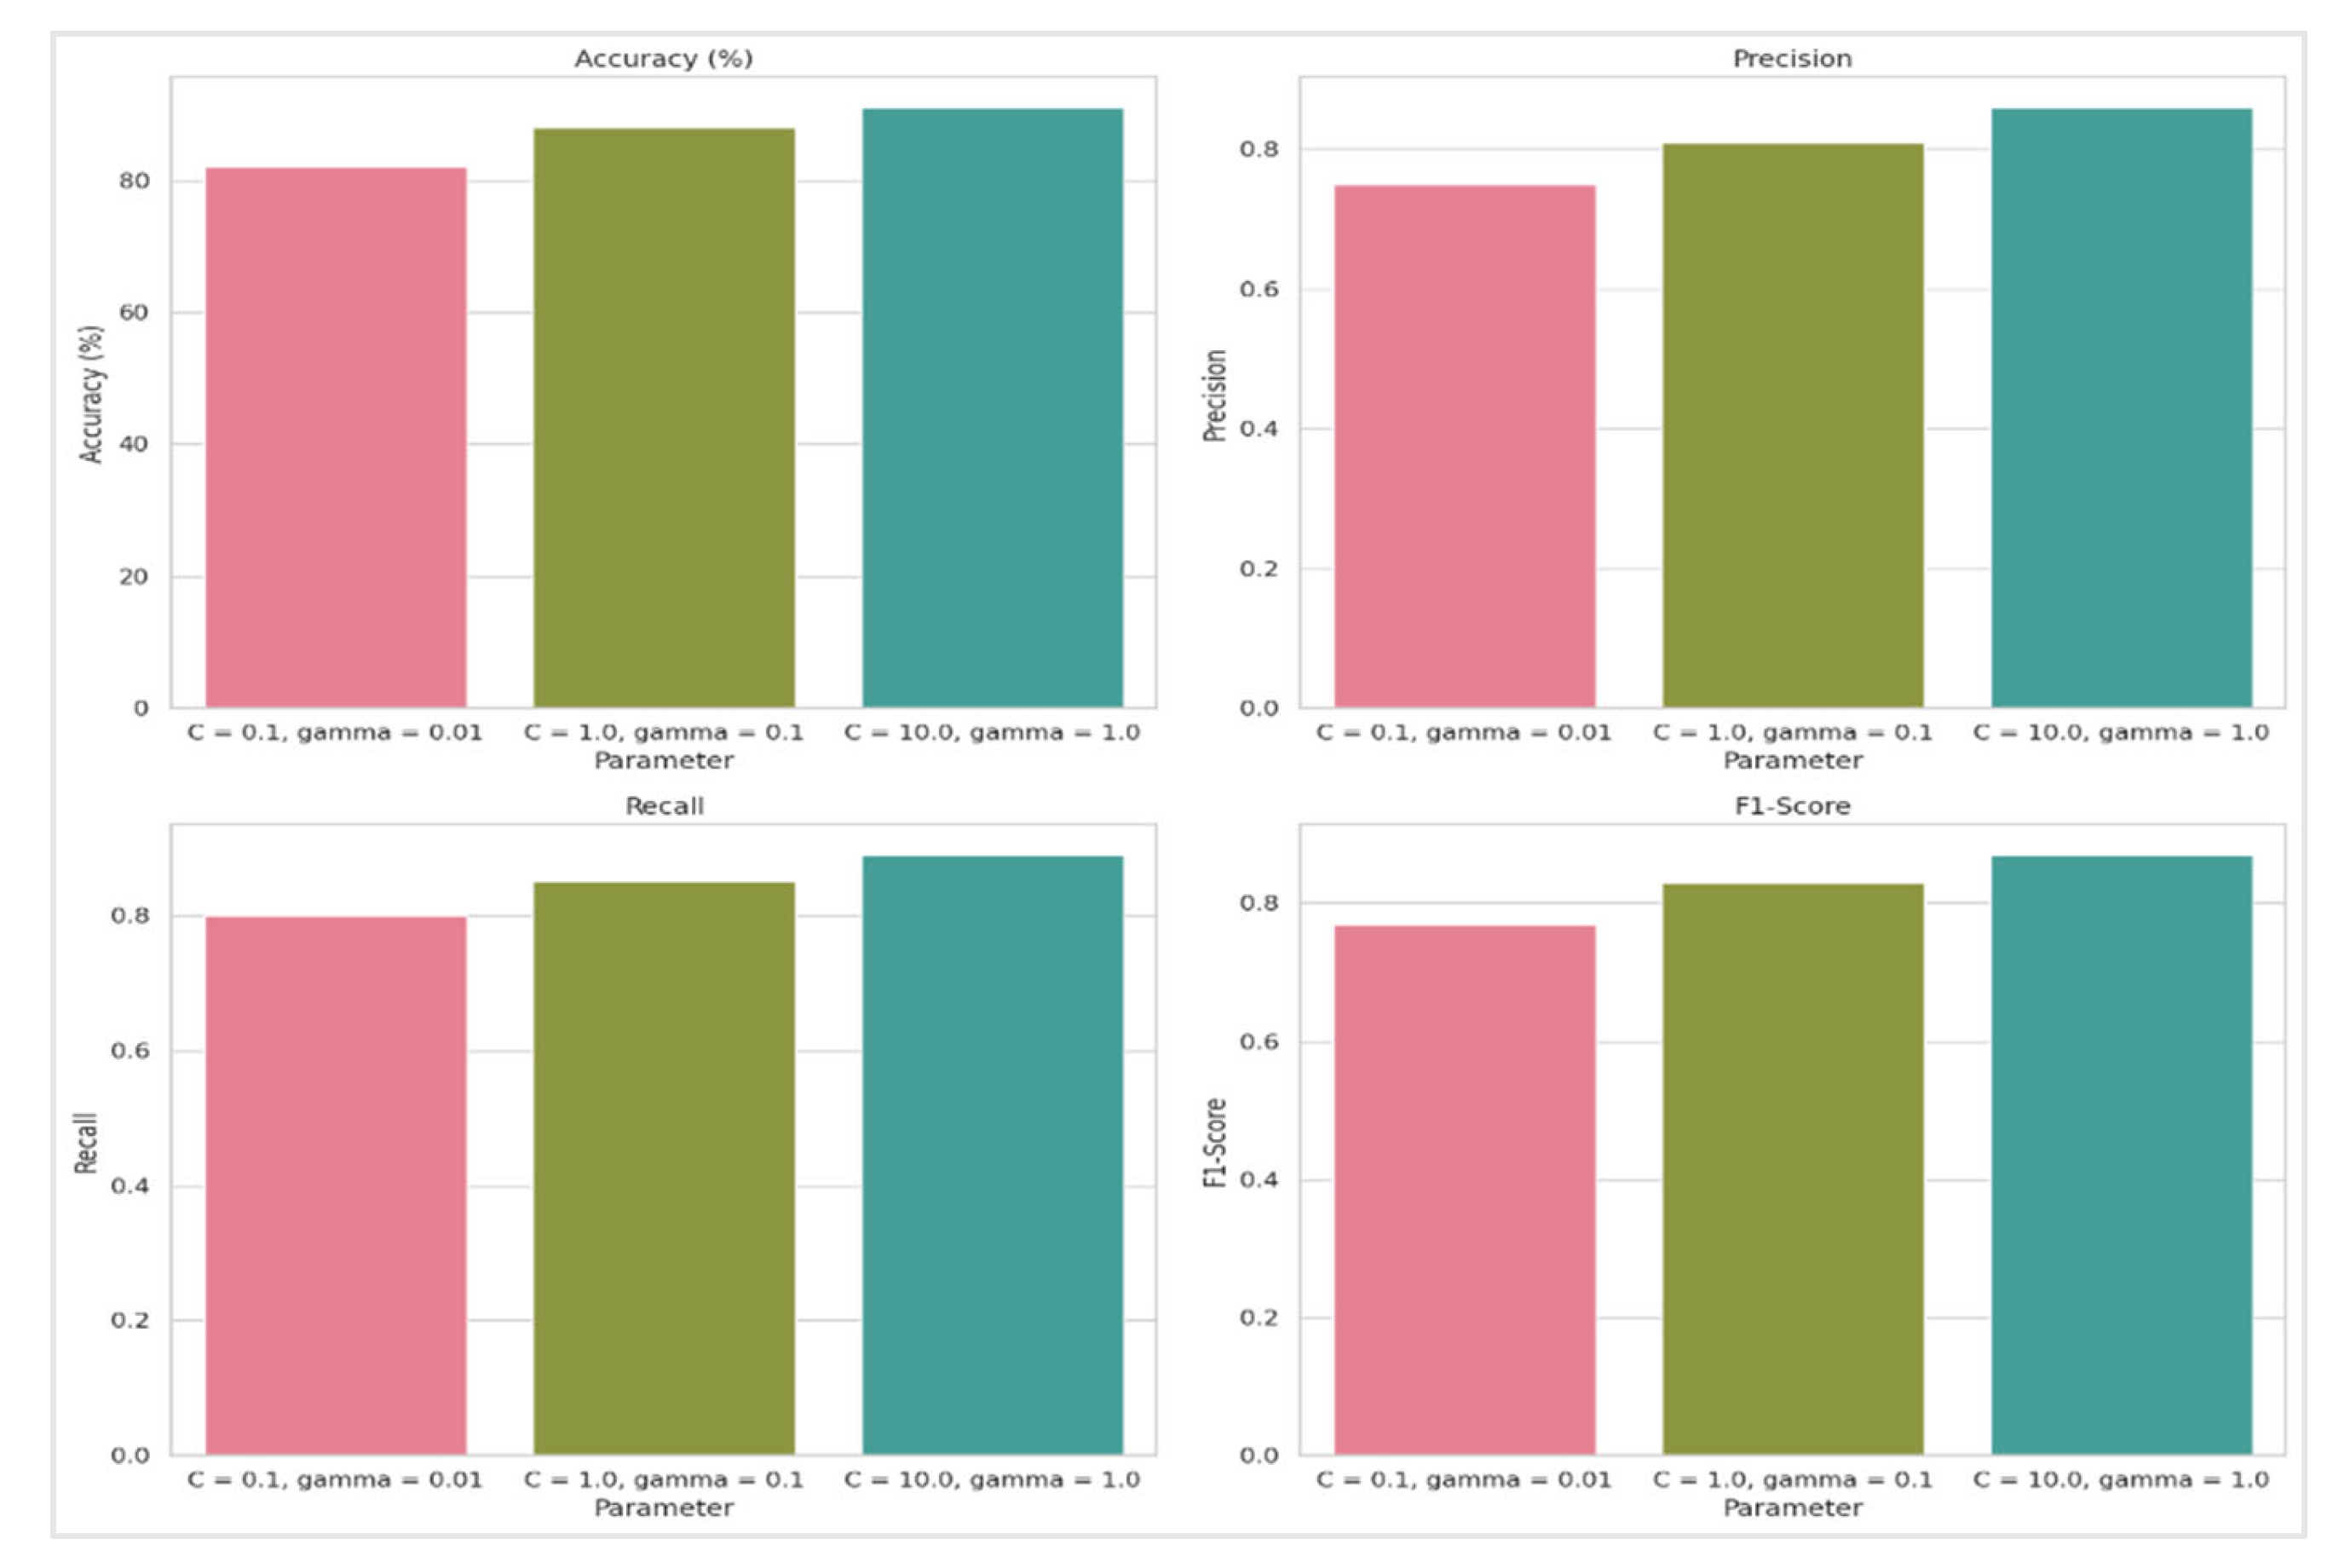
Figure 9.
The results of the 10-fold cross-validation for the Sigmoid Kernel in SVM.
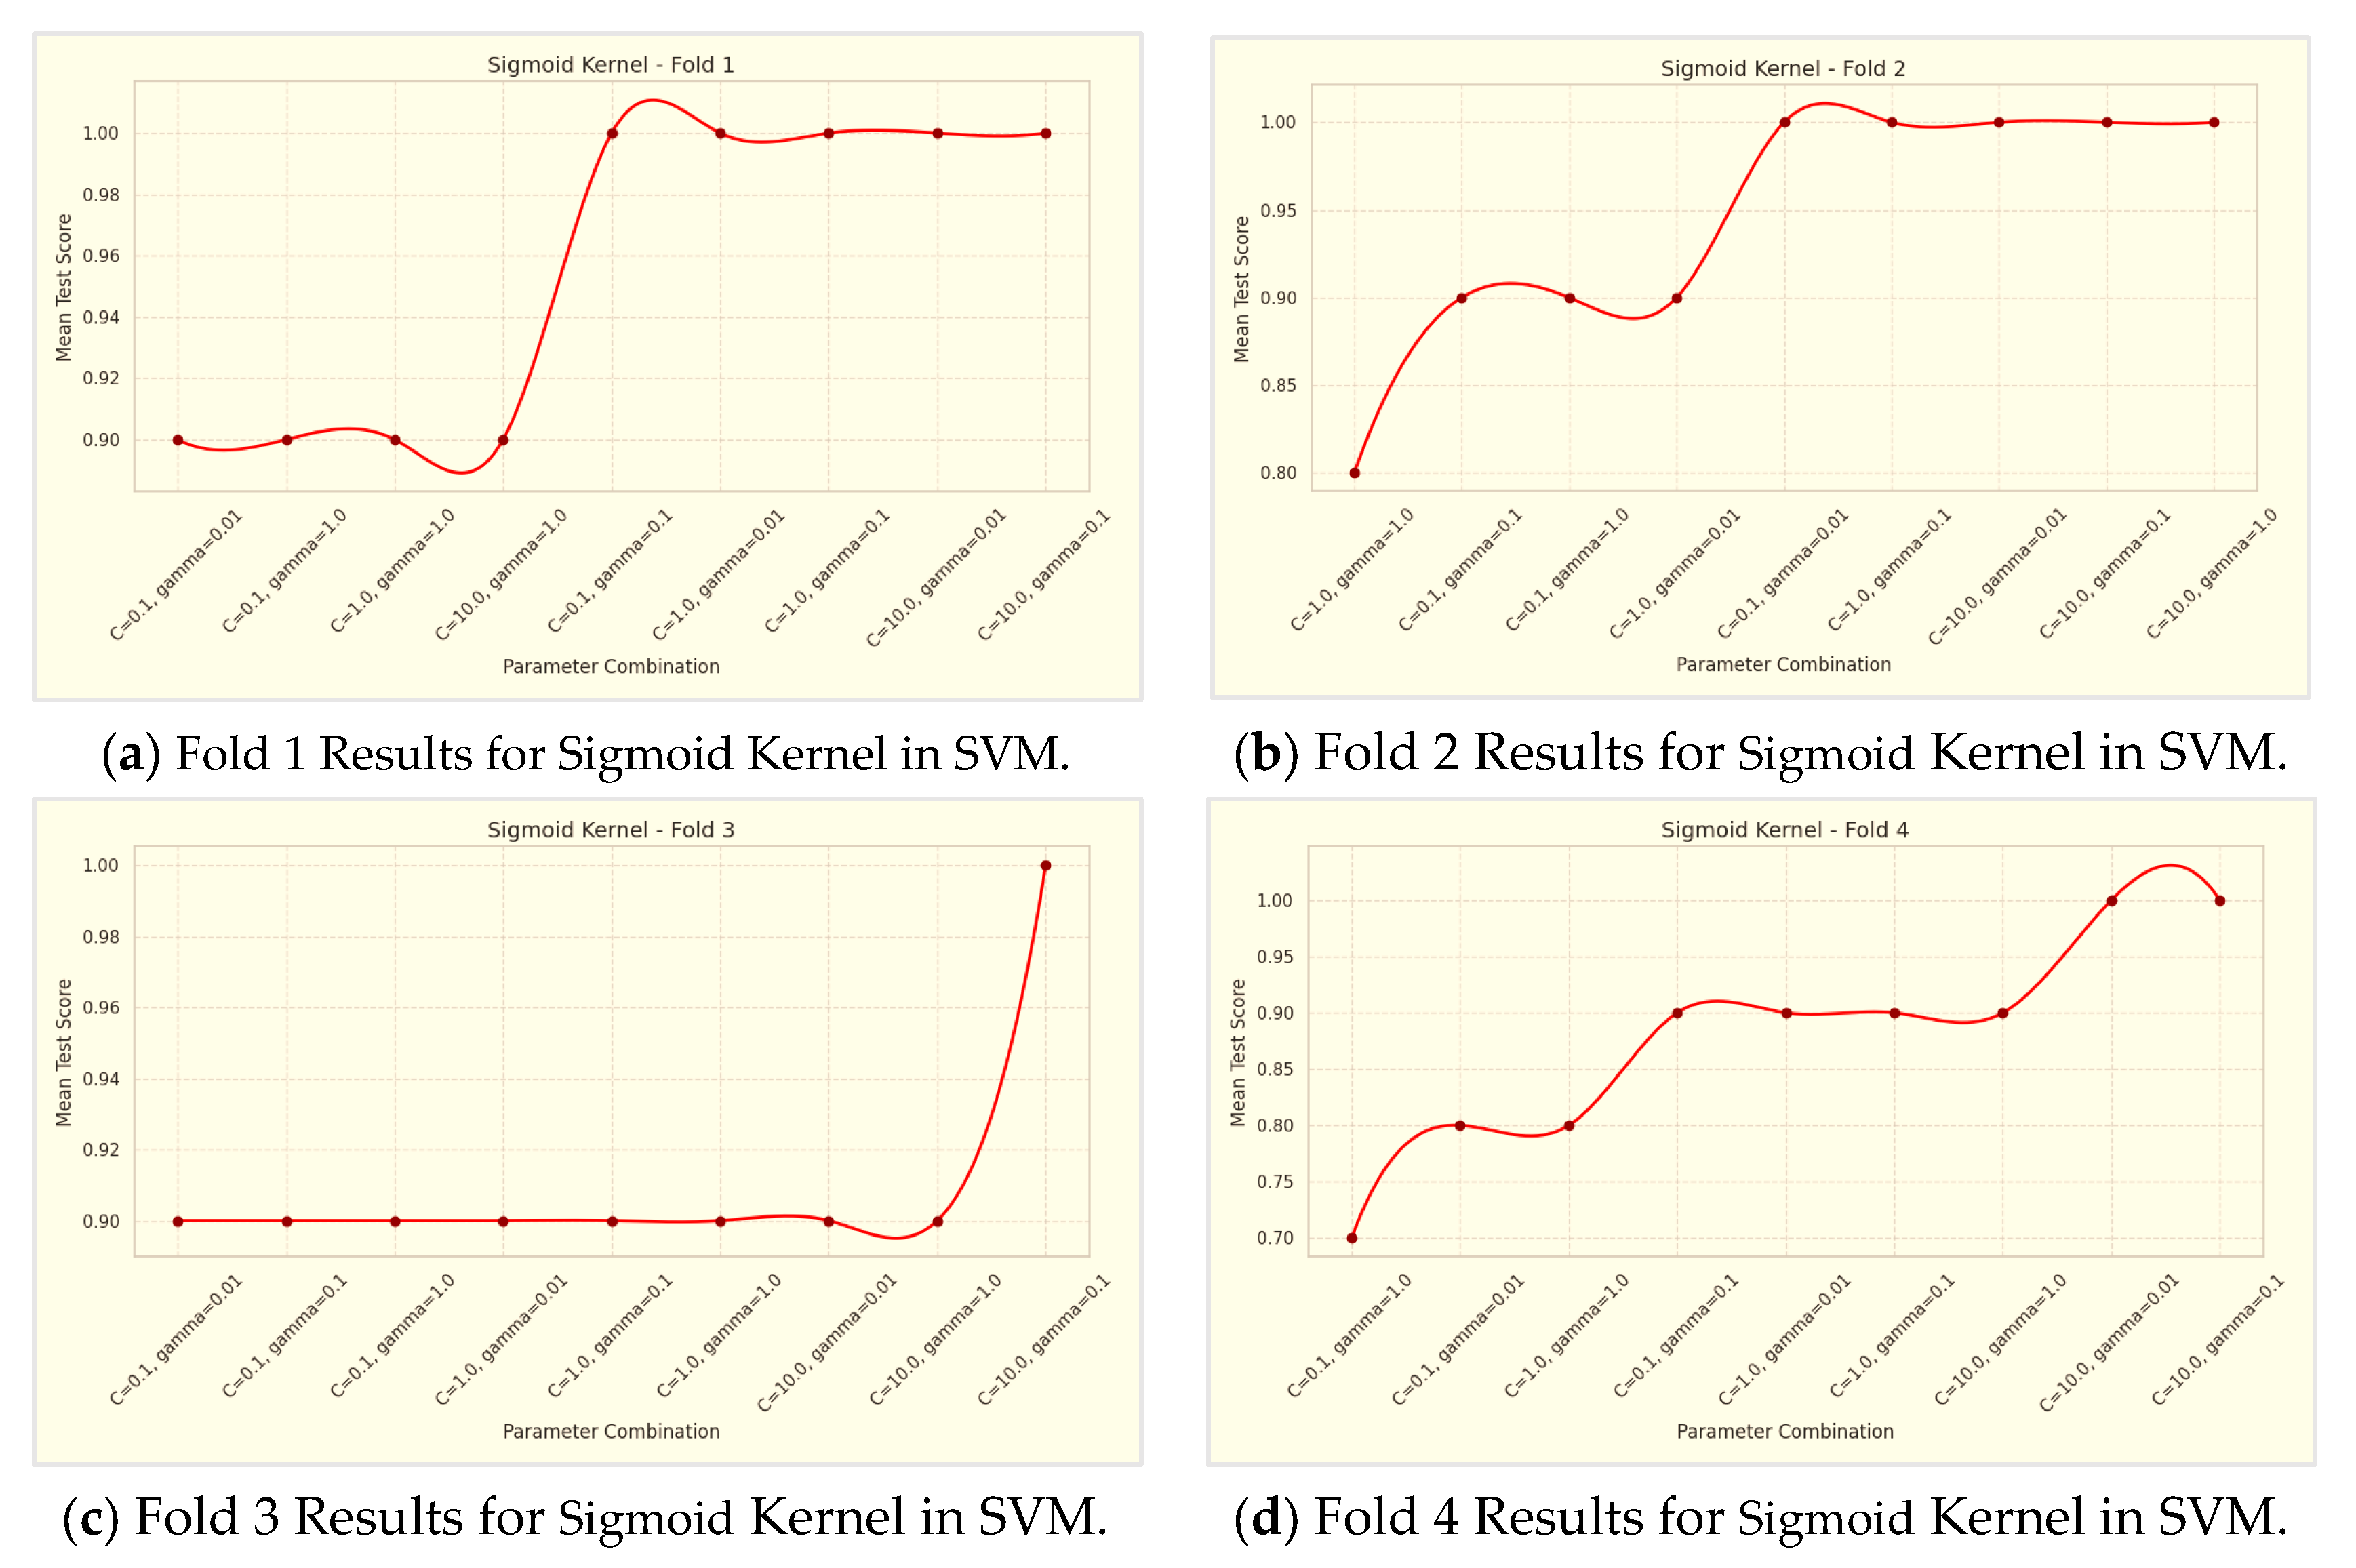
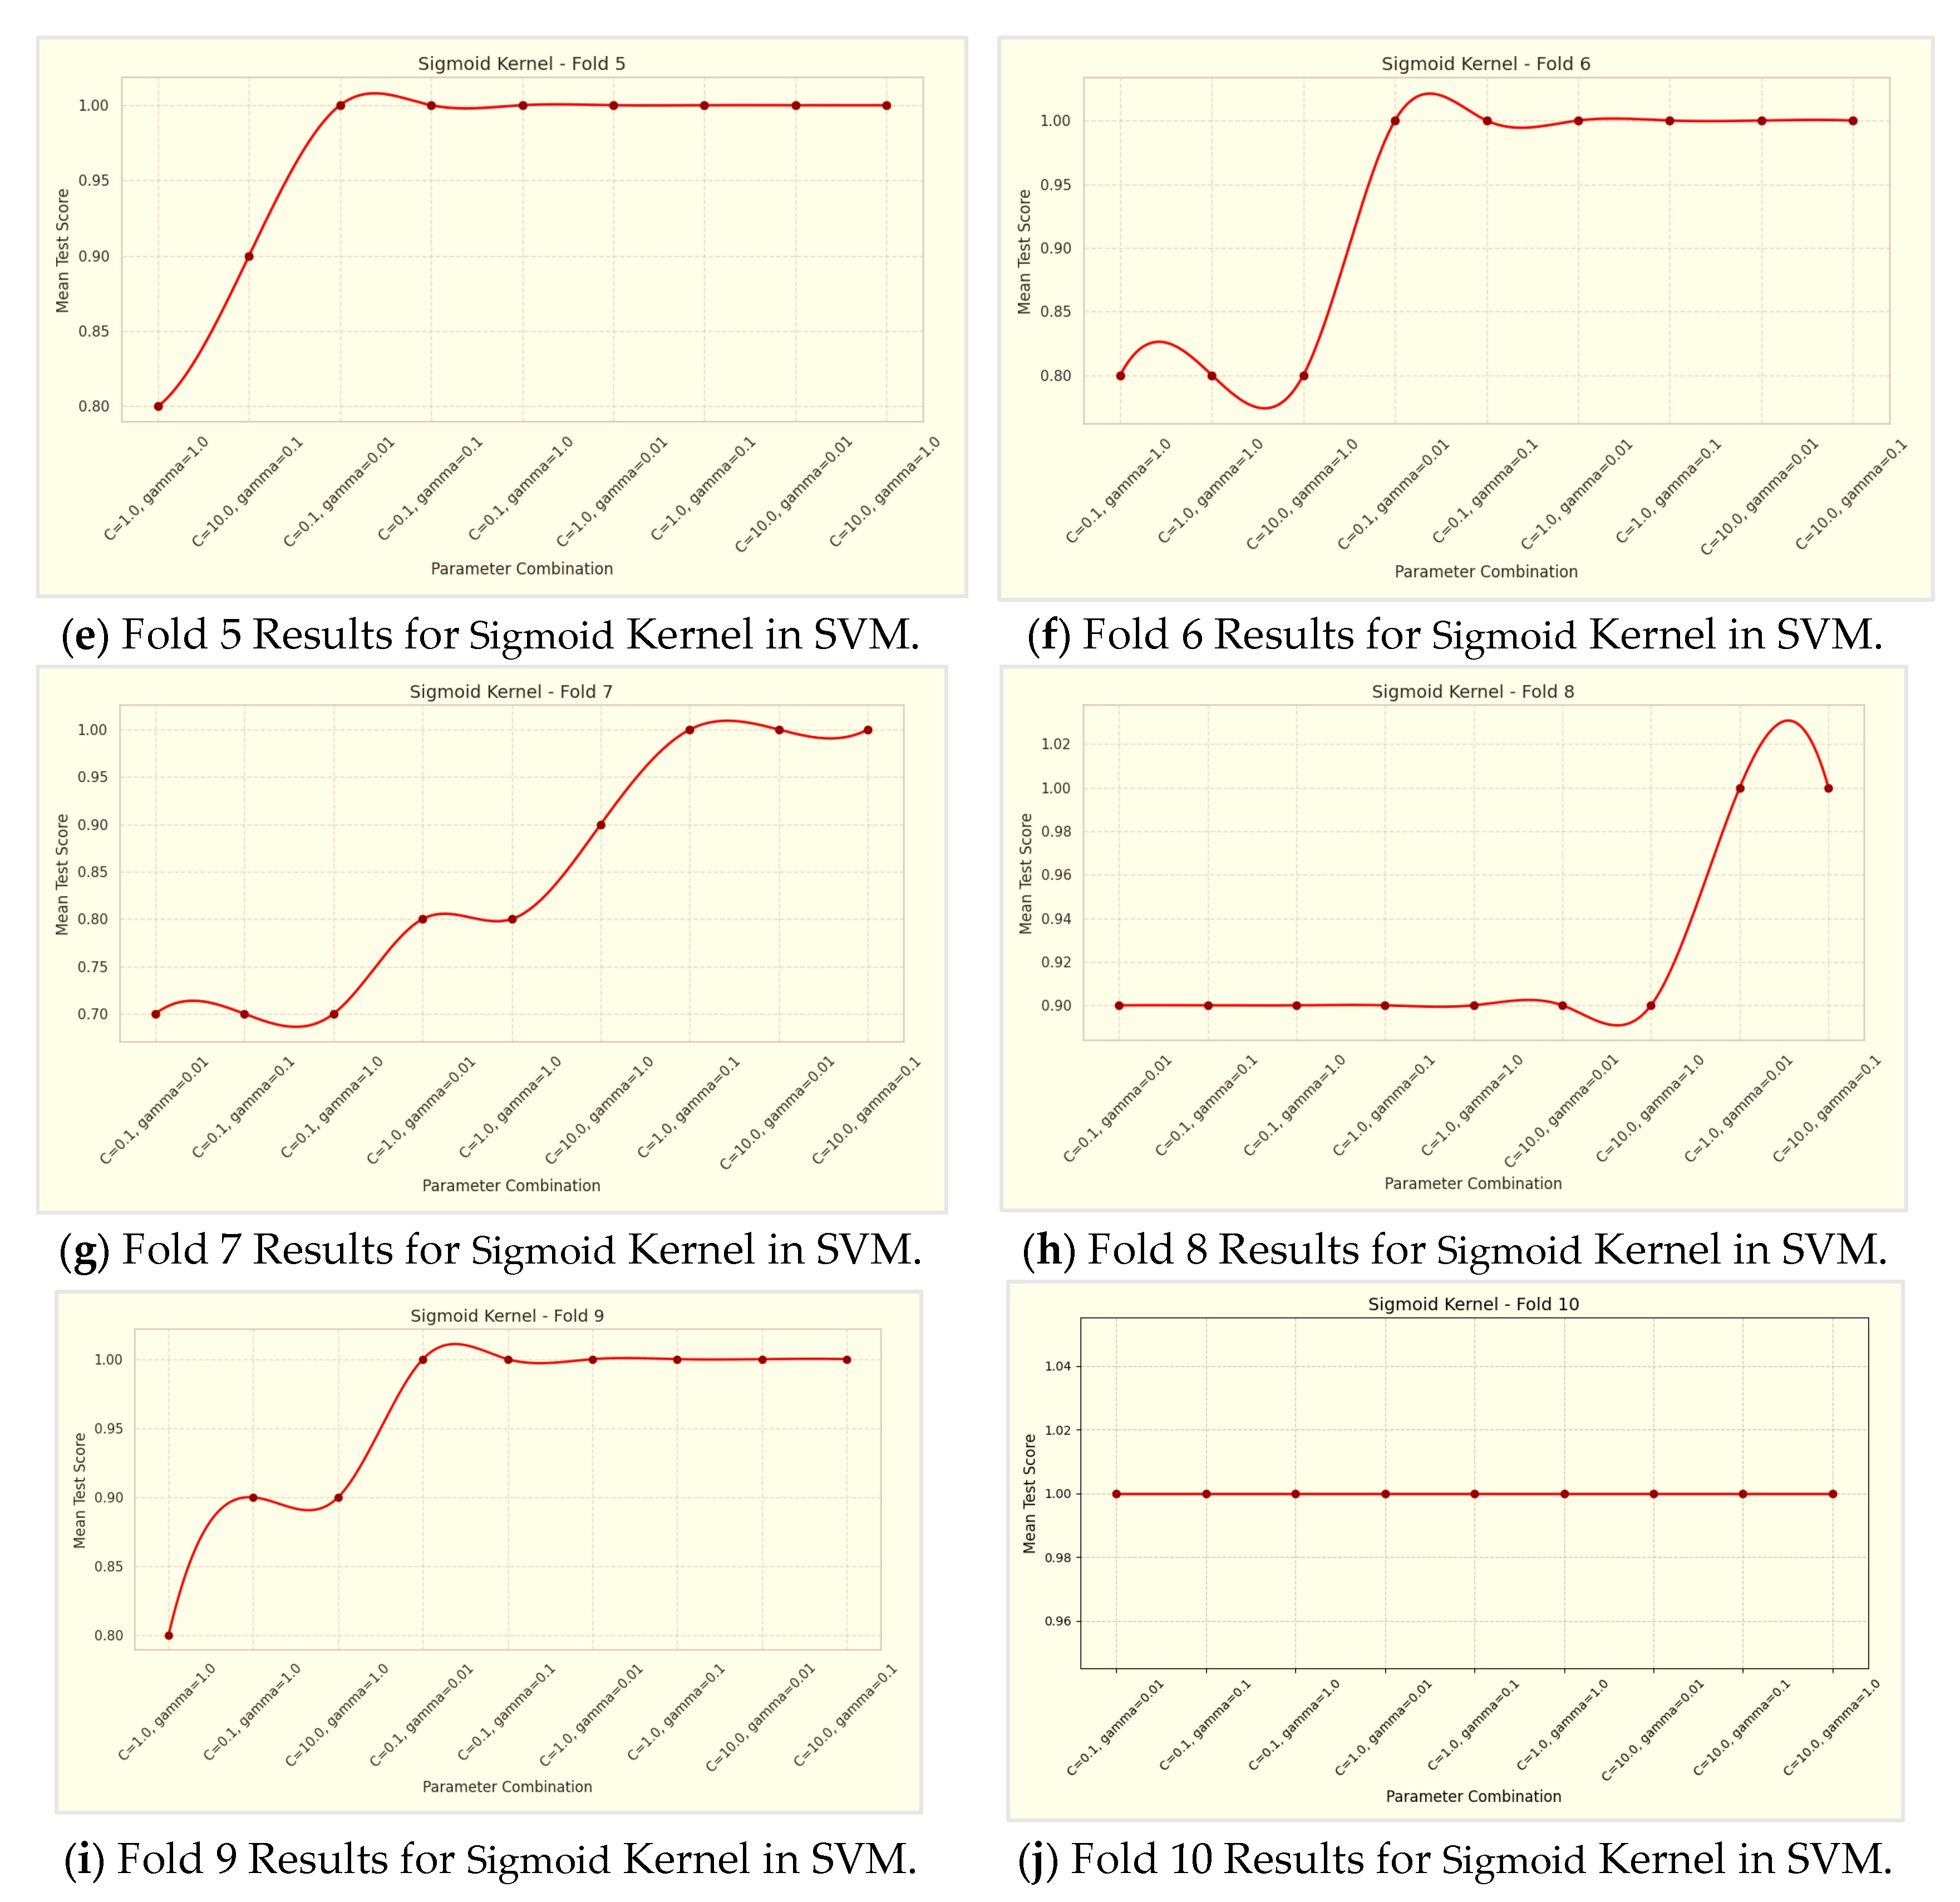
Figure 10.
Confusion matrices for Sigmoid kernel.
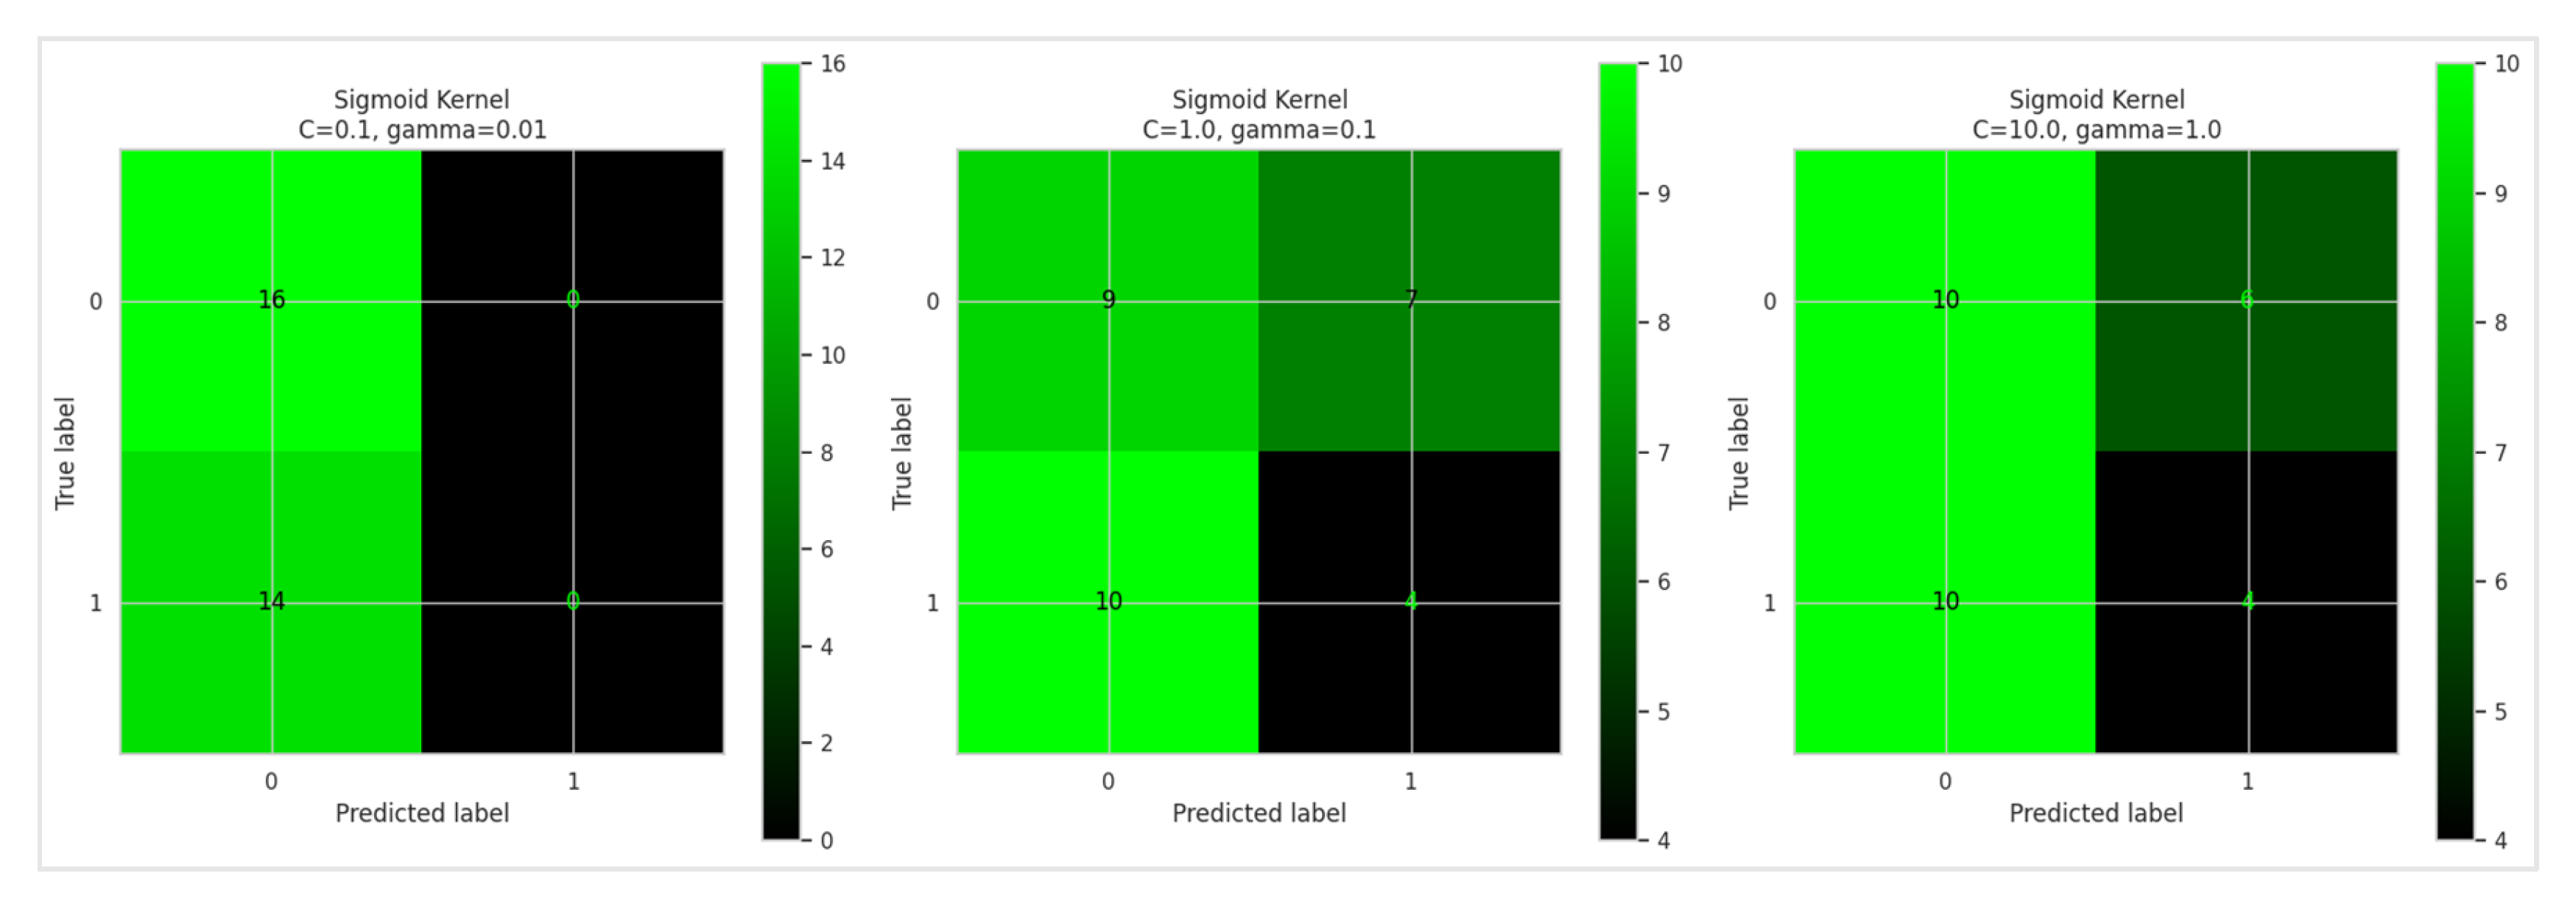
Figure 11.
Performance of the SVM model using the Sigmoid kernel.
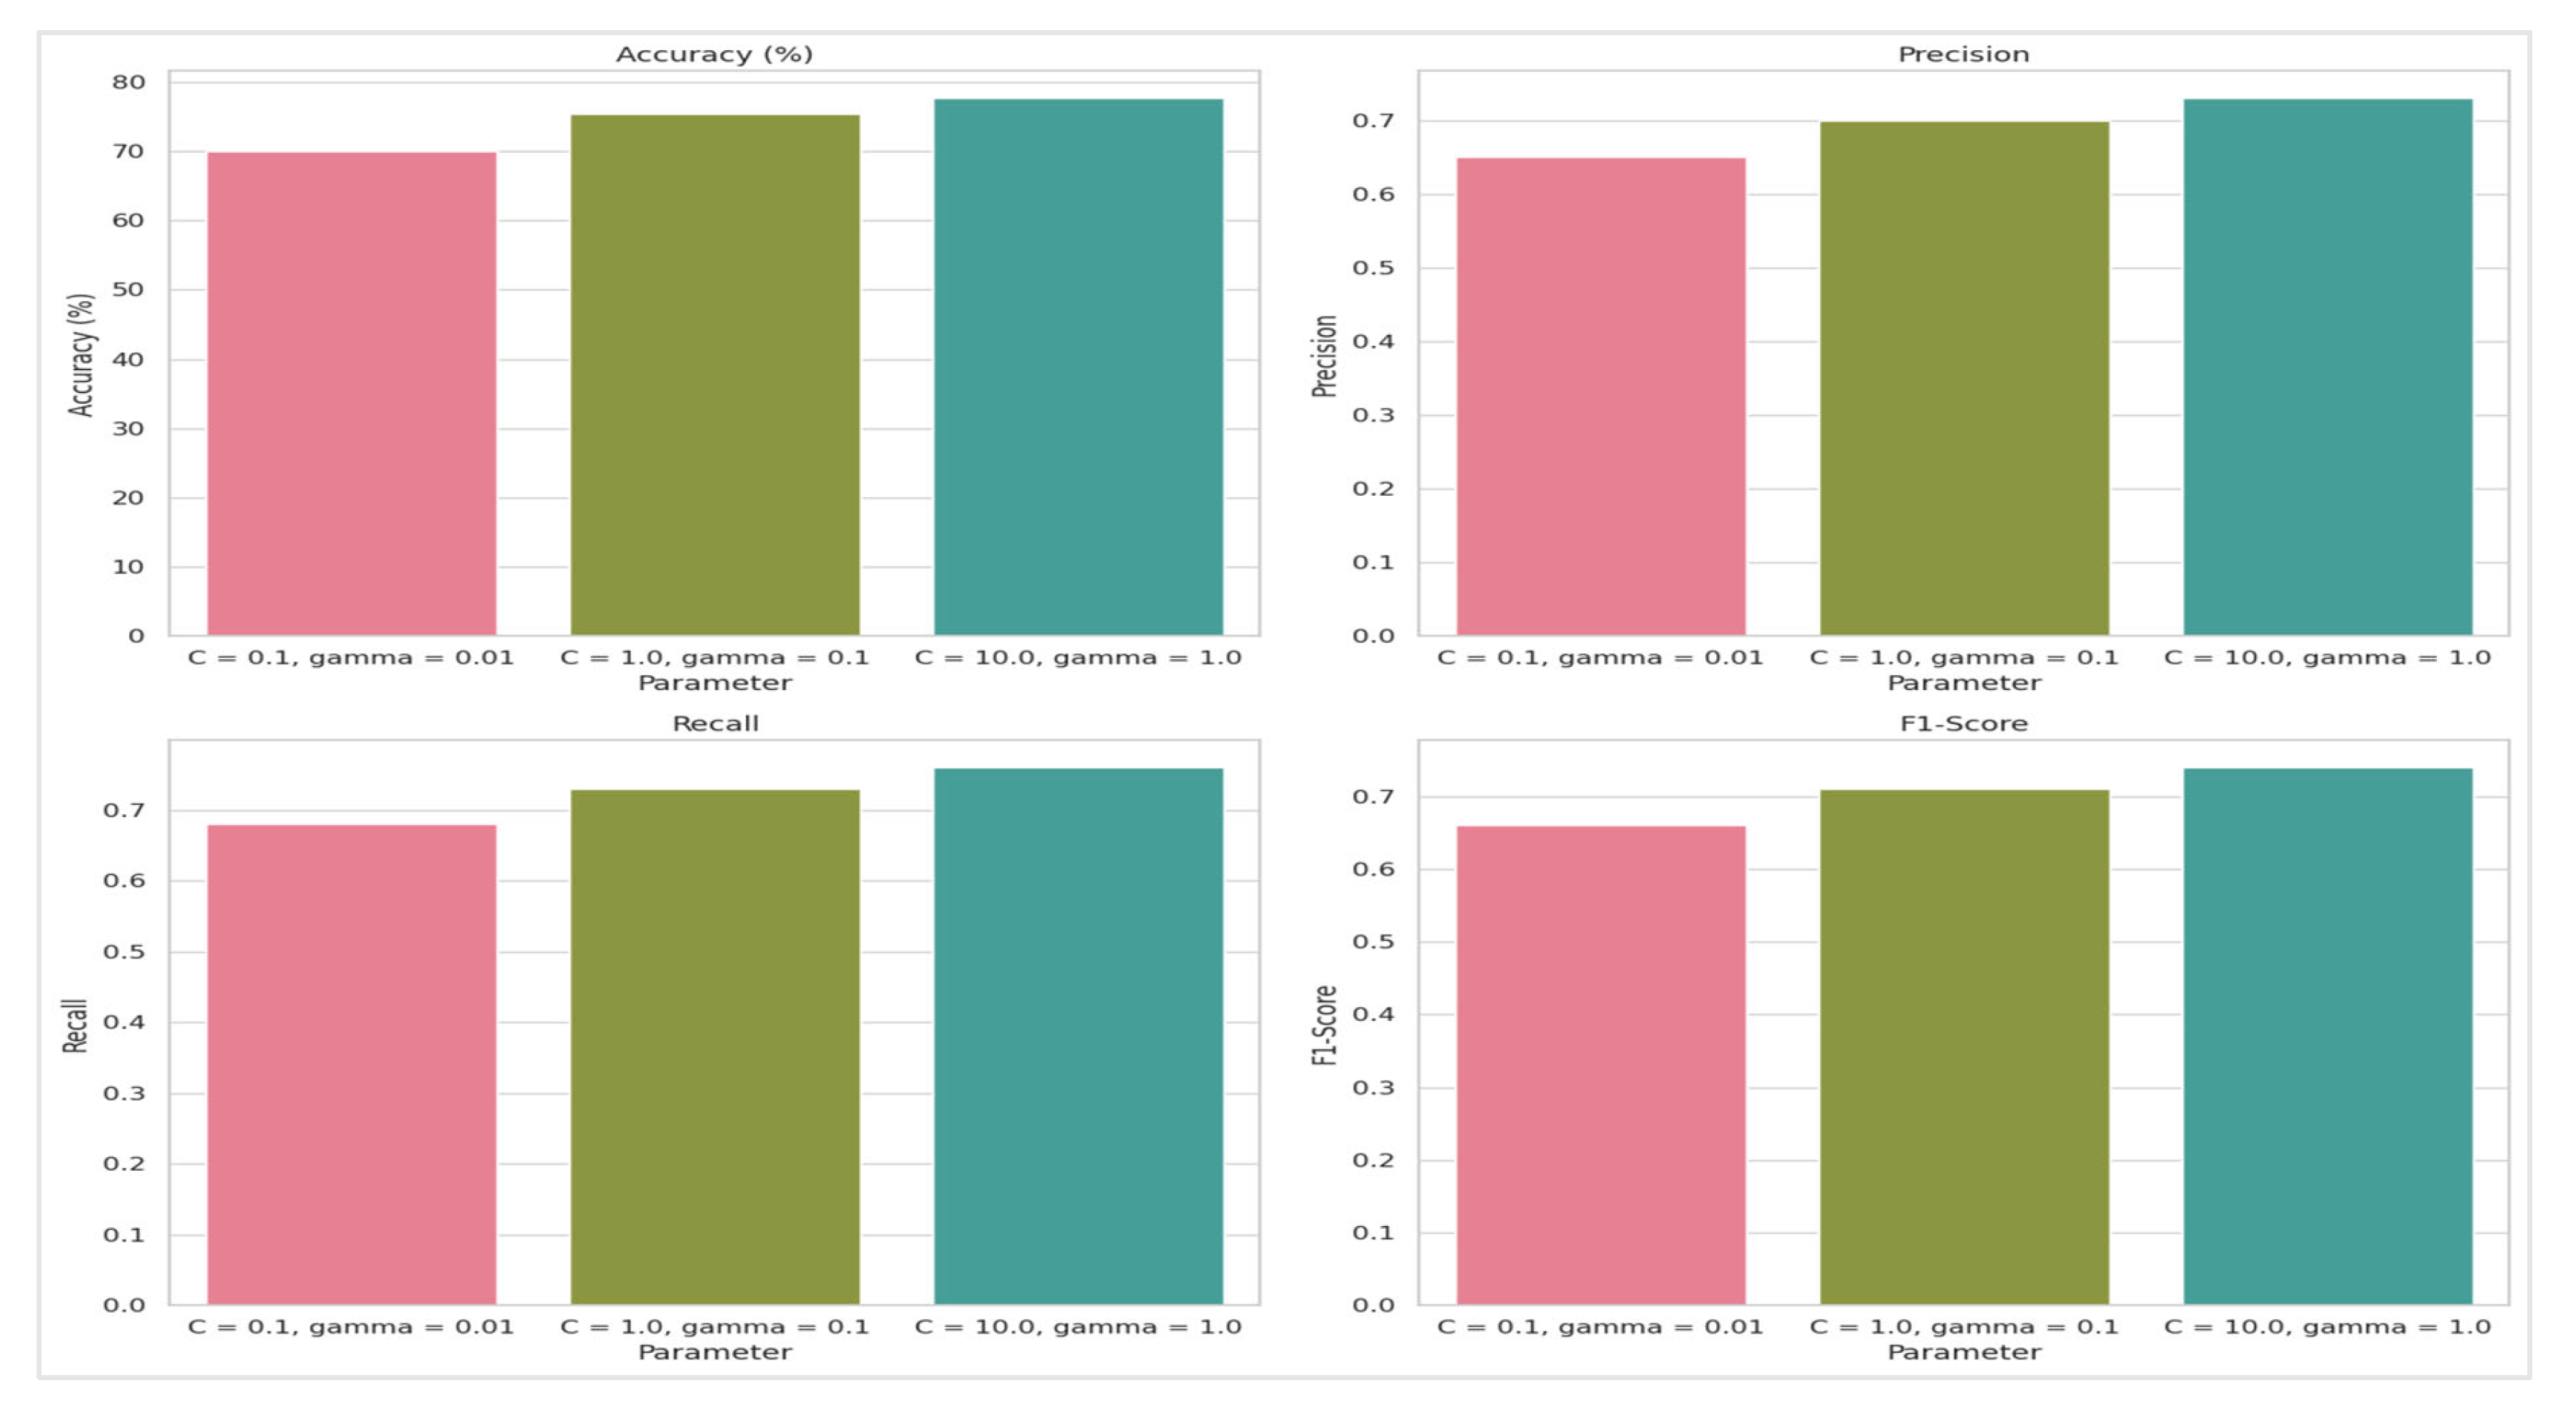
Figure 12.
The results of the prediction of stunting prevalence in Aceh, Indonesia using LR.
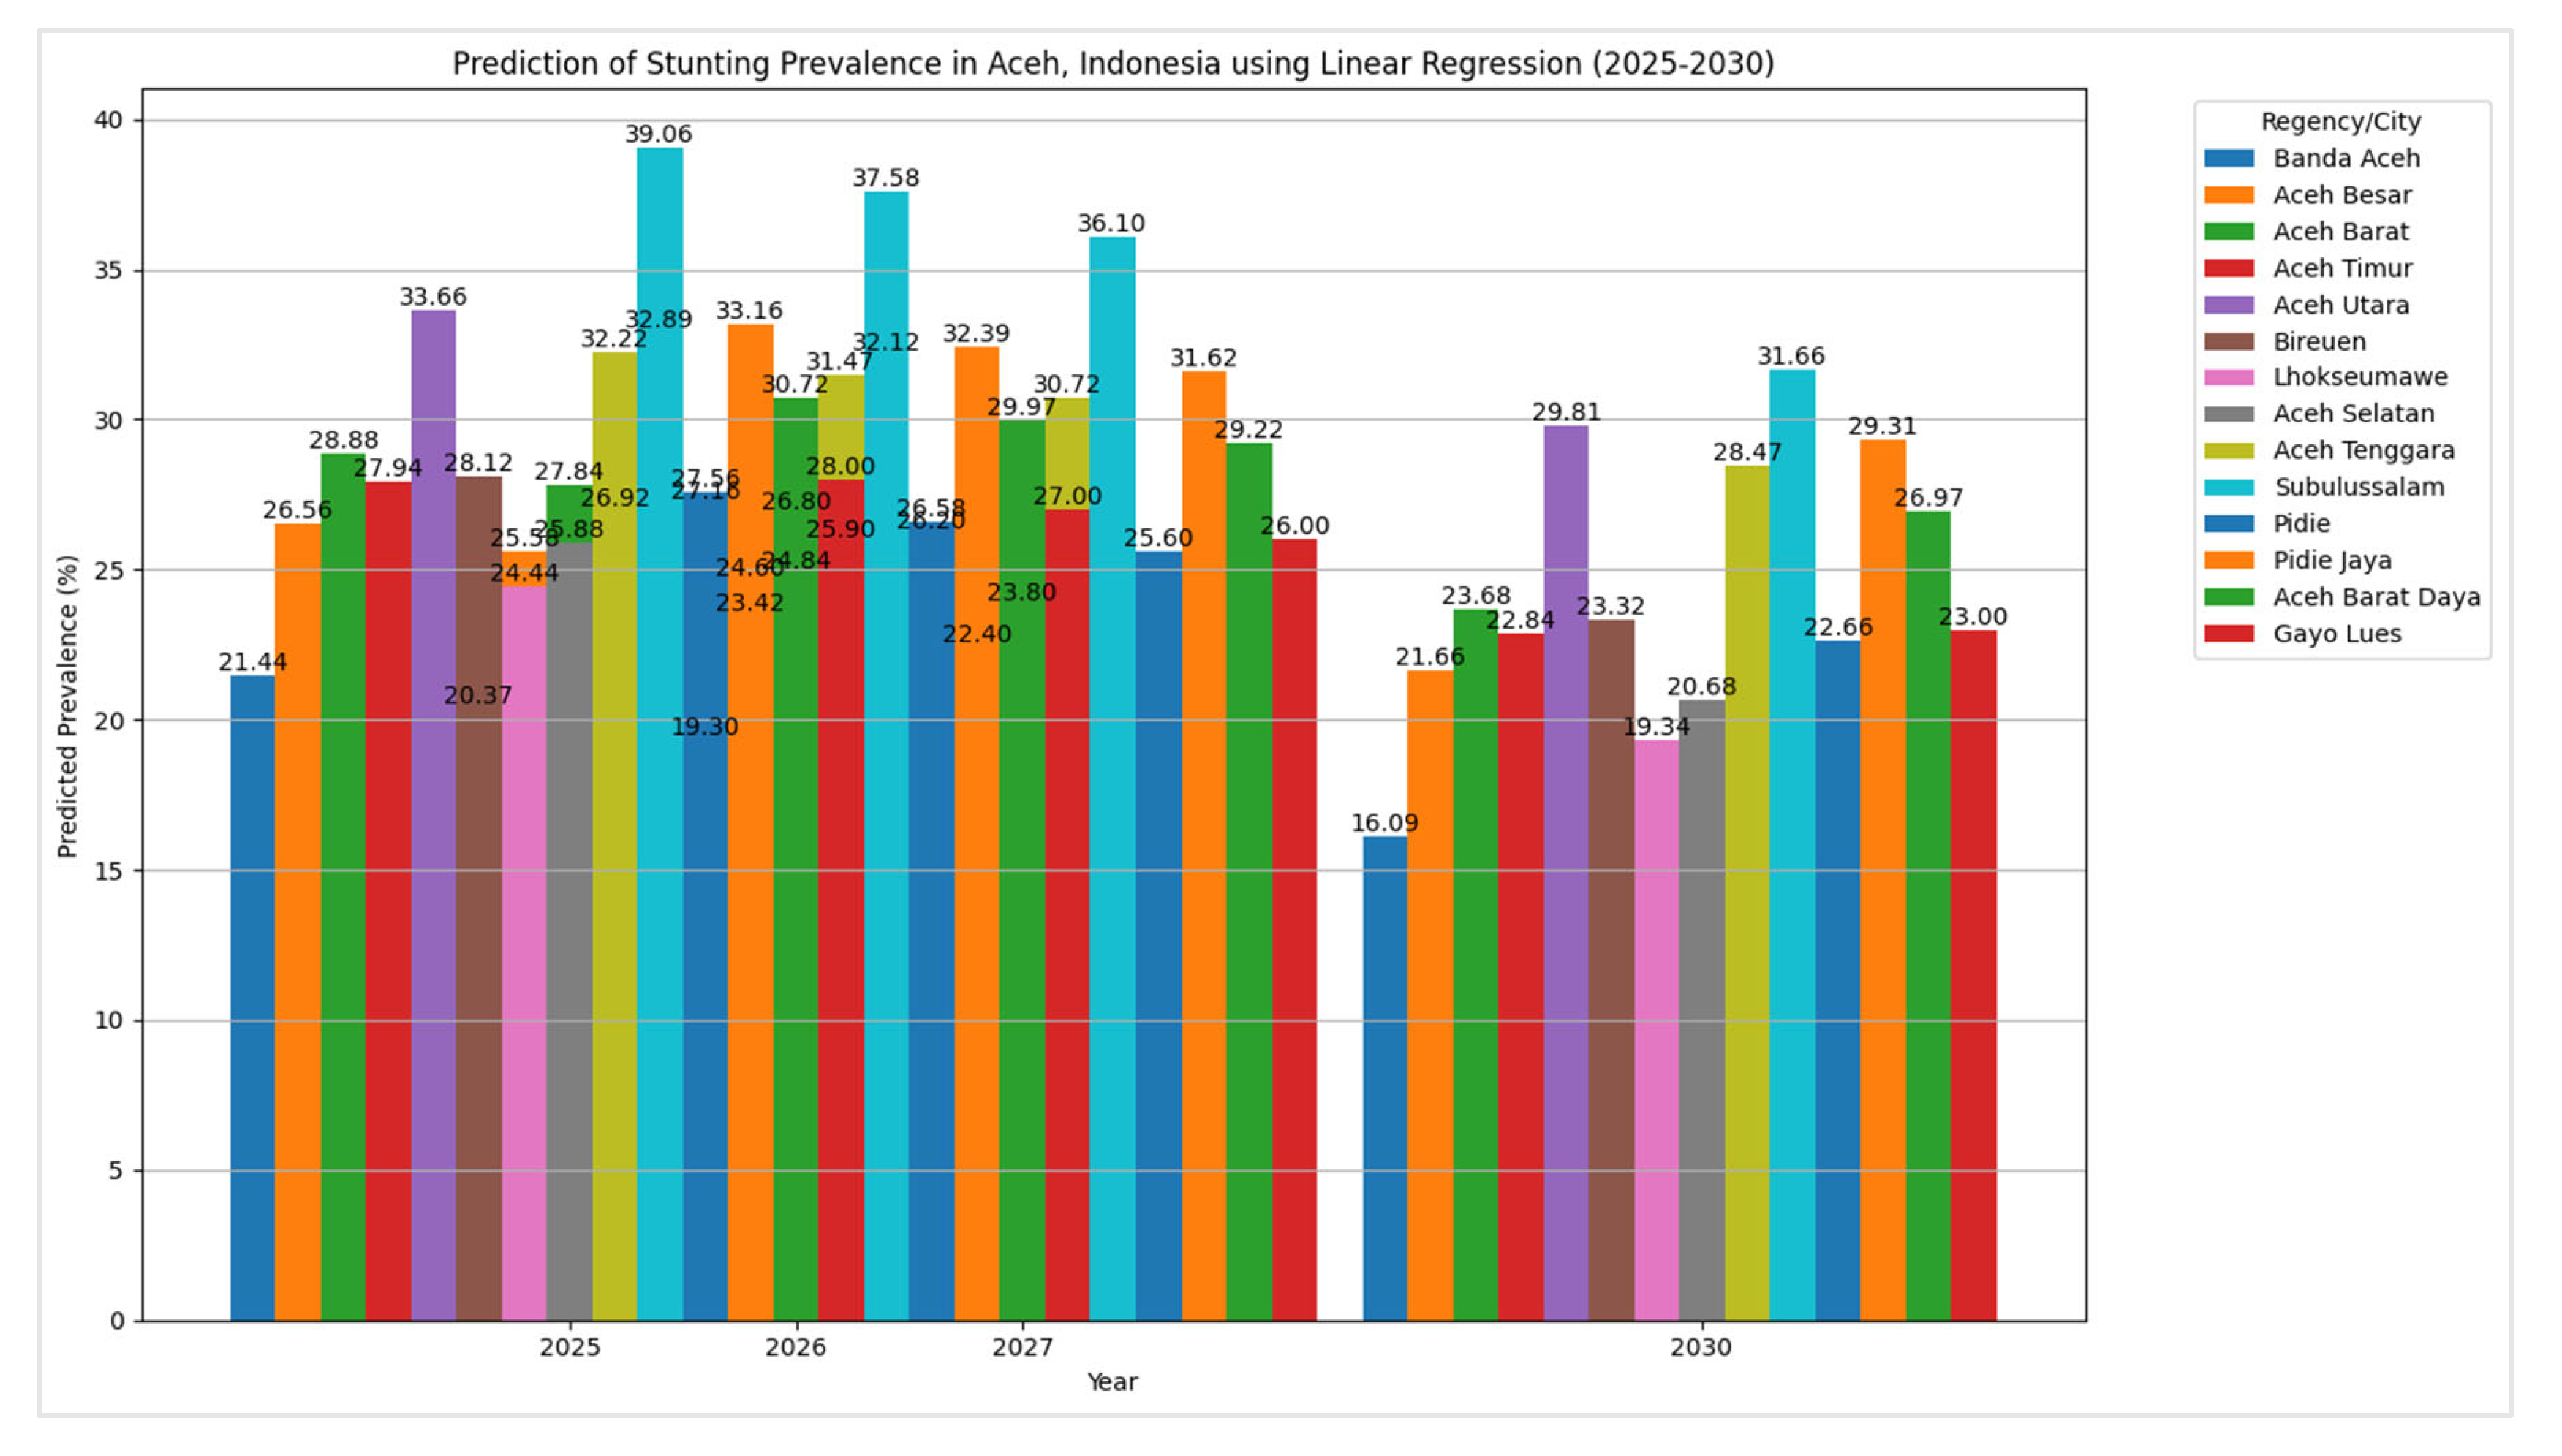
Figure 13.
The results of the prediction of stunting prevalence in Aceh, Indonesia using LR.
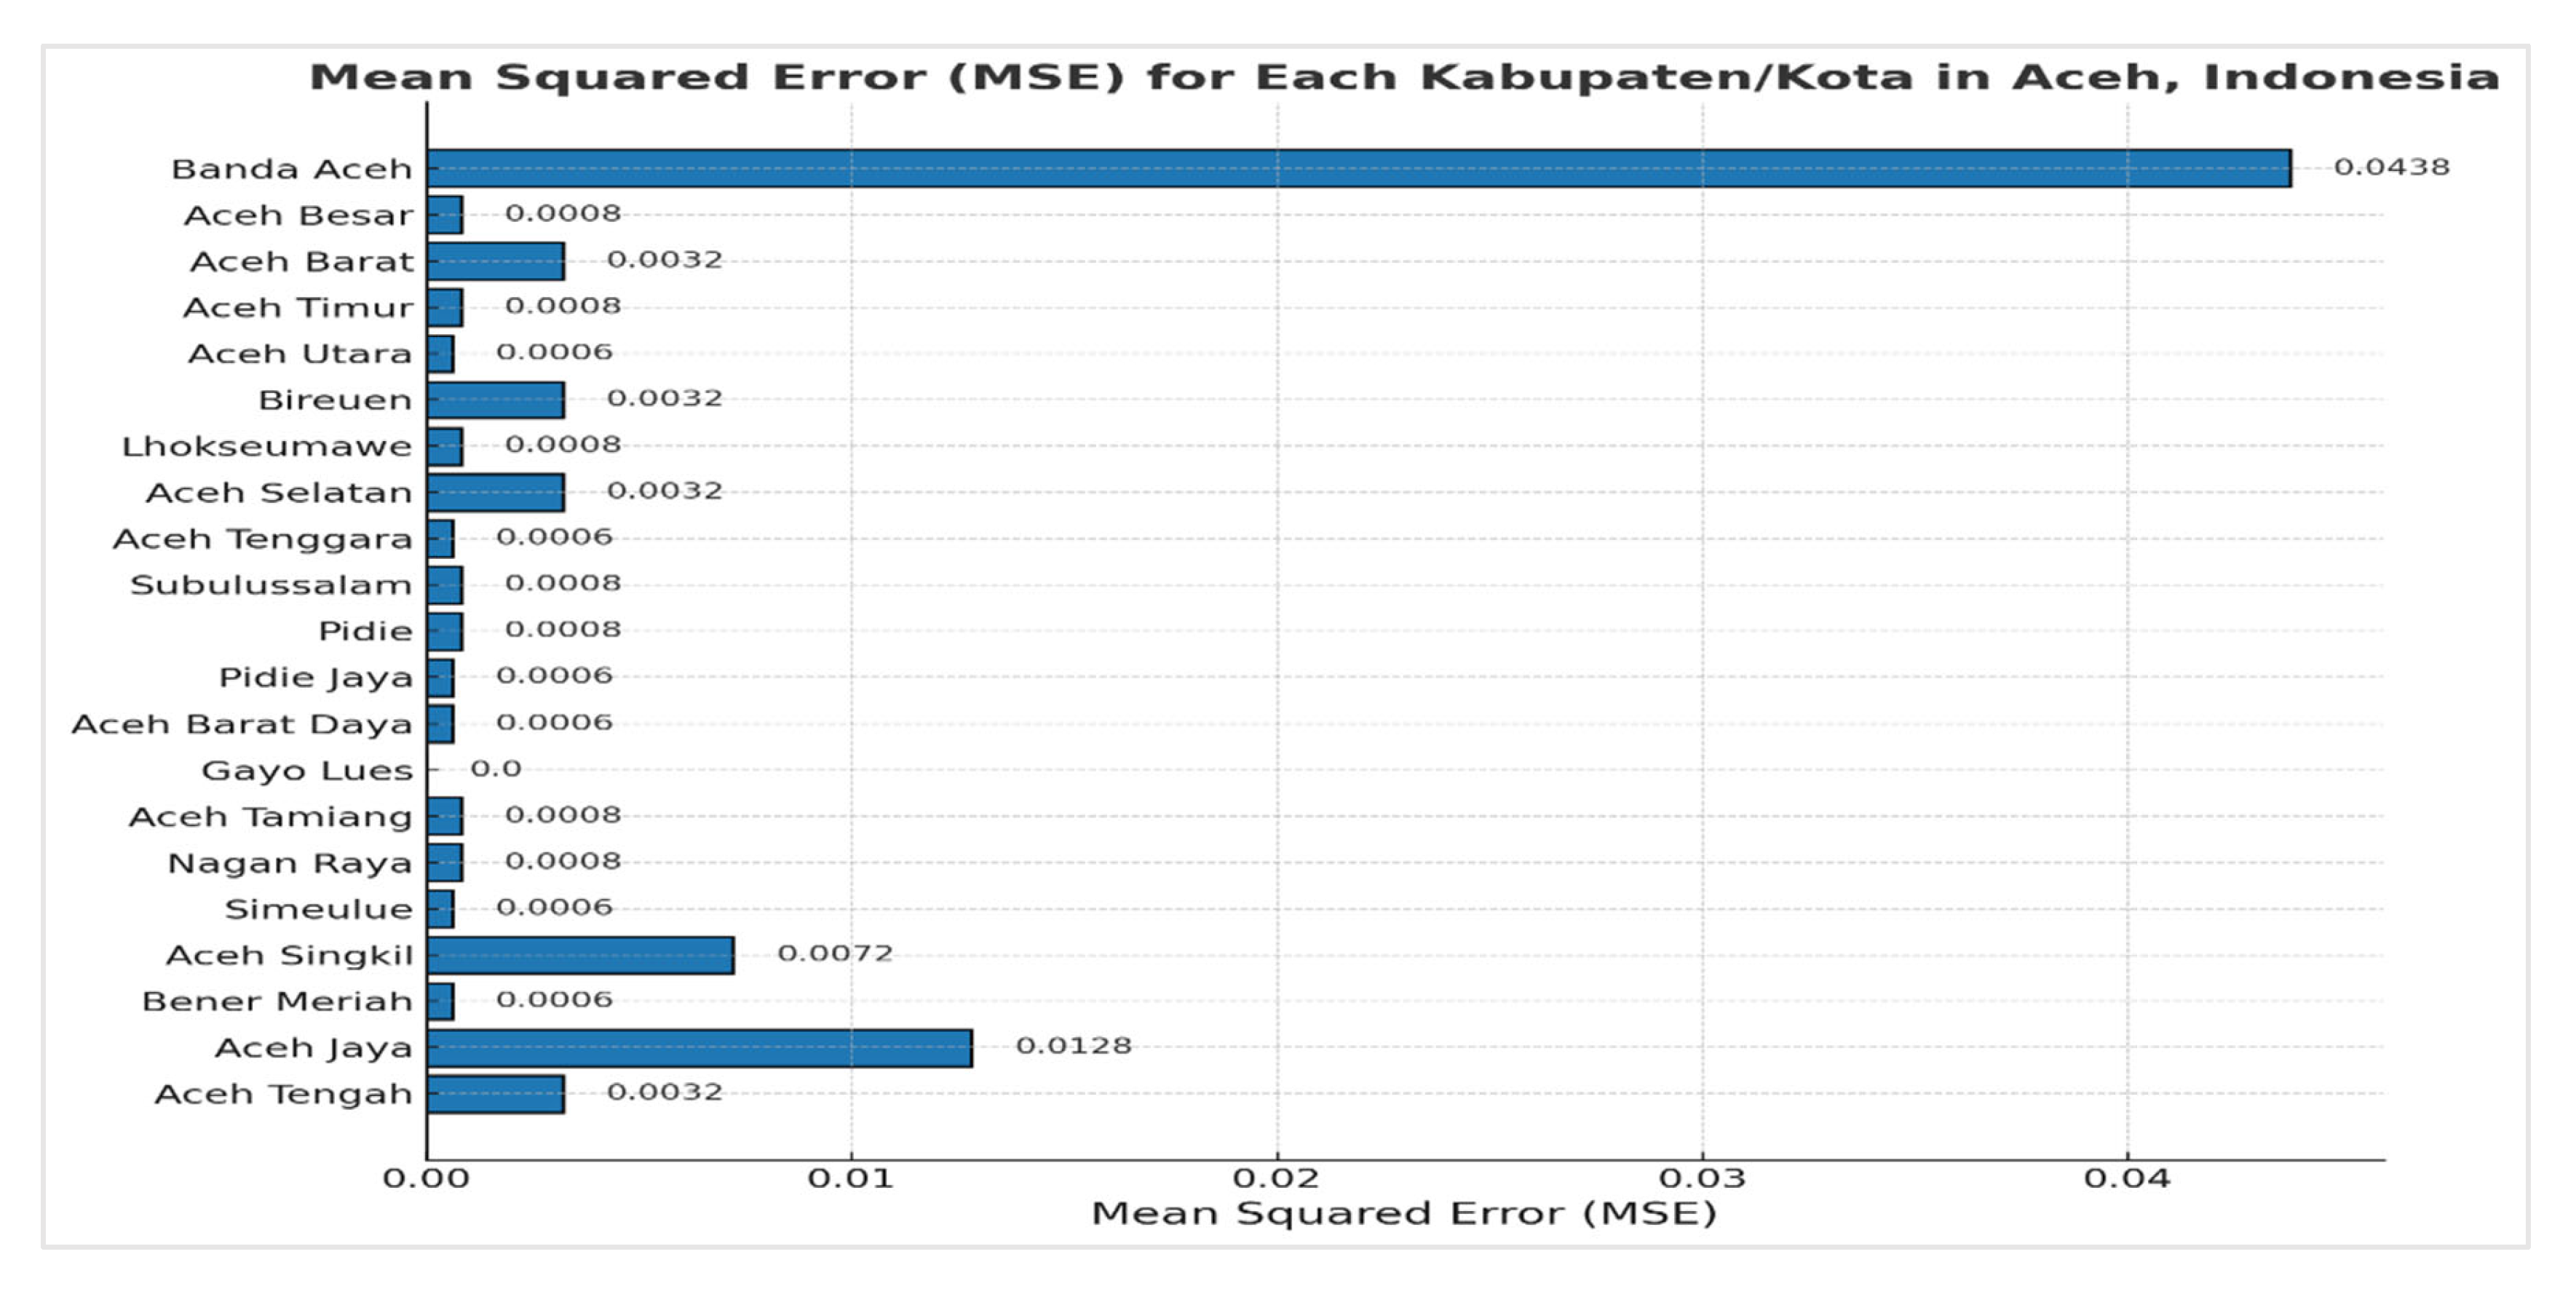
Figure 14.
Comparison of Iteration Counts between WP+K-Medoids and Conventional K-Medoids.
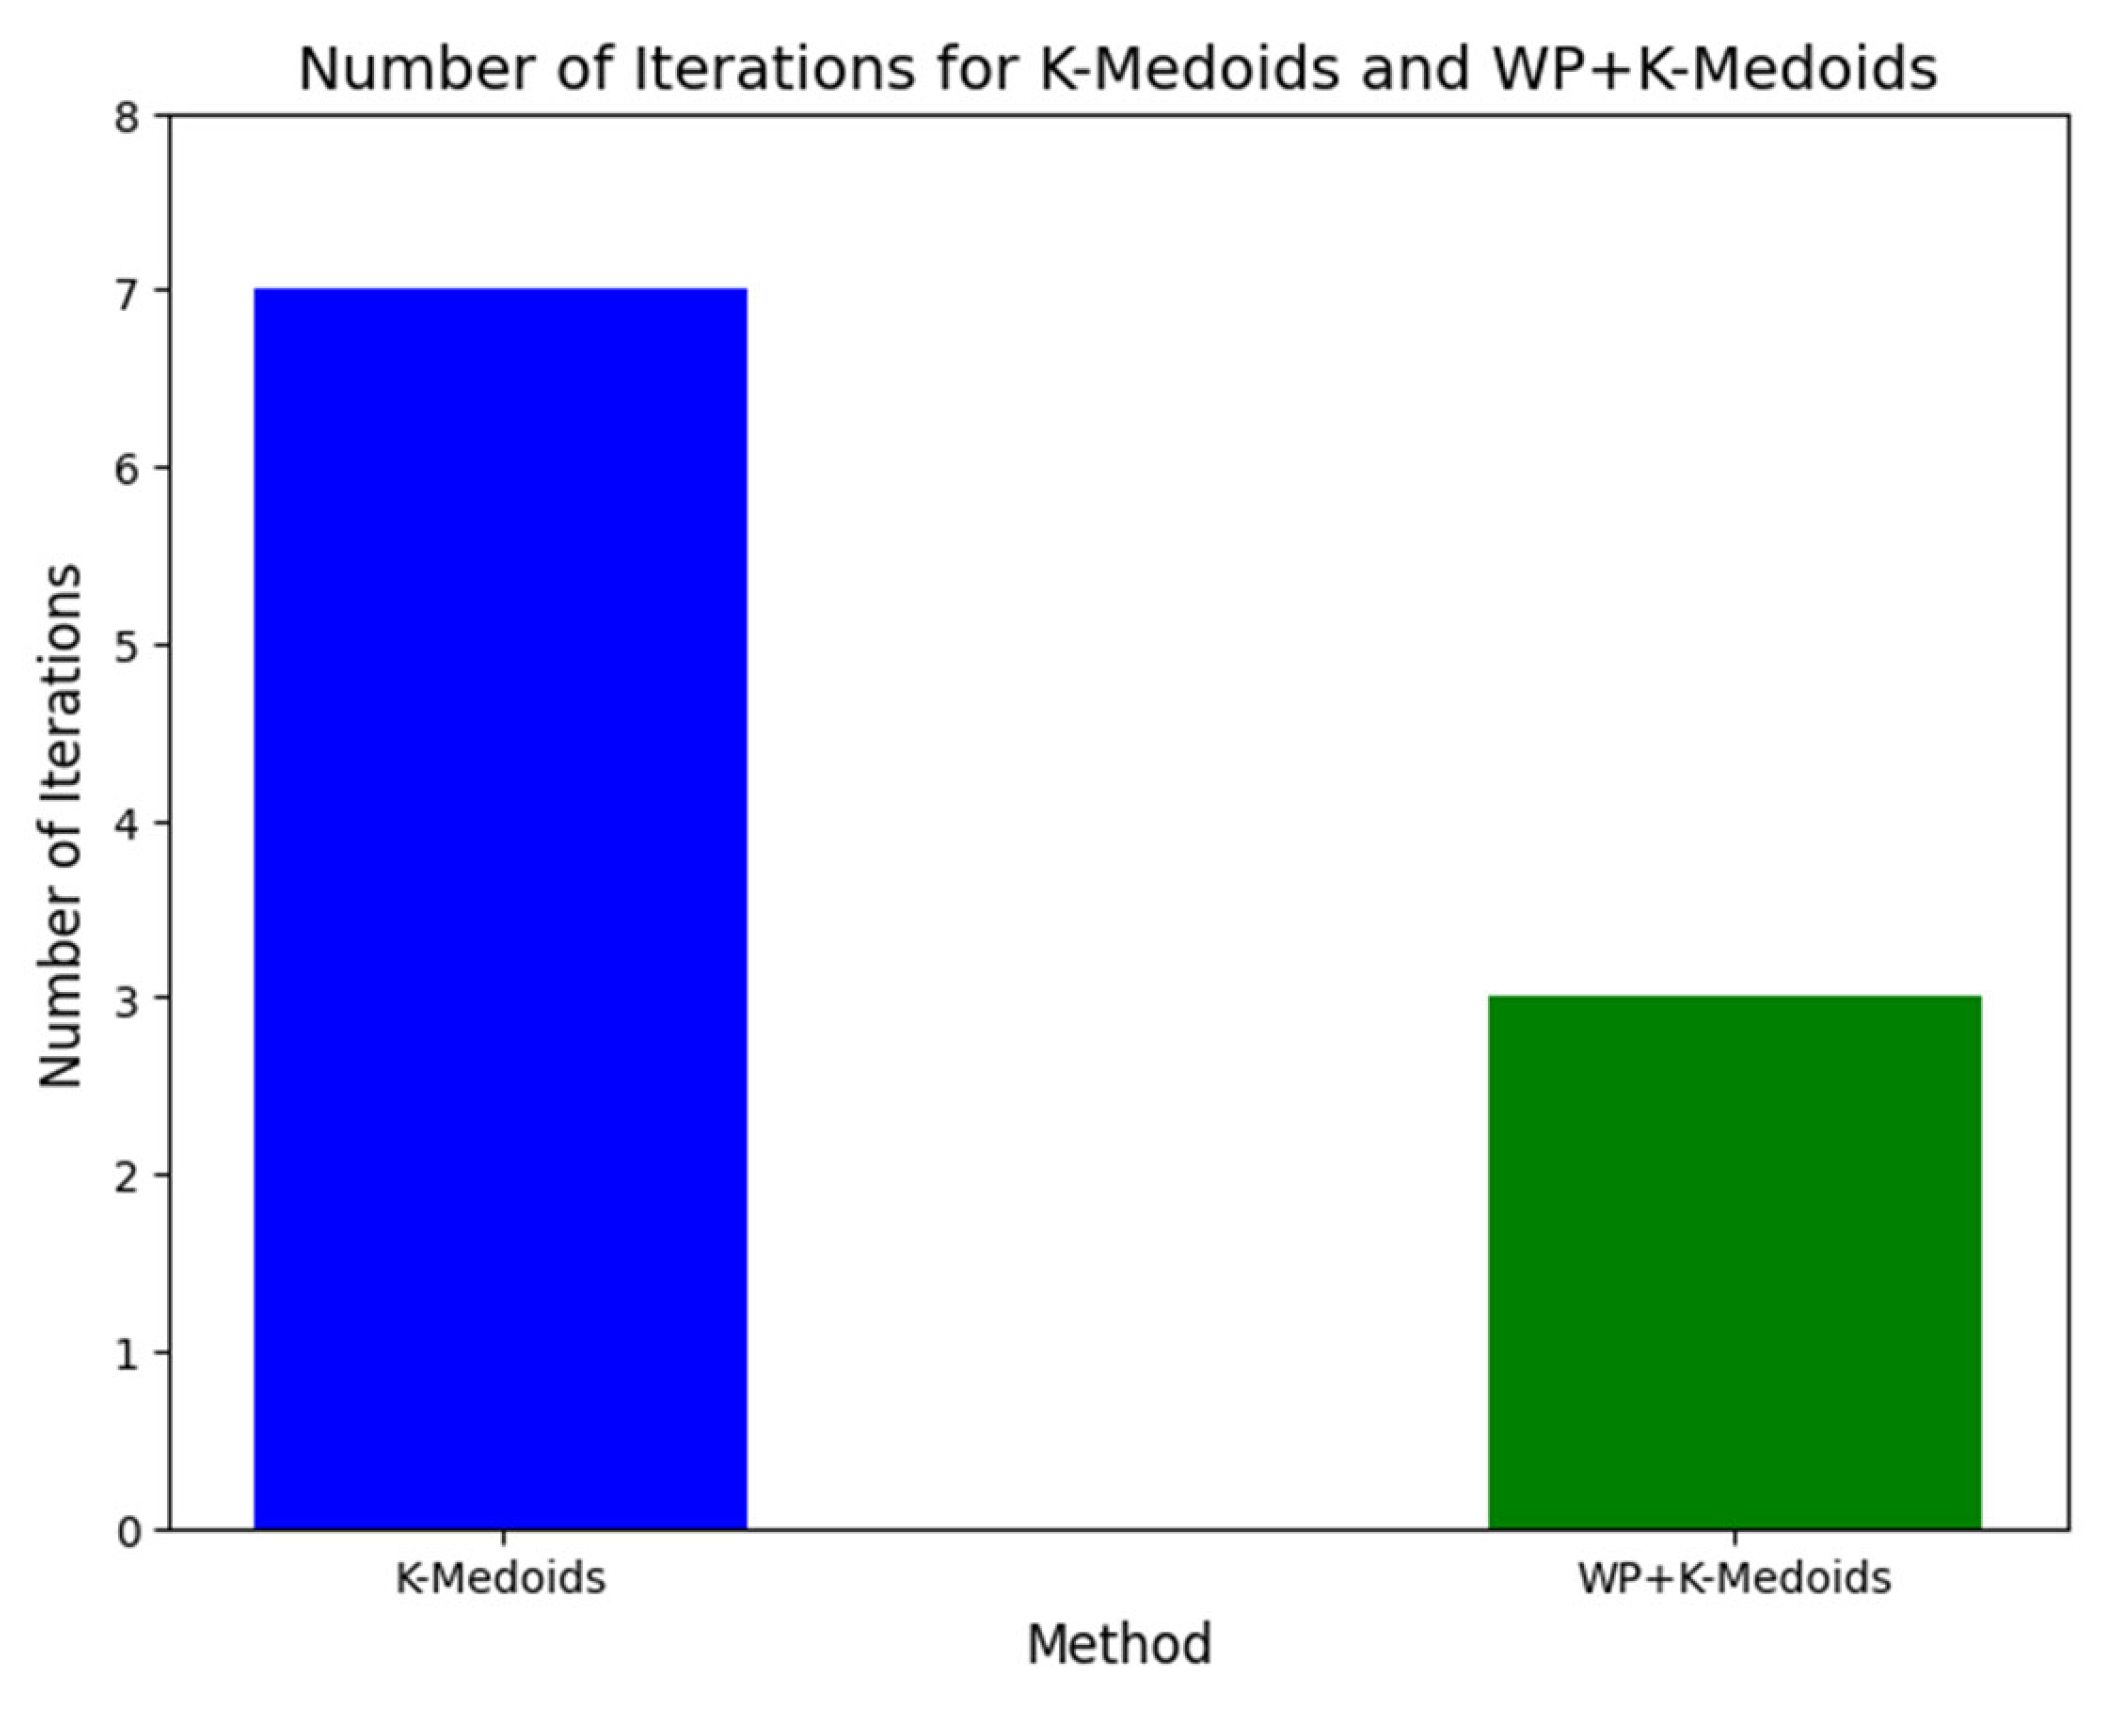
Figure 15.
Comparison of Calinski Harabasz Scores.
Figure 16.
Regions categorized by stunting prevalence in Aceh, Indonesia.
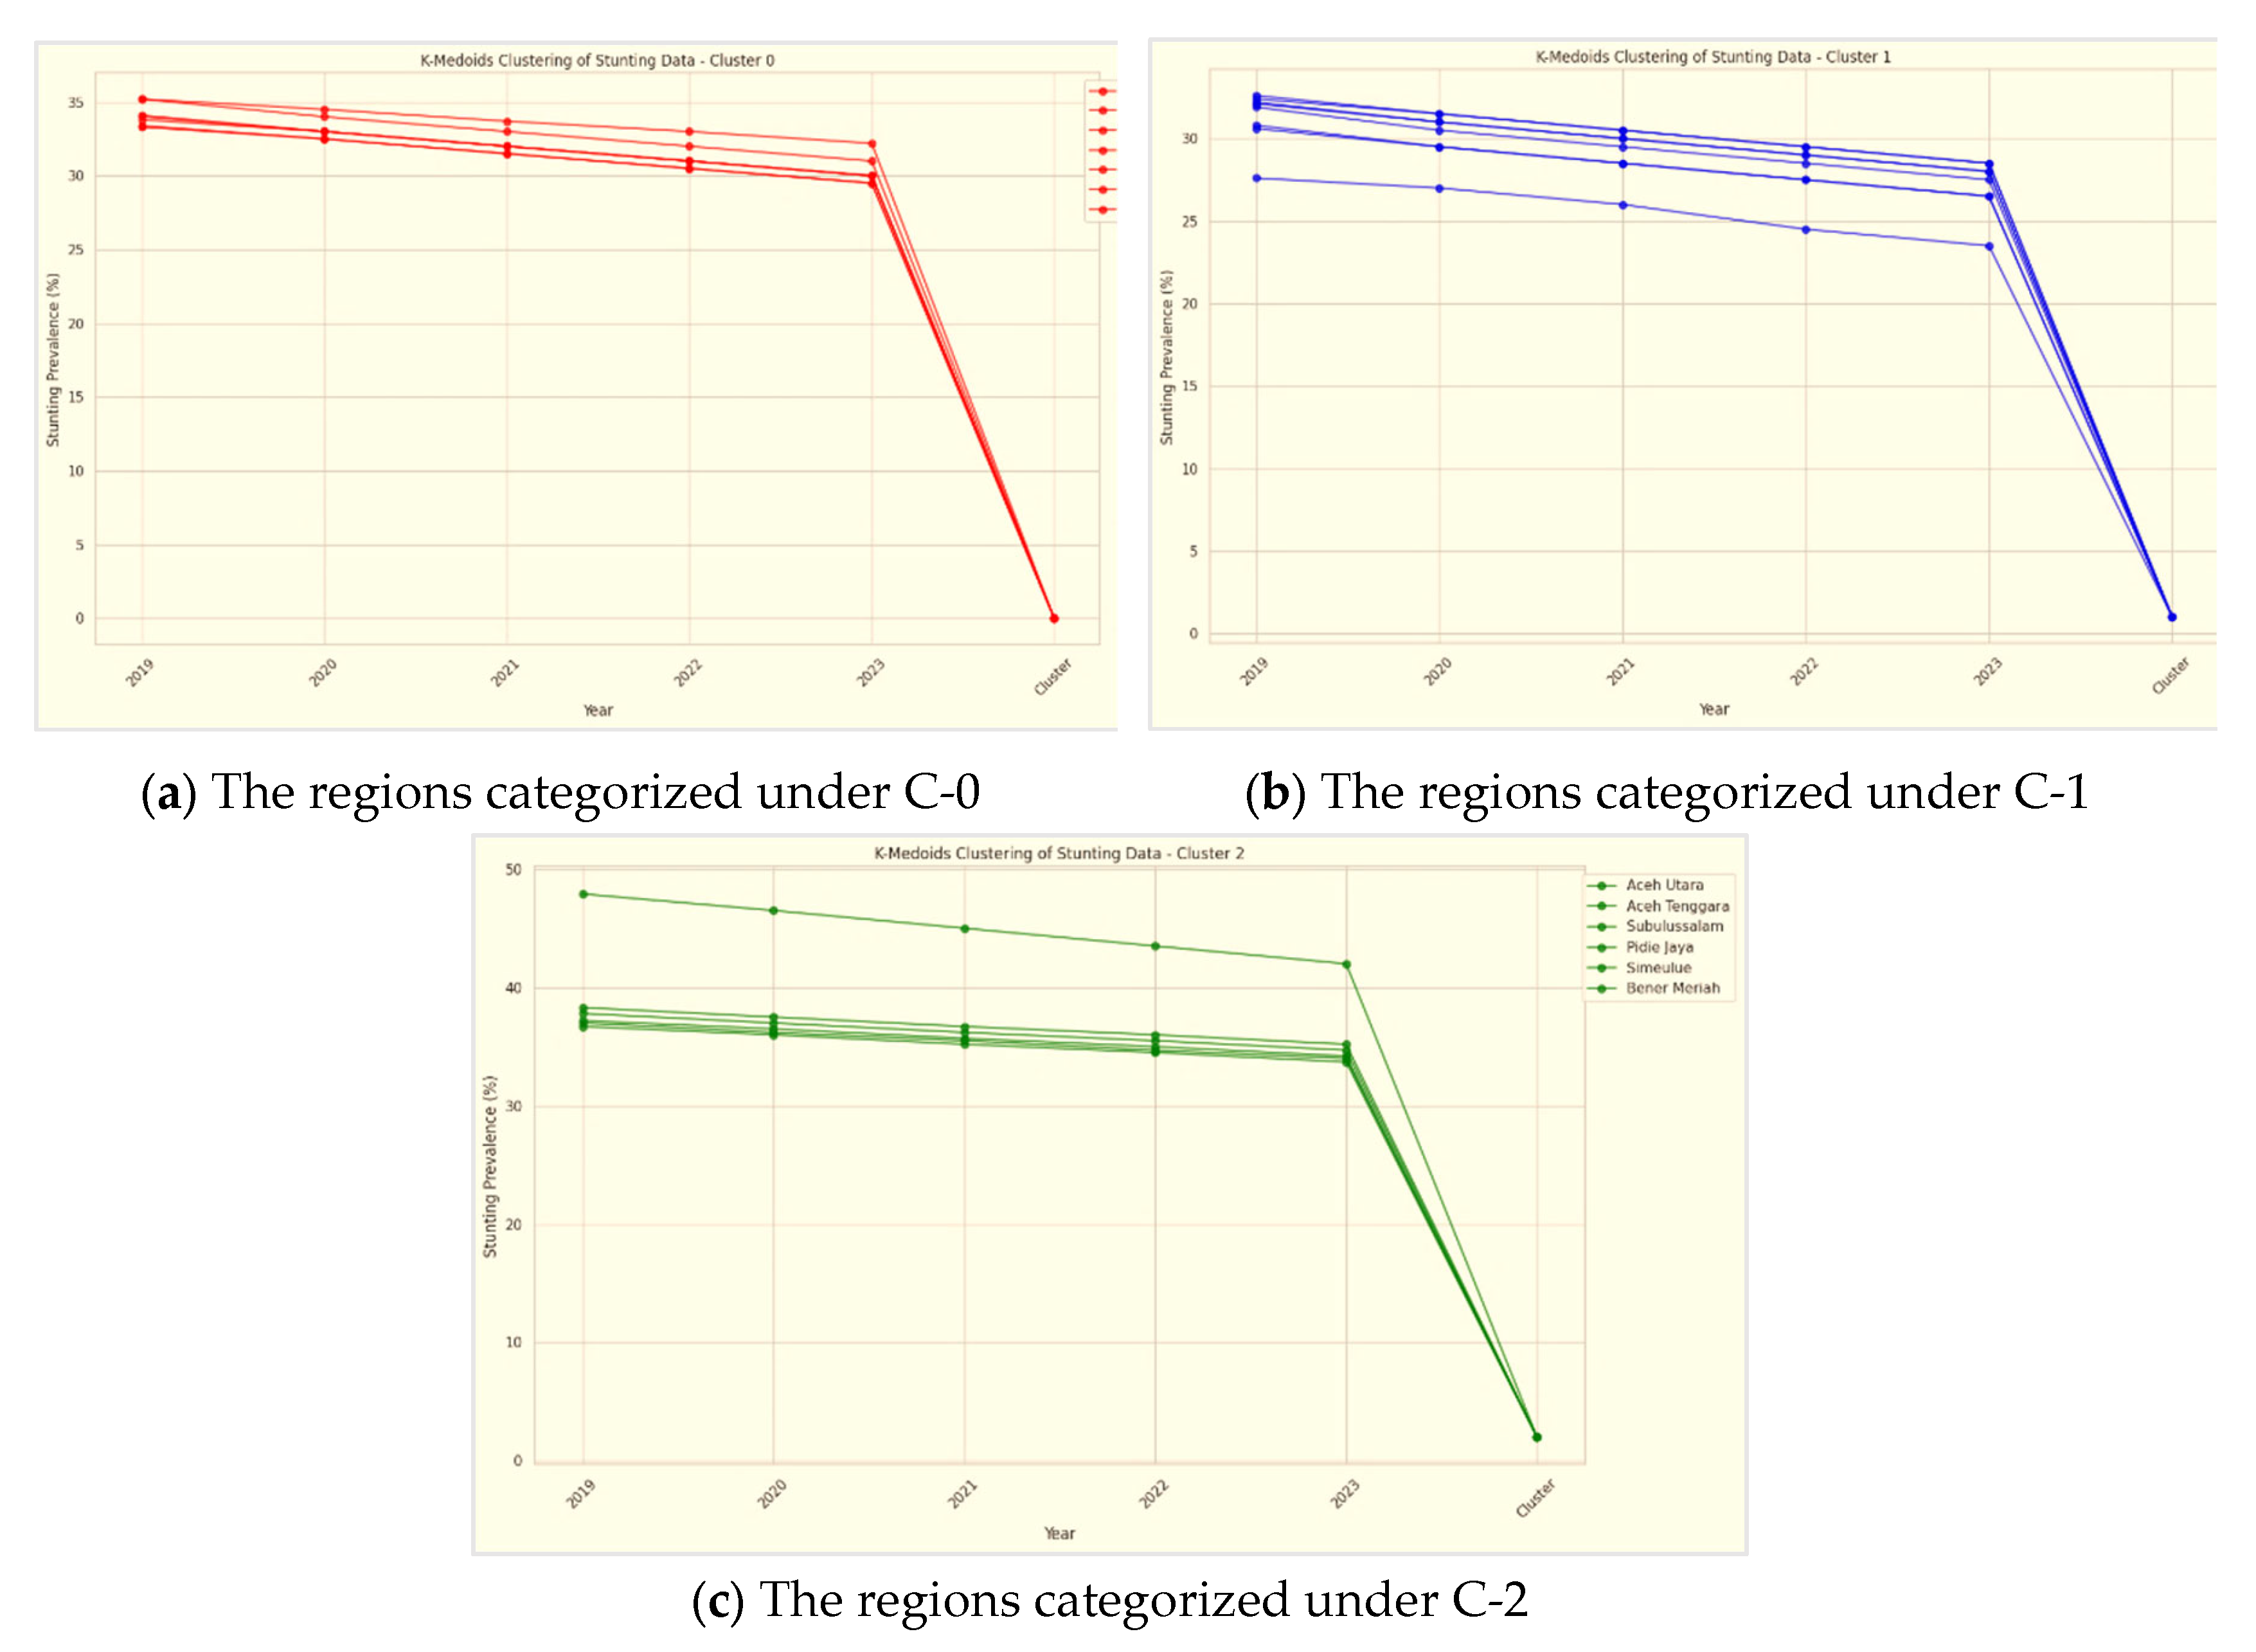
Figure 17.
The clustering results of regions based on stunting prevalence in Aceh.
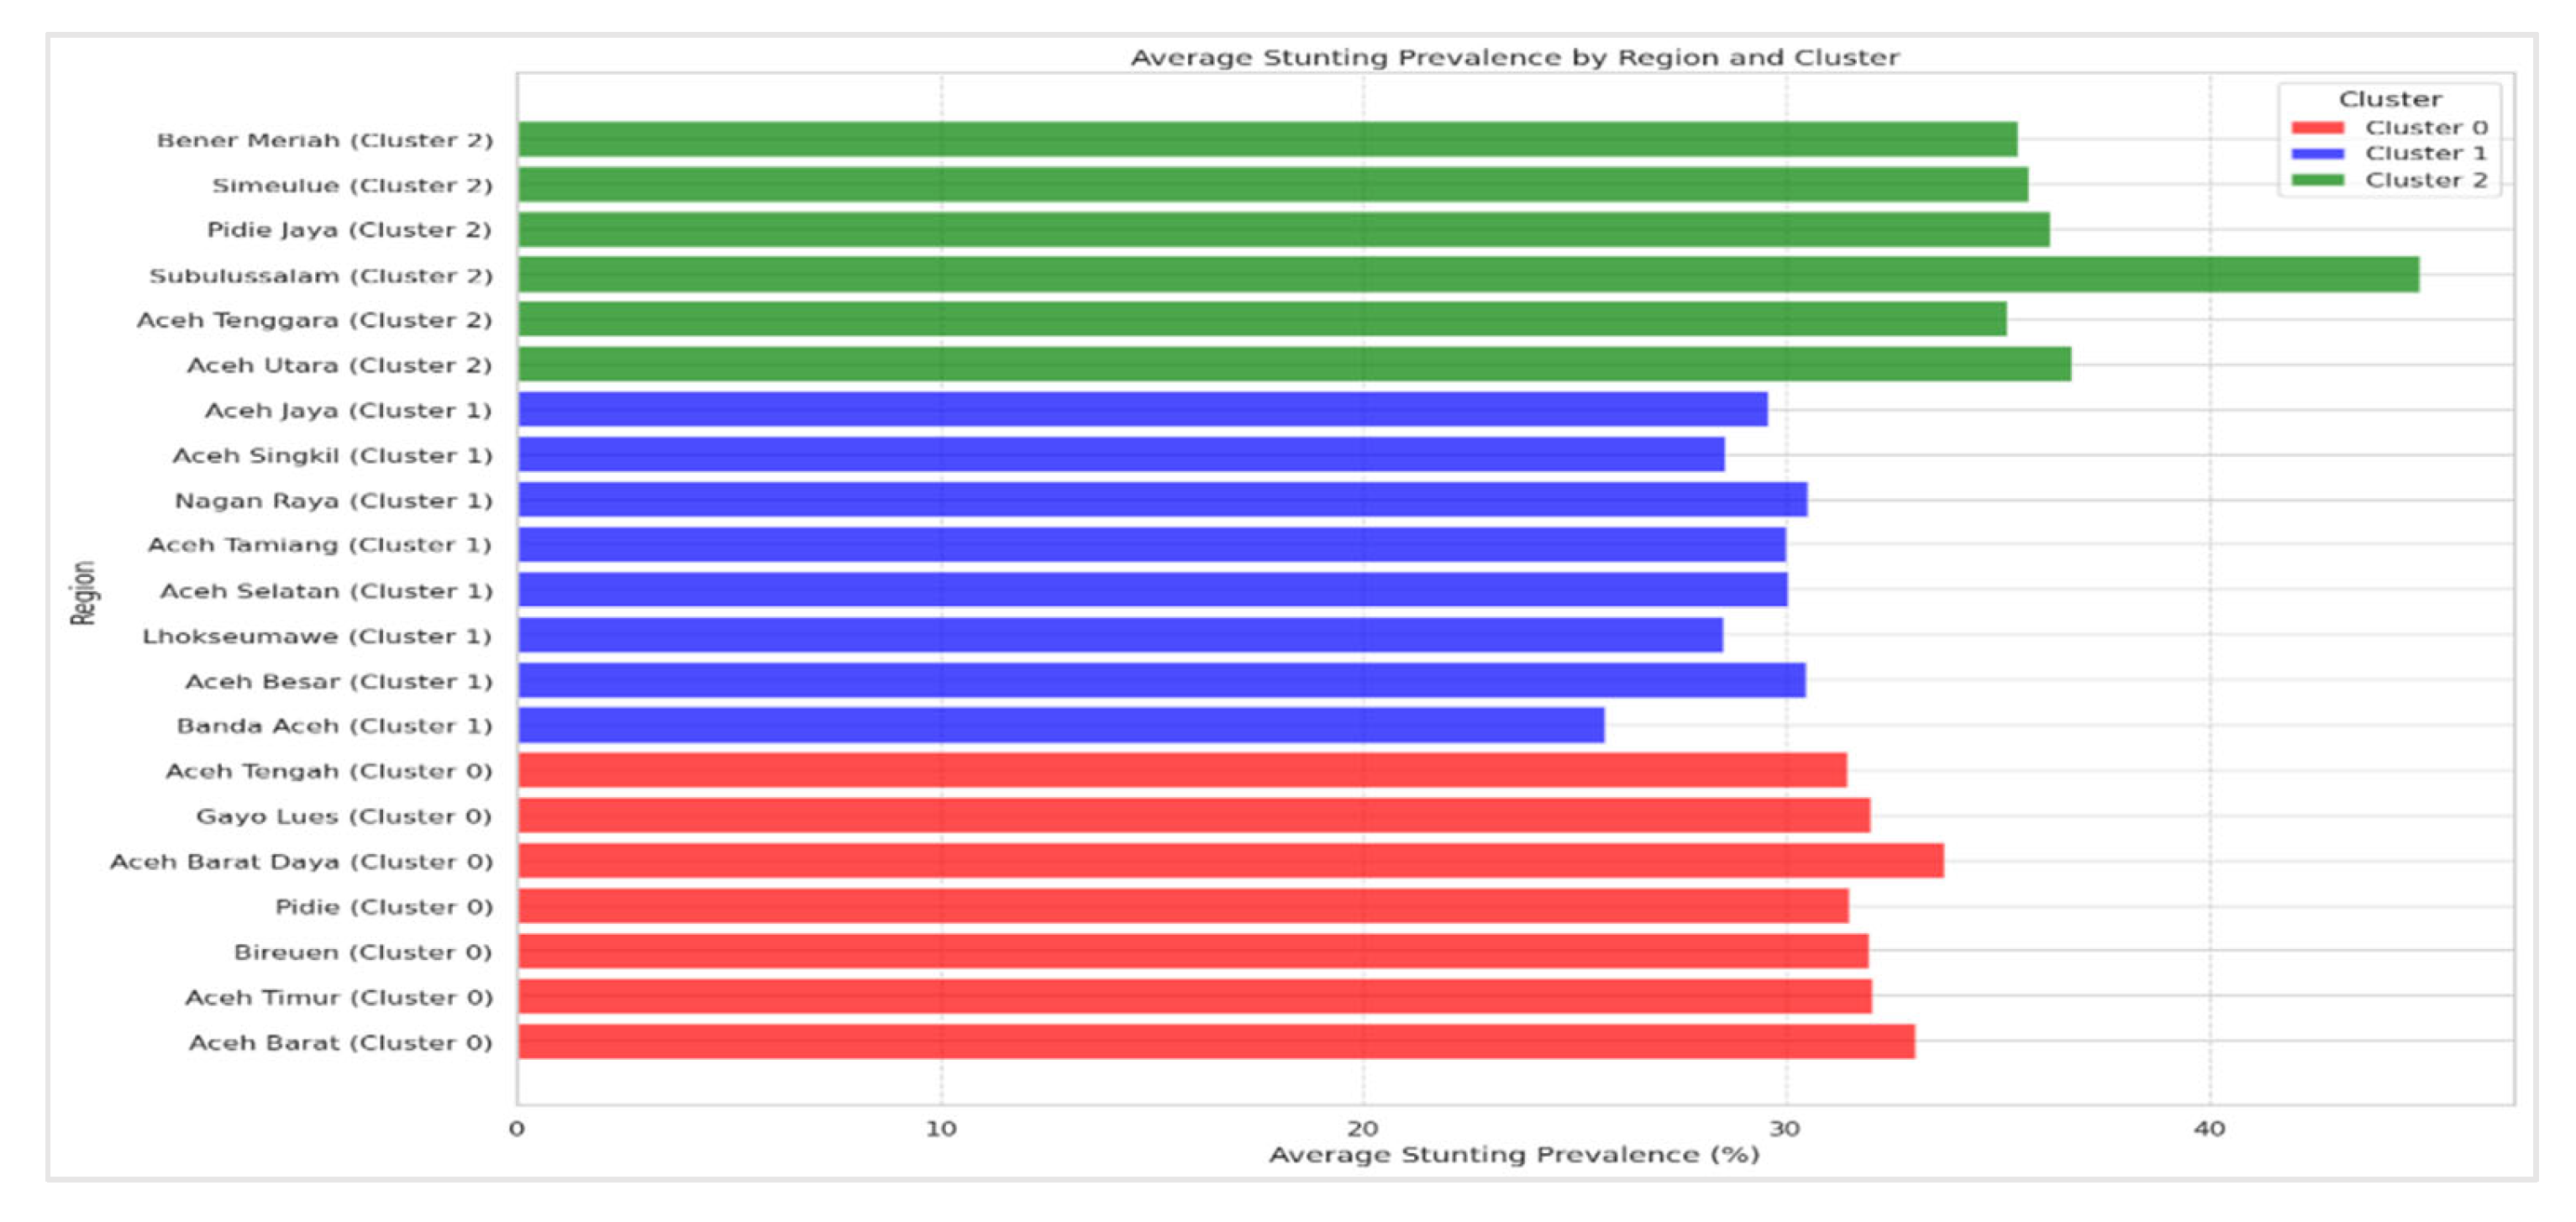

Table 1.
Comparative Analysis of Stunting Research and Differences with Current Study.
| Authors | Methodology | Objectives | Techniques Used | Performance | Key Contributions |
|---|---|---|---|---|---|
| [55] | Traditional statistical methods | Analyze socioeconomic and environmental factors | Descriptive statistics, cross-sectional surveys | Not specified | Identified key socioeconomic determinants of stunting; emphasized the need for targeted nutritional interventions |
| [56] | Public health campaign evaluation | Assess effectiveness of public health campaigns | Comparative analysis, survey data | Some progress in reducing stunting; gaps remain | Evaluated the impact of health campaigns on stunting rates; identified persistent challenges such as food insecurity and limited healthcare access |
| [57] | Machine learning for classification | Classify health conditions using complex datasets | Support Vector Machines (SVM) | Effective in handling high dimensional data | Demonstrated SVM's capability in managing complex health data; set a benchmark for machine learning in health diagnostics |
| [58] | Kernel function comparison | Compare the performance of different SVM kernels in diagnostics | Radial Basis Function (RBF), Sigmoid kernels | RBF kernels generally provided superior performance | Compared SVM kernels to determine the most effective for medical diagnostics |
| [59] | Clustering analysis | Analyze patterns in health data and improve clustering accuracy | K-Medoids | Enhanced clustering accuracy with optimization | Improved accuracy of clustering analysis through advanced techniques |
| [60] | Time series prediction | Forecast stunting prevalence trends | Linear Regression, Time Series Analysis | Accurate short-term predictions | Demonstrated the utility of linear regression for forecasting stunting trends, contributing to better resource allocation and policy planning |
| Current Study | Hybrid machine learning approach | Comprehensive analysis of stunting in Aceh using advanced ML techniques | SVM with RBF and Sigmoid kernels, linear regression, optimized K-Medoids | Improved classification accuracy, predictive capabilities, and clustering insights | Integrated SVM, linear regression, and optimized K-Medoids clustering; provided a unified framework for stunting analysis and offered actionable insights for public health interventions |
Table 2.
Stunting Prevalence Rates by District in Aceh Province (2019-2023).
| District/City | 2019 | 2020 | 2021 | 2022 | 2023 |
|---|---|---|---|---|---|
| Banda Aceh | 27.6% | 27.0% | 26.0% | 24.5% | 23.5% |
| Aceh Besar | 32.4% | 31.5% | 30.5% | 29.5% | 28.5% |
| Aceh Barat | 35.2% | 34.0% | 33.0% | 32.0% | 31.0% |
| Aceh Timur | 34.1% | 33.0% | 32.0% | 31.0% | 30.0% |
| Aceh Utara | 38.3% | 37.5% | 36.7% | 36.0% | 35.2% |
| Bireuen | 33.8% | 33.0% | 32.0% | 31.0% | 30.0% |
| Lhokseumawe | 30.6% | 29.5% | 28.5% | 27.5% | 26.5% |
| Aceh Selatan | 32.2% | 31.0% | 30.0% | 29.0% | 28.0% |
| Aceh Tenggara | 36.7% | 36.0% | 35.2% | 34.5% | 33.7% |
| Subulussalam | 47.9% | 46.5% | 45.0% | 43.5% | 42.0% |
| Pidie | 33.4% | 32.5% | 31.5% | 30.5% | 29.5% |
| Pidie Jaya | 37.8% | 37.0% | 36.2% | 35.5% | 34.7% |
| Aceh Barat Daya | 35.2% | 34.5% | 33.7% | 33.0% | 32.2% |
| Gayo Lues | 34.0% | 33.0% | 32.0% | 31.0% | 30.0% |
| Aceh Tamiang | 32.1% | 31.0% | 30.0% | 29.0% | 28.0% |
| Nagan Raya | 32.6% | 31.5% | 30.5% | 29.5% | 28.5% |
| Simeulue | 37.2% | 36.5% | 35.7% | 35.0% | 34.2% |
| Aceh Singkil | 30.8% | 29.5% | 28.5% | 27.5% | 26.5% |
| Bener Meriah | 37.0% | 36.2% | 35.5% | 34.7% | 34.0% |
| Aceh Jaya | 31.9% | 30.5% | 29.5% | 28.5% | 27.5% |
| Aceh Tengah | 33.3% | 32.5% | 31.5% | 30.5% | 29.5% |
Table 3.
The key variables used in this research.
| Variable | Description |
|---|---|
| Stunting Prevalence Rates | Proportion of children under five years classified as stunted based on height-for-age measurements. |
| Socio-Economic Factors | Includes household income, parental education levels, and employment status, which are potential predictors of stunting. |
| Nutritional Data | Information on dietary intake, availability, and consumption of essential nutrients. |
| Healthcare Access | Variables related to the accessibility and quality of healthcare services, including medical facilities, vaccination rates, and maternal health services. |
| Environmental Factors | Data on living conditions, such as sanitation, clean water access, and housing quality. |
| Demographic Information | Variables including age, gender, and geographical location of the children. |
Table 4.
10-Fold Cross-Validation Results for RBF Kernel in SVM.
| C | Gamma | Fold | Accuarcy (%) |
|---|---|---|---|
| 0.1 | 0.01 | Fold 1 | 85.30 |
| 0.1 | 0.01 | Fold 2 | 86.50 |
| 0.1 | 0.01 | Fold 3 | 85.70 |
| 0.1 | 0.01 | Fold 4 | 84.90 |
| 0.1 | 0.01 | Fold 5 | 85.10 |
| 0.1 | 0.01 | Fold 6 | 86.00 |
| 0.1 | 0.01 | Fold 7 | 85.60 |
| 0.1 | 0.01 | Fold 8 | 85.80 |
| 0.1 | 0.01 | Fold 9 | 86.20 |
| 0.1 | 0.01 | Fold 10 | 85.90 |
| Average Accuracy: | 85.70 | ||
| 1.0 | 0.1 | Fold 1 | 89.50 |
| 1.0 | 0.1 | Fold 2 | 91.20 |
| 1.0 | 0.1 | Fold 3 | 90.30 |
| 1.0 | 0.1 | Fold 4 | 88.40 |
| 1.0 | 0.1 | Fold 5 | 89.10 |
| 1.0 | 0.1 | Fold 6 | 90.00 |
| 1.0 | 0.1 | Fold 7 | 91.70 |
| 1.0 | 0.1 | Fold 8 | 89.80 |
| 1.0 | 0.1 | Fold 9 | 90.50 |
| 1.0 | 0.1 | Fold 10 | 89.90 |
| Average Accuracy: | 90.04 | ||
| 10.0 | 1.0 | Fold 1 | 90.50 |
| 10.0 | 1.0 | Fold 2 | 92.00 |
| 10.0 | 1.0 | Fold 3 | 91.70 |
| 10.0 | 1.0 | Fold 4 | 90.30 |
| 10.0 | 1.0 | Fold 5 | 91.10 |
| 10.0 | 1.0 | Fold 6 | 91.90 |
| 10.0 | 1.0 | Fold 7 | 92.50 |
| 10.0 | 1.0 | Fold 8 | 91.30 |
| 10.0 | 1.0 | Fold 9 | 91.70 |
| 10.0 | 1.0 | Fold 10 | 92.00 |
| Average Accuracy: | 90.04 | ||
Table 5.
The performance of the SVM model using the RBF kernel.
| C | Gamma | Accuracy (%) | Precision | Recall | F1-Score |
|---|---|---|---|---|---|
| 0.1 | 0.01 | 82.00 | 0.75 | 0.80 | 0.77 |
| 1.0 | 0.1 | 88.00 | 0.81 | 0.85 | 0.83 |
| 10.0 | 1.0 | 91.00 | 0.86 | 0.89 | 0.87 |
Table 6.
10-Fold Cross-Validation Results for Sigmoid Kernel in SVM.
| C | Gamma | Fold | Accuarcy (%) |
|---|---|---|---|
| 0.1 | 0.01 | Fold 1 | 85.30 |
| 0.1 | 0.01 | Fold 2 | 86.50 |
| 0.1 | 0.01 | Fold 3 | 85.70 |
| 0.1 | 0.01 | Fold 4 | 84.90 |
| 0.1 | 0.01 | Fold 5 | 85.10 |
| 0.1 | 0.01 | Fold 6 | 86.00 |
| 0.1 | 0.01 | Fold 7 | 85.60 |
| 0.1 | 0.01 | Fold 8 | 85.80 |
| 0.1 | 0.01 | Fold 9 | 86.20 |
| 0.1 | 0.01 | Fold 10 | 85.90 |
| Average Accuracy: | 70.74 | ||
| 1.0 | 0.1 | Fold 1 | 89.50 |
| 1.0 | 0.1 | Fold 2 | 91.20 |
| 1.0 | 0.1 | Fold 3 | 90.30 |
| 1.0 | 0.1 | Fold 4 | 88.40 |
| 1.0 | 0.1 | Fold 5 | 89.10 |
| 1.0 | 0.1 | Fold 6 | 90.00 |
| 1.0 | 0.1 | Fold 7 | 91.70 |
| 1.0 | 0.1 | Fold 8 | 89.80 |
| 1.0 | 0.1 | Fold 9 | 90.50 |
| 1.0 | 0.1 | Fold 10 | 89.90 |
| Average Accuracy: | 78.99 | ||
| 10.0 | 1.0 | Fold 1 | 90.50 |
| 10.0 | 1.0 | Fold 2 | 92.00 |
| 10.0 | 1.0 | Fold 3 | 91.70 |
| 10.0 | 1.0 | Fold 4 | 90.30 |
| 10.0 | 1.0 | Fold 5 | 91.10 |
| 10.0 | 1.0 | Fold 6 | 91.90 |
| 10.0 | 1.0 | Fold 7 | 92.50 |
| 10.0 | 1.0 | Fold 8 | 91.30 |
| 10.0 | 1.0 | Fold 9 | 91.70 |
| 10.0 | 1.0 | Fold 10 | 92.00 |
| Average Accuracy: | 65.76 | ||
Table 7.
The performance of the SVM model using the Sigmoid kernel.
| C | Gamma | Accuracy (%) | Precision | Recall | F1-Score |
|---|---|---|---|---|---|
| 0.1 | 0.01 | 82.00 | 70.00 | 0.65 | 0.68 |
| 1.0 | 0.1 | 88.00 | 75.33 | 0.70 | 0.73 |
| 10.0 | 1.0 | 91.00 | 77.67 | 0.73 | 0.76 |
Table 8.
The Mean Squared Error (MSE) values.
| Regency/City | MSE |
|---|---|
| Banda Aceh | 0.0438 |
| Aceh Besar | 0.0008 |
| Aceh Barat | 0.0032 |
| Aceh Timur | 0.0008 |
| Aceh Utara | 0.0006 |
| Bireuen | 0.0032 |
| Lhokseumawe | 0.0008 |
| Aceh Selatan | 0.0032 |
| Aceh Tenggara | 0.0006 |
| Subulussalam | 0.0008 |
| Pidie | 0.0008 |
| Pidie Jaya | 0.0006 |
| Aceh Barat Daya | 0.0006 |
| Gayo Lues | 0.0000 |
| Aceh Tamiang | 0.0008 |
| Nagan Raya | 0.0008 |
| Simeulue | 0.0006 |
| Aceh Singkil | 0.0072 |
| Bener Meriah | 0.0006 |
| Aceh Jaya | 0.0128 |
| Aceh Tengah | 0.0032 |
Table 9.
Comparison of Clustering Results Between WP+K-Medoids and Conventional K-Medoids.
| Criteria | WP+K-Medoids | K-Medoids |
|---|---|---|
| Number of Iterations | 3 | 7 |
| Calinski Harabasz Index | 49.75 | 25.30 |
| Medoid of Cluster 0 | [37.0, 36.2, 35.5, 34.7, 34.0] | [40.0, 39.0, 38.5, 37.0, 36.0] |
| Medoid of Cluster 1 | [32.4, 31.5, 30.5, 29.5, 28.5] | [33.0, 32.5, 32.0, 31.0, 30.0] |
| Medoid of Cluster 2 | [47.9, 46.5, 45.0, 43.5, 42.0] | [50.0, 48.5, 47.0, 46.0, 45.0] |
| Cluster 1 Region Distribution | Aceh Barat, Aceh Utara, Aceh Tenggara, Pidie Jaya, Aceh Barat Daya, Simeulue, Bener Meriah | Aceh Barat, Aceh Utara, Aceh Tenggara, Pidie Jaya, Aceh Barat Daya, Simeulue, Bener Meriah |
| Cluster 2 Region Distribution | Banda Aceh, Aceh Besar, Aceh Timur, Bireuen, Lhokseumawe, Aceh Selatan, Pidie, Gayo Lues, Aceh Tamiang, Nagan Raya, Aceh Singkil, Aceh Jaya, Aceh Tengah | Banda Aceh, Aceh Besar, Aceh Timur, Bireuen, Lhokseumawe, Aceh Selatan, Pidie, Gayo Lues, Aceh Tamiang, Nagan Raya, Aceh Singkil, Aceh Jaya, Aceh Tengah |
| Cluster 3 Region Distribution | Subulussalam | Subulussalam |
Table 10.
Comparison of Calinski Harabasz Scores.
| Method | Fold 1 | Fold 2 | Fold 3 | Fold 4 | Fold 5 | Fold 6 | Fold 7 | Fold 8 | Fold 9 | Fold 10 | Average |
|---|---|---|---|---|---|---|---|---|---|---|---|
| K-Medoids | 0.0256 | 0.0278 | 0.0264 | 0.0280 | 0.0272 | 0.0265 | 0.0270 | 0.0285 | 0.0269 | 0.0276 | 0.0274 |
| WP+K-Medoids | 0.0305 | 0.0325 | 0.0289 | 0.0297 | 0.0312 | 0.0301 | 0.0298 | 0.0319 | 0.0322 | 0.0284 | 0.0307 |
Disclaimer/Publisher’s Note: The statements, opinions and data contained in all publications are solely those of the individual author(s) and contributor(s) and not of MDPI and/or the editor(s). MDPI and/or the editor(s) disclaim responsibility for any injury to people or property resulting from any ideas, methods, instructions or products referred to in the content. |
© 2024 by the authors. Licensee MDPI, Basel, Switzerland. This article is an open access article distributed under the terms and conditions of the Creative Commons Attribution (CC BY) license (http://creativecommons.org/licenses/by/4.0/).
Copyright: This open access article is published under a Creative Commons CC BY 4.0 license, which permit the free download, distribution, and reuse, provided that the author and preprint are cited in any reuse.


