

Submitted:
02 September 2024
Posted:
03 September 2024
You are already at the latest version
Abstract
Resource and capacity constraints are common challenges for suppliers in digital transformation. This study examines the impact of government subsidies on supplier digital transformation from the perspectives of supply chain diffusion and the local government competition, with supply chain relationship data from A-share listed companies spanning 2010 to 2021. The findings indicate that: government subsidies promote suppliers to expand their diversified downstream customer base, which will boost supplier digital transformation. However, the spillover effect within the same region is higher than that across regions. The heterogeneity analysis results indicate that the effect of government subsidies becomes increasingly apparent as the opportunistic risk escalates; conversely, the impact of such subsidies is considerably constrained by heightened systemic risk. The higher the human capital of suppliers and the smaller the digital divide between suppliers and customers, the better the effect of suppliers receiving innovation diffusion. Further analysis reveals that local government subsidies to upstream suppliers reduce the proportion of downstream local customer purchases outside the jurisdiction, thereby hindering cross-regional spillover effects. This article enriches the research on the promotion mechanism of enterprise digital transformation and the efficiency loss of market segmentation, providing some reference for optimizing local government subsidy behavior.
Keywords:
Government subsidies
; Supply chain configuration
; Digital transformation
; Local government competition
1. Introduction
At present, China’s real economy has confronted notable structural imbalances, characterized by an insufficient effective supply and the leakage of consumer spending. The recent structural imbalances within China’s real economy have led to formidable challenges, including overcapacity, high debt levels, and sluggish economic expansion. The 20th National Congress of the Communist Party of China (CPC) highlighted the critical need for a coordinated strategy that intertwines the expansion of domestic demand with the advancement of supply-side structural reforms. This integrated approach is designed to augment total factor productivity and strengthen the robustness and reliability of the nation’s industrial and supply chain systems. Consequently, leveraging the innovation and application of next-generation digital technologies as an opportunity, it is imperative to analyze the behavioral logic of governments and enterprises. This analysis is essential for guiding policy optimization and directing the effective allocation of resources.
The essence of digital transformation in enterprises lies in the utilization of new-generation digital technologies to fundamentally revolutionize production methods and organizational structures. From an internal corporate perspective, digital transformation positively impacts various aspects such as innovation performance [1,2,3], competitive advantage [4,5], and total factor productivity [6,7]. Externally, the deep integration of digital technology and AI within the supply chain, more precise statements can be made about inventory, orders, deliveries and demand, which effectively helps mitigating the “bullwhip effect” [8]. Despite these potential benefits, data indicates that a mere 25% of enterprises in China have embarked on digital transformation, while over 55% have yet to complete basic equipment digitalization upgrades. Existing studies generally believe that under fiscal and political incentives, local governments are motivated to provide subsidies to alleviate the resource and capacity constraints faced by enterprises in digital transformation [9,10], but the focus of the analysis is limited to the impact of government subsidies on the internal digital transformation of enterprises, ignoring the linkage between the upstream and downstream of the supply chains.
In practice, government subsidies are often used as a tool for competition between local governments. Early studies have generally verified the role of government subsidies in attracting foreign investment and highly skilled talents [11,12,13]. In recent years, the role of government subsidies in helping local enterprises expand their markets has been valued. Taking the financial subsidies for the promotion and application of new energy vehicles as an example, local governments implement subsidies according to a certain proportion of the national subsidy standard. This approach is intended to stimulate market demand, but it has also triggered a “subsidy war”. Among the 88 demonstration cities in China, the total promotion amount of the bottom 40 cities is lower than 80% of the top 5 cities, indicating a highly imbalanced development status of the new energy vehicle market. Against the backdrop of the “official promotion tournament” [14,15], the market competition between local enterprises and the official competition among local officials are more closely tied together: the promotion prospects of local officials largely depend on the competitive performance of enterprises within their jurisdiction in the national market. The expansion into cross-regional markets can be construed as a form of protective strategy, safeguarding the political and economic interests of both officials and enterprises from potential erosion.
To this end, this paper investigates how government subsidies influence the collaborative transformation of upstream and downstream firms within the supply chain from supply chain perspective and local government competition perspective, utilizing data from listed firms spanning 2010 to 2021. This analysis is of substantial practical significance.
Discussions on digital transformation often focus on the technologies themselves without adequately considering the broader social, economic, and institutional environments in which firms operate. Breaking away from the single “technology-driven” perspective, this paper potentially makes several boundary contributions:
(1) Examining firms with supply chain relationship networks provides a more comprehensive understanding of firm behavior and transformation processes. The supply chain relationship network includes not only direct buyer-seller relationships, but also exchanges of technology, information, and management practices. It is found that the digital transformation of customers promotes the digital transformation of suppliers, and the intensity of the spillover effect is heterogeneous depending on the characteristics of the suppliers, which enriches the research on the influences on digital transformation of firms.
(2) Embedding the configuration of supply chains within a geographical spatial context can reveal the dual role of government subsidies in local economic development. Government subsidies can accelerate the digital transformation of suppliers by promoting diversification of downstream customers. Concurrently, local governments’ subsidies to upstream suppliers can restrict the outflow of downstream local customer enterprises, thereby hindering the spillover effects across regions. The supply chain configuration ultimately manifests as a state of “dispersed downstream sales and concentrated upstream procurement”, enriching the understanding of the production efficiency losses caused by market segmentation.
(3) To eliminate the impact of other subsidy policies and clarify the economic effects of special subsidies related to digital transformation implemented by local governments, this paper diverges from the common practice in existing research of relying on research reports issued by the China Academy of Information and Communications Technology (CAICT) and the digital economy plans formulated by the government to establish a keyword corpus. Instead, it constructs a “Digital Technology and Practical Application” corpus based on patent data, serving as a beneficial supplement to the existing literature on government subsidies. Utilizing patent data to construct a keyword corpus can enhance the accuracy of identifying subsidies, patent data includes more technical details and is more closely linked to enterprises.
2. Theoretical Analysis and Research Hypotheses
2.1. Impact of Government Subsidies on Supplier Digital Transformation
Synthesizing the findings of the survey and research, it was identified that suppliers face several main barriers to digital transformation. The main obstacles faced by suppliers in digital transformation include insufficient financial support, increased information security risks, shortage of digitally skilled employees, insufficient supply of information technology experts, strong internal resistance to change, lack of practical experience among management, and uncertainty about industry digital standards [16,17]. All discovered obstacles are related to resources and can be divided into tangible resources and intangible resources. The former includes financial resources, human resources, and material resources, while the latter includes the reputation, culture, knowledge, experience, and relationships with stakeholders of the enterprise.
Considering the current research findings, the Resource-Based Theory (RBT) can provide theoretical support for the study of “how government subsidies can alleviate the resource constraints of suppliers” in the context of digital transformation. Resource-based theory posits that suppliers can maintain and enhance their competitive advantages through effective resource management [18]. This theory has further developed into strategic factor market theory focusing on the resource acquisition process, enterprise theory emphasizing the knowledge-based view, and dynamic capability theory highlighting the ability to adapt to the environment.
On the one hand, government subsidies significantly improve suppliers’ access to crucial resources. Financial support reduces the economic pressure on supplier companies to acquire key technologies and highly skilled personnel [19,20], which not only improves the technical level of supplier companies, but also enhances their competitiveness in the strategic factor market to support their digital transformation. On the other hand, government subsidies promote the diffusion of knowledge and skills [21,22]. The government supports suppliers’ cooperation with higher education institutions or research centers by funding R&D activities, collaborative projects, and training programs, thereby accelerating technology transfer and knowledge application. This cross-border cooperation greatly enhances employees’ digital skills and overall knowledge base; at the same time, government subsidies enhance suppliers’ environmental adaptability and risk response capabilities [23,24]. By leveraging government subsidies, suppliers gain the flexibility and resilience needed to adapt to market fluctuations and technological advancements, maintaining a continuous and robust trajectory towards digital transformation.
In summary, government subsidies not only assist suppliers in addressing their immediate resource and skill needs but also enhance their adaptability and overall competitiveness through long-term restructuring and capacity enhancement. This multifaceted support accelerates the pace of supplier digital transformation. Consequently, this paper proposes Hypothesis 1.
Hypothesis 1:
Government subsidies have a positive facilitating effect on the supplier digital transformation.
2.2. Mechanisms of Government Subsidies Influencing Supplier Digital Transformation
Government subsidies can enhance the diversity of local suppliers’ downstream customers through several ways. Firstly, government subsidies can help suppliers reduce the cost of entering new markets [25,26]. Secondly, government subsidies can be allocated to hire market access consultants who provide suppliers with professional advice on the laws and regulations, market demand, and competitive landscape of target markets. These consultancy services help suppliers gain a precise understanding of new market requirements, formulate effective market entry strategies, and reduce the challenges and uncertainties associated with entering new markets [27,28]. Thirdly, government subsidies support suppliers in conducting targeted R&D to develop products or services tailored to the needs of local markets [29,30]. This targeted R&D enables suppliers to offer more competitive and relevant products in diverse markets. Fourthly, government subsidies enable suppliers to participate in international exhibitions, business seminars, and industry exchange activities. These platforms help suppliers establish connections with potential customers and partners, increase corporate exposure, enhance market recognition, and open up new sales channels [31,32,33]. Through these engagements, suppliers can significantly expand their market reach and customer base. By reducing the administrative barriers and complexity of entering target markets, government subsidies effectively help suppliers diversify their customer base. This diversification not only mitigates market risks for enterprises but also drives their digital transformation by exposing them to diverse market needs and technologies.
The diversification of downstream customers can significantly facilitate supplier digital transformation. This facilitative effect can be analyzed through several dimensions: the diversification of market demand, the intensification of competitive pressures, and the enhanced exchange and diffusion of knowledge and technology. Firstly, catering to a broad spectrum of customer needs necessitates the adoption of more flexible and efficient production methodologies and innovative service approaches [34,35]. This dynamic environment fosters both technological and managerial innovation, driving suppliers to enhance their operational capabilities. Notably, market demand has a greater propensity to stimulate product innovation compared to process innovation [36,37], as suppliers strive to meet varied and evolving customer preferences with new and improved offerings. For example, in response to the dynamic demands of a diverse clientele spanning various geographic regions and industry sectors, suppliers have increasingly adopted sophisticated customer relationship management (CRM) and enterprise resource planning (ERP) systems. These technological advancements are designed to enhance the efficiency of customer information management, enabling the provision of tailored products and services; Secondly, in the context of cross-regional competition, suppliers must navigate not only local market challenges but also the pressures exerted by competitors from other regions. In the digital economy era, differentiation has emerged as a critical strategy for enterprises aiming to secure a competitive edge [38,39]. Digital technologies enhance the accuracy of data analysis and the transparency of information, thereby empowering enterprises to gain profound insights into the nuanced and dynamic nature of customer needs and their situational dependencies [40]. To bolster their competitive position, suppliers are increasingly championing digital transformation initiatives; Thirdly, a firm’s capacity for innovation is significantly influenced by its ability to absorb external knowledge [41]. Each customer group and market segment may offer distinct knowledge, technological requirements, and operational challenges, presenting suppliers with valuable learning opportunities. Engaging with a diverse clientele enables suppliers to deepen their understanding of market dynamics, thereby enhancing their responsiveness and the efficacy of their digital strategies. Based on these considerations, this paper proposes Hypothesis 2.
Hypothesis 2:
Government subsidies promote the diversification of supplier downstream customer bases, which subsequently accelerates the supplier digital transformation.
2.3. Competition among Local Governments Prevents Spillover Effects from Crossing Administrative Boundaries
Drawing on the theory of diffusion of innovation [42], the practical experiences and knowledge generated by customers during digital transformation will spread along the supply chain, providing upstream suppliers with learning and adoption resources. Existing research on supply chain relationships predominantly addresses the flow of production factors and the diffusion of knowledge between upstream and downstream enterprises [43]. It also explicates the phenomenon of inter-firm knowledge spillover through the demand feedback mechanism of customers and the external competitive pressure mechanism exerted on suppliers [44,45]. Considering that the spillover effects of customers’ digital transformation are primarily achieved through technology sharing, standardization requirements, and collaborative projects, suppliers can expedite their own digitalization processes by closely collaborating with customers. This partnership allows suppliers to access and implement these innovations promptly and effectively.
From the product dimension, customer demands are increasingly inclined towards high customization and digital enhancement, compelling suppliers to continually adopt new design and manufacturing technologies to improve their products’ market adaptability. Innovations such as 3D printing and smart manufacturing systems are driving a paradigm shift from traditional mass production methods to more flexible manufacturing approaches. From the process dimension, the integration of digital technologies has refined and enhanced the operational processes of customers. To maintain collaborative efficiency within the supply chain, suppliers must optimize their production, design, and R&D methodologies in alignment with modularization, versioning, and openness requirements. From an organizational perspective, as customers strive to implement networked and flat organizational structures, suppliers must adapt and optimize their management models. This transition from traditional industrial management to digital management necessitates investments in enterprise resource planning, manufacturing execution systems/distributed control systems, product lifecycle management, and other integrative systems. These systems facilitate internal resource integration, dismantle information silos, and externally support the precise alignment of information, capital, and technology among supply chain participants, thereby enhancing overall supply chain efficiency. From the business model dimension, the cross-border expansion of horizontal businesses and the integration of vertical businesses require suppliers to evolve from traditional single product or service providers to comprehensive digital solutions platforms. This evolution encompasses the development of customized online support services and data-driven maintenance services, as well as a shift from one-time transactions to ongoing subscription-based revenue models. Such models enhance customer retention and market competitiveness. Based on these considerations, this paper proposes Hypothesis 3.
Hypothesis 3:
The digital transformation of customers serves as a catalyst for supplier digital transformation.
The advent of new digital technologies compresses time and spatial distances, while digital platforms expand consumer markets and deepen economic linkages between regions. This evolution further exacerbates the imbalance in the distribution of value-added tax (VAT) across regions. For local governments, the local market is no longer the primary “home base” for maximizing fiscal revenues, nor is it the “reserve” for maintaining local fiscal expenditures. Consequently, local governments must reassess their roles and strategies to adapt to a more dynamic and interconnected economic landscape. Local government subsidy strategies play a dual role in this transformation, promoting the diversification of suppliers’ downstream customers and enhancing the internal linkages and self-sufficiency of the local economy. In practice, due to the relatively limited scope of jurisdiction, local governments typically allocate financial resources exclusively within their jurisdictions, making it challenging to mobilize resources from other parts of the country. As a result, they often strive to match the needs of local customers with local suppliers. To achieve this objective, local governments distort upstream factor prices by subsidizing suppliers, thereby stimulating local consumption and reducing dependence on foreign products. Specifically, to prevent local customers from sourcing outside their jurisdictions, local governments engage in competitive subsidy practices. These subsidies are used as tools to influence the degree of cross-regional cooperation between customer firms and suppliers by adjusting the intensity of subsidy policies. This approach not only restricts the free flow of capital and technology but also discourages knowledge spillovers from local customers to suppliers outside the jurisdiction. Based on these considerations, this paper proposes Hypothesis 4.
Hypothesis 4:
Taking into account the competitive dynamics between local governments, spillovers from customers to supplier within the same jurisdiction are higher than those from customers to supplier across different jurisdictions.
3. Research Design
3.1. Model Construction and Variable Setting
To test the impact of government subsidies on supplier digital transformation, this study constructs the following benchmark model:
In this model, the dependent variable is the digital transformation level of supplier i in year t (). The independent variables include the government subsidies related to digital transformation received by this supplier and the combined digital transformation level of downstream customers (). The term denotes control variables, , and denote year, regional, and industry fixed effects, respectively, and is a randomized disturbance term. Additionally, robust standard errors clustered at the city level are used to control for within-group autocorrelation problems. Model (1) focuses on the coefficient , . If is significantly positive, then it indicates that government subsidies can facilitate supplier digital transformation, thereby validating Hypothesis 1. If is significantly positive, then it indicates that customer digital transformation can facilitate supplier digital transformation, thereby validating Hypothesis 3.
To validate the mechanism of government subsidies on supplier digital transformation, referring to Baron and Kenny [46], this paper constructs the following model:
The mechanisms () of interest in this paper include the degree of customer concentration () and the degree of customer localization (). If and are both significantly positive, then it indicates that government subsidies accelerate supplier digital transformation by promoting the diversification of supplier downstream customer bases, thereby validating Hypothesis 2. In addition, the level of digital transformation is calculated separately for customers located in the same city as the supplier () and for customers located in a different city from the supplier (). If is greater than , then it indicates that spillovers from customers to supplier within the same jurisdiction are higher than those from customers to supplier across different jurisdictions, thereby validating Hypothesis 4.
3.2. Variable Selection and Description
3.2.1. Dependent Variable
Supplier Digital Transformation (). Recognizing that digital transformation involves the deep integration of various aspects of supplier production and operations with digital technology, this paper employs text analysis to identify this process, drawing on the studies of Verhoef et al. [47] and Zhai et al. [48]. By calculating the frequency of keywords indicative of “digital transformation” in annual reports, we construct a detailed depiction of the suppliers’ level of digital transformation. Given the right-skewed distribution of keyword frequencies, we use the natural logarithm of the sum of keyword frequencies after adding 1 to measure the level of digital transformation. This approach, while leveraging the advantage of internal information through active supplier disclosure, is susceptible to the influences of capital market dynamics and industrial policies, potentially leading to discrepancies between reported and actual digital transformation levels. To complement this, we also refer to Geng et al. [49] and examine digital intangible assets disclosed in financial statements. We measure the level of digital transformation by the ratio of digital intangible assets to the total intangible assets of the supplier. This method is grounded in the accounting and financial reporting standards, making it less prone to manipulation and providing a more accurate reflection of the enterprise’s comprehensive benefits. Consequently, this dual approach mitigates the overestimation risk inherent in text analysis, offering a balanced and realistic assessment of the digital transformation levels within enterprises.
3.2.2. Independent Variable
Government Subsidies (): Annual reports disclose the specific amount of each subsidy program received by supplier. Established research typically measures government subsidy intensity by aggregating all subsidies, which may include those unrelated to digital transformation. However, different types of subsidies yield inconsistent effects. Therefore, this study screens for digital transformation subsidies by identifying specific keywords in the project names or breakdowns of government grants in the notes to the firm’s financial statements. Given the significant variation in how listed enterprises standardize the disclosure of subsidy information, some enterprises may name the subsidy project based on the digital technology or its practical application, while others may use the policy objectives of the project. To address this, two types of keywords are used for identification.
The first category of keywords is related to subsidy functions, including “Service industry transformation”, “Strategic emerging industries”, “Modern information service”, “Enterprise informatization”, “Industry transformation”, “Industrial economic upgrading”, “New industrialization”, “Industrial upgrading”, “Industrial transformation” and so on. The second category of keywords pertains to digital technology and its practical applications. The “PatSnap” patent database1 categorizes each patent by its technical subject and application field2. Here, the technical subject illustrates the core content of the underlying technology, while the application field delineates the specific scenarios where this technology is applied. Using keywords such as “Big Data”, “Artificial Intelligence”, “Cloud Computing”, “Blockchain”, “Internet of Things”, “Virtual Reality”, and “Quantum Communication” in patent titles or abstracts to search for relevant patents, and using Python to write a web crawler program to obtain specific information of each patent, so as to construct a “Digital Technology and Practical Applications” dictionary.
Customer Digital Transformation (). Given that each supplier corresponds to multiple customers annually, the dataset is constructed in the format of “Supplier-Year-Customer-Proportion of the supplier’s sales to the customer relative to the total sales of the year—Whether supplier and customer are in the same city—Customer Digitization Transformation Level”. Subsequently, using “Supplier-Year” as the grouping variable, the digitization levels of customers are weighted and summed according to the proportion of sales to each customer within the group. This calculation results in a combined value representing the digitization level of downstream customers. Further, by using “Supplier-Year-Whether supplier and customer are in the same city” as the grouping variable, and applying the same weighted summation method, the digital transformation level of customers located in the same city as the supplier () and those located in different cities from the supplier () can be calculated.
3.2.3. Mechanism Variables
Degree of Customer Concentration (): A high degree of customer concentration is indicated when a supplier’s main sales revenue is derived from a small number of customers, reflecting a high dependence on these few customers. Conversely, a supplier that sells products or provides services to a larger number of customers on average demonstrates a diversified customer structure, corresponding to a low degree of customer concentration. Therefore, the degree of customer concentration can be measured using the proportion of the supplier’s sales to the top five customers for the year as a percentage of total annual sales.
Degree of Customer Localization (): A high degree of customer localization is indicated when a supplier’s main sales revenue comes from local customers, reflecting a high dependence on the local market. Conversely, a supplier that sells its products or provides services to a broader range of markets outside its jurisdiction demonstrates geographical diversification of customers, corresponding to a low degree of customer localization. The degree of customer localization is measured using the proportion of the supplier’s sales to local firms among the top five customers as a percentage of total annual sales.
3.2.4. Control variables
To eliminate the influence of confounding factors, referring to the existing literature [1,49,50,51], a series of control variables were added, including supplier age (Age), supplier size (Size), supplier ownership (Soe), Tobin’s Q (TobinQ), net profit margin of total assets (Roa), growth rate of total assets (Grow), financing constraints (FC), proportion of independent directors (Indrate), degree of checks and balances on equity (Own), etc. Year, Region and Industry fixed effects are also introduced to exclude the effects of unobservable factors at all levels. Table 1 lists the definitions of the main variables.
3.3. Data Sources and Descriptive Statistics
This study selects China’s A-share listed companies from 2010 to 2021 as research sample. Financial indicators, upstream and downstream purchasing and sales data are obtained from CSMAR database, and the text of “Management’s Discussion and Analysis”, which measures the digitization level of enterprises, is obtained from China Research Data Service Platform (CNRDS). In the event of missing textual information, it will be supplemented by visiting the websites of Shanghai and Shenzhen Stock Exchanges and reviewing the relevant annual reports. In instances of missing textual information, supplementation is achieved through the examination of the Shanghai and Shenzhen Stock Exchange websites, along with the relevant annual reports. Following the acquisition of raw data, the subsequent steps were undertaken for processing. Considering the special characteristics of the financial industry, samples whose suppliers or customers belong to the financial industry are excluded. To minimize data bias resulting from the absence of information in the annual reports of non-listed enterprises, only samples where both suppliers and customers are listed enterprises were retained. Samples with missing or abnormal key variables were excluded, as well as those with a listing status of ST and *ST in the current year. As a consequence of these procedures, 2,197 observations were obtained. The descriptive statistical results of the main variables are presented in Table 2.
4. Analysis of Empirical Results
4.1. Benchmark Regression Analysis
Table 3 reports the results of the baseline regression. The regression results are consistent between the two methods, controlling for region, year, and industry. The results of Method 1 are illustrated below. The regression coefficient of government subsidies in column (1) is 0.012 and significant at the 1% level, implying that government subsidies increase the level of suppliers’ digital transformation. Column (2) further controls for the digital transformation level of downstream customers, with a regression coefficient of 0.412, also significant at the 1% level, implying that downstream customers’ digital transformation can promote suppliers’ digital transformation. These results support the validity of Hypotheses 1 and 3.
4.2. Endogeneity Test
4.2.1. Replacement of Dependent Variable
①Construct a dictionary from the four dimensions of “modern information systems”, “digital technology application”, “intelligent manufacturing”, and “Internet business models”. The logarithm of the sum of keyword frequencies is taken to obtain the indicators under the new dictionary measure. ②Standardize the number of digital transformation keywords calculated in Method 1 by dividing by the total vocabulary of the annual reports. ③Match the main classification numbers of listed companies patents with the “Statistical Classification of the Digital Economy and its Core Industries(2021)”, screen out patent activities related to the digital economy, and take the logarithm of the sum of digital patents to measure the enthusiasm of enterprises in promoting the digitalization process.
The regression results are shown in Appendix 1. The regression coefficients for government subsidies and customer digital transformation levels remain positive and significant at least at the 5% level, consistent with the benchmark regression results.
4.2.2. Controlling for Reverse Causation
①The study re-estimates the regression using the one-period lagged government subsidy (L.Subsidy) as the independent variable. ②The average value of government subsidies within the same city and industry is selected as the instrumental variable for government subsidies in a two-stage least squares (2SLS) regression. Firstly, local governments proactively implement subsidy measures to align with central industrial policies, thus selecting and supporting suppliers in different industries based on central policy directions. Secondly, local government subsidies typically originate from their fiscal revenues, which vary according to the economic development level of different regions. Therefore, using the average government subsidy within the same city and industry as an instrumental variable effectively reflects the level of policy support for a specific industry in a specific region. This instrumental variable theoretically has no direct connection to the supplier’s level of digital transformation but is closely related to the potential government subsidies the supplier may receive, thereby meeting the basic requirements of an instrumental variable. ③Firstly, a probability model is established to predict the likelihood of suppliers receiving government subsidies. Then, the inverse Mills ratio for the suppliers is calculated. Finally, this ratio is incorporated into the baseline regression model for re-estimation of the coefficients.
The regression results are shown in Appendix 2. After including L.Subsidy in the model, the coefficient for this variable remains significantly positive. The validity test statistics for the instrumental variable (IV.Subsidy) indicate that there are no issues with weak instruments or under-identification, and its regression coefficient also remains significantly positive. Additionally, after controlling for the inverse Mills ratio, the regression coefficient for government subsidies remains significantly positive.
4.2.3. Omitted Variable Issue
①If suppliers have already obtained critical knowledge and resources on effectively implementing digital transformation through their social networks, this may prompt them to adopt digital transformation measures earlier. When such suppliers receive government subsidies because they appear more “well-prepared”, it may misleadingly suggest that their digital transformation success is primarily due to government subsidies. Considering the influence of supplier social networks, relevant characteristic variables are added, including independent director network centrality (Idnc), institutional investor shareholding ratio (Inpro), whether the supplier holds bank shares (Bankhold), and whether or not the actual controller of the enterprise controls multiple companies (Ocm). ②Although year, region, and industry fixed effects have been controlled, specific events occurring in certain regions or industries in particular years may still not be fully captured. Therefore, this study adds interaction fixed effects between industry and year, as well as region and year.
The regression results are shown in Appendix 3. After adding the characteristic variables reflecting supplier social networks, the regression coefficients for government subsidies and customer digital transformation levels remain significantly positive. Further controlling for the interaction fixed effects, the magnitude and significance of the core explanatory variables’ coefficients did not change substantially.
4.3. Robustness Test
4.3.1. Excluding the Influence of Central Policies
In 2018, the Ministry of Commerce, along with eight other departments, jointly initiated the “Supply Chain Innovation and Application Pilot” program to promote the development of industrial supply chain systems. Consequently, supplier digital transformation may be influenced by central policies. To accurately assess the true effect of local government subsidies, this study excludes enterprises3 and cities4 included in the pilot list from the sample starting from the pilot year and onwards, then re-examines the data. The regression results, shown in Appendix 4, indicate that the regression coefficients for government subsidies and customer digital transformation levels remain significantly positive, supporting the fundamental conclusions of this paper.
4.3.2. Propensity Score Matching and Placebo Tests
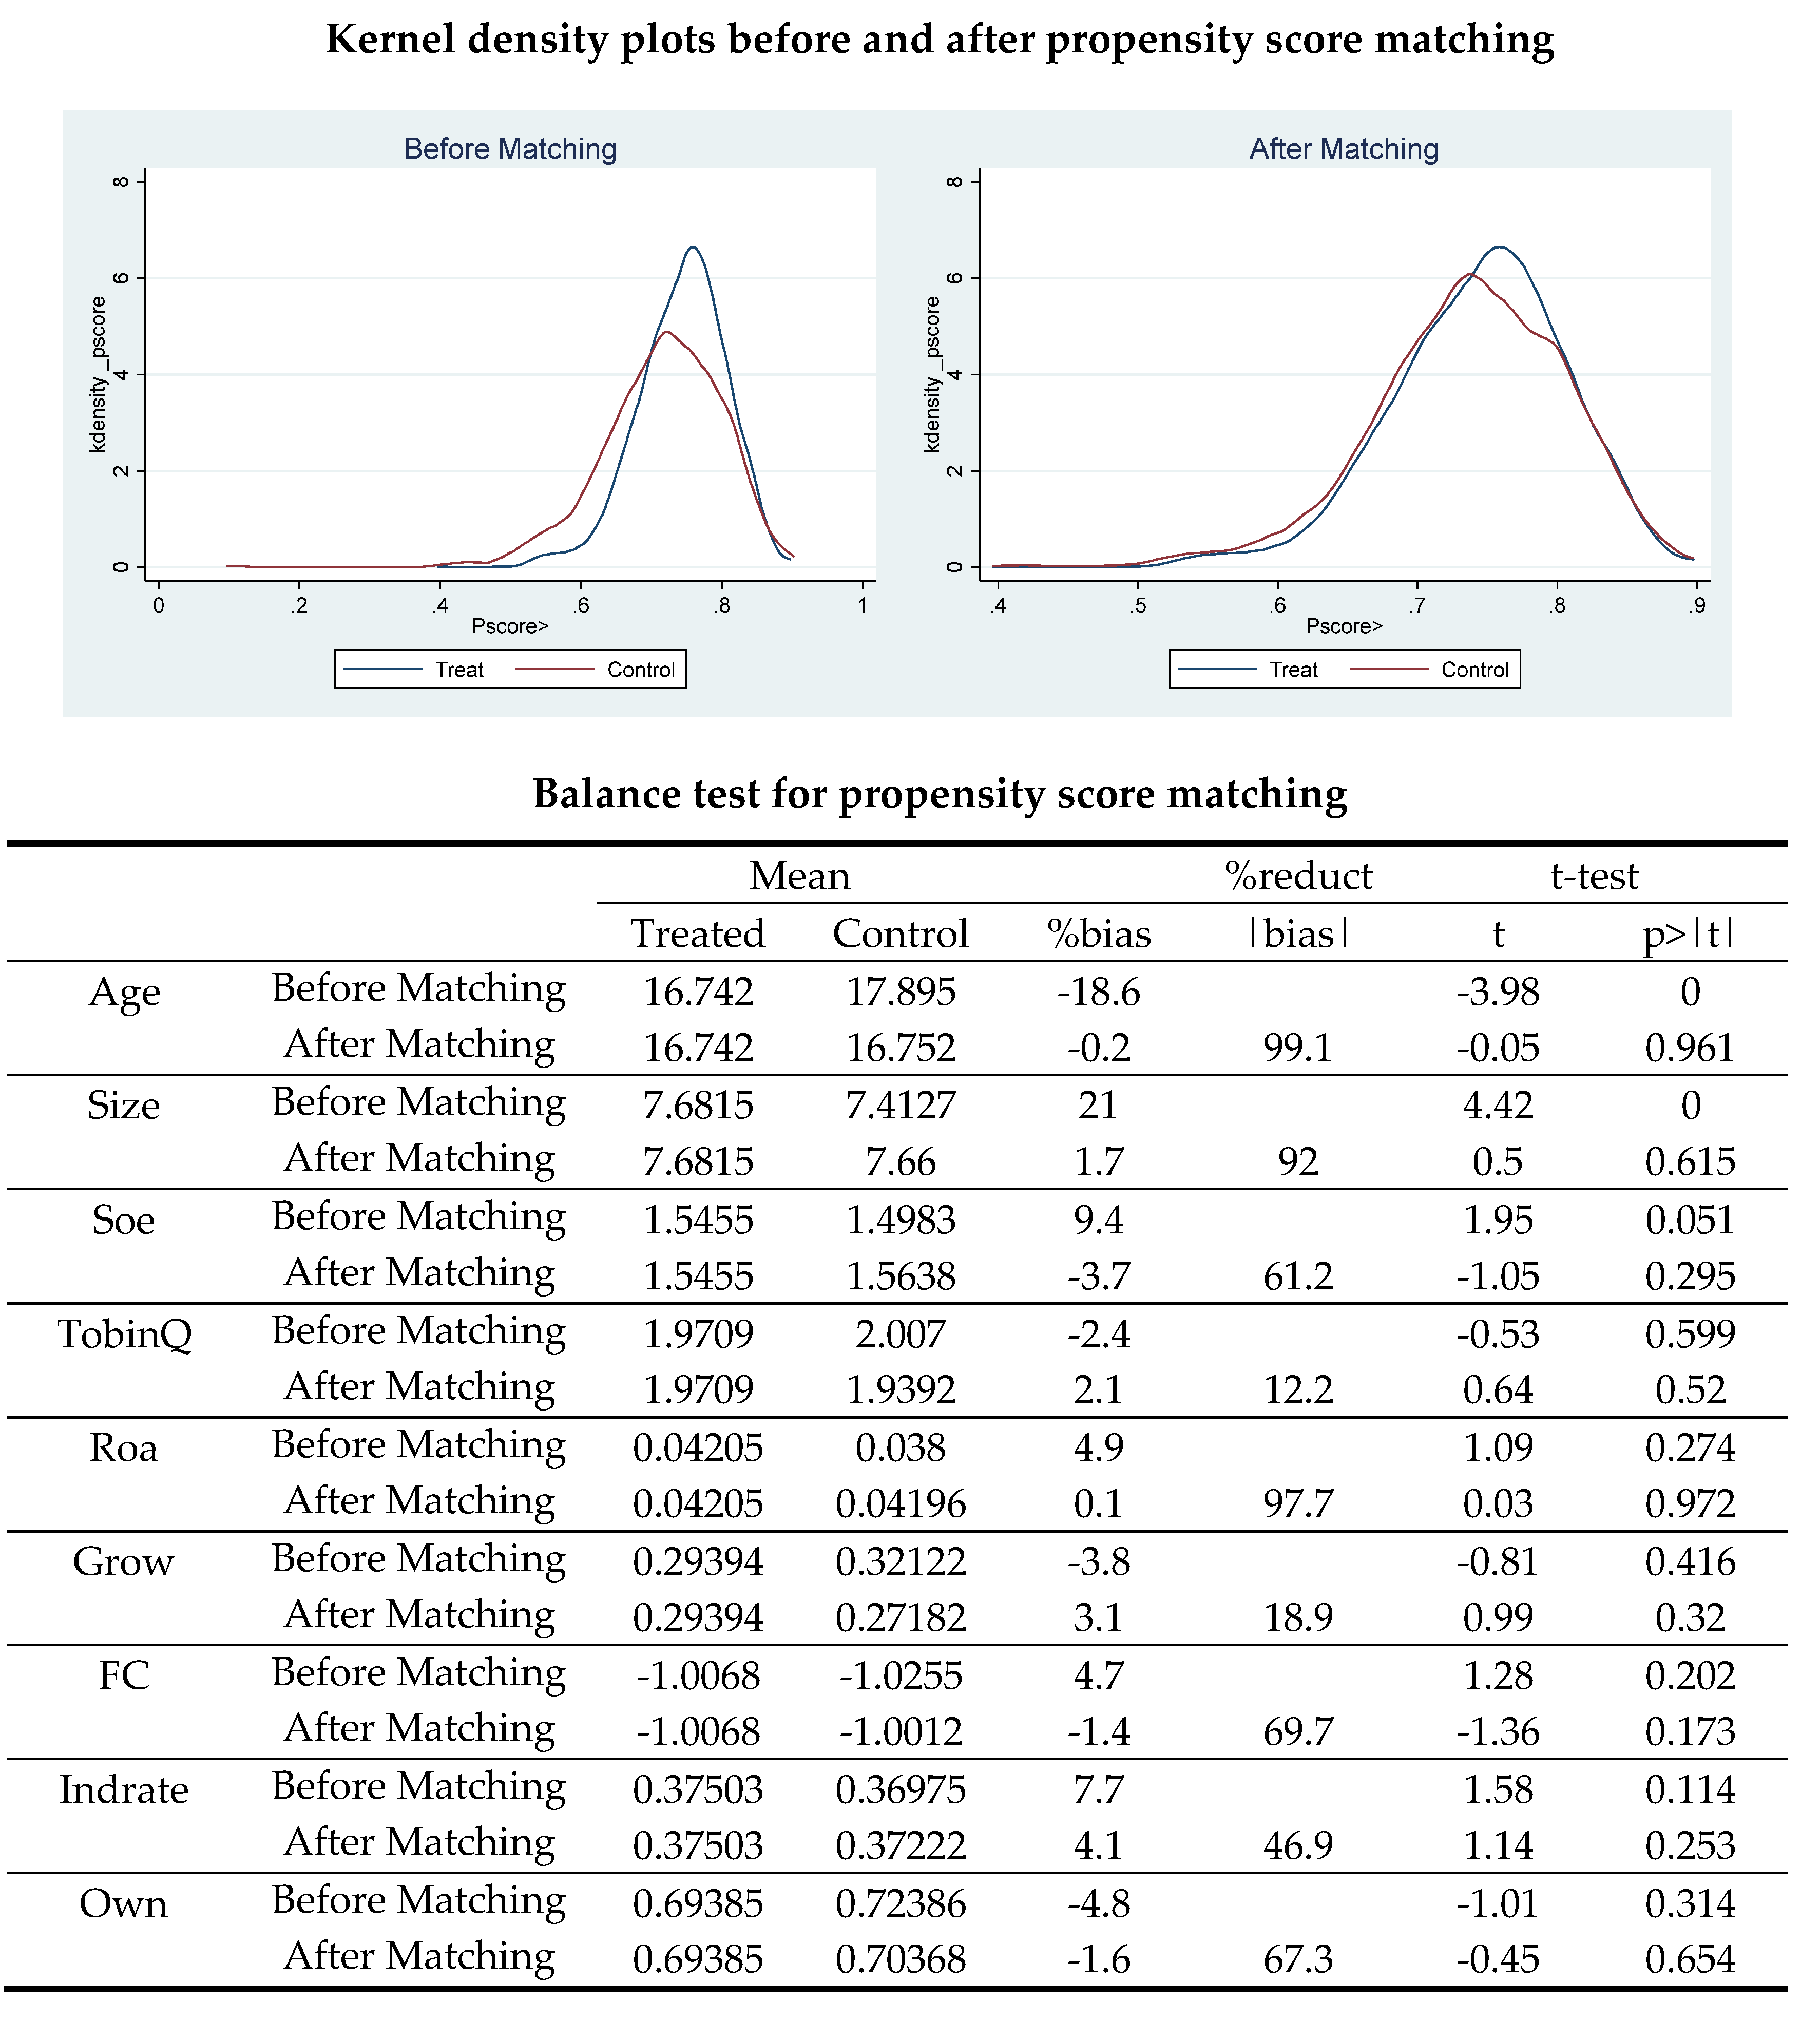
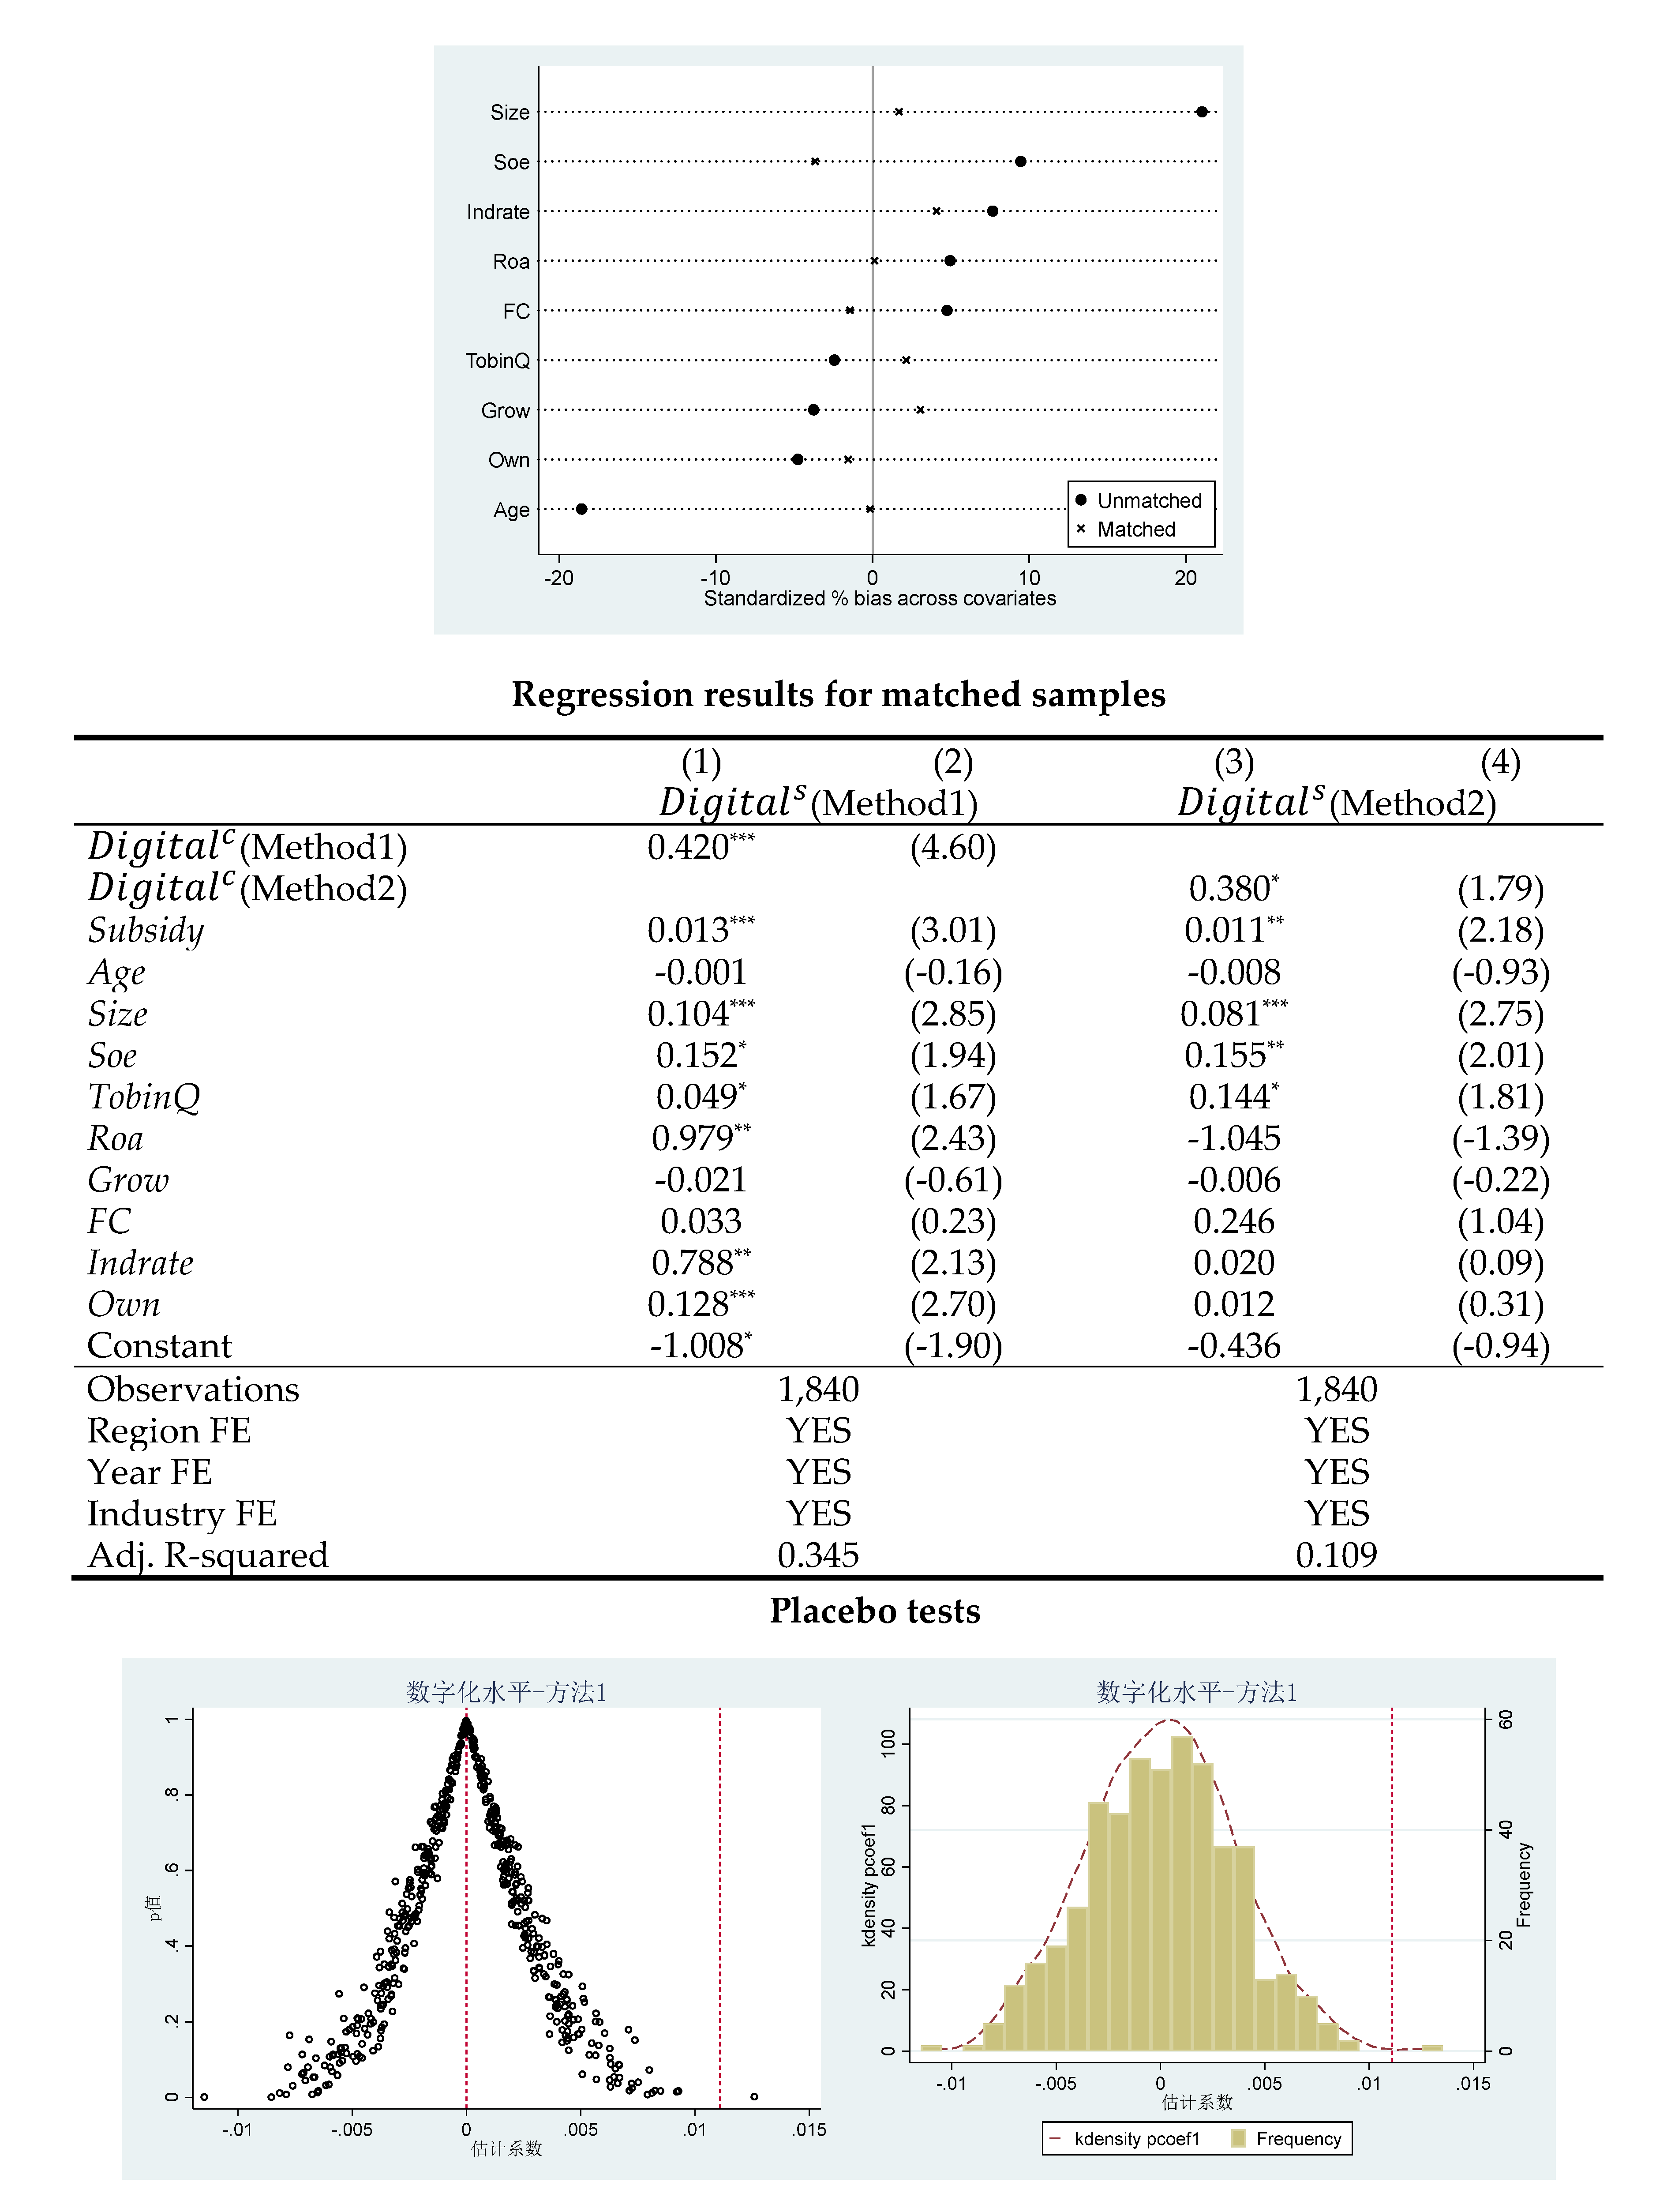
①The sample is divided into a treatment group and a control group based on whether the supplier receives government subsidies. The control variables mentioned earlier are selected as matching covariates, and 1:5 nearest neighbor matching within a 0.05 caliper is employed. The matched treatment and control groups satisfy the common support assumption, and the mean values of covariates in both groups show no significant differences, meeting the balance requirement. ② If it is other unobserved confounding factors that increase the level of supplier digital transformation, then randomly matching government subsidies with suppliers and re-testing, the increase in government subsidies still promotes the digital transformation of firms. Conversely, if there is no such effect, the role of other potential confounding factors can be ruled out.
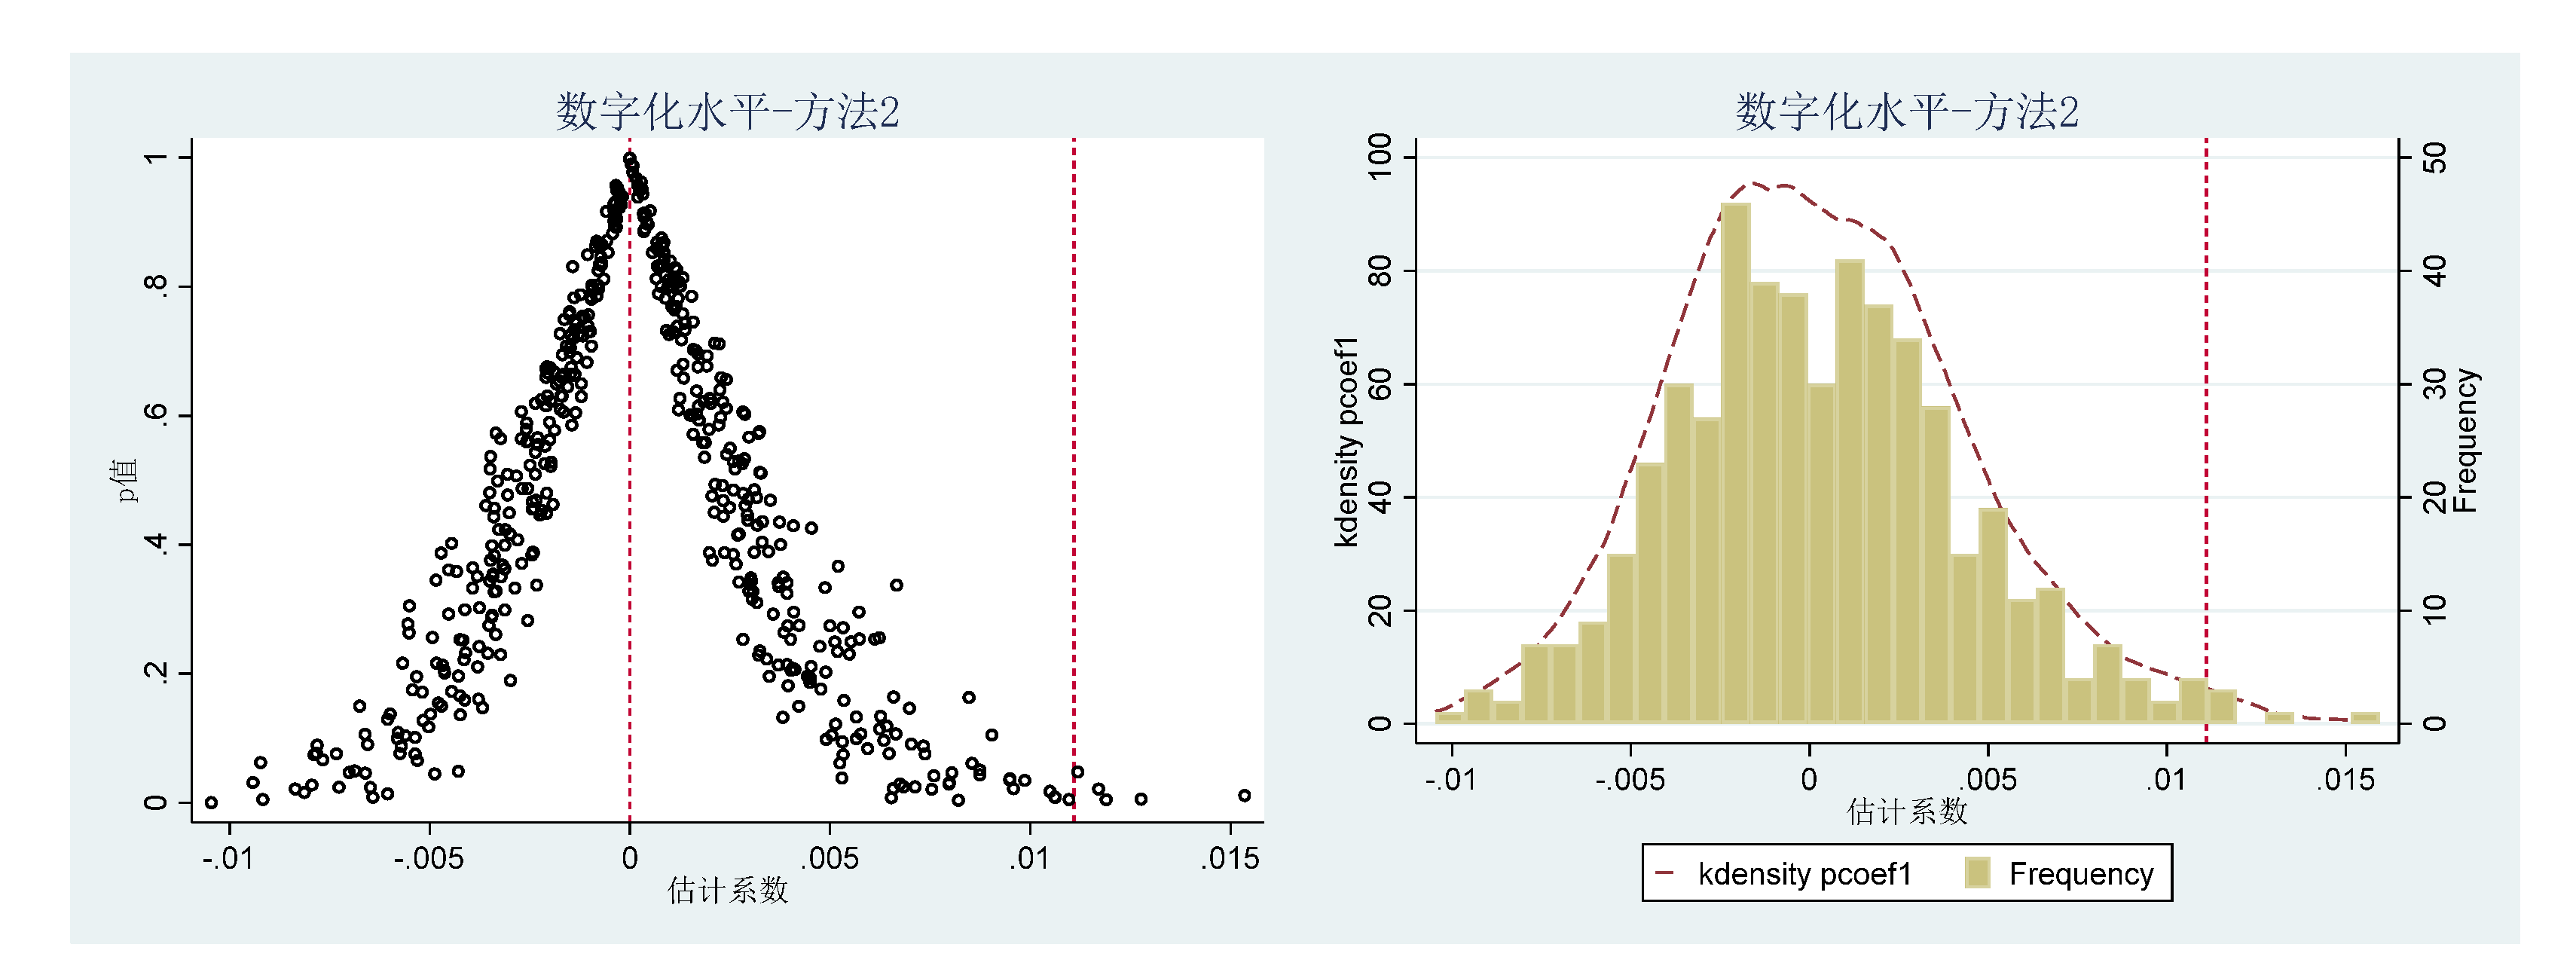
The results are shown in Appendix 5. Re-testing the relationships between variables based on the matched sample, the regression coefficients for government subsidies and customer digital transformation levels remain significantly positive. Additionally, this study conducts 500 placebo tests, and the estimated coefficients for government subsidies measured by both methods in the baseline regression are located to the left of the 5th percentile of the placebo test coefficient distribution. This indicates that it is almost impossible to obtain the baseline regression results through random matching. The sample obtained through random matching does not reflect the impact of government subsidies on supplier digital transformation. Therefore, the hypothesis that other potential unobserved factors improve the level of supplier digital transformation is not supported.
4.3.3. Annual Report Information Disclosure Issues
The level of digital transformation measured by Method 1 is based on the number of keywords extracted from annual report text, which may be influenced by annual report information disclosure issues. Therefore, this study employs the following three methods for verification. ①Exclude national and provincial high-tech suppliers from the sample. The business activities of high-tech suppliers are highly related to digital transformation keywords, potentially leading to an overestimation of their level of digital transformation. ②Exclude suppliers penalized by the China Securities Regulatory Commission (CSRC) or stock exchanges to reduce analysis bias caused by potential misconduct, such as exaggerating or manipulating data in annual report disclosures. ③Exclude suppliers deemed unqualified in information disclosure evaluations by the Shenzhen Stock Exchange, as these suppliers are more likely to manipulate annual report text information.
The results, shown in Appendix 6, indicate that under different sample screening schemes, the regression coefficients for government subsidies and customer digital transformation levels remain significantly positive, supporting the basic conclusions of this study.
4.4. Influence Mechanism Test
Table 4 shows the results of the mechanism test5. Columns (1) to (3) report the mechanism test results of how government subsidies accelerate supplier digital transformation by promoting the diversification of their downstream customer structure. Under both measurement methods, the regression coefficients of customer concentration on the level of supplier digital transformation are significantly negative at the 5% level, and the regression coefficient of government subsidies on customer concentration is significantly negative at the 10% level. This indicates that increased customer concentration negatively impacts supplier digital transformation, but government subsidies can reduce supplier customer concentration.
Columns (4) to (6) report the mechanism test results of how government subsidies accelerate supplier digital transformation by promoting the geographical diversification of their downstream customers. Under both measurement methods, the regression coefficients of customer localization on the level of supplier digital transformation are significantly negative at the 10% level, and the regression coefficient of government subsidies on customer localization is also significantly negative at the 10% level. This indicates that increased customer localization negatively impacts supplier digital transformation, but government subsidies can reduce the degree of customer localization. These results support the validity of Hypotheses 2.
Furthermore, by comparing the regression coefficients of the digital transformation level of local customers () with that of non-local customers (), it is found that, under different mechanisms and measurement methods, the regression coefficients of are consistently higher than those of . This indicates that the spillover effects within the same region are higher than those across regions, thus validating Hypothesis 4.
4.5. Heterogeneity Analysis
The effects of government subsidies and customer spillover may vary due to differences in the internal and external environments of suppliers, and exploring these variations has significant practical implications. On one hand, mechanism analysis indicates that government subsidies accelerate supplier digital transformation by promoting the diversification of downstream customers. However, external risk shocks can also impact supply chain configurations [53]. External risks include opportunistic risks and systemic risks; the former is related to the supplier’s market position and industry competition intensity, while the latter is related to the duration and scope of major unexpected events. Generally, the higher the opportunistic risk, the more pronounced the effect of government subsidies, whereas the higher the systemic risk, the more limited the effect of government subsidies. On the other hand, combining the innovation diffusion theory, scholars have found that the effectiveness of innovation diffusion reception is mainly influenced by factors such as enterprise human capital and technological proximity [45,54]. Specifically, the higher the supplier’s human capital and the smaller the “digital divide” between suppliers and customers, the better the supplier’s reception of innovation diffusion. To test these hypotheses, the sample is grouped according to relevant characteristic variables, and the differences in regression coefficients between groups are compared. The complete regression results are shown in Appendix 8.
4.5.1. Opportunistic Risk
Market-dominant suppliers are those that hold a leading position in the market, possessing high bargaining power within the supply chain. This allows them to ensure stable product sales, thereby reducing the likelihood of opportunistic behavior. However, when competition within the supplier’s industry intensifies, downstream customers have more alternative trading partners, weakening the supplier’s control over its customers. This also makes downstream customers more prone to engaging in opportunistic behavior. This study uses market share6 to measure a supplier’s market dominance and divides the sample into high market dominance and low market dominance groups based on the median market share for each year. The Herfindahl-Hirschman Index (HHI)7 is utilized to measure industry competition intensity, and the sample is divided into low competition intensity and high competition intensity groups based on the median HHI for each year. The grouped regression results are shown in Table 5. Compared to suppliers with high market dominance, government subsidies more significantly promote digital transformation in suppliers with low market dominance. Similarly, compared to industries with low competition intensity, government subsidies more significantly promote digital transformation in suppliers within highly competitive industries. Therefore, for suppliers facing higher opportunistic risk, the effect of government subsidies is more pronounced.
4.5.2. Systemic Risk
The sudden outbreak of the U.S.-China trade war provides an opportunity to study the heterogeneity of the impact of government subsidies on supplier digital transformation under different levels of systemic risk. In March 2018, the United States announced the first list of tariffs on Chinese imports, marking the beginning of the U.S.-China trade war. Due to its long duration and wide scope, this event increased the uncertainty of the business environment faced by enterprises and destabilized commercial relationships within the supply chain. Therefore, the period before 2018 is classified as the low systemic risk sample, while the period from 2018 onwards is classified as the high systemic risk sample. The grouped regression results are shown in Table 6. When suppliers face lower systemic risk, government subsidies significantly promote their digital transformation. However, when suppliers face higher systemic risk, the effect of government subsidies is not as pronounced. In a high systemic risk environment, suppliers not only deal with their own operational pressures but also face multiple challenges such as supply chain disruptions, raw material shortages, and shrinking market demand. Government subsidies alone are insufficient to fully offset these impacts.
4.5.3. Human Capital
This study measures the level of human capital in suppliers by the proportion of employees with a bachelor’s degree or higher to the total number of employees. Based on the median human capital level for each year, the sample is divided into low human capital and high human capital groups. The grouped regression results are shown in columns (1) to (4) of Table 7. When the level of human capital in suppliers is high, customer digital transformation significantly promotes supplier digital transformation. Conversely, when the level of human capital in suppliers is low, customer digital transformation does not significantly promote supplier digital transformation. These results collectively indicate that customer digital transformation generates more significant spillover effects for suppliers with higher human capital.
4.5.4. Digital Divide
OECD defines the digital divide as the significant gap in access to information and communication technologies and the use of the internet among individuals, businesses, and geographic regions across different socio-economic levels. Based on this concept, the digital divide in this study specifically refers to the gap in digital transformation levels between upstream and downstream enterprises in the supply chain. This study measures the size of the digital divide by the absolute difference in digital transformation levels between suppliers and customers. Based on the median digital divide for each year, the sample is divided into low digital divide and high digital divide groups. The grouped regression results are shown in columns (5) to (8) of Table 7. When the digital divide is large, customer digital transformation does not significantly promote supplier digital transformation. Conversely, when the digital divide is small, customer digital transformation significantly promotes supplier digital transformation. These results collectively indicate that customer digital transformation generates more significant spillover effects for suppliers with a smaller digital divide.
4.6. Further Analysis: Externalities of Government Subsidies
Each customer corresponds to multiple suppliers, and each local government, in order to compete for the customer and make the customer purchase from its own jurisdiction, would indirectly influence the downstream customer’s business decision-making behavior through subsidies to local suppliers, so this study mainly focuses on the degree of supplier concentration and the degree of supplier localization8. The dataset is constructed in the format: “Customer-Year-Supplier-Whether Customer and Supplier Are in the Same City- Proportion of customer’s purchases from the supplier to its total annual purchases-Government Subsidies Received by the Supplier”. Using “Customer-Year-Whether Customer and Supplier Are in the Same City” as the grouping variable, government subsidies received by suppliers are weighted by the percentage of purchases within each group and then divided by the sum of the percentage of purchases to obtain the subsidy intensity per unit of purchase. This standardized indicator allows for cross-regional comparisons. Following these steps, a final sample of 1,355 observations was obtained. The subsidy intensity received by upstream suppliers located in the same city as the customer is denoted as , and the subsidy intensity received by upstream suppliers located in different cities from the customer is denoted as . Regression equations for and with and are established respectively, with relevant control variables included, as shown below. The complete regression results can be found in Appendix 9.
Columns (1) and (2) of Table 8 report the effect of the intensity of government subsidies received by upstream suppliers on the degree of supplier localization of customers. The regression coefficients for are significantly positive at the 1% level, while the regression coefficients for are significantly negative at least at the 5% level. This indicates that increasing the subsidy intensity for upstream suppliers located in the same city as the customer can enhance the degree of supplier localization of customers. Conversely, increasing the subsidy intensity for upstream suppliers located in different cities from the customer can reduce the degree of supplier localization of customers. This implies that local governments within and outside the jurisdiction engage in subsidy competition around customers. By adjusting the intensity of subsidy policies, local governments influence the cross-regional cooperation between customers and suppliers.
Columns (3) and (4) of Table 8 report the effect of the intensity of government subsidies received by upstream suppliers on the supplier concentration of downstream customers. The regression coefficients for and are all significantly negative at the 1% level. This indicates that increasing the intensity of upstream supplier subsidies reduces the supplier concentration of customers, regardless of whether the suppliers and customers are in the same city. Therefore, government subsidies optimize the customer’s supply chain structure by stimulating competition among upstream suppliers, enabling customers to choose partners from a more diversified group of suppliers. Lower supplier concentration not only improves customers bargaining power in the supply chain but also reduces potential supply risks and enhances their resilience to market volatility.
Combining the results of the above analyses, it can be concluded that local government subsidies to upstream suppliers lead to an increase in supplier localization for local customers, while reducing supplier concentration for local customers. This results in supplier diversification within the region, thereby hindering cross-regional spillover effects.
5. Conclusions
The 14th Five-Year Plan for the Development of the Digital Economy lists “adherence to application-led, data-enabled” as a basic principle, emphasizing the advantages of massive data resources, vast market space, and rich application scenarios, while making full use of market demand to guide the digital transformation of enterprises. For suppliers, market demand is directly reflected in customer demand, and the goal of government subsidies is accordingly focused on promoting the diversification of suppliers’ downstream customers. However, the production linkages between upstream and downstream enterprises mean that transformation outcomes will spread along the supply chain. To ensure that spillover effects occur locally, local governments often compete to attract or retain customers, thereby reducing the level of digital synergy within the supply chain. Based on the above analytical framework, this paper empirically examines the impact of government subsidies on supplier digital transformation and its underlying mechanisms.
The findings indicate that government subsidies positively facilitate supplier digital transformation by promoting local suppliers to expand a diversified downstream customer base. Customer digital transformation also promotes supplier digital transformation, but the spillover effect within the same region is higher than that across regions. The higher the opportunistic risk, the more pronounced the role that government subsidies can play, while the higher the systemic risk, the more limited their role becomes. Additionally, the higher the human capital of suppliers and the smaller the digital divide between suppliers and customers, the more effective suppliers are in receiving innovation diffusion. These findings provide key policy insights for local governments to utilize subsidies to drive supplier digital transformation.
1. Promoting Diversification of Suppliers’ Downstream Customers
To promote the diversification of suppliers’ downstream customers more effectively, local governments can establish innovation funds to support cooperative R&D projects between suppliers and scientific research institutes, universities, and other enterprises. This will foster the development of new products and services and expand market applications. Market research activities, supported by government or industry associations, can help suppliers understand market dynamics and competitive environments, enabling them to develop effective market entry strategies. Additionally, diverse marketing subsidies can increase corporate brand visibility and market presence. Special emphasis should be placed on digital marketing training and implementing social media strategies, such as search engine optimization, content marketing, and data-driven advertising.
2. Enhancing Cross-Regional Supply Chain Synergy
Given that spillover effects within the same region are higher than those across regions, local governments should consider the synergistic benefits of upstream and downstream supply chains when formulating subsidy policies. A cross-regional supply chain data-sharing platform can ensure seamless access to critical data, aiding coordinated decision-making across regions. Governments can also exchange best practices in policy-making and digital transformation through this platform to avoid redundant investments and enhance policy effectiveness. Furthermore, a cross-regional coordination committee should be established to oversee unified subsidy strategies, resource sharing, and issue resolution, ensuring alignment with broader strategic goals.
3. Tailoring Support Based on Market Dynamics and Risks
The effectiveness of government subsidies is influenced by the market dominance of enterprises, industry competition levels, and systemic risks. Therefore, more direct financial support and technical assistance should be provided to enterprises with low market dominance and high industry competition to enhance their market competitiveness. To mitigate the risk of opportunism, an independent third-party organization should oversee the use of subsidy funds, ensuring compliance with objectives and requirements. To address widespread systemic risk events, a risk-sharing mechanism between local and central governments, such as a risk fund, should be established. To enhance suppliers’ capacity for innovation diffusion, the government can provide special financial subsidies for collaboration with vocational colleges and technical training institutes to develop customized training courses in digital technology, data analytics, and emerging technologies. To reduce the digital divide, the government can lead or fund the creation of industry-shared digital technology platforms, promote standardized data interfaces and open APIs, and offer inclusive services such as data storage, processing, and analysis. This will enable suppliers of all sizes to access and utilize shared data equally, thereby upgrading the digital transformation of the entire supply chain.
Author Contributions
Conceptualization, X.-L. H. and X.-Y. C.; methodology, X.-L. H.; formal analysis, X.-L. H. and X.-Y. C.; investigation, X.-L. H. and X.-Y. C.; data curation, X.-L. H.; writing—original draft preparation, X.-L. H. and X.-Y. C.; writing—review and editing, X.-L. H., X.-Y. C. and F.-T. W.; visualization, X.-L. H. All authors have read and agreed to the published version of the manuscript.
Funding
This research received no external funding.
Institutional Review Board Statement
Not applicable.
Informed Consent Statement
Not applicable.
Data Availability Statement
Data is available from authors upon reasonable request.
Acknowledgments
We would like to thank the anonymous reviewers for their careful reading of our manuscript and their many helpful comments and suggestions.
Conflicts of Interest
The authors declare no conflict of interest.
Appendix A. Replacement of Dependent Variable
| (1) | (2) | (3) | ||||
| (①) | (②) | (③) | ||||
| (①) | 0.188*** | (3.88) | ||||
| (②) | 0.033*** | (3.57) | ||||
| (③) | 0.055** | (2.17) | ||||
| Subsidy | 0.019*** | (3.65) | 0.248*** | (3.33) | 0.007* | (1.85) |
| Age | -0.015* | (-1.79) | -0.014 | (-0.07) | -0.018** | (-1.98) |
| Size | 0.184*** | (5.73) | 1.534** | (2.41) | 0.172*** | (7.73) |
| Soe | 0.291*** | (3.56) | 4.341** | (2.51) | 0.081 | (0.91) |
| TobinQ | -0.013 | (-0.51) | 2.711* | (1.77) | 0.038** | (2.15) |
| Roa | 1.312*** | (3.24) | -14.121 | (-0.91) | 0.806*** | (3.09) |
| Grow | 0.063** | (2.46) | 0.644 | (0.96) | 0.019 | (0.51) |
| FC | 0.008 | (0.16) | 1.131** | (1.98) | 0.009 | (0.42) |
| Indrate | 1.016** | (2.06) | 12.851* | (1.78) | -0.161 | (-0.59) |
| Own | 0.117** | (2.33) | 2.970*** | (2.70) | -0.045 | (-0.76) |
| Constant | -0.565 | (-1.18) | -24.766** | (-2.20) | -0.572* | (-1.84) |
| Observations | 2,197 | 2,197 | 2,197 | |||
| City FE | YES | YES | YES | |||
| Year FE | YES | YES | YES | |||
| Industry FE | YES | YES | YES | |||
| Adj. R-squared | 0.375 | 0.221 | 0.289 | |||
Appendix B. Controlling for Reverse Causation
| (1) | (2) | (3) | (4) | (5) | (6) | |
|
(Method1) |
(Method2) |
(Method1) |
(Method2) |
(Method1) |
(Method2) |
|
| (Method1) | 0.409*** | 0.412*** | 0.413*** | |||
| (4.58) | (4.56) | (4.60) | ||||
| (Method2) | 0.505** | 0.501** | 0.500** | |||
| (2.01) | (1.99) | (1.99) | ||||
| L.Subsidy | 0.010** | 0.008** | ||||
| (2.50) | (2.60) | |||||
| IV.Subsidy | 0.012*** | 0.013*** | ||||
| (2.70) | (2.67) | |||||
| Subsidy (Heckman) | 0.012*** | 0.011*** | ||||
| (3.46) | (3.24) | |||||
| Imr (inverse Mills ratio) | -1.280** | -0.515 | ||||
| (-2.11) | (-1.03) | |||||
| Age | -0.001 | -0.011 | -0.001 | -0.011 | 0.012 | -0.006 |
| (-0.13) | (-1.29) | (-0.06) | (-1.23) | (1.16) | (-0.55) | |
| Size | 0.110*** | 0.069** | 0.110*** | 0.067*** | 0.041 | 0.041 |
| (3.05) | (2.55) | (3.28) | (2.61) | (1.02) | (1.17) | |
| Soe | 0.192** | 0.172** | 0.192** | 0.170** | 0.050 | 0.114 |
| (2.36) | (2.16) | (2.40) | (2.17) | (0.51) | (1.47) | |
| TobinQ | 0.047* | 0.127** | 0.049** | 0.129** | 0.058** | 0.133** |
| (1.88) | (2.06) | (1.99) | (2.09) | (2.33) | (2.17) | |
| Roa | 0.869** | -1.126 | 0.864** | -1.140 | 0.586 | -1.247* |
| (2.49) | (-1.60) | (2.46) | (-1.63) | (1.65) | (-1.78) | |
| Grow | -0.000 | -0.021 | -0.009 | -0.028 | 0.019 | -0.017 |
| (-0.01) | (-0.96) | (-0.40) | (-1.30) | (0.77) | (-0.66) | |
| FC | 0.003 | 0.026 | 0.002 | 0.024 | -0.029 | 0.012 |
| (0.11) | (0.97) | (0.07) | (0.88) | (-0.90) | (0.48) | |
| Indrate | 0.748* | 0.293 | 0.716* | 0.246 | -0.168 | -0.094 |
| (1.83) | (0.93) | (1.81) | (0.77) | (-0.31) | (-0.19) | |
| Own | 0.119** | 0.048 | 0.121** | 0.050 | 0.143*** | 0.059 |
| (2.45) | (0.99) | (2.50) | (1.05) | (2.68) | (1.24) | |
| Constant | -1.096** | -0.592 | 0.681 | 0.113 | ||
| (-2.03) | (-1.23) | (0.76) | (0.14) | |||
| Observations | 2,197 | 2,197 | 2,197 | 2,197 | 2,195 | 2,195 |
| Region FE | YES | YES | YES | YES | YES | YES |
| Year FE | YES | YES | YES | YES | YES | YES |
| Industry FE | YES | YES | YES | YES | YES | YES |
| Kleibergen-Paap rk LM statistic | 80.515*** | 80.245*** | ||||
| Kleibergen-Paap rk Wald F statistic | 8834.100 | 8615.792 | ||||
| Adj. R-squared | 0.347 | 0.112 | 0.0349 | 0.0066 | 0.350 | 0.114 |
Appendix C. Omitted Variable Issue
| (1) | (2) | (3) | (4) | |||||
| (Method1) | (Method1) | (Method1) | (Method2) | |||||
| (Method1) | 0.412*** | (4.28) | 0.440*** | (4.57) | ||||
| (Method2) | 0.501** | (2.04) | 0.499** | (2.05) | ||||
| Subsidy | 0.011*** | (3.09) | 0.011*** | (2.99) | 0.017*** | (4.10) | 0.016*** | (2.69) |
| Age | -0.005 | (-0.55) | -0.012 | (-1.38) | -0.002 | (-0.20) | -0.014 | (-1.25) |
| Size | 0.113*** | (3.05) | 0.067** | (2.43) | 0.098* | (1.89) | 0.088** | (2.09) |
| Soe | 0.188** | (2.39) | 0.151* | (1.86) | 0.189** | (2.18) | 0.160 | (1.48) |
| TobinQ | 0.048* | (1.94) | 0.124* | (1.92) | 0.034 | (1.07) | 0.148 | (1.60) |
| Roa | 0.913*** | (2.69) | -1.079 | (-1.50) | 1.226*** | (2.66) | -1.153 | (-1.40) |
| Grow | 0.014 | (0.58) | -0.018 | (-0.89) | 0.064* | (1.79) | 0.019 | (0.53) |
| FC | 0.004 | (0.13) | 0.023 | (0.91) | 0.613 | (1.13) | 0.884 | (1.51) |
| Indrate | 0.623 | (1.54) | 0.178 | (0.58) | 0.528 | (1.18) | -0.042 | (-0.09) |
| Own | 0.114** | (2.52) | 0.047 | (0.95) | 0.136*** | (2.62) | 0.040 | (0.69) |
| Idnc | 0.061 | (0.89) | -0.015 | (-0.25) | 0.113 | (1.42) | 0.021 | (0.30) |
| Inpro | -0.001*** | (-2.88) | -0.001** | (-2.58) | -0.001*** | (-2.69) | -0.001** | (-2.09) |
| Bankhold | -0.008 | (-0.12) | -0.089 | (-1.51) | -0.034 | (-0.44) | -0.123 | (-1.47) |
| Ocm | -0.006 | (-0.08) | -0.024 | (-0.46) | 0.042 | (0.48) | -0.062 | (-1.00) |
| Constant | -0.960** | (-2.08) | -0.336 | (-0.67) | -0.337 | (-0.66) | 0.450 | (0.76) |
| Observations | 2,080 | 2,080 | 1,943 | 1,943 | ||||
| Region FE | YES | YES | YES | YES | ||||
| Year FE | YES | YES | YES | YES | ||||
| Industry FE | YES | YES | YES | YES | ||||
| Industry×Year | YES | YES | ||||||
| Region×Year | YES | YES | ||||||
| Adj. R-squared | 0.346 | 0.110 | 0.342 | 0.005 | ||||
Appendix D. Excluding the Influence of Central Policies
| (1) | (2) | (3) | (4) | |||||
| (Method1) | (Method1) | (Method2) | (Method2) | |||||
| (Method1) | 0.441*** | (4.96) | 0.415*** | (4.62) | ||||
| (Method2) | 0.534** | (2.05) | 0.660* | (1.72) | ||||
| Subsidy | 0.012*** | (3.38) | 0.011*** | (3.20) | 0.012*** | (3.23) | 0.011*** | (2.64) |
| Age | -0.002 | (-0.25) | -0.012 | (-1.26) | -0.003 | (-0.39) | -0.015* | (-1.81) |
| Size | 0.110*** | (3.24) | 0.071*** | (2.70) | 0.083*** | (2.90) | 0.050** | (2.44) |
| Soe | 0.190** | (2.36) | 0.178** | (2.23) | 0.180** | (2.20) | 0.145** | (2.28) |
| TobinQ | 0.051** | (2.08) | 0.134** | (2.17) | 0.045* | (1.95) | 0.063*** | (2.79) |
| Roa | 0.878** | (2.54) | -1.089 | (-1.57) | 1.320*** | (3.31) | -0.288 | (-0.70) |
| Grow | -0.012 | (-0.56) | -0.027 | (-1.29) | -0.018 | (-0.72) | -0.046** | (-2.41) |
| FC | -0.004 | (-0.14) | 0.022 | (0.86) | -0.029 | (-0.94) | -0.011 | (-0.76) |
| Indrate | 0.825** | (2.07) | 0.285 | (0.89) | 0.556 | (1.22) | -0.074 | (-0.22) |
| Own | 0.126*** | (2.66) | 0.049 | (0.96) | 0.102* | (1.86) | 0.066 | (1.07) |
| Constant | -1.149** | (-2.20) | -0.643 | (-1.36) | -0.919** | (-2.04) | -0.253 | (-0.82) |
| Observations | 2,148 | 2,148 | 1,838 | 1,838 | ||||
| Region FE | YES | YES | YES | YES | ||||
| Year FE | YES | YES | YES | YES | ||||
| Industry FE | YES | YES | YES | YES | ||||
| Adj. R-squared | 0.352 | 0.118 | 0.344 | 0.135 | ||||
Appendix E. Propensity Score Matching and Placebo Tests
Appendix F. Annual Report Information Disclosure Issues
| (1) | (2) | (3) | (4) | (5) | (6) | |
|
(Method1) |
(Method2) |
(Method1) |
(Method2) |
(Method1) |
(Method2) |
|
| (Method1) | 0.357*** | 0.417*** | 0.423*** | |||
| (3.61) | (4.68) | (4.71) | ||||
| (Method2) | 0.669* | 0.512* | 0.509** | |||
| (1.81) | (1.82) | (2.03) | ||||
| Subsidy | 0.016*** | 0.016** | 0.012*** | 0.012*** | 0.012*** | 0.011*** |
| (3.19) | (2.41) | (3.41) | (3.33) | (3.34) | (3.26) | |
| Age | -0.004 | -0.019** | 0.001 | -0.011 | 0.000 | -0.010 |
| (-0.62) | (-2.08) | (0.07) | (-1.22) | (0.05) | (-1.18) | |
| Size | 0.102** | 0.112*** | 0.107*** | 0.072*** | 0.109*** | 0.068*** |
| (2.34) | (2.72) | (3.05) | (2.70) | (3.15) | (2.67) | |
| Soe | 0.227*** | 0.139 | 0.190** | 0.185** | 0.190** | 0.182** |
| (3.19) | (1.58) | (2.29) | (2.33) | (2.36) | (2.30) | |
| TobinQ | 0.068** | 0.177* | 0.053** | 0.127** | 0.055** | 0.133** |
| (2.33) | (1.67) | (2.14) | (2.00) | (2.37) | (2.13) | |
| Roa | 0.864** | -0.614 | 0.818** | -1.258 | 0.858** | -1.275 |
| (2.30) | (-0.86) | (2.16) | (-1.63) | (2.27) | (-1.61) | |
| Grow | 0.002 | 0.044 | 0.002 | -0.028 | -0.010 | -0.028 |
| (0.04) | (1.02) | (0.07) | (-1.20) | (-0.44) | (-1.31) | |
| FC | 0.322 | 0.954 | 0.006 | 0.022 | 0.003 | 0.022 |
| (0.67) | (1.56) | (0.22) | (0.79) | (0.09) | (0.86) | |
| Indrate | 0.374 | -0.128 | 0.678* | 0.218 | 0.728* | 0.277 |
| (0.76) | (-0.26) | (1.66) | (0.68) | (1.78) | (0.88) | |
| Own | 0.104** | 0.019 | 0.122** | 0.050 | 0.122** | 0.050 |
| (2.09) | (0.36) | (2.55) | (1.02) | (2.54) | (1.01) | |
| Constant | -0.732 | 0.134 | -1.101** | -0.642 | -1.141** | -0.643 |
| (-1.54) | (0.26) | (-2.07) | (-1.36) | (-2.16) | (-1.38) | |
| Observations | 1,239 | 1,239 | 2,158 | 2,158 | 2,344 | 2,344 |
| Region FE | YES | YES | YES | YES | YES | YES |
| Year FE | YES | YES | YES | YES | YES | YES |
| Industry FE | YES | YES | YES | YES | YES | YES |
| Adj. R-squared | 0.309 | 0.121 | 0.348 | 0.113 | 0.349 | 0.119 |
Note: Columns (1) and (2) are the results of excluding high‐tech enterprises, columns (3) and (4) are the results of excluding enterprises penalized by the CSRC or stock exchanges, and columns (5) and (6) are the results of excluding enterprises whose disclosure appraisal results are judged to be unqualified.
Appendix G. Mechanism Test
| (1) | (2) | (3) | (4) | (5) | (6) | |
|
(Method 1) |
(Method 2) |
(Method 1) |
(Method 2) |
|||
| Subsidy | -0.145* | 0.011*** | 0.011*** | -0.034* | 0.012*** | 0.011*** |
| (-1.95) | (3.33) | (3.21) | (-1.95) | (3.45) | (3.30) | |
| (Method1) | 0.509** | 0.681*** | ||||
| (2.02) | (2.77) | |||||
| (Method1) | 0.417*** | 0.385*** | ||||
| (6.10) | (5.64) | |||||
| (Method2) | 1.996*** | 2.426*** | ||||
| (5.93) | (6.33) | |||||
| (Method2) | 0.504* | 0.417 | ||||
| (1.73) | (1.55) | |||||
| -0.443*** | -0.356** | |||||
| (-2.64) | (-2.09) | |||||
| -1.616*** | -0.805* | |||||
| (-2.96) | (-1.77) | |||||
| Age | -0.334** | -0.002 | -0.012 | -0.024 | -0.001 | -0.011 |
| (-2.02) | (-0.23) | (-1.44) | (-0.60) | (-0.10) | (-1.32) | |
| Size | -5.356*** | 0.086*** | 0.048** | -0.121 | 0.105*** | 0.066*** |
| (-8.00) | (2.62) | (2.11) | (-0.66) | (3.18) | (2.64) | |
| Soe | -3.993** | 0.172** | 0.152** | 0.222 | 0.189** | 0.167** |
| (-2.40) | (2.35) | (2.09) | (0.51) | (2.45) | (2.21) | |
| TobinQ | 1.412*** | 0.054** | 0.133** | -0.085 | 0.046* | 0.127** |
| (3.53) | (2.14) | (2.08) | (-0.91) | (1.96) | (2.06) | |
| Roa | -9.296 | 0.822** | -1.169 | -0.072 | 0.837** | -1.141 |
| (-1.19) | (2.47) | (-1.65) | (-0.04) | (2.51) | (-1.64) | |
| Grow | 1.372** | -0.004 | -0.024 | 0.181 | -0.006 | -0.028 |
| (2.05) | (-0.16) | (-1.11) | (1.55) | (-0.26) | (-1.31) | |
| FC | 0.331 | 0.003 | 0.026 | 0.279*** | 0.005 | 0.027 |
| (0.32) | (0.09) | (0.85) | (2.77) | (0.18) | (0.94) | |
| Indrate | -5.098 | 0.699* | 0.241 | -2.889** | 0.680* | 0.236 |
| (-0.64) | (1.70) | (0.76) | (-2.26) | (1.67) | (0.75) | |
| Own | -0.740 | 0.116** | 0.044 | -0.196 | 0.116** | 0.046 |
| (-0.65) | (2.42) | (0.91) | (-0.69) | (2.41) | (0.95) | |
| Constant | 89.328*** | -0.725 | -0.287 | 4.118*** | -1.032** | -0.563 |
| (11.02) | (-1.61) | (-0.76) | (2.98) | (-2.17) | (-1.29) | |
| Observations | 2,197 | 2,197 | 2,197 | 2,197 | 2,197 | 2,197 |
| Region FE | YES | YES | YES | YES | YES | YES |
| Year FE | YES | YES | YES | YES | YES | YES |
| Industry FE | YES | YES | YES | YES | YES | YES |
| Adj. R-squared | 0.303 | 0.354 | 0.119 | 0.0493 | 0.352 | 0.116 |
Appendix H. Heterogeneity Analysis
| High or low market dominance | ||||||||
| High | Low | High | Low | |||||
| (1) | (2) | (3) | (4) | |||||
| (Method1) | (Method1) | (Method2) | (Method2) | |||||
| Subsidy | 0.003 | (0.61) | 0.018*** | (2.93) | 0.004 | (0.78) | 0.022** | (2.50) |
| (Method1) | 0.713*** | (7.01) | 0.289*** | (3.27) | ||||
| (Method2) | -0.007 | (-0.03) | 0.708** | (2.09) | ||||
| Age | 0.019* | (1.89) | -0.016 | (-1.64) | -0.019 | (-1.36) | -0.002 | (-0.20) |
| Size | 0.088** | (2.23) | 0.091** | (2.19) | 0.016 | (0.51) | 0.114** | (2.37) |
| Soe | 0.215* | (1.81) | 0.171* | (1.71) | 0.066 | (0.67) | 0.220** | (2.10) |
| TobinQ | 0.168*** | (3.54) | 0.017 | (0.63) | 0.149** | (2.09) | 0.116* | (1.85) |
| Roa | 0.561 | (0.83) | 0.911** | (2.34) | -0.242 | (-0.42) | -1.134 | (-1.31) |
| Grow | -0.001 | (-0.01) | 0.003 | (0.09) | 0.018 | (0.75) | -0.062 | (-1.62) |
| FC | 0.005 | (0.18) | 0.806 | (0.98) | 0.038** | (2.03) | 1.611* | (1.95) |
| Indrate | 0.483 | (1.17) | 0.825 | (0.96) | -0.222 | (-0.55) | 0.648 | (1.04) |
| Own | 0.207** | (2.15) | 0.029 | (0.47) | 0.043 | (0.44) | 0.048 | (0.80) |
| Constant | -1.471*** | (-2.63) | 0.203 | (0.22) | 0.280 | (0.56) | 0.195 | (0.25) |
| Observations | 1,098 | 1,094 | 1,098 | 1,094 | ||||
| Region FE | YES | YES | YES | YES | ||||
| Year FE | YES | YES | YES | YES | ||||
| Industry FE | YES | YES | YES | YES | ||||
| Adj. R-squared | 0.429 | 0.318 | 0.181 | 0.111 | ||||
| High or low market competition | ||||||||
| Low | High | Low | High | |||||
| (5) | (6) | (7) | (8) | |||||
| (Method1) | (Method1) | (Method2) | (Method2) | |||||
| Subsidy | 0.007 | (1.56) | 0.010*** | (2.72) | 0.004 | (1.24) | 0.013* | (1.88) |
| (Method1) | 0.373** | (2.53) | 0.333*** | (4.18) | ||||
| (Method2) | 0.149 | (0.58) | 0.940* | (1.78) | ||||
| Age | -0.001 | (-0.16) | -0.004 | (-0.33) | -0.007 | (-1.49) | -0.017 | (-1.39) |
| Size | 0.121** | (2.23) | 0.087* | (1.92) | 0.066* | (1.78) | 0.048 | (1.21) |
| Soe | 0.229** | (2.52) | 0.067 | (0.65) | 0.145* | (1.89) | 0.072 | (0.49) |
| TobinQ | 0.077* | (1.86) | 0.039 | (0.89) | 0.133*** | (3.21) | 0.141 | (1.26) |
| Roa | 0.854** | (2.21) | 0.417 | (0.91) | 0.091 | (0.26) | -3.536** | (-2.23) |
| Grow | -0.056* | (-1.67) | -0.004 | (-0.11) | -0.007 | (-0.27) | -0.012 | (-0.34) |
| FC | -0.133 | (-0.99) | -0.019 | (-0.54) | 0.017 | (0.26) | -0.009 | (-0.21) |
| Indrate | -0.319 | (-0.99) | 1.411** | (2.54) | -0.442 | (-1.56) | 0.738 | (1.28) |
| Own | 0.152 | (1.58) | 0.039 | (0.54) | 0.045 | (1.30) | 0.057 | (0.93) |
| Constant | -1.171** | (-2.25) | -0.696 | (-1.09) | -0.445 | (-1.36) | -0.265 | (-0.39) |
| Observations | 1,093 | 1,104 | 1,093 | 1,104 | ||||
| Region FE | YES | YES | YES | YES | ||||
| Year FE | YES | YES | YES | YES | ||||
| Industry FE | YES | YES | YES | YES | ||||
| Adj. R-squared | 0.312 | 0.435 | 0.127 | 0.163 | ||||
| (1) | (2) | (3) | (4) | |||||
| Year2018 | Year2018 | Year2018 | Year2018 | |||||
| (Method1) | (Method1) | (Method2) | (Method2) | |||||
| Subsidy | 0.011*** | (3.13) | 0.013 | (1.51) | 0.012*** | (2.71) | 0.003 | (0.15) |
| (Method1) | 0.425*** | (4.74) | 0.366** | (2.05) | ||||
| (Method2) | 0.707* | (1.86) | 0.010 | (0.03) | ||||
| Age | -0.001 | (-0.11) | 0.015 | (0.77) | -0.013 | (-1.53) | 0.010 | (0.43) |
| Size | 0.083*** | (2.85) | 0.391*** | (3.29) | 0.054** | (2.60) | 0.307** | (2.54) |
| Soe | 0.190** | (2.36) | 0.010 | (0.05) | 0.136** | (2.15) | -0.039 | (-0.11) |
| TobinQ | 0.040* | (1.82) | -0.017 | (-0.22) | 0.060*** | (2.71) | 0.584 | (1.56) |
| Roa | 1.460*** | (3.44) | 0.127 | (0.14) | -0.096 | (-0.26) | -2.504 | (-1.56) |
| Grow | -0.024 | (-1.00) | 0.134 | (0.63) | -0.048** | (-2.57) | 0.106 | (0.52) |
| FC | -0.032 | (-0.97) | 6.314*** | (4.17) | -0.013 | (-0.82) | 5.235*** | (3.37) |
| Indrate | 0.576 | (1.21) | 1.208 | (1.54) | -0.203 | (-0.57) | 1.968* | (1.92) |
| Own | 0.107* | (1.92) | 0.058 | (0.41) | 0.077 | (1.23) | -0.189 | (-0.86) |
| Constant | -0.987** | (-2.26) | 3.470* | (1.97) | -0.280 | (-0.92) | 1.841 | (1.07) |
| Observations | 1,753 | 434 | 1,753 | 434 | ||||
| Region FE | YES | YES | YES | YES | ||||
| Year FE | YES | YES | YES | YES | ||||
| Industry FE | YES | YES | YES | YES | ||||
| Adj. R-squared | 0.350 | 0.355 | 0.143 | 0.151 | ||||
| Level of human capital | ||||||||
| High | Low | High | Low | |||||
| (1) | (2) | (3) | (4) | |||||
| (Method1) | (Method1) | (Method2) | (Method2) | |||||
| Subsidy | 0.008* | (1.76) | 0.006 | (1.18) | 0.012*** | (3.11) | 0.001 | (0.34) |
| (Method1) | 0.434*** | (4.54) | 0.210 | (1.56) | ||||
| (Method2) | 0.828** | (2.02) | 0.105 | (0.52) | ||||
| Age | -0.002 | (-0.14) | -0.002 | (-0.22) | -0.021 | (-1.39) | 0.001 | (0.30) |
| Size | 0.175*** | (2.91) | 0.077* | (1.76) | 0.143*** | (3.77) | 0.048 | (1.64) |
| Soe | 0.333*** | (2.75) | 0.158* | (1.69) | 0.350*** | (2.68) | 0.028 | (0.39) |
| TobinQ | 0.070*** | (2.65) | 0.028 | (0.86) | 0.229*** | (2.64) | 0.027* | (1.70) |
| Roa | 1.445*** | (3.31) | 0.349 | (0.73) | -3.666*** | (-2.70) | 0.161 | (0.68) |
| Grow | 0.007 | (0.22) | -0.042 | (-1.17) | 0.007 | (0.20) | -0.021 | (-0.96) |
| FC | 0.038 | (1.19) | -0.078 | (-0.50) | 0.027 | (1.07) | 0.019 | (0.31) |
| Indrate | 0.760 | (1.55) | 0.463 | (0.98) | 0.650 | (1.53) | -0.186 | (-0.69) |
| Own | 0.101 | (1.25) | 0.140** | (2.04) | 0.025 | (0.22) | 0.032 | (0.74) |
| Constant | -1.587** | (-2.26) | -0.874* | (-1.78) | -1.345** | (-2.07) | -0.199 | (-0.67) |
| Observations | 1,118 | 1,070 | 1,118 | 1,070 | ||||
| Region FE | YES | YES | YES | YES | ||||
| Year FE | YES | YES | YES | YES | ||||
| Industry FE | YES | YES | YES | YES | ||||
| Adj. R-squared | 0.425 | 0.237 | 0.184 | 0.0313 | ||||
| Size of digital divide | ||||||||
| Big | Small | Big | Small | |||||
| (5) | (6) | (7) | (8) | |||||
| (Method 1) | (Method 1) | (Method 2) | (Method 2) | |||||
| Subsidy | 0.010* | (1.81) | 0.002 | (1.02) | 0.019*** | (2.82) | -0.000 | (-0.61) |
| (Method1) | -0.038 | (-0.36) | 0.843*** | (11.58) | ||||
| (Method2) | -0.085 | (-0.34) | 0.743*** | (4.12) | ||||
| Age | 0.003 | (0.23) | 0.001 | (0.23) | -0.009 | (-0.65) | 0.000 | (0.14) |
| Size | 0.149*** | (3.14) | 0.014 | (1.17) | 0.113** | (2.49) | 0.004 | (0.77) |
| Soe | 0.194** | (2.13) | 0.007 | (0.29) | 0.389*** | (3.23) | 0.010 | (1.09) |
| TobinQ | 0.054** | (2.12) | -0.013 | (-0.96) | 0.233** | (2.28) | 0.003 | (0.84) |
| Roa | 0.965 | (1.30) | 0.124 | (1.09) | -3.166** | (-2.29) | -0.068 | (-1.15) |
| Grow | -0.043 | (-1.11) | 0.005 | (0.19) | 0.040 | (0.97) | -0.005 | (-1.37) |
| FC | 0.567 | (1.16) | -0.042** | (-2.04) | 0.170 | (0.64) | 0.006 | (1.01) |
| Indrate | 1.220* | (1.68) | 0.327* | (1.95) | 0.083 | (0.13) | 0.195** | (2.26) |
| Own | 0.133 | (1.56) | 0.005 | (0.25) | 0.027 | (0.33) | -0.005 | (-0.82) |
| Constant | -0.351 | (-0.60) | -0.211 | (-1.31) | -0.965* | (-1.69) | -0.025 | (-0.44) |
| Observations | 906 | 1,288 | 1,008 | 1,187 | ||||
| Region/Year/Industry FE | YES | YES | YES | YES | ||||
| Adj. R-squared | 0.515 | 0.452 | 0.193 | 0.378 | ||||
Appendix I. Impact of Government Subsidies Received by Suppliers on Customer Behavior
| (1) | (2) | (3) | (4) | |
| 0.540*** | 0.565*** | -2.528*** | -2.285*** | |
| (3.89) | (3.99) | (-3.95) | (-3.75) | |
| -0.127*** | -0.099*** | -1.289*** | -0.899*** | |
| (-3.10) | (-3.05) | (-5.55) | (-4.60) | |
| Age | 0.040 | 0.125 | ||
| (1.49) | (0.88) | |||
| Size | -0.429** | -7.412*** | ||
| (-2.29) | (-6.85) | |||
| Soe | 0.122 | -4.278* | ||
| (0.23) | (-1.94) | |||
| TobinQ | 0.034 | -0.715* | ||
| (0.32) | (-1.79) | |||
| Roa | 0.342 | 1.189 | ||
| (0.27) | (0.23) | |||
| Grow | -0.005 | 0.011 | ||
| (-1.32) | (0.62) | |||
| FC | 1.345 | -4.965 | ||
| (0.80) | (-0.52) | |||
| Indrate | -3.124* | -6.344 | ||
| (-1.95) | (-0.71) | |||
| Own | -0.157 | 0.717 | ||
| (-0.75) | (0.61) | |||
| Constant | 1.024*** | 5.857*** | 41.935*** | 100.388*** |
| (7.13) | (2.69) | (57.51) | (9.64) | |
| Observations | 1,355 | 1,355 | 1,355 | 1,355 |
| Region FE | YES | YES | YES | YES |
| Year FE | YES | YES | YES | YES |
| Industry FE | YES | YES | YES | YES |
| Adj. R-squared | 0.0897 | 0.105 | 0.202 | 0.295 |
| 1 | |
| 2 | For example, the technical subjects of artificial intelligence include “Convolutional neural network”, “Computer vision”, “Pattern perception”, “Reinforcement learning”, “Knowledge mapping”, “Natural language processing” and so on; The applications of artificial intelligence include “Medical automation diagnosis”, “Location-based services”, “Selective content distribution”, “Natural language translation” and so on. |
| 3 | When either the supplier or the customer is included in the pilot list, this record is eliminated from the sample. |
| 4 | When either the supplier or the customer is located in a pilot city, this record is eliminated from the sample. |
| 5 | The complete regression results are shown in Appendix 7. |
| 6 | Supplier market share is equal to the ratio of that supplier's sales revenue to the total sales revenue of all suppliers in the same industry. |
| 7 | The ratio of each supplier's sales revenue in the industry to the industry's total sales revenue is first calculated and then squared and totaled. |
| 8 | The supplier concentration of customer is measured by the proportion of purchases from the customer's top 5 suppliers for the year to the total annual purchases, and the supplier localization of customer is measured by the proportion of purchases from local listed companies among the customer's top 5 suppliers for the year to the total annual purchases. |
References
- Yang, Y.; Zhang, C.; Liu, B.; Huang, Y.; Tai, Y. Mystery of Special Government Subsidies: How Does Digital Transformation Promote Enterprise Innovation and Development? Econ. Anal. Policy 2024, 83, 1–16. [Google Scholar] [CrossRef]
- Li, S.; Gao, L.; Han, C.; Gupta, B.; Alhalabi, W.; Almakdi, S. Exploring the Effect of Digital Transformation on Firms’ Innovation Performance. J. Innov. Knowl. 2023, 8, 100317. [Google Scholar] [CrossRef]
- Liu, M.; Li, C.; Wang, S.; Li, Q. Digital Transformation, Risk-Taking, and Innovation: Evidence from Data on Listed Enterprises in China. J. Innov. Knowl. 2023, 8, 100332. [Google Scholar] [CrossRef]
- Garmaki, M.; Gharib, R.K.; Boughzala, I. Big Data Analytics Capability and Contribution to Firm Performance: The Mediating Effect of Organizational Learning on Firm Performance. Journal of Enterprise Information Management 2023, 36, 1161–1184. [Google Scholar] [CrossRef]
- Li, J.; Zhou, J.; Cheng, Y. Conceptual Method and Empirical Practice of Building Digital Capability of Industrial Enterprises in the Digital Age. IEEE Trans. Eng. Manage. 2022, 69, 1902–1916. [Google Scholar] [CrossRef]
- Cheng, Y.; Zhou, X.; Li, Y. The Effect of Digital Transformation on Real Economy Enterprises’ Total Factor Productivity. International Review of Economics & Finance 2023, 85, 488–501. [Google Scholar] [CrossRef]
- Wen, H.; Wen, C.; Lee, C.-C. Impact of Digitalization and Environmental Regulation on Total Factor Productivity. Inf. Econ. Policy 2022, 61, 101007. [Google Scholar] [CrossRef]
- Weisz, E.; Herold, D.M.; Kummer, S. Revisiting the Bullwhip Effect: How Can AI Smoothen the Bullwhip Phenomenon? Int. J. Logist. Manag. 2023, 34, 98–120. [Google Scholar] [CrossRef]
- Zhang, W.; Zhao, S.; Wan, X. Industrial Digital Transformation Strategies Based on Differential Games. Applied Mathematical Modelling 2021, 98, 90–108. [Google Scholar] [CrossRef]
- Zhao, X.; Zhao, L.; Sun, X.; Xing, Y. The Incentive Effect of Government Subsidies on the Digital Transformation of Manufacturing Enterprises. Int. J. Emerg. Mark. 2023. [CrossRef]
- Xu, Y.; Chen, Z.; Fan, R. Highly Skilled Foreign Labor Introduction Policies and Corporate Innovation: Evidence from a Natural Experiment in China. Econ. Anal. Policy 2023, 77, 137–156. [Google Scholar] [CrossRef]
- Haupt, A.; Krieger, T. The Role of Relocation Mobility in Tax and Subsidy Competition. Journal of Urban Economics 2020, 116, 103196. [Google Scholar] [CrossRef]
- Rodriguez-Pose, A.; Wilkie, C. Context and the Role of Policies to Attract Foreign R&D in Europe. Eur. Plan. Stud. 2016, 24, 2014–2035. [Google Scholar] [CrossRef]
- Li, X.; Liu, C.; Weng, X.; Zhou, L.-A. Target Setting in Tournaments: Theory and Evidence from China. The Economic Journal 2019, 129, 2888–2915. [Google Scholar] [CrossRef]
- Li, H.-B.; Zhou, L.-A. Political Turnover and Economic Performance: The Incentive Role of Personnel Control in China. Journal of Public Economics 2005, 89, 1743–1762. [Google Scholar] [CrossRef]
- Truant, E.; Broccardo, L.; Dana, L.-P. Digitalisation Boosts Company Performance: An Overview of Italian Listed Companies. Technological Forecasting and Social Change 2021, 173. [Google Scholar] [CrossRef]
- Cichosz, M.; Wallenburg, C.M.; Knemeyer, A.M. Digital Transformation at Logistics Service Providers: Barriers, Success Factors and Leading Practices. The International Journal of Logistics Management 2020, 31, 209–238. [Google Scholar] [CrossRef]
- Wernerfelt, B. A Resource-Based View of the Firm. Strategic Management Journal 1984, 5, 171–180. [Google Scholar] [CrossRef]
- Söderblom, A.; Samuelsson, M.; Wiklund, J.; Sandberg, R. Inside the Black Box of Outcome Additionality: Effects of Early-Stage Government Subsidies on Resource Accumulation and New Venture Performance. Research Policy 2015, 44, 1501–1512. [Google Scholar] [CrossRef]
- Yang, R.; Tang, W.; Zhang, J. Technology Improvement Strategy for Green Products under Competition: The Role of Government Subsidy. European Journal of Operational Research 2021, 289, 553–568. [Google Scholar] [CrossRef]
- Szücs, F.W. Research Subsidies, Industry–University Cooperation and Innovation. Research Policy 2018, 47, 1256–1266. [Google Scholar] [CrossRef]
- Feldman, M.P.; Kelley, M.R. The Ex-Ante Assessment of Knowledge Spillovers: Government R&D Policy, Economic Incentives and Private Firm Behavior. Research Policy 2006, 35, 1509–1521. [Google Scholar] [CrossRef]
- Miocevic, D.; Srhoj, S. How Do Governmental Wage Subsidies Enhance SME Resilience in the COVID-19 Pandemic? International Journal of Operations & Production Management 2023, 43, 183–204. [Google Scholar] [CrossRef]
- Dvouletý, O.; Srhoj, S.; Pantea, S. Public SME Grants and Firm Performance in European Union: A Systematic Review of Empirical Evidence. Small Business Economics 2020, 57, 243–263. [Google Scholar] [CrossRef]
- Bakhtiari, S.; Bruno, A. Government Commercialization Grants and Business Performance. Singapore Economic Review 2020, 65, 1271–1291. [Google Scholar] [CrossRef]
- Grg, H.; Henry, M.; Strobl, E. Grant Support and Exporting Activity. Review of Economics and Statistics 2007, 90, 168–174. [Google Scholar] [CrossRef]
- Back, Y.; Parboteeah, K.P.; Nam, D. Innovation in Emerging Markets: The Role of Management Consulting Firms. Journal of International Management 2014, 20, 390–405. [Google Scholar] [CrossRef]
- Ojala, A. Internationalization of Knowledge-Intensive SMEs: The Role of Network Relationships in the Entry to a Psychically Distant Market. International Business Review 2009, 18, 50–59. [Google Scholar] [CrossRef]
- Choi, J.; Lee, J. Repairing the R&D Market Failure: Public R&D Subsidy and the Composition of Private R&D. Research Policy 2017, 46, 1465–1478. [Google Scholar] [CrossRef]
- Hottenrott, H.; Lopes-Bento, C. (International) R&D Collaboration and SMEs: The Effectiveness of Targeted Public R&D Support Schemes. Research Policy 2014, 43, 1055–1066. [Google Scholar] [CrossRef]
- Sarmento, M.; Simões, C.; Farhangmehr, M. Applying a Relationship Marketing Perspective to B2B Trade Fairs: The Role of Socialization Episodes. Industrial Marketing Management 2015, 44, 131–141. [Google Scholar] [CrossRef]
- Kalafsky, R.V.; Gress, D.R. Trade Fairs as an Export Marketing and Research Strategy: Results from a Study of Korean Advanced Machinery Firms. Geographical Research 2013, 51, 304–317. [Google Scholar] [CrossRef]
- Schuldt, N.; Bathelt, H. International Trade Fairs and Global Buzz. Part II: Practices of Global Buzz. European Planning Studies 2011, 19, 1–22. [Google Scholar] [CrossRef]
- Ivanov, D.; Das, A.; Choi, T. New Flexibility Drivers for Manufacturing, Supply Chain and Service Operations. International Journal of Production Research 2018, 56, 3359–3368. [Google Scholar] [CrossRef]
- Copani, G.; Urgo, M. Innovative Flexibility-Oriented Business Models and System Configuration Approaches: An Industrial Application. Cirp Journal of Manufacturing Science and Technology 2015, 11, 10–17. [Google Scholar] [CrossRef]
- Dawid, H.; Pellegrino, G.; Vivarelli, M. The Role of Demand in Fostering Product vs Process Innovation: A Model and an Empirical Test. Journal of Evolutionary Economics 2020, 31, 1553–1572. [Google Scholar] [CrossRef]
- Ketokivi, M.; Schroeder, R. Manufacturing Practices, Strategic Fit and Performance: A Routine-Based View. International Journal of Operations & Production Management 2004, 24, 171–191. [Google Scholar] [CrossRef]
- Thomas, A. Convergence and Digital Fusion Lead to Competitive Differentiation. Business Process Management Journal 2019, 26, 707–720. [Google Scholar] [CrossRef]
- Liu, W.; Atuahene-Gima, K. Enhancing Product Innovation Performance in a Dysfunctional Competitive Environment: The Roles of Competitive Strategies and Market-Based Assets. Industrial Marketing Management 2018, 73, 7–20. [Google Scholar] [CrossRef]
- Akter, S.; Motamarri, S.; Hani, U.; Shams, R.; Fernando, M.; Mohiuddin Babu, M.; Ning Shen, K. Building Dynamic Service Analytics Capabilities for the Digital Marketplace. Journal of Business Research 2020, 118, 177–188. [Google Scholar] [CrossRef]
- Cohen, W.M.; Levinthal, D.A. Absorptive Capacity: A New Perspective on Learning and Innovation. Administrative science quarterly 1990, 35, 128–152. [Google Scholar] [CrossRef]
- Rogers, E.M. Diffusion of Innovations; 5th edition.; Free Press: New York London Toronto Sydney, 2003; ISBN 978-0-7432-2209-9. [Google Scholar]
- Abrell, T.; Pihlajamaa, M.; Kanto, L.; Vom Brocke, J.; Uebernickel, F. The Role of Users and Customers in Digital Innovation: Insights from B2B Manufacturing Firms. Information & Management 2016, 53, 324–335. [Google Scholar] [CrossRef]
- Dai, R.; Liang, H.; Ng, L. Socially Responsible Corporate Customers. Journal of Financial Economics 2021, 142, 598–626. [Google Scholar] [CrossRef]
- Chu, Y.; Tian, X.; Wang, W. Corporate Innovation Along the Supply Chain. Management Science 2019, 65, 2445–2466. [Google Scholar] [CrossRef]
- Baron, R.M.; Kenny, D.A. The Moderator-Mediator Variable Distinction in Social Psychological Research: Conceptual, Strategic, and Statistical Considerations. J Pers Soc Psychol 1986, 51, 1173–1182. [Google Scholar] [CrossRef]
- Verhoef, P.C.; Broekhuizen, T.; Bart, Y.; Bhattacharya, A.; Qi Dong, J.; Fabian, N.; Haenlein, M. Digital Transformation: A Multidisciplinary Reflection and Research Agenda. Journal of Business Research 2021, 122, 889–901. [Google Scholar] [CrossRef]
- Zhai, H.; Yang, M.; Chan, K.C. Does Digital Transformation Enhance a Firm’s Performance? Evidence from China. Technology in Society 2022, 68, 101841. [Google Scholar] [CrossRef]
- Geng, Y.; Zheng, Z.; Ma, Y. Digitization, Perception of Policy Uncertainty, and Corporate Green Innovation: A Study from China. Economic Analysis and Policy 2023, 80, 544–557. [Google Scholar] [CrossRef]
- Chen, W.; Srinivasan, S. Going Digital: Implications for Firm Value and Performance. Rev Account Stud 2024, 29, 1619–1665. [Google Scholar] [CrossRef]
- Cheng, W.; Li, C.; Zhao, T. The Stages of Enterprise Digital Transformation and Its Impact on Internal Control: Evidence from China. International Review of Financial Analysis 2024, 92, 103079. [Google Scholar] [CrossRef]
- Whited, T.M.; Wu, G. Financial Constraints Risk. The Review of Financial Studies 2006, 19, 531–559. [Google Scholar] [CrossRef]
- Leung, W.S.; Sun, J. Policy Uncertainty and Customer Concentration. Production and Operations Management 2021, 30, 1517–1542. [Google Scholar] [CrossRef]
- Orlando, M.J. Measuring Spillovers from Industrial R&D: On the Importance of Geographic and Technological Proximity. The RAND Journal of Economics 2004, 35, 777–786. [Google Scholar] [CrossRef]

Table 1.
Definition of variables.
| Variable types | Variable symbols | Variable meanings |
| Dependent variable | (Method 1) | Level of supplier digital transformation based on the logarithm of the number of keywords |
| (Method 2) | Level of supplier digital transformation based on the percentage of digital intangible assets | |
| Independent variable | Logarithm of the total amount of government subsidies related to digital transformation | |
| (Method 1) | Level of customer digital transformation based on the logarithm of the number of keywords | |
| (Method 2) | Level of customer digital transformation based on the percentage of digital intangible assets | |
| Mechanism variables | Proportion of the supplier’s sales to the top five customers | |
| Local | Proportion of the supplier’s sales to local firms among the top five customers | |
| Control variables |
Age | Number of years since supplier’s establishment |
| Size | Logarithm of the number of employees | |
| In the case of state-owned suppliers, ; in the case of privately-owned suppliers, | ||
| TobinQ | Ratio between a physical asset’s market value and its replacement value | |
| Roa | Net profit divided by total assets | |
| Grow | Percentage increase in total assets relative to prior year | |
| FC | Financial constraints index with reference to Whited and Wu [52] | |
| Indrate | Number of independent directors divided by number of directors | |
| Own | Proportion of shares held by the second to fifth largest shareholders divided by the proportion of shares held by the first largest shareholder |
Table 2.
Descriptive statistics for variables.
| Variables | Observations | Average values |
Standard deviation |
Minimum | Maximum |
| (Method 1) | 2,197 | 0.670 | 1.140 | 0 | 5.984 |
| (Method 2) | 2,197 | 0.395 | 1.125 | 0 | 23.953 |
| 2,197 | 7.362 | 7.079 | 0 | 19.616 | |
| (Method 1) | 2,197 | 0.238 | 0.446 | 0 | 3.568 |
| (Method 2) | 2,197 | 0.040 | 0.134 | 0 | 1.818 |
| 2,197 | 0.357 | 0.235 | 0.003 | 1 | |
| Local | 2,197 | 0.013 | 0.053 | 0 | 0.754 |
| Age | 2,197 | 17.046 | 6.005 | 2 | 41 |
| Size | 2,197 | 7.611 | 1.261 | 2.303 | 11.541 |
| 2,197 | 0.533 | — | 0 | 1 | |
| TobinQ | 2,197 | 1.980 | 1.419 | 0.839 | 11.089 |
| Roa | 2,197 | 0.041 | 0.076 | -1.558 | 0.464 |
| Grow | 2,197 | 0.301 | 0.693 | -0.363 | 5.612 |
| FC | 2,197 | -1.012 | 0.302 | -13.667 | -0.608 |
| Indrate | 2,197 | 0.374 | 0.069 | 0.2 | 0.800 |
| Own | 2,197 | 0.702 | 0.616 | 0.003 | 3.522 |
Table 3.
Impact of Government Subsidies on Supplier Digital Transformation.
| (1) | (2) | (3) | (4) | |||||
|
(Method 1) |
(Method 1) |
(Method 2) |
(Method 2) |
|||||
|
(Method 1) |
0.412*** | (4.54) | ||||||
|
(Method 2) |
0.502** | (2.00) | ||||||
| Subsidy | 0.012*** | (3.47) | 0.012*** | (3.45) | 0.011*** | (3.25) | 0.011*** | (3.23) |
| Age | -0.002 | (-0.27) | -0.001 | (-0.06) | -0.012 | (-1.37) | -0.011 | (-1.24) |
| Size | 0.098*** | (2.71) | 0.110*** | (3.20) | 0.067** | (2.58) | 0.068*** | (2.61) |
| Soe | 0.191** | (2.21) | 0.192** | (2.38) | 0.176** | (2.21) | 0.171** | (2.18) |
| TobinQ | 0.066** | (2.51) | 0.049** | (1.99) | 0.131** | (2.09) | 0.129** | (2.08) |
| Roa | 0.813** | (2.25) | 0.863** | (2.46) | -1.159 | (-1.64) | -1.135 | (-1.62) |
| Grow | 0.000 | (0.02) | -0.009 | (-0.40) | -0.029 | (-1.34) | -0.028 | (-1.33) |
| FC | 0.011 | (0.37) | 0.002 | (0.07) | 0.027 | (0.92) | 0.025 | (0.90) |
| Indrate | 0.691 | (1.62) | 0.715* | (1.76) | 0.256 | (0.81) | 0.258 | (0.82) |
| Own | 0.131** | (2.56) | 0.121** | (2.51) | 0.061 | (1.27) | 0.050 | (1.03) |
| Constant | -0.923* | (-1.66) | -1.117** | (-2.12) | -0.574 | (-1.24) | -0.610 | (-1.30) |
| Observations | 2,197 | 2,197 | 2,197 | 2,197 | ||||
| Region FE | YES | YES | YES | YES | ||||
| Year FE | YES | YES | YES | YES | ||||
| Industry FE | YES | YES | YES | YES | ||||
| Adj. R-squared | 0.327 | 0.348 | 0.112 | 0.114 | ||||
Note: ***, **, and * indicate significance at the 1%, 5%, and 10% statistical levels, respectively; values in parentheses are city-level clustering robustness t-statistics. The table below is the same.
Table 4.
Mechanism test.
| (1) | (2) | (3) | (4) | (5) | (6) | |
|
(Method 1) |
(Method 2) |
(Method 1) |
(Method 2) |
|||
| Subsidy | -0.145* | 0.011*** | 0.011*** | -0.034* | 0.012*** | 0.011*** |
| (-1.95) | (3.33) | (3.21) | (-1.95) | (3.45) | (3.30) | |
|
(Method 1) |
0.509** | 0.681*** | ||||
| (2.02) | (2.77) | |||||
|
(Method 1) |
0.417*** | 0.385*** | ||||
| (6.10) | (5.64) | |||||
|
(Method 2) |
1.996*** | 2.426*** | ||||
| (5.93) | (6.33) | |||||
|
(Method 2) |
0.504* | 0.417 | ||||
| (1.73) | (1.55) | |||||
| -0.443*** | -0.356** | |||||
| (-2.64) | (-2.09) | |||||
| -1.616*** | -0.805* | |||||
| (-2.96) | (-1.77) | |||||
| Control variables | YES | YES | YES | YES | YES | YES |
| Fixed effect | YES | YES | YES | YES | YES | YES |
| Observations | 2,197 | 2,197 | 2,197 | 2,197 | 2,197 | 2,197 |
| Adj. R-squared | 0.303 | 0.354 | 0.119 | 0.0493 | 0.352 | 0.116 |
Table 5.
Heterogeneity analysis of opportunistic risk.
| High or low market dominance | High or low market competition | |||||||
| High | Low | High | Low | Low | High | Low | High | |
| (1) | (2) | (3) | (4) | (5) | (6) | (7) | (8) | |
|
Method1 |
Method1 |
Method2 |
Method2 |
Method1 |
Method1 |
Method2 |
Method2 |
|
| Subsidy | 0.003 | 0.018*** | 0.004 | 0.022** | 0.007 | 0.010*** | 0.004 | 0.013* |
| (0.61) | (2.93) | (0.78) | (2.50) | (1.56) | (2.72) | (1.24) | (1.88) | |
|
(Method 1) |
0.713*** | 0.289*** | 0.373** | 0.333*** | ||||
| (7.01) | (3.27) | (2.53) | (4.18) | |||||
|
(Method 2) |
-0.007 | 0.708** | 0.149 | 0.940* | ||||
| (-0.03) | (2.09) | (0.58) | (1.78) | |||||
| Control variables |
YES | YES | YES | YES | YES | YES | YES | YES |
| Fixed effect | YES | YES | YES | YES | YES | YES | YES | YES |
| Observations | 1,098 | 1,094 | 1,098 | 1,094 | 1,093 | 1,104 | 1,093 | 1,104 |
| Adj. R-squared | 0.429 | 0.318 | 0.181 | 0.111 | 0.312 | 0.435 | 0.127 | 0.163 |
Table 6.
Heterogeneity analysis of systemic risk.
| Year2018 | Year2018 | Year2018 | Year2018 | |||||
| (1) | (2) | (3) | (4) | |||||
|
(Method 1) |
(Method 1) |
(Method 2) |
(Method 2) |
|||||
| Subsidy | 0.011*** | (3.13) | 0.013 | (1.51) | 0.012*** | (2.71) | 0.003 | (0.15) |
|
(Method 1) |
0.425*** | (4.74) | 0.366** | (2.05) | ||||
|
(Method 2) |
0.707* | (1.86) | 0.010 | (0.03) | ||||
| Control variables | YES | YES | YES | YES | ||||
| Fixed effect | YES | YES | YES | YES | ||||
| Observations | 1,753 | 434 | 1,753 | 434 | ||||
| Adj. R-squared | 0.350 | 0.355 | 0.143 | 0.151 | ||||
Table 7.
Heterogeneity analysis of human capital and digital divide.
| Level of human capital | Size of digital divide | |||||||
| High | Low | High | Low | Big | Small | Big | Small | |
| (1) | (2) | (3) | (4) | (5) | (6) | (7) | (8) | |
|
Method1 |
Method1 |
Method2 |
Method2 |
Method1 |
Method1 |
Method2 |
Method2 |
|
| Subsidy | 0.008* | 0.006 | 0.012*** | 0.001 | 0.010* | 0.002 | 0.019*** | -0.000 |
| (1.76) | (1.18) | (3.11) | (0.34) | (1.81) | (1.02) | (2.82) | (-0.61) | |
|
(Method 1) |
0.434*** | 0.210 | -0.038 | 0.843*** | ||||
| (4.54) | (1.56) | (-0.36) | (11.58) | |||||
| 0.828** | 0.105 | -0.085 | 0.743*** | |||||
| (Method 2) | (2.02) | (0.52) | (-0.34) | (4.12) | ||||
| Control variables | YES | YES | YES | YES | YES | YES | YES | YES |
| Fixed effect | YES | YES | YES | YES | YES | YES | YES | YES |
| Observations | 1,118 | 1,070 | 1,118 | 1,070 | 906 | 1,288 | 1,008 | 1,187 |
| Adj. R-squared | 0.425 | 0.237 | 0.184 | 0.0313 | 0.515 | 0.452 | 0.193 | 0.378 |
Table 8.
Impact of government subsidies received by suppliers on customer behavior.
| (1) | (2) | (3) | (4) | |
| 0.540*** | 0.565*** | -2.528*** | -2.285*** | |
| (3.89) | (3.99) | (-3.95) | (-3.75) | |
| -0.127*** | -0.099*** | -1.289*** | -0.899*** | |
| (-3.10) | (-3.05) | (-5.55) | (-4.60) | |
| Control variables | NO | YES | NO | YES |
| Fixed effect | YES | YES | YES | YES |
| Observations | 1,355 | 1,355 | 1,355 | 1,355 |
| Adj. R-squared | 0.0897 | 0.105 | 0.202 | 0.295 |
Disclaimer/Publisher’s Note: The statements, opinions and data contained in all publications are solely those of the individual author(s) and contributor(s) and not of MDPI and/or the editor(s). MDPI and/or the editor(s) disclaim responsibility for any injury to people or property resulting from any ideas, methods, instructions or products referred to in the content. |
© 2024 by the authors. Licensee MDPI, Basel, Switzerland. This article is an open access article distributed under the terms and conditions of the Creative Commons Attribution (CC BY) license (http://creativecommons.org/licenses/by/4.0/).
Copyright: This open access article is published under a Creative Commons CC BY 4.0 license, which permit the free download, distribution, and reuse, provided that the author and preprint are cited in any reuse.