

Submitted:
20 August 2024
Posted:
20 August 2024
You are already at the latest version
Abstract
Background: The increasing prevalence of severe obesity among children and adolescents poses
a significant challenge for pediatricians and general practitioners. This study aimed to investigate
the relationships between biochemical results, anthropometry, blood pressure measurements and
bioimpedance analysis (BIA)-derived parameters, to identify potential cardiometabolic
complications associated with severe obesity. Methods: The study included 347 children (162
boys, 185 girls) aged 0-19 years, meeting criteria for severe obesity based on BMI thresholds for
different age groups. Patients were recruited in four pediatric endocrinology centers in Poland
(Zabrze, Cracow, Rzeszow, Szczecin). Each participant underwent anthropometric
measurements, pubertal stage assessment, blood pressure measurement, biochemical and
hormonal tests and BIA. Results: BMI showed significant associations with fat mass percentage
(FM%) and waist-to-height ratio (WHtR), but not waist-to-hip ratio (WHR). The relationship
between BMI and FM% was stronger in girls and prepubertal children. Metabolic syndrome (MetS)
Z-score showed a strong positive correlation with BMI in pubertal children. Negative correlation
between HDL and triglycerides was observed only in boys. Prepubertal children exhibited more
significant correlations despite a smaller sample size and shorter duration of obesity.
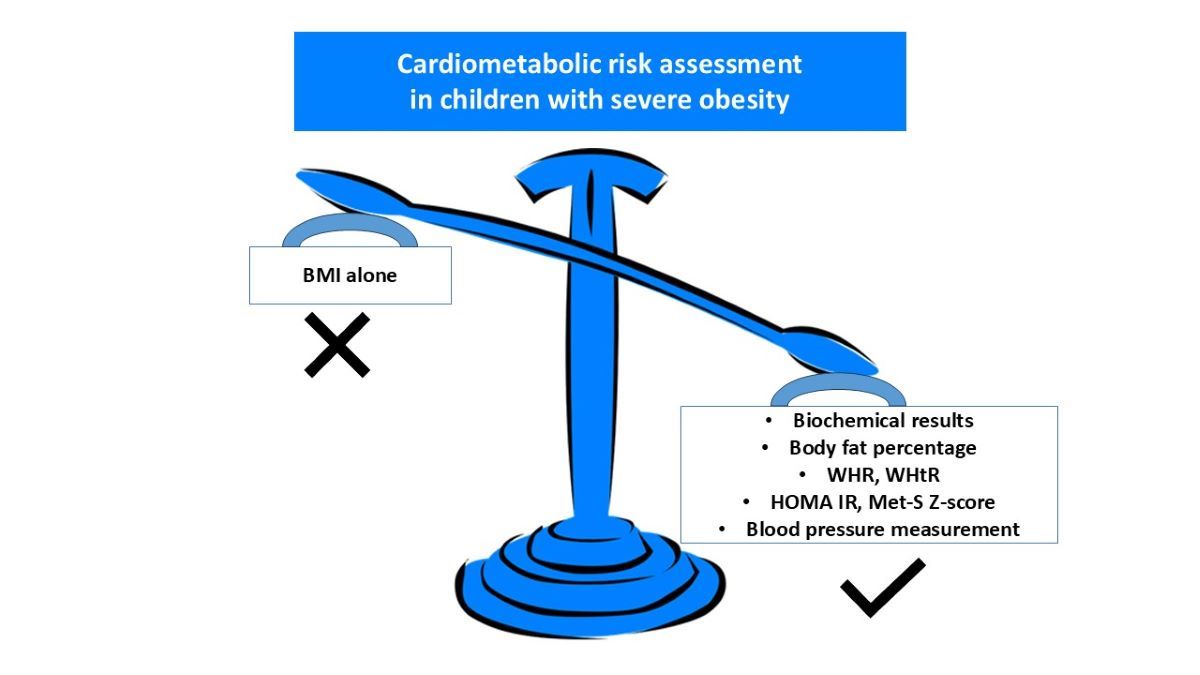
Conclusions: Considering multiple parameters beyond BMI alone provides a better
understanding of cardiometabolic risks associated with severe obesity in children. MetS Z-score
was not a reliable indicator of increased cardiometabolic risk in younger children. Early-onset
severe obesity was associated with a higher risk of metabolic complications. Early intervention is
crucial to mitigate metabolic complications in this population.
Keywords:
severe obesity
; childhood obesity
; bioimpedance analysis
; cardiometabolic complications
1. Introduction
Childhood and adolescent obesity has emerged as one of the foremost challenges in both clinical and socio-economic domains during the 21st century. Nowadays, approximately one in four European children with obesity meets the criteria for severe obesity, resulting in nearly 380 000 children aged 6 to 9 years with severe obesity across 21 European countries [1] meaning that every general practitioner and pediatrician will increasingly encounter children with severe obesity in their medical practice. The prevalence of severe obesity among Polish children and adolescents remains unexplored to date. The number of research studies performed on this study group is still very limited.
Obesity is directly connected with a comprehensive spectrum of over 200 complications, including disruptions in carbohydrate metabolism such as pre-diabetes and diabetes type 2, atherogenic dyslipidemia, hypertension and MAFLD (Metabolic-Associated Fatty Liver Disease). Due to the increasing number of children and adults suffering from severe obesity and, consequently, its complications, there is a genuine necessity to find tools that facilitate the early detection of metabolic complications, enabling the implementation of prophylactic approach or medical intervention [2]. Development of those strategies is particularly crucial for pediatricians and general practitioners as these healthcare professionals continue to play a significant role in managing and coordinating the treatment of patients into adulthood.
One of the strategies for early detection of individuals at risk of developing metabolic complications is to perform simple anthropometric measurements allowing for the calculation of BMI (Body Mass Index), WHR (Waist-to-Hip Ratio), and WHtR (Waist-to-Height Ratio). Another method of determining body composition is BIA (Bioelectrical Impedance Analysis). Basic screening for metabolic complications of obesity includes the assessment of carbohydrate metabolism parameters, lipid profile, and liver enzyme concentrations in the blood, as well as blood pressure measurements. Gathering all this information allows for the calculation of MetS (Metabolic Syndrome Severity) parameter. Correlations between data from BIA, anthropometry, blood pressure measurements and biochemical results have been demonstrated in only one study so far [3]. These relationships are the main focus of our study, as children with severe obesity are at the greatest risk of developing metabolic and cardiovascular disorders, who remain still not well comprehended study population and who require tools that identify the increased risk of cardiometabolic complications the most.
2. Materials and Methods
This study is a part of prospective multi-center clinical investigation conducted across four specialized medical centers in Poland (Szczecin, Cracow, Zabrze, Rzeszow) and describes preliminary results of the project. The intended sample size consists of 500 patients within the age range of 0 to 19 years, all exhibiting severe obesity with an early onset, hyperphagia and food-seeking behaviors. This project aims to establish a Polish database of children with severe obesity, characterize this cohort clinically and biochemically, as well as to evaluate the prevalence of monogenic obesity among Polish children and identify new mutations in obesity-related genes[4].
The study group consisted of 347 children and adolescents (162 boys and 185 girls) meeting the following criteria. Inclusion criteria: 1. Age 0–19 years. 2. The presence of severe obesity defined as a BMI >24 kg/m2 in a child below the age of 2 years, a BMI >30 kg/m2 in children aged 2–6 years, a BMI >35 kg/m2 in children aged 6–14 years, and BMI >40 kg/m2 in children aged >14 years or documented severe obesity in the past. 3. Hyperphagia and food-seeking behaviors. 4. Written informed consent of the patient’s parent/guardian and patient above the age of 13 years to participate in the study.
Exclusion criteria: 1. Lack of written informed written consent from patients’ parent/guardian or patient above the age of 13 years. 2. Secondary cause of obesity: previously diagnosed genetic syndrome coexisting with obesity, treatment with medicine with known effect on weight gain (glucocorticoids, valproic acid, risperidone, and others), Cushing’s syndrome, and other secondary causes of obesity.
One child aged 9 months was included in the study despite BMI 20.7 because of excessive hyperphagia and food-seeking behavior.
Patients were recruited in four medical centers of pediatric endocrinology involved in childhood obesity management (Zabrze, Cracow, Rzeszów, and Szczecin) from inpatient and outpatient departments from 1st July 2022 to 21 st November 2023. Statistical analysis was performed on the whole cohort and with differentiation based on the gender and sexual maturity level.
The data were obtained during a single visit or hospitalization at the study center. Each patient enrolled in the study:
- -
- underwent a physical examination with anthropometric measurements (body weight was measured to the nearest 0.1 kg on a certified medical scale, body height was measured to the nearest 0.1 cm on Harpenden stadiometer, waist circumference was measured at the level of midpoint between the lowest rib and iliac crest, and hip circumference was measured at the level of the greatest convexity of the buttocks on the back and with cardboard applied tangentially to the greatest convexity of the abdomen on the front by measuring tape to the nearest 0.5cm)
- -
- underwent pubertal stage classification using the Tanner scale
- -
- had their blood pressure measured (SBP – systolic blood pressure, DBP – diastolic blood pressure); blood pressure was measured with a calibrated automatic blood pressure monitor with a cuff size appropriate to the arm size, while a participant was in a sitting position following a 15 minute rest period before the examination
- -
- underwent blood uptake for biochemical and hormonal tests in fasting (ALT - alanine aminotransferase, AST - aspartate aminotransferase, glucose, insulin, TGD – triglycerides, HDL - high-density lipoprotein, LDL - low-density lipoprotein, total cholesterol); deviation from the blood collection procedure was allowed if the patient provided documentation of having undergone listed laboratory tests within the last 6 months before the examination
- -
- went through BIA; deviation from BIA was allowed for children unable to cooperate (too young to follow the instructions); BIAs were conducted using TANITA MC-580 M S MDD, TANITA MC-780MA-N, and TANITA MC-780 P MA devices to measure fat mass (FM, %) and fat-free mass (FFM, %).
BMI, WHR, WHtR and HOMA IR (Homeostatic model assessment for insulin resistance) were calculated from the following formulas:
- -
- BMI = weight (kg)÷height (m^2)
- -
- WHR = waist circumference (cm)÷hip circumference (cm)
- -
- WHtR = waist circumference (cm)÷height(cm)
- -
- HOMA IR=(glucose (mg/dl)×insulin (µIU/ml))÷405
- -
- BMI Z-Score was calculated by Pediatric Z-Score Calculator online [5] for children aged 2-19 years
- -
- MetS Z-score was calculated by MetS Z-score Calculator online [6]
In order to state the statistically significant differences between data gathered: girls vs boys and prepubertal vs pubertal patients - a nonparametric Mann-Whitney test was used. The above analyses were performed on two subgroups: all study participants (n=347), and patients who have entered puberty (n=301). In order to determine the presence of significant correlations between the analyzed parameters – Spearman’s rank correlations were calculated and correlograms were generated for five subgroups: whole study population (n=347), girls (n=185), boys (n=162), prepubertal patients (n=46) and pubertal patients (n=301). Statistically significant results were stated for p <0.05. All calculations and graphics were performed using the R programming and statistical environment (R Foundation for Statistical Computing, Vienna, Austria, version: 4.3.2).
3. Results
Study group consisted of 347 children (185 girls and 162 boys) with average age 13.4 years (13.7 for girls and 13.1 for boys, p=0.034). 301 children has entered puberty (expressed by Tanner II in at least one assessed variable) and 46 were assessed Tanner I (prepubertal period) p<0.001. Average age of children who have entered puberty was equal 14.4 while the average age of children in prepubertal period was equal 7. Mean BMI of the whole study population was equal 40.1 (the same for both genders), 40.9 for children in pubertal period and 34.9 for children in prepubertal period. The difference in BMI according to the level of puberty was statistically significant p<0.01. BMI Z-score and MetS Z-score on average were both equal 2.7 and they were dependent on the gender and pubertal period (p<0.001 for both). Both parameters were higher in the group of boys (2.8 both) and in children in the prepubertal period (3.1 and 3.0 respectively). Mean value of WHR in the study population was equal 0.9 (same for both genders and children in pubertal period) and 1 in the group of children who have not entered puberty yet. The difference was statistically significant in both variables - gender and pubertal level (p<0.01). The average value of WHtR was equal 0.7 (the same in both genders and pubertal periods) and the difference was statistically significant in terms of pubertal period. HOMA IR on average was equal 6.4 (6.2 for girls and 6.7 for boys, 6.7 for children in pubertal period and 4.8 in prepubertal period). Detailed data about characteristics and derived parameters of the whole study population and their correlation with the gender (Table 1) and pubertal period (Table 2) have been presented in Table 1 and Table 2.
Analysis of biochemical and hormonal tests results revealed, that within studied population children have experienced wide range of glucose concentration from hypoglycemia, normoglycemia (majority, mean=88.6 mg/dl) and impaired fasting glucose. Glucose concentration was higher in boys, the difference was statistically significant (p=0.027). When it comes to insulin, average value calculated for the whole study population was equal 29.0 µIU/ml indicating hyperinsulinemia (cut-off equal 24.9 µIU/ml was adopted from the laboratory standards). There was a statistically significant difference in insulin concentration in children in pubertal (30.1 µIU/ml) and prepubertal period (21.8 µIU/ml) p=0.001. When it comes to lipid profile, average total cholesterol of the whole study population was equal 163.5 mg/dl, HDL 41.8 mg/dl, LDL 97 mg/dl, TGD 134.5 mg/dl. Triglyceride concentration was higher in boys, the difference was statistically significant (p=0.032). Liver enzyme levels were also elevated, especially in boys (p<0.001), AST being particularly elevated in the prepubertal group of children (p<0.001). Average blood pressure of the whole study population was equal 135/80, higher values were observed in the group of children who have entered puberty (136/81 vs 125/76 in prepubertal period) and in boys (137/80 vs 133/81 in girls). The differences were statistically significant. When it comes to BIA-derived parameters, FM of the whole study population was equal 46.8% and was higher in girls (48.5% vs 44.8% in boys, p<0.001), while FFM was equal 53.2%, but it was higher in boys (55.2% vs 51.5% in girls, p<0.001). The difference in FM and FFM in children in pubertal and prepubertal period was not statistically significant. Detailed results of biochemical and hormonal tests, blood pressure measurements and BIA-derived parameters of the whole study group according to gender (Table 3) and pubertal period (Table 4) have been presented in Table 3 and Table 4.
Due to the significant number of children in the pubertal period, a statistical analysis of the results according to gender was also conducted within this group. Results have shown that boys had higher both MetS Z-score, BMI Z-score (2.7 vs 2.5 in girls in both parameters p<0.001) and HOMA IR (7.2 vs 6.3 p=0.007). Boys also had higher glucose (91 mg/dl vs 88 mg/dl p=0.006), insulin (32 µIU/ml vs 29 µIU/ml p=0.016), TGD (150 mg/dl vs 124 mg/dl p=0.047), ALT (39 vs 29 U/I p<0.001), AST (29 vs 25 U/I p<0.001), SBP (139 mmHg vs 134 mmHg p<0.001) and FFM (56% vs 51% p<0.001), while girls had higher HDL (43 mg/dl vs 40 mg/dl p=0.020) and FM (49 vs 44% p<0.001) than boys. Detailed results of the selected characteristics, derived parameters, results of biochemical and hormonal tests, blood pressure measurements and BIA-derived parameters of the children in pubertal period have been presented in the Table 5 and Table 6.
When examining correlations between gathered parameters in the whole study population (n=347) the strongest positive correlations were observed between HOMA IR and insulin (r=1.0), cholesterol and LDL level (r=0.9) and between AST and ALT (r=0.8). BMI was strongly associated with FM% (r=0.5), MetS Z-score (r=0.4) and WHtR (r=0.5). No correlation between BMI and WHR has been observed. There was also a significant correlation between WHR and WHtR indicators (r=0.6), SBP and DBP (r=0.5), glucose and HOMA IR (r=0.4) and between cholesterol and TGD (r=0.4). The most robust negative relationship was observed between FFM% and BMI (r=-0,5) and WHtR (r=-0.4) and FM% (r=-1). Detailed results of the correlation analysis have been presented in Figure 1.
Correlations were also examined within the group of girls. Statistical analysis revealed that the relationship between BMI and FM% (r=0.7) in the group of girls was stronger than in the whole study population. What is more, only in the group of girls relationships between ALT and WHtR (=r.3), FM% and MetS Z-score (r=0.5) and between FM% and DBP (r=0.3) have been observed. Detailed results of the correlation analysis in the group of girls have been presented in Figure 2.
In the group of boys less variations in correlations have been observed. Both positive and negative correlations have been largely compatible with the trends observed in the whole study population. However, there was a strong negative relationship between HDL and TGD (r=-0.3) which was not observed in any other analyzed group, and MetS Z-score was more strongly correlated with the BMI (r=0.6). Graphical representation of the data analysis in the group of boys have been presented in the Figure 3.
Correlations were also assessed based on the pubertal stage of the study population. 46 children who took part in the study were classified as stage I in Tanner scale (13 girls, 33 boys). In this group statistical analysis revealed more very strong positive correlations between BMI and other parameters: insulin (r=0.6), HOMA IR (r=0.5) and DBP (r=0.4). The relationship between BMI and FM% was stronger than in the whole study population (r=0.8). WHR was associated not only with WHtR (=0r.6), but also with AST and ALT (r=0.5 and r=0.4). There was a stronger correlation between SBP and DBP (r=0.7) than in the whole study population. What is interesting, MetS Z-score correlated negatively with FM (r=-0.3), insulin (r=-0.4), HOMA IR (r=-0.5) and cholesterol (r=-0.6). There was also a robust association between insulin and HOMA IR and ALT (r=0.5 and 0.4), DBP (r=0.4 and 0.6) and FM% (r=0.5 for both insulin and HOMA IR). Graphical representation of analysis performed on the group of children in the prepubertal period have been presented in the Figure 4.
Study population consisted of 301 children (172 girls and 129 boys) who entered pubertal period (classified as Tanner II or more). Graphical representation of analysis performed on the group of children in the pubertal period have been presented in the Figure 5. In this group BMI was correlated with insulin (r=0.3) and SBP (r=0.3). What is worth noting is that there was a strong positive correlation between MetS Z-score and BMI (r=0.7), and MetS Z-score and glucose (r=0.4).
4. Discussion
The ongoing global epidemic of obesity in both children and adults has underscored the necessity for tools to identify risks associated with obesity. The simplest tools for assessing nutritional status and potential complications of obesity include anthropometric measures such as BMI, WHR, and WHtR.
Various global organizations, such as the World Health Organization (WHO) [7] and the International Obesity Task Force (IOTF) [8], have established standards for assessing the nutritional status of children using age- and gender-specific BMI percentile thresholds. It is concerning that over a period of 17 months, we successfully enrolled nearly 350 children meeting the criteria for severe obesity (with an average BMI of 40.1, BMI Z-score 2.7) in four Polish medical centers. What is even more troubling is that in the group of the youngest children who have not entered puberty yet (average age 7 years), calculated mean BMI value was equal 34.9 (BMI Z-score 3.1, meaning more than 3 standard deviations above the mean BMI for age and gender). A study estimating the number of children with severe obesity in Poland has not been conducted yet, basing on our results it is evident that the scale of the problem is significant.
WHR and WHtR ratios provide a straightforward and quick method for assessing abdominal obesity, which is associated with a higher risk of metabolic disorders and cardiovascular diseases. Unlike BMI, which may not distinguish between fat and muscle mass, WHR and WHtR are less influenced by these variations. The norms for WHR and WHtR vary slightly depending on the source and adopted standards. According to WHO abdominal obesity is recognized when the Waist-to-Hip Ratio (WHR) exceeds 0.85 in women and 0.9 in men [9]. Based on a recently published meta analysis by Eslami et al. optimal cut-off value of WHtR to predict central obesity in children and adolescents was 0.49 for both genders [10]. Average values of both WHR (0.9 for both genders) and WHtR (0.7 for both genders) in our study population exceeded mentioned cut-off points indicating presence of abdominal obesity. What is interesting, no statistically significant correlation between BMI and WHR in our study population was found, while WHtR correlated very strongly with BMI and FM%, qualifying WHtR as a superior indicator of fat distribution. WHtR takes into account height, which helps standardize the measurement and provides a better reflection of how fat is distributed relative to a person’s overall stature [10]. According to studies WHtR exhibits a superior ability to forecast health risks associated with central obesity, including type 2 diabetes, hypertension, and cardiovascular disease, particularly in children and adolescents aged five and older [11].
In addition to classical anthropometric methods used to assess nutritional status and potential metabolic complications, our analysis also employed the MetS Z-score parameter and FM% obtained by bioimpedance method. As of now, there are no standardized diagnostic criteria consistently used to define metabolic syndrome in childhood and adolescence [12]. MetS is a constellation of cardiovascular risk factors linked to insulin resistance, believed to result from underlying processes involving dysfunction of adipocytes, systemic inflammation, and oxidative stress [13]. The MetS z-score in our analysis was derived from a confirmatory factor analysis that examines how the various components of MetS (obesity (BMI or WHR), blood pressure, TGD, HDL cholesterol, and fasting glucose) are correlated with one another [8]. Its clinical significance in predicting future risk of developing cardiovascular disease and diabetes type 2 in children and adolescents remains a controversial issue [13]. Interpretation of the results is challenging especially in the group of youngest children, as MetS z-score has been developed in the group of US adults [6]. MetS z-score equal 0 means average degree of metabolic syndrome, higher scores above 0 are associated with more risk for future disease, particularly scores above 1 (which is higher than 84.1% of US adults) or 2 (which is higher than 97.7% of US adults) [8]. Average MetS Z-score calculated for our population was very high equal 2.7 indicating increased risk of cardiovascular disease and diabetes type 2. We found strong positive correlations of MetS Z-score with BMI and WHtR in children who have entered puberty. Additionally, MetS Z-score in girls was strongly correlated with FM% which could result from the physiologically greater amount of body fat percentage in women [14]. On the contrary, the analysis of prepubertal children’s data revealed strong negative correlations of MetS Z-score with glucose, insulin, HOMA-IR, and FM%. This confirms that application of this parameter in the group of youngest children is limited, as this indicator was originally developed in the group of adults.
Bioelectrical impedance analysis (BIA) has gained popularity due to its ease of use and non-invasiveness. It allows for a quick and efficient assessment of body composition by measuring the resistance of electrical currents as they pass through body tissues [15]. High body fat is linked to an increased cardiometabolic risk and hypertension. BIA is also suggested as a potential predictor for pediatric MAFLD [16] and metabolic syndrome [3]. It has been proven to be applicable in the population of children with severe obesity [12,13]. The study performed on a group of 1 998 people aged 16 to 91 years revealed an increased cardiometabolic risk when body fat exceeded 25.9% for men and 37.1% for women [12]. Williams et al. provide a cut-off for total percentage of body fat equal 30% for females and 25% for males as values significantly associated with cardiovascular risk factors in children and adolescents [17]. Average value of body fat in our study population was 48.5% for girls and 44.8% for boys (on the contrary, boys experienced higher FFM equal 55.2% vs 51.5% for girls). According to Bojanic et. all in boys between ages of seven and ten, there is a gradual increase in the average body fat percentage. However, after the age of 10, there is a consistent decline in body fat percentage until reaching 14 years of age. For girls they observed a steady rise in average body fat percentage from the age of 6 and continuing until 14 [18]. These data correspond with our findings, as the average age of our study population was equal 13.4. What is concerning, is that the total percentage of body fat of children in the prepubertal period was also very high, equal 48.2%. The other BIA-derived parameter was FFM (which includes muscle mass). Children with obesity typically have a higher FFM compared to children with normal body weight, which can be attributed to the need for enhanced muscle mass to support excess weight and maintain mobility. Obesity often leads to inflammation and fluid retention, which can result in edema, impacting BIA measurements as well. Moreover, during periods of rapid growth, such as childhood and adolescence, children naturally experience an increase in FFM as part of their normal growth and development process [15]. It’s crucial to recognize that while FFM may be higher, this doesn’t necessarily equate to being healthy or desirable.
The average results of insulin, TGD, liver enzymes and blood pressure were exceeding cut-off values. The particularly concerning fact is that children in the prepubertal period achieved almost equally high test results as children in the pubertal period. The maintenance of fasting glucose levels within the normal range is achieved through a compensatory mechanism involving hyperinsulinemia, as indicated by HOMA-IR values. The HOMA-IR provides a relatively straightforward approach to evaluating insulin resistance. Currently, there is no established threshold value indicating pathology for the HOMA-IR index in pediatric patients. Shashaj et al. suggested that values surpassing 1.68 in individuals with normal body weight suggest a "non-physiological state" (3.42 in the group of children and adolescents) and may elevate the risk of cardiovascular diseases [19]. The 2012 OSCA guidelines proposed an HOMA-IR value > 4.5 as the cutoff point for defining insulin resistance in children with excess body weight [20]. Average HOMA IR in our studied population indicated presence of insulin resistance (6.4 in the whole study population, 6.7 for children in pubertal period and 4.8 for children in prepubertal period). It is noteworthy that physiological insulin resistance occurs during adolescence, marked by a 25–50% decrease in insulin sensitivity. Unfortunately, excess body weight often leads to an exacerbation of insulin resistance during adolescence, which is a significant concern, especially in case of children diagnosed with severe obesity at a young age. According to a study by Reihner et al. , T2DM in children and adolescents often occurs in the presence of a strong family history and may not be related to obesity severity [17]. In our analysis of the whole study population HOMA IR was significantly correlated only with glucose and insulin. What is interesting, in the group of youngest children HOMA IR was additionally strongly correlated with BMI (r=0.5), ALT (r=0.4), DBP (r=0.6) and FM (r=0.5) presumably due to a greater genetic predisposition for the development of metabolic complications associated with obesity [18]. Children in the prepubertal period exhibited a greater number of strong correlations even despite a smaller sample size and potentially shorter duration of obesity.
According to AAP guidelines total cholesterol in children should not exceed 170 mg/dl, LDL 110mg/dl, TGD 75 mg/dl, while HDL should be greater than 40 mg/dl [21]. In our study abnormalities in triglycerides compared to other lipids were distinctly noticeable (146.7mg/dl for boys and 124 mg/dl for girls), serving as the primary marker of lipid disorders associated with an improper diet and high consumption of simple sugars. ALT and AST, especially ALT, are considered biochemical markers of liver damage. NASPGHAN recommendations suggest using ALT as a screening test for Metabolic Associated Fatty Liver Disease (MAFLD), with values of 22 U/l for girls and 26 U/l for boys as the upper limits of normal [22]. In our study population average values of ALT for girls were equal 28.8 U/l and 38.8 U/l for boys indicating very high risk of MAFLD development. Diagnostic criteria for MAFLD include identification of liver steatosis in histopathological examinations, imaging studies or serological markers of lipid accumulation and presence of 1 out of 3 following criteria: overweight or obesity, type 2 diabetes or at least two parameters confirming metabolic dysregulation [23]. Recent studies emphasize the need for a more precise definition of MAFLD in children, especially in the context of more effectively identifying children with an increased cardiovascular risk [24]. The norms for arterial blood pressure in children depend on their age, gender, and height. The average arterial blood pressure in the studied population was 135/80, meeting the criteria for stage I hypertension in adults according to the American College of Cardiology/American Heart Association (ACC/AHA) guidelines from 2017 [25]. This indicates that the majority of the examined children had blood pressure significantly exceeding the norm for their gender, age, and height. According to the American Heart Association the overall prevalence of hypertension in children is 2% to 5% [26]. Children with hypertension have a significant likelihood of developing hypertension in adulthood and experiencing detectable damage to target organs, especially hypertrophy of the left ventricle and stiffening of blood vessels [26].
Regardless of gender and maturation stage, strong correlations were observed between HOMA IR and insulin concentration, cholesterol and LDL level, BMI and FM, BMI and WHtR, ALT and AST, WHR and WHtR indicators, as well as SBP and DBP. Only in the group of boys strong negative correlation between HDL and TGD levels (r=-0.3) was observed. What is more, girls had higher average values of HDL cholesterol, while boys had higher average values of triglycerides and liver enzymes. This may suggest that boys obesity results from consumption of more highly processed food, while in girls excessive body weight can be associated with exorbitant calorie intake. In our project we investigated children’s dietary habits through surveys and we will aim to address this topic in subsequent publications. In the group of children during puberty, significantly higher values of HOMA IR were observed, along with a strong positive correlation between BMI and SBP, which was not present in the pre-pubertal group. These results suggest that there is an increasing risk of developing diabetes and arterial hypertension with age and the progress of sexual maturation. The examination of the prepubertal period population yielded particularly intriguing insights. The most likely primary contributors to the development of obesity in this age group are genetic factors, which predispose to the early development of metabolic complications. This was reflected in our results as we observed a higher number of stronger correlations, despite the smaller size of the group and potentially shorter duration of the metabolically adverse effects of higher body mass. Evaluation of the prevalence of monogenic forms of obesity in this cohort, with a special focus on leptin-proopiomelanocortin pathway abnormalities is planned to be investigated in the next stage of the study.
Childhood obesity increases the likelihood of persistent obesity in the long term, along with an elevated risk of significant complications and mortality in adulthood. Severe obesity during adolescence is linked to notably higher complication risks [18]. While treating childhood obesity is recommended and effective, intensive therapies like medically supervised meal replacement, pharmacologic treatment, and bariatric surgery come with risks and high costs. The use of simple tools such as anthropometric indicators, body composition analysis, blood pressure measurements and basic biochemical parameters assessing carbohydrate metabolism, lipid profile and liver enzymes can contribute to the early detection of obesity with its complications and allow for early implementation of preventive strategies.
5. Conclusions
Results have shown that considering multiple parameters beyond BMI alone provides a better understanding of cardiometabolic risks associated with severe obesity in children. MetS Z-score could be successfully applied in the group of children who have entered puberty, but it was not a reliable indicator of increased cardiometabolic risk in younger children. The earlier the onset of severe obesity, the greater the risk of metabolic complications development. Early intervention is crucial to mitigate metabolic complications in this population.
Author Contributions
Conceptualization, Ewa Kostrzeba and Elżbieta Petriczko; Data curation, Ewa Kostrzeba, Mirosław Bik-Multanowski, Ewa Malecka-Tendera, Artur Mazur, Małgorzata Wójcik, Agnieszka Zachurzok, Anna Przestalska-Sowa and Elżbieta Petriczko; Formal analysis, Ewa Kostrzeba, Michael B. Ranke, Martin Wabitsch and Elżbieta Petriczko; Investigation, Ewa Kostrzeba, Mirosław Bik-Multanowski, Ewa Malecka-Tendera, Artur Mazur, Małgorzata Wójcik, Agnieszka Zachurzok, Anna Przestalska-Sowa and Elżbieta Petriczko; Methodology, Agnieszka Zachurzok; Supervision, Stephanie Brandt, Michael B. Ranke, Martin Wabitsch, Agnieszka Zachurzok and Elżbieta Petriczko; Writing – original draft, Ewa Kostrzeba and Anna Przestalska-Sowa; Writing – review & editing, Ewa Kostrzeba, Stephanie Brandt, Michael B. Ranke and Elżbieta Petriczko.
Funding
This research was funded in whole by National Science Center, Poland (2021/41/B/NZ5/01676). For the purpose of Open Access, the author has applied a CC-BY public copyright license to any Author Accepted Manuscript (AAM) version arising from this submission.
Institutional Review Board Statement
The study was conducted according to the guidelines of the Declaration of Helsinki “Ethical Principles for Medical Research in Humans” (9 July 2018). The study was approved by the local ethics committees (No. PCN/CBN/0022/KB1/137/I/21/22, KBETUJ 1072.6120.69.2022, KB-006/12/2022).
Informed Consent Statement
All parents and children above the age of 13 fulfilled written consent to the participation in the study prior to its initiation.
Conflicts of Interest
The authors declare no conflicts of interest.
References
- Williams, J.; Buoncristiano, M.; Nardone, P.; Rito, A. I.; Spinelli, A.; Hejgaard, T.; Kierkegaard, L.; Nurk, E.; Kunešová, M.; Musić Milanović, S.; García-Solano, M.; Gutiérrez-González, E.; Brinduse, L. A.; Cucu, A.; Fijałkowska, A.; Farrugia Sant’Angelo, V.; Abdrakhmanova, S.; Pudule, I.; Duleva, V.; Yardim, N. A Snapshot of European Children’s Eating Habits: Results from the Fourth Round of the WHO European Childhood Obesity Surveillance Initiative (COSI). Nutrients 2020, 12, 2481. [Google Scholar] [CrossRef] [PubMed]
- Rulkiewicz, A.; Pilchowska, I.; Lisik, W.; Pruszczyk, P.; Ciurzyński, M.; Domienik-Karłowicz, J. Prevalence of Obesity and Severe Obesity among Professionally Active Adult Population in Poland and Its Strong Relationship with Cardiovascular Co-Morbidities-POL-O-CARIA 2016–2020 Study. J. Clin. Med. 2022, 11, 3720. [Google Scholar] [CrossRef] [PubMed]
- Muhanna, R. G.; Aljuraiban, G. S.; Almadani, N. K.; Alquraishi, M.; El-Sharkawy, M. S.; Mahmoud. Value of Adding Bioelectrical Impedance Analysis to Anthropometric Indices in the Diagnosis of Metabolic Syndrome in 10–16 Years Old Schoolgirls. Healthcare 2022, 10, 419–419. [Google Scholar] [CrossRef] [PubMed]
- Mierzwa, M.; Mirosław Bik-Multanowski; Ranke, M. B.; Brandt, S.; Flehmig, B.; Małecka-Tendera, E.; Mazur, A.; Elżbieta Petriczko; Wabitsch, M.; Małgorzata Wójcik; Agnieszka Zachurzok. Clinical, Genetic, and Epidemiological Survey of Polish Children and Adolescents with Severe Obesity: A Study Protocol of the Polish–German Study Project on Severe Early-Onset Obesity. Front. Endocrinol. 2022, 13. [CrossRef]
- Pediatric Z-Score Calculator [Internet]. [cited 2023 Sep 12]. Available from: https://zscore.research.chop.edu/calcbmi.php.
- MetS Z-score Calculator [Internet]. [cited 2024 Jan 28]. Available from: https://metscalc.org/.
- De Onis, M.; Onyango, A. W.; Borghi, E.; Siyam, A.; Nishida, C.; Siekmann, J. Development of a WHO Growth Reference for School-Aged Children and Adolescents. Bull. World Health Organ. 2007, 85, 660–667. [Google Scholar] [CrossRef] [PubMed]
- Cole, T. J.; Bellizzi, M. C.; Flegal, K. M.; Dietz, W. H. ; Establishing a Standard Definition for Child Overweight and Obesity Worldwide: International Survey. BMJ 2000, 320, 1240–1240. [Google Scholar] [CrossRef] [PubMed]
- WHO. Waist circumference and waist-hip ratio: report of a WHO expert consultation. Geneva, 8-11 December 2008. World Health Organization; 2011. 39. Available online: https://www.who.int/publications/i/item/9789241501491.
- Eslami, M.; Pourghazi, F.; Khazdouz, M.; Tian, J.; Pourrostamim, K.; Esmaeili-Abdar, Z.; Ejtahed H.-S.; Qorbani, M. Optimal Cut-off Value of Waist Circumference-To-Height Ratio to Predict Central Obesity in Children and Adolescents: A Systematic Review and Meta-Analysis of Diagnostic Studies. 2023, 9. [CrossRef]
- Yoo, E.-G. Waist-To-Height Ratio as a Screening Tool for Obesity and Cardiometabolic Risk. Korean J. Pediatr. 2016, 59, 425. [Google Scholar] [CrossRef] [PubMed]
- Lamb, M. J. E.; Byrne, C. D.; Wilson, J. F.; Wild, S. H. Evaluation of Bioelectrical Impedance Analysis for Identifying Overweight Individuals at Increased Cardiometabolic Risk: A Cross-Sectional Study. PLoS ONE 2014, 9, e106134. [Google Scholar] [CrossRef] [PubMed]
- Khan, S.; Xanthakos, S. A.; Hornung, L.; Arce-Clachar, C.; Siegel, R.; Kalkwarf, H. J. Relative Accuracy of Bioelectrical Impedance Analysis for Assessing Body Composition in Children with Severe Obesity. J. Pediatr. Gastroenterol. Nutr. 2020, 70, e129–e135. [Google Scholar] [CrossRef] [PubMed]
- Bredella, M. A. Sex Differences in Body Composition. Sex Gend. Factors Affect. Metab. Homeost. Diabetes Obes. 2017, 1043, 9–27. [Google Scholar] [CrossRef]
- Wells, J. C. K. Body Composition in Childhood: Effects of Normal Growth and Disease. Proc. Nutr. Soc. 2003, 62, 521–528. [Google Scholar] [CrossRef] [PubMed]
- Lee, L.-W.; Yen, J.-B.; Lu, H.-K.; Liao, Y.-S. Prediction of Nonalcoholic Fatty Liver Disease by Anthropometric Indices and Bioelectrical Impedance Analysis in Children. Childhood Obesity 2021. [CrossRef] [PubMed]
- Reinehr, T.; Tittel, S. R.; Holle, R.; Wiegand, S.; Gellhaus, I.; Hebebrand, J.; Greber-Platzer, S.; Denzer, C.; Linke, S.; Wieland Kieß; Holl, R. W. Comparison of Cardiovascular Risk Factors between Children and Adolescents with Classes III and IV Obesity: Findings from the APV Cohort. Int. J. Obes. 2021, 45, 1061–1073. [CrossRef]
- Skinner, A. C.; Perrin, E. M.; Moss, L. A.; Skelton, J. A. Cardiometabolic Risks and Severity of Obesity in Children and Young Adults. N. Engl. J. Med. 2015, 373, 1307–1317. [Google Scholar] [CrossRef] [PubMed]
- Shashaj, B.; Luciano, R.; Contoli, B.; Morino, G. S.; Spreghini, M. R.; Rustico, C.; Sforza, R. W.; Dallapiccola, B.; Manco, M. Reference Ranges of HOMA-IR in Normal-Weight and Obese Young Caucasians. Acta Diabetol. 2016, 53, 251–260. [Google Scholar] [CrossRef] [PubMed]
- Viner, R. M.; White, B.; Barrett, T.; David; Gibson, P.; Gregory, J.; Matyka, K.; Ong, K. K.; Roche, E.; Rudolf, M. C. J.; Shaikh, G.; Julian P.H. Shield; Wales, J. K. Assessment of Childhood Obesity in Secondary Care: OSCA Consensus Statement. 2012, 97, 98–105. [CrossRef]
- HORSLEY, L. AAP Clinical Report on Lipid Screening in Children. Am. Fam. Physician 2009, 79, 703–705, Available online: https://www.aafp.org/pubs/afp/issues/2009/0415/p703.html. [Google Scholar]
- Vos, M. B.; Abrams, S. H.; Barlow, S. E.; Caprio, S.; Daniels, S. R.; Kohli, R.; Mouzaki, M.; Sathya, P.; Schwimmer, J. B.; Sundaram, S. S.; Xanthakos, S. A. NASPGHAN Clinical Practice Guideline for the Diagnosis and Treatment of Nonalcoholic Fatty Liver Disease in Children. J. Pediatr. Gastroenterol. Nutr. 2017, 64, 319–334. [Google Scholar] [CrossRef]
- Shaunak, M.; Byrne, C. D.; Davis, N.; Afolabi, P.; Faust, S. N.; Davies, J. H. Non-Alcoholic Fatty Liver Disease and Childhood Obesity. Arch. Dis. Child. 2020, 106, 3–8. [Google Scholar] [CrossRef] [PubMed]
- Marcinkiewicz, K.; Horodnicka-Józwa, A.; Jackowski, T.; Kamila Strączek; Agnieszka Biczysko-Mokosa; Walczak, M.; Elżbieta Petriczko. Nonalcoholic Fatty Liver Disease in Children with Obesity– Observations from One Clinical Centre in the Western Pomerania Region. Front. Endocrinol. 2022, 13. [CrossRef]
- Whelton, P. K.; Carey, R. M.; Aronow, W. S.; Casey, D. E.; Collins, K. J.; Dennison Himmelfarb, C.; DePalma, S. M.; Gidding, S.; Jamerson, K. A.; Jones, D. W.; MacLaughlin, E. J.; Muntner, P.; Ovbiagele, B.; Smith, S. C.; Spencer, C. C.; Stafford, R. S.; Taler, S. J.; Thomas, R. J.; Williams, K. A.; Williamson, J. D. 2017 ACC/AHA/AAPA/ABC/ACPM/AGS/APhA/ASH/ASPC/NMA/PCNA Guideline for the Prevention, Detection, Evaluation, and Management of High Blood Pressure in Adults: Executive Summary: A Report of the American College of Cardiology/American Heart Association Task Force on Clinical Practice Guidelines. Hypertension 2018, 71, 1269–1324. [Google Scholar] [CrossRef] [PubMed]
- Falkner, B.; Gidding, S. S.; Baker-Smith, C. M.; Brady, T. M.; Flynn, J. T.; Malle, L. M.; South, A. M.; Tran, A. H.; Urbina, E. M. Pediatric Primary Hypertension: An Underrecognized Condition: A Scientific Statement from the American Heart Association. Hypertension 2023, 80. [Google Scholar] [CrossRef] [PubMed]
Figure 1.
Results of the statistical analysis performed on the whole study population. Positive correlations between parameters were denoted in blue, with stronger correlations indicated by more intense blue coloring. Negative correlations were indicated in red, with more intense red coloring signifying stronger negative correlations between observed parameters.
Figure 1.
Results of the statistical analysis performed on the whole study population. Positive correlations between parameters were denoted in blue, with stronger correlations indicated by more intense blue coloring. Negative correlations were indicated in red, with more intense red coloring signifying stronger negative correlations between observed parameters.
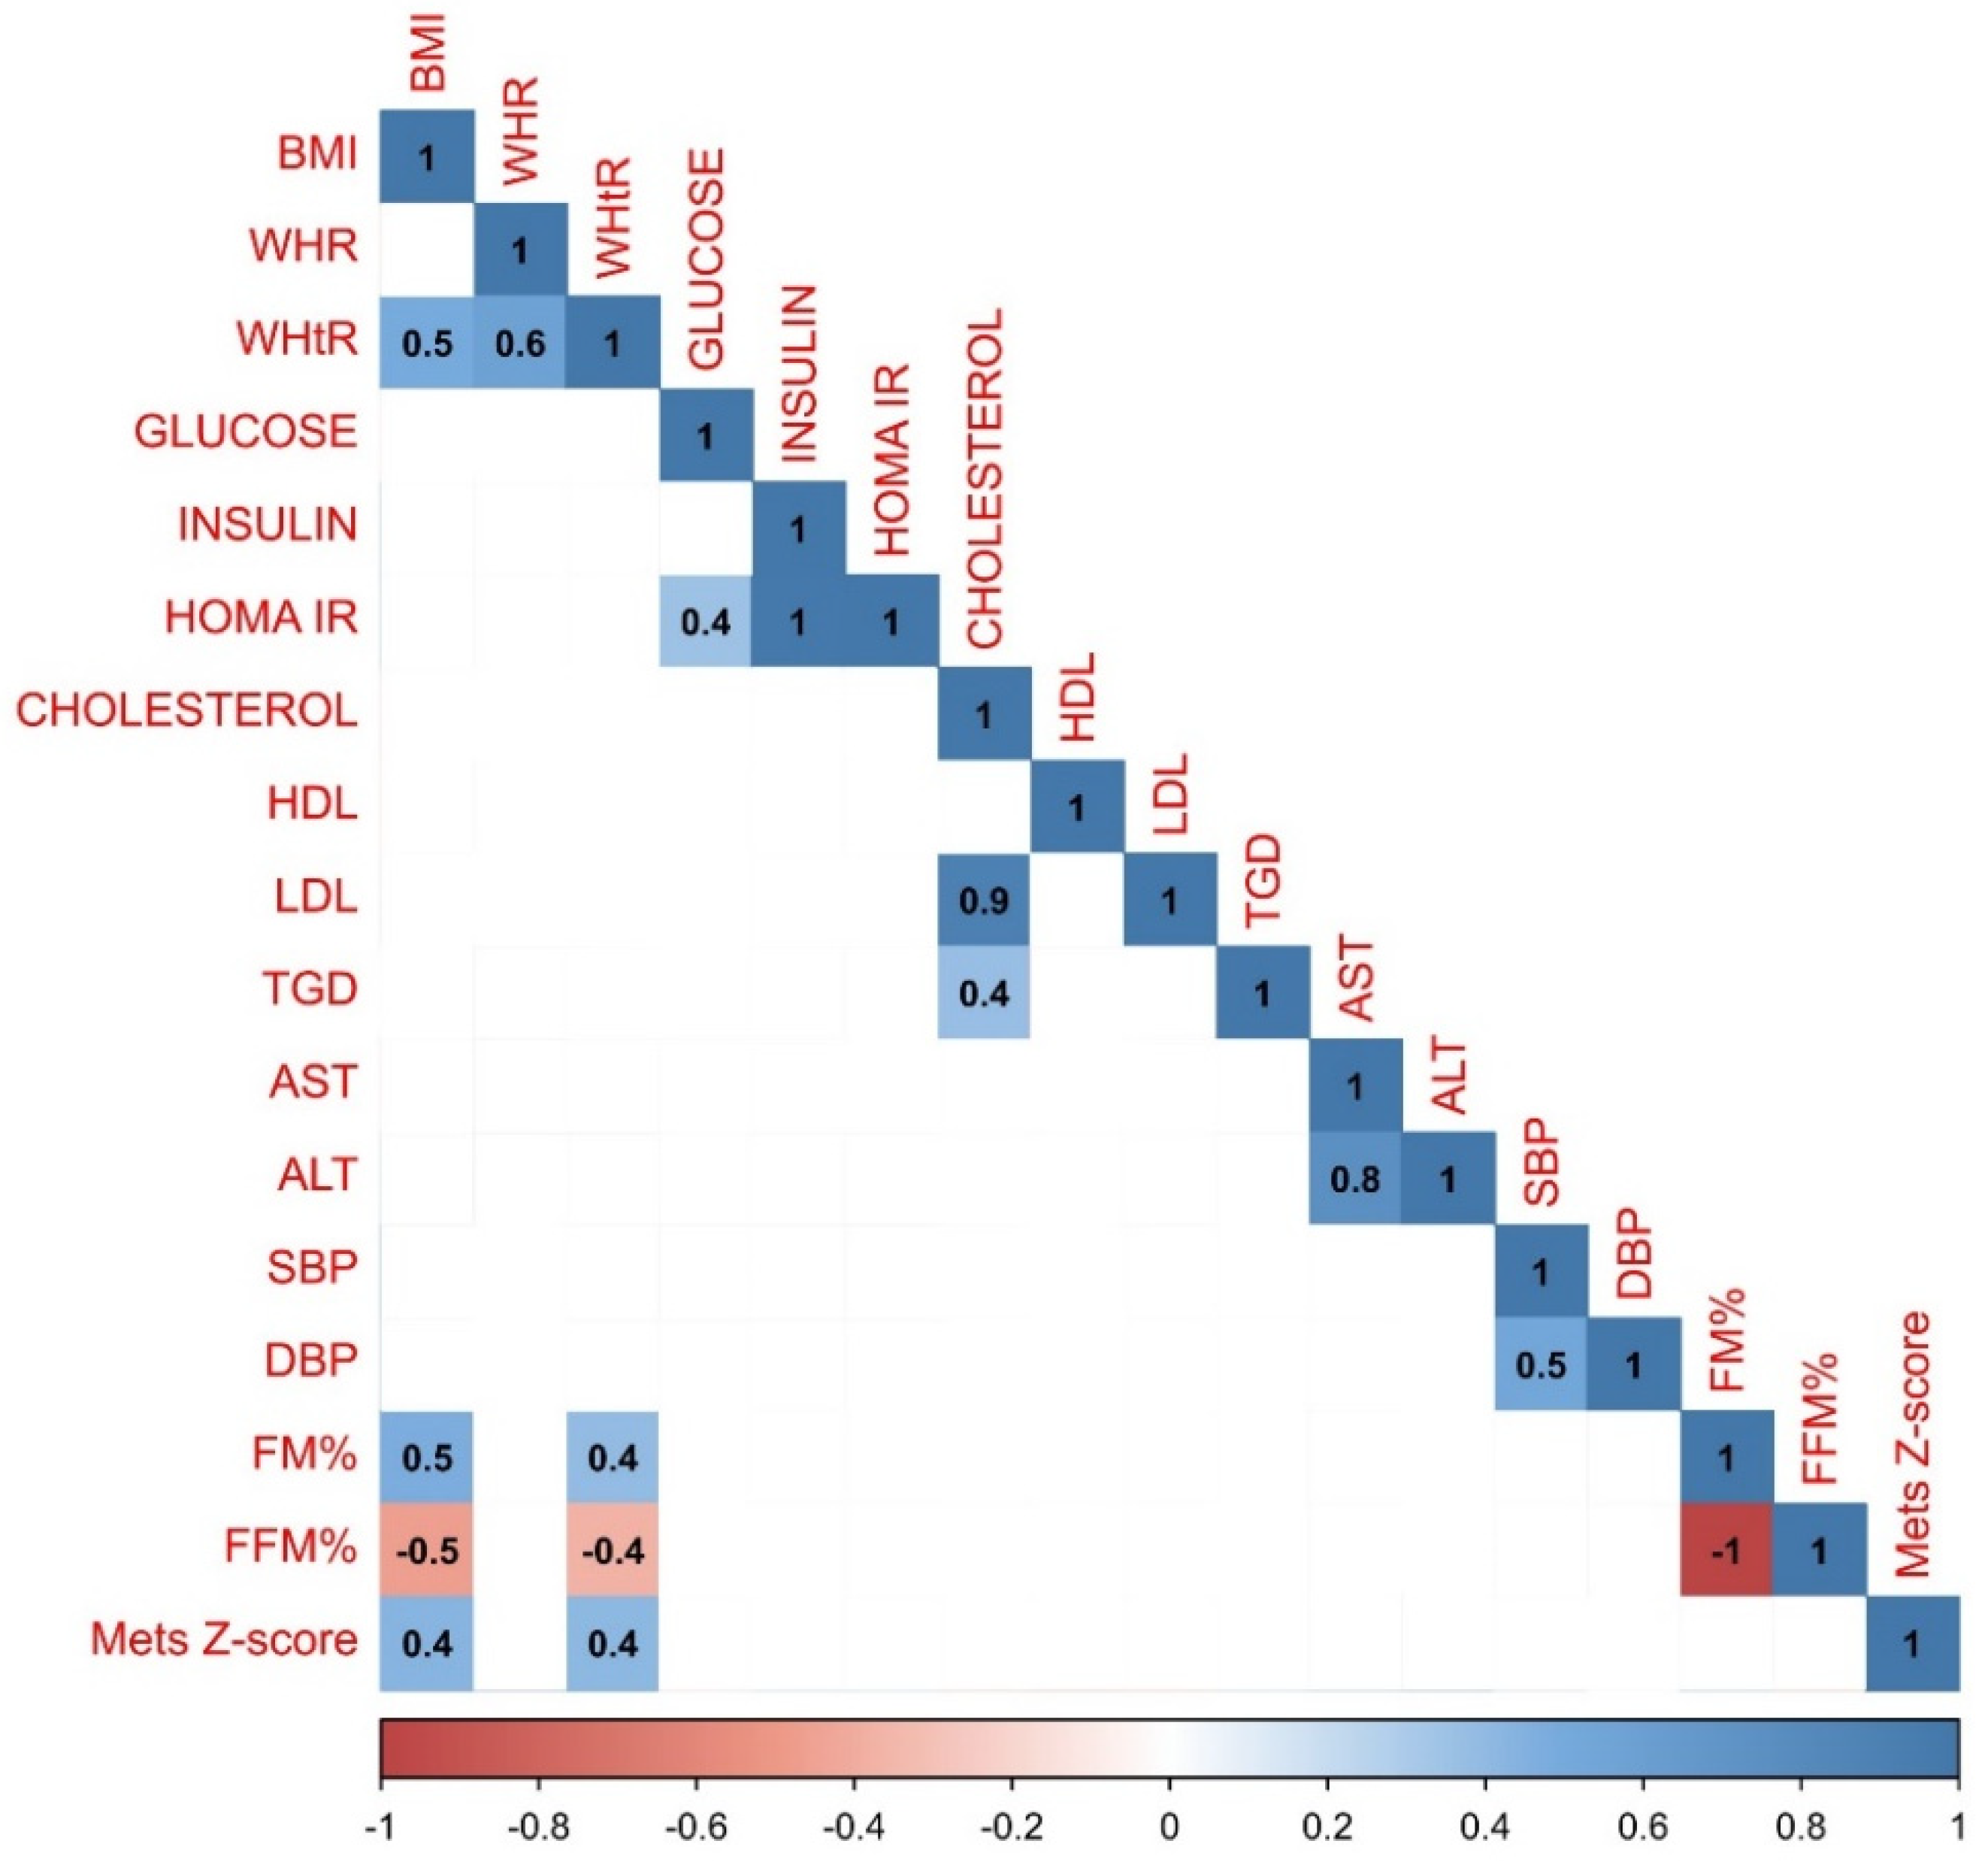
Figure 2.
Results of the statistical analysis performed on the girls population. Positive correlations between parameters were denoted in blue, with stronger correlations indicated by more intense blue coloring. Negative correlations were indicated in red, with more intense red coloring signifying stronger negative correlations between observed parameters.
Figure 2.
Results of the statistical analysis performed on the girls population. Positive correlations between parameters were denoted in blue, with stronger correlations indicated by more intense blue coloring. Negative correlations were indicated in red, with more intense red coloring signifying stronger negative correlations between observed parameters.
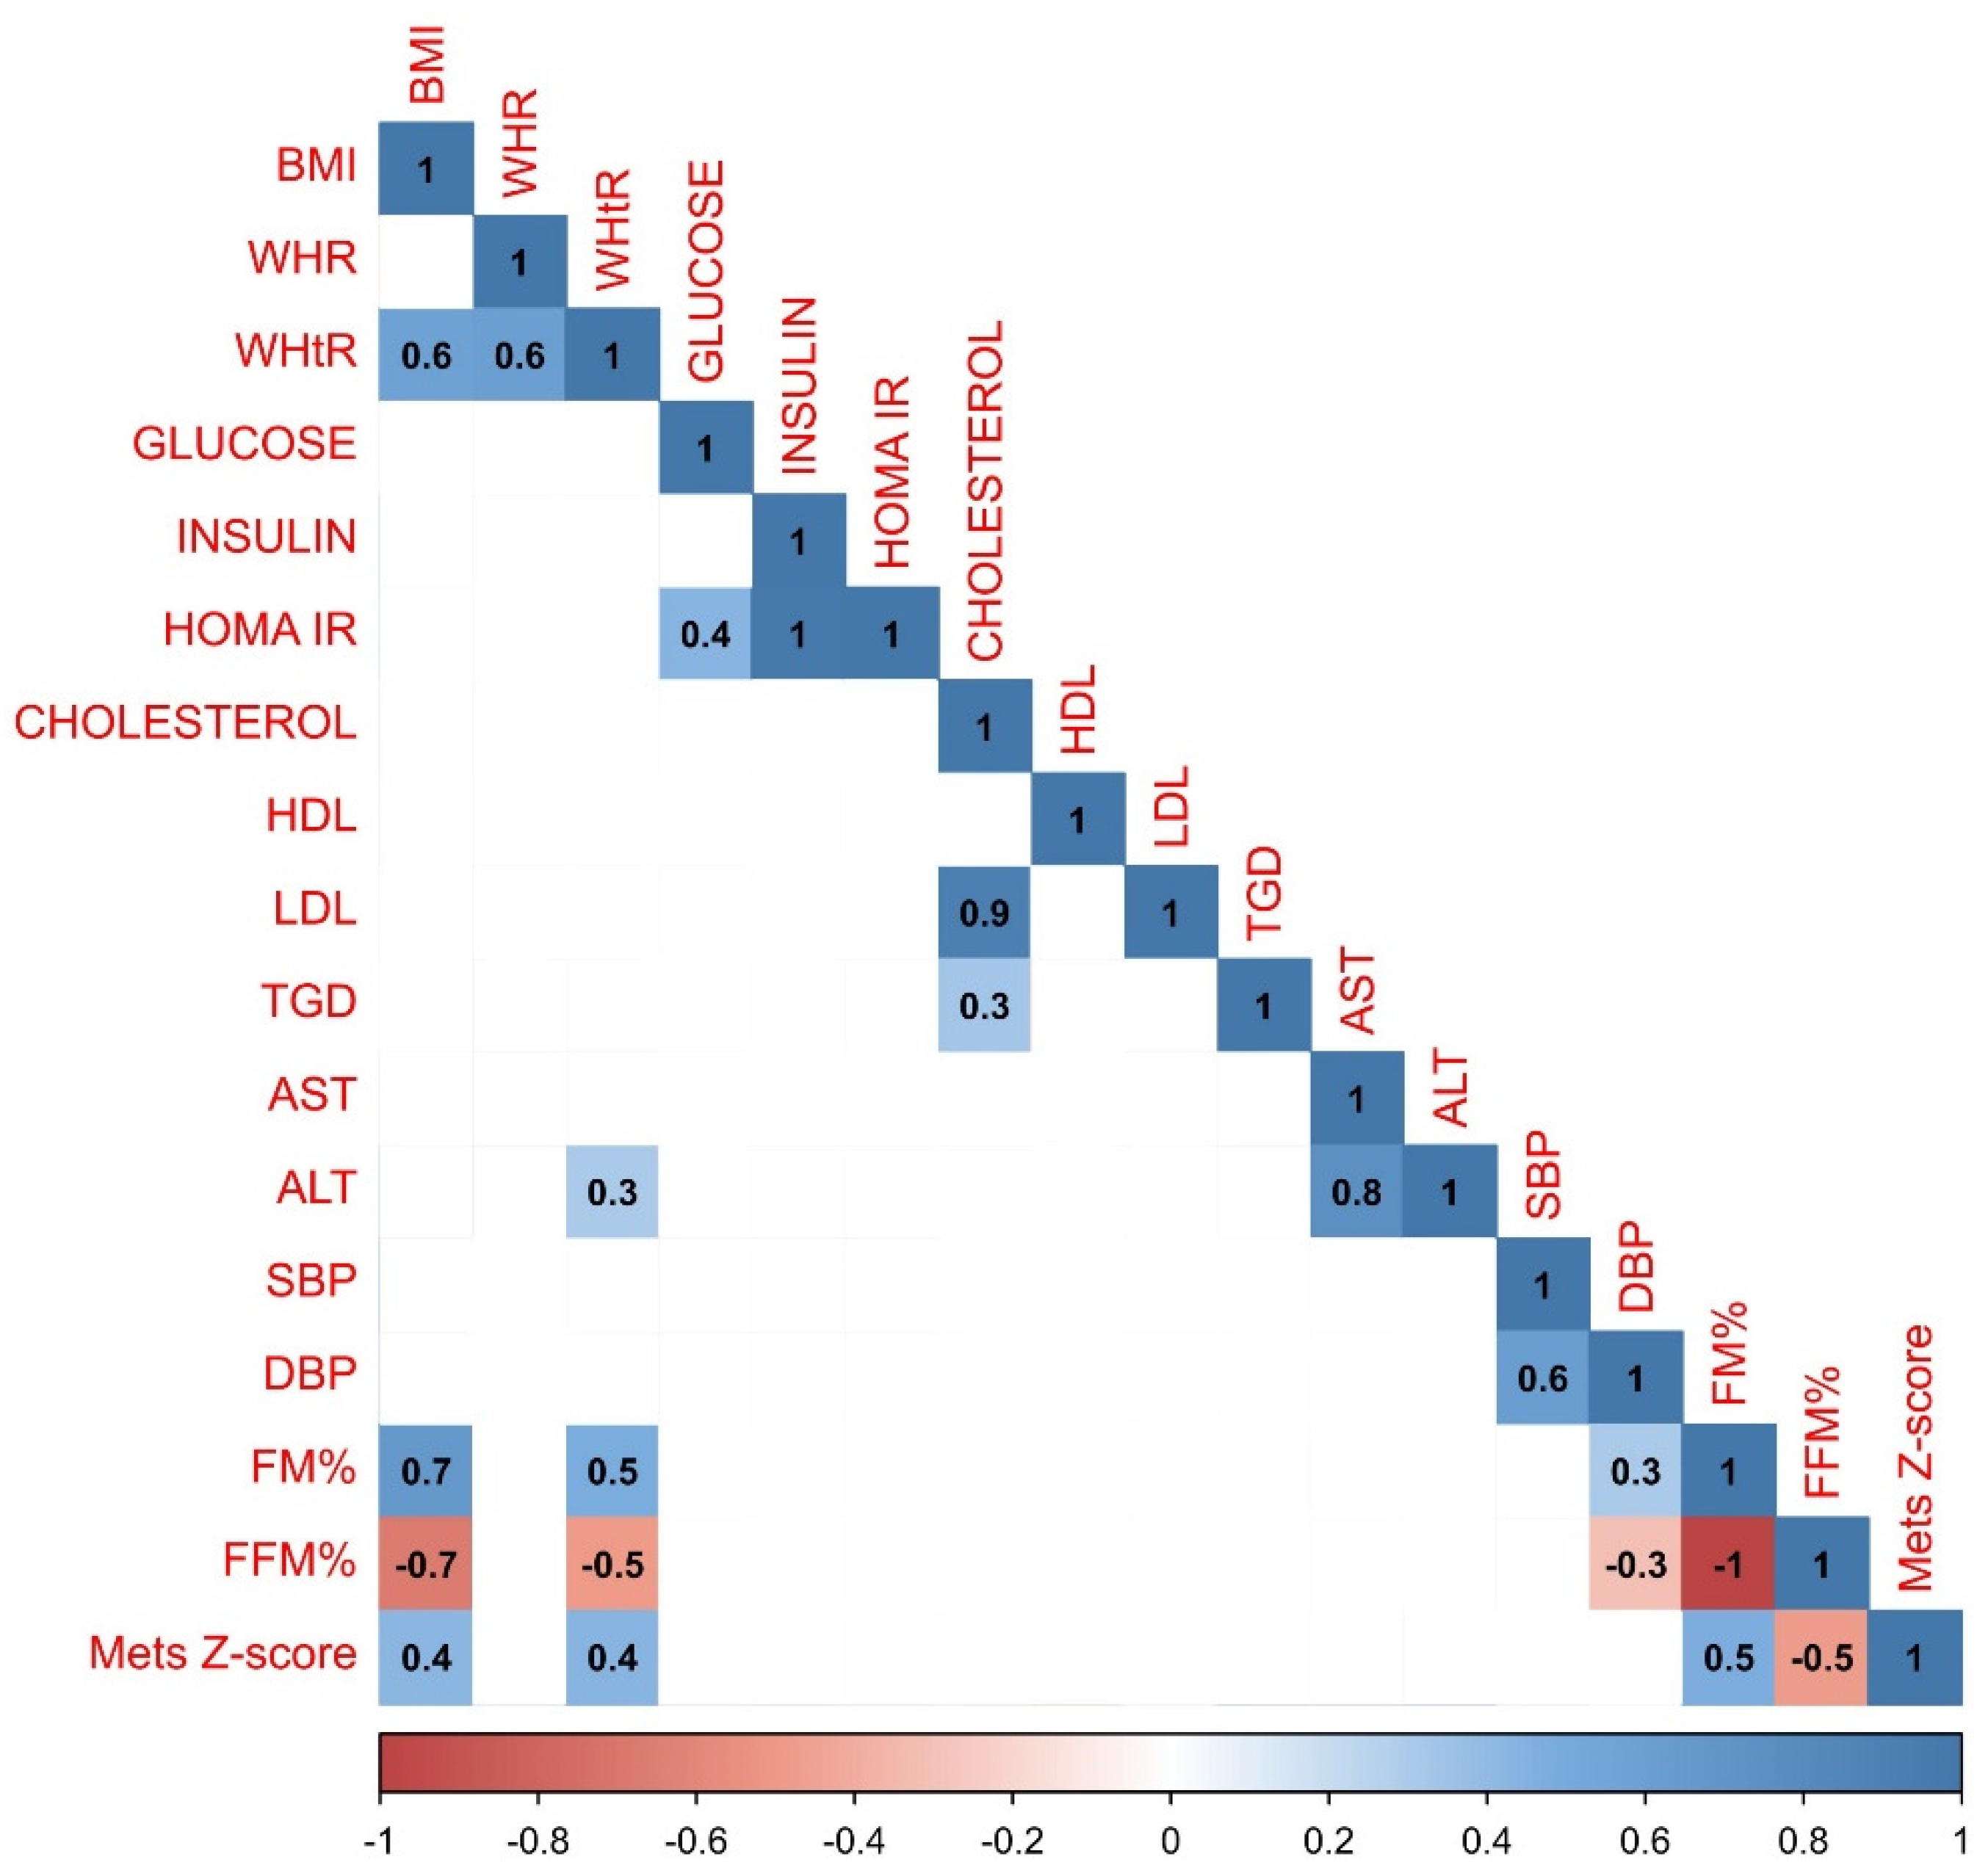
Figure 3.
Results of the statistical analysis performed on the boys population. Positive correlations between parameters were denoted in blue, with stronger correlations indicated by more intense blue coloring. Negative correlations were indicated in red, with more intense red coloring signifying stronger negative correlations between observed parameters.
Figure 3.
Results of the statistical analysis performed on the boys population. Positive correlations between parameters were denoted in blue, with stronger correlations indicated by more intense blue coloring. Negative correlations were indicated in red, with more intense red coloring signifying stronger negative correlations between observed parameters.
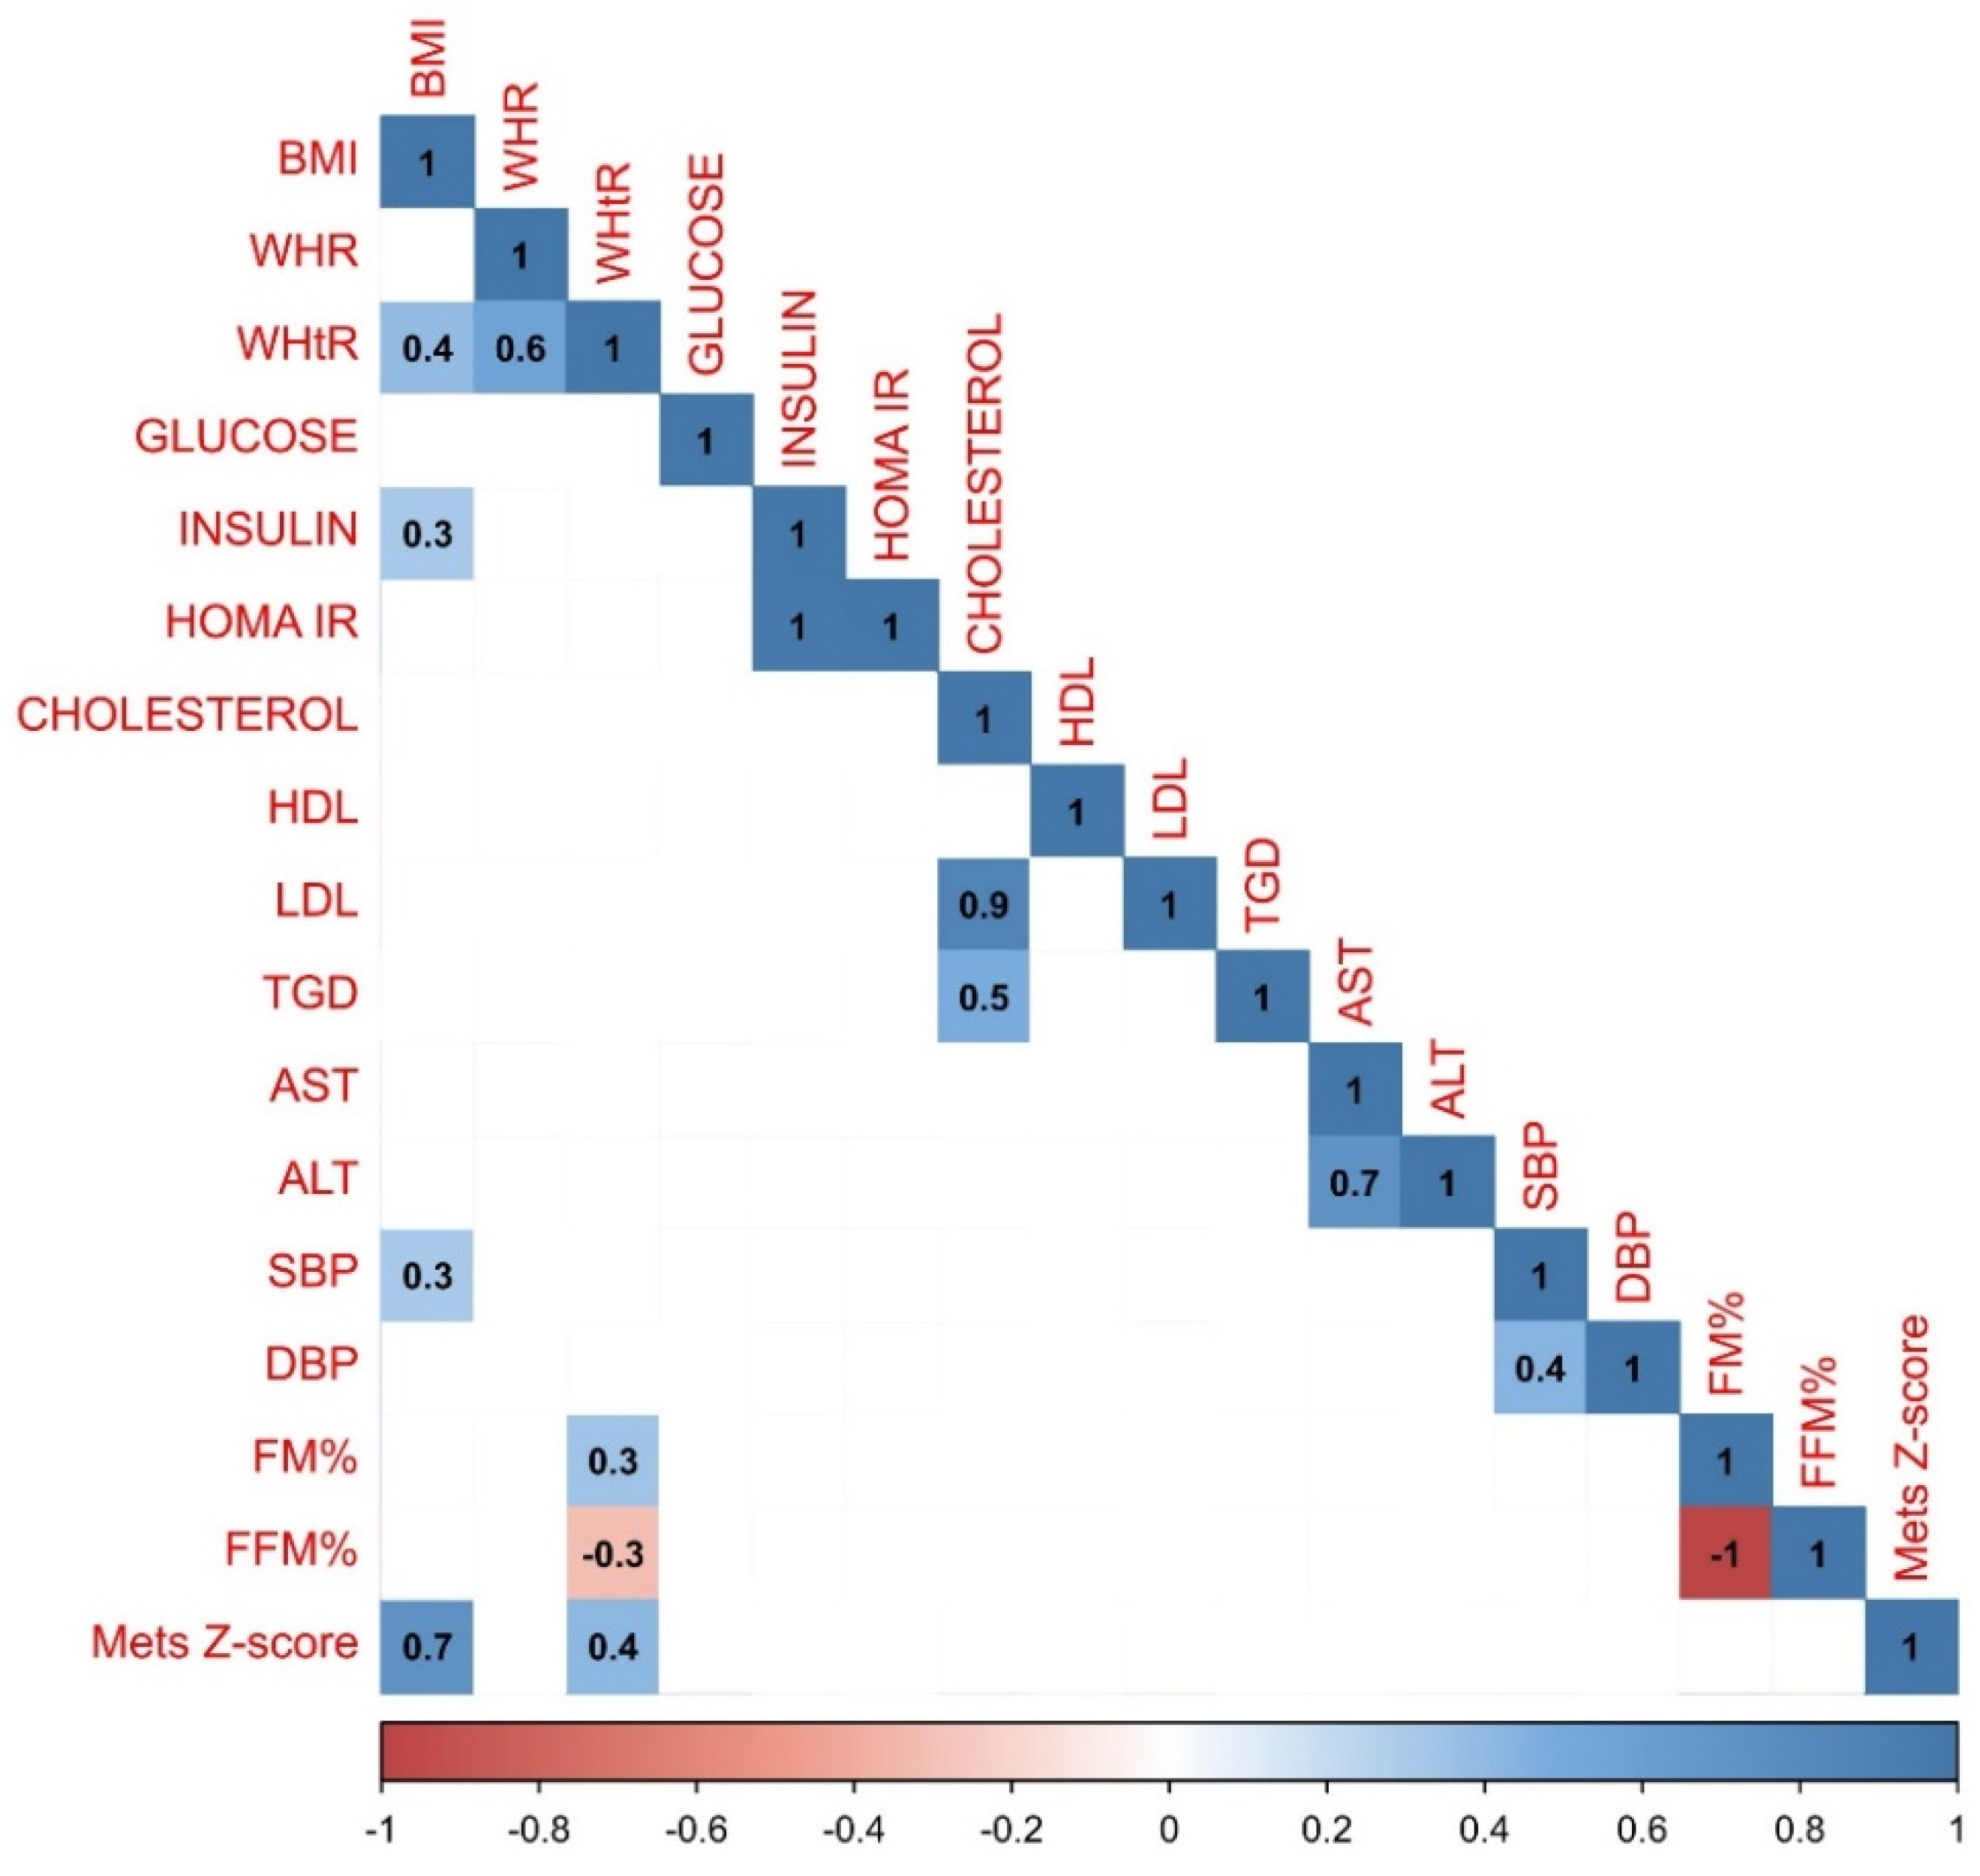
Figure 4.
Results of the statistical analysis performed on the population in the prepubertal period. Positive correlations between parameters were denoted in blue, with stronger correlations indicated by more intense blue coloring. Negative correlations were indicated in red, with more intense red coloring signifying stronger negative correlations between observed parameters.
Figure 4.
Results of the statistical analysis performed on the population in the prepubertal period. Positive correlations between parameters were denoted in blue, with stronger correlations indicated by more intense blue coloring. Negative correlations were indicated in red, with more intense red coloring signifying stronger negative correlations between observed parameters.
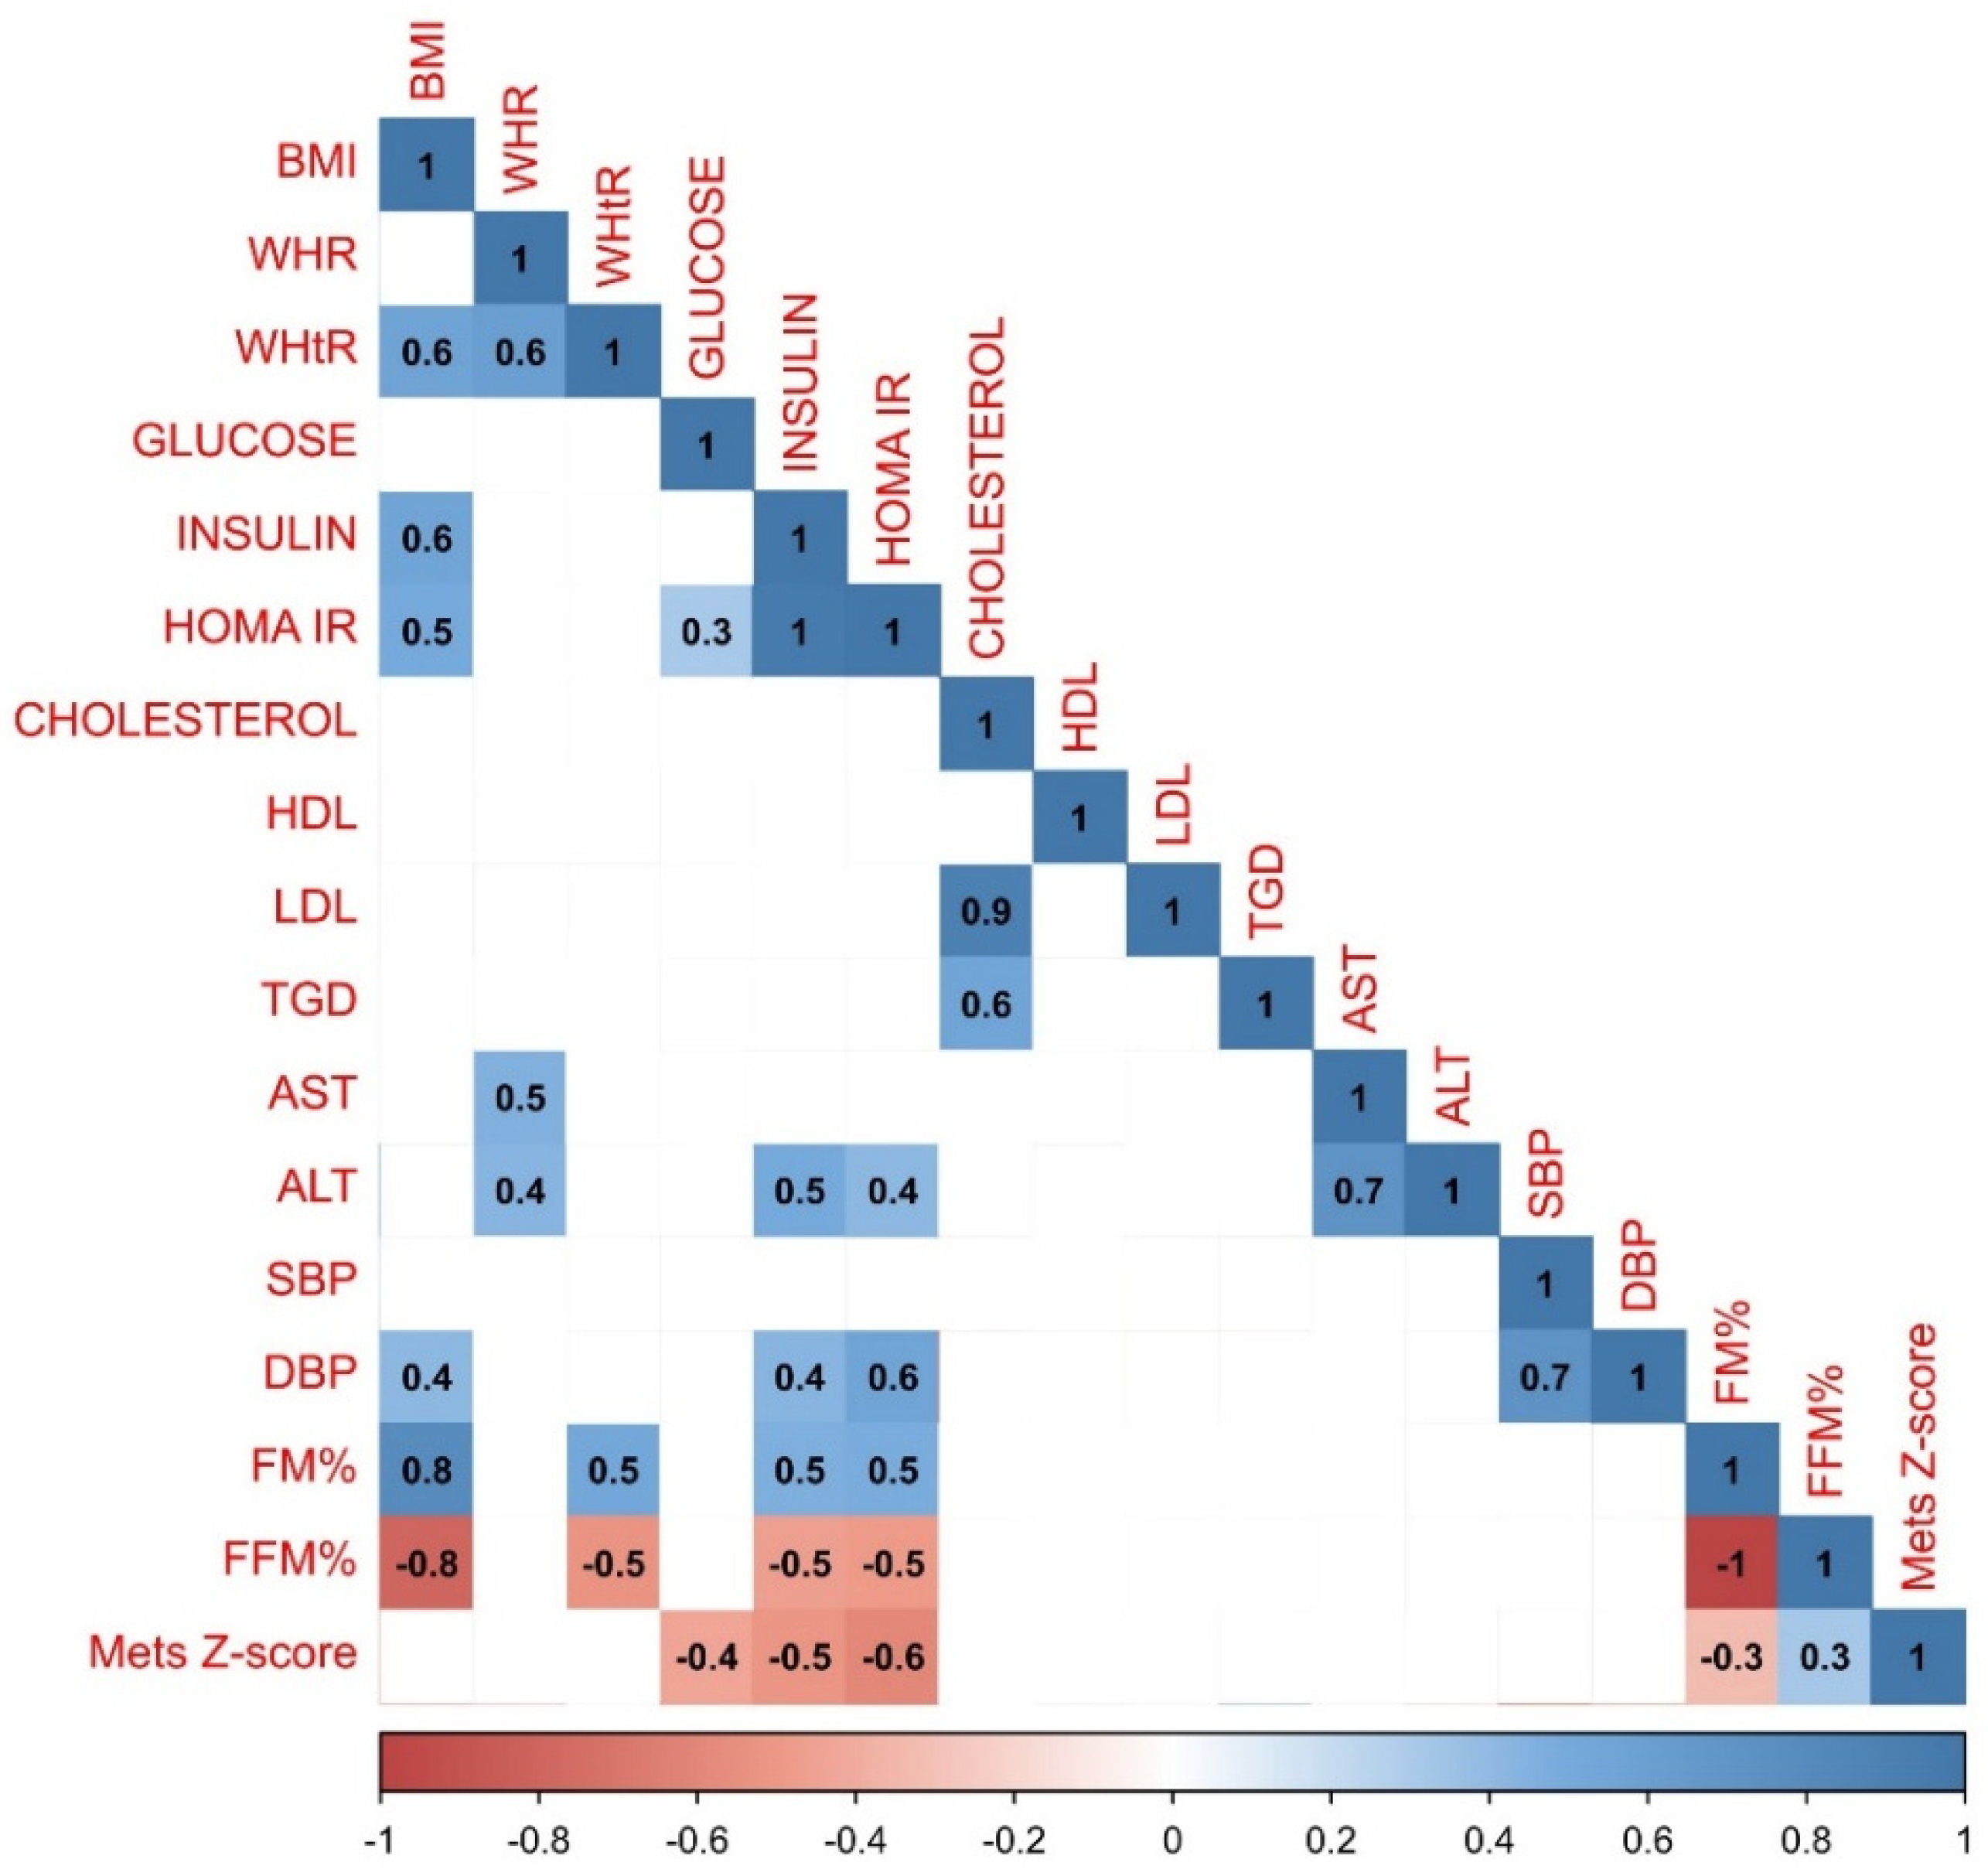
Figure 5.
Results of the statistical analysis performed on the population in the pubertal period. Positive correlations between parameters were denoted in blue, with stronger correlations indicated by more intense blue coloring. Negative correlations were indicated in red, with more intense red coloring signifying stronger negative correlations between observed parameters.
Figure 5.
Results of the statistical analysis performed on the population in the pubertal period. Positive correlations between parameters were denoted in blue, with stronger correlations indicated by more intense blue coloring. Negative correlations were indicated in red, with more intense red coloring signifying stronger negative correlations between observed parameters.
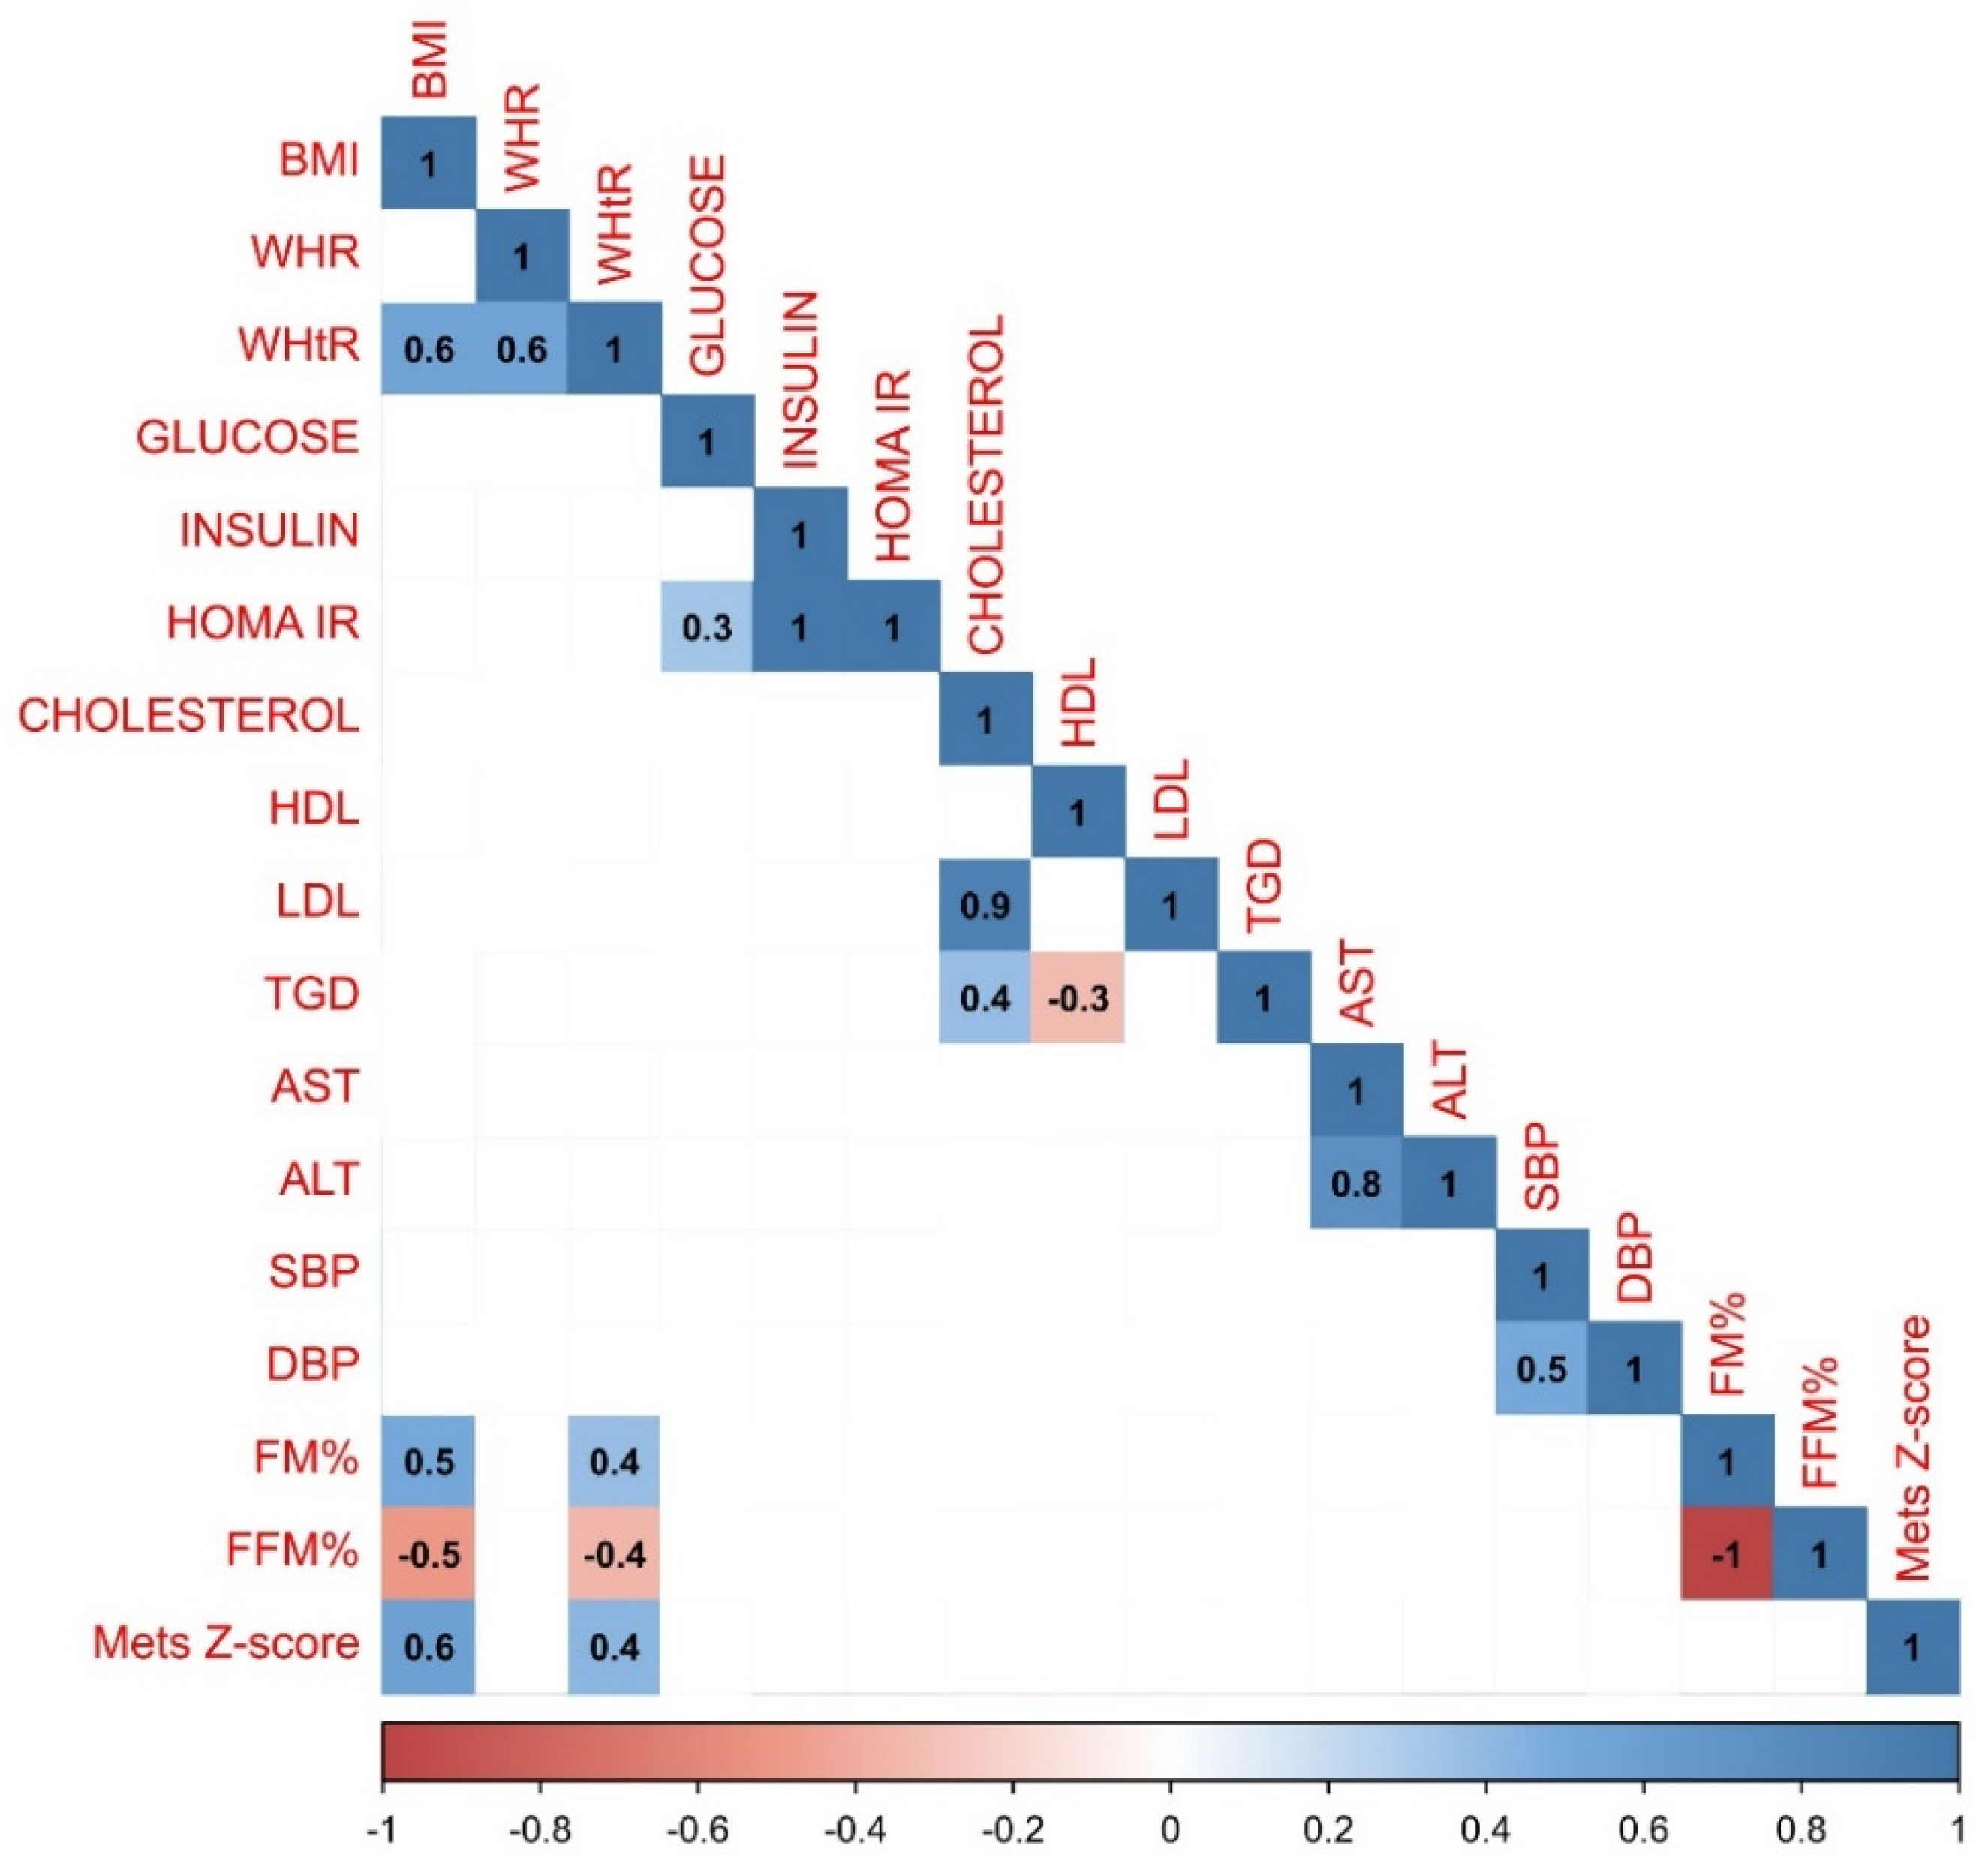

Table 1.
Selected characteristics and derived parameters of the whole study population. 1Range (Mean / SD), 2Wilcoxon rank sum test. Statistically significant correlations of the characteristics with the gender were marked in red (p<0.05).
Table 1.
Selected characteristics and derived parameters of the whole study population. 1Range (Mean / SD), 2Wilcoxon rank sum test. Statistically significant correlations of the characteristics with the gender were marked in red (p<0.05).
| Whole study population | Gender | ||||
|---|---|---|---|---|---|
| Characteristic | Available data | Overall, n=3471 | Girls, n=1851 |
Boys, n=1621 | p-value2 |
| Age | 347 | 0.8 - 18.9 (13.4 / 3.4) |
0.8 - 18.9 (13.7 / 3.4) |
0.8 - 18.6 (13.1 / 3.4) |
0.034 |
| BMI | 347 | 20.7 - 65.8 (40.1 / 5.9) |
20.7 - 57.1 (40.1 / 5.7) |
24.0 - 65.8 (40.1 / 6.1) |
0.5 |
| BMI Z-score | 340 | 1.7 - 5.5 (2.7 / 0.4) |
1.7 - 4.9 (2.6 / 0.3) |
2.1 - 5.5 (2.8 / 0.4) |
<0.001 |
| Unknown | 7 | 4 | 3 | ||
| Mets Z-score | 310 | 1.7 - 5.5 (2.7 / 0.3) |
1.7 - 3.2 (2.5 / 0.2) |
2.1 - 5.5 (2.8 / 0.4) |
<0.001 |
| Unknown | 37 | 19 | 18 | ||
| WHR | 340 | 0.5 - 4.5 (0.9 / 0.2) |
0.7 - 4.5 (0.9 / 0.3) |
0.5 - 1.2 (0.9 / 0.1) |
<0.001 |
| Unknown | 7 | 3 | 4 | ||
| WHtR | 340 | 0.3 - 1.0 (0.7 / 0.1) |
0.5 - 1.0 (0.7 / 0.1) |
0.3 - 1.0 (0.7 / 0.1) |
0.2 |
| Unknown | 7 | 3 | 4 | ||
| HOMA IR | 319 | 0.5 - 19.1 (6.4 / 3.6) |
1.2 - 19.1 (6.2 / 3.8) |
0.5 - 17.3 (6.7 / 3.5) |
0.057 |
| Unknown | 28 | 14 | 14 | ||
Table 2.
Selected characteristics and derived parameters of the whole study population. 1Range (Mean / SD), 2Wilcoxon rank sum test. Statistically significant correlations of the characteristics with the pubertal period were marked in red (p<0.05).
Table 2.
Selected characteristics and derived parameters of the whole study population. 1Range (Mean / SD), 2Wilcoxon rank sum test. Statistically significant correlations of the characteristics with the pubertal period were marked in red (p<0.05).
| Whole study population | Pubertal period | ||||
|---|---|---|---|---|---|
| Characteristic | Available data | Overall, n=3471 | Puberty, n=3011 |
Prepuberty, n=461 | p-value2 |
| Age | 347 | 0.8 - 18.9 (13.4 / 3.4) |
7.8 - 18.9 (14.4 / 2.0) |
0.8 - 14.3 (7.0 / 3.7) | <0.001 |
| BMI | 347 | 20.7 - 65.8 (40.1 / 5.9) |
25.5 - 65.8 (40.9 / 5.3) |
20.7 - 62.1 (34.9 / 6.9) | <0.001 |
| BMI Z-score | 340 | 1.7 - 5.5 (2.7 / 0.4) |
1.7 - 3.4 (2.6 / 0.2) |
2.5 - 5.5 (3.1 / 0.7) |
<0.001 |
| Unknown | 7 | 0 | 7 | ||
| Mets Z-score | 310 | 1.7 - 5.5 (2.7 / 0.3) |
1.7 - 3.4 (2.6 / 0.2) |
2.5 - 5.5 (3.0 / 0.6) |
<0.001 |
| Unknown | 37 | 25 | 12 | ||
| WHR | 340 | 0.5 - 4.5 (0.9 / 0.2) |
0.5 - 4.5 (0.9 / 0.2) |
0.5 - 1.2 (1.0 / 0.1) |
<0.001 |
| Unknown | 7 | 6 | 1 | ||
| WHtR | 340 | 0.3 - 1.0 (0.7 / 0.1) |
0.3 - 1.0 (0.7 / 0.1) |
0.4 - 0.9 (0.7 / 0.1) |
0.005 |
| Unknown | 7 | 6 | 1 | ||
| HOMA IR | 319 | 0.5 - 19.1 (6.4 / 3.6) |
1.2 - 19.1 (6.7 / 3.7) |
0.5 - 15.3 (4.8 / 2.9) |
0.002 |
| Unknown | 28 | 23 | 5 | ||
Table 3.
Results of biochemical and hormonal tests, blood pressure measurements and bioimpedance analysis parameters of the whole study population. Statistically significant correlations of the characteristics with the gender were marked in red (p<0.05). 1Range (Mean / SD), 2Wilcoxon rank sum test.
Table 3.
Results of biochemical and hormonal tests, blood pressure measurements and bioimpedance analysis parameters of the whole study population. Statistically significant correlations of the characteristics with the gender were marked in red (p<0.05). 1Range (Mean / SD), 2Wilcoxon rank sum test.
| Whole study population | Gender | ||||
|---|---|---|---|---|---|
| Characteristic | Available data | Overall, n=3471 | Girls , n=1851 |
Boys, n=1621 |
p-value2 |
| Glucose (mg/dl) | 338 | 63.0 - 123.3 (88.6 / 9.2) | 64.0 - 122.4 (87.6 / 9.0) |
63.0 - 123.3 (89.7 / 9.3) | 0.027 |
| Unknown | 9 | 3 | 6 | ||
| Insulin (µIU/ml) | 319 | 2.5 - 98.5 (29.0 / 15.6) | 5.9 - 98.5 (28.2 / 16.0) | 2.5 - 83.0 (30.0 / 15.0) | 0.093 |
| Unknown | 28 | 14 | 14 | ||
|
Cholesterol (mg/dl) |
336 | 82.5 - 307.0 (163.5 / 32.0) | 89.0 - 307.0 (163.7 / 31.1) | 82.5 - 237.0 (163.2 / 33.0) | 0.8 |
| Unknown | 11 | 6 | 5 | ||
|
HDL (mg/dl) |
335 | 25.0 - 64.0 (41.8 / 8.3) | 26.0 - 64.0 (42.6 / 8.5) | 25.0 - 59.2 (40.9 / 8.1) | 0.089 |
| Unknown | 12 | 6 | 6 | ||
|
LDL (mg/dl) |
334 | 34.9 - 225.0 (97.0 / 27.0) | 34.9 - 225.0 (97.6 / 26.8) | 44.8 - 161.0 (96.4 / 27.3) | 0.4 |
| Unknown | 13 | 8 | 5 | ||
|
TGD (mg/dl) |
332 | 10.5 - 597.0 (134.5 / 69.5) | 10.5 - 361.4 (124.0 / 52.5) | 40.0 - 597.0 (146.7 / 83.8) | 0.032 |
| Unknown | 15 | 6 | 9 | ||
|
ALT (U/l) |
341 | 7.5 - 194.0 (33.5 / 22.0) | 7.5 - 104.0 (28.8 / 15.9) | 10.9 - 194.0 (38.8 / 26.4) | <0.001 |
| Unknown | 6 | 3 | 3 | ||
|
AST (U/l) |
329 | 8.9 - 93.8 (27.5 / 11.6) | 8.9 - 66.9 (25.1 / 9.9) | 14.0 - 93.8 (30.1 / 12.7) | <0.001 |
| Unknown | 18 | 11 | 7 | ||
|
SBP (mmHG) |
323 | 70.0 - 186.0 (134.9 / 15.3) | 100.0 - 186.0 (133.1 / 15.4) | 70.0 - 174.0 (137.0 / 15.0) | 0.007 |
| Unknown | 24 | 13 | 11 | ||
|
DBP (mmHg) |
323 | 40.0 - 118.0 (80.5 / 10.7) | 56.0 - 110.0 (80.9 / 10.0) | 40.0 - 118.0 (80.1 / 11.5) | 0.7 |
| Unknown | 24 | 13 | 11 | ||
|
Fat mass (%) |
275 | 14.7 - 68.0 (46.8 / 7.1) | 32.7 - 68.0 (48.5 / 6.1) | 14.7 - 62.2 (44.8 / 7.7) | <0.001 |
| Unknown | 72 | 38 | 34 | ||
| Fat free mass (%) | 274 | 32.0 - 85.3 (53.2 / 7.2) | 32.0 - 67.3 (51.5 / 6.2) | 37.8 - 85.3 (55.2 / 7.7) | <0.001 |
| Unknown | 73 | 39 | 34 | ||
Table 4.
Results of biochemical and hormonal tests, blood pressure measurements and bioimpedance analysis parameters of the whole study population. Statistically significant correlations of the characteristics with pubertal period were marked in red (p<0.05). 1Range (Mean / SD), 2Wilcoxon rank sum test.
Table 4.
Results of biochemical and hormonal tests, blood pressure measurements and bioimpedance analysis parameters of the whole study population. Statistically significant correlations of the characteristics with pubertal period were marked in red (p<0.05). 1Range (Mean / SD), 2Wilcoxon rank sum test.
| Whole study population | Pubertal period | ||||
|---|---|---|---|---|---|
| Characteristic | Available data | Overall, n=3471 | Puberty, n=3011 | Prepuberty, n=461 |
p-value2 |
| Glucose (mg/dl) | 338 | 63.0 - 123.3 (88.6 / 9.2) | 64.0 - 123.3 (88.8 / 8.9) | 63.0 - 122.4 (87.4 / 11.0) | 0.2 |
| Unknown | 9 | 8 | 1 | ||
| Insulin (µIU/ml) | 319 | 2.5 - 98.5 (29.0 / 15.6) | 6.1 - 98.5 (30.1 / 15.7) | 2.5 - 63.2 (21.8 / 12.3) | 0.001 |
| Unknown | 28 | 23 | 5 | ||
|
Cholesterol (mg/dl) |
336 | 82.5 - 307.0 (163.5 / 32.0) | 82.5 - 248.7 (162.8 / 31.1) | 103.0 - 307.0 (168.0 / 37.6) | 0.5 |
| Unknown | 11 | 8 | 3 | ||
|
HDL (mg/dl) |
335 | 25.0 - 64.0 (41.8 / 8.3) | 25.0 - 64.0 (41.8 / 8.3) | 25.3 - 58.0 (42.1 / 8.4) | 0.7 |
| Unknown | 12 | 9 | 3 | ||
|
LDL (mg/dl) |
334 | 34.9 - 225.0 (97.0 / 27.0) | 34.9 - 161.0 (96.5 / 25.9) | 35.9 - 225.0 (100.3 / 33.9) | 0.7 |
| Unknown | 13 | 10 | 3 | ||
|
TGD (mg/dl) |
332 | 10.5 - 597.0 (134.5 / 69.5) | 10.5 - 597.0 (134.6 / 70.4) | 46.7 - 335.0 (133.6 / 63.8) | >0.9 |
| Unknown | 15 | 12 | 3 | ||
|
ALT (U/l) |
341 | 7.5 - 194.0 (33.5 / 22.0) | 7.5 - 194.0 (33.0 / 21.8) | 10.9 - 133.0 (36.6 / 23.2) | 0.2 |
| Unknown | 6 | 6 | 0 | ||
|
AST (U/l) |
329 | 8.9 - 93.8 (27.5 / 11.6) | 8.9 - 93.8 (26.5 / 11.1) | 16.0 - 84.0 (33.6 / 12.6) | <0.001 |
| Unknown | 18 | 16 | 2 | ||
|
SBP (mmHG) |
323 | 70.0 - 186.0 (134.9 / 15.3) | 100.0 - 186.0 (136.2 / 14.7) | 70.0 - 174.0 (125.0 / 16.3) | <0.001 |
| Unknown | 24 | 15 | 9 | ||
|
DBP (mmHg) |
323 | 40.0 - 118.0 (80.5 / 10.7) | 40.0 - 118.0 (81.1 / 10.2) | 40.0 - 116.0 (76.4 / 13.6) | 0.023 |
| Unknown | 24 | 15 | 9 | ||
|
Fat mass (%) |
275 | 14.7 - 68.0 (46.8 / 7.1) | 14.7 - 68.0 (46.7 / 7.1) | 25.2 - 61.5 (48.2 / 8.1) | 0.2 |
| Unknown | 72 | 50 | 22 | ||
| Fat free mass (%) | 274 | 32.0 - 85.3 (53.2 / 7.2) | 32.0 - 85.3 (53.4 / 7.1) | 38.5 - 74.8 (51.8 / 8.1) | 0.2 |
| Unknown | 73 | 51 | 22 | ||
Table 5.
Selected characteristics and derived parameters of the children who have entered puberty. 1Range (Mean / SD), 2Wilcoxon rank sum test. Statistically significant correlations of the characteristics with the gender were marked in red (p<0.05).
Table 5.
Selected characteristics and derived parameters of the children who have entered puberty. 1Range (Mean / SD), 2Wilcoxon rank sum test. Statistically significant correlations of the characteristics with the gender were marked in red (p<0.05).
| Children in pubertal period | Gender | ||||
|---|---|---|---|---|---|
| Characteristic | Available data | Overall, n=3011 | Girls, n=1721 |
Boys, n=1291 | p-value2 |
| Age | 301 | 7.8 - 18.9 (14.4 / 2.0) | 7.8 - 18.9 (14.4 / 2.2) |
10.3 - 18.6 (14.4 / 1.8) | 0.6 |
| BMI | 301 | 25.5 - 65.8 (40.9 / 5.3) | 25.5 - 57.1 (40.8 / 5.1) |
30.0 - 65.8 (41.0 / 5.6) | 0.8 |
| BMI Z-score | 301 | 1.7 - 3.4 (2.6 / 0.2) |
1.7 - 3.0 (2.5 / 0.2) |
2.1 - 3.4 (2.7 / 0.2) |
<0.001 |
| Mets Z-score | 276 | 1.7 - 3.4 (2.6 / 0.2) | 1.7 - 3.0 (2.5 / 0.2) |
2.1 - 3.4 (2.7 / 0.2) |
<0.001 |
| Unknown | 25 | 13 | 12 | ||
| WHR | 295 | 0.5 - 4.5 (0.9 / 0.2) |
0.7 - 4.5 (0.9 / 0.3) |
0.5 - 1.2 (0.9 / 0.1) |
<0.001 |
| Unknown | 6 | 3 | 3 | ||
| WHtR | 295 | 0.3 - 1.0 (0.7 / 0.1) |
0.5 - 1.0 (0.7 / 0.1) |
0.3 - 1.0 (0.7 / 0.1) |
0.2 |
| Unknown | 6 | 3 | 3 | ||
| HOMA IR | 278 | 1.2 - 19.1 (6.7 / 3.7) | 1.2 - 19.1 (6.3 / 3.8) |
2.1 - 17.3 (7.2 / 3.5) | 0.007 |
| Unknown | 23 | 11 | 12 | ||
Table 6.
Results of biochemical and hormonal tests, blood pressure measurements and bioimpedance analysis parameters of the children who have entered puberty. Statistically significant correlations of the characteristics with the gender were marked in red (p<0.05). 1Range (Mean / SD), 2Wilcoxon rank sum test.
Table 6.
Results of biochemical and hormonal tests, blood pressure measurements and bioimpedance analysis parameters of the children who have entered puberty. Statistically significant correlations of the characteristics with the gender were marked in red (p<0.05). 1Range (Mean / SD), 2Wilcoxon rank sum test.
| Children in pubertal period | Gender | ||||
|---|---|---|---|---|---|
| Characteristic | Available data | Overall, n=3011 | Girls, n=1721 | Boys, n=1291 |
p-value2 |
|
Glucose (mg/dl) |
293 | 64.0 - 123.3 (88.8 / 8.9) | 64.0 - 117.0 (87.5 / 8.7) | 72.7 - 123.3 (90.5 / 9.0) | 0.006 |
| Unknown | 8 | 3 | 5 | ||
|
Insulin (µIU/ml) |
278 | 6.1 - 98.5 (30.1 / 15.7) |
6.1 - 98.5 (28.7 / 16.1) | 9.9 - 83.0 (32.0 / 15.0) | 0.016 |
| Unknown | 23 | 11 | 12 | ||
|
Cholesterol (mg/dl) |
293 | 82.5 - 248.7 (162.8 / 31.1) | 89.0 - 248.7 (163.4 / 29.6) | 82.5 - 237.0 (162.1 / 33.0) | 0.5 |
| Unknown | 8 | 5 | 3 | ||
|
HDL (mg/dl) |
292 | 25.0 - 64.0 (41.8 / 8.3) | 26.0 - 64.0 (42.9 / 8.5) | 25.0 - 59.2 (40.4 / 8.0) | 0.020 |
| Unknown | 9 | 5 | 4 | ||
|
LDL (mg/dl) |
291 | 34.9 - 161.0 (96.5 / 25.9) | 34.9 - 157.9 (97.2 / 25.0) | 44.8 - 161.0 (95.7 / 27.0) | 0.3 |
| Unknown | 10 | 7 | 3 | ||
|
TGD (mg/dl) |
288 | 32.9 - 597.0 (135.0 / 70.2) | 32.9 - 361.4 (124.4 / 50.5) | 40.0 - 597.0 (149.6 / 88.5) | 0.047 |
| Unknown | 13 | 6 | 7 | ||
|
ALT (U/l) |
295 | 7.5 - 194.0 (33.0 / 21.8) | 7.5 - 104.0 (28.9 / 16.4) | 11.8 - 194.0 (38.5 / 26.5) | <0.001 |
| Unknown | 6 | 3 | 3 | ||
|
AST (U/l) |
285 | 8.9 - 93.8 (26.5 / 11.1) | 8.9 - 66.9 (24.7 / 9.6) | 14.0 - 93.8 (28.9 / 12.4) | <0.001 |
| Unknown | 16 | 10 | 6 | ||
|
SBP (mmHG) |
286 | 100.0 - 186.0 (136.2 / 14.7) | 100.0 - 186.0 (133.8 / 15.3) | 111.0 - 174.0 (139.4 / 13.4) | <0.001 |
| Unknown | 15 | 8 | 7 | ||
|
DBP (mmHg) |
286 | 40.0 - 118.0 (81.1 / 10.2) | 56.0 - 110.0 (81.1 / 10.0) | 40.0 - 118.0 (81.0 / 10.5) | 0.9 |
| Unknown | 15 | 8 | 7 | ||
|
Fat mass (%) |
251 | 14.7 - 68.0 (46.7 / 7.1) | 32.7 - 68.0 (48.7 / 6.2) | 14.7 - 62.2 (44.1 / 7.3) | <0.001 |
| Unknown | 50 | 30 | 20 | ||
|
Fat free mass (%) |
250 | 32.0 - 85.3 (53.4 / 7.1) | 32.0 - 67.3 (51.3 / 6.2) | 37.8 - 85.3 (56.0 / 7.3) | <0.001 |
| Unknown | 51 | 31 | 20 | ||
Disclaimer/Publisher’s Note: The statements, opinions and data contained in all publications are solely those of the individual author(s) and contributor(s) and not of MDPI and/or the editor(s). MDPI and/or the editor(s) disclaim responsibility for any injury to people or property resulting from any ideas, methods, instructions or products referred to in the content. |
© 2024 by the authors. Licensee MDPI, Basel, Switzerland. This article is an open access article distributed under the terms and conditions of the Creative Commons Attribution (CC BY) license (http://creativecommons.org/licenses/by/4.0/).
Copyright: This open access article is published under a Creative Commons CC BY 4.0 license, which permit the free download, distribution, and reuse, provided that the author and preprint are cited in any reuse.