
Submitted:
09 August 2024
Posted:
12 August 2024
You are already at the latest version
Preprints on COVID-19 and SARS-CoV-2
Abstract
[3:46 PM] Anahita Zahertar
This research explores the factors influencing bikeshare usage durations in the Detroit Metropolitan Area over two years, focusing on spatial, temporal, and COVID-19-related variables. Using a fully parametric hazard-based duration model with random parameters, we address data heterogeneity and uncover how different conditions affect bikeshare trips. Our findings reveal that a) intense environmental factors such as high traffic stress, poor weather, and high COVID-19 risk levels are associated with shorter trip durations b) in contrast, supportive initiatives like memberships, an affordable $5 Access Pass, a free one-month pass during the pandemic, and the introduction of new stations have been more likely to encourage longer rides c) furthermore, the study examines how variables like gym closures due to the pandemic, evening hours, and the addition of new stations, which were set as random variables in our model, exhibit both positive and negative relationships with ride durations. A key finding is the 20-minute mark in ride durations, which helps understand user behaviors and trip purposes. This insight aids urban planning by suggesting strategic bike station placements to enhance bikeshare system efficiency and meet diverse community needs. This study not only deepens our understanding of urban mobility dynamics but also underscores the effectiveness of adaptive strategies in promoting sustainable urban transportation.
Keywords:
bikeshare
; covid-19
; survivalanalysis
; urbanmobility
; riderbehavior
1. Introduction
The last decade has seen a sharp increase in the popularity of micro-mobility including bikeshare services in the United States. These services allow users to ride a bike for short trips without having a need to own a bike and get involved with its maintenance. Some of the biggest USA cities such as New York, Boston and Washington D.C. have launched their bikeshare system in the early 2010s, encouraging more cities to have their own bikeshare system. Biking is an attractive mode of transportation due to its ease of use, affordable price, and being faster than some other transportation modes such as walking and e-scooters. Many spatiotemporal factors, and abrupt events such as COVID-19 pandemic have an impact on the ridership and user behavior as well. It is important to understand these underlying factors to improve the current bikeshare systems, and infrastructure of the cities to get prepared for other unexpected events.
The last months of 2019 have seen the spread of one of the biggest health disasters of the last decades, the Coronavirus disease also known as COVID-19. This pandemic quickly spread across the globe, infecting many people, and causing a high number of deaths: As of April 29th, 2021, the number of reported COVID cases in the U.S. is 32 million, and the death toll is over 570,000 [1]. Most governments in the world have imposed travel restrictions within and inter countries to limit the spread, such as stay-at-home orders and border closures. These impacted the way people travel and behave in their everyday lives: transportation modes disregarding the social distance, such as bus or taxis, were not recommended as they increase the risk of exposure [2]. Biking is one of the possible alternatives, where safe distances with other people are in place.
While it is hard to monitor and obtain data for private bike usage, it is easier to analyze data from bikeshare services. This data includes useful spatiotemporal information that combined with other interesting factors, make it appealing to see what impacts does using bikeshare services have. Bikeshare usage has changed during the pandemic, and this study tries to shed some light on what impact COVID-19 and other spatiotemporal factors might have on the bikeshare trip duration along with rider behavior using hazard-based duration models.
While numerous studies have examined the impact of COVID-19 on urban mobility, our research goes further by analyzing two years of bikeshare ride data in the Detroit Metropolitan Area, incorporating a wide range of variables beyond the pandemic. We explore parameters such as trips that start and end at the same station, promotional passes like the Access Pass for low-income users, and free monthly passes.
Our use of hazard-based duration models, commonly applied in various disciplines, is enhanced by a random parameter model to address unobserved heterogeneity. This comprehensive approach allows us to assess the impacts of COVID-19 alongside other influential temporal and spatial factors, providing deep insights for urban planners and policymakers to enhance bikeshare systems and promote sustainable urban transportation.
It is particularly interesting to study these effects in Detroit, a city recognized for its strong automobile industry and history. Detroit was the first city in Michigan to implement a bikeshare system, launching an initial service in 2013 [3]. The City’s current system, MoGo (a portmanteau of Motor City and Go), was launched in 2017.
2. Literature Review
2.1. Bikeshare History
Bikeshare systems are widely deployed in most countries around the world nowadays. It took three bikeshare generations and over 55 years to obtain the current bikeshare services. The first existing bikeshare system was the White Bikes in Amsterdam during the year 1965 [4]. Ordinary bikes were painted in white and were left free for use by any user. A few decades later, in 1991, the second generation was born in Denmark, with small systems consisting of 26 bikes and 4 stations [5]. In 1996, the third generation of bikeshare systems appeared, with the Bikeabout service at Portsmouth University in England, which added a magnetic card to rent a bike [4]. The first two decades of the twenty-first century have seen a big interest in the bikeshare concept in Europe, and many important cities have started implementing their own system. One of the most notable BSS is Paris’ Vélib, which started in 2007 with 7,000 bikes, and has increased to more than 20,000 bikes, of which 35% are electric [6]. While some cities in the U.S.A. have implemented their own bikeshare system since the end of the twentieth century, the creation of the first fourth generation BSS was made in August 2008 in Washington DC, with 120 bicycles and 10 stations [7]. This system evolved in 2010 to become the Capital Bikeshare system. Starting 2010, more US cities have shown interest in creating their own bikeshare system. New York City launched its Citi Bike NYC system in 2013, with 6,000 bikes divided into hundreds of stations [8]. Each year, US citizens are more likely to use BSS, with a ridership count that has exponentially grown from 320,000 in 2010 up to twenty-eight million in 2016 [9]. In Michigan, bikeshare arrived in 2013 shortly after the New York City bikeshare system launched. Detroit was the first city to propose a system, with sixty bikes and nine racks in downtown Detroit [3]. Other Michigan cities have launched their own systems, with a small number of bikes and stations. It was during 2017 that Detroit decided to launch their new and bigger bikeshare system called MoGo. It had 430 bikes divided in forty-three stations throughout ten neighborhoods [10]. As of May 2020, MoGo has expanded its fleet to 620 bikes and seventy-five stations across the six Metro Detroit cities.
2.2. Analyzing Bikeshare Services
The use of bikeshare systems can depend on a variety of socioeconomic and demographic characteristics. Many studies have focused on which of these characteristics best describes the population using bikeshare services, and what could be done to extend the user base. For example, previous research has shown that bikeshare users tend to be from households with education and income levels that are above average for the city [11,12,13,14] in which the bikeshare service operates. Men tend to be the majority of users in countries with lower overall cycling levels, such as the US, while women are more heavily represented in countries with a strong cycling culture [15]. Early research from the COVID-19 period has shown that income and employment characteristics also play a significant role in cycling behavior [16].
Previous research on bikeshare use has focused on different spatial levels (stations, cities), and temporal factors (weekends or weekdays, seasons, peak hours) [17]. Because bikeshare data is often overdispersed, traditional methods such as Ordinary Least Squares (OLS) and Poisson regression are of limited utility [18]. Negative binomial models are often used to examine these data instead, especially for ridership counts [19,20]. Schimohr et al. applied a negative binomial regression on Cologne’s bikeshare data to identify connections to the public transport network and other spatial and temporal factors that influence bikeshare usage [21]. Spatiotemporal bikeshare data can also present modelling challenges due to endogeneity and unobserved heterogeneity; multilevel models such as Bayesian regression [22] or autoregressive models have been previously used to resolve these issues [17,23].
Some studies have also shown that bikeshare services are significantly intertwined with other modes of transport. Chen et al. reviewed user feedback of free-floating bikeshare services in China and concluded that these services impacted the utilization rate of public transportation and private car trip frequency, mostly on short distance trips [24]. Willberg et al. determined that 79% of Helsinki’s bikeshare trips are made by people who live within walking distance of existing stations [25]. And Kim et al. used negative binomial regression to demonstrate that bikeshare and public transit can complement one another, within cities and surrounding areas [26].
Finally, while most previous work has focused on bikeshare trip counts, there has been some limited research on understanding ride duration. For example, Shang et al. found an association of pandemic conditions with longer ride durations and a shift of trips to less-heavily trafficked areas [27]. Fyhri et al. found that electric bikes were associated with a change in average daily trip length from 2.1 km to 9.2 km [28]. Liu et al. used a hazard-based duration model to predict activity durations and analyzed the impacts of COVID-19 countermeasures for the first time, including their interaction with built environment factors, such as the number of open stores during the pandemic [29].
The review highlights a gap in understanding trip duration during emergencies, as most studies focus only on socio-demographic factors and neglect environmental influences like the built environment. Given the changes due to COVID-19 restrictions, there's a need to understand the varied impacts of these factors on trip duration. Additionally, current studies only consider single areas, missing the differences across various urban regions and leaving spatial heterogeneity unexplored. Therefore, to fill this gap, this study examines bikeshare data in Detroit and its surrounding cities using a hazard-based duration model to help close this gap.
2.3. COVID-19 Effect on Transportation
COVID-19 pandemic drastically changed the way people transit. Many states, including Michigan, instituted stay-at-home orders early in the pandemic, thereby significantly reducing the demand for transport in general. In the U.S., the number of trips per person dropped by 12.52%, while the proportion of people staying at home increased by 39.61% [30]. Public transportation has also seen a marked decrease in use, due to concerns about social distancing and the prospect of disease spread [31]; for instance, subway ridership has seen a drop of 92% in New York City [32], and a decrease of 77% in Washington D.C. [30] [33]. Even while bicycles have the advantages of social distancing, public agencies have had to take measures to ensure that bikeshare systems continue to work safely for their users. San Antonio’s bikeshare service, for example, implemented seven measures to fight COVID-19, from cleaning the bikes and the frequently touched areas of stations, to encouraging bikeshare users to apply good practices about washing hands before using the bikes [34,35]. The cities of New Orleans, Houston, and Atlanta decided to suspend parts of their bikeshare services to avoid concentrations of people at docking stations and to allow for the sanitation of stations and bikes. On the other hand, cities like Detroit have encouraged additional use of their bikeshare systems during this period through programs such as free monthly passes during certain times of the pandemic [36]. Although numerous studies have explored the impacts of COVID-19 on bikeshare systems in major cities [29,37,38,39,40,41], the effect of promotional incentive programs on rider behavior remains unclear. For instance, research on Houston's bikeshare system conducted by Azimi et al. found increased ridership in 2020, with longer trips and more off-peak usage, including evenings and mornings [42]. Additionally, a study on five U.S. bikeshare systems found that ridership levels did not return to pre-pandemic levels, except for members in Minneapolis and non-members in Washington D.C., though both groups took longer trips during the pandemic [43].
This study aims to fill the gap by examining the impact of promotional incentive programs on rider behavior, along with other spatial and temporal factors.
3. Data and Variables of Interest
3.1. Data Collection and Filtering
In this study, the bikeshare trip data were provided by MoGo, the non-profit bikeshare system for the City of Detroit and surrounding communities. The dataset provided by MoGo was station-level data and consisted of information such as origin and destination stations, trip duration, start and end time of the ridership, bike type, and pass type. An illustration of the data schema can be found in Figure 1. The data were recorded between January 2019 and December 2020. Total trips of 257,279 were documented through the stated period. The number of stations was recorded as forty-five in Detroit before June 2020; however, it was increased to 80 in 10 neighborhoods through downtown Detroit and several cities through Michigan: Ferndale, Oak Park, Huntington Woods, Berkeley, and Royal Oak.
Data were filtered before modeling and analyzing. To reduce the amount of “ghost” data from the dataset, trips with a duration of under one minute and more than 120 minutes were excluded from the dataset. Moreover, there were five temporary test stations which were eliminated from analysis. The final total number of stations and trips were 75 and 171,568, respectively. Figure 2 shows the MoGo bikeshare stations in Detroit and suburbs. Red pins are representatives for stations before the year 2020 in midtown and downtown Detroit, grey and green pins are new stations added in June 2020 in north of Detroit, and suburbs, respectively.
3.2. Variables of Interest
The dependent variable for this study was identified as trip duration. A detailed summary of the variables used in the model is available in Table 1. The data were categorized into five primary groups: Weather Conditions, Temporal Seasonality, Ridership Characteristics, Safety and Station Characteristics, and COVID-19 Impact Features.
Weather Conditions: This category includes hourly temperatures and conditions such as Clear, Rainy, Cloudy, and Wintery. These data were sourced from the Weather Underground website [44]. Research suggests that seasonal variations, along with the time of day and day of the week, significantly influence travel mode choices.
Temporal Seasonality: This category was introduced to highlight the effects of temporal variables on the dataset. It illustrates how seasonal and temporal factors influence rider choices and behaviors.
Ridership Characteristics: This group includes the type of bike and pass used by riders. Passes are further divided by type: On-Demand passes, which cover Daily, Pay as You Go, and Prepaid options; and longer-term passes, which include all variants of monthly and annual passes such as Annual Pass, Annual Pass - Senior Discount, and city-specific versions like Annual Pass - City of Detroit, among others. The Access Pass, although an annual pass, is treated distinctly to examine the impact of the state benefits program on bikeshare usage and rider behavior. To be eligible for the $5 per year Access Pass, individuals must be registered with state benefits programs such as Food Assistance, Cash Assistance/Family Independence, Healthy Michigan Plan, Children's Special Health Care Services, and Childcare Assistance [45].
Safety and Station Characteristics: This category accounts for spatial attributes and safety features associated with ridership. It includes whether trips start and end at the same station, or if a station was recently added to the network. Additionally, the category includes Level of Traffic Stress (LTS), an approximate measure of cyclist discomfort due to traffic conditions, factoring in elements such as speed limits, traffic volumes, and the availability of bike lanes; LTS was developed by Mekuria et al. in 2012 [46]. For this study, the LTS value for the roadway closest to each MoGo station was obtained from the Southeast Michigan Council of Governments (SEMCOG) [47].
COVID-19 Impact Features: This final category examines the effects of the COVID-19 pandemic on bikeshare systems and usage patterns. It includes variables such as whether trips occurred during the state-mandated stay-at-home orders following March 10, 2020, the date when the first COVID-19 cases were confirmed in Michigan. Another variable captures usage of a promotional free pass offered by MoGo from March 30th through April 28th, 2020, which was valid for 30 days from the issue date. Additional considerations include the closure of gyms and Detroit’s risk levels, specifically at levels D and E, indicating the highest risk.
3.3. Descriptive Analysis
One question of particular interest is the impact of e-assist bicycles on rider behavior; total number of 31048 (18.1%) and 140,520 (81.9%) trips were made by the Boost model (e-bikes), and the Iconic model (traditional bikes) respectively.
Figure 3 illustrates the cumulative distribution functions (CDF) of trip distance and trip duration for two different bike types, Boost and Iconic. In Figure 3-(a), comparing trip distances, Boost (blue line) and Iconic (orange line) show that for shorter trips, Boost trips are slightly longer, with 50th and 80th percentiles at approximately 0.95 miles and 1.6 miles for Boost, compared to 0.9 miles and 1.45 miles for Iconic. As trip distance increases, the CDFs converge, showing similar behavior for longer trips. Figure 3-(b), comparing trip durations, reveals that Boost users tend to have shorter trip durations with 50th and 80th percentiles at approximately 13 minutes and 26 minutes, whereas Iconic users have longer durations at approximately 18 minutes and 41 minutes. This suggests that Boost trips are typically shorter in duration but slightly longer in distance compared to Iconic trips, indicating different usage patterns between the two bike-sharing programs.
As Michigan saw its first COVID-19 confirmed cases on March 10, 2020, the Governor announced executive orders shortly thereafter. Some of the major executive orders related to COVID-19 have been shown in Figure 4. March and April experienced a small number of weekday trip counts, likely owing to a combination of colder weather and the introduction of statewide shelter-in-place orders; however, duration of those trips that did occur tended to increase over this time period. Ridership begins to increase noticeably in May and June, owing to general improvements in the weather and a loosening of certain COVID-19 restrictions, such as the stay-at-home order. An added factor contributing to increased trip counts in June is the network expansion by MoGo; on June 4, 2020, MoGo increased its fleet from 480 bikes (430 Iconic bikes, and 50 Boost bikes) to 621 bikes (571 Iconic bikes, and 50 Boost bikes). Moreover, thirty new stations were added to the network at this time.
Figure 5 illustrates the weekly trip counts as well as the weekly average trip duration from January 2019 till the end of December 2020. More and longer trips happened in the Spring and Summer seasons. Although the weekly average trip counts in Spring and Summer of 2020 was less than 2019, the weekly average trip duration was greater.
4. Modeling Methodology
In this research, a hazard-based duration model is used to explore the effects of the explanatory variables on bikeshare trip duration. Temporal dependent variables can be modeled using hazard- or survival-based techniques, which analyze the time that passes until an event occurs (here, the end of the bikeshare trip) and explain the influence of each covariate. These models have seen limited previous application in the transportation research domain [29] [55] [56] [57]. While duration data can be modelled by traditional least-square regression, hazard-based models offer additional insights into the fundamental time-related issues [58]. Hazard-based duration models are developed with cumulative distribution function (CDF).
where P is probability, T denotes a random time variable, and t is a specific time. The density of CDF is shown below:
and the hazard function is:
where the hazard function, h(t), is the probability of an event occurring between time t and t+dt, knowing that the event has not occurred up until time t [58].
It is often a challenge to choose among nonparametric, semiparametric, and fully parametric methods for estimating duration models. A non-parametric approach is proper when there is little information provided about the underlying distribution due to the small sample size. Semiparametric models can be also recommended when little information is available, however, there are two shortcomings for using these models; it is difficult to quantify the duration effects, and a loss in efficiency may be captured. Fully parametric models assume a duration-time distribution along with parametric assumption of the impacts of covariates on the hazard function [58].
In this study, Log Logistic, a fully parametric model for the hazard function were studied.
Additionally, the random-parameters approach is used to account for unobserved heterogeneity across individuals. This is particularly important in understanding human behavior. The model parameters can be estimated based on maximum likelihood method and using Halton draws [59] to maximize the simulated likelihood function. The density function used for the random parameters are to be normally distributed.
5. Results
In this section, we discuss the results from our analysis using two distinct models: a fixed parameter log-logistic survival model and a random parameter model. These were selected to thoroughly explore the factors affecting bikeshare ridership. The fixed survival model provides a general overview of the influence of independent variables. Conversely, the random parameter survival model adjusts for unobserved heterogeneity among users, offering a more tailored analysis. When examining the coefficients in these models, it is crucial to consider both their signs and magnitudes. A positive coefficient indicates an increase in trip duration, whereas the magnitude reflects how significantly a variable influences the duration. Furthermore, the statistical significance of these coefficients sheds light on the reliability of our findings, with significant coefficients denoting a notable impact on ridership.
When comparing the fixed-parameters and random-parameters Log-Logistic models in Table 2, the random-parameters model shows significant improvement. Its likelihood at convergence is −191,821.3, which is notably better than the −192,382.6 observed with fixed parameters. This comparison, supported by a χ² statistic of 1122.6 from a likelihood ratio test, allows us to confidently reject the fixed-parameter model in favor of the random-parameters model at a 99.999% confidence level. Our discussion will therefore focus on the random-parameters model. For further details, please refer to Table 1 for variable specifics and Table 2 for a comparison of outcomes between the two models. This analysis highlights the benefits of using the random-parameters approach in our model.
Ridership, Safety and Station Characteristics: The use of Access Passes also showed considerable variation (mean = 0.18, standard deviation = 0.33), with a negative impact on about 29% of individuals and a positive effect on about 71%. Additionally, higher levels of traffic stress correlate with shorter durations. According to Table 2, trips that start and end at the same station are more likely to last longer. Conversely, e-bike users tend to have shorter trips. The introduction of new MoGo stations showed a normally distributed random parameter (mean = 0.07, standard deviation = 0.31), impacting about 41% of trips negatively and 59% positively, further highlighting the diverse effects of these variables across the user base.
Weather Conditions and Temporal Seasonality: Adverse weather conditions, such as rain or snow, are linked to shorter trip durations. Conversely, more favorable conditions, like higher temperatures or clear weather during spring or summer, are associated with longer rides. Time of day also plays a significant role: night hours (between 7-10 PM) are associated with longer trip durations (mean = 0.07, standard deviation = 0.007), and this period sees 100% of trips being longer. Evening times (4-7 PM) show a positive association with longer trips (mean = 0.07, standard deviation = 0.11), with 73% of trips being longer and 27% shorter. Conversely, AM peak hours for weekdays (6-9 AM) see shorter trips (mean = -0.10), while midday hours (11 AM to 4 PM) and weekends are positively associated with longer trip durations (mean = 0.06 and 0.11, respectively). Seasonal variations further highlight that spring and summer contribute to longer trips (mean = 0.11 and 0.08, respectively).
COVID-19 Impact Features: Trips during gym closures resulted in a normally distributed random parameter (mean = 0.35, standard deviation = 0.34), indicating negative impacts for about 15% of trips and positive for about 85%, demonstrating significant variability in this variable's effect across different users. During the initial lockdown phases from February to April 2020, higher risk levels (D and E) were linked to shorter ride durations. However, the use of promotional tactics like offering free monthly passes led to a notable increase in the length of rides.
6. Discussion
The results from the bikeshare model shed light on critical factors influencing ride duration. These findings are crucial in understanding the nuances of urban mobility and can inform policy decisions aimed at enhancing bikeshare systems. Following this, we will conduct a comprehensive discussion to uncover potential underlying factors contributing to these coefficient estimates for our model.
Our analysis highlights several intriguing aspects of bikeshare usage in Detroit, particularly concerning trip duration. Notably, trips that begin and end at the same station tend to be longer, reflecting leisure-oriented trips where users are not pressured by specific arrival times and can enjoy the ride at their own pace. This finding is less commonly reported in existing literature and adds a new dimension to the understanding of bikeshare usage.
A key finding pertains to the Level of Traffic Stress (LTS) at both origin and destination stations. Our results suggest that higher LTS, which accounts for factors such as speed limits, traffic volume, and the availability of bike lanes, tends to decrease trip durations. This could be due to the increased discomfort and perceived danger that cyclists feel in high-stress traffic conditions, prompting them to shorten their trips to minimize exposure to these environments. Improving traffic conditions around bikeshare stations could thus encourage longer, more enjoyable rides.
The expansion of stations in Detroit and its suburbs illustrates a mixed relationship with trip duration. The proximity of new stations can lead to shorter, more direct routes in densely populated areas, while stations placed further apart in the suburbs offer options for longer rides, enhancing connectivity for suburban residents commuting to the city. This dual effect underscores the complexity of network expansion in urban and suburban settings.
Weather conditions and time of day also played substantial roles in shaping bikeshare usage. Clear weather and night hours (between 7-10 PM) were particularly favorable to longer rides, reflecting the appeal of pleasant biking conditions combined with leisure activities after work. In contrast, AM peak hours saw shorter trips, typically indicative of commuting patterns where users are aiming for efficiency and promptness. Evening times (4-7 PM) showed that 73% of trips were longer, likely due to a mix of commuters returning home and individuals engaging in leisure activities post-work. This period may also capture users enjoying evening outings or running errands, reflecting the versatility of bikeshare systems in meeting various user needs.
During periods when gyms were closed, we observed that 85% of the rides were likely to be longer, suggesting that bikeshare systems were used as an alternative form of exercise. This aligns with the broader trends observed during the COVID-19 pandemic, where travel restrictions and closure of indoor recreational facilities pushed people towards outdoor activities, including biking. Interestingly, the COVID-19 pandemic also influenced bikeshare usage patterns. Higher risk levels (D and E) during the initial lockdown phases (February to April 2020) were associated with shorter rides, reflecting cautious behavior among users. However, promotional strategies, such as free monthly passes and the Access Pass, significantly increased ride durations, demonstrating that financial incentives can effectively boost the usage intensity of bikeshare systems. The Access Pass, which was heavily discounted, showed that 71% of its recipients used the service for longer periods due to the reduced cost barrier.
Another key finding is the 20-minute mark in ride durations, which helps understand user behaviors and trip purposes. Figure 6, the cumulative distribution function (CDF) for bike ride durations, indicates that the survival curve reaches the median point at around 17.26 minutes. This observation highlights a distinct rider behavior pattern, where a significant portion of trips are either quite short or substantially longer. The steep initial rise of the CDF suggests that many rides are brief, serving quick, practical needs, likely within densely populated or high-traffic areas. After this point, the curve levels off, indicating that rides that exceed this median duration tend to continue for much longer, suggesting these might accommodate to more leisurely activities or extended commutes. These insights are crucial for enhancing urban mobility strategies, offering a robust basis for the strategic placement of bike stations and the formulation of services that precisely meet the varied demands of users.
Figure 7 shows a marked increase in risk, peaking at around 19.9 minutes for the fixed parameters model and 20.4 minutes for the random parameters model, before it begins to decrease. The difference between the fixed and random parameters models is minimal, with the hazard value for the random parameters model being slightly higher (by 30 seconds), likely due to its accounting for heterogeneity. This peak is significant as it represents the most probable time when rides are likely to end.
Understanding that this specific point in time marks a shift in rider behavior is crucial for future analyses of ridership patterns. The hazard function analysis reveals how the likelihood of an event changes over time. The 20.4-minute mark could serve as a strategic dividing point in evaluating trip purposes, rider demographics, and network planning. It suggests that rides extending beyond this duration are typically longer, possibly indicating different needs or objectives among these riders. This insight is particularly valuable for transportation planners, providing a robust basis for making more informed decisions about the layout of bike stations. By integrating this temporal insight into planning, officials can optimize the placement of bike stations to better accommodate actual usage patterns. For example, stations might be positioned to encourage longer rides in scenic or less densely populated areas, while ensuring that more stations are available shortly before the 20.4-minute mark in urban or high-traffic areas to assist those likely to end their rides.
Overall, these insights underscore the complex dynamics that shape bikeshare systems, influenced by factors such as urban planning, policy changes, and societal shifts, particularly during the pandemic. Factors ranging from the layout of bikeshare networks to the timing of promotional pricing strategies demonstrate how targeted interventions can adaptively respond to changing urban conditions. The introduction of pandemic-related policies and public health orders also played a significant role, altering user behaviors and impacting the overall use of the bikeshare system. These adaptations highlight the resilience and flexibility of bikeshare services, capable of meeting diverse user needs across varying contexts. Moreover, this research not only sheds light on the diverse influences on bikeshare usage but also highlights the potential of thoughtful policy and strategic planning to enhance the sustainability and appeal of urban mobility solutions.
7. Limitations and Future Work
A key limitation of this study is the lack of sociodemographic data, which could examine how distinct groups in the population engage with bikeshare systems. potentially revealing patterns linked to age, sex, income, or education level. Understanding these dimensions could help tailor bikeshare services more effectively to meet diverse community needs and promote equity. Additionally, the focus on the Detroit Metropolitan Area may limit the applicability of our findings to other regions with different urban layouts, climates, or bikeshare system designs. The study’s temporal scope, confined to two years before and immediately after the start of the COVID-19 pandemic, could present limits on insights into long-term trends and the lasting impacts of COVID-19 on bikeshare usage.
Future research should incorporate sociodemographic data to deepen the understanding of user diversity within bikeshare systems. Expanding the study to include multiple cities and extending the timeline to capture post-pandemic data would offer a more comprehensive view of the evolving dynamics of bikeshare usage.
8. Conclusions
This study offers an insightful analysis of bikeshare usage patterns in Detroit, emphasizing the interplay of environmental, temporal, and pandemic-related factors over two years. Our findings indicate that higher levels of traffic stress and adverse weather conditions typically reduce trip durations, while supportive measures such as the promotional Access Passes and new bikeshare stations promote longer rides.
The analysis also highlights how bikeshare systems can be served as alternative exercise options, especially during periods when gyms were closed, leading to increased usage. Promotional strategies, including free monthly passes, significantly boosted ride durations, demonstrating that financial incentives effectively encourage more extensive use of the bikeshare system. Moreover, the pandemic and related policy responses have clearly impacted user behaviors, showing the necessity for adaptable urban transportation strategies in response to external crises.
The dual impact of station expansion in both urban and suburban areas reflect the complex dynamics of mobility infrastructure planning. This research underscores the need for thoughtful urban planning and policy-making that harnesses bikeshare systems to enhance sustainable urban transportation. These findings provide a basis for future strategies aimed at improving the viability and appeal of bikeshare systems, ensuring they meet diverse user needs and adapt to changing environmental and social conditions.
Author Contributions
Anahita Zahertar: Conceptualization, Data curation, Formal analysis, Investigation, Methodology, Software, Validation, Visualization, Writing – original draft, Writing – review & editing. Steven Lavrenz: Conceptualization, Data curation, Formal analysis, Funding acquisition, Investigation, Methodology, Project administration, Resources, Software, Supervision, Validation, Visualization, Writing – review & editing.
Acknowledgments
We would like to thank MoGo for providing the data. We would also like to acknowledge the work of Tony Geara and the City of Detroit who assisted with the initial COVID-19 data preparation.
References
- Centers for Disease Control and Prevention, "COVID Data Tracker," 29 04 2021. [Online]. Available: https://covid.cdc.gov/covid-data-tracker/#datatracker-home.
- Centers for Disease Control and Prevention, "Safer Travel Ideas," 20 4 2021. [Online]. Available: https://www.cdc.gov/coronavirus/2019-ncov/travelers/travel-risk.html.
- Bridge Michigan, "Bike-share programs rolling out across Michigan," 8 1 2014. [Online]. Available: https://www.bridgemi.com/quality-life/bike-share-programs-rolling-out-across-michigan.
- S. Shaheen, "Bikesharing in Europe, the Americas, and Asia: Past, Present, and Future," Transportation Research Record Journal of the Transportation Research Board, 2010.
- B. H. Nielsen, "The Bicycle in Denmark: Present Use and Future Potential," Ministry of Transport, 1993.
- Vélib’ Métropole, "The Vélib’ Service," 2021. [Online]. Available: https://www.velib-metropole.fr/en/service.
- E. Silverman, "Bicycle-Sharing Program to Debut," The Washington Post, 19 04 2008.
- Citi Bike NYC, "The History of Citi Bike," 2021. [Online]. Available: The History of Citi Bike.
- National Association of City Transportation Officials, "Bike Share in the US: 2010-2016," 2016. [Online]. Available: https://nacto.org/bike-share-statistics-2016/.
- HAP, "HAP," 26 04 2017. [Online]. Available: https://www.hap.org/news/2017/04/detroit-bike-share.
- E. Fishman, S. Washington, N. Haworth and A. & Mazzei, "Barriers to bikesharing: An analysis from Melbourne and Brisbane," Journal of Transport Geography, no. 41, pp. 325-337, 2014. [CrossRef]
- E. Fishman, S. Washington, N. Haworth and A. &Watson, "Factors influencing bike share membership: An analysis of Melbourne and Brisbane," Transportation Research Part A, no. 71, p. 17–30, 2015. [CrossRef]
- Fishman, "Bikeshare: A Review of Recent Literature," Transport Reviews, no. 36, p. Transport Reviews, 2016. [CrossRef]
- S. Shaheen, A. P. Cohen and E. W. Martin, "Public bikesharing in North America: Early operator understanding and emerging trends," Transportation Research Record: Journal of the Transportation Research Board, p. 83–92, 2013. [CrossRef]
- J. E. Pucher and R. E. Buehler, "City cycling," Cambridge, MA: MIT Press, 2012.
- S. Hu, "A big-data driven approach to analyzing and modeling human mobility trend under non-pharmaceutical interventions during COVID-19 pandemic," A big-data driven approach to analyzing and modeling human mobility trend under non-pharmaceutical interventions during COVID-19 pandemic, no. 124, 2021. [CrossRef]
- S. Hu, "Examining spatiotemporal changing patterns of bike-sharing usage during COVID-19 pandemic," Journal of Transport Geography, no. 91, 2021. [CrossRef]
- R. d. Buen Kalman, "Can’t drive today? The impact of driving restrictions on bikeshare ridership in Mexico City," Transportation Research Part D, no. 1, p. 91, 2021. [CrossRef]
- W. Gardner, "Regression analyses of counts and rates: Poisson, overdispersed Poisson, and negative binomial models," Psychological Bulletin, no. 118, pp. 392-404, 1995. [CrossRef]
- T. Y. Jang, "Count Data Models for Trip Generation," Journal of Transportation Engineering, no. 131, p. 444, 2005. [CrossRef]
- K. Schimohr and J. Scheiner, "Spatial and temporal analysis of bike-sharing use in Cologne taking into account a public transit disruption," Journal of Transport Geography, no. 92, 2021. [CrossRef]
- R. B. Noland, "Bikeshare trip generation in New York City," Transportation Research Part A: Policy and Practice, no. 94, pp. 164-181, 2016. [CrossRef]
- Y. Shen, "Understanding the usage of dockless bike sharing in Singapore," International Journal of Sustainable Transportation, no. 12, pp. 686-700, 2018. [CrossRef]
- J. Chen, Y. Zhang, R. Zhang, X. Cheng and F. & Yan, "Analyzing users’ attitudes and behavior of free-floating bike sharing: An investigating of Nanjing," Transportation research procedia, no. 39, pp. 634-645, 2019. [CrossRef]
- E. Willberg, M. Salonen and T. Toivonen, "What do trip data reveal about bike-sharing system users?," Journal of Transport Geography, no. 91, 2021. [CrossRef]
- M. Kim and G. H. Cho, "Analysis on bike-share ridership for origin-destination pairs: Effects of public transit route characteristics and land-use patterns," Journal of Transport Geography, no. 93, 2021. [CrossRef]
- W. L. Shang, J. Chen, H. Bi, Y. Sui, Y. Chen and H. Yu, "Impacts of COVID-19 pandemic on user behaviors and environmental benefits of bike sharing: A big-data analysis," Applied Energy, no. 285, 2021. [CrossRef]
- Fyhri and H., B. Sundfør, "Do people who buy e-bikes cycle more?," Transportation research part D: transport and environment, no. 86, 2020. [CrossRef]
- Liu, X. Zuo, X. Gu, M. Shao and C. Chen, "Activity Duration under the COVID-19 Pandemic: A Comparative Analysis among Different Urbanized Areas Using a Hazard-Based Duration Model," Sustainability, no. 15, 2023. [CrossRef]
- S. Hu, "Who left riding transit? Examining socioeconomic disparities in the impact of COVID-19 on ridership," Transportation Research Part D, no. 90, 2021. [CrossRef]
- B. Mo, "Modeling epidemic spreading through public transit using time-varying encounter network," Transportation Research Part C, no. 122, 2021. [CrossRef]
- MTA, "Day-By-Day Ridership Numbers," 20 03 2020. [Online]. Available: https://new.mta.info/coronavirus/ridership.
- WMATA, "Ridership Data Portal Washington Metropolitan Area Transit Authority," 20 03 2020. [Online]. Available: https://www.wmata.com/initiatives/ridership-portal/.
- J. Jobe, "Bike share responses to COVID-19," Transportation Research Interdisciplinary Perspectives, no. 10, 2021. [CrossRef]
- San Antonio Bike Share, "Caring for the San Antonio Bike Share community," 01 08 2020. [Online]. Available: https://sanantonio.bcycle.com/top-navpages/contact/covid-19-update.
- S. Hamidi, "Hamidi, S.," Planning, no. 86, pp. 25-29, 2020.
- J. Jiao, H. Lee and S. Choi, "Impacts of COVID-19 on bike-sharing usages in Seoul, South Korea," Cities, no. 130, 2022. [CrossRef]
- H. Li, Y. Zhang, M. Zhu and G. Ren, "Impacts of COVID-19 on the usage of public bicycle share in London," Transp. Res. Part A Policy Pract., no. 150, p. 140–155, 2021. [CrossRef]
- V. Padmanabhan, P. Penmetsa, X. Li, F. Dhondia, S. Dhondia and A. Parrish, "COVID-19 effects on shared-biking in New York, Boston, and Chicago," Transp. Res. Interdiscip. Perspect., no. 9, 2020. [CrossRef]
- P. Bucsky, "Modal share changes due to COVID-19: The case of Budapest," Transp. Res. Interdiscip. Perspect., no. 8, 2020. [CrossRef]
- J. Teixeira and M. Lopes, "The link between bike sharing and subway use during the COVID-19 pandemic: The case-study of New York’s Citi Bike," Transp. Res. Interdiscip. Perspect., no. 6, 2020. [CrossRef]
- M. Azimi, M. Wali and Y. Qi, "Studying the Impact of the COVID-19 Pandemic on Bikeshares as a Mode of Shared Micromobility in Major Cities: A Case Study of Houston," Future Transp., no. 4, p. 270–282, 2024. [CrossRef]
- T. Vo, N. Barbour, L. Palaio and M. Maness, "Impacts of the COVID-19 Pandemic on Bikeshare Usage by Rider Membership Status Across Selected U.S. Cities," Transp. Res. Rec. J. Transp. Res. Board, no. 2677, p. 547–561, 2023. [CrossRef]
- Weather Underground, "Detroit, MI Weather History," Weather Underground, 01 09 2020. [Online]. Available: https://www.wunderground.com/history/monthly/us/mi/detroit/KDET/date/2020-2.
- MoGo, "Access Pass," 2020. [Online]. Available: https://mogodetroit.org/mogo-for-all/access-pass/.
- M. Mekuria, "Low-Stress Bicycling and Network Connectivity," Mineta, 2012.
- Southeast Michigan Council of Governments, SEMCOG, [Online]. Available: https://bicycle-and-pedestrian-mobility-maps-semcog.hub.arcgis.com/pages/bicycle-and-pedestrian-mobility-network.
- G. Whitmer, "Executive Order 2020-04: Declaration of State of Emergency," 10 03 2020. [Online]. Available: https://www.michigan.gov/whitmer/0,9309,7-387-90499_90705-521576--,00.html.
- G. Whitmer, "Executive Order 2020-09: Temporary restrictions on the use of places of public accommodation," 16 03 2020. [Online]. Available: https://www.michigan.gov/whitmer/0,9309,7-387-90499_90705-521789--,00.html.
- G. Whitmer, "Executive Order 2020-21: Temporary requirement to suspend activities that are not necessary to sustain or protect life," 24 03 2020. [Online]. Available: https://www.michigan.gov/whitmer/0,9309,7-387-90499_90705-522626--,00.html.
- G. Whitmer, "Executive Order 2020-33: Expanded emergency and disaster declaration," 01 04 2020. [Online]. Available: https://www.michigan.gov/whitmer/0,9309,7-387-90499_90705-524025--,00.html.
- G. Whitmer, "Executive Order 2020-35: Provision of K-12 education during the remainder of the 2019-2020 school year," 02 04 2020. [Online]. Available: https://www.michigan.gov/whitmer/0,9309,7-387-90499_90705-524032--,00.html.
- G. Whitmer, "Executive Order 2020-43 (COVID-19). Temporary restrictions on the use of places of public accommodation," 09 04 2020. [Online]. Available: https://www.michigan.gov/whitmer/0,9309,7-387-90499_90705-525927--,00.html.
- G. Whitmer, "Executive Order 2020-91: Safeguards to protect Michigan's workers from COVID-19," 18 05 2020. [Online]. Available: https://www.michigan.gov/whitmer/0,9309,7-387-90499_90705-529474--,00.html.
- H. Guo, "Modeling Travel Time under the Influence of On-Street Parking," Journal of Transportation Engineering, no. 138, 2012. [CrossRef]
- P. Van Den Berg, "A latent class accelerated hazard model of social activity duration," Transportation Research Part A, no. 46, pp. 12-21, 2012. [CrossRef]
- X. Yang, "Survival analysis of car travel time near a bus stop in developing countries," Science China Technological Sciences, no. 55, pp. 2355-2361, 2012. [CrossRef]
- S. P. Washington, M. G. Karlaftis and F. Mannering, "Statistical and econometric methods for transportation data analysis," Chapman and Hall/CRC, 2003.
- J. Halton, "On the efficiency of certain quasi-random sequences of points in evaluating," Numer. Math. 2, p. 84–90, 1960. [CrossRef]
Figure 1.
Flowchart of the data.
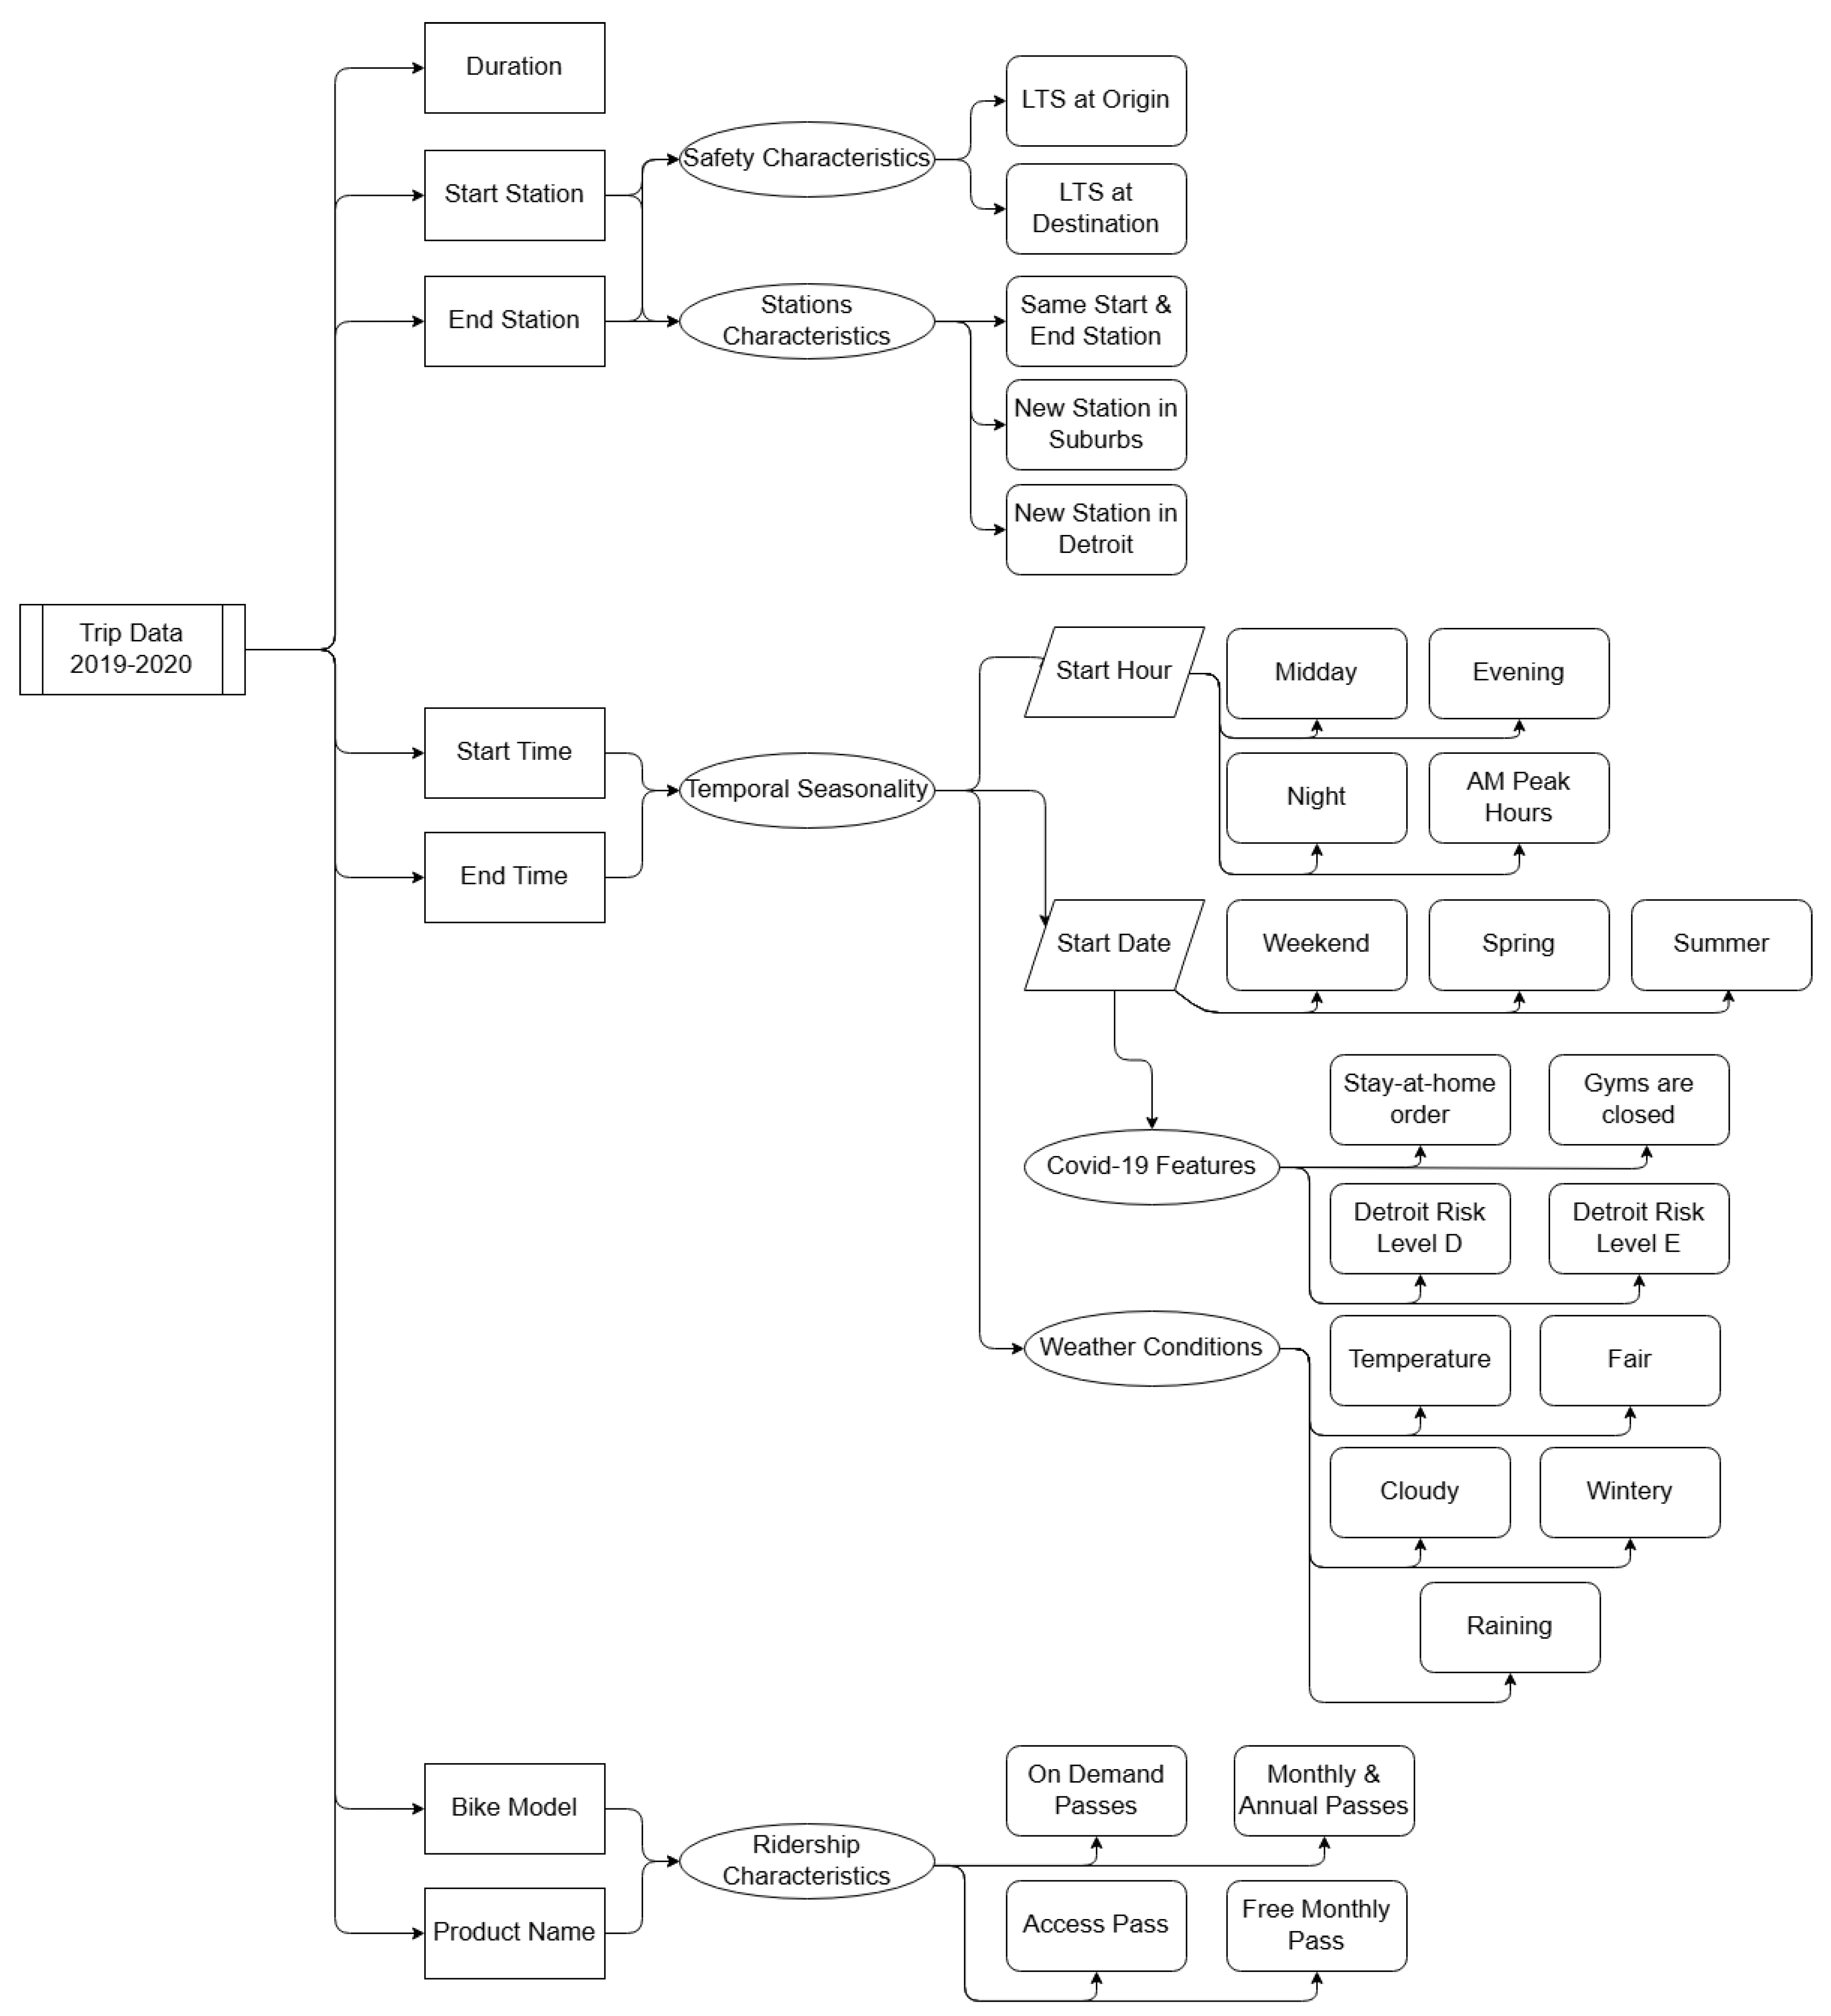
Figure 2.
Bike-Share stations in Detroit, Oak Park, Royal Oak, Ferndale, Huntington Woods, and Berkley cities in Michigan.
Figure 2.
Bike-Share stations in Detroit, Oak Park, Royal Oak, Ferndale, Huntington Woods, and Berkley cities in Michigan.
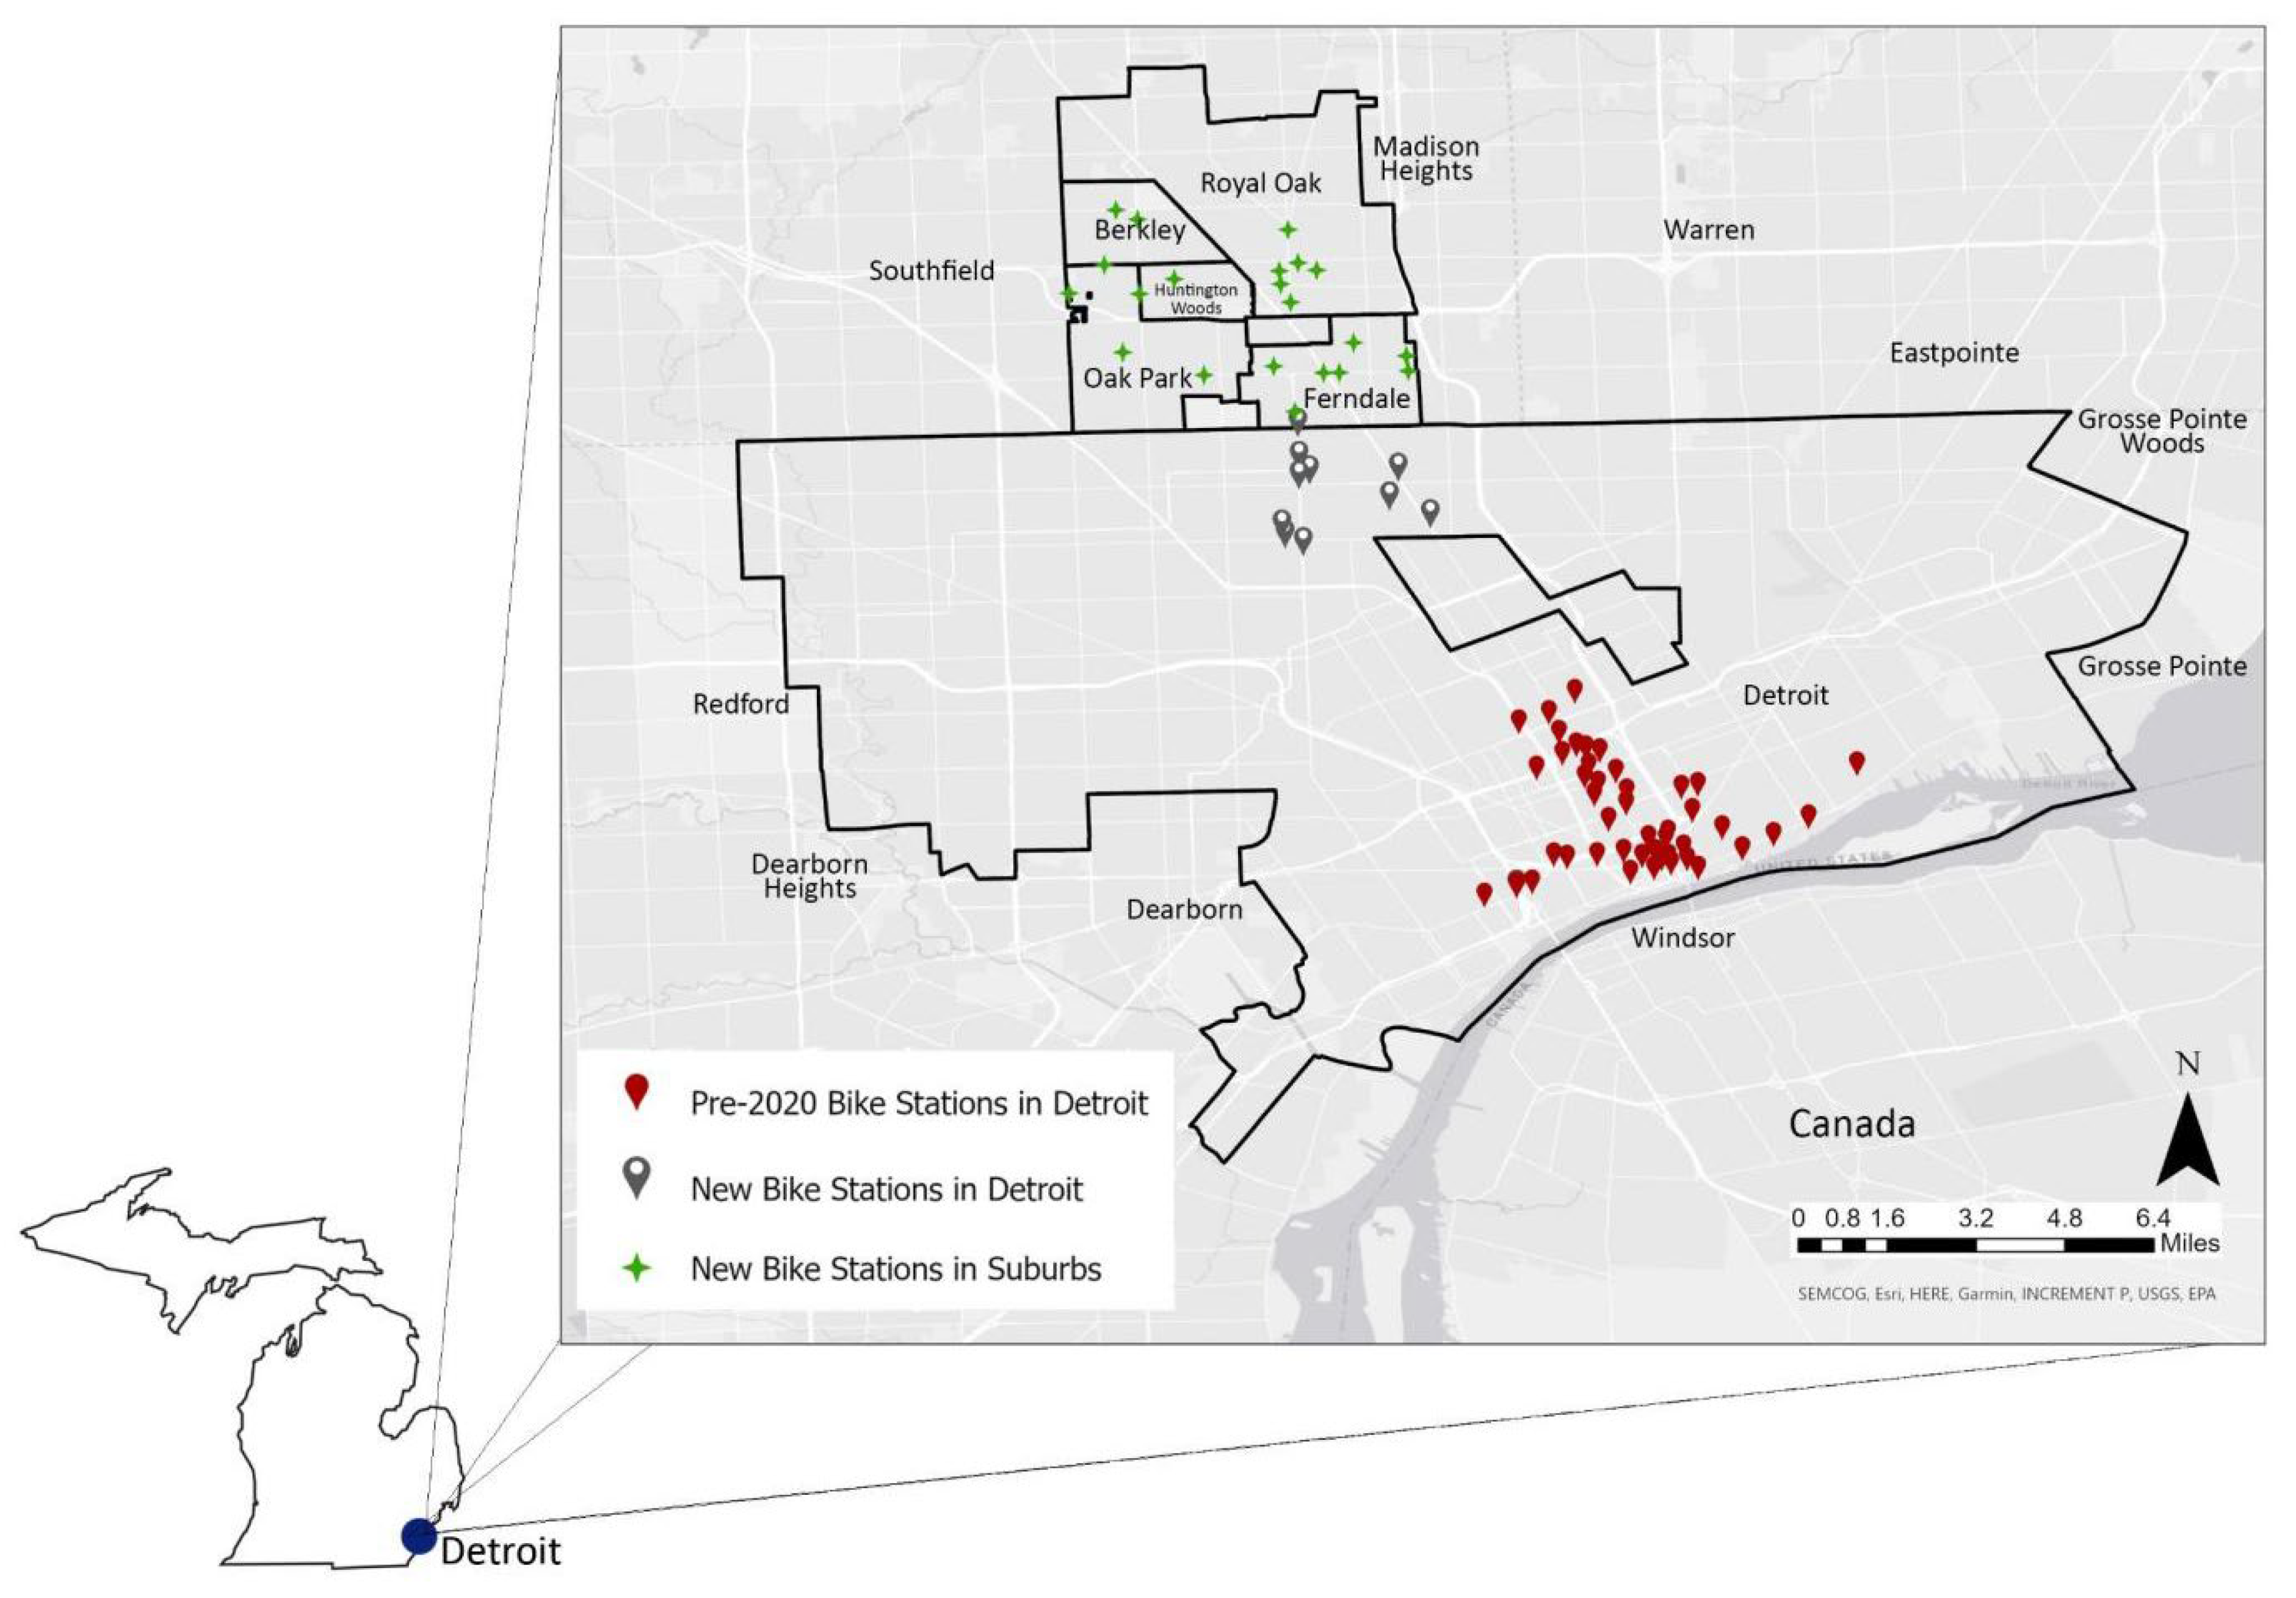
Figure 3.
Cumulative distribution of (a) trip distance and (b) trip duration for Boost and Iconic bikes.
Figure 3.
Cumulative distribution of (a) trip distance and (b) trip duration for Boost and Iconic bikes.
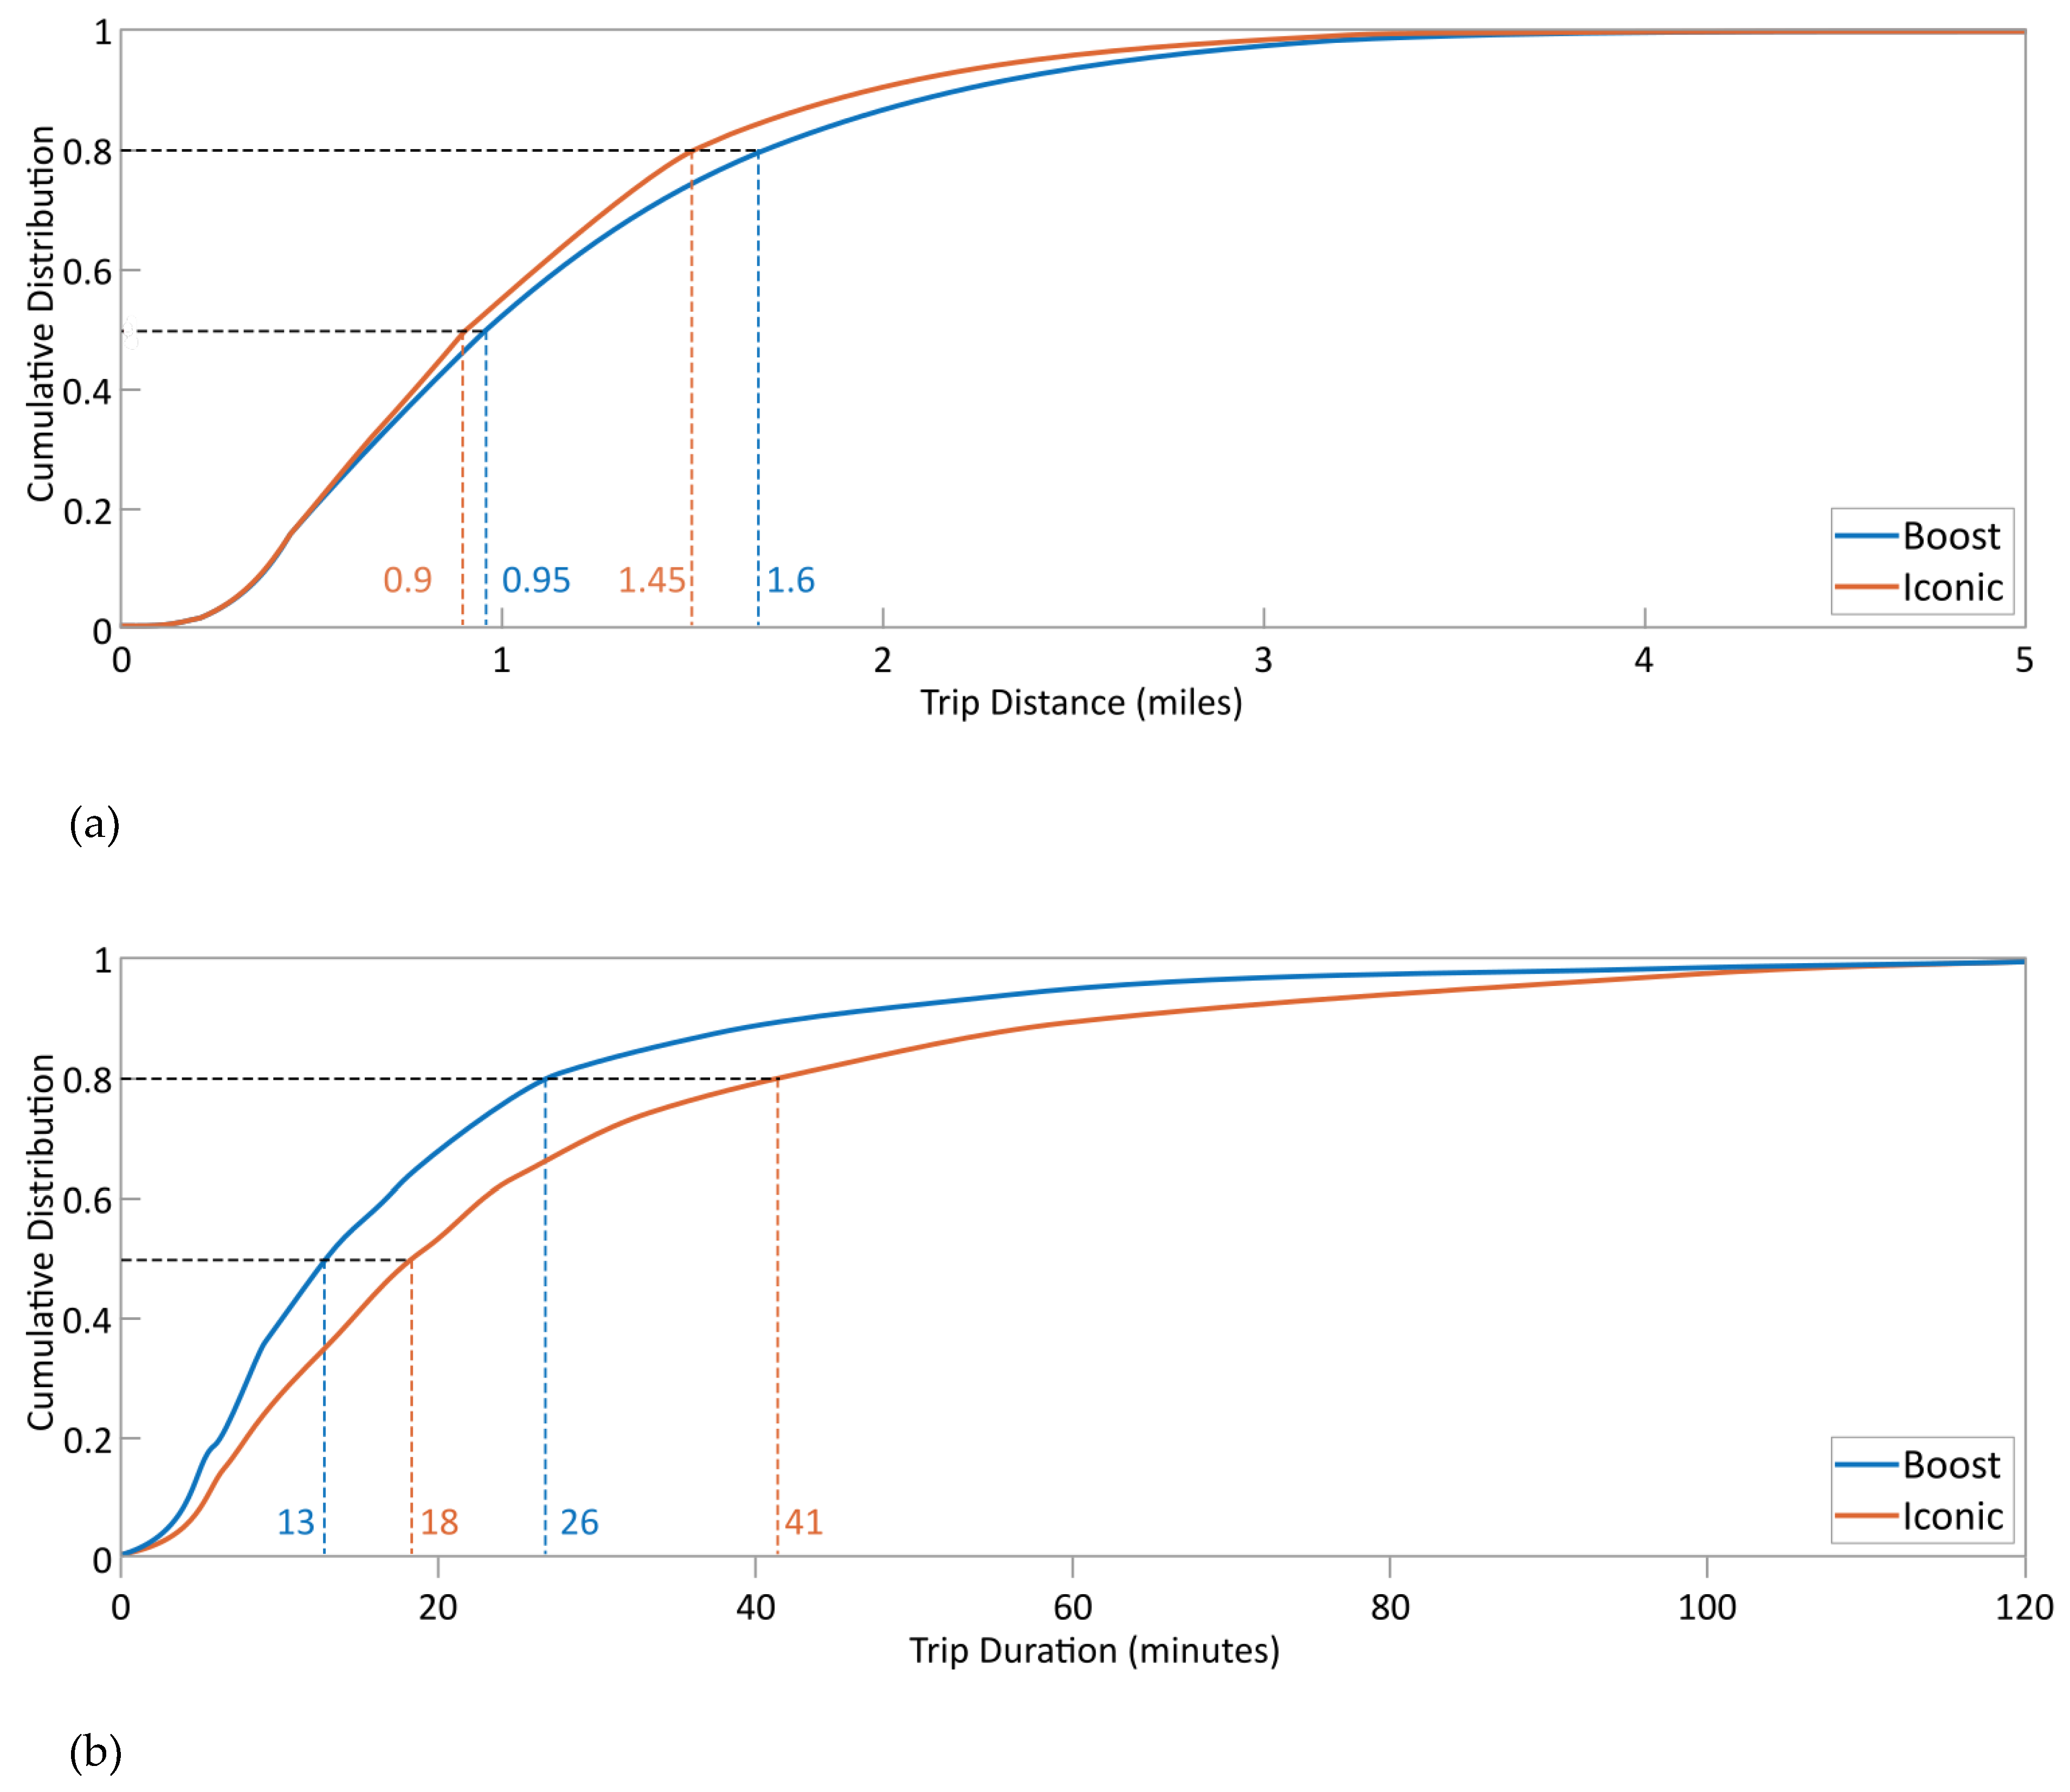
Figure 4.
Daily trip counts and daily average trip duration for the March 1st to June 30th, 2020, period [48,49,50,51,52,53,54].

Figure 5.
Weekly trip count for the January 1st, 2019, to December 31st, 2020 period.
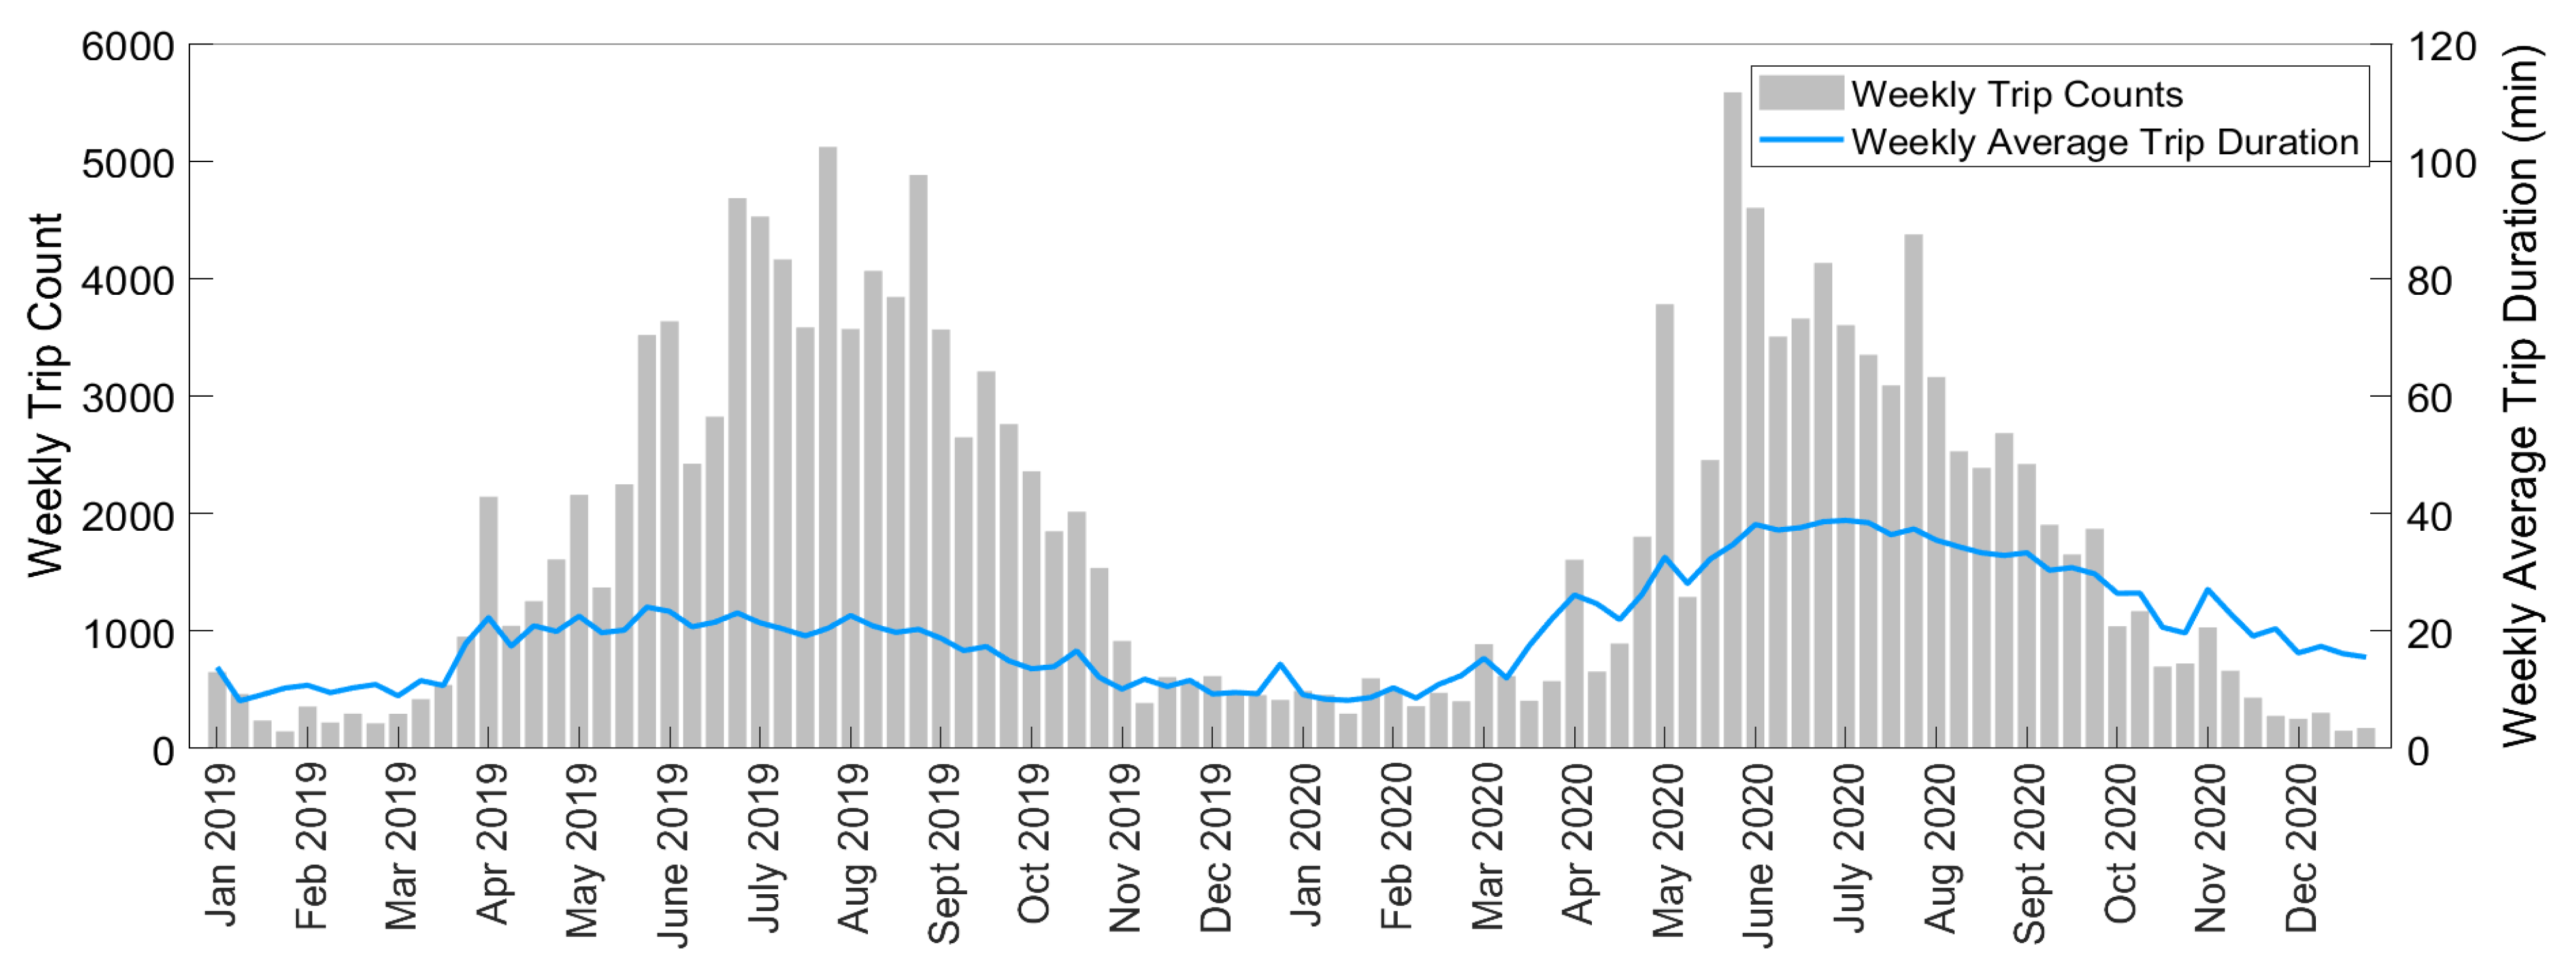
Figure 6.
Cumulative distribution of survival function of log-logistic models.
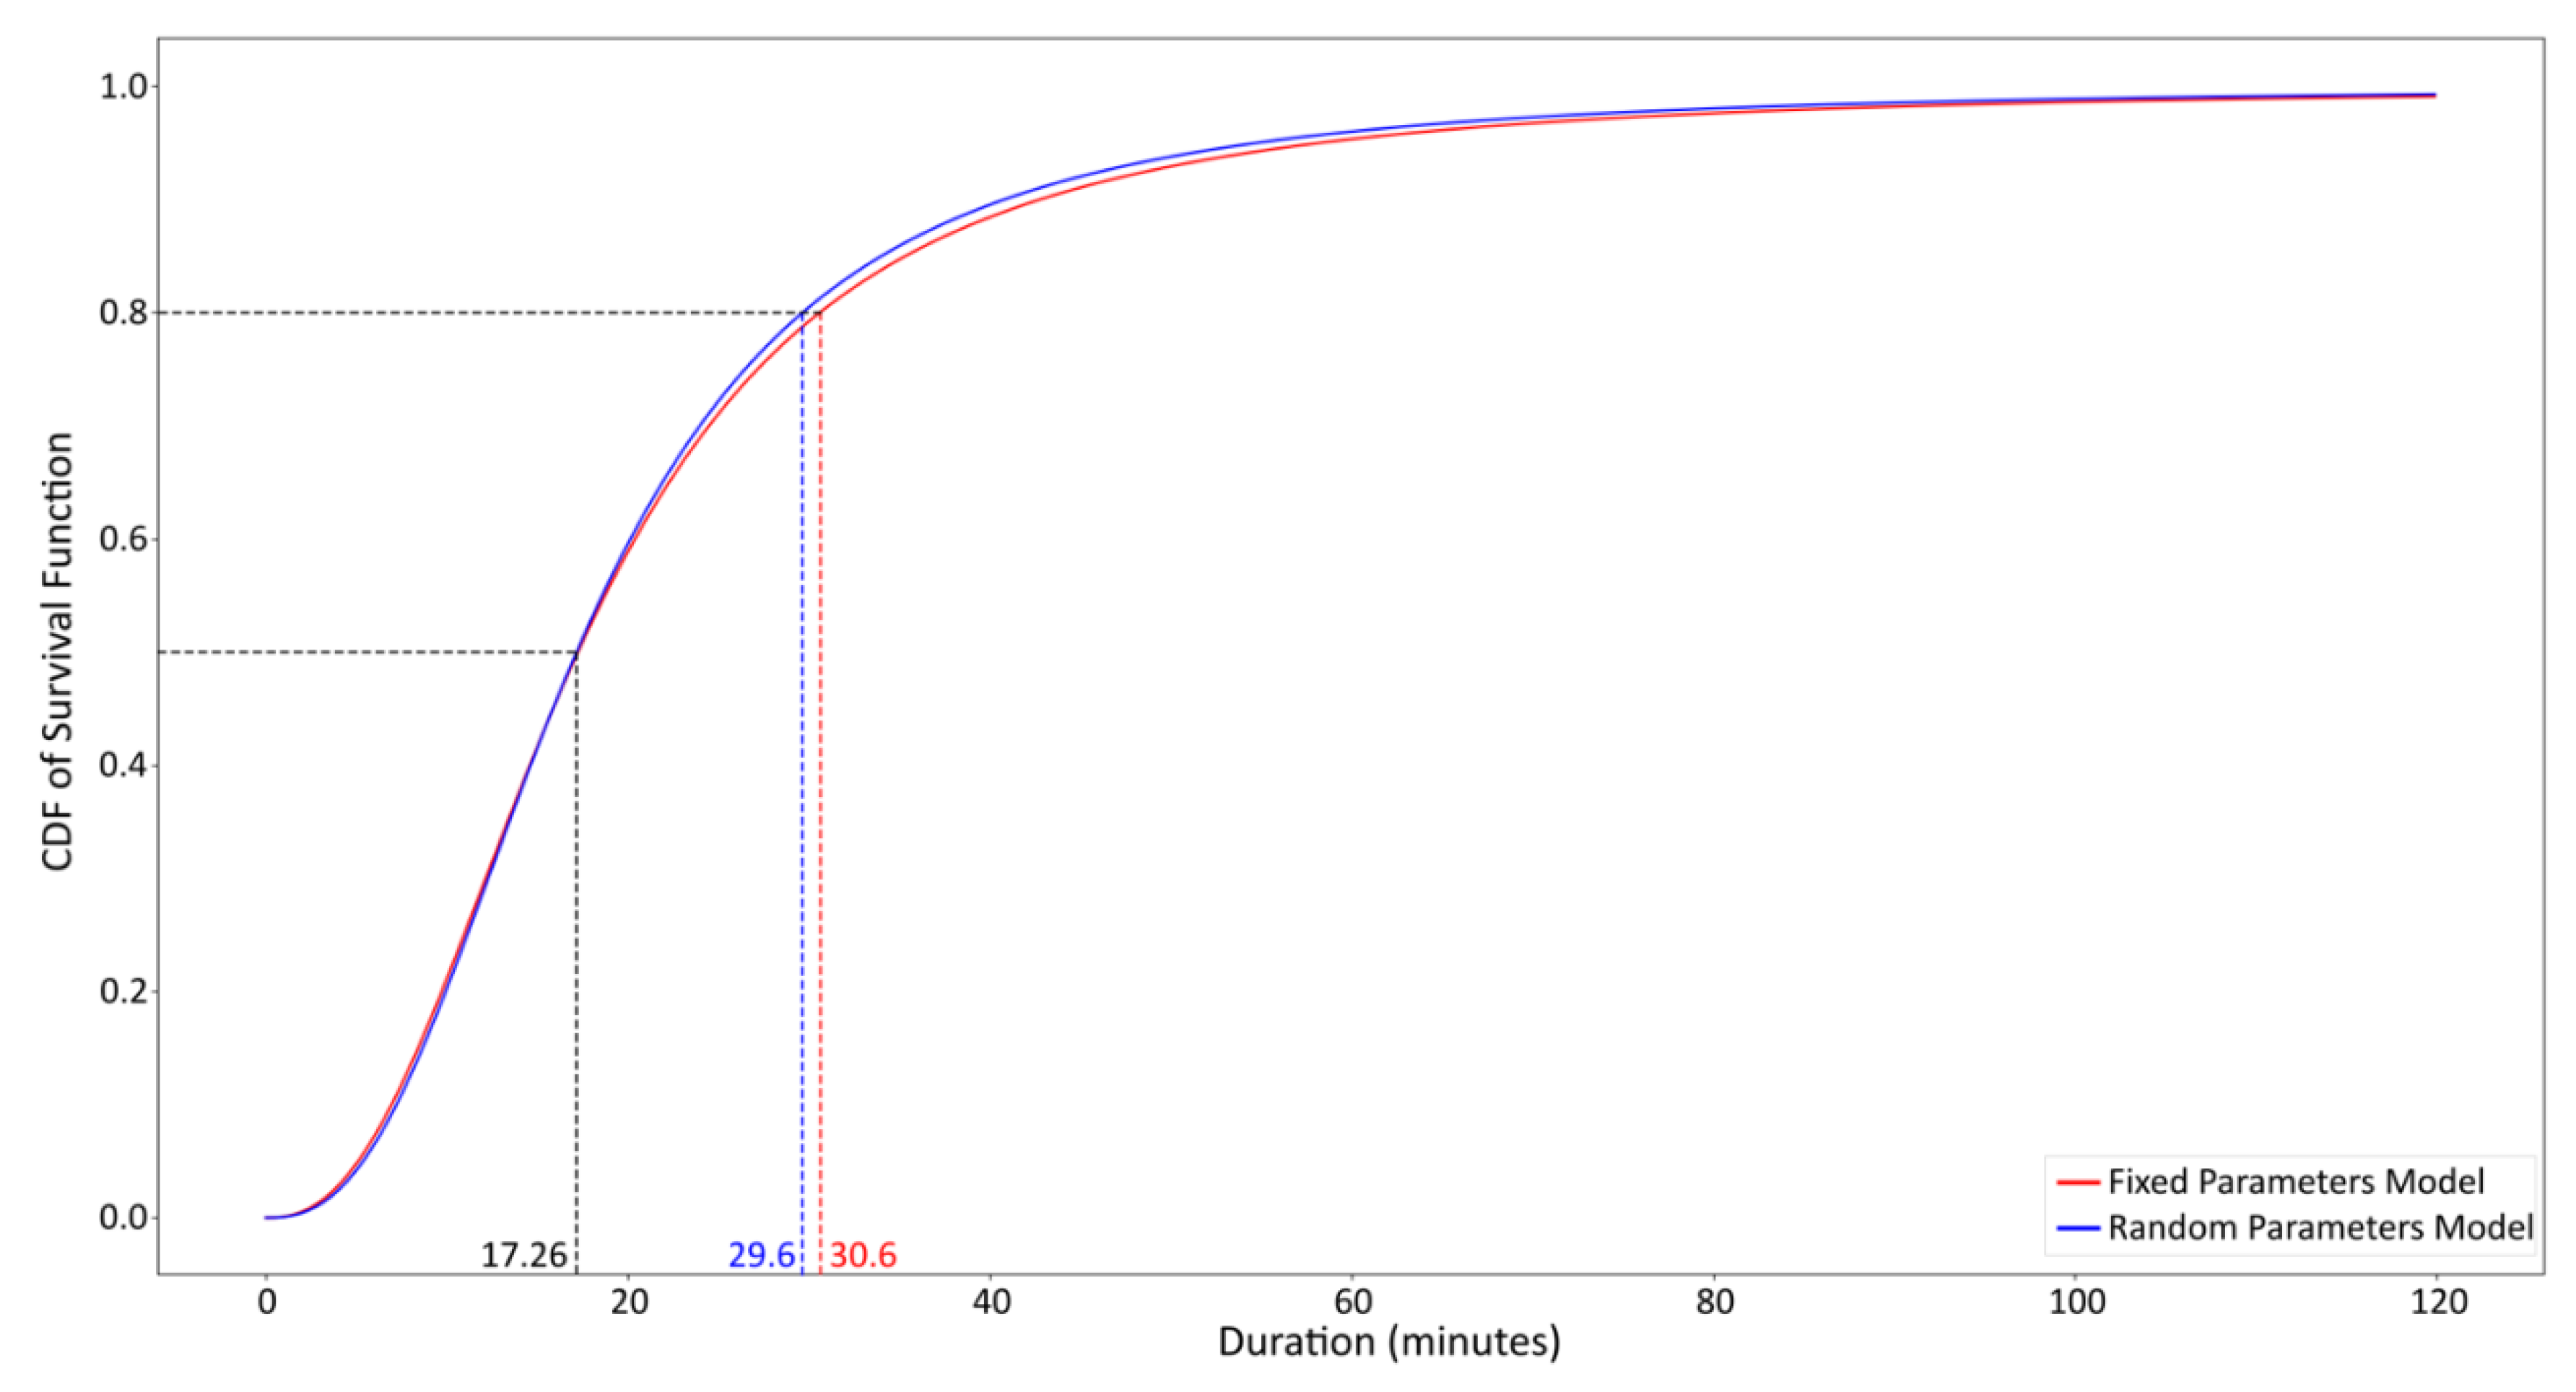
Figure 7.
Estimated hazard function for the log-logistic model.
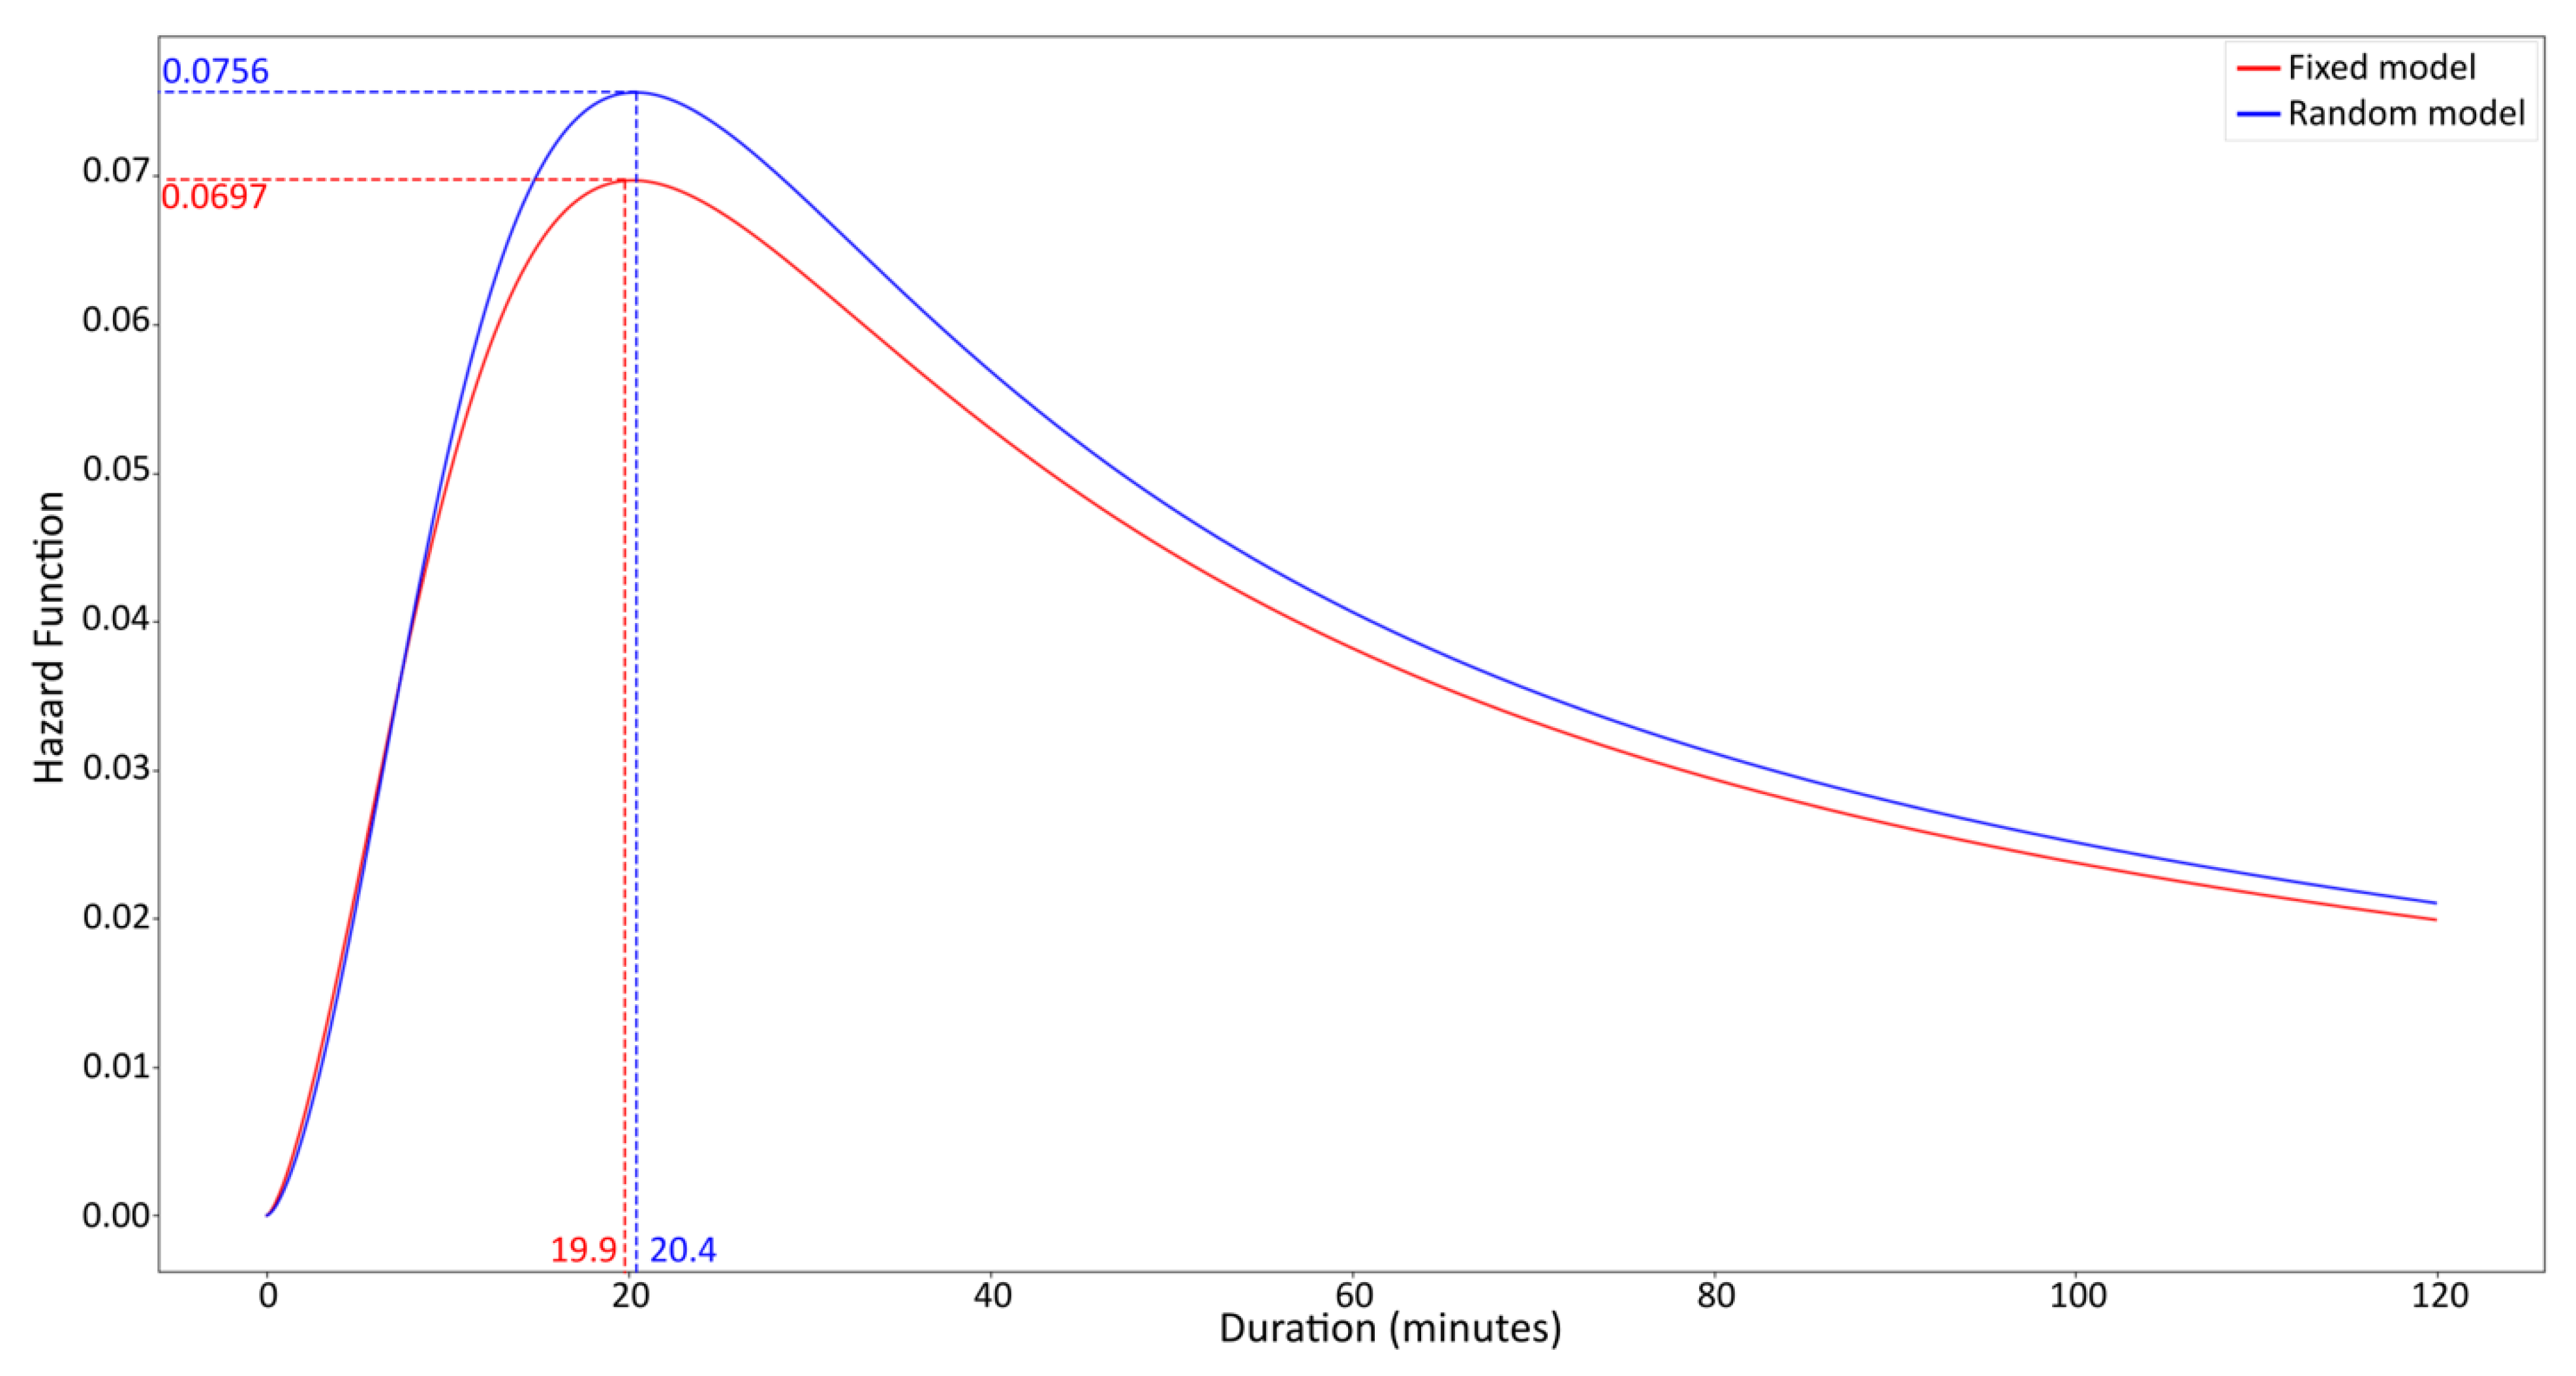

Table 1.
Descriptive Statistics of variables.
| Variable | Description | Pct. or Mean ± S.D. |
Sum |
|---|---|---|---|
| Ridership Characteristics | |||
| Bike Model (Boost = 1, Iconic = 0) | Boos bike = e-bike, Iconic bike = regular bike | 18.10% | 31048 |
| On Demand Passes | Daily, Pay-As-Go or Prepaid pass, 1; else, 0. | 43.33% | 74347 |
| Monthly & Annual Passes | Annual or Monthly pass, 1; else, 0. | 39.76% | 68222 |
| Access Passes | Access Pass, 1; else, 0. | 11.90% | 20419 |
| Temporal Seasonality | |||
| Midday (11 a.m. to 4 p.m.) | Trip between 11 a.m. to 4 p.m., 1; else, 0. | 32.47% | 55711 |
| Evening (4 p.m. to 7 p.m.) | Trip between 4 p.m. to 7 p.m., 1; else, 0. | 26.27% | 45072 |
| Night (7 p.m. to 10 p.m.) | Trip between 7 p.m. to 10 p.m., 1; else, 0. | 18.75% | 32173 |
| AM Peak Hours for weekdays (6 a.m. to 9 a.m.) | Trip between 6 a.m. to 9 a.m. on weekdays, 1; else, 0. | 5.78% | 9917 |
| Weekend (Yes = 1, No = 0) | Trip during a weekend, 1; else, 0. | 35.25% | 60479 |
| Spring | Trip between 03/21/2019 to 06/22/2019 and 03/20/2020 to 06/21/2020, 1; else, 0. | 31.57% | 54166 |
| Summer | Trip between 06/22/2019 to 09/23/2019 and 06/21/2020 to 09/22/2020, 1; else, 0. | 49.39% | 84740 |
| Safety & Station Characteristics | |||
| Same start & end stations | If the start and end stations of the trip are the same, 1; else, 0. | 24.78% | 42522 |
| New station in Suburbs or Detroit | If the station is recently added and located in the suburbs or Detroit, 1; else, 0. | 3.62% | 6199 |
| LTS at Origin | The level of traffic stress for the start station, on a scale of 1 to 4. (4 being the most stressful) | 2.11 1.050 | |
| LTS at Destination | The level of traffic stress for the end station, on a scale of 1 to 4. (4 being the most stressful) | 2.1 1.052 | |
| Covid-19 Impact Features | |||
| Stay at home order | Trip between 03/10/2020 to 06/01/2020, 1; else, 0. | 11.67% | 20024 |
| Gyms are closed (Yes = 1, No = 0) | Trip between 06/02/2020 to 09/02/2020, 1; else, 0. | 35.34% | 60629 |
| Detroit Risk Level D | Trip during Detroit's risk level D, 1; else, 0. | 0.65% | 1112 |
| Detroit Risk Level E | Trip during Detroit's risk level E, 1; else, 0. | 4.32% | 7410 |
| Promotional Free Month Pass | Free Monthly Pass provided by MoGo, 1; else, 0. | 3.72% | 6375 |
| Weather Conditions | |||
| Hourly Temperature | Temperature at the time of the ride (F) | 65.98 15.160 | |
| Clear Weather | The weather was Clear at the start of the ride, 1; else, 0. | 79.85% | 137003 |
| Cloudy | The weather was Cloudy at the start of the ride, 1; else, 0. | 15% | 25728 |
| Wintery Condition | The weather was Wintery at the start of the ride, 1; else, 0. | 0.53% | 911 |
| Raining | The weather was Raining at the start of the ride, 1; else, 0. | 0.44% | 763 |
Table 2.
Summary of the variable coefficients for each model.
| Fixed Parameter Model | Random Parameter Model | Percent Observations | ||||
|---|---|---|---|---|---|---|
| Coef. | t-stat | Coef. | t-stat | Above 0 | Below 0 | |
| Constant | 1.99** | 102.73 | 1.99*** | 108.02 | ||
| Ridership Characteristics | ||||||
| Bike Model (Boost = 1, Iconic = 0) | -0.03*** | -5.6 | -0.03*** | -6.97 | ||
| On Demand Passes | 0.68*** | 47.1 | 0.69*** | 50.23 | ||
| Monthly & Annual Passes | 0.06*** | 3.84 | 0.06*** | 4.06 | 97% | 3% |
| Monthly & Annual Passes Standard Deviation | 0.03*** | 11.14 | ||||
| Access Passes | 0.19*** | 12.58 | 0.18*** | 12.81 | 71% | 29% |
| Access Passes Standard Deviation | 0.33*** | 66.94 | ||||
| Temporal Seasonality | ||||||
| Midday (11 a.m. to 4 p.m.) | 0.06*** | 11.61 | 0.06*** | 11.39 | ||
| Evening (4 p.m. to 7 p.m.) | 0.07*** | 12.99 | 0.06*** | 12.23 | 73% | 27% |
| Standard Deviation of Evening | 0.11*** | 32.13 | ||||
| Night (7 p.m. to 10 p.m.) | 0.07*** | 12.38 | 0.07*** | 12.29 | 100% | |
| Standard Deviation of Night | 0.007* | 1.91 | ||||
| AM Peak Hours for weekdays (6 a.m. to 9 a.m.) | -0.10*** | -11.06 | -0.10*** | -11.59 | ||
| Weekend (Yes = 1, No = 0) | 0.11*** | 28.57 | 0.11*** | 29.34 | ||
| Spring | 0.11*** | 16.91 | 0.10*** | 17.43 | ||
| Summer | 0.08*** | 11.96 | 0.07*** | 11.87 | ||
| Safety & Station Characteristics | ||||||
| Same start & end stations | 0.52*** | 119.6 | 0.52*** | 123.01 | ||
| New station in suburbs or Detroit | 0.07*** | 7.72 | 0.07*** | 7.95 | 59% | 41% |
| Standard Deviation of New station in suburbs or Detroit | 0.31*** | 36.51 | ||||
| LTS at Origin | -0.04*** | -22.58 | -0.04*** | -23.84 | ||
| LTS at Destination | -0.04*** | -21.27 | -0.04*** | -22.51 | ||
| Covid-19 Impact Features | ||||||
| Stay at home order | 0.29*** | 36.46 | 0.29*** | 38.61 | ||
| Gyms are closed (Yes = 1, No = 0) | 0.37*** | 79.5 | 0.35*** | 77.68 | ||
| Standard Deviation of Gyms are closed | 0.34*** | 99.41 | ||||
| Detroit Risk Level E or D | -0.06*** | -5.8 | -0.05*** | -5.56 | ||
| Promotional Free Month Pass | 0.27*** | 15.63 | 0.29*** | 17.21 | ||
| Weather Conditions | ||||||
| Hourly Temperature | 0.003*** | 21.24 | 0.004*** | 22.71 | ||
| Clear Weather when riding | 0.04*** | 4.22 | 0.04*** | 4.48 | 100% | |
| Standard Deviation of Clear Weather when riding | 0.005*** | 3.15 | ||||
| Cloudy when riding | -0.04*** | -4.23 | -0.04*** | -4.35 | ||
| Wintery when riding | -0.06** | -2.14 | -0.06** | -2.28 | ||
| Raining when riding | -0.04*** | -7.91 | -0.04*** | -8.03 | ||
| P (distribution parameter) | 2.41 | 2.54 | ||||
| λ | 0.057 | 0.0582 | ||||
| Number of observations | 171568 | |||||
| Log-likelihood at convergence | -192382.6 | -191821.3 | ||||
Signifiance codes: 0 ‘***’ 0.001 ‘**’ 0.01 ‘*’ 0.05 ‘.’ 0.1 ‘’ 1. Variables with P-values smaller than 0.1 are considered as statistically significant.
Disclaimer/Publisher’s Note: The statements, opinions and data contained in all publications are solely those of the individual author(s) and contributor(s) and not of MDPI and/or the editor(s). MDPI and/or the editor(s) disclaim responsibility for any injury to people or property resulting from any ideas, methods, instructions or products referred to in the content. |
© 2024 by the authors. Licensee MDPI, Basel, Switzerland. This article is an open access article distributed under the terms and conditions of the Creative Commons Attribution (CC BY) license (http://creativecommons.org/licenses/by/4.0/).
Copyright: This open access article is published under a Creative Commons CC BY 4.0 license, which permit the free download, distribution, and reuse, provided that the author and preprint are cited in any reuse.


