

Submitted:
09 August 2024
Posted:
12 August 2024
You are already at the latest version
Abstract
The analysis of aggregate data has received increasing attention in the statistical discipline over the past 20 years. Much of this attention has been focused on estimating the cells frequencies of a 2×2 contingency table given only the marginal totals; the analyses proposed have been received with missed reviews. More recently, the focus has shifted toward analysing the overall association structure rather than on the estimation of the cell frequencies. This article provides some insight int how informative the aggregate data of a single 2×2 contingency table is for assessing the association. The information contained in the margins of the table is quantified using the squared deviation of the expected cell frequencies over the possible range of values, where the row and column totals are known and fixed. The new measure we discuss to quantify this association is referred to as the aggregate informative index (AII) and is shown to be the standardized area under the squared deviation curve.
Keywords:
aggregate data
; aggregate association index
; ecological inference
; Pearson’s chi-squared statistic
1. Introduction
The 2x2 contingency table remains the most fundamental of data structures in the categorical data analysis literature. Due to its relative simplicity in summarizing the joint frequencies of two dichotomous variables, understanding the nature of the association between these variables has a long and rich history. One may refer to the key texts of [1](pp. 219–225), [2](Chapter 2), [3] (Chapter 3), [4] (Chapter 6), [5](Chapter 2), [6](Section 2.1–2.3), [7,8](Section 4.4) and [9] (Chapter 4) for comprehensive and varied discussions on the analysis of 2x2 contingency tables. The past three decades have seen new techniques developed for the analysis of 2x2 contingency tables that involve analyzing the association between the variables when the joint frequencies are known (or assumed) unknown or missing. This branch of analysis is known as ecological inference (EI) and is especially popular in the political and social sciences where marginal, or aggregate, data of dichotomous variables is all that is available for analysis; see, for example [10,11,12,13,14]. As a result, EI has seen this area of research also gain momentum as a topic of research in the statistics literature; see, for example, [15,16,17,18,19,20,21,22]. Furthermore, the growing availability of R and Python packages has also helped to provide researchers with the tools necessary to perform EI; see, for example, [23,24,25,26,27,28,29]. Despite the relative youth of EI in the statistical discipline, studying the association structure between two dichotomous variables given only the marginal information was raised earlier by [30]. His view was that the marginal information of a single 2x2 table provides only ancillary information if inferring the joint cell frequencies was of interest. [31,32] also considered this same issue. [33](p. 447) agreed with Fisher’s conclusion although argued that, for “extreme” marginal frequencies, the estimation of the cell values was possible. [34] demonstrated that, when only the marginal information is available, the maximum likelihood estimate of the joint cell values do not exist unless one of the cells is zero. Others to have considered this issue are [35,36,37].
A common feature of the EI strategies proposed to date is that they all rely on assumptions of the missing data that is either unknown, untestable, or both. In fact, [20] (p. 198), in a study of EI techniques in regard to an empirical evaluation using data describing gender and voter turnout at New Zealand elections (between 1893–1919), said
“all EI methods make assumptions about the data to compensate for the loss of information due to aggregation”
Noteworthy also is that none of the EI strategies mentioned above are applicable for the analysis of a single 22 contingency table. Therefore, rather than focusing on the estimation of the cell values of 22 tables, the focus can be and has been redirected to determining the association structure between the two dichotomous variables, given only the marginal information. In doing so, [38,39] developed an index that does exactly this and referred to it as the aggregated association index or the AAI. The AAI quantifies, on a [0, 100] scale, the extent of association that may be present in the table, based only on the marginal information. It does this by identifying those cell values that lead to a statistically significant association between the variables keeping in mind that the permissible cell values are constrained by a special case of Fréchet bounds, [40].
Further development of the AAI has since been undertaken by [41,42,43,44]. See [45] for an application of the AAI to the 1893 election data of New Zealand, the first country to permit female voting. We also refer the interested reader to [46] who presented a novel application of the AAI for the clustering of stratified aggregated data using the New Zealand voter turnout data (1893–1919). These applications and developments were reported in [47] and elaborated on earlier in [48].
In this paper, we discuss the role of the AAI for assessing how likely the two dichotomous variables of a 22 contingency table are statistically significant, at the α level of significance, given only the row and column totals. The major contribution of this paper is the development of a new index, the aggregate informative index (AII) which quantifies how much information, on a [0, 100] scale, there is in the row and column totals of a 2x2 contingency table for concluding that a statistically significant association exists between the variables. It is established in this paper that, unlike Pearson’s (and other forms of the) chi-squared statistic and the AAI, the new index, AII, is immune to changes in the sample size. The applicability of the AII is demonstrated by using the real-life classic data sets of R.A. Fisher’s criminal twin data [30] and Irving Selikoff’s asbestosis data [49].
This paper has been divided into 6 further sections. In Section 2, we define the notation of a 22 table. Section 3 provides a brief discussion of the AAI, its theory and some of its properties, while Section 4 defines and describes the development of the AII; the origins of this index can be found in [50](Chapter 10). Section 5 and Section 6 empirically study the features of the AII using Fisher’s criminal twin data [30] and Selikoff’s asbestosis data [49], respectively. Some final comments are made in Section 7.
2. The 22 Contingency Table
Consider a 2x2 contingency table, N, of sample size n. Denote to be the joint frequency of the cell so that its relative joint frequency is for and . Define the row and column marginal frequency by and respectively, such that , is total sample size. We shall also denote the row and column relative marginal frequency by and respectively. Table 1 provides a description of notation used in this paper.
For the purposes of investigating how informative the marginal frequencies of N are for analyzing the association between the row and column variables, we consider the conditional probability and . Here, is the conditional probability of the classification of an individual/unit into “Column 1” given that it has been classified into “Row 1”. Similarly, is the conditional probability of an individual/unit being classified into “Column 1” given that they have been classified in “Row 2”. Under the hypothesis of independence between the two dichotomous variables, the expected value of is denoted by . We shall also consider the overall mean cell frequency of the four cells of Table 1, which we denote by . Therefore, the overall mean cell proportion for the cell is 0.25.
When the cell values of Table 1 are not known, then lies within the Fréchet bounds
These bounds have been considered for the analysis of the 2x2 contingency table, especially in the EI literature; see, for example, [13,51]. By considering (1), is therefore bounded by,
Using only the row and column marginal information of a 2x2 table, [39] showed that when a test of the association between the variables is made at the level of significance, the bounds of are narrowed to
Here is the 1 - α percentile of the chi-squared distribution with one degree of freedom.
2. Aggregate Association Index (AAI)
By considering only the marginal information of a single 2x2 table, [38,39] developed the AAI. The AAI is bounded by [0, 100] and quantifies, for a given level of significance α, how likely a particular set of fixed marginal frequencies will enable the analyst to conclude that there exists a statistically significant association between the two dichotomous variables. An AAI close to zero indicates that there is virtually no information in the margins to suggest that such an association might exist, while an AAI close to 100 reflects that such an association is very likely to exist. This section briefly outlines the AAI and shows the impact that the sample size, n, and extreme margins have on its magnitude.
When the four cell frequencies of N are unknown, is also unknown, but bounded by (2). Therefore, we may consider the Pearson’s chi-square statistic as a function of such that
See, for example, [38](eq. (16)). Therefore, by graphically depicting the relationship between (4) and , we obtain a parabolic curve with positive concavity. This curve is referred to as the AAI curve and is depicted Figure 1. Since we are interested in detecting where there exists a statistically significant association between the row and column variables of Table 1, this can then be assessed by observing those values which exceed the critical value of , but lie under the AAI curve. This region is represented by the shaded area of Figure 1. Therefore, the proportion of this shaded area, when compared with the total area under the curve, is
and is the AAI of N. [39] showed that (5) can be alternatively, and equivalent expressed free of the integrals so that
where
The maximum value that the AAI can attain is 100 when the extent of association between both variables is very high. Similarly, the minimum possible value of the AAI is zero and indicates that, given only the marginal information of Table 1, the likelihood of a statistically significant association existing between the variables, at the α level of significance is very low. [39](Section 4) showed that the AAI can also be partitioned as follows
where is the aggregate positive association index and is that part of that reflects the extent to which the marginal information of N reflects a statistically significant positive association at the α level of significance. Similarly, is the aggregate negative association index and reflects a statistically significant negative association at this value of α.
An important issue that needs to be considered when calculating an AAI is that the sample size of N, n, has an impact on its magnitude. One can see that the Pearson’s chi-square statistic, (4), is greatly influenced by the magnitude of the sample size n; see also [2](p. 56). As the sample size increases so does Pearson’s chi-squared statistic, a feature described by [52]. Therefore, for a fixed level of significance, α, the AAI will also increase; so that doubling, say, the original sample size will double the magnitude of the chi-squared statistic. Like Pearson’s chi-squared statistic, this can create problems when assessing the association structure of the variables given only the marginal information. To help reduce this impact of the sample size on the magnitude of the AAI, [42] derives alternative definitions of the AAI, (5). We shall not describe these alternatives here.
4. Aggregate Informative Index (AII)
To accommodate the feature that any change in the sample size of N impacts on the magnitude of Pearson’s statistic and, therefore, the AAI this section introduces a new index that assesses how informative, on a scale from 0 to 100, the marginal frequencies of a 2x2 contingency table are for concluding whether a statistically significant association exists between the variables of the table. This index is referred to as the aggregate informative index, or the AII. To develop this index, we first need to establish a “benchmark” quantity that reflects no information in the marginal totals of N.
4.1. The Benchmark Situation (No-Information)
For any given sample size, n, of a 2x2 contingency table, the individuals/units can be classified into each of the two row and two column categories in a variety of ways. Here we shall define the benchmark situation to be the case where the sample size is equally distributed between the two row categories and the two column categories. For example, in the case where n is even, the benchmark situation arises when . With no further information on the classifications made in the contingency table and assuming that the individuals/units are uniformly distributed between the two categories, this benchmark situation is considered to be the most conservative option. Allocations based on other criteria may also be considered to define the benchmark situation, but to keep the description of our new index simple, we shall not consider them here.
As described by [39], when only marginal information is available, the benchmark situation is also where the least amount of information on the association structure exists. It is also then equally likely that the dichotomous variables are positively or negatively associated. As one moves closer to the case where the allocation of the sample size amongst the categories is deemed to be “extreme” (for example, when or ), the information contain in the margins for establishing whether a statistically significant association exists between the variables becomes more apparent. Based on the underlying structure of the AAI, we shall now quantify how informative the marginal information is by comparing them with the benchmark situation.
In the benchmark situation, the expected cell frequency of the cell, under the null hypothesis of independence between the two dichotomous variables, is identical to the overall mean cell value of the cells. That is, . Therefore, in the benchmark situation, is bounded by
while Pearson’s chi-squared statistic is a parabolic function of with positive concavity such that
Therefore, the AAI curve that describes this relationship is symmetric around and this is also where attains its minimum value of zero. The AAI curve depicted using (7) is referred to as the benchmark curve. In this benchmark case, the maximum value of will be equal to the sample size, n, and this arises at the bounds of (6).
Figure 2 provides a visual comparison of the benchmark and AAI curves given the margins of an unspecified 2x2 contingency table. The shaded region reflects how much information there is in the row and column totals to conclude that the association between the dichotomous variables is statistically significant at the α level of significance. We now describe how to quantify the area of this shaded region.
4.2. The Aggregate Informative Index
The rationale underlying the AII is to quantify the area arising from any deviation of the AAI curve from the benchmark situation. This area is quantified relative to the maximum possible area between the benchmark and AAI curves and is defined by
so that . For (11), the numerator (denoted D) is the area under the curve specified by the difference between the benchmark curve and the AAI curve and is dependent on the range of possible values. The denominator of (11) (denoted M) is the maximum possible area under the AAI or benchmark curve.
If the AII is close to 100 then the features of the AAI curve as different to the benchmark curve as can be. Thus, the marginal information of the 2x2 contingency table varies considerably from the benchmark situation. Hence, the marginal information is deemed to be informative for determining the statistical significance of the association between the variables. Conversely, an AII close to (or equal) to zero shows that the marginal information is consistent with the benchmark situation. Therefore, the marginal information of the 2x2 contingency table is deemed to be not very informative for determining the association between the variables.
We can simplify the AAI of (11) by removing the integrals in the expression. In doing so
and
where
Therefore, can be alternatively, and equivalently, expressed as
Similarly,
Therefore, the AII, (11), may be alternatively, and equivalently, expressed without the need for the integrals so that
Since the magnitude of , and do not depend on the sample size, n, the magnitude of the AII is independent of n. Therefore, unlike the AAI and Pearson’s chi-squared statistic, any change in the sample size of the 2x2 contingency table does not impact on the magnitude of the AII. This feature is shown in the two applications discussed in detail in Section 5 and Section 6.
When visualizing the AII, identifying the points where the benchmark and AAI curves intersect is important. Since both curves are parabolic, there will be either a single or two points of intersection. Suppose we consider the case where there are two points of intersection, denoted by and . They can be derived by solving for when . Doing so yields
Depending on the configuration of the marginal information, there may also be a single point of intersection between the benchmark and AII curves.
5. Application 1: Fisher’s Criminal Twin Data
5.1. The Data
Consider R.A. Fisher’s classic data summarized in Table 2 [30](p. 48). It is based on a study of 30 criminal twins who have been classified according to whether they are monozygotic or dizygotic twins and whether the same sex twins have been convicted for criminal activity or not. This data set was also discussed by [38,39] and recently by [43] in their discussion of the AAI. Therefore, we shall consider it here with a view of demonstrating the applicability of the AII.
In the case when the cell frequencies of Table 2 are assumed known, Pearson’s test of independence gives a p-value 0.0012. Therefore, there is ample evidence to conclude that there is a statistically significant association between the two variables of Table 2. If we “blot out” the cells, as [30](p. 48) originally considered, or have the situation where the cell frequencies are not known, . When a test of the association is performed using the 5% level of significance, there is a statistically significant association between the dichotomous variables of Table 2 when and Also, from (5), the AAI is . The magnitude of this index shows that, using only the marginal information of Table 2, there is strong evidence to conclude that the variables are statistically significantly associated at the 5% level of significance. In fact, by partitioning the AAI we have and . Therefore, the marginal information of Table 2 shows that if there is a statistically significant association between its variables, it is about three times more likely to be positive than negative.
Now that we have determined that the marginal information of Table 2 indicates the likely strength, and direction, of the association between its row and column variables we now determine how informative this information is for making such a conclusion. It is apparent that the two row totals are relatively similar, and the two column totals are relatively similar. If the difference between each row marginal frequency and each column marginal frequency were greater, the AAI of 61.83 may indeed be closer to 100, yielding marginal data that is more informative (when compared with the benchmark situation of “no information”) than what is summarized in Table 2.
To calculate the AII, we first note that the overall mean frequency of the four cells is 30/4 = 7.5 so that in the benchmark situation each row total and column total is 15. Then, any deviation of the row and column totals from this value provides better quality information for identifying the nature of the association that may exist in Table 2. Consider now Pearson’s chi-squared statistic (4). For Table 2 this statistic can be expressed as a function of so that
Similarly, in the benchmark case, this relationship is
A graphical comparison of (15) and (16) is given in Figure 3. By using (12), the points of intersection of the two curves exist at the values of and and D = 3.4006; note that is the only valid intersect between the benchmark and AAI curves of Table 2. We can also see that the maximum area under the curves, for 0, is M = 10 so that the AII of Table 2 is
Therefore, the marginal information of Table 2 is not very informative for assessing the association between the variables.
5.2. On the Robustness of the AII
The relatively small value of the AII arises since there is only a 20% difference between the two columns totals of Table 2 and less than 15% difference between the row totals; here and . Therefore, even if the sample size was doubled (say), and the relative marginal frequencies remained unchanged, the AII will remain unchanged. Note that, unlike the AAI, the magnitude of the AII is independent of the sample size as (13) shows.
5.3. The AII and Extreme Margins
It is also interesting to study the impact on the AII when altering the marginal configuration given a particular sample size, say n = 30. Suppose a more extreme allocation of the marginal frequencies is made such that for all values of n. In this case, using (2), is bounded by , and the relationship between Pearson’s chi-squared statistic and –defined by (4)–is
Therefore, in this case, the AII can be written solely in terms of n so that
Table 3 now summarizes, to 2 decimal places, the behavior of the AII when the sample size of Table 2 has an extreme marginal relative frequency allocation of for various values of n; when n = 30 (as it is for Table 2) this configuration of marginal information means there are only two valid assignments of the cell frequencies which is and . In this case, we can see that the AII changes from 33.0063 (for Table 2) to 54.9261 (when and ). This change in the AII demonstrates the responsiveness of the AII to shifts in the marginal frequencies. It also shows that, in the extreme marginal case, the AII remains, relatively, stable as the sample size increases. Table 3 also summarizes the AAI for and as n → ; recall that the AAI of Table 2 is 61.83 while, for and the AAI is 69.4. Table 3 also shows the increase in the AAI in the case of our extreme marginal configuration as the sample size of Fisher’s crime data increases to n = 5000. Refer to Beh (2008, 2010) and Beh et al. (2015) for a detailed description of the impact of the sample size on the magnitude on the AAI, (5).
6. Application 2: Selikoff’s Asbestosis Data
In 1963, a study was conducted that involved collecting data from 1117 insulation workers in New York. This landmark epidemiological study, and its findings published by Irving Selikoff in 1981 [49], established the link between long-term occupational exposure to asbestos fibers and the severity of asbestosis the workers were diagnosed with. This data, summarized in Table 4, has also been a topic of statistical discussion by [53,54]; where the latter studied the asbestosis data in terms of the AAI. For Table 4, and so that, unlike the columns, the row marginal relative frequencies are notably different from when compared with the marginal relative frequencies of Table 2.
A study of Table 4 shows that, when the cell frequencies are known, a chi-squared test of independence yields a p-value that is less 0.0001. Therefore, the association between the two dichotomous variables of Table 4 is statistically significant. In fact, this association is positive (confirmed by testing the correlation between the variables), a conclusion which helps to confirm Selikoff’s now famous “20-year rule” [49](p. 948); this “rule” reflects the finding that workers who were exposed to asbestos fibers for at least 20 years are at a higher risk of being diagnosed with asbestosis than workers who were exposed to the fibers for less than 20 years.
Suppose that the joint cell frequencies of Table 4 are assumed unknown. Given the marginal information of the data the AAI is (at the 5% level of significance) with and showing the association is slightly more likely to be positive than negative, given the marginal information of Table 4.. Such a very high AAI value indicates that, given only the marginal information, it is highly likely that the association between the years of occupational exposure and whether a worker is diagnosed with asbestosis is statistically significant at the 5% level of significance. The magnitude of the AAI may in fact be due to the large sample size. However, it is also possible that the distribution of the marginal information is also very informative when making a conclusion about the association based solely on this information. To investigate how informative the marginal information is, we shall determine the AII of Table 4.
By considering (4) and (7) for Table 4, the AAI and benchmark curves are defined by the Pearson chi-squared statistics
and
respectively. Figure 4 provides a graphical depiction of these benchmark and AAI curves. Using (2), the bounds of for the AAI curve is and the points of intersection between the AAI curve and the benchmark curve exist at = 0.51 and = 0.56. It is apparent from Figure 4 that the area under the AAI curve, based on the marginal information in Table 2, is vastly different from the area under the benchmark. In fact, D = 262.44 while M = 371.67 giving an AII of
Therefore, the configuration of the marginal information of Table 4 suggests that they are informative for helping to detect the association structure of the two dichotomous variables when the cell frequencies are unknown.
7. Discussion
This paper presents the development of a new index, the aggregate informative index (AII), that quantifies on a [0, 100] scale how informative the marginal information of a 2x2 contingency table is for detecting a statistically significant association between the variables. The calculation of the AII is shown to depend only on the relative marginal frequencies and is independent of the sample size. We have also shown that the AII is highly responsive to changes in the configuration of the relative marginal frequencies.
Future development of the AII can see it expanded for assessing how informative the marginal information of an IxJ contingency table is, where I > 2 and J > 2. Formalizing the mathematical links between the AII and the AAI also requires attention. At present, the AII is expressed in terms of the conditional proportion, , although we see no reason why other measures cannot be considered to quantify the AII. These include the classic odds ratio or a more general linear transformation of . Such extensions would supplement the work on the AAI by [41,43].
Author Contributions
Conceptualization, S.C.; methodology, S.C., E.J.B and I.L.H.; software, E.J.B.; validation, S.C., E.J.B. and I.L.H.; formal analysis, S.C. and E.J.B.; investigation, E.J.B. and I.L.H.; writing—original draft preparation, S.C.; writing—review and editing, E.J.B. and I.L.H.; visualization, E.J.B.; supervision, E.J.B. and I.L.H. All authors have read and agreed to the published version of the manuscript.
Funding
This research received no external funding
Data Availability Statement
Conflicts of Interest
The authors declare no conflicts of interest
References
- Lancaster, H.O. The Chi-squared Distribution; Wiley: New York, USA, 1969. [Google Scholar]
- Everitt, B.S. The Analysis of Contingency Tables, 2nd ed.; Chapman & Hall: London, UK, 1992. [Google Scholar]
- Fleiss, J.L.; Levin, B.; Paik, M.C. Statistical Methods for Rates and Proportions, 3rd ed; Wiley: Hoboken, USA, 2003. [Google Scholar]
- Simonoff, J.S. Analyzing Categorical Data; Springer: New York, USA, 2003. [Google Scholar]
- Agresti, A. An Introduction to Categorical Data Analysis, 2nd ed.; Wiley: Hoboken, USA, 2007. [Google Scholar]
- Agresti, A. Categorical Data Analysis, 3rd ed.; Wiley: Hoboken, USA, 2013. [Google Scholar]
- Kateri, M. Contingency Table Analysis: Methods and Implementation using R; Birkhäuser: New York, USA, 2010. [Google Scholar]
- Friendly, M.; Meyer, D. Discrete Data Analysis with R: Visualization and Modeling Techniques for Categorical and Count Data; CRC Press: Boca Raton, USA, 2016. [Google Scholar]
- Fagerland, M.W.; Lydersen, S.; Laake, P. Statistical Analysis of Contingency Tables; CRC Press: Boca Raton, USA, 2017. [Google Scholar]
- Goodman, L. Ecological regressions and the behavior of individuals. American Sociological Review 1953, 18, 663–666. [Google Scholar] [CrossRef]
- Goodman, L. Some alternatives to ecological correlation. The American Journal of Sociology 1959, 64, 610–625. [Google Scholar] [CrossRef]
- Freedman, D.A.; Stephen, P.K.; Jerome, S.; Charles, A.S.; Charles, G.E. Ecological regression and voting rights. Evaluation Review 1991, 15, 673–711. [Google Scholar] [CrossRef]
- King, G. A Solution to Ecological Inference Problem; Princeton University Press: Princeton, USA, 1997. [Google Scholar]
- King, G.; Rosen, O.; Tanner, M.A. Binomial-beta hierarchical models for ecological inference. Sociological Methods & Research 1999, 28, 61–90. [Google Scholar]
- Rosen, O.; Jiang, W.; King, G.; Tanner, M.A. Bayesian and frequentist inference for ecological inference: the RxC case. Statistica Neerlandica 2001, 55, 134–156. [Google Scholar] [CrossRef]
- Chambers, R.L.; Steel, D.G. Simple methods for ecological inference in 2x2 tables. Journal of the Royal Statistical Society, Series A 2001, 164, 175–192. [Google Scholar] [CrossRef]
- Steel, D.G.; Beh, E.J.; Chambers, R.L. The information in aggregate data. In Ecological Inference: New Methodological Strategies; King, G., Rosen, O., Tanner, M.A., Eds.; Cambridge University Press: Cambridge, UK, 2004; pp. 51–68. [Google Scholar]
- Wakefield, J. Ecological inference for 2x2 tables. Journal of Royal Statistical Society, Series A 2004, 167, 385–445. [Google Scholar]
- Greiner, D.; Quinn, K. RxC ecological inference: bounds, correlations, flexibility and transparency of assumptions. Journal of the Royal Statistical Society, Series A 2009, 172, 67–81. [Google Scholar] [CrossRef]
- Hudson, I.L.; Moore, L.; Beh, E.J.; Steel, D.G. Ecological inference techniques: an empirical evaluation using data describing gender and voter turnout at New Zealand elections 1893-1919. Journal of the Royal Statistical Society: Series A 2010, 173, 185–213. [Google Scholar] [CrossRef]
- Wakefield, J.; Haneuse, S.; Dobra, A.; Teeple, E. Bayes computation for ecological inference. Statistics in Medicine 2011, 30, 1381–1396. [Google Scholar] [CrossRef]
- Plescia, C.; De Sio, L. An evaluation of the performance and suitability of RxC methods for ecological inference with known true values. Quality & Quantity 2018, 52, 669–683. [Google Scholar]
- Jackson, C. Ecological inference with R: the ecoreg package (Version 0.2.3). URL. Available online: https://cran.r-project.org/web/packages/ecoreg/index.html (accessed on 8 August 2024).
- Imai, K.; King, G.; Lau, O. Toward a common framework for statistical analysis and development. Journal of Computational and Graphical Statistics 2008, 17, 892–913. [Google Scholar] [CrossRef]
- Imai, K.; King, G.; Lau, O. Zelig: everyone’s statistical software. R package version 3.4–5, URL. Available online: https://gking.harvard.edu/zelig (accessed on 8 August 2024).
- Imai, K.; Lu, Y.; Strauss, A. eco: R package for ecological inference in 2x2 tables. Journal of Statistical Software 2011, 42, 1–23. [Google Scholar] [CrossRef]
- Lau, O.; Moore, R.T.; Kellermann, M. eiPack: RxC ecological inference and higher-dimension data management. R News 2007, 7, 43–47. [Google Scholar]
- Collingwood, L.; Oskooii, K.; Garcia-Rios, S.; Barretto, M. eiCompare: comparing ecological inference estimates across EI and EI:RxC. The R Journal 2016, 8, 92–101. [Google Scholar] [CrossRef]
- Knudson, K.C.; Schoenbach, G.; Becker, A. PyEI: a Python package for ecological inference. The Journal of Open Source Software 2021, 6, 3397. [Google Scholar] [CrossRef]
- Fisher, R.A. The logic of inductive inference (with discussion). Journal of Royal Statistical Association, Series A 1935, 98, 39–82. [Google Scholar]
- Plackett, R.L. The marginal totals of a 2x2 table. Biometrika 1977, 64, 37–42. [Google Scholar]
- Berkson, J. Do the marginal totals of the 2x2 table contain relevant information respecting the table proportion? Journal of Statistical Planning and Inference 1978, 2, 27–42. [Google Scholar] [CrossRef]
- Yates, F. Tests of significance for 2x2 contingency tables (with discussion). Journal of Royal Statistical Society, Series A 1984, 147, 426–463. [Google Scholar] [CrossRef]
- Haber, M. Do the marginal total of a 2x2 contingency table contain information regarding the table proportion? Communication in Statistics: Theory and Methods 1989, 18, 147–156. [Google Scholar] [CrossRef]
- Aitkin, M.; Hind, J.P. Comments to Yates’ “Tests of significance for 2x2 contingency tables”. Journal of Royal Statistical Society, Series A 1984, 147, 453–454. [Google Scholar]
- Barnard, G.A. Comments to Yates’ “Tests of significance for 2x2 contingency tables”. Journal of Royal Statistical Society, Series A 1984, 147, 449–450. [Google Scholar]
- Beh, E.J.; Steel, D.G.; Booth, J.G. What useful information is in the marginal frequencies of a 2x2 table? Preprint 4/02, School of Mathematics and Applied Statistics, University of Wollongong, Australia, 2002.
- Beh, E.J. Correspondence analysis of aggregate data: The 2x2 table. Journal of Statistical Planning and Inference 2008, 138, 2941–2952. [Google Scholar] [CrossRef]
- Beh, E.J. The aggregate association index. Computational Statistics & Data Analysis 2010, 54, 1570–1580. [Google Scholar]
- Fréchet, M. Sur les tableaux de corrélation dont les marges sont données. Annales de L’Université de Lyon, Section A, Série 3 1951, 14, 53–77. [Google Scholar]
- Beh. E.J.; Tran, D.; Hudson, I.L. A reformulation of the aggregate association index using the odds ratio. Computational Statistics & Data Analysis 2013, 68, 52–65. [Google Scholar]
- Beh, E.J.; Cheema, S.A.; Tran, D.; Hudson, I.L. Adjustment to the aggregate association index to minimize the impact of large samples. In Advances in Latent Variables; Carpita, M., Brentari, E., Qannari, E.M., Eds.; Springer: Berlin, Germany, 2015; pp. 241–251. [Google Scholar]
- Beh, E.J.; Tran, D.; Hudson, I.L. A generalization of the aggregate association index (AAI): Incorporating a linear transformation of the cells of a 2x2 table. Metrika 2024, 87, 499–531. [Google Scholar] [CrossRef]
- Lombardo, R.; Beh, E.J. The prediction index of aggregate data. Journal of Applied Statistics 2016, 43, 1998–2018. [Google Scholar] [CrossRef]
- Tran, D.; Beh, E.J.; Hudson, I.L. The aggregate association index applied to stratified 2x2 tables: Application to the 1893 election data in New Zealand. Statistical Journal of the IAOS 2018, 34, 379–394. [Google Scholar] [CrossRef]
- Beh, E.J.; Tran, D.; Hudson, I.L.; Moore, L. Clustering of stratified aggregated data using the aggregate association index: analysis of New Zealand voter turnout (1893–1919). In Analysis and Modeling Complex Data in Behavioral and Social Sciences; Vicari, D., Okada, A., Ragozini, G., Weihs, C., Eds.; Springer: Cham, Switzerland, 2014; pp. 21–28. [Google Scholar]
- Fairburn, M.; Olssen, E. Class, Gender and the Vote: Historical Perspectives from New Zealand; University of Otago Press: Dunedin, 2013. [Google Scholar]
- Moore, L. Gender Counts: Men, Women and Electoral Politics in New Zealand, 1893–1919; Unpublished. MA Thesis, University of Canterbury, Christchurch, NZ, 2004. [Google Scholar]
- Selikoff, I.J. Household risk with inorganic fibers. Bulletin of the New York Academy of Medicine 1981, 57, 947–961. [Google Scholar] [PubMed]
- Cheema, S.A. The Aggregate Association Index and its Extensions. Unpublished. PhD Thesis, University of Newcastle, Australia, 2016. [Google Scholar]
- Duncan, O.D.; Davis, B. An alternative to ecological correlation. American Sociological Review 1953, 18, 665–666. [Google Scholar] [CrossRef]
- Mosteller, F. Association and estimation in contingency tables. Journal of the American Statistical Association 1968, 63, 1–28. [Google Scholar] [CrossRef]
- Beh, E.J.; Smith, D.R. Real world occupational epidemiology, part 1: Odds ratios, relative risk and asbestosis. Archives of Environmental and Occupational Health 2011, 66, 119–123. [Google Scholar] [CrossRef]
- Tran, D.; Beh, E.J.; Smith, D.R. ; Real-world occupational epidemiology, part 3: An aggregate data analysis of Selikoff’s “20-year rule”. Archives of Environmental and Occupational Health 2012, 67, 243–248. [Google Scholar] [CrossRef] [PubMed]
Figure 1.
The shaded region depicts aggregate association index (AAI).
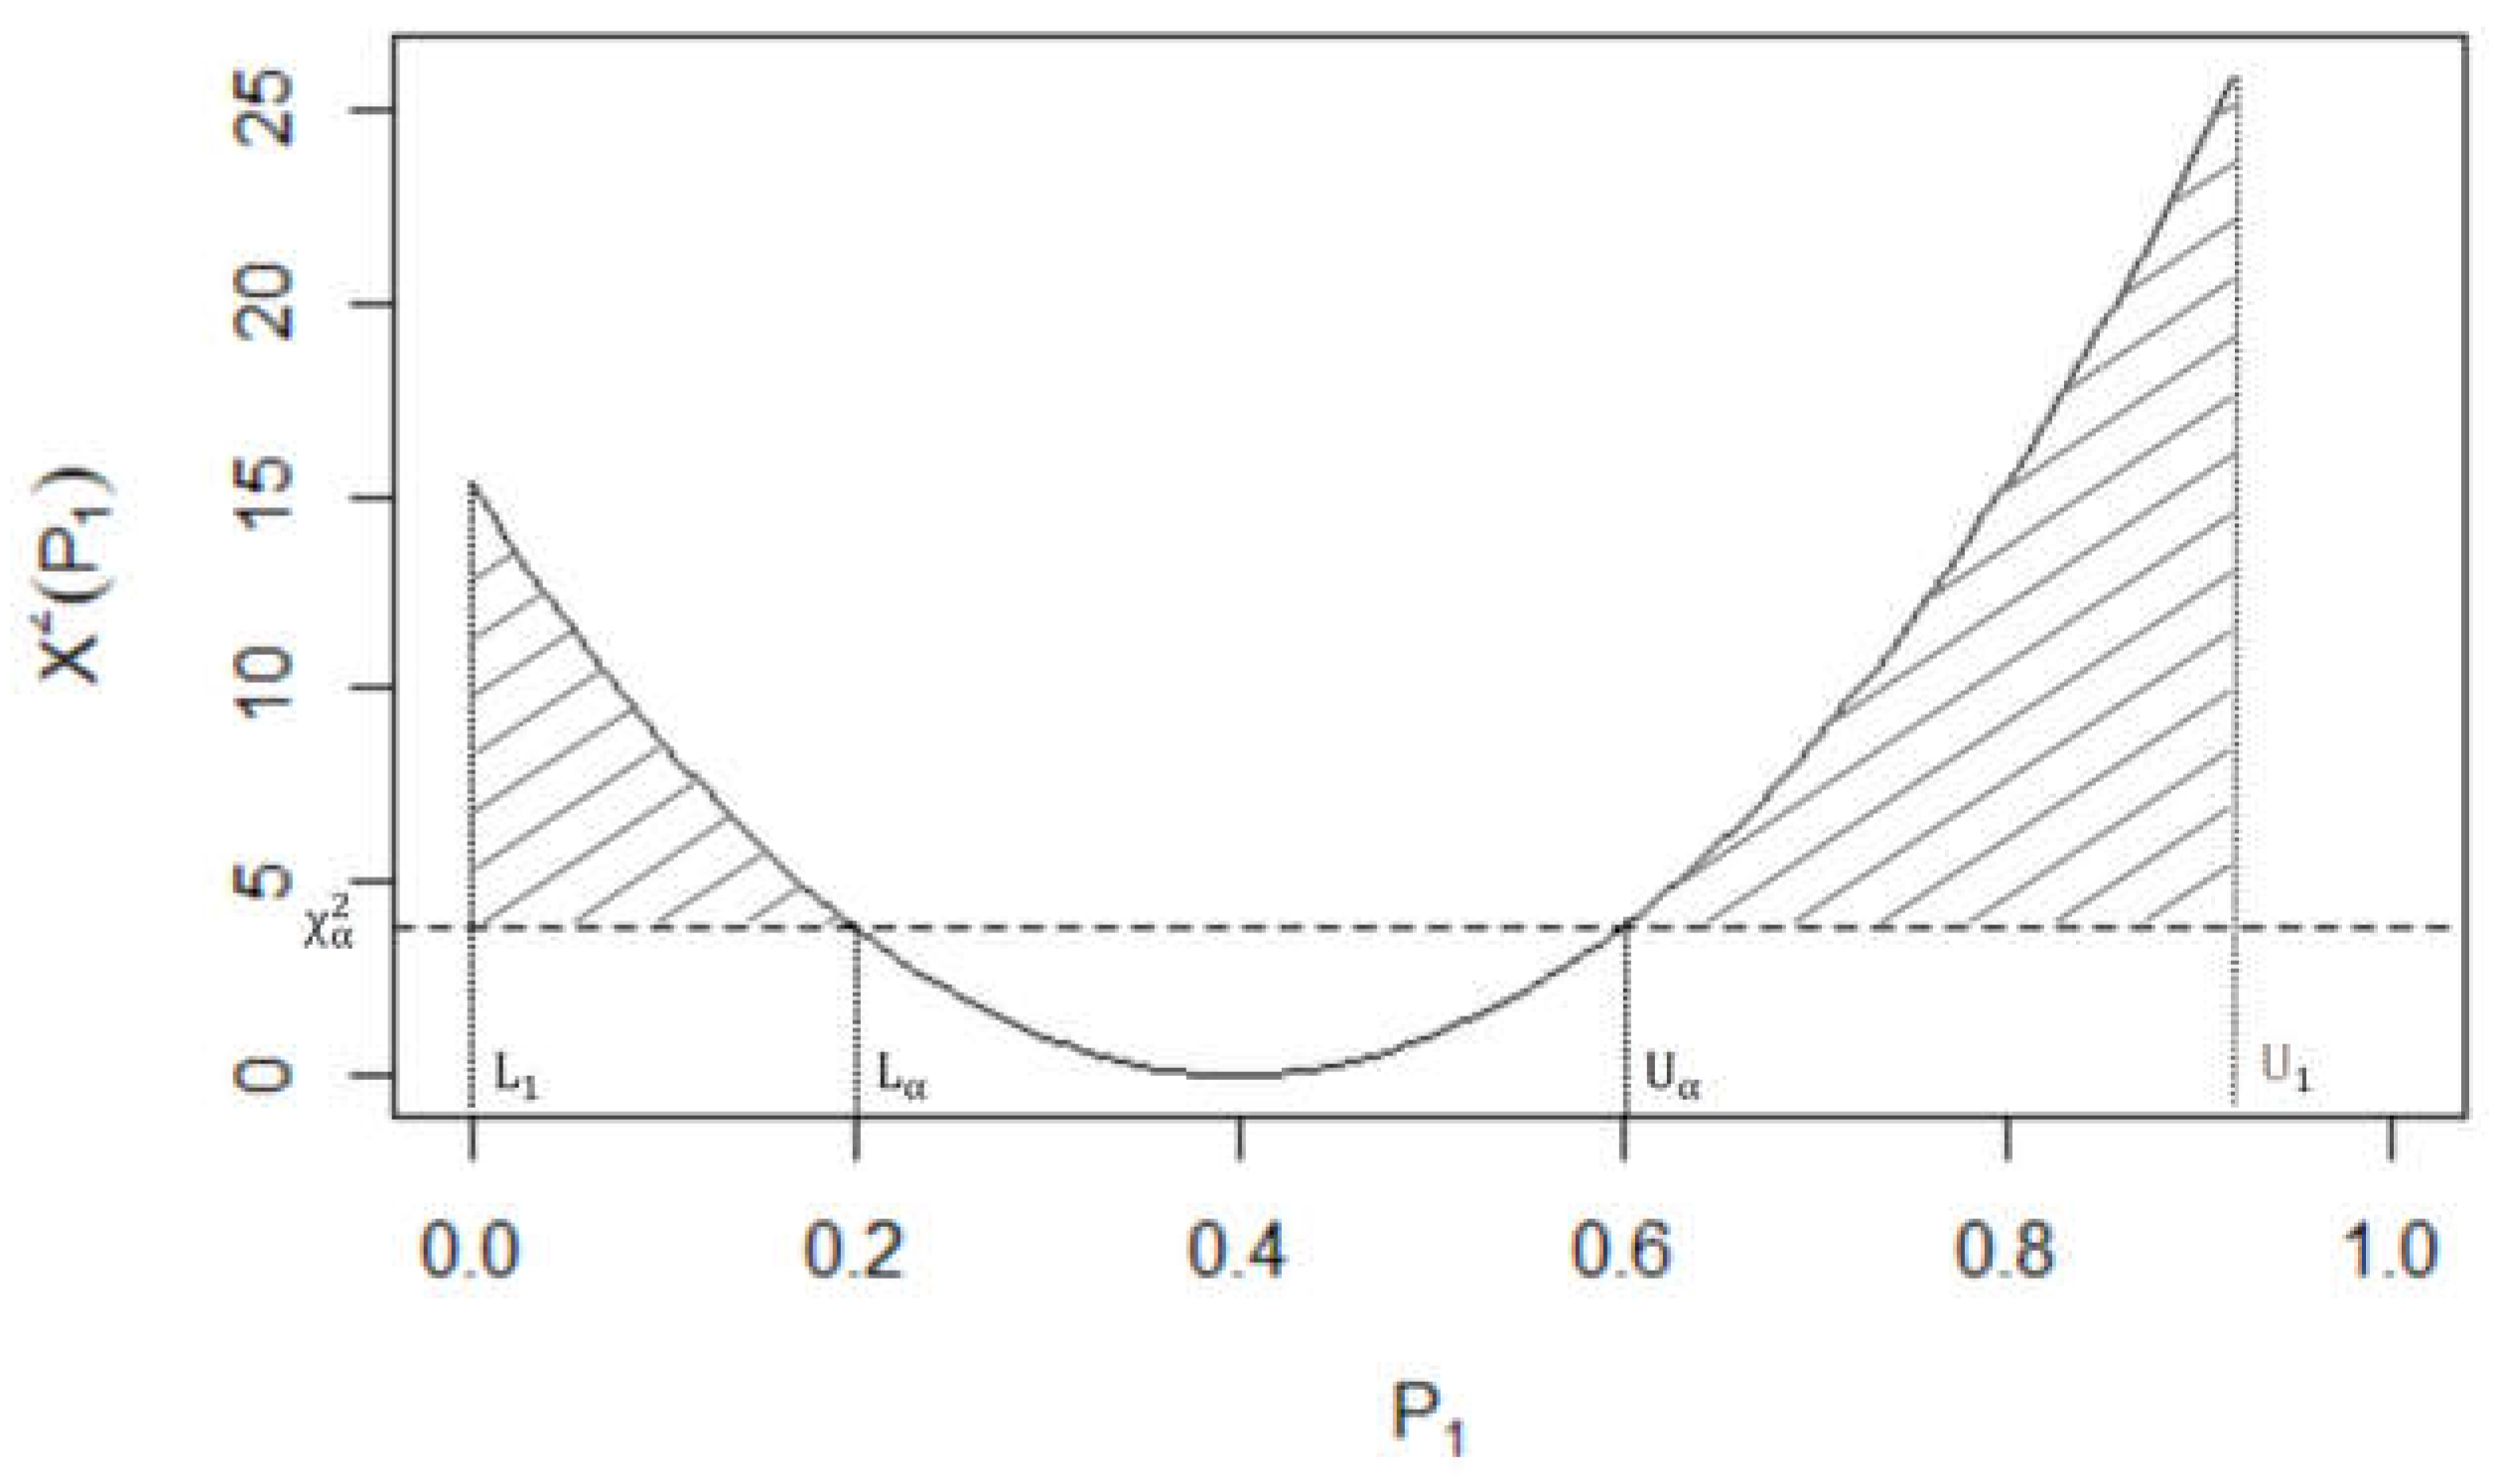
Figure 2.
A graphical interpretation of the AAI curve and the benchmark curve for n = 40 yielding the AII (the shaded region);
Figure 2.
A graphical interpretation of the AAI curve and the benchmark curve for n = 40 yielding the AII (the shaded region);
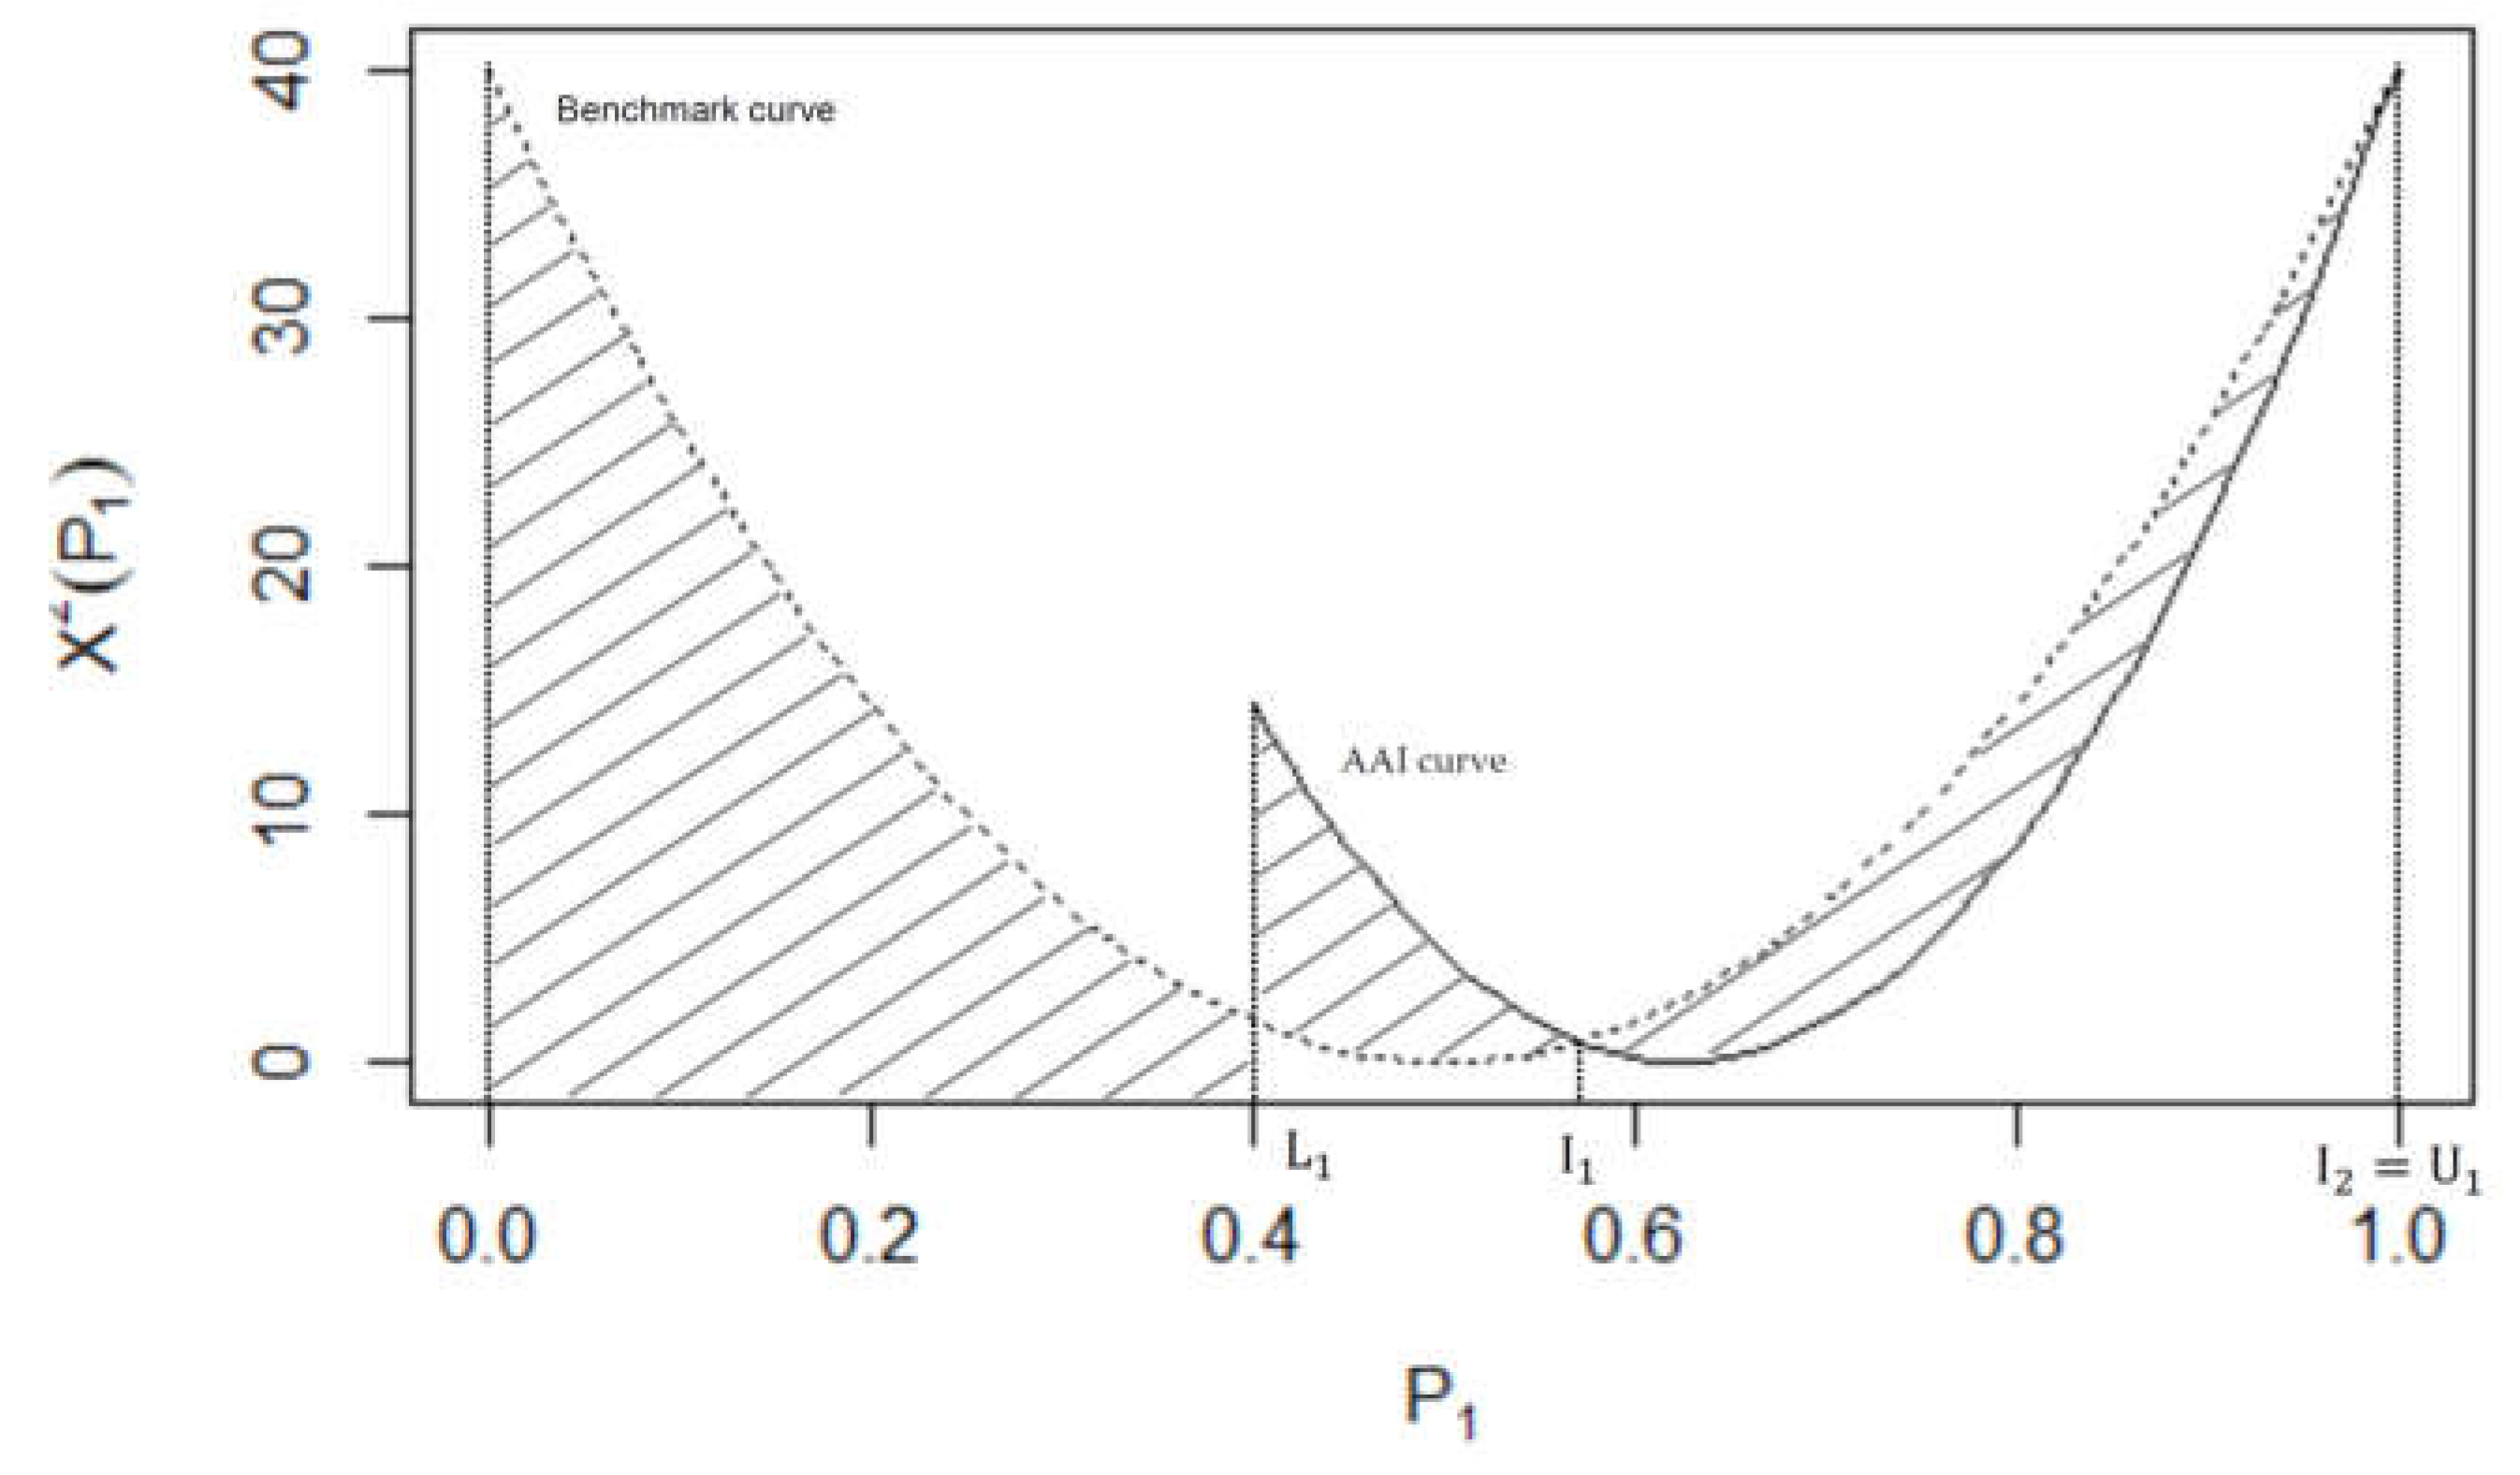
Figure 3.
A graphical interpretation of the AII for Table 1.
Figure 3.
A graphical interpretation of the AII for Table 1.
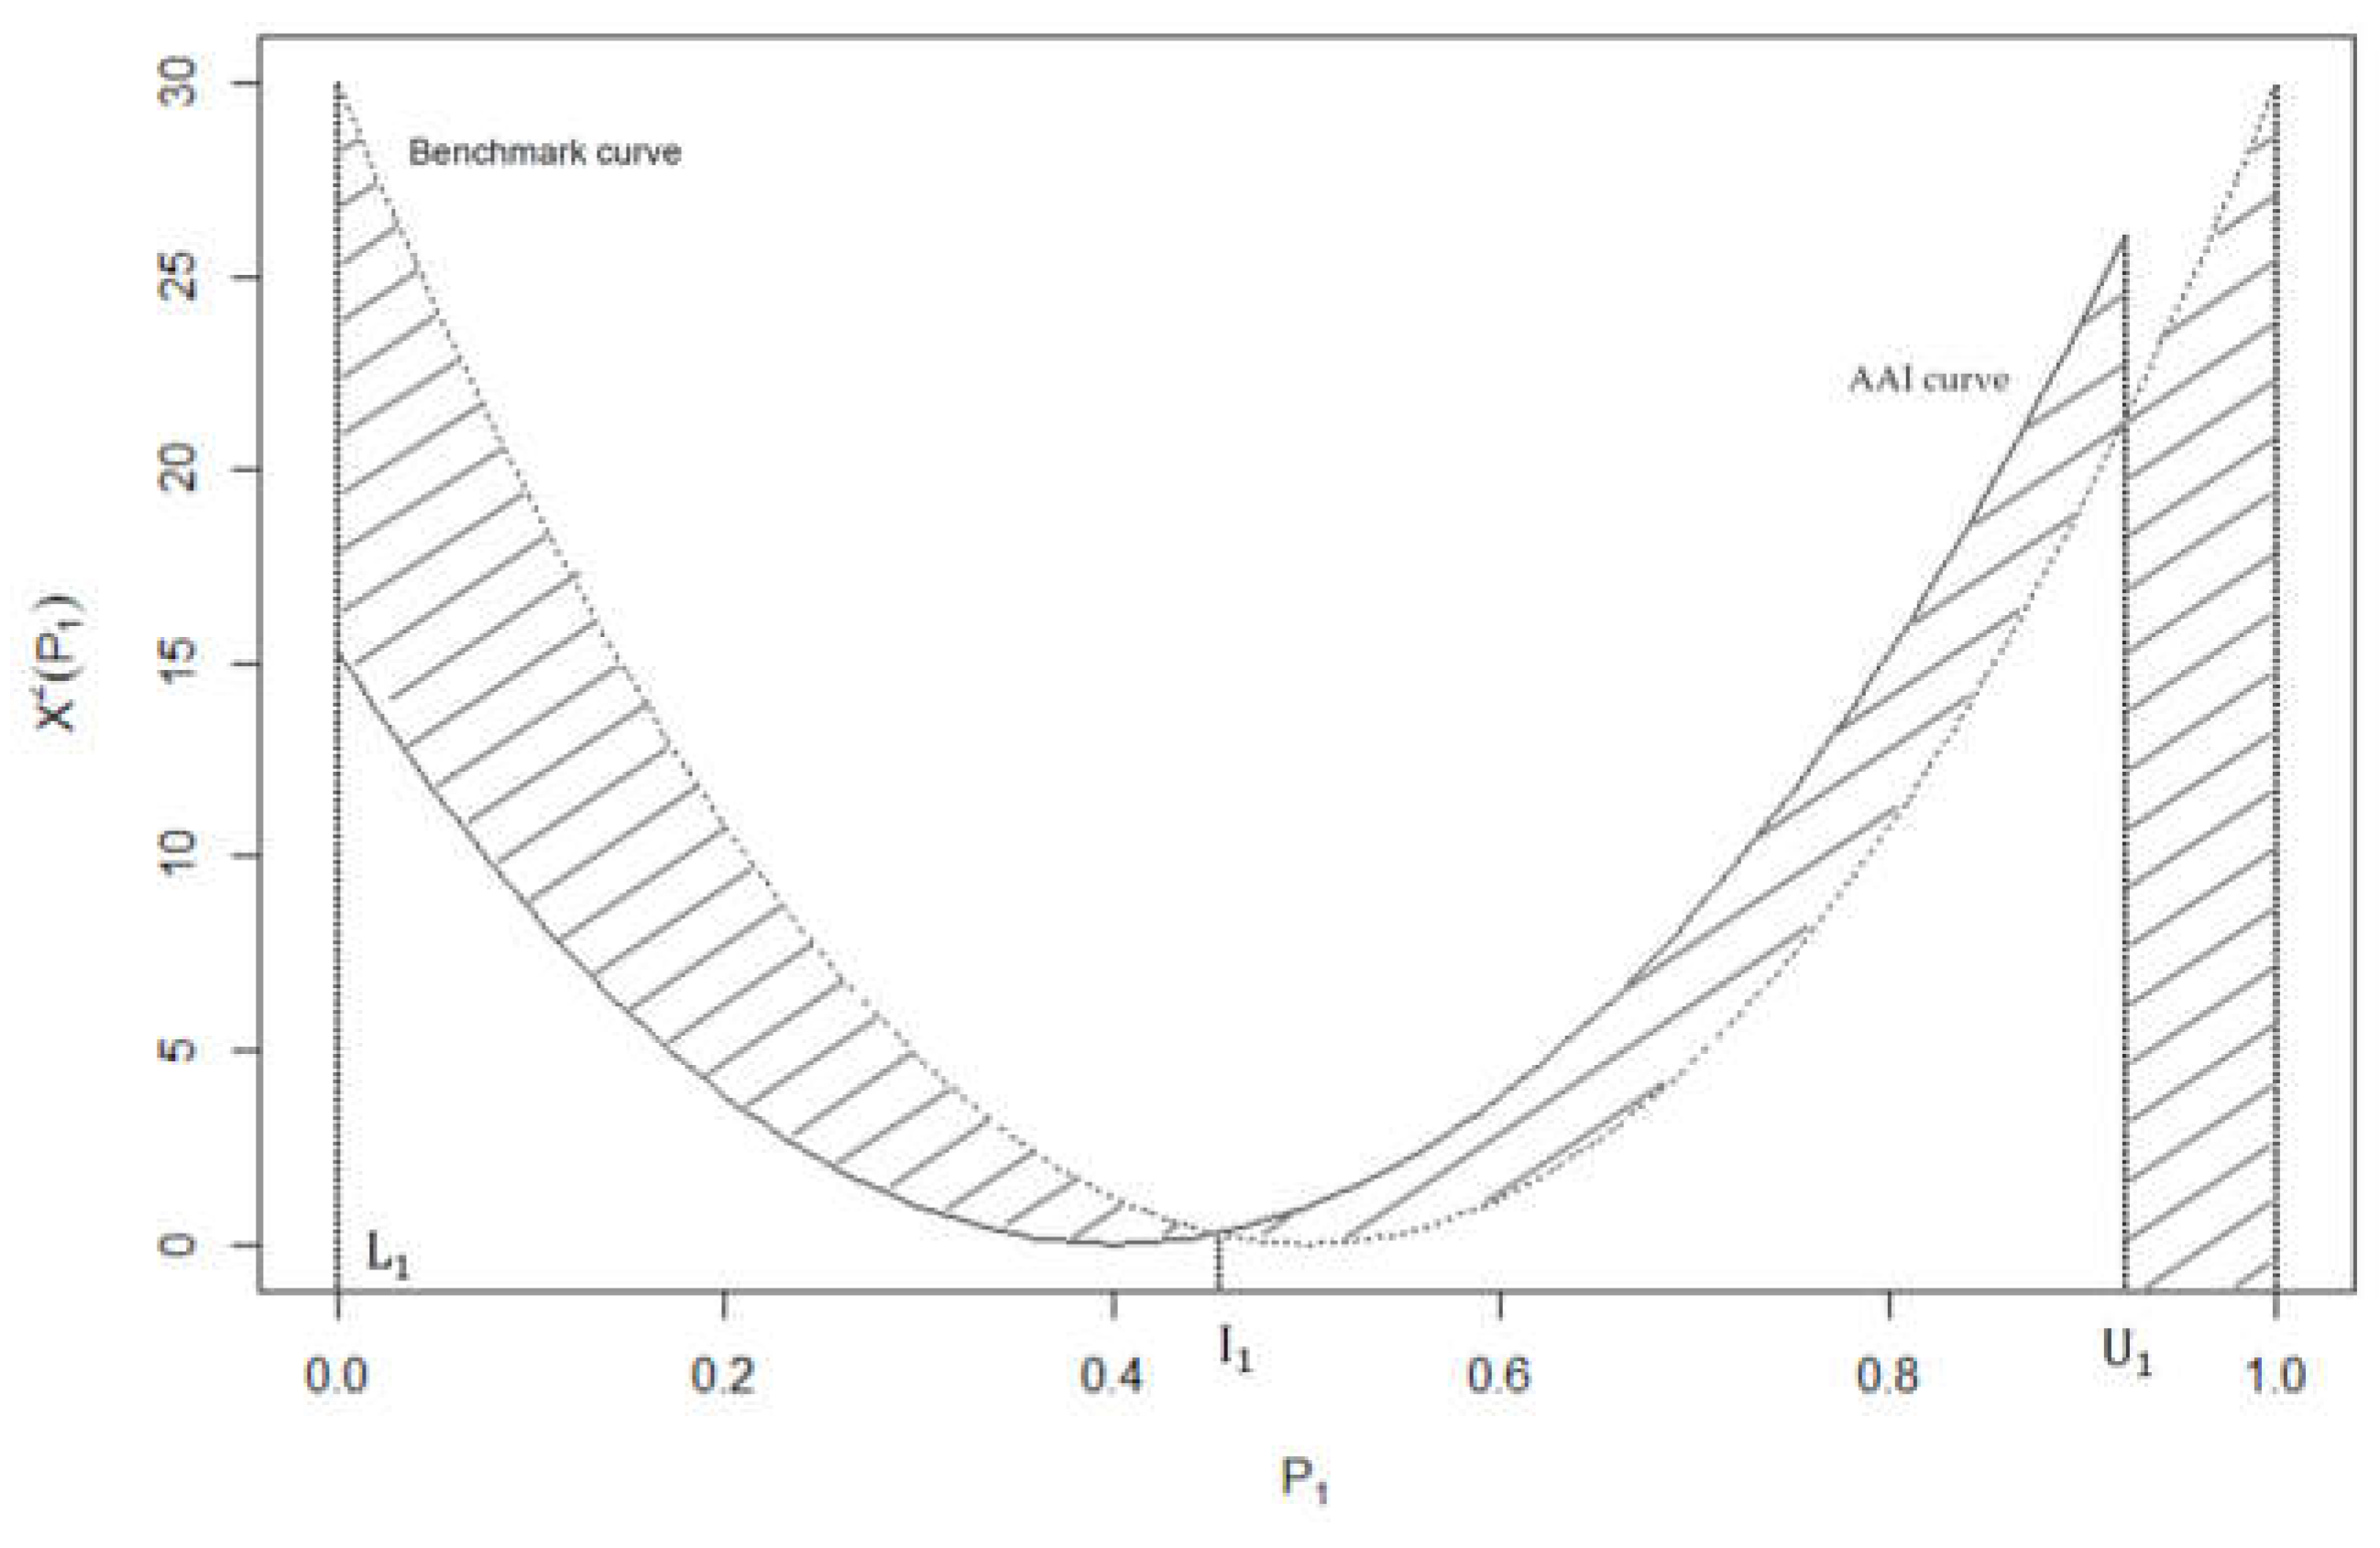
Figure 4.
A graphical interpretation of the AII for Table 4.
Figure 4.
A graphical interpretation of the AII for Table 4.
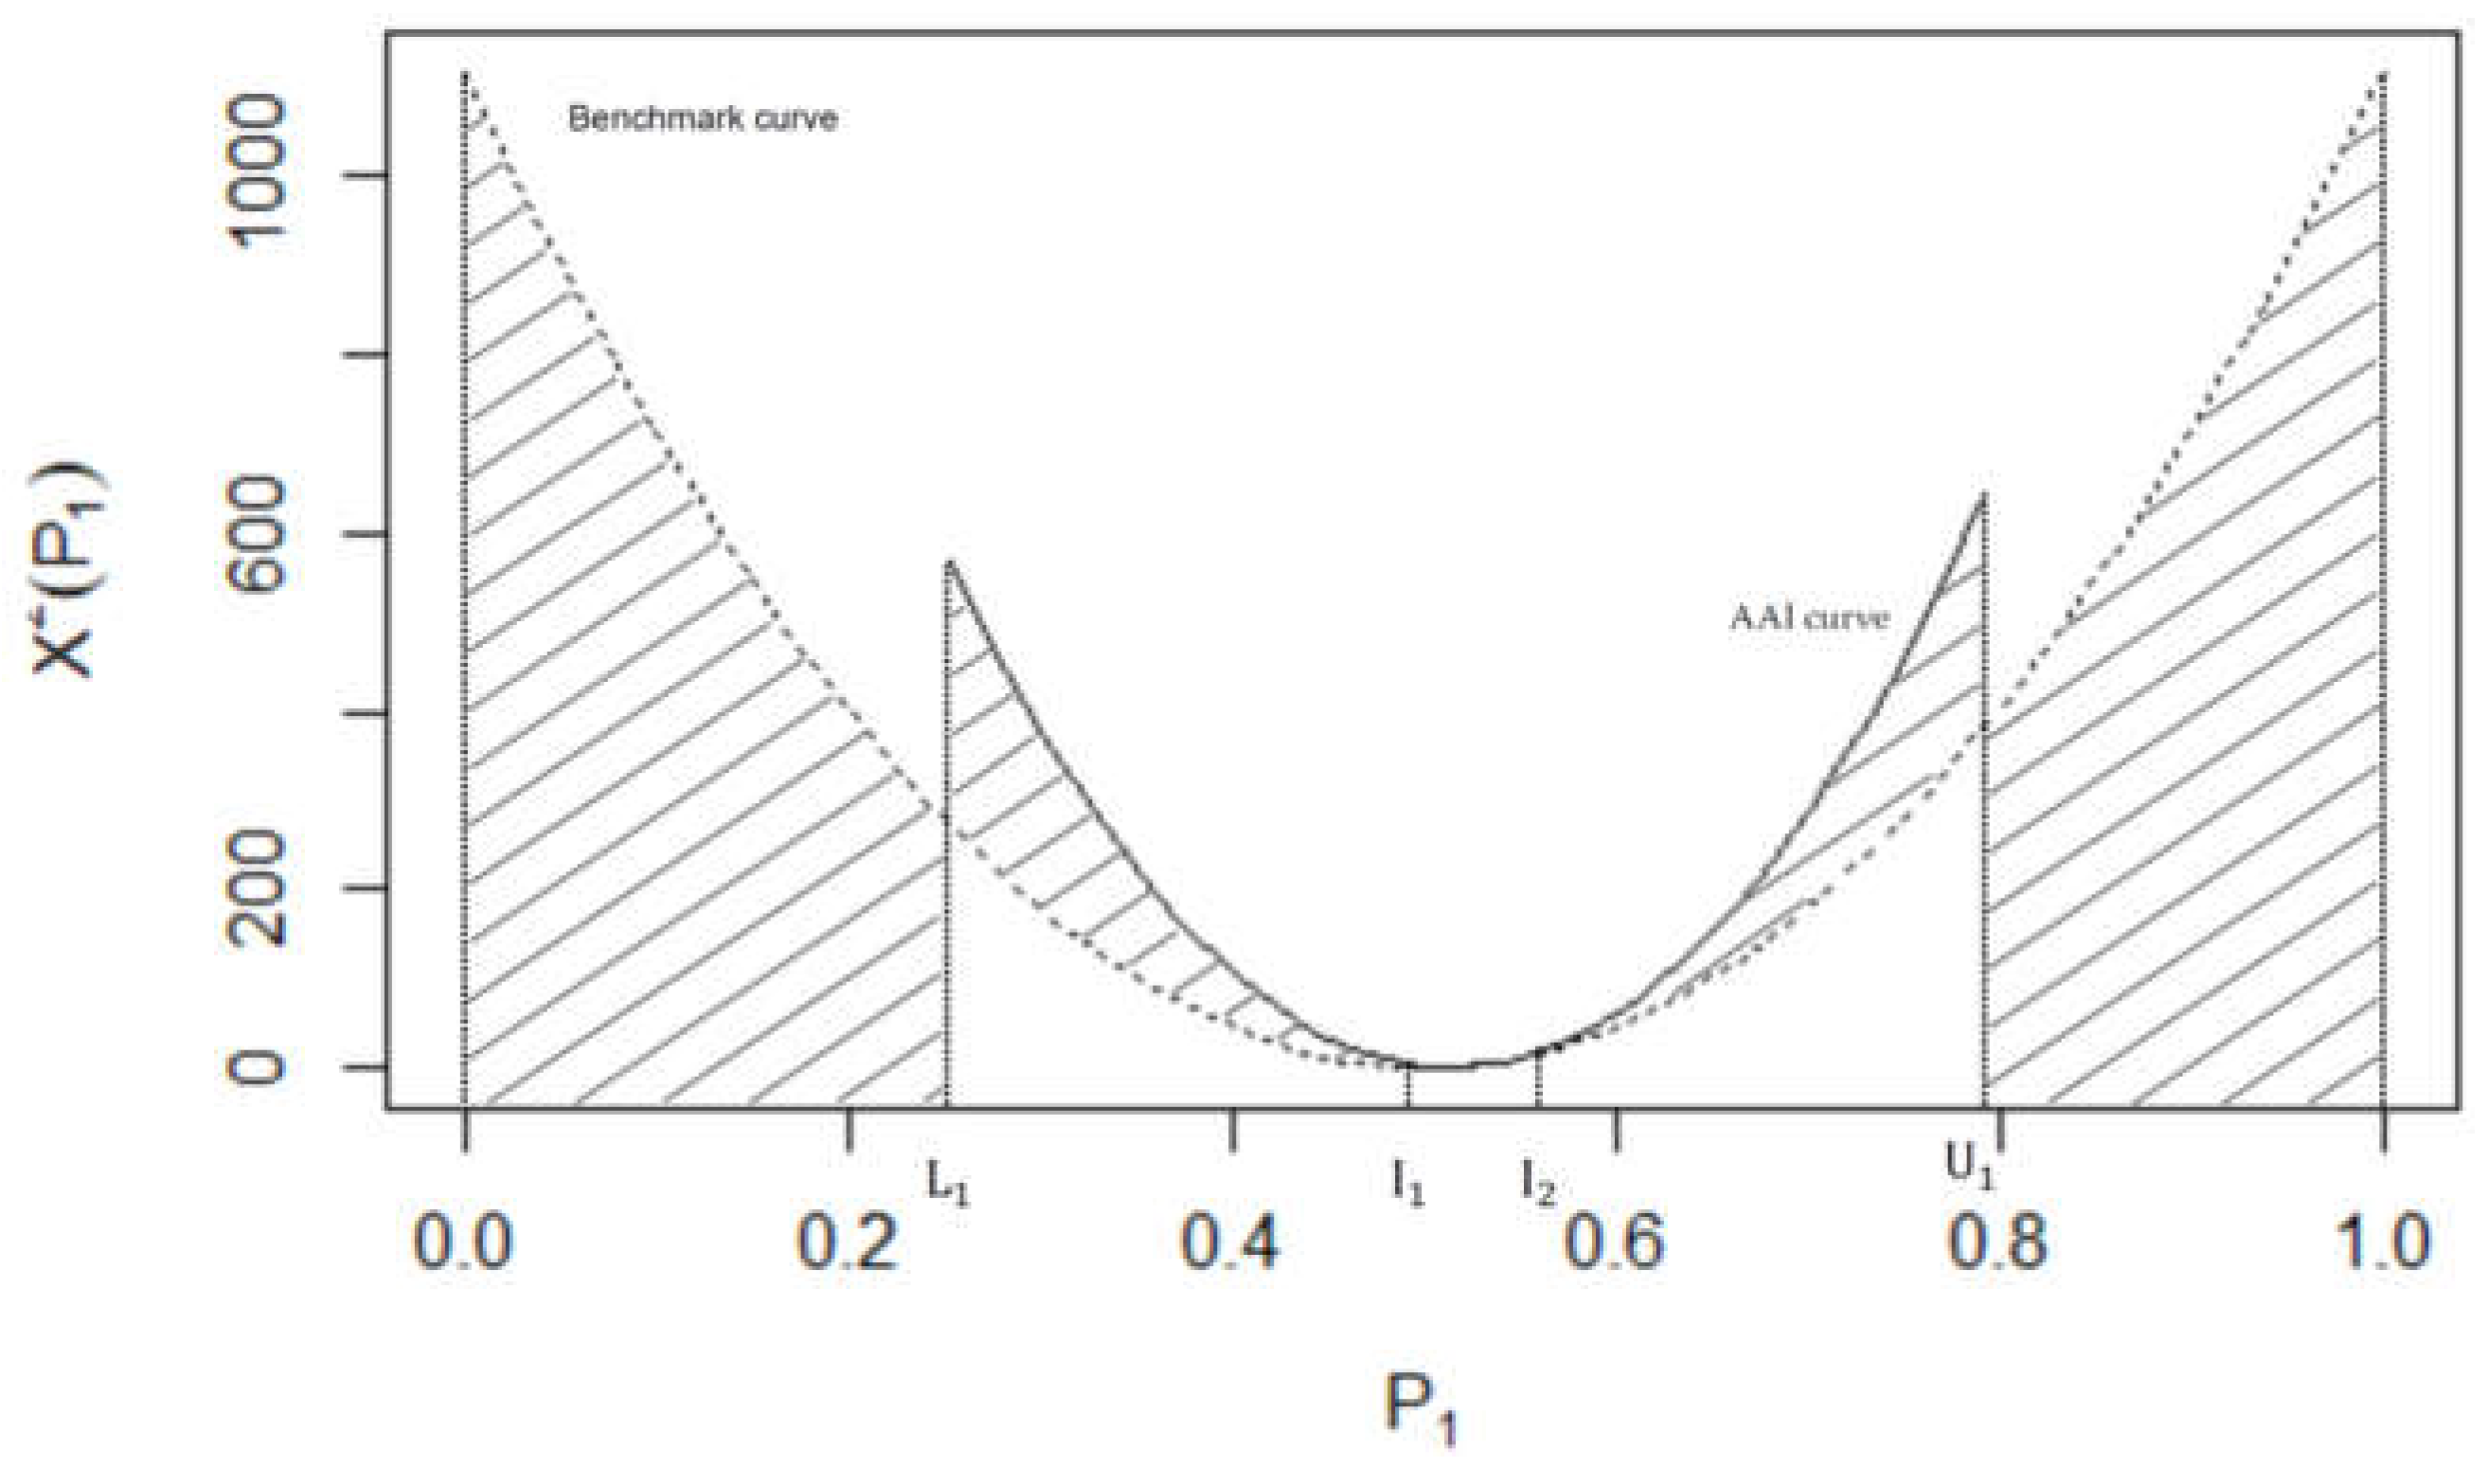

Table 1.
A general 22 contingency table.
| Column 1 | Column 2 | Total | |
|---|---|---|---|
| Row 1 | |||
| Row 2 | |||
| Total |
Table 2.
R.A. Fisher’s classic criminal twin data [30].
Table 2.
R.A. Fisher’s classic criminal twin data [30].
| Convicted | Not Convicted | Total | |
|---|---|---|---|
| Monozygotic | 10 | 3 | 13 |
| Dizygotic | 15 | 17 | |
| Total | 12 | 18 | 30 |
Table 3.
Behavior of the AAI and AII for and different values of n.
| Sample size (n) | AII | AAI |
|---|---|---|
| 30 | 54.93 | 69.40 |
| 50 | 52.98 | 75.83 |
| 100 | 51.49 | 84.89 |
| 250 | 50.60 | 92.84 |
| 500 | 50.30 | 96.13 |
| 1000 | 50.15 | 97.96 |
| 2500 | 50.06 | 99.15 |
| 5000 | 50.03 | 99.56 |
Table 4.
Irving Selikoff’s asbestosis data [49].
Table 4.
Irving Selikoff’s asbestosis data [49].
| Asbestosis | |||
|---|---|---|---|
| Onset of Exposure | Yes | No | Total |
| 0–19 years | 522 | 203 | 725 |
| 20+ years | 53 | 339 | 392 |
| Total | 575 | 542 | 1117 |
Disclaimer/Publisher’s Note: The statements, opinions and data contained in all publications are solely those of the individual author(s) and contributor(s) and not of MDPI and/or the editor(s). MDPI and/or the editor(s) disclaim responsibility for any injury to people or property resulting from any ideas, methods, instructions or products referred to in the content. |
© 2024 by the authors. Licensee MDPI, Basel, Switzerland. This article is an open access article distributed under the terms and conditions of the Creative Commons Attribution (CC BY) license (http://creativecommons.org/licenses/by/4.0/).
Copyright: This open access article is published under a Creative Commons CC BY 4.0 license, which permit the free download, distribution, and reuse, provided that the author and preprint are cited in any reuse.