Submitted:
24 July 2024
Posted:
24 July 2024
You are already at the latest version
Abstract
The upwelling is due to the combined effect of the coastal divergence process and Ekman pumping. The author aims to investigate two new upwelling indices for the Black Sea, derived from climate reanalysis models and in situ data: a) the Coastal Upwelling Transport Index (CUTI that estimates the rate of vertical volume transport) and b) the Biologically Effective Upwelling Transport Index (BEUTI, that estimates the nitrate flux into the surface mixed layer). Average monthly wind by the European Centre for Medium-Range Weather Forecasts (ECMWF) and Copernicus Marine Services for the Black Sea basin is used to calculate the CUTI and BEUTI Indexes, for over 26 years (1993 - 2019) to analyse the sites along the North-Western Black Sea where changes in divergence phe-nomena occur. From 2000 to 2018, 31 divergence processes were observed based on daily in-situ data from the coastal monitoring stations, with significant predominance in late spring and early summer. Nitrate supply by coastal upwelling has been estimated by combining sea surface temperature and salinity for the in-situ data for the North-Western Black Sea shallow waters, and BEUTI indices were determined. Comparing 18 years of data results, the calculated indices and the observed upwelling events showed significant correlations.
Keywords:
upwelling
; coastal upwelling transport index
; black sea
; biologically effective upwelling transport index
1. Introduction
Scaled by the baroclinic Rossby radius of deformation, coastal upwelling is essential in the World Ocean and semi-enclosed seas like the Black Sea as a driver of ecosystem productivity. The horizontal scale of geostrophic relaxation is the “natural” scale of baroclinic boundary currents, eddies and fronts. In addition, it sets the scale of the waves that grow most rapidly due to baroclinic instability and the long Rossby wave speed [1,2,3]. Along the world continent’s western coast, the most productive regions are known as the eastern boundary currents of the Eastern Boundary Upwelling System (EBUS), representing only about 1% of the global ocean [4]. The dynamics of wind-driven coastal upwelling were first described mathematically by V. Wilfrid Ekman [5]. For over a century, the Ekman theory stood as foundational dynamical oceanography and the basis for understanding wind-driven ocean circulation [6]. Ekman determined that the net transfer of water is at a 90-degree angle to the wind direction, and the total water transport in the Ekman layer displaced to the right of the prevailing winds is called Ekman transport. The Ekman transport results from a balance between the Coriolis effect and turbulent drag forces within surface waters and geographic features (shoreline and seabed).
To describe the upwelling mechanisms and indicators, [7,8] developed the Bakun Index as a simple time series to represent variations in upwelling along the coast, calculated based on Ekman’s theory. [9] estimate offshore Ekman transport driven by geostrophic wind stress (Environmental Research Division ERD or upwelling index) through calculations derived from mean surface atmospheric pressure fields provided by the US Navy Fleet Numerical Meteorological and Oceanographic Center (FNMOC).
The upwelled deep water to the sea surface is generally cold and rich in nutrients like nitrogen and phosphorus. At the surface, the nutrient-rich water supplied to the sunlit surface layer by wind-driven upwelling stimulates phytoplankton’s growth, which ultimately fuels diverse and productive marine ecosystems. As a result, plankton populations often multiply in the upwelling layer, a phenomenon called phytoplanktonic bloom. In addition to this bottom-up forcing through the base of the food web, upwelling can influence higher trophic levels directly through exposure to physical and chemical signatures of the deep ocean (e.g., lower temperature, oxygen concentration, and pH). Nitrate storage by phytoplankton cells during the early stages of upwelling development was studied by [10]. In non- and upwelling events, they found that the intracellular nitrate reserves account only for less than 2% of daily primary production during upwelling events. Impacts of upwelling variability can be felt on timescales ranging from single events(days) to decades and more extended. In addition, they propagate commercial and recreational activities that derive considerable socio-economic benefits [11].
Upwelling tends to be highly seasonal in temperate regions, where it peaks in the spring-summer but tends toward year-round continuity in most tropical areas [12]. Located in a temperate region, the Black Sea, the world’s most isolated sea, is connected to the Mediterranean Sea through the Marmara Sea and the Aegean Sea by the narrow and shallow Bosporus and Dardanelles Straits, respectively. As well as in other parts of the ocean, the Ekman pumping causes intense upwelling on the western coast [13], the western cyclonic gyre [14], and the southern part of the Black Sea basin. The upwelling season occurs on the North-Western shelf from April to September, strengthening the across-shelf exchange of rich-nutrient deep water with the surface layer.
Studies of upwelling events for the Black Sea have been based mainly on in situ and satellite data. Based on satellite data evaluation, [15] summarised that the South Crimea coast, the Western part of the Turkish coast, and the Bulgarian and Romanian beaches occur frequent upwelling events. For the near-coastal North-Western Black Sea waters, [13,14] concluded that strong southern wind or moderate to strong westerly wind generates offshore oriented currents that favour the surface water replenishments by deep waters (characterised by low temperature and high salinity).
The paper aims to explore the divergent processes and increase understanding of the physical-chemical-biological interaction dynamics in the Black Sea basin upwelling regions, emphasising the North-Western Shelf. The analysis will consist of integrated data, including in-situ and satellite data, and numerical models to understand the upwelling dynamics.
2. Materials and Methods
2.1. Area of Interest
The Black Sea (BS) is an inland sea in southeastern Europe, bordered by six countries: Bulgaria, Romania, Ukraine, Russia, Georgia, and Turkey. Unlike many coastal regions worldwide that experience significant upwelling, the Black Sea does not have strong, continuous upwelling events due to its unique physical and hydrographic characteristics. Instead, the Black Sea is considered a “meromictic” sea, meaning it has distinct layers of water that do not mix as thoroughly as in a typical ocean. Rivers play a substantial role in the pollution and eutrophication processes, leading to profound alterations in the Black Sea ecosystem.
Four major rivers, namely the Danube, Dnieper, Dniester, and Southern Bug, which collectively possess a water basin size 23 times larger than that of the Northwest Shelf (NWS) area [17], serve as conduits for industrial, agricultural, and domestic wastewater from several European countries into the Black Sea. However, these waterborne effluents more frequently propagate southward along the western coast (Figure 1). In either scenario, the coastal water region extending from the Danube mouth to the Dnieper-Bug estuary bears the brunt of the highest anthropogenic load. In some instances, this area even receives the combined flows of all four rivers. It is particularly true when the Danube’s flow diverts southward, resulting in the influx of eutrophicated waters from the north.
These waterways are major contributors to the influx of pollutants and excess nutrients, which have triggered significant transformations in the delicate balance of life within the Black Sea. Between the 1970s and 1980s decades, the Black Sea, especially its northwest shelf, underwent a dramatic shift in ecological balance. This change led to persistent and ex-tensive hypoxia, causing significant disruption to the pelagic (water column) and benthic (sediment) ecosystems, leaving enduring impacts in its wake. As a result, the ecosystem of the Black Sea has undergone dramatic shifts with far-reaching consequences.
Nonetheless, the most environmentally precarious conditions in the Northwest Shelf (NWS) manifest during the warmer months. At the onset of the spring-summer period, typically from April to May [13,14], rising water temperatures induce a stratification phenomenon within the NWS, encompassing temperature and salinity variations. This stratification facilitates the dispersion of altered river runoff across the surface, resulting in a notable elevation of nutrient concentrations within the warm, brackish surface waters. Consequently, this triggers a robust proliferation of phytoplankton, which gradually consumes the abundant nutrients, simultaneously enhancing the dissolved oxygen levels through photosynthesis in the surface waters.
Regarding its physical characteristics, the NWS Black Sea stretches from the shoreline to the shelf’s edge, reaching depths of 130 to 200 meters, with its widest point spanning 220 kilometres. This expansive region encompasses the majority of the western Black Sea, defined in this context as the area west of the narrowest basin width, approximately 250 kilometres wide, between the Crimea peninsula and the Turkish coast. The seabed terrain exhibits a smooth, uniform profile shaped by the continuous sediment deposition carried by the major rivers that discharge into this sector of the Black Sea. However, the shelf’s overall topography gains complexity due to specific geographical features, including the presence of the Danube Delta, the coastline’s northward curvature beyond the delta, irregularities along the coastline caused by prominent capes, and a reduction in the shelf’s width immediately south of the Danube River.
2.2. Methods to Calculate the Upwelling Indexes
Here, we briefly review the upwelling indices and their key differences. Details of the Coastal Upwelling Transport Index (CUTI) and Biologically Effective Upwelling Transport Index (BEUTI) calculations and an exhaustive comparison with the Bakun Index are in [6].
CUTI is derived from the surface wind stress, sea surface height, and mixed layer depth. CUTI is an estimation of vertical transport into (or out of) the surface mixed layer (SML) as the sum of two components: vertical transport in near-surface Ekman transport (UEk) and vertical transport associated with an alongshore pressure gradient (UGeo)
CUTI = UEk + UGeo.
Bakun Index can be obtained using the sea level pressure fields from an atmospheric reanalysis to derive estimated near-surface winds. Details of the peculiarity of the Bakun Index calculation are available in technical reports by [7,8,9].
Biologically Effective Upwelling Transport Index (BEUTI), the volume transport of upwelling/downwelling and the amount of nitrate upwelled/downwelled, derived by multiplying the vertical transport at the mixed layer base:
BEUTI = CUTI * [NO3–]MLD.
In contrast to the Bakun Index, CUTI and BEUTI use winds directly from atmospheric reanalyses that assimilate satellite and in situ wind measurements. As a result, they account for cross-shore geostrophic transport, which can suppress or enhance upwelling relative to the wind-driven Ekman transport and fully consider upwelling driven by wind stress curl. In contrast, the Bakun Index omits upwelling associated with alongshore changes in the wind.
Another method proposed in the specialised literature is represented by a simple thermal difference (∆T ) between the coastal and the offshore SST acquired at the same latitude to estimate the latitudinal and temporal variability of the intensity of the upwelling, using the following formulation:
The maximum temperature, SSTmax, is chosen as the offshore temperature, which used to be the coastal SST, where the influence of the upwelling is predictable to be insignificant. The SSTmax determines the SST-based indices from various locations at arbitrary distances from the coast.
2.3. Data and Computation
In the present study, the Coastal Upwelling Transport Index (CUTI) of the National Oceanic and Administrative Administration’s Environmental Research Division (NOAA-ERD) has been used to derive a time series of the coastal upwelling index in four locations on the north-western Black Sea coast. The method uses planetary boundary layer theory and geostrophic wind approximation to calculate a time series for coastal upwelling index using the European Centre for Medium-Range Weather Forecasts (ECMWF) to retrieve monthly average wind fields for the interest area and MATLAB to compute the CUTI (Figure 2).
Using the meridional (v) and zonal (u) winds components, the Ekman transport (Q, m3 ·s−1 ·km−1) was calculated using the following formula:
Q_x= τ_y/(f∙ ρ_w) ∙ 10^3
τ_y=ρ_a ∙ C_d ∙ √(u^2+v^2) ∙v
Where, the x corresponds to the zonal component, and the y to the meridional component. Finally, the upwelling index (UI) was computed using the CUTI formula (1), defined as CUTI (m3 ·s−1 ·100m−1 ), representing the volume transport per distance unit of an alongshore section. The sign of Ekman transport is changed to define positive or negative values of UI as a response to upwelling or downwelling favourable winds.
To compute the BEUTI, Copernicus Marine Service [19] data are used for dedicated locations. For in-situ records of the Sea Surface Temperature (SST), Sea Surface Salinity (SSS), and nitrates to extract the upwelling events, we use long-term daily data from the monitoring station of the NIMRD at Mamaia Casino site (44°14’ N and 28°38’ E) [13,14].
3. Results
In the paper, the sea surface temperature and salinity data are used as indicators of the upwelling phenomena. Data were collected with YSI CastAway CTD at Mamaia Casino (44014’ N and 28038’ E). Referring to the occurrence statistics, from 18 years of analysis (2000 to 2018), 31 divergence processes were observed based on daily in-situ data from the coastal monitoring station, with significant predominance in late spring and early summer (Figure 3 and Figure 4).
Figure 3 illustrates the occurrences of recorded upwelling events in the nearshore waters of the Western Black Sea, specifically at Constanta, during the period spanning from May to September from 2000 to 2019. Notably, divergence processes occur in May and June nearly every year, with one event per period being the norm and sometimes extending into July.
Figure 5 presents the monthly variability of the Ekman transport index (which is proportional to the wind stress) at different stations in the Black Sea throughout the year. The stations are represented by different coloured lines (ECTA and PO), and the X-axis shows the months. Most stations have clear seasonal patterns in the upwelling and downwelling trends. Upwelling (positive values) is more common during spring and summer, while downwelling (negative values) is more prevalent during autumn and winter. The intensity of upwelling and downwelling varies significantly among the stations. Some stations experience stronger upwelling or downwelling than others. For example, the ECTA5 station tends to have stronger upwelling than other stations, while the DANUBE station experiences stronger downwelling than the rest. In addition, some stations, such as ECTA1 and ECTA3, exhibit considerable interannual variability in upwelling intensity. There seems to be a general trend of decreasing upwelling intensity.
Figure 6 illustrates the monthly variability of the Ekman Coastal Transport Index for East–Constanta (ECTA) at eight different locations from the coast to the deep waters (ECTA1 through ECTA8) throughout the year. Positive values indicate upwelling, while negative values indicate downwelling. Upwelling is generally more pronounced in the spring and summer (April to September), particularly at locations ECTA4, ECTA5, ECTA7, and ECTA8. Upwelling intensity varies significantly between locations, with ECTA5 and ECTA8 showing the strongest upwelling events. Some locations, such as ECTA1 and ECTA3, exhibit considerable interannual variability in upwelling intensity.
For ECTA1, nearshore water, Figure 7 shows a clear seasonal pattern in the CUTI, with positive values occurring predominantly in the spring and summer and negative values more common in autumn and winter. In contrast, Figure 8 reveals that for the offshore waters, the CUTI values mainly fluctuate around zero, indicating a relatively balanced state between upwelling and downwelling events throughout the observed period. Moreover, considerable variability in the intensity of upwelling can be observed yearly, with some years experiencing much stronger upwelling events than others (Figure 7). However,Figure 8 appears to be a weak seasonal pattern, with slightly more positive CUTI values during the spring and summer than autumn and winter. While there are fluctuations in the CUTI over the 26 years, there doesn’t appear to be a consistent trend towards increasing or decreasing upwelling intensity (Figure 7) or no exceptionally strong upwelling or downwelling events observed in the time series (Figure 8). Year-to-year fluctuations in upwelling intensity and frequency, as revealed by the CUTI, underscore the dynamic nature of this process in the nearshore zone. These fluctuations, coupled with the pronounced seasonal variations in upwelling, highlight the significant influence of seasonal factors on driving upwelling events in this region. The offshore area of Constanța experiences a relatively moderate and balanced upwelling regime, with weak seasonal variations and notable interannual fluctuations. This information is valuable for understanding the oceanographic processes and potential impacts on marine ecosystems in the region.
Figure 9, shows that the SST exhibits a clear seasonal pattern, with higher temperatures in the summer months and lower temperatures in the winter months. This pattern is consistent for both nearshore and offshore locations. The nearshore SST tends to be slightly higher than the offshore SST, particularly during the warmer months. This could be due to the influence of shallower waters and land-based heat sources. The CUTI, shows negative values during periods of upwelling. These events appear to occur more frequently during spring and summer, corresponding with periods of higher SST. There doesn’t appear to be a significant long-term trend in either SST or the frequency and intensity of upwelling events over the time period covered by the graph. Figure 9 illustrates the complex interplay between SST, upwelling, and seasonality in the study area. This information is crucial for understanding the region’s marine ecosystem dynamics, as upwelling plays a critical role in nutrient supply and primary productivity.
Figure 10 illustrates the time series of three variables: CUTI ECTA for nearshore and offshore waters and the calculated CUTI using Sea Surface Temperature (SST) data. The Figure 10 spans from January 1993 to September 2019 and shows the monthly variability of these indices. The nearshore values generally exhibit a larger magnitude than the offshore values, suggesting that upwelling is more intense in the nearshore region. Moreover, there is a clear seasonal pattern in all three variables, with the strongest upwelling events occurring during the spring and summer months (April to September). The three variables appear to be highly correlated, indicating that they are all capturing the same underlying phenomenon of upwelling. Furthermore, there is considerable interannual variability in the intensity of upwelling, with some years experiencing much stronger events than others. Overall, Figure 10 provides valuable insights into the spatial and temporal dynamics of upwelling in the study area, highlighting the importance of both nearshore and offshore processes and the significant role of seasonality in driving upwelling events.
For the evaluation, homogeneity analysis (the Pettitt test, Tabel 1) is applied to the Sea Surface Temperature (SST), CUTI (m3/s/100m coastline) and CUTI SST (grdC). Widely used in hydrological studies, the Pettitt test detects the significant changes in the mean of a time series, with performance analysis using Monte Carlo simulation. The change point was identified as being in June 2010 and May 2014 (as shown in Figure 10) with a fixed significance level of α=0.05. The seasonal variability of SST varies strongly by longitude depending on the upwelling phenomena intensity and the energy exchange between the sea and the atmosphere. The climatological SST display a seasonality that varies sinusoidally for the Constanta transect (fig. below). The CUTI SST index describes the seasonal variability of the upwelling intensity for the north-western Black Sea system from 28.6 - 32.85 E.

Table 1.
Descriptive statistics (Pettitt test) for the Sea Surface Temperature (SST), CUTI (m3/s/100m coastline) and CUTI SST (grdC).
Table 1.
Descriptive statistics (Pettitt test) for the Sea Surface Temperature (SST), CUTI (m3/s/100m coastline) and CUTI SST (grdC).
| Station | N | Min | Max | Mean | std.dev. | p-value (Two-tailed) | alpha | K | t | The risk of rejecting the null hypothesis H0 while it is true |
|---|---|---|---|---|---|---|---|---|---|---|
| ECTA 1 | 324 | -43.252 | 15.860 | -3.917 | 6.797 | 0.088 | 0.05 | 4414 | June 2010 | 8.82% |
| ECTA 2 | 324 | -47.243 | 17.267 | -4.311 | 7.524 | 0.103 | 0.05 | 4380 | June 2010 | 10.26% |
| ECTA 3 | 324 | -51.423 | 18.734 | -4.725 | 8.296 | 0.108 | 0.05 | 4344 | June 2010 | 10.80% |
| ECTA 4 | 324 | -52.761 | 20.163 | -5.073 | 8.772 | 0.130 | 0.05 | 4206 | June 2010 | 13.02% |
| ECTA 5 | 324 | -53.428 | 21.462 | -5.395 | 9.187 | 0.186 | 0.05 | 3976 | June 2010 | 18.60% |
| ECTA 6 | 324 | -52.853 | 24.252 | -5.991 | 9.916 | 0.267 | 0.05 | 3742 | June 2010 | 26.70% |
| ECTA 7 | 324 | -48.356 | 23.623 | -5.844 | 9.537 | 0.347 | 0.05 | 3544 | June 2010 | 34.70% |
| PO1 | 324 | -43.544 | 16.515 | -3.975 | 7.184 | 0.040 | 0.05 | 4860 | June 2010 | 4.02% |
| PO2 | 324 | -47.687 | 18.771 | -4.375 | 7.918 | 0.051 | 0.05 | 4748 | June 2010 | 5.06% |
| PO3 | 324 | -49.428 | 20.918 | -4.729 | 8.411 | 0.063 | 0.05 | 4626 | June 2010 | 6.32% |
| PO4 | 324 | -51.278 | 23.181 | -5.110 | 8.961 | 0.090 | 0.05 | 4458 | June 2010 | 9,00% |
| PO5 | 324 | -52.242 | 24.354 | -5.314 | 9.267 | 0.104 | 0.05 | 4370 | June 2010 | 10.36% |
| PO6 | 324 | -47.129 | 24.147 | -5.261 | 8.970 | 0.073 | 0.05 | 4586 | June 2010 | 7.32% |
| PO7 | 324 | -53.526 | 23.385 | -6.322 | 10.198 | 0.287 | 0.05 | 3684 | June 2010 | 28.74% |
| MG1 | 324 | -43.110 | 16.037 | -3.949 | 6.768 | 0.163 | 0.05 | 4050 | June 2010 | 16.30% |
| MG2 | 324 | -48.738 | 17.614 | -4.511 | 7.713 | 0.184 | 0.05 | 3976 | June 2010 | 18.44% |
| MG3 | 324 | -53.956 | 19.128 | -5.100 | 8.647 | 0.212 | 0.05 | 3890 | June 2010 | 21.20% |
| MG4 | 324 | -55.610 | 19.945 | -5.385 | 9.049 | 0.219 | 0.05 | 3854 | June 2010 | 21.94% |
| MG5 | 324 | -56.720 | 23.121 | -6.222 | 10.139 | 0.319 | 0.05 | 3601 | May 2014 | 31.88% |
| MG6 | 324 | -51.643 | 23.485 | -6.358 | 10.124 | 0.457 | 0.05 | 3325 | May 2014 | 45.68% |
| DANUBE | 324 | -41.030 | 18.740 | -3.861 | 6.790 | 0.020 | 0.05 | 5268 | June 2010 | 2.04% |
Figure 11 shows considerable interannual variability in the CUTI values, indicating that the intensity and frequency of upwelling events vary from year to year at the offshore station Mangalia (MG6) station from January 1993 to March 2020. The CUTI values mostly fluctuate around zero, indicating a relatively balanced state between upwelling and downwelling events throughout the observed period. Moreover, seems to be a slight tendency for upwelling to be more pronounced during the spring and summer months, as indicated by more frequent positive CUTI values during those periods but are no exceptionally strong upwelling or downwelling events observed in the time series. Figure 11 suggests that the MG6 station experiences a relatively moderate and balanced upwelling regime, with slight seasonal variations and notable interannual fluctuations.
Figure 12 illustrates the comparison between the number of observed in-situ upwelling events (blue bars) and the number of upwelling events predicted by the Coastal Upwelling Transport Index (CUTI) model (red bars) over the period 2000-2019. The x-axis represents the months from May to September for each year, while the y-axis indicates the number of events, ranging from 0 to 3.5. Both in-situ and CUTI-predicted upwelling events show a strong seasonal pattern, with the majority of events occurring during the summer months (June-August). This is consistent with the typical upwelling season in the Black Sea. In most cases, the number of in-situ and CUTI-predicted events are in close agreement, suggesting that the CUTI model is a reliable tool for predicting upwelling occurrences in the region. However, there are a few instances where the two datasets diverge, particularly in 2009 and 2018, where the CUTI model seems to overpredict the number of upwelling events compared to the in-situ observations.
Overall, Figure 12 highlights the utility of the CUTI model in predicting upwelling events in the Black Sea, while also emphasizing the need for continuous validation with in-situ data to improve the model’s accuracy. Additionally, the graph reveals the distinct seasonal pattern of upwelling in the region, providing valuable information for understanding the region’s marine ecosystem dynamics.
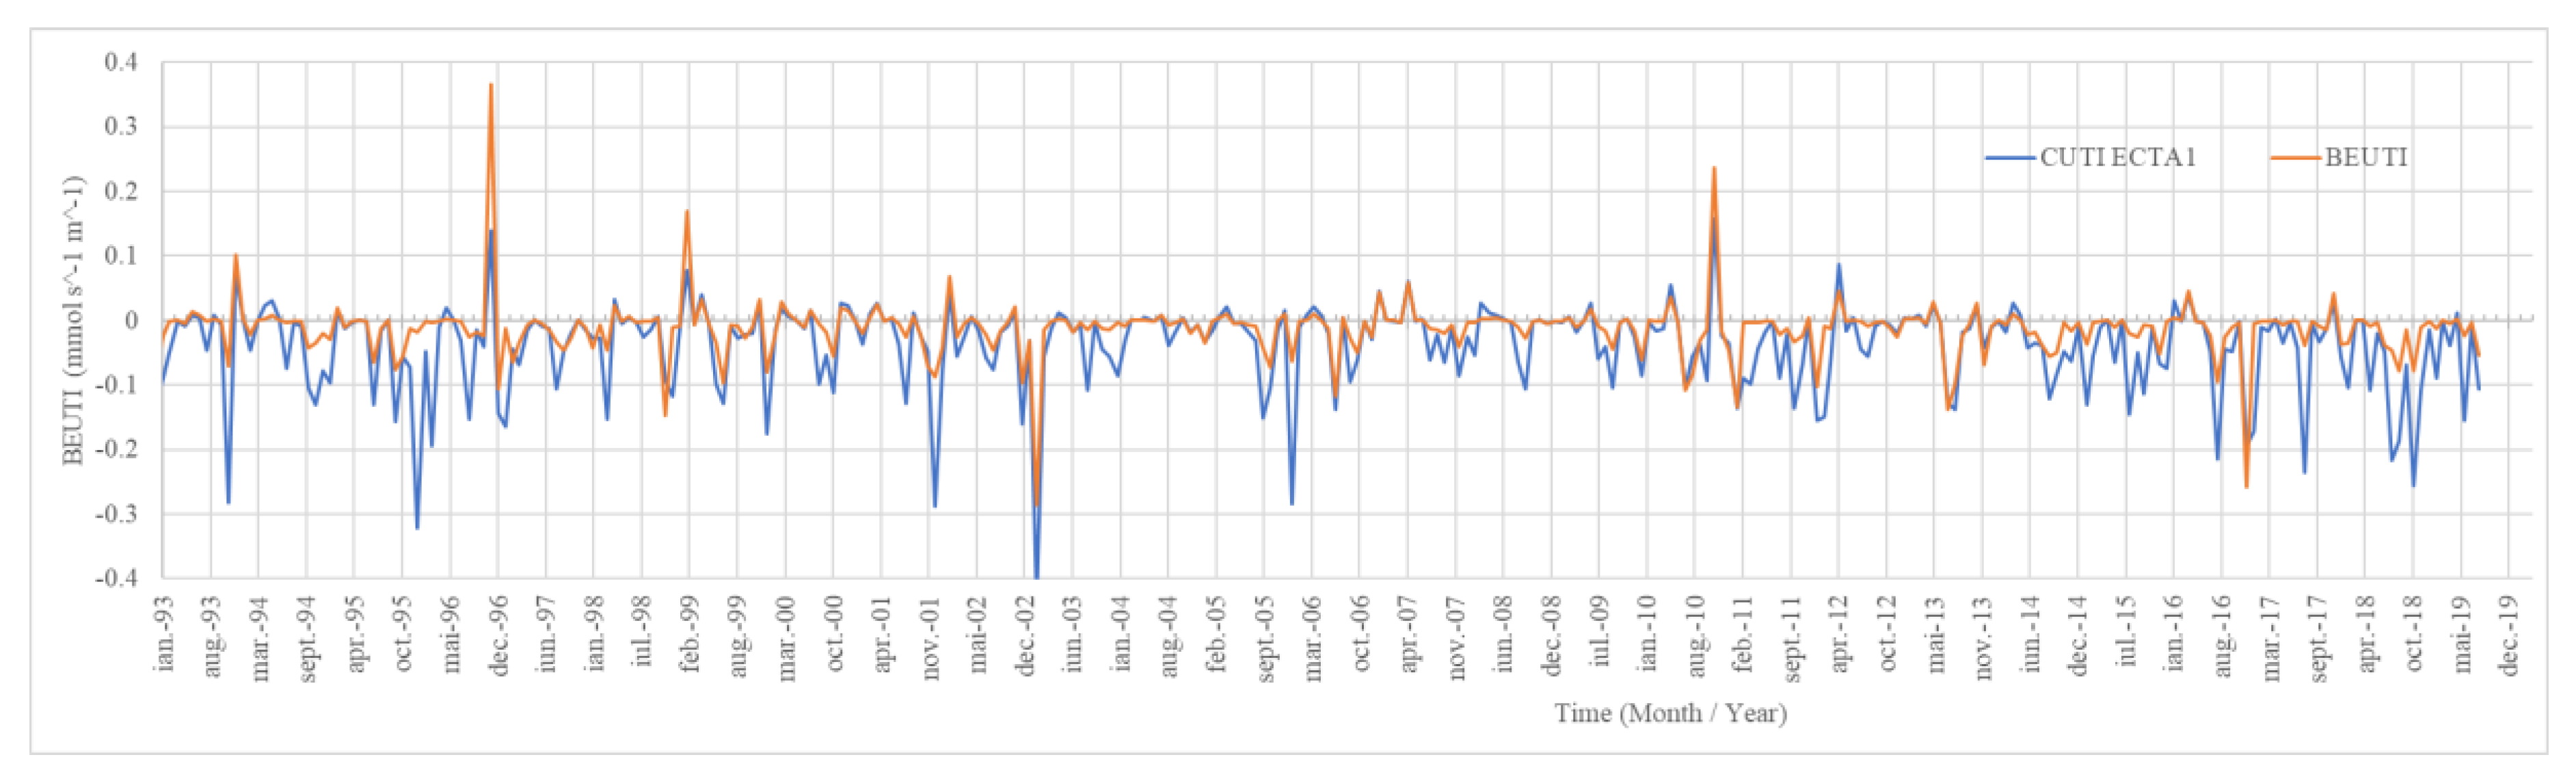
Figure 13 displays the time series of two variables, CUTI ECTA1 (Coastal Upwelling Transport Index for the nearest coastal station) and BEUTI (Biologically Effective Upwelling Transport Index), from January 1993 to December 2019. The x-axis represents time (in months and years), and the y-axis shows the magnitude of both indices. Using the formula (2) we calculate the BEUTI index that quantifies the amount of nitrate brought to the surface by upwelling.
Both CUTI ECTA1 and BEUTI exhibit a distinct seasonal pattern, with positive values (upwelling) occurring predominantly in the spring and summer months, and negative values (downwelling) more common in autumn and winter. The two indices show a strong positive correlation, indicating that higher rates of upwelling are associated with increased nitrate transport to the surface. Also, there is considerable interannual variability in the magnitude of both indices, suggesting that the intensity of upwelling and associated nitrate transport vary from year to year. While there are fluctuations in both indices over time, there doesn’t appear to be a clear long-term trend towards increasing or decreasing upwelling intensity in this location.
Overall, Figure 13 explains the dynamic nature of upwelling and its associated biological productivity in the Black Sea, emphasizing the importance of considering both physical and biogeochemical processes when studying this phenomenon.
4. Discussion
The Black Sea is an inland sea located in southeastern Europe, bordered by six countries: Bulgaria, Romania, Ukraine, Russia, Georgia, and Turkey. Unlike many coastal regions around the world that experience significant upwelling, the Black Sea does not have strong, continuous upwelling events due to its unique physical and hydrographic charac-teristics. Instead, the Black Sea is considered a “meromictic” sea, which means that it has distinct layers of water that do not mix as thoroughly as in a typical ocean.
Several notable features of upwelling and water circulation in the Black Sea basin can be briefly described:
- -
- Meromictic Nature: The Black Sea is stratified into layers of water with different properties. The surface layer, known as the “epilimnion,” is relatively warm and well-oxygenated. Below this layer is the “metalimnion,” which acts as a transition zone. Beneath the metalimnion is the “hypolimnion,” which is cold, stagnant, and lacks oxygen. The presence of the hypolimnion inhibits significant vertical mixing of waters, which is characteristic of upwelling in other seas.
- -
- Limited Wind-Driven Upwelling: While the Black Sea does experience some wind-driven vertical mixing, it is generally not strong enough to bring up significant nu-trient-rich water from the depths to the surface regularly. The prevailing winds in the Black Sea are typically light, and the depth of the Black Sea is relatively shallow compared to large ocean basins.
- -
- Nutrient Distribution: The nutrients in the Black Sea are primarily supplied by river discharge, particularly from the Danube River, which carries nutrients from agricultural runoff. These nutrients are distributed throughout the water column but tend to accumu-late in the anoxic (oxygen-depleted) hypolimnion. As a result, the surface waters are gen-erally nutrient-poor compared to regions with frequent upwelling.
- -
- Anoxic Conditions: The Black Sea’s unique stratification and limited vertical mixing lead to the development of anoxic conditions in the deep hypolimnion. These anoxic con-ditions result in the accumulation of hydrogen sulfide, which can be toxic to marine life and have significant ecological implications.
In the realm of marine environmental conservation, comprehending upwelling is essential for safeguarding the region against potential sources of pollution, whether they originate from industrial activities or ship waste [20]. The occurrence, timing, and intensity of upwelling events are pivotal considerations in this context. Assessing the presence or absence of upwelling can be achieved through vertical temperature meas-urements of seawater using tools such as moorings or Argo floats [21]. However, it is important to note that these methods are associated with high costs, local-ized data collection, and the inability to access real-time or near-real-time data due to the need for extensive post-processing.
Conversely, a more expedient and cost-effective approach widely adopted in the study of upwelling involves the examination of upwelling indicators [22]. These indicators offer a swift and economical means of ascertaining the presence or absence of upwelling events in a given marine environment
The study of upwelling is therefore important in the NW Black Sea for the advance in the knowledge of primary productivity processes. The present paper extends the statistical investigation of the Black Sea upwelling events. It introduces the CUTI index covering the North-Western Black Sea shelf, based on free atmospheric and oceanographic data portals, as Copernicus Marine Service data download and ERDDAP (the Environmental Research Division’s Data Access Program), validated with observations in-situ data. The results confirm the previously reported seasonality of upwelling in the region, with events primarily occurring between May and September (Figure 3, Figure 4 and Figure 12). The spatial variability of upwelling intensity is evident across different stations, with ECTA5 experiencing the most pronounced events (Figure 4a).
The study’s findings align with previous research highlighting the Black Sea’s unique characteristics that influence upwelling patterns. The meromictic nature of the sea, limited wind-driven upwelling due to weak winds and shallow depths, and the significant influence of riverine input, particularly from the Danube, all contribute to the observed dynamics.
The strong correlation between the calculated CUTI and observed in-situ upwelling events (Figure 12) validates the effectiveness of the CUTI as a cost-effective tool for assessing upwelling in the Black Sea. This is particularly important for a region where traditional methods like moorings or Argo floats are not feasible due to financial constraints. The successful application of CUTI in this study opens up avenues for its wider use in other regions with similar limitations. However, the discrepancies observed between in-situ and CUTI-predicted events in some years (Figure 12) underscore the need for further refinement of the model. Incorporating additional parameters, such as local bathymetry and coastline configuration, could enhance the model’s accuracy and predictive ca-pabilities.
The implications of these findings extend beyond the Black Sea. The study contributes to a broader understanding of upwelling dynamics in semi-enclosed seas, which are often characterized by complex interactions between physical, chemical, and biological processes. Moreover, the demonstrated effectiveness of the CUTI model has potential applications for other regions facing similar challenges in monitoring and managing upwelling events.
To further enhance our understanding of upwelling processes and their role in shaping marine ecosystems, future research could delve into high-resolution modeling to investigate the fine-scale spatial and temporal dynamics of upwelling, potentially revealing underlying mechanisms and their ecological consequences. Additionally, coupling the CUTI model with biogeochemical models could help assess the impact of upwelling on nutrient transport, phytoplankton blooms, and overall ecosystem productivity in the Black Sea. Examining the potential effects of climate change on upwelling patterns in the Black Sea is crucial for predicting future changes in the region’s marine ecosystem and developing appropriate adaptation strategies. Furthermore, comparative studies with other semi-enclosed seas could reveal commonalities and differences in upwelling mechanisms and their ecological implications, ultimately contributing to more effective conservation and management strategies in the face of ongoing environmental challenges.
Author Contributions
Conceptualisation, methodology, software, validation, formal analysis, investigation, resources, writing—original draft preparation, review and editing; funding acquisition, Maria – Emanuela MIHAILOV. All authors have read and agreed to the published version of the manuscript.
Funding
This research received no external funding.
References
- Gill, A.E. Atmosphere-Ocean Dynamics; Academic Press: San Diego, CA, USA, 1982; p. 662. [Google Scholar]
- Chelton, D.B.; de Szoeke, R.A.; Schlax, M.G.; El Naggar, K.; Siwertz, N. Geographical variability of the first-baroclinic Rossby radius of deformation. J. Phys. Oceanogr. 1998, 28, 433–460. [Google Scholar] [CrossRef]
- Saenko, O.A.; Merryfield, W.J. Vertical partition of ocean heat transport in isothermal coordinates. Geophys. Res. Lett. 2006, 33, L01606. [Google Scholar] [CrossRef]
- Kämpf, J.; Chapman, P. Upwelling Systems of the World. A Scientific Journey to the Most Productive Marine Ecosystems; Springer International Publishing: Geneva, Switzerland, 2016; p. 433. [Google Scholar]
- Ekman, W. On the influence of the earth’s rotation on ocean currents. Ark. Mat. Astron. Och Fys. 1905, 2. [Google Scholar]
- Jacox, M.G.; Edwards, C.A.; Hazen, E.L.; Bograd, S.J. Coastal upwelling revisited: Ekman, Bakun, and improved upwelling indices for the US west coast. J. Geophys. Res. Oceans 2018, 123, 7332–7350. [Google Scholar] [CrossRef]
- Bakun, A. Coastal upwelling indices, west coast of North America, 1946-71. NOAA technical report: National Marine Fisheries Service, United States, 1973; NMFS SSRF 671, p. 112.
- ] Bakun, A. Daily and Weekly Upwelling Indices, West Coast of North America, 1967-73. NOAA technical report: U.S. Department of Commerce, NMFS SSRF-693, 1978; p. 114.
- Schwing, F.B.; O’Farrell, M.; Steger, J.M.; Baltz, K. Coastal Upwelling indices west coast of North America. NOAA technical report: U.S. Department of Commerce, 1996; NOAA-TM-NMFS-SWFSC-231, pp. 144.
- Bode, A.; Botas, J.A.; Fernández, E. Nitrate storage by phytoplankton in a coastal upwelling environment. Mar. Biol. 1997, 129, 399–406. [Google Scholar] [CrossRef]
- Bograd, S.J.; Hazen, E.L.; Maxwell, S.; Leising, A.W.; Bailey, H.; Brodeur, R. SIXTEEN. Offshore ecosystems, H. Mooney & E. Zavaleta (Eds.): Ecosystems of California—A source book, Berkeley: University of California Press, 2016; pp. 287–309.
- Parrish, R.H.; Bakun, A.; Husby, D.M.; Nelson, C.S. Comparative climatology of selected environmental processes in relation to eastern boundary current pelagic fish reproduction, In Proceedings of the expert consultation to examine changes in abundance and species composition of neritic fish resources; Sharp, G.D., Csirke, J., Eds.;. FAO Fish. Rep., 1983, 291, 731-777.
- Mihailov, M.E.; Tomescu-Chivu, M.I.; Dima, V. Black Sea water dynamics on the Romanian littoral–case study: The upwelling phenomena. Rom. J. Phys. 2012, 64, 232–245. [Google Scholar]
- Mihailov, M.E.; Buga, L.; Malciu, V.; Sarbu, G.; Oros, A.; Lazar, L.; Stefan, S. Characteristics of up-welling algal bloom and hypoxia events in the western black sea in 2010. Fresenius Environ. Bull. 2013, 22, 2981–2990. [Google Scholar]
- Stanichny, S.V.; Kubryakova, E.A.; Kubryakov, A.A. Quasi-tropical cyclone caused anomalous autumn coccolithophore bloom in the Black Sea. Biogeosciences 2021, 18, 3173–3188. [Google Scholar] [CrossRef]
- Stanichnaya, R.; Davidov, A.; Stanichny, S.; Soloviev, D. Coastal upwelling in the Black Sea as derived from satellite remote sensing. In Proceedings of the 35th COSPAR Scientific Assembly, Paris, France, 18–25 July 2004; Volume 35, p. 3786. [Google Scholar]
- Kondratev, S.I. Three Typical Hydrological-Hydrochemical Situations near the Danube River Mouth Based on the Marine Hydrophysical Institute Research Expeditions in 1997-2013. J. Phys. Oceanogr. 2019, 26, 326–340. [Google Scholar]
- Kubryakov, A.A.; Stanichny, S.V.; Zatsepin, A.G. Interannual Variability of Danube Waters Propagation in Summer Period of 1992–2015 and Its Influence on the Black Sea Ecosystem. J. Mar. Syst. 2018, 179, 10–30. [Google Scholar] [CrossRef]
- Available online: https://marine.copernicus.eu/ (accessed on 10 November 2023).
- Smith, J.N.; Mongin, M.; Thompson, A.; Jonker, M.J.; De’ath, G.; Fabricius, K.E. Shifts in coralline algae, macroalgae, and coral juveniles in the Great Barrier Reef associated with present-day ocean acidification. Glob. Change Biol. 2020, 26, 2149–2160. [Google Scholar] [CrossRef] [PubMed]
- Roemmich, D.; Johnson, G.C.; Riser, S.; Davis, R.; Gilson, J.; Owens, W.B.; Garzoli, S.L.; Schmid, C.; Ignaszewski, M. The Argo Program: Observing the global ocean with profiling floats. Oceanography 2009, 22, 34–43. [Google Scholar] [CrossRef]
- Bakun, A. Global climate change and intensification of coastal ocean upwelling. Science 1990, 247, 198–201. [Google Scholar] [CrossRef] [PubMed]
Figure 1.
The Danube’s propagation altered the summer freshwater flow patterns, as evidenced by the distribution of chlorophyll in surface waters [18].
Figure 1.
The Danube’s propagation altered the summer freshwater flow patterns, as evidenced by the distribution of chlorophyll in surface waters [18].
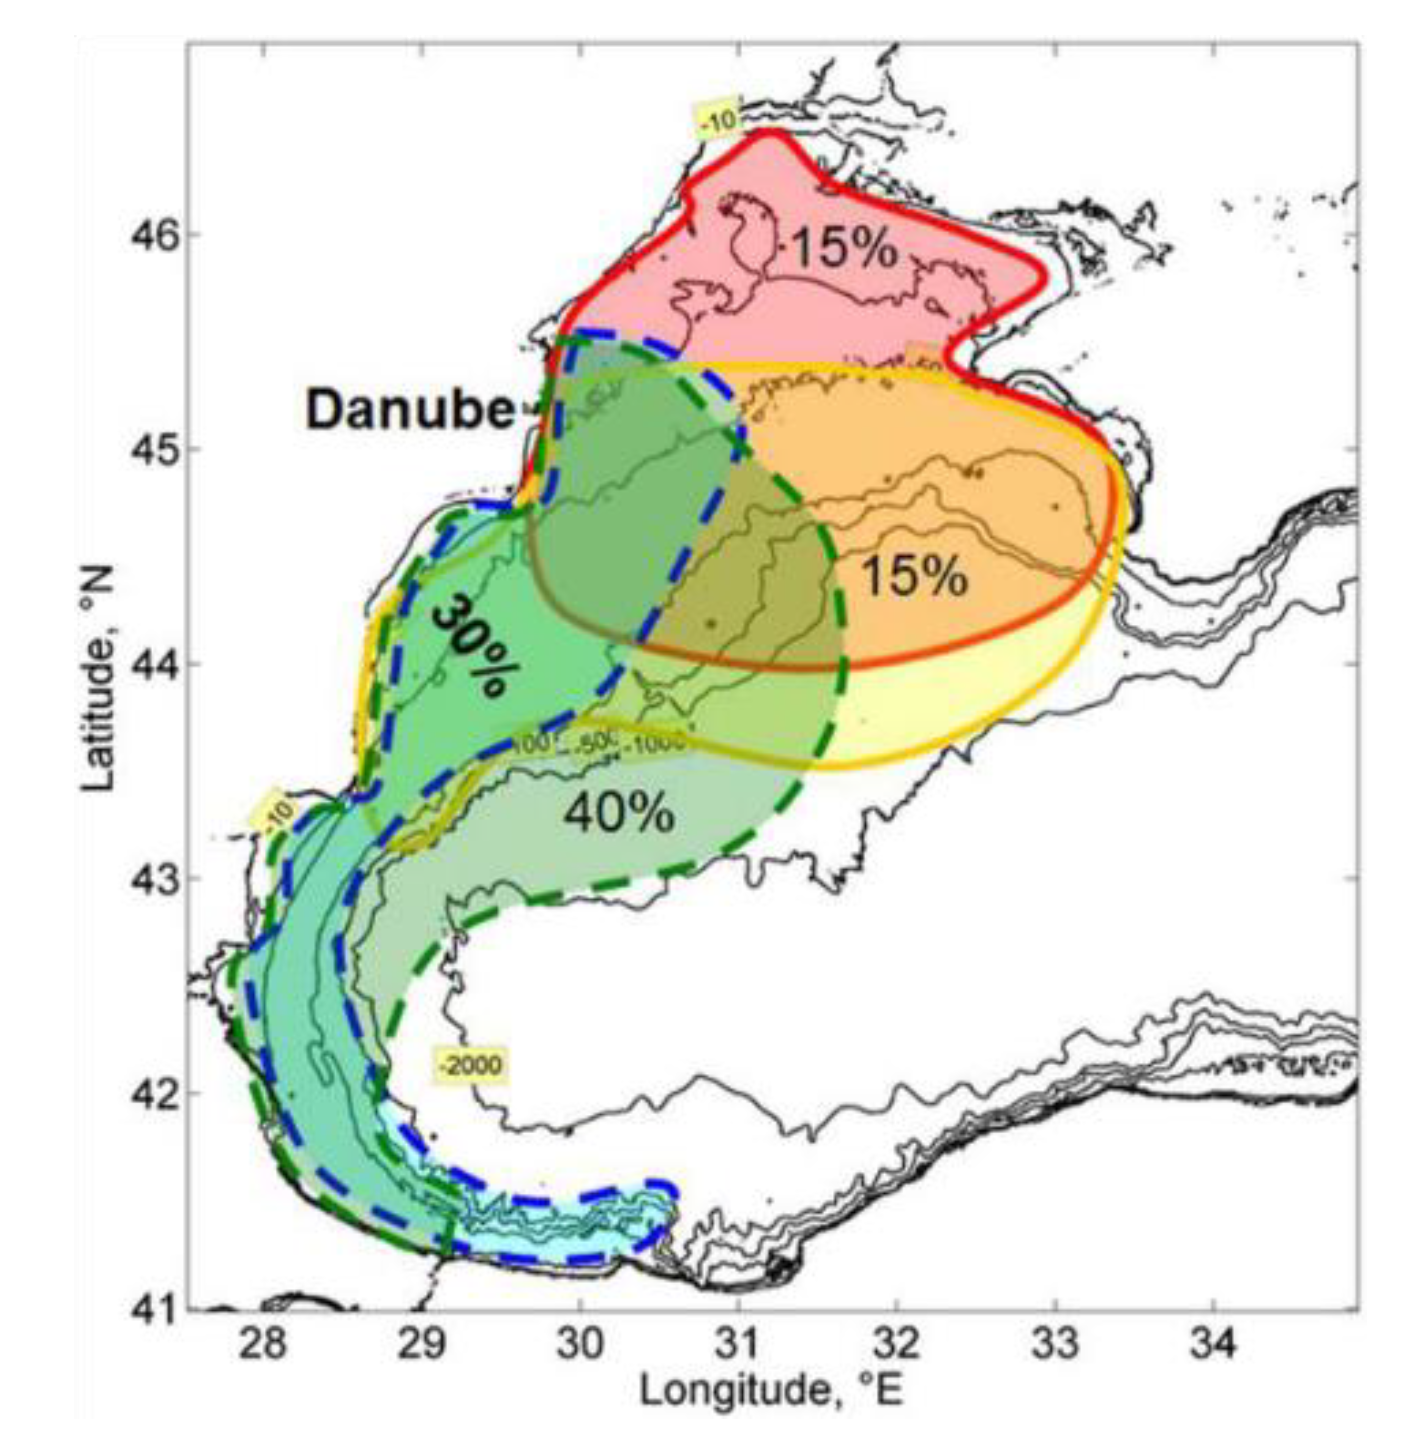
Figure 2.
European Center for Medium-Range Weather Forecasts (ECMWF) grid for the North-Western Black Sea shelf (Sfantu Gheorghe – abreviation in text Station: Danube; Portita– abreviation in text Station: PO; Constanta – abreviation in text Station: ECTA; Mangalia – abreviation in text Station: MG. Stations are numbered from the nearshore / near the coast with 1 to the offshore station 6 or 7).
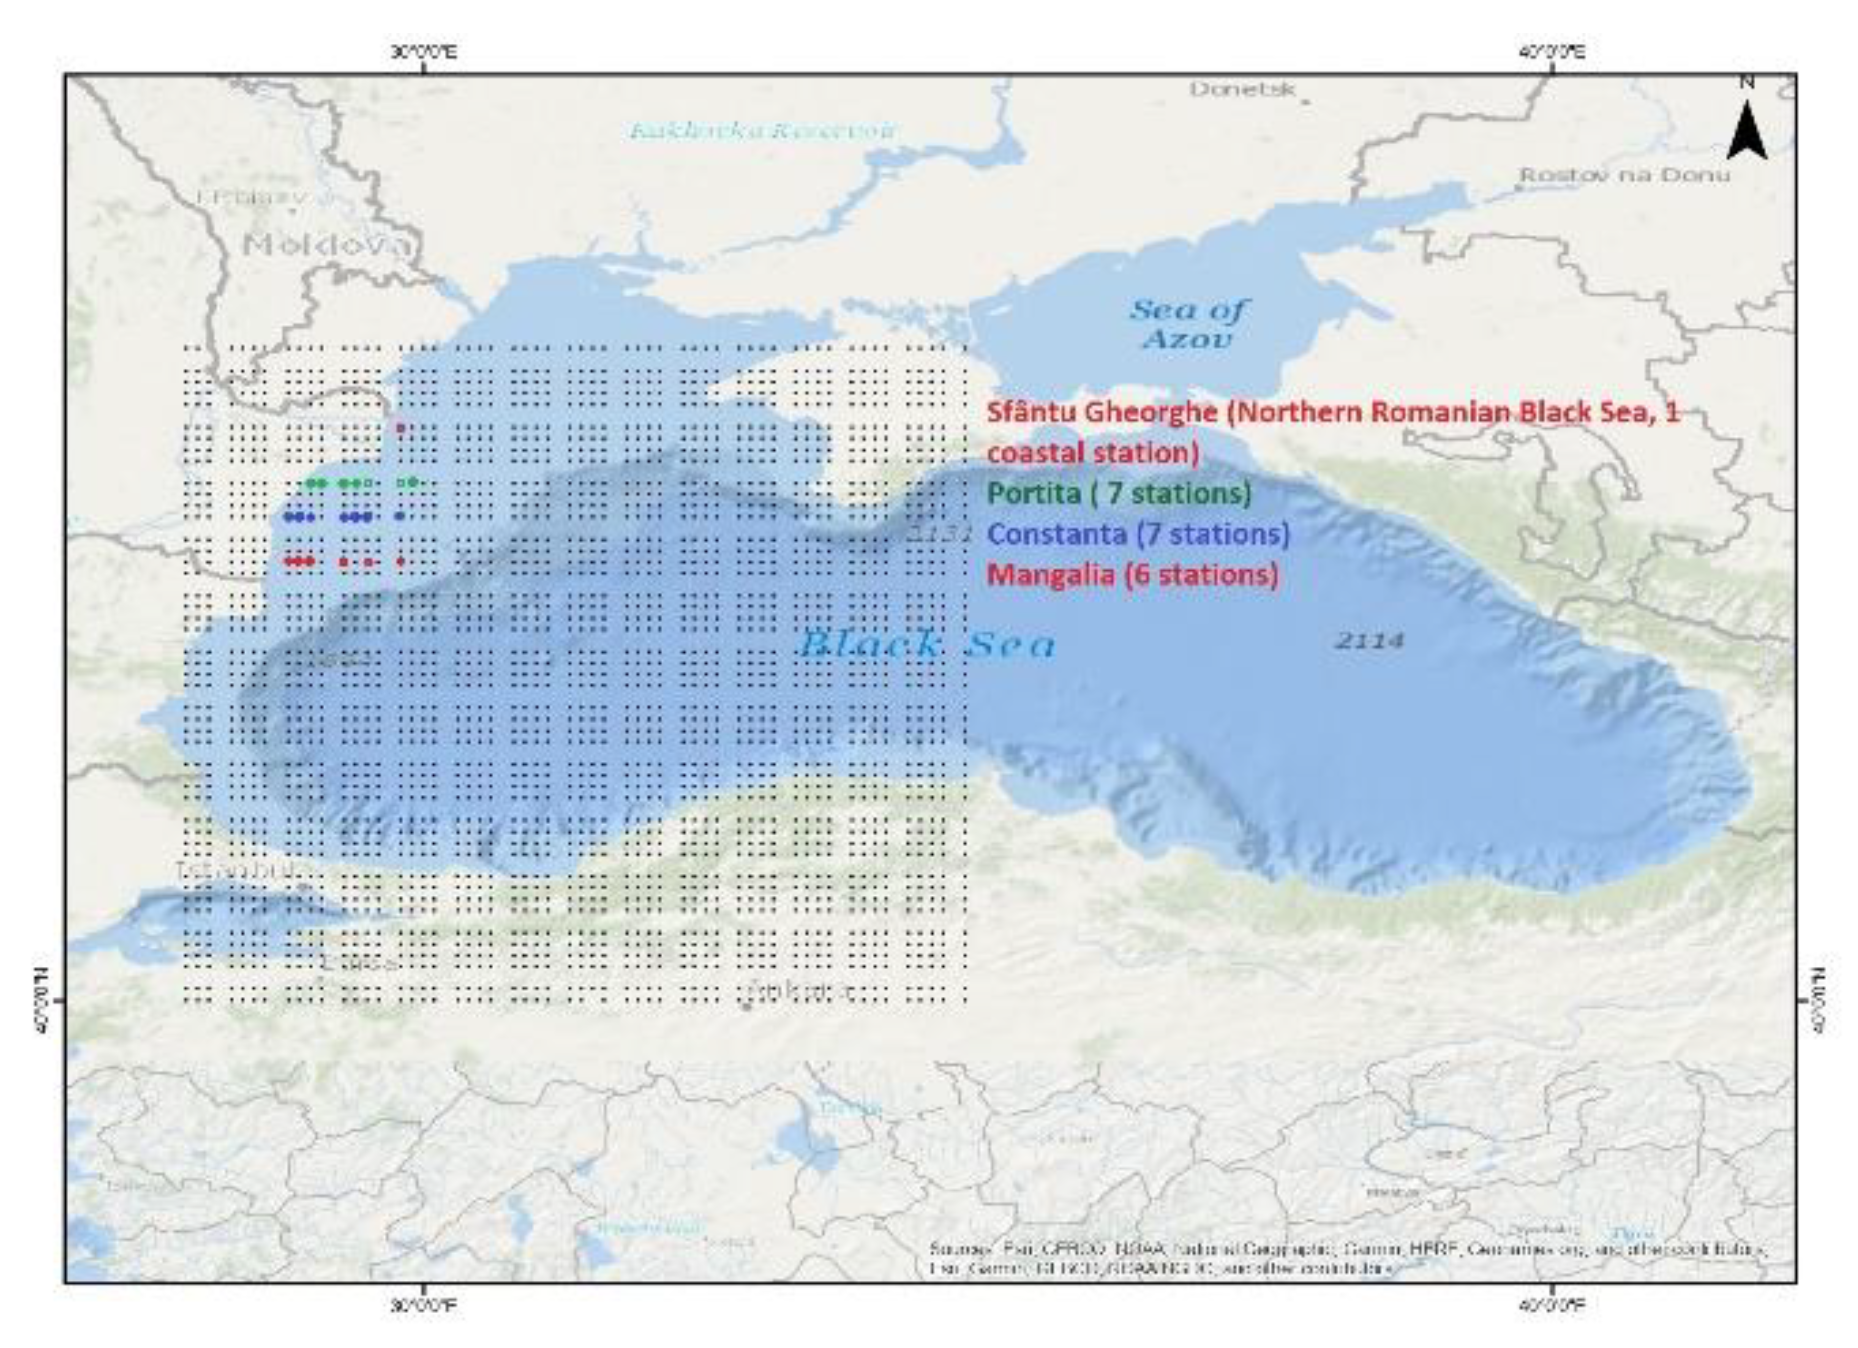
Figure 3.
Recorded upwelling [events no.] phenomena for May–September during the 2000 - 2019 period at Constanta, the Western Black Sea nearshore waters.
Figure 3.
Recorded upwelling [events no.] phenomena for May–September during the 2000 - 2019 period at Constanta, the Western Black Sea nearshore waters.
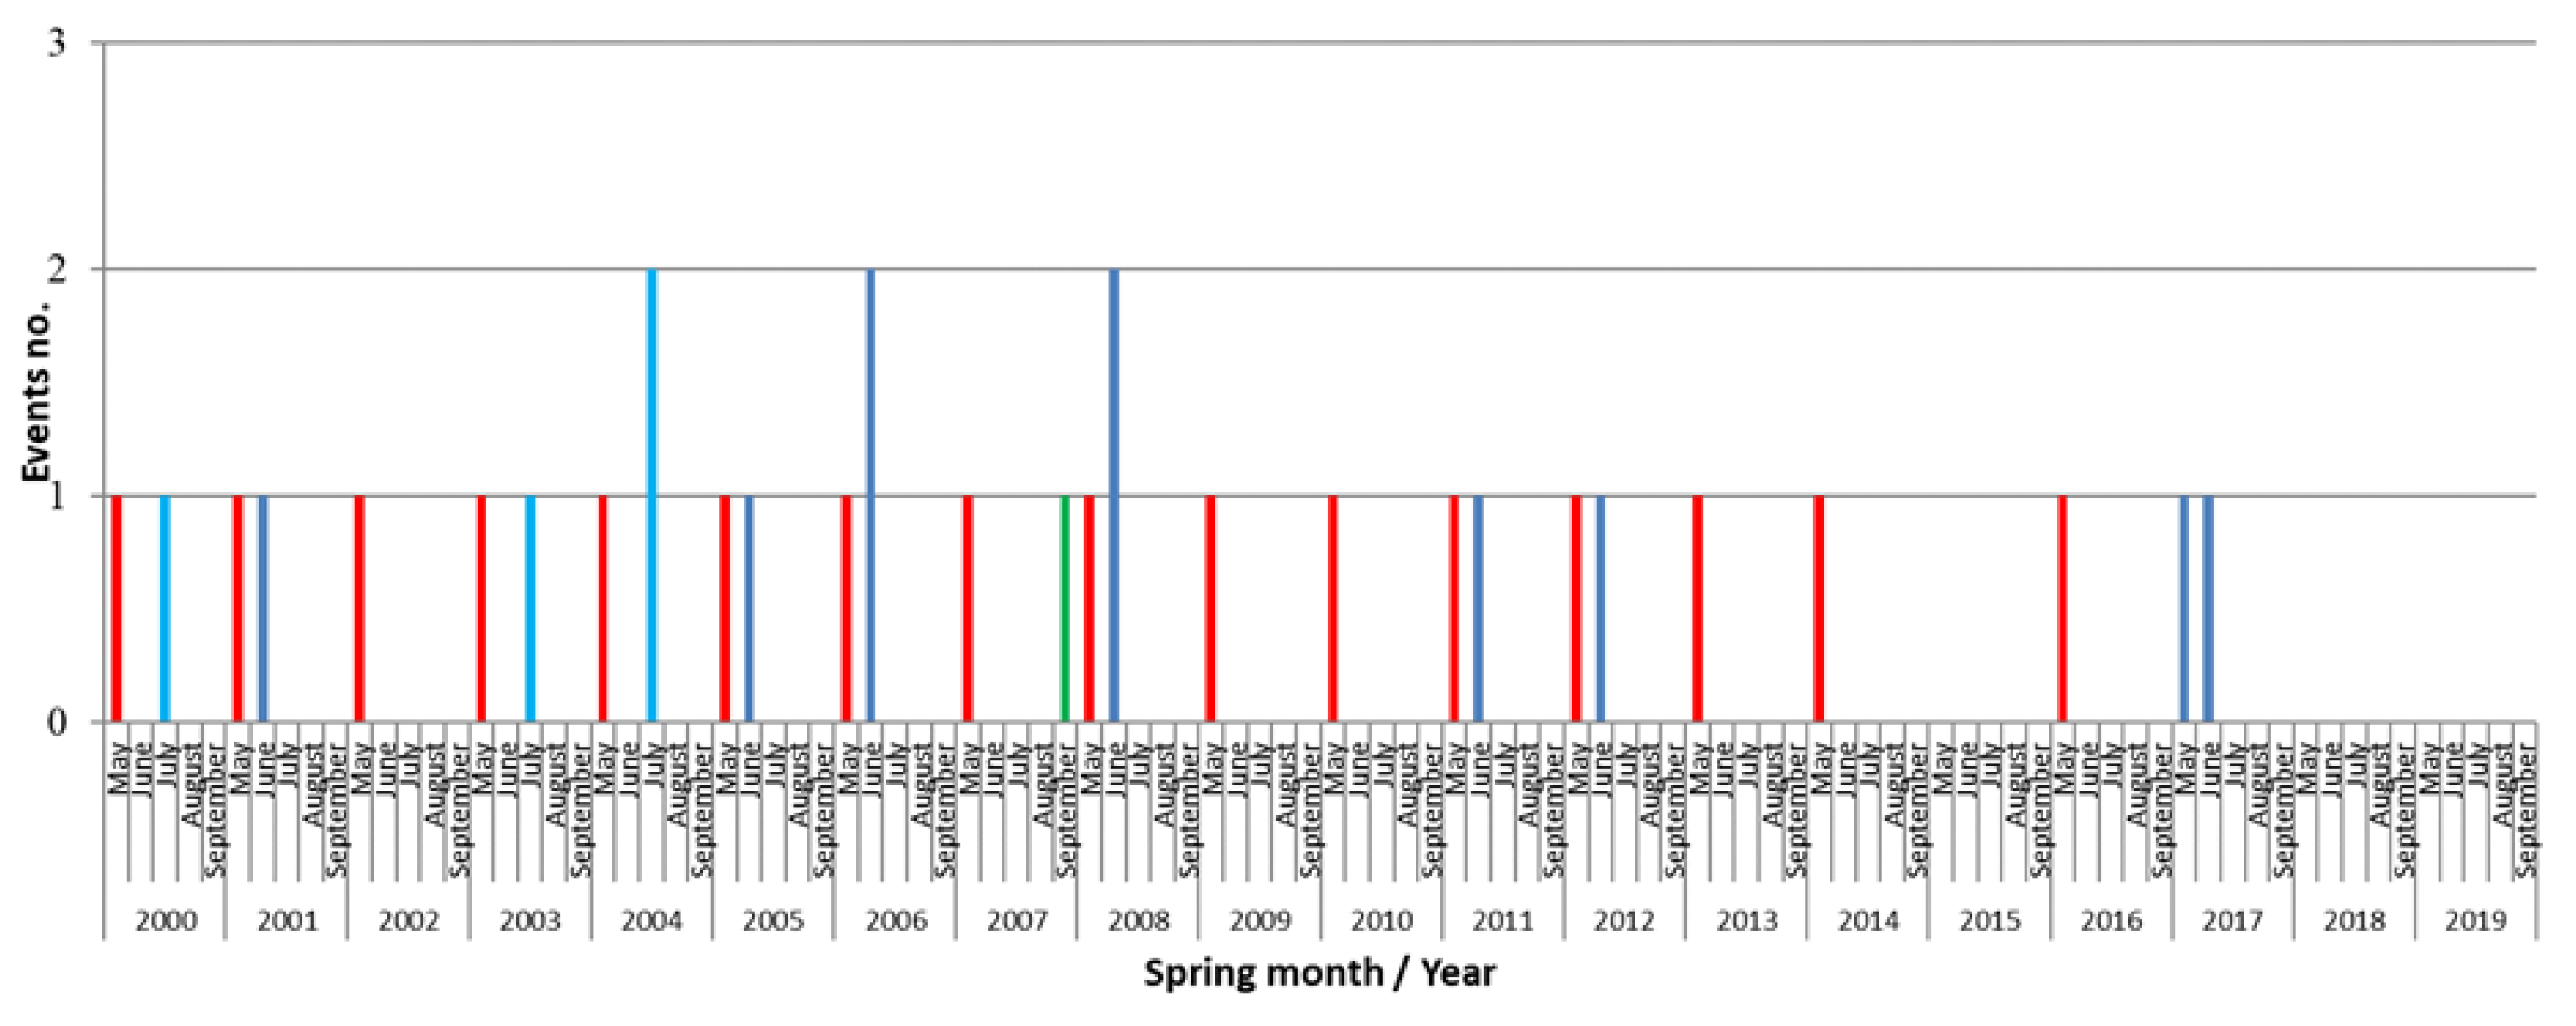
Figure 4.
a) Monthly and b) Yearly upwelling events count from September for the 2000 - 2019 period at Constanta, the Western Black Sea nearshore waters.
Figure 4.
a) Monthly and b) Yearly upwelling events count from September for the 2000 - 2019 period at Constanta, the Western Black Sea nearshore waters.
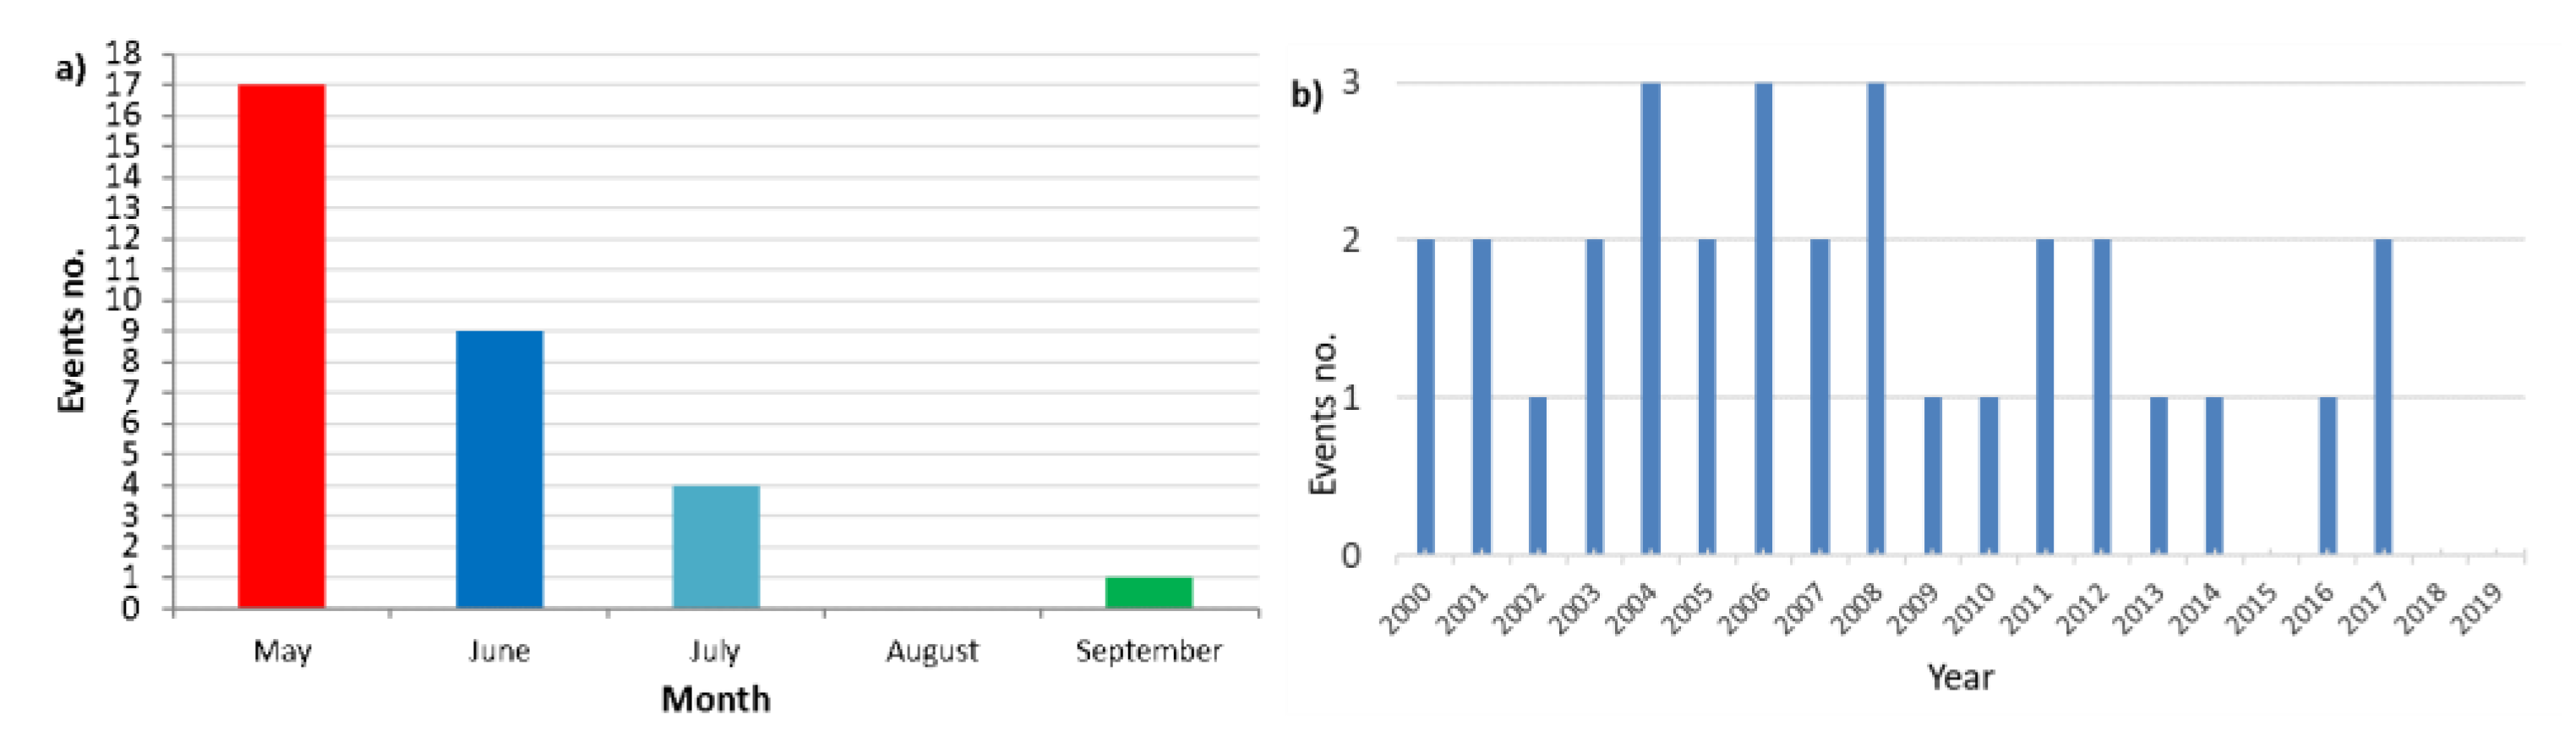
Figure 5.
Monthly variability of the Ekman transport index for the Western Black Sea.
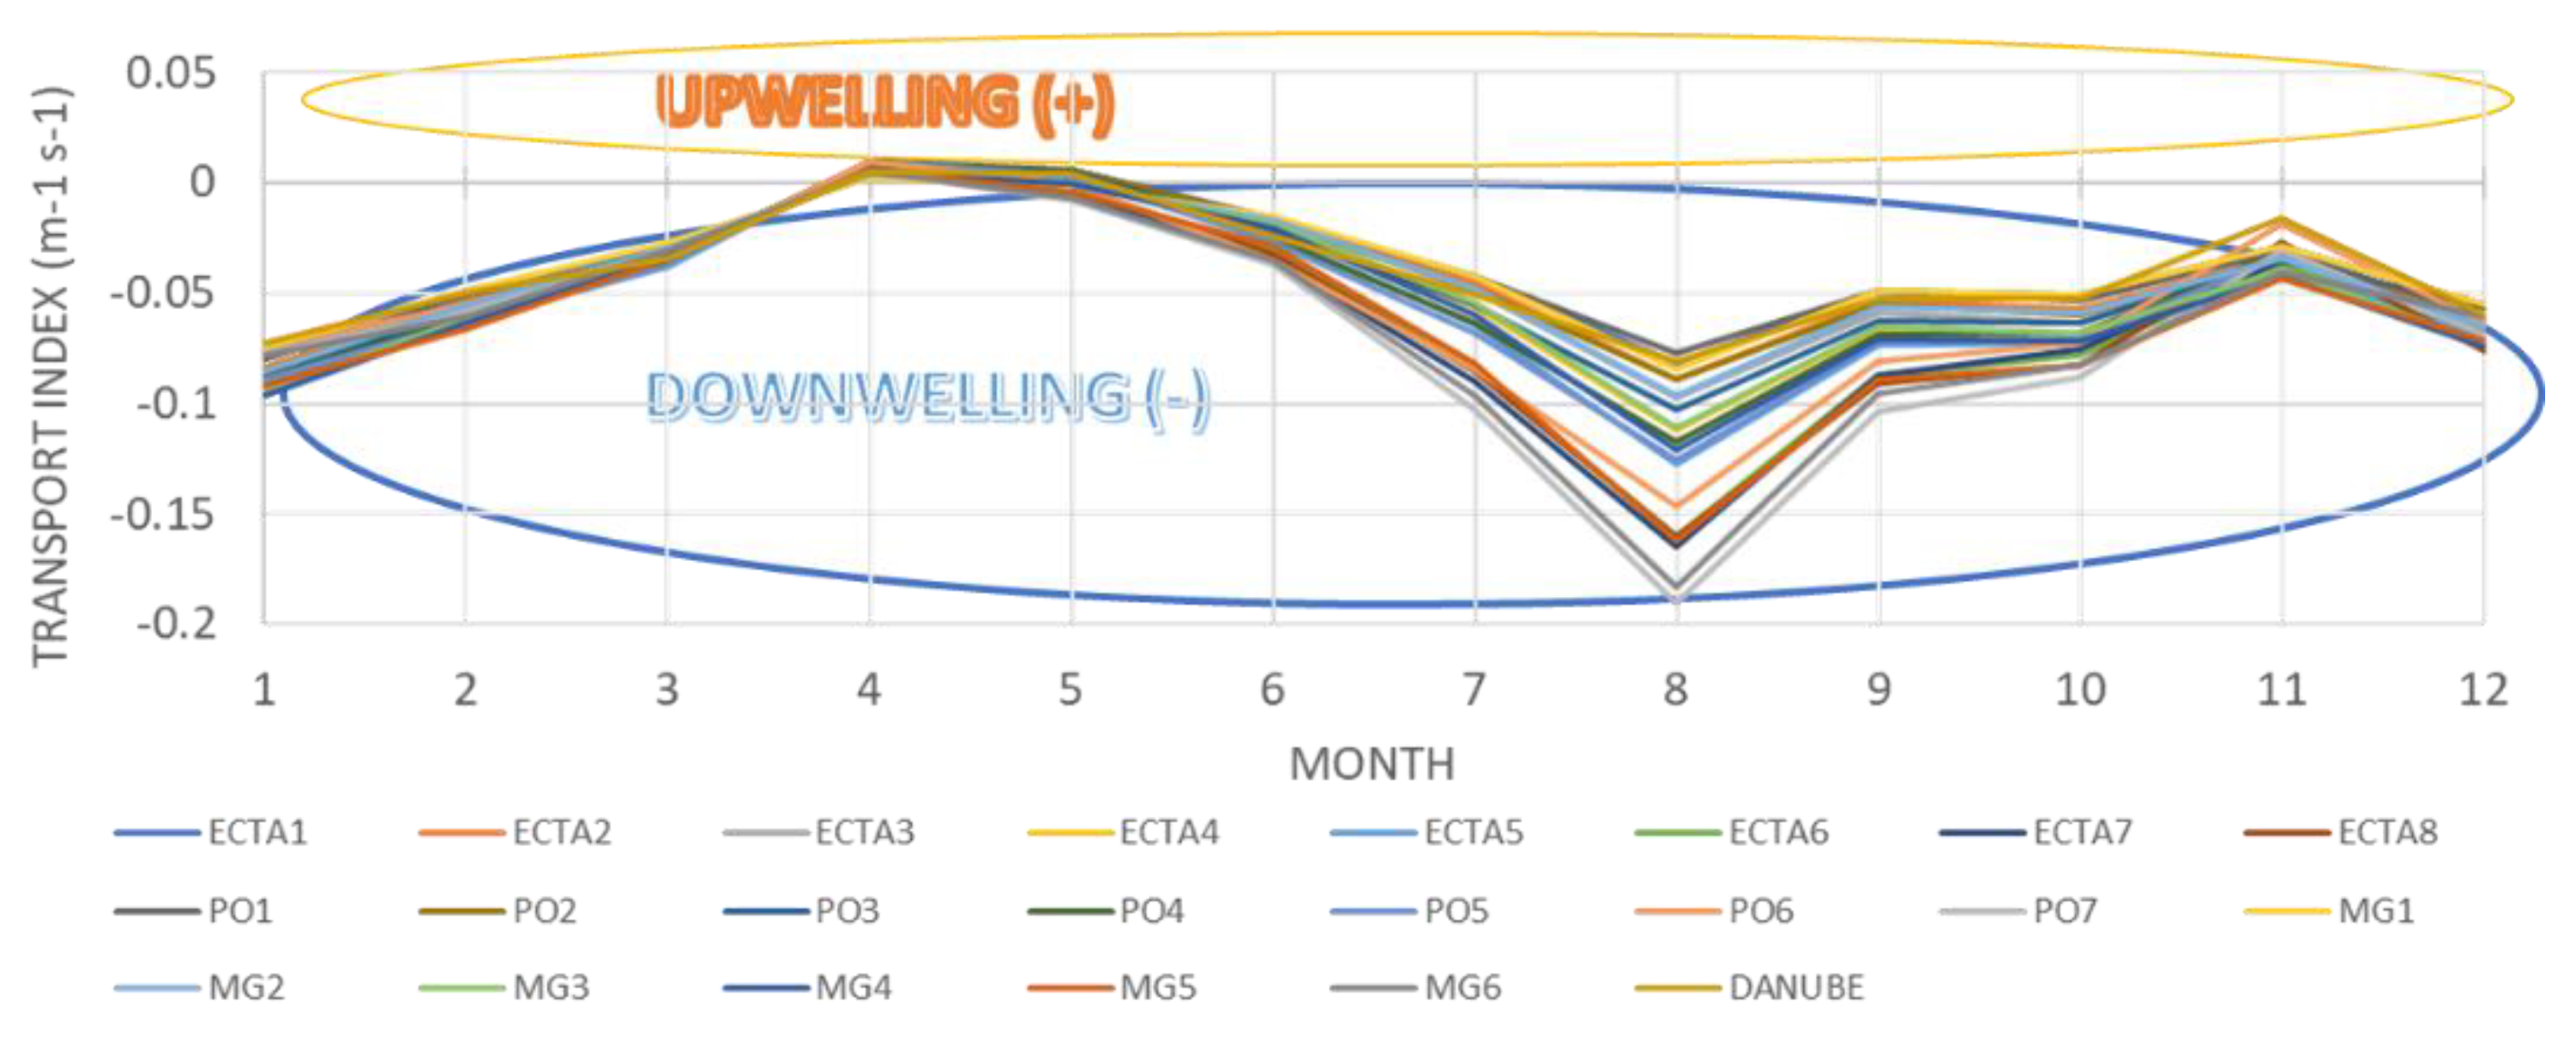
Figure 6.
Spatial and temporal dynamics of upwelling along the coast (Constanta), highlighting the complex interactions between wind patterns and coastal topography.
Figure 6.
Spatial and temporal dynamics of upwelling along the coast (Constanta), highlighting the complex interactions between wind patterns and coastal topography.
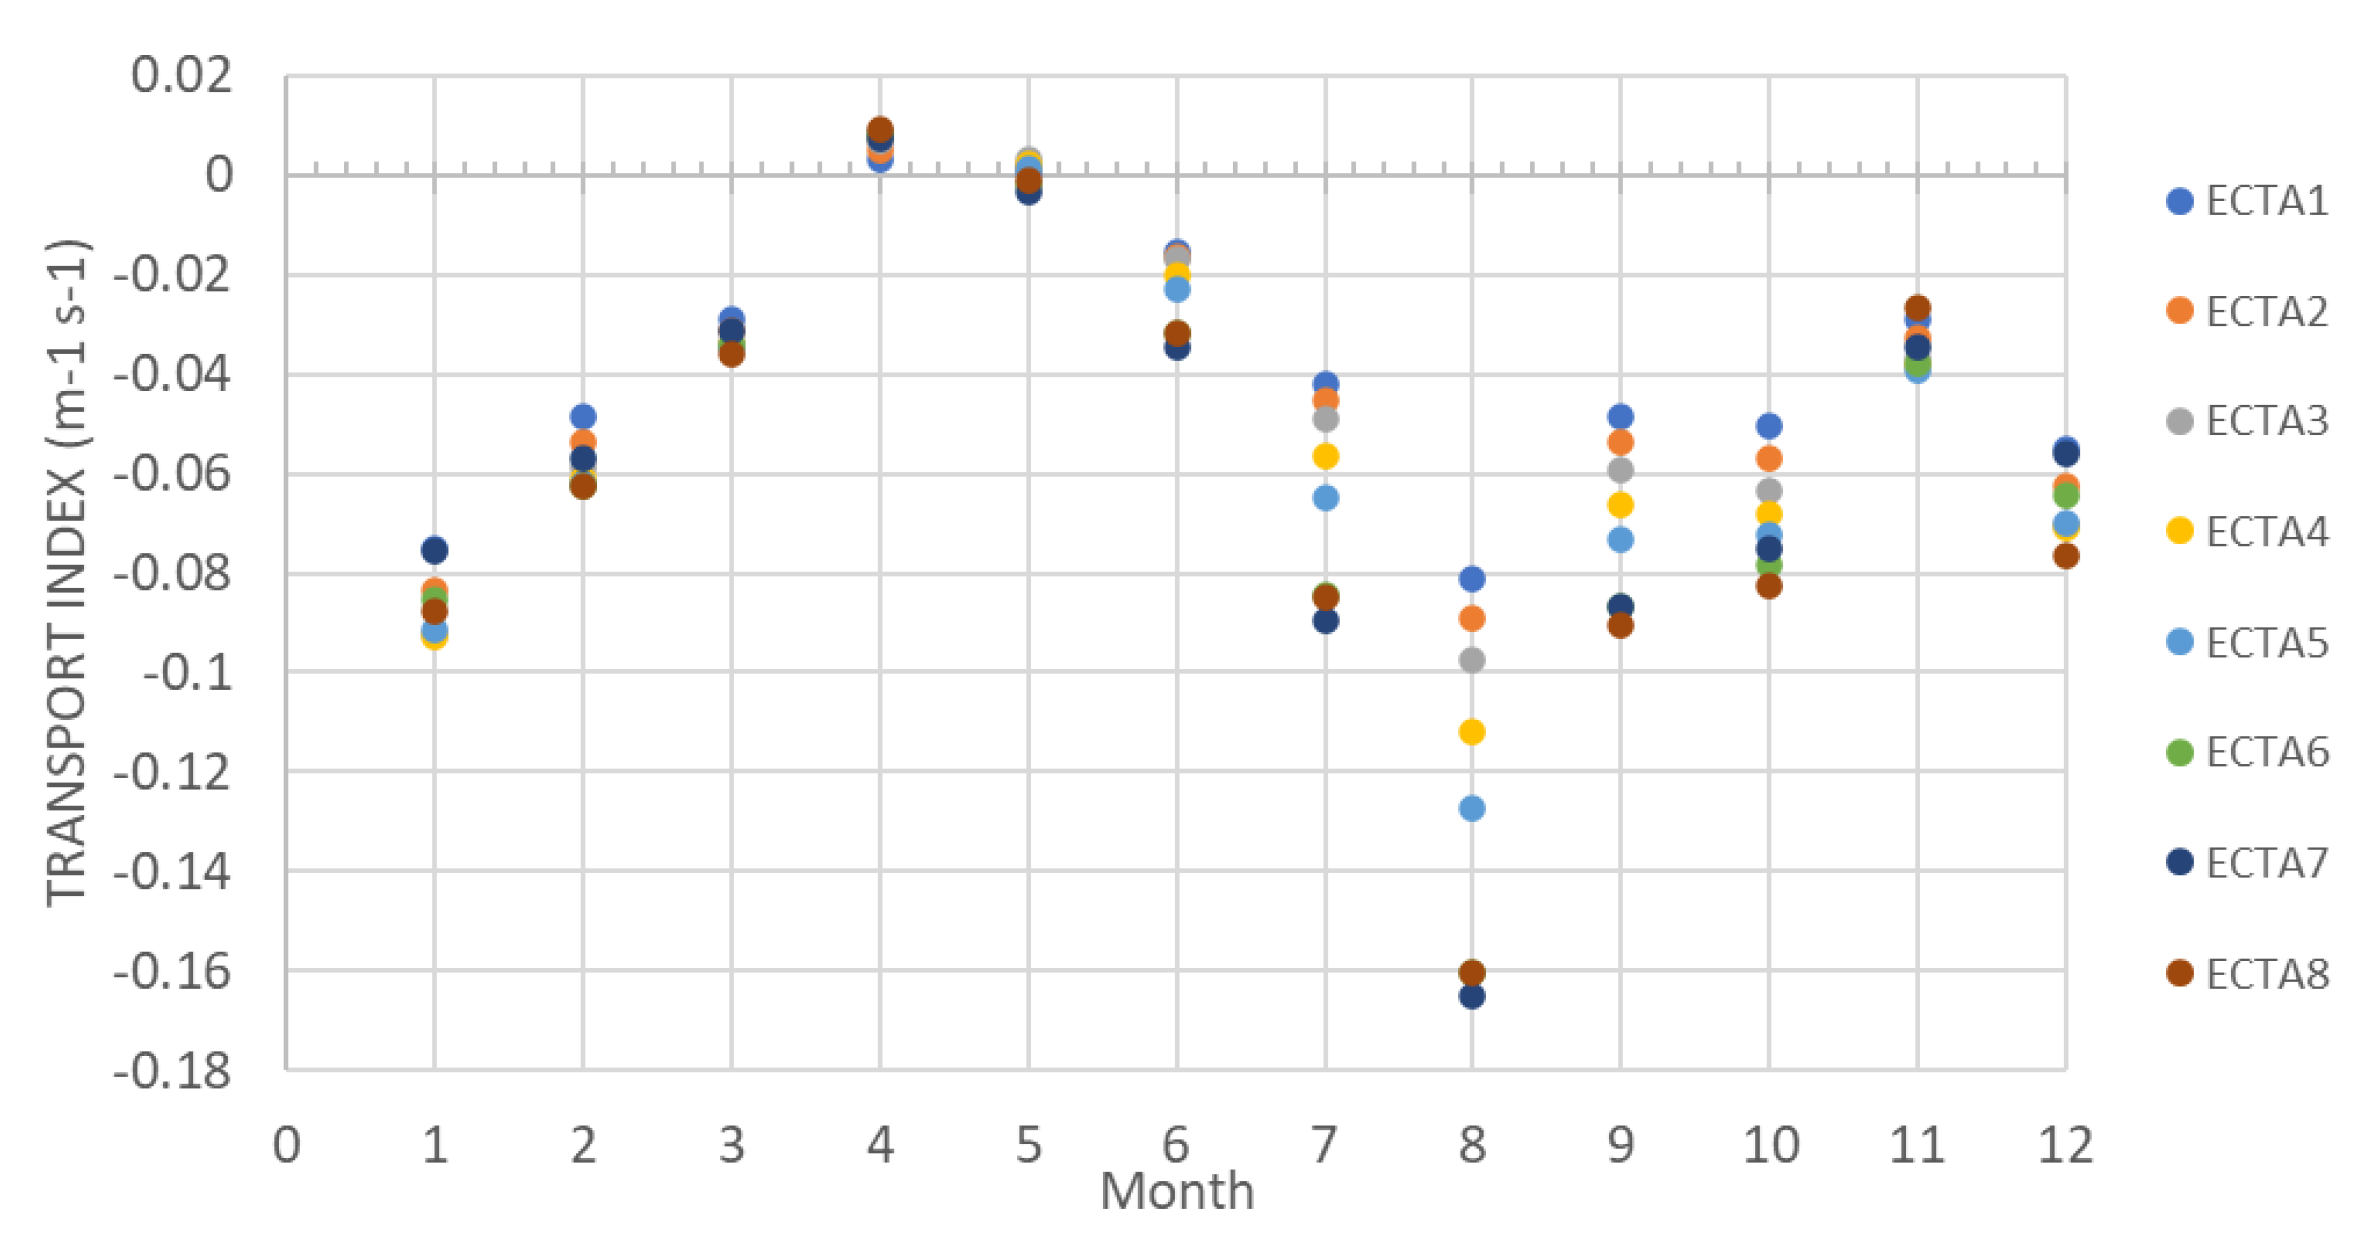
Figure 7.
Monthly variability of the Coastal Upwelling Transport Index (CUTI) near the shore of Constanța, Romania, from January 1993 to April 2019.
Figure 7.
Monthly variability of the Coastal Upwelling Transport Index (CUTI) near the shore of Constanța, Romania, from January 1993 to April 2019.
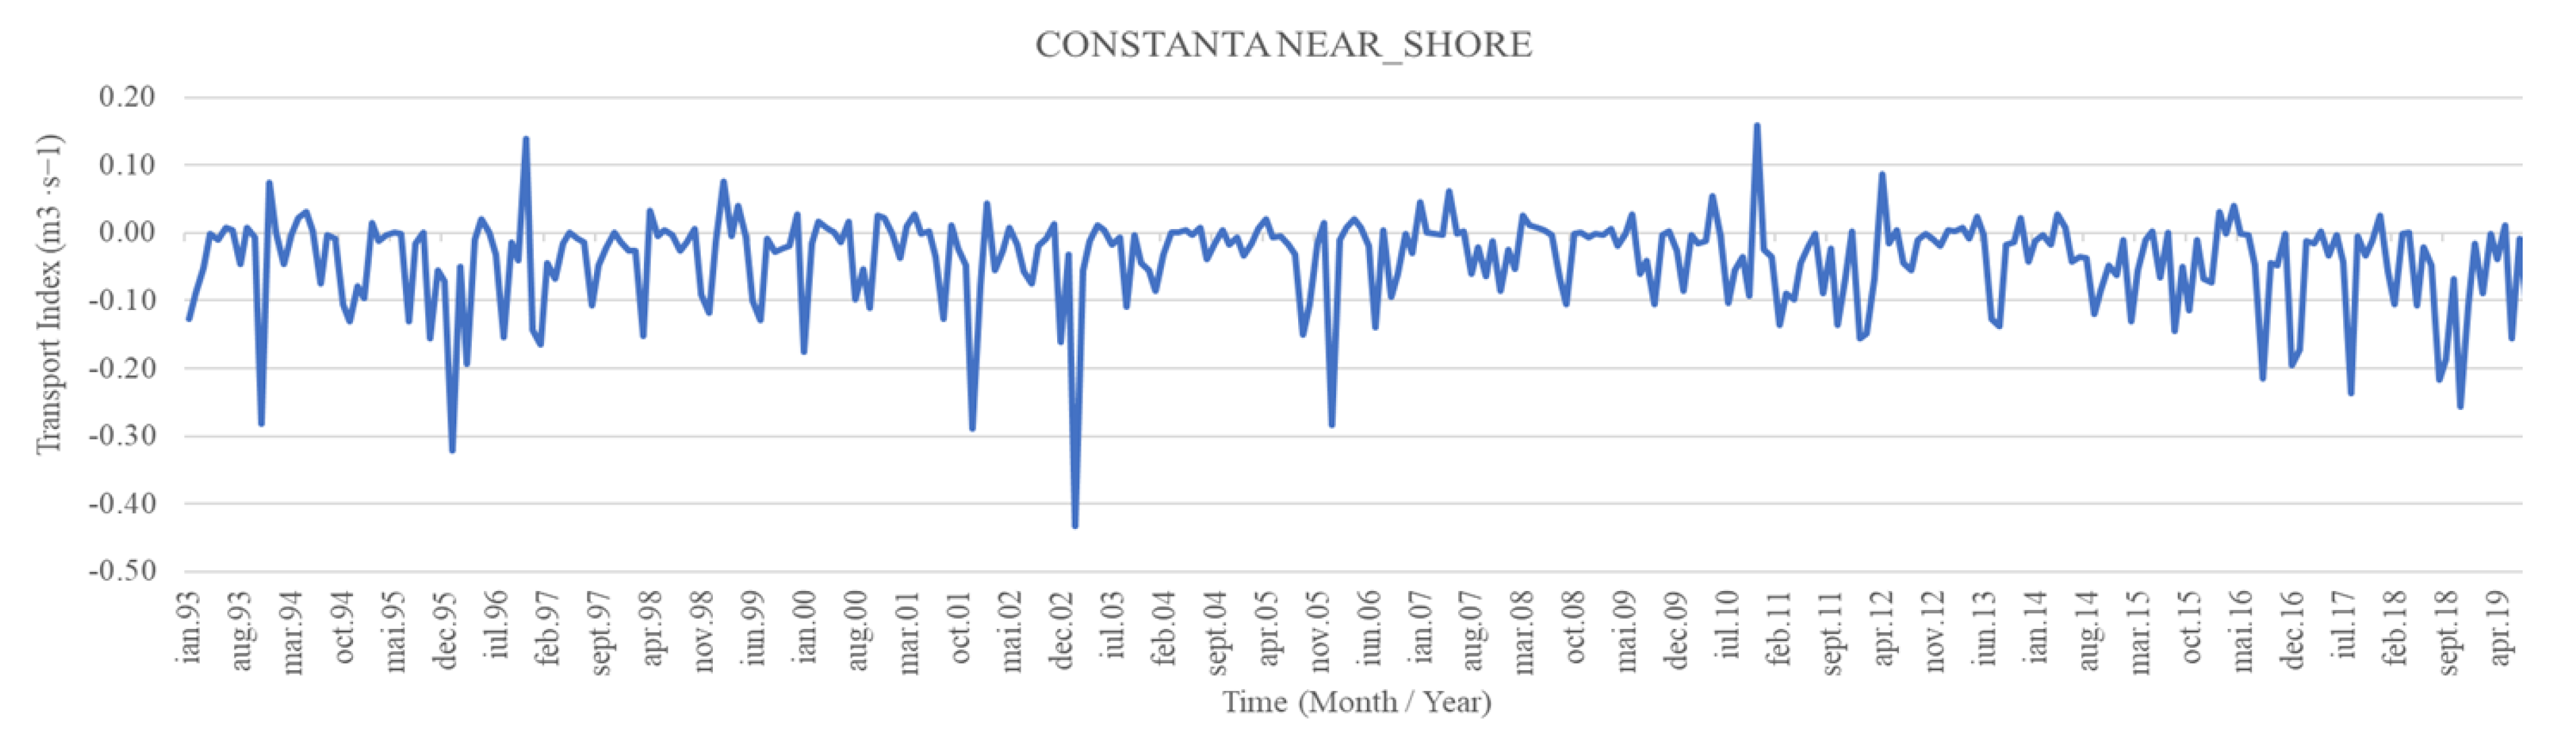
Figure 8.
Coastal Upwelling Transport Index (CUTI) for the offshore region of Constanța, Romania, from January 1993 to December 2019.
Figure 8.
Coastal Upwelling Transport Index (CUTI) for the offshore region of Constanța, Romania, from January 1993 to December 2019.
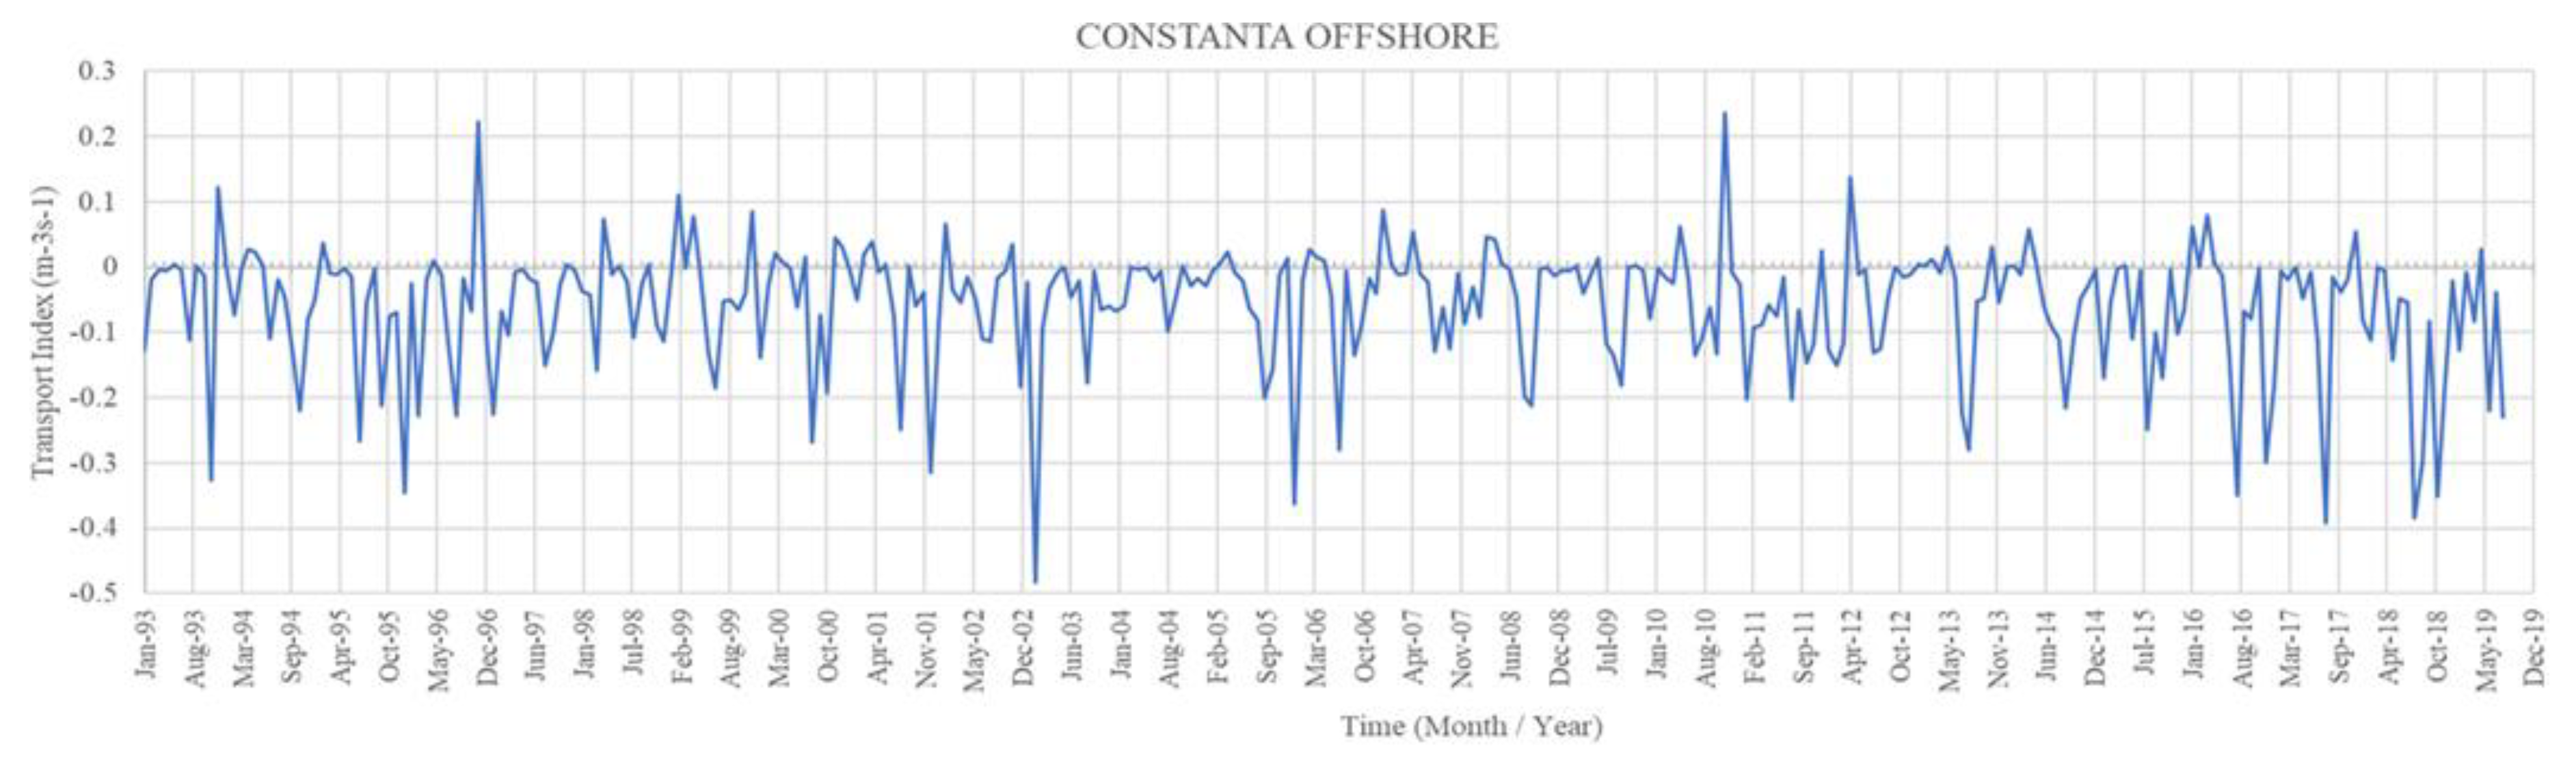
Figure 9.
Evolution of the Sea Surface Temperature (SST) in both nearshore and offshore areas, along with the Coastal Upwelling Transport Index (CUTI) over time, likely in the Black Sea.
Figure 9.
Evolution of the Sea Surface Temperature (SST) in both nearshore and offshore areas, along with the Coastal Upwelling Transport Index (CUTI) over time, likely in the Black Sea.
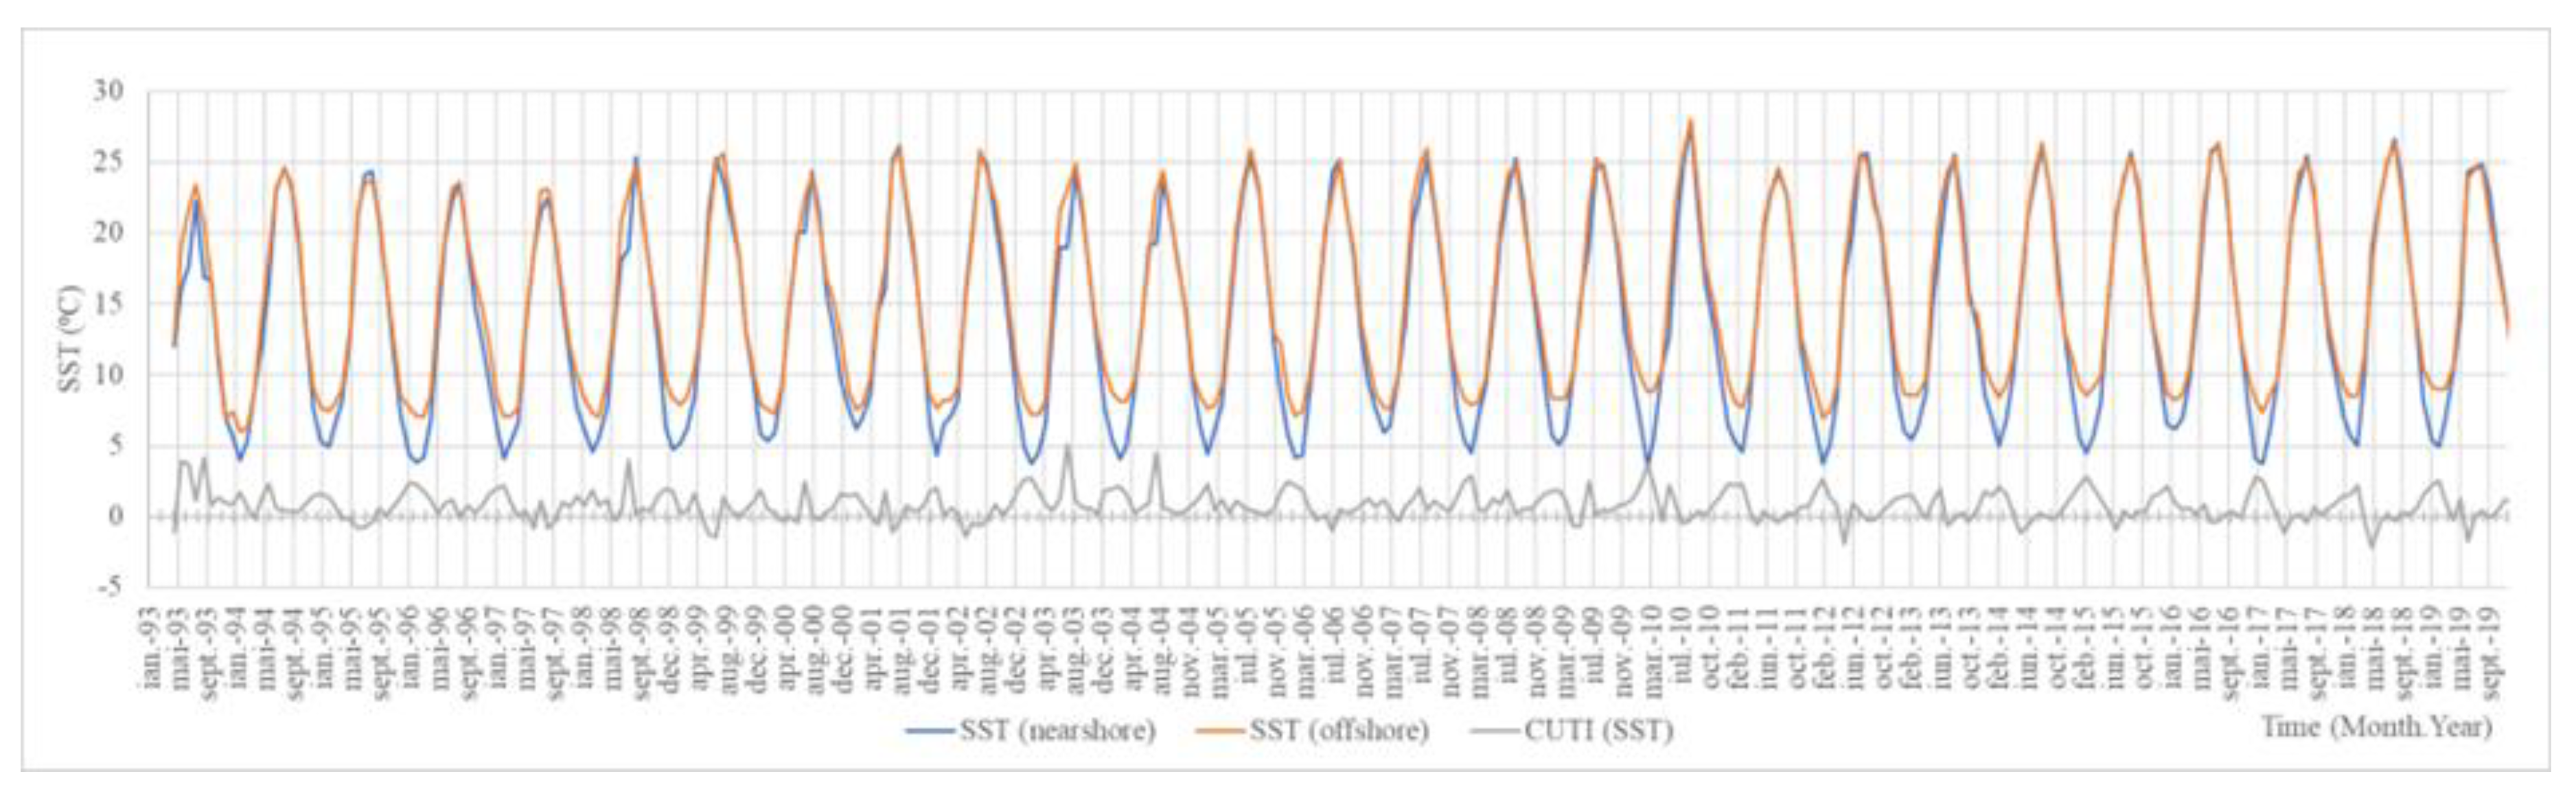
Figure 10.
CUTI for nearshore and offshore waters, for Est Constanta transect (CUTI ECTA).
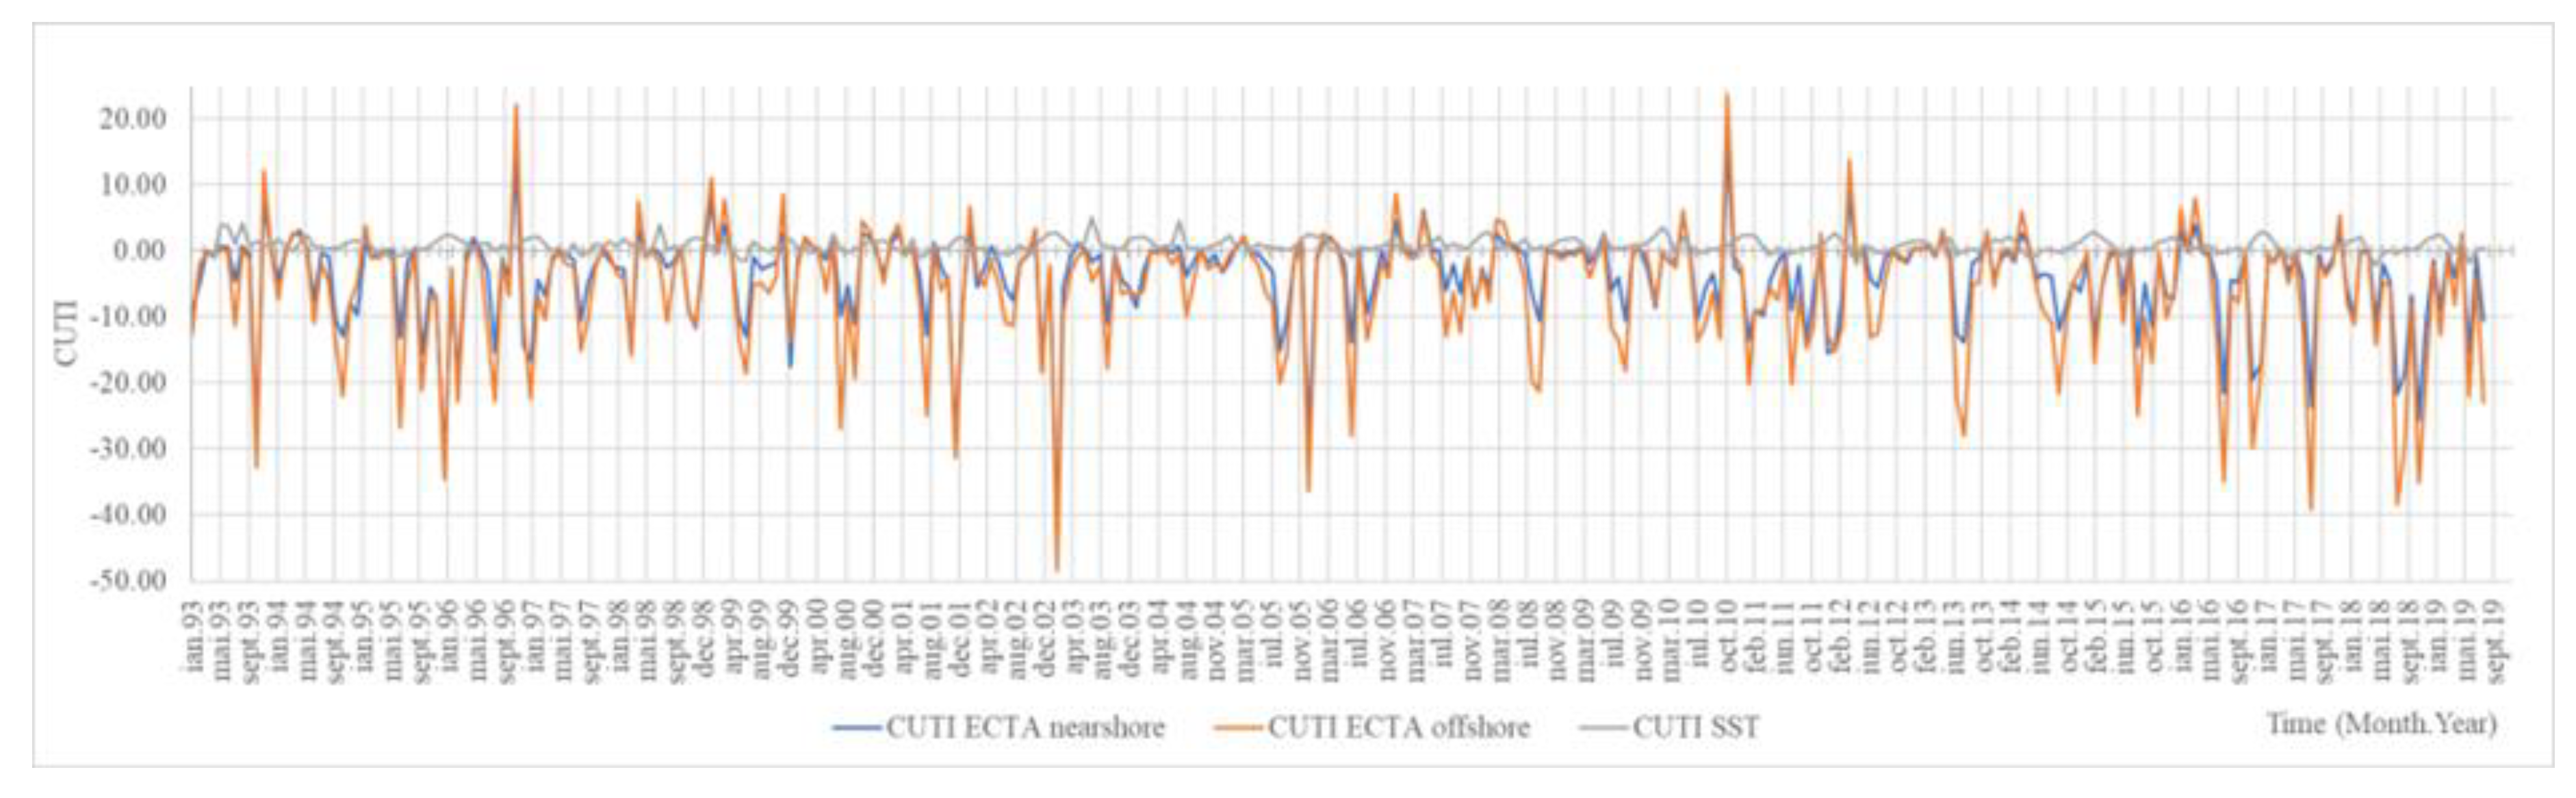
Figure 11.
Calculated offshore CUTI for the southern Romanian Black Sea location, Mangalia (MG) for the 1993 - 2019 period.
Figure 11.
Calculated offshore CUTI for the southern Romanian Black Sea location, Mangalia (MG) for the 1993 - 2019 period.
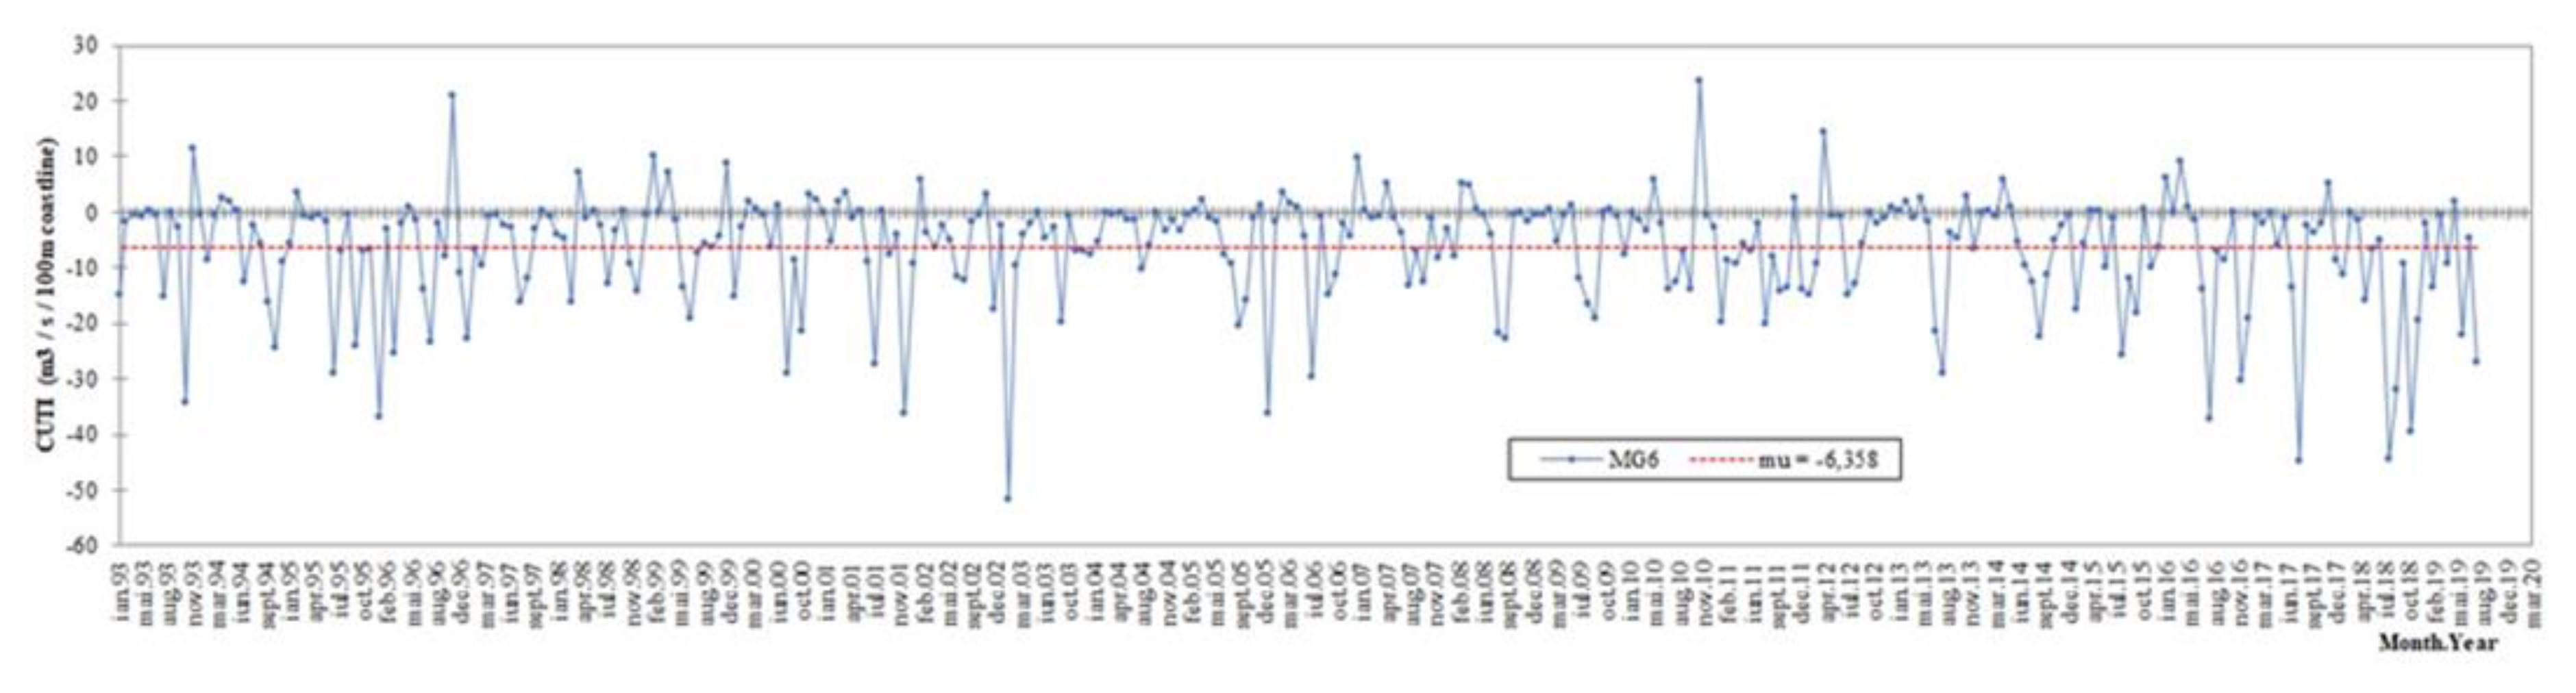
Figure 12.
Comparaison between observed upwelling events (In-situ) and calculated CUTI for the 1993 - 2019 period at Constanta, for the favourable upwelling month.
Figure 12.
Comparaison between observed upwelling events (In-situ) and calculated CUTI for the 1993 - 2019 period at Constanta, for the favourable upwelling month.
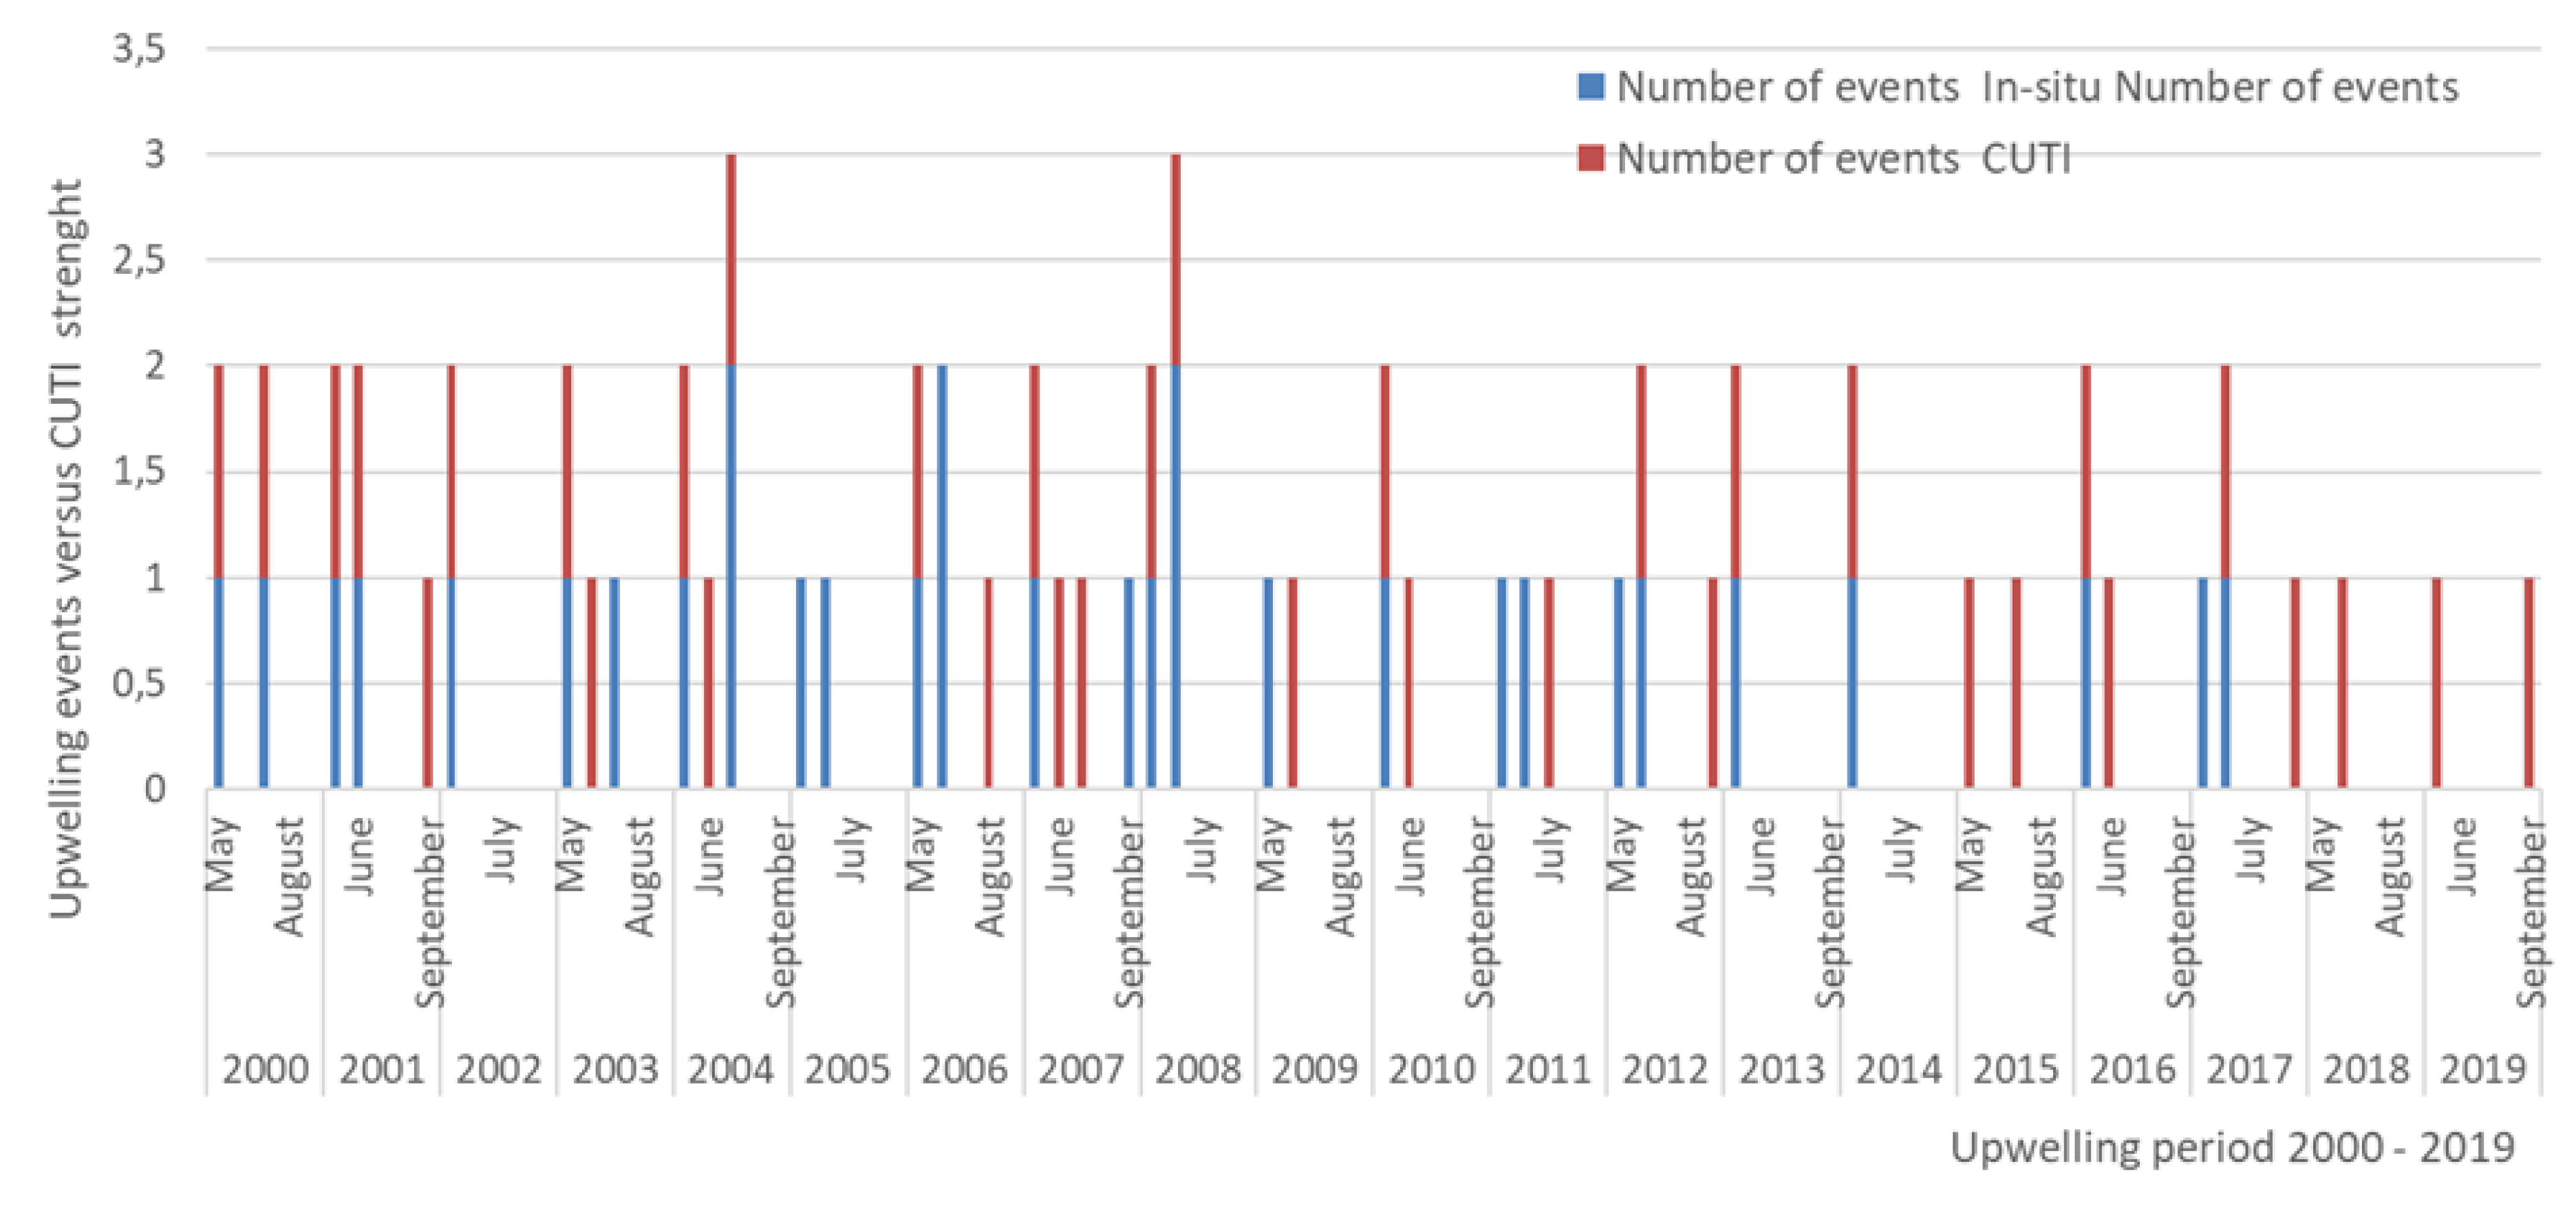
Figure 13.
CUTI ECTA1 (Coastal Upwelling Transport Index for the nearest coastal station) and BEUTI (Biologically Effective Upwelling Transport Index), from January 1993 to December 2019.
Figure 13.
CUTI ECTA1 (Coastal Upwelling Transport Index for the nearest coastal station) and BEUTI (Biologically Effective Upwelling Transport Index), from January 1993 to December 2019.
Disclaimer/Publisher’s Note: The statements, opinions and data contained in all publications are solely those of the individual author(s) and contributor(s) and not of MDPI and/or the editor(s). MDPI and/or the editor(s) disclaim responsibility for any injury to people or property resulting from any ideas, methods, instructions or products referred to in the content. |
© 2024 by the authors. Licensee MDPI, Basel, Switzerland. This article is an open access article distributed under the terms and conditions of the Creative Commons Attribution (CC BY) license (http://creativecommons.org/licenses/by/4.0/).
Copyright: This open access article is published under a Creative Commons CC BY 4.0 license, which permit the free download, distribution, and reuse, provided that the author and preprint are cited in any reuse.


