Submitted:
23 July 2024
Posted:
24 July 2024
You are already at the latest version
Preprints on COVID-19 and SARS-CoV-2
Abstract
Background: COVID-19 has a major impact on businesses, with employee absenteeism resulting in lost productivity and medical costs to employers as well as lost wages and medical costs to employees. The aim of this analysis was to assess the economic impact of workplace COVID-19 vaccination in the United States (US).Methods: A decision tree economic model, populated with US data for the working-age population, estimated the burden of COVID-19 in the workplace (symptomatic infections, long COVID cases, inpatient/outpatient care, absent days) with and without vaccination. Disease burden and impact of seasonal influenza vaccination was studied for context. Results: Without workplace vaccination, an average US business (with 10,000 employees), had an estimated 18,175 absent days from COVID-19, resulting in employer lost productivity costs of $ 5.08 million. Implementing COVID-19 workplace vaccination (at 70% US Healthy People target vaccination rate) prevented an estimated 3,132 absent days, saving employers $ 876,453 in lost productivity costs and $240,633 in medical costs. It also saved employees $ 182,196 in medical costs and $198,250 in lost wages . Seasonal influenza caused around 5,333 absent days, and seasonal influenza vaccination (at 70% coverage) prevented 1,675 absent days, saving employers $ 468,394 in lost productivity and saving employees $ 27,757 in medical costs. Conclusions: COVID-19 remains a burden to US businesses. Implementing COVID-19 workplace vaccination and increasing vaccination coverage rates for COVID-19 and seasonal influenza has the potential to prevent a significant number of absent days, while providing employers and employees with cost savings from averted disease and its consequences.
Keywords:
COVID-19
; influenza
; vaccination
; workplace
; economic model
; United States
Introduction
The coronavirus disease 2019 (COVID-19) pandemic had a major impact on the United States (US) economy, with a gross domestic product loss estimated at $14 trillion over the first four years of the pandemic (2020–2023) [1]. Industry experienced large declines in revenue (e.g., over 50% declines in the first 30 months for air travel, indoor dining and large events [1]) as well as labor shortages due to reduced labor force participation [2].
According to the US Bureau of Labor Statistics, the number of employees absent due to illness remained elevated every quarter compared with pre-pandemic levels, especially during the winter months (e.g., 5.00 million and 3.30 million in the 4th quarter of 2020 and 2023, respectively, versus 2.85 million before the pandemic) [3]. For employees, the average loss of earnings due to a COVID-19 absence was estimated at $9,000, with 90% of this loss occurring over the 14 months following infection [4]. For the overall US population, this amounted to an estimated annual loss in employee earnings due to COVID-19 of $62 billion, equivalent to around half of the loss from cancer or diabetes [4].
For employers, employee absences due to COVID-19 resulted in major disruptions to business operations. For instance, the surge in Omicron cases in late 2021/early 2022 caused absences among 4.4% of United Airlines and 10.7% of Delta employees, which resulted in up to 7% of flights being cancelled [5], compared with 1.6% of pre- pandemic flights cancelled in 2018[6]. Outbreaks and transmission of infectious respiratory diseases are common in the workplace due to employee interactions. For example, in the second half of 2021, there were a reported 12,660 COVID-19 outbreaks with known type of workplace, of which nearly a third were in nursing/residential care facilities and nearly a quarter in K–12 (primary and secondary) schools [7]. By contrast, pooled estimates from seasonal influenza transmission studies indicate that 16.2% of influenza transmission occurs in the workplace [8]. The workplace impact of COVID-19 when compared with seasonal influenza may also lead to longer absences, as observed in a 2022 Netherlands study: there was a longer absence from work due to COVID-19 (median 10 days versus 6 for influenza), as well as a lower chance of returning to work in the short-term (34% vs. 72% within 1 week, 71% vs. 92% within 3 weeks, and 91% vs. 99% within 6 weeks) [9]. The impact of COVID-19-related absences is further exacerbated by an ongoing skills shortage in the US [10]. Many industries are experiencing difficulties in finding and retaining skilled workers, which magnifies the operational disruptions caused by employee illnesses. This shortage not only heightens the financial burden on businesses but also stresses the importance of maintaining a healthy workforce to sustain productivity and operations.
Following the acute infection and corresponding absences from work, long COVID can also result in long-term absences from work. In the US, a recent Centers for Disease Control and Prevention (CDC) study on long COVID reported that 5% of working-age adults with COVID-19 experienced long-term symptoms, of which 28% (and up to 35% of 40–49-year-olds) experienced disabling long COVID i.e., significantly limiting their daily activities [11], and thus, likely to impact their work productivity. In addition, claims data analyses of injured workers from New York State found that 18% of people with long COVID who filed an injury claim remained off work one year after contracting COVID-19, and the majority (78%) were aged <60 years [12]. The 2022 US National Health survey reported that people with long COVID have a nearly 30% higher chance of experiencing disability (odds ratio 1.29; 95% confidence interval [CI] 1.11–1.50) than those without long COVID [13]. In addition, 6% had chronic cardiovascular conditions and 39% had anxiety or depression resulting in an increased number of workdays missed versus people with those conditions but without long COVID (average 26.2 vs. 11.8 days for cardiovascular; and 12.2 vs. 8.5 for anxiety/depression) [13]. In 2021, the US government issued guidance that long COVID could be considered a disability under the American Disability Act (ADA), thus requiring employers to provide reasonable accommodations [14]. Total estimated annual losses in wages due to long COVID in the US were estimated to range from $105–235 billion [15,16].
COVID-19 remains the leading cause of respiratory infectious disease leading to hospitalizations and deaths, regardless of age and comorbidities, both during and between seasonal peaks [17]. To maintain high levels of protection against COVID-19, the CDC recommends a fall vaccination for all ages (from 6 months old) with an updated 2024-2025 COVID-19 vaccine. Seasonal influenza vaccination among working-age adults is relatively common e.g., with May 2024 coverage rates of 37.5% among 18–49 year-olds and 51.5% among 50–64-year-olds in the US [18], however, COVID-19 vaccination coverage was lower i.e., 14.3% among 18–49-year-olds and 25.2% among 50–64-year-olds [19]. Seasonal influenza vaccination programs in the workplace are also common in the US, and previous studies have shown that annual, free, onsite seasonal influenza vaccination in the workplace was successful in achieving a pooled vaccination coverage rate of 42% (95% CI 25–60%) among employees [20]. Despite the low vaccination coverage rate among working-age adults and lack of data on COVID-19 workplace vaccination programs among employers in the US, data indicate that workplace vaccination could be successful, as seen among healthcare workers [21].
To inform implementation of COVID-19 workplace vaccination programs, this analysis assessed the COVID-19 disease burden in the workplace and the impact of COVID-19 workplace vaccination with the updated Moderna COVID-19 mRNA Fall 2023/2024 vaccine. The impact was assessed for employers (e.g., productivity losses, medical costs) and employees (e.g., disease burden, wage losses and medical costs), and compared with scenarios of no workplace vaccination and seasonal influenza workplace vaccination. A simplified decision tree economic model estimated disease burden of COVID-19 and seasonal influenza, and evaluated the health and economic outcomes following workplace vaccination among working-age adults in the US.
Methods
Model Description
A simplified decision tree ‘workplace vaccination’ model (Figure 1) for both COVID-19 and seasonal influenza was developed in Microsoft Excel, based on the comprehensive COVID-19 dynamic transmission and economic model by Kohli et al. (2023) [22]. The workplace vaccination model was used to estimate the disease impact of COVID-19 and seasonal influenza (assuming no workplace vaccination in place); as well as the impact of Moderna COVID-19 mRNA Fall 2023/2024 vaccination and currently available seasonal influenza vaccination among employees aged 18–64 years over a one year time horizon. Vaccination impact was estimated based on COVID-19 and seasonal influenza disease-related health and economic outcomes prevented by vaccination, using current vaccination rates (based on the 2023–2024 season data) and the US Healthy People 2030 target immunization rate for seasonal influenza vaccination (70%) for both COVID and seasonal influenza [23]. These results provide insights into the value for employers and employees of increasing vaccination rates in the working-age population.
Disease outcomes included infections, outpatient visits, hospitalizations, COVID-19 or seasonal influenza deaths, and long COVID (conservatively assuming only severe persistent long COVID impacts the ability to work and leads to absenteeism). Economic outcomes included employer-specific outcomes such as workdays missed (productivity loss; overall and due to long COVID), direct medical costs (applicable for fully self-insured employers), and employee-specific outcomes such as employee co-pays for direct medical costs and wage losses for the employee due to only a limited number of sick days being covered by the employer. Considering the employer and employee perspective, productivity (employer) and wage (employee) losses and medical costs were included. Under the US Affordable Care Act (ACA), applicable large employers (ALEs) are required to offer healthcare coverage to their full-time employees and their dependents up to 26 years of age [24]. Thus, the model also included health outcomes and medical costs for employees’ dependents (children <18 years), as well as productivity losses to the employer and wage losses to employees for time off to care for their dependents. The model focused on the impact of disease and vaccination in the workplace, thus, costs of COVID-19 and seasonal influenza vaccination and of potential vaccination-related adverse events were not included.
Model Structure
In Figure 1, employees/dependents with a symptomatic COVID-19 infection who are not hospitalized could either receive outpatient care or have no medical attendance, after which they can either recover or develop long COVID. For severe COVID-19 disease, employees/dependents may be hospitalized, after which they can recover, develop long COVID or die due to COVID-19. The model did not include other causes of mortality over the 1-year time horizon as both COVID-19 and seasonal influenza were assumed to be annually recurring workplace vaccination programs. For seasonal influenza the structure was similar, however influenza cases were not assumed to develop long COVID, and conservatively, also not assumed to develop cardiovascular events or exacerbations of other underlying chronic conditions [25] The probabilities of these events, with their associated costs and numbers of workdays missed are presented in Table S1. Vaccination was assumed to reduce the risk of symptomatic COVID-19 or seasonal influenza infection, as well as hospitalizations and their consequences among the vaccinated employees and dependents.
Model Inputs and Assumptions
Companies in the US are very heterogeneous with regards to size and many other aspects relevant for this study. To allow for some generalizability of results, a hypothetical US company was simulated considering average US data on employers, employees, and COVID-19 and seasonal influenza disease burden. Extensive scenario and sensitivity analysis on input parameters related to the heterogeneity of companies in the US were conducted to provide further insights beyond the ‘average’ US company.
The base case analysis simulated a business with 10,000 employees and 0.86 dependents per employee [26], although results are presented for smaller and larger businesses as well (1,000 and 100,000 employees). Overall, 60% of employees were assumed to be covered by health insurance [27], with a 25% employee co-pay, and up to 10 days of paid sick leave. Average US data were used for employee age distribution [28], annual wage (i.e., $61,442 [29]), and percentage currently vaccinated by age (e.g., 14.70–23.50% for COVID-19 [30] and 37.50–51.50% for seasonal influenza [18,31] among 18–64-year-olds).
In the model, without vaccination, 20.80% of employees developed symptomatic COVID-19 infections [32], of which 39.20% of employees incurred outpatient visits (assumption based on seasonal influenza data [33]); 0.61% were hospitalized (based on Optum Clinformatics analysis [34]) and 2.07% of these died from COVID-19 [35]; and 2.2% developed severe long COVID resulting in workdays lost [11,36]. The impact on productivity loss was 3.57 days missed for a symptomatic infection [22], 42.31 days for hospitalization with subsequent recovery [22,37], and 82.40 days per year due to long COVID (see Appendix File S1 for details) [12,38]. Taking a conservative approach, only the impact of COVID-19 on absenteeism (i.e., missed workdays) was considered, and not any potential impact on presenteeism i.e., working while being sick with reduced productivity and potential associated disability insurance payments. Associated medical costs (inflated to 2023 price levels [39]) were $477.17 [22] per employee with outpatient care, $22,853.01 [22] per hospitalization, and $517.32 [39,40] of post COVID cost assumed for each COVID-19 patient with any medical attendance. The cost to the employer of replacing an employee (because of COVID-19 death; no replacement due to long-COVID was assumed) was $14,724, based on a replacement duration of 56 days [41]. In addition, the model assumed 56.10% of dependents with COVID-19 had outpatient visits (assumption based on seasonal influenza data [33]); an assumed 3.57 employee workdays were missed per non-hospitalized COVID-19 episode; and 1.00% were hospitalized (based on Optum Clinformatics analysis [34]), resulting in 9.10 employee workdays missed [42]. (See Table S1 for seasonal influenza inputs).
Moderna COVID-19 mRNA Fall 2023/2024 vaccination was administered in September 2023, and outcomes were assessed over one year (until August 2024) in the model. The incidence of COVID-19 during this period was based on the projected number of infections estimated by Kohli et al. (2023) [22]. The workplace Moderna COVID-19 mRNA Fall 2023/2024 vaccination program was assumed to prevent 23.5% and 57.3% of COVID-19 symptomatic infections and hospitalizations [43], respectively, across the season (see Appendix file S1 for details). Seasonal influenza vaccination was assumed to prevent 45.0% and 23.0% of symptomatic infections and hospitalizations, respectively, across the season, based on 2022-2023 data [33].
Scenario Analyses
Five scenario analyses were conducted to assess the impact on employer productivity losses and on the number of absent days using differing model assumptions. For this analysis, the model assumed a business with 10,000 employees. The impact was considered with 70% coverage of Moderna COVID-19 mRNA Fall 2023/2024 and seasonal influenza vaccination.
Scenario A took the ‘Employee only perspective’ i.e., not considering vaccination or burden of disease and costs for dependents. This scenario reflects companies which may not provide healthcare coverage to dependents of their employees. Scenario B was the ‘Cumulative long COVID’ scenario; assuming that long COVID patients would experience persistent symptoms, with an impact on productivity and medical costs beyond a one-year time horizon [44], thus leading to an accumulation and increased prevalence of long COVID over time due to more long COVID patients being in the company. This scenario approximates a disease burden perspective over a 5-year time horizon. With an assumed probability of developing long COVID of 2.2% for each symptomatic infection, the prevalence of long COVID was assumed to be 10.53% over 5 years. Scenario C considered ‘Flu hospitalization recovery’; assuming the same number of absent days during post-hospitalization recovery for seasonal influenza as for COVID-19 (COVID-19 assumed 33.4 days of productivity losses during recovery time), resulting in overall 39.4 days of productivity losses for hospitalized seasonal influenza patients [37]. Scenario D was a ‘Conservative scenario’; only assuming lost productivity for employees and dependents with medical attendance. Scenario E ‘Caregiver scenario’ assumed 1.4 days of lost productivity to care for non-hospitalized dependents, based on estimates of caregiver time off for dependents with seasonal influenza [42], instead of assuming the same productivity loss for non-hospitalized dependents and employees.
Sensitivity Analyses
Comprehensive sensitivity analyses were conducted to assess the impact on employer productivity losses when varying key input parameters. For this analysis, the model assumed a business with 10,000 employees. The impact on productivity was considered with 70% coverage of Moderna COVID-19 mRNA Fall 2023/2024 and seasonal influenza vaccination. The following key model probabilities were varied by plus or minus 20%: symptomatic infection; outpatient visit for symptomatic infection; hospitalization for symptomatic infection (employee and dependent); hospital death (employee and dependent); long COVID for symptomatic infection. In addition, the following key inputs were also varied by plus or minus 20%: vaccine effectiveness against hospitalization and against symptomatic infection; absent days for a non-hospitalized and hospitalized episode (employee and dependent); lost productivity cost per day; and replacement cost (for employees with long-term sick leave or who do not return to work).
Results
Without a COVID-19 workplace vaccination program in place, a business with 10,000 employees can expect to see 3,869 annual symptomatic COVID-19 cases (with 31 hospitalizations) resulting in 18,175 absent days (of which 3,771 are due to long COVID cases). For employers, this represents a productivity loss of $5.08 million with medical costs of $1.00 million (for self-insured employers). For employees, this represents $0.86 million in medical costs and $1.04 million in lost wages (from insufficient sick leave coverage) (Table 1). Without a seasonal influenza vaccination program, the disease impact is lower than for COVID-19 yet remains important. Employers can expect 1,655 cases (and 10 hospitalizations), and 5,333 absent days per year. For employers, this results in a lost productivity cost of $1.49 million and medical costs of $0.22 million from seasonal influenza; and for employees, the medical cost was estimated at $0.12 million (Table 1).
The results indicate that for a business with 10,000 employees, Moderna COVID-19 mRNA Fall 2023/2024 vaccination of employees and their dependents (with current coverage rates) could prevent on average 445 infections, 10 hospitalizations and 0.1 deaths due to COVID-19, and 1,837 days of sick leave (of which 153 are due to long COVID). For the employer, this translates into savings of $183,346 in COVID-19 medical costs (for the self-insured employer) and savings of $513,544 in averted COVID-19 lost productivity costs. For employees, this represents savings of $135,519 in medical costs and savings of $48,809 in lost wages averted. By comparison, seasonal influenza vaccination of employees and their dependents (with current coverage rates) could prevent 325 infections, 1 hospitalization and 0.03 deaths due to seasonal influenza, and 1,044 days of sick leave. Thus, saving the employer $30,964 in influenza-associated averted medical costs and $292,083 in influenza-associated averted lost productivity; while saving the employees $17,202 in averted medical costs (Table 1). No wage loss for seasonal influenza was observed as the number of days absence due to seasonal influenza for both a non-inpatient and an inpatient episode was less than 10 days.
Current vaccination coverage rates are suboptimal compared with seasonal influenza targets of 70% coverage [23]. Figure 2 illustrates how increasing Moderna COVID-19 mRNA Fall 2023/2024 and seasonal influenza vaccination coverage to 70% would further reduce the disease burden for employers and employees (e.g., 637 and 521 fewer COVID-19 and seasonal influenza cases, respectively, versus no workplace vaccination program), with fewer hospitalizations, deaths and sick days as a result (Figure 2).
Figure 3a shows the number of absent days averted following workplace vaccination for COVID-19 and seasonal influenza e.g., at 70% vaccination coverage, 3,176 absent days due to COVID-19 (including 621 absent days due to long COVID) and 1,679 absent days due to seasonal influenza averted. Figure 3b illustrates the additional economic gains for employers and employees, of a Moderna COVID-19 mRNA Fall 2023/2024 and seasonal influenza workplace vaccination program with 70% coverage rates e.g., for COVID-19 alone, employers could save $876,453 in lost productivity costs averted and $240,633 in medical costs averted; and employees could save $182,196 in medical costs averted and $198,250 in lost wages averted. Cost savings were lower but still important for seasonal influenza cases prevented (e.g., for employers, savings of $49,962 for medical costs and $468,394 for lost productivity costs averted; for employees, savings of $27,757 for medical costs averted) (Table 1).
Scenario Analyses
With a workplace vaccination program (at 70% coverage) in place, the largest benefits in absent days and lost productivity costs averted were seen in scenario B, assuming the cumulative impact from persistent long COVID than in the base case (i.e., resulting in 5,482 absent days averted versus 3,132 in the base case, and averted lost productivity costs of $1.53 million versus $0.88 million in the base case). Scenarios A, D, and E with their focus on employee impact only, or reduced impact in employees/dependents had fewer absent days and lost productivity costs averted than the base case (Figure 4).
Sensitivity Analyses
With workplace vaccination (at 70% coverage) in place, the probability of symptomatic infection and the lost productivity cost per day had the largest impact on employer lost productivity (e.g., an increase of 20% in the probability of infection could increase employer costs saved by $175,000 in averted lost productivity). Varying the inputs for vaccine effectiveness against symptomatic infection and number of absent days for non-hospitalized employees also had a large impact on the overall costs of lost productivity prevented by vaccination (Figure 5).
Discussion
To inform implementation of COVID-19 workplace vaccination, this analysis estimated the workplace impact of COVID-19 disease for US employers and employees. With no COVID-19 workplace vaccination in place, for an average US business with 10,000 employees, there were an estimated 18,175 sick leave days per year due to COVID-19, with employer lost productivity costs of $5.08 million. Employee costs without COVID-19 workplace vaccination totaled $1.90 million in medical costs and lost wages.
Implementing COVID-19 workplace vaccination (with 70% vaccination coverage) prevented 3,132 sick leave days due to COVID-19, saving employers $876,453 in COVID-19 related lost productivity and $240,633 in medical costs; while saving employees $182,196 in medical costs and $198,250 in lost wages. These results highlight the significant economic benefits for employers, as well as the substantial economic benefits for employees in addition to improving health, morale and convenience for the employee [45]. By comparison, workplace seasonal influenza vaccination (with 70% vaccination coverage) prevented 1,675 sick leave days, saving the employer around $468,394 in lost productivity costs and $49,962 in medical costs; and saving the employees around $27,757 in medical costs. Thus, increasing seasonal influenza coverage from current rates to the target of 70% could prevent an additional 630 absent days, and save the employer an additional $176,312 in lost productivity costs prevented.
In scenario analyses, considering the cumulative prevalence of long COVID had a large effect on overall absent days and lost productivity costs. This scenario highlights the potential enormous impact for employers when employees experience persistent long COVID symptoms and their subsequent effect on productivity. As the risk of developing long COVID symptoms increases with increasing number of reinfections [17,46], continued protection of employees against infection becomes even more important. In sensitivity analyses, the probability of having a symptomatic COVID-19 or seasonal influenza infection, as well as the cost per day of lost productivity, had the largest impact on the results, followed by vaccine effectiveness estimates against infection. Similar findings were reported for a workplace influenza vaccination study e.g., showing that workplace program costs were lower when influenza was assumed to be more contagious and with higher vaccine effectiveness estimates [47].
The analysis found that the workplace burden and financial impact of COVID-19 was substantially higher than seasonal influenza, driven by higher incidence rates and the long COVID burden. Thus, COVID-19 vaccination provided employers approximately twice the savings in disease burden related productivity losses than seasonal influenza vaccination. The burden findings reflect the situation in the US in general, with CDC data (2023/2024 season) showing hospitalization rates per 100,000 population of 141.8 for COVID-19 [47] versus 82.4 for seasonal influenza [48]. In addition, a retrospective US claims analysis (2022/2023 season) reported that COVID-19 hospitalization rates were 5.6 times (in 18–49-year-olds) and 4.2 times (in 50–64-year-olds) higher compared with seasonal influenza, as were COVID-19 outpatient visit rates (5.6 times higher than for seasonal influenza) [49].
Current vaccination rates are suboptimal compared with the US target rate of 70% (for seasonal influenza [23]). Despite this, the analysis estimated that even at lower vaccination coverage rates (reflecting current rates in the population), both employers and employees had significant benefits from workplace vaccination. Workplace vaccination programs present an opportunity to increase coverage among working-age adults. US healthcare workers cited the most common reasons for receiving a COVID-19 vaccine in the workplace was that it was offered free of charge and that the workplace was an easy or convenient place to receive a vaccination [21].
Similar benefits of workplace vaccination were also reported in an economic analysis of workplace seasonal influenza vaccination for emergency medical services personnel showing cost savings of $20,745 from avoided absenteeism ($7,988), avoided presenteeism, lost productivity ($10,303), and avoided medical costs of treating employees with influenza ($2,454) [50]. The authors conclude that despite influenza vaccination being recommended for all healthcare workers (to protect employees and patients and prevent absenteeism), there is a lack of knowledge about the potential economic benefits for employers, which may inhibit implementation of more workplace vaccination programs [50].
Workplace vaccination is recommended by the CDC in the US [45]. Other countries, such as the United Kingdom (UK), also recommend workplace vaccination against COVID-19 as an effective way to protect employees and clients/patients, as well as employers who may suffer significant losses due to absenteeism, with recent guidance (January 2024) provided for employers on implementing such a program [51].
Strengths and Limitations
The aim of this analysis was to estimate the burden of COVID-19 associated disease and the potential impact of workplace vaccination for an average US business. However, workplace benefits may differ by type of workplace [52]. For more accurate estimates, the model inputs should be adjusted to fit the specific employer’s settings e.g., adjusting vaccination coverage rate, average wage, cost per missed day, number of paid sick days, insurance co-pay, and percent of insured employees as well as capturing workplace-specific vaccination costs, including potential productivity losses due to vaccine administration and adverse events. A key limitation of these findings is due to the uncertainty regarding COVID-19 incidence, corresponding health outcomes and associated productivity losses in the post-pandemic era, and to the uncertainty around the vaccine effectiveness against emerging variants, as SARS-CoV-2 virus is constantly evolving [22]. Although the body of evidence is rapidly evolving, the long COVID disease burden and associated vaccination benefits may potentially be underestimated in this analysis. For instance, evidence is emerging to show that long COVID can also occur following asymptomatic SARS-CoV-2 infection [53], however, only symptomatic cases were assumed to have a workplace impact; also, the analysis did not account for the increased risk of developing long COVID symptoms following reinfection [17,46], or for any potential disability insurance payments [17] and dropping out of the workforce. The model also relied on seasonal influenza data for some inputs where COVID-19 inputs were lacking. Key limitations also exist with regards to the uncertainty of input parameters for modelling the disease burden and impact of current seasonal influenza vaccination in the workplace, such as vaccine effectiveness estimates relying on 2022/2023 season estimates of currently available standard egg-based seasonal influenza vaccination. Also for simplicity, the model conservatively assumed that seasonal influenza does not trigger or exacerbate underlying chronic conditions [25]. However, extensive scenario and sensitivity analysis conducted showed results were robust, with regards to disease burden and benefits of COVID-19 and seasonal influenza vaccination preventing disease related health and productivity losses.
Conclusions
COVID-19 and seasonal influenza continue to pose significant threats to public health and the economy, leading to considerable absenteeism and lost productivity, and imposing a substantial financial burden on employers and employees. This study demonstrates that implementing COVID-19 and seasonal influenza workplace vaccination programs can substantially reduce absenteeism, productivity and wage losses, and medical costs for both employers and employees.
Acknowledgements
Medical writing and editorial assistance was provided by Kavi Littlewood (Littlewood Writing Solutions) in accordance with Good Publication Practice (GPP 2022) guidelines, funded by Moderna, Inc., and under the direction of the authors.
Conflict of interest
This study was sponsored by Moderna, Inc. EB, KJ, DM, BR and NV are employees of Moderna, Inc and may hold stocks/options in Moderna, Inc. SL received funding from Moderna, Inc.
References
- Walmsley T, Rose A, John R, Wei D, Hlávka JP, Machado J, Byrd K. Macroeconomic consequences of the COVID-19 pandemic. Econ Model. 2023;120:106147. [CrossRef]
- U.S. Bureau of Labor Statistics. Labor Force Participation Rate [CIVPART]. https://fred.stlouisfed.org/series/CIVPART. Accessed 06-04-2024.
- U.S. Bureau of Labor Statistics. Labor force statistics from the current population survey. https://data.bls.gov/timeseries/LNU02006735. Accessed 06-04-2024.
- Goda GS, Soltas EJ. The impacts of Covid-19 absences on workers. J Public Econ. 2023;222:104889. [CrossRef]
- Sobieralski JB, Hubbard SM. Turbulent skies ahead? Pandemic related workforce issues in air transportation. Transport Policy. 2023;130:84-8. [CrossRef]
- US Department of Transportation. Air Travel Consumer Report: December 2018, Full Year 2018 Numbers. 2019. Accessed 07-22-2024.
- Luckhaupt SE, Horter L, Groenewold MR, de Perio MA, Robbins CL, Sweeney MH, et al. COVID-19 Outbreaks Linked to Workplaces, 23 US Jurisdictions, August-October 2021. Public Health Rep. 2023;138(2):333-40. [CrossRef]
- Edwards CH, Tomba GS, de Blasio BF. Influenza in workplaces: transmission, workers’ adherence to sick leave advice and European sick leave recommendations. Eur J Public Health. 2016;26(3):478-85. [CrossRef]
- Aben B, Kok RN, de Wind A. Return-to-work rates and predictors of absence duration after COVID-19 over the course of the pandemic. Scand J Work Environ Health. 2023;49(3):182-92. [CrossRef]
- US Chamber of Commerce. Understanding America’s Labor Shortage. 2024. https://www.uschamber.com/workforce/understanding-americas-labor-shortage. Accessed 07-14-2024.
- National Center for Health Statistics -, U.S. Census Bureau. Household Pulse Survey, 2022–2024. Long COVID. https://www.cdc.gov/nchs/covid19/pulse/long-covid.htm. Accessed 06-05-2024.
- New York State Insurance Fund (NYSIF). Shining a light on long COVID: An analysis of workers’ compensation data. 2023. https://ww3.nysif.com/-/media/Files/NYSIF_Publications/PDF/NYSIFLongCOVIDStudy2023.ashx. Accessed 06-05-2024.
- Bonner C, Ghouralal SL. Long COVID and Chronic Conditions in the US Workforce: Prevalence, Productivity Loss, and Disability. J Occup Environ Med. 2024;66(3):e80-e6. [CrossRef]
- National Conference of State Legislatures (NCSL). Long COVID-19 and Disability Accommodations in the Workplace. 2024. https://documents.ncsl.org/wwwncsl/Labor/Long-COVID-Disability-Accommodations-Workplace.pdf. Accessed 07-10-2024.
- Brookings Institution. New data shows long Covid is keeping as many as 4 million people out of work. 2022. https://www.brookings.edu/articles/new-data-shows-long-covid-is-keeping-as-many-as-4-million-people-out-of-work/. Accessed 07-10-2024.
- Cutler, DM. The Economic Cost of Long COVID: An Update 2022. https://scholar.harvard.edu/files/cutler/files/long_covid_update_7-22.pdf. Accessed 07-10-2024.
- Mansi JAH, H.; Dawson, R.; Tuckson, R.; Wolynn, T. Navigating the Evolving Landscape of COVID-19: Strategies to Increase Vaccine Confidence and Improve Vaccination Rates in the United States. . Preprints 2024, 2024051990. [Google Scholar] [CrossRef]
- Centers for Disease Control and Prevention (CDC). CDC Influenza Vaccination Coverage, Adults. https://www.cdc.gov/flu/fluvaxview/dashboard/vaccination-adult-coverage.html. Accessed 06-25-2024.
- Centers for Disease Control and Prevention (CDC). Adult Coverage and Intent. 2023. https://www.cdc.gov/vaccines/imz-managers/coverage/covidvaxview/interactive/adult-coverage-vaccination.html. Accessed 07-10-2024.
- Gualano MR, Santoro PE, Borrelli I, Rossi MF, Amantea C, Tumminello A, et al. Employee Participation in Workplace Vaccination Campaigns: A Systematic Review and Meta-Analysis. Vaccines (Basel). 2022;10(11). [CrossRef]
- Razzaghi H, Masalovich S, Srivastav A, Black CL, Nguyen KH, de Perio MA, et al. COVID-19 Vaccination and Intent Among Healthcare Personnel, U.S. Am J Prev Med. 2022;62(5):705-15. [CrossRef]
- Kohli MA, Maschio M, Joshi K, Lee A, Fust K, Beck E, et al. The potential clinical impact and cost-effectiveness of the updated COVID-19 mRNA fall 2023 vaccines in the United States. J Med Econ. 2023;26(1):1532-45. [CrossRef]
- US Department of Health and Human Services. Healthy People 2030 - Vaccination targets: Increase the proportion of people who get the flu vaccine every year — IID-09. https://health.gov/healthypeople/objectives-and-data/browse-objectives/vaccination/increase-proportion-people-who-get-flu-vaccine-every-year-iid-09. Accessed 06-25-2024.
- US Department of Labor. Young Adults and the Affordable Care Act: Protecting Young Adults and Eliminating Burdens on Businesses and Families FAQs. https://www.dol.gov/agencies/ebsa/about-ebsa/our-activities/resource-center/faqs/young-adult-and-aca. Accessed 07-14-2024.
- Macias AE, McElhaney JE, Chaves SS, Nealon J, Nunes MC, Samson SI, et al. The disease burden of influenza beyond respiratory illness. Vaccine. 2021;39 Suppl 1:A6-a14. [CrossRef]
- United States Census Bureau. America’s Families and Living Arrangements: 2022. Table AVG2. Average Number of People per Family Household, by Race and Hispanic Origin1, Marital Status, Age, and Education of Householder: 2022. https://www.census.gov/data/tables/2022/demo/families/cps-2022.html. Accessed 06-12-2024.
- Kaiser Family Foundation. Employer Health Benefits 2022 Annual Survey. https://www.kff.org/report-section/ehbs-2022-summary-of-findings/. Accessed 06-12-2024.
- U.S. Bureau of Labor Statistics. Labor Force Statistics from the Current Population Survey - Household data annual averages 3. Employment status of the civilian noninstitutional population by age, sex, and race. https://www.bls.gov/cps/cpsaat03.htm. Accessed 06-12-2024.
- U.S. Bureau of Labor Statistics. Table B-3. Average hourly and weekly earnings of all employees on private nonfarm payrolls by industry sector, seasonally adjusted. https://www.bls.gov/news.release/empsit.t19.htm. Accessed 06-25-2024.
- Centers for Disease Control and Prevention (CDC). National sample: Received a 2023-2024 COVID-19 Vaccine dose (among all adults 18 plus) April 28th to May 25th, 2024. https://www.cdc.gov/vaccines/imzmanagers/coverage/covidvaxview/interactive/adults.html. Accessed 06-25-2024.
- Centers for Disease Control and Prevention (CDC). Influenza Vaccination Coverage, Children 6 months through 17 years, United States. https://www.cdc.gov/flu/fluvaxview/dashboard/vaccination-coverage-race.html. Accessed 06-25-2024.
- Tokars JI, Olsen SJ, Reed C. Seasonal Incidence of Symptomatic Influenza in the United States. Clinical Infectious Diseases. 2017;66(10):1511-8. [CrossRef]
- Centers for Disease Control and Prevention (CDC). Flu Vaccine Effectiveness (VE) Data for 2022-2023. https://www.cdc.gov/flu/vaccines-work/2022-2023.html. Accessed 06-25-2024.
- ModernaTX Inc. Moderna Data on File - Analysis of Optum Clinformatics database: non-vaccinated patients with any medical attendance from September 2023 to February 2024.
- Centers for Disease Control and Prevention (CDC). COVID Data Tracker - Hospitalizations. https://covid.cdc.gov/covid-data-tracker/#hospitalizations-severity. Accessed 06-12-2024.
- Federal Reserve Bank of Minneapolis, Dasom Ham. INSTITUTE WORKING PAPER No. 60 - Long-Haulers and Labor Market Outcomes https://doi.org/10.21034/iwp.60. 2022. https://researchdatabase.minneapolisfed.org/concern/publications/td96k268d. Accessed 06-25-2024.
- Chopra V, Flanders SA, O’Malley M, Malani AN, Prescott HC. Sixty-Day Outcomes Among Patients Hospitalized With COVID-19. Ann Intern Med. 2021;174(4):576-8. [CrossRef]
- Davis HE, Assaf GS, McCorkell L, Wei H, Low RJ, Re’em Y, et al. Characterizing long COVID in an international cohort: 7 months of symptoms and their impact. EClinicalMedicine. 2021;38:101019. [CrossRef]
- U.S. Department of Commerce. Table 1.1.3. Real Gross Domestic Product, Quantity Indexes. https://apps.bea.gov/iTable/?reqid=19&step=3&isuri=1&1921=survey&1903=11&_gl=1*k0zjxm*_ga*MTc4MzI1NDkzMy4xNzE5Mjk3NDc0*_ga_J4698JNNFT*MTcxOTI5NzQ3My4xLjAuMTcxOTI5NzQ3My42MC4wLjA.#eyJhcHBpZCI6MTksInN0ZXBzIjpbMSwyLDMsM10sImRhdGEiOltbIk5JUEFfVGFibGVfTGlzdCIsIjMiXSxbIkNhdGVnb3JpZXMiLCJTdXJ2ZXkiXSxbIkZpcnN0X1llYXIiLCIyMDIwIl0sWyJMYXN0X1llYXIiLCIyMDI0Il0sWyJTY2FsZSIsIjAiXSxbIlNlcmllcyIsIlEiXV19. Accessed 06-25-2024.
- Chambers LC, Park A, Cole M, Lovgren L, Zandstra T, Beaudoin FL, Collins M. Long-term health care costs following COVID-19: implications for pandemic preparedness. Am J Manag Care. 2023;29(11):566-72. [CrossRef]
- Hanly P, Ortega Ortega M, Pearce A, de Camargo Cancela M, Soerjomataram I, Sharp L. Estimating Global Friction Periods for Economic Evaluation: A Case Study of Selected OECD Member Countries. PharmacoEconomics. 2023;41(9):1093-101. [CrossRef]
- Blanchet Zumofen MH, Frimpter J, Hansen SA. Impact of Influenza and Influenza-Like Illness on Work Productivity Outcomes: A Systematic Literature Review. Pharmacoeconomics. 2023;41(3):253-73. [CrossRef]
- Kopel H, Araujo AB, Bogdanov A, Zeng N, Winer I, Winer-Jones J, et al. Effectiveness of the 2023-2024 Omicron XBB.1.5-containing mRNA COVID-19 vaccine (mRNA-1273.815) in preventing COVID-19-related hospitalizations and medical encounters among adults in the United States: An interim analysis. medRxiv. 2024:2024.04.10.24305549. [CrossRef]
- Cai M, Xie Y, Topol EJ, Al-Aly Z. Three-year outcomes of post-acute sequelae of COVID-19. Nature Medicine. 2024;30(6):1564-73. [CrossRef]
- Centers for Disease Control and Prevention (CDC). Promoting Vaccination in the Workplace. 2021. https://www.cdc.gov/flu/business/promoting-vaccines-workplace.htm#:~:text=Benefits%20to%20Employees%3A,Improves%20health. 07-14-2024.
- Bowe B, Xie Y, Al-Aly Z. Acute and postacute sequelae associated with SARS-CoV-2 reinfection. Nat Med. 2022;28(11):2398-405. [CrossRef]
- Centers for Disease Control and Prevention (CDC). COVID-NET Laboratory-confirmed COVID-19 hospitalizations. 2024. https://covid.cdc.gov/covid-data-tracker/#covidnet-hospitalization-network. Accessed 07-11-2024.
- Centers for Disease Control and Prevention (CDC). FluSurv-NET Hospitalization surveillance. 2024. https://www.cdc.gov/flu/weekly/index.htm#FluSurvNet. Accessed 07-11-2024.
- Kopel H, Bogdanov A, Winer-Jones JP, Adams C, Winer IH, Bonafede M, et al. Comparison of COVID-19 and Influenza-Related Outcomes in the United States during Fall-Winter 2022-2023: A Cross-Sectional Retrospective Study. Diseases. 2024;12(1). [CrossRef]
- Hubble MW, Renkiewicz GK. Estimated Cost Effectiveness of Influenza Vaccination for Emergency Medical Services Professionals. West J Emerg Med. 2021;22(6):1317-25. [CrossRef]
- UK Health Security Agency. Guidance - COVID-19 vaccination: guide for employers. 2024. https://www.gov.uk/government/publications/covid-19-vaccination-guide-for-employers/covid-19-vaccination-guide-for-employers. Accessed 07-11-2024.
- Lee BY, Bailey RR, Wiringa AE, Afriyie A, Wateska AR, Smith KJ, Zimmerman RK. Economics of employer-sponsored workplace vaccination to prevent pandemic and seasonal influenza. Vaccine. 2010;28(37):5952-9. [CrossRef]
- National Academies of Sciences E, Medicine. A Long COVID Definition: A Chronic, Systemic Disease State with Profound Consequences. Fineberg HV, Brown L, Worku T, Goldowitz I, editors. Washington, DC: The National Academies Press; 2024.
Figure 1.
Workplace COVID-19 and seasonal influenza vaccination model structure*. *Only COVID-19 cases could develop long COVID; COVID-19: Coronavirus disease 2019; Flu: seasonal influenza; ICU: intensive care unit.
Figure 1.
Workplace COVID-19 and seasonal influenza vaccination model structure*. *Only COVID-19 cases could develop long COVID; COVID-19: Coronavirus disease 2019; Flu: seasonal influenza; ICU: intensive care unit.
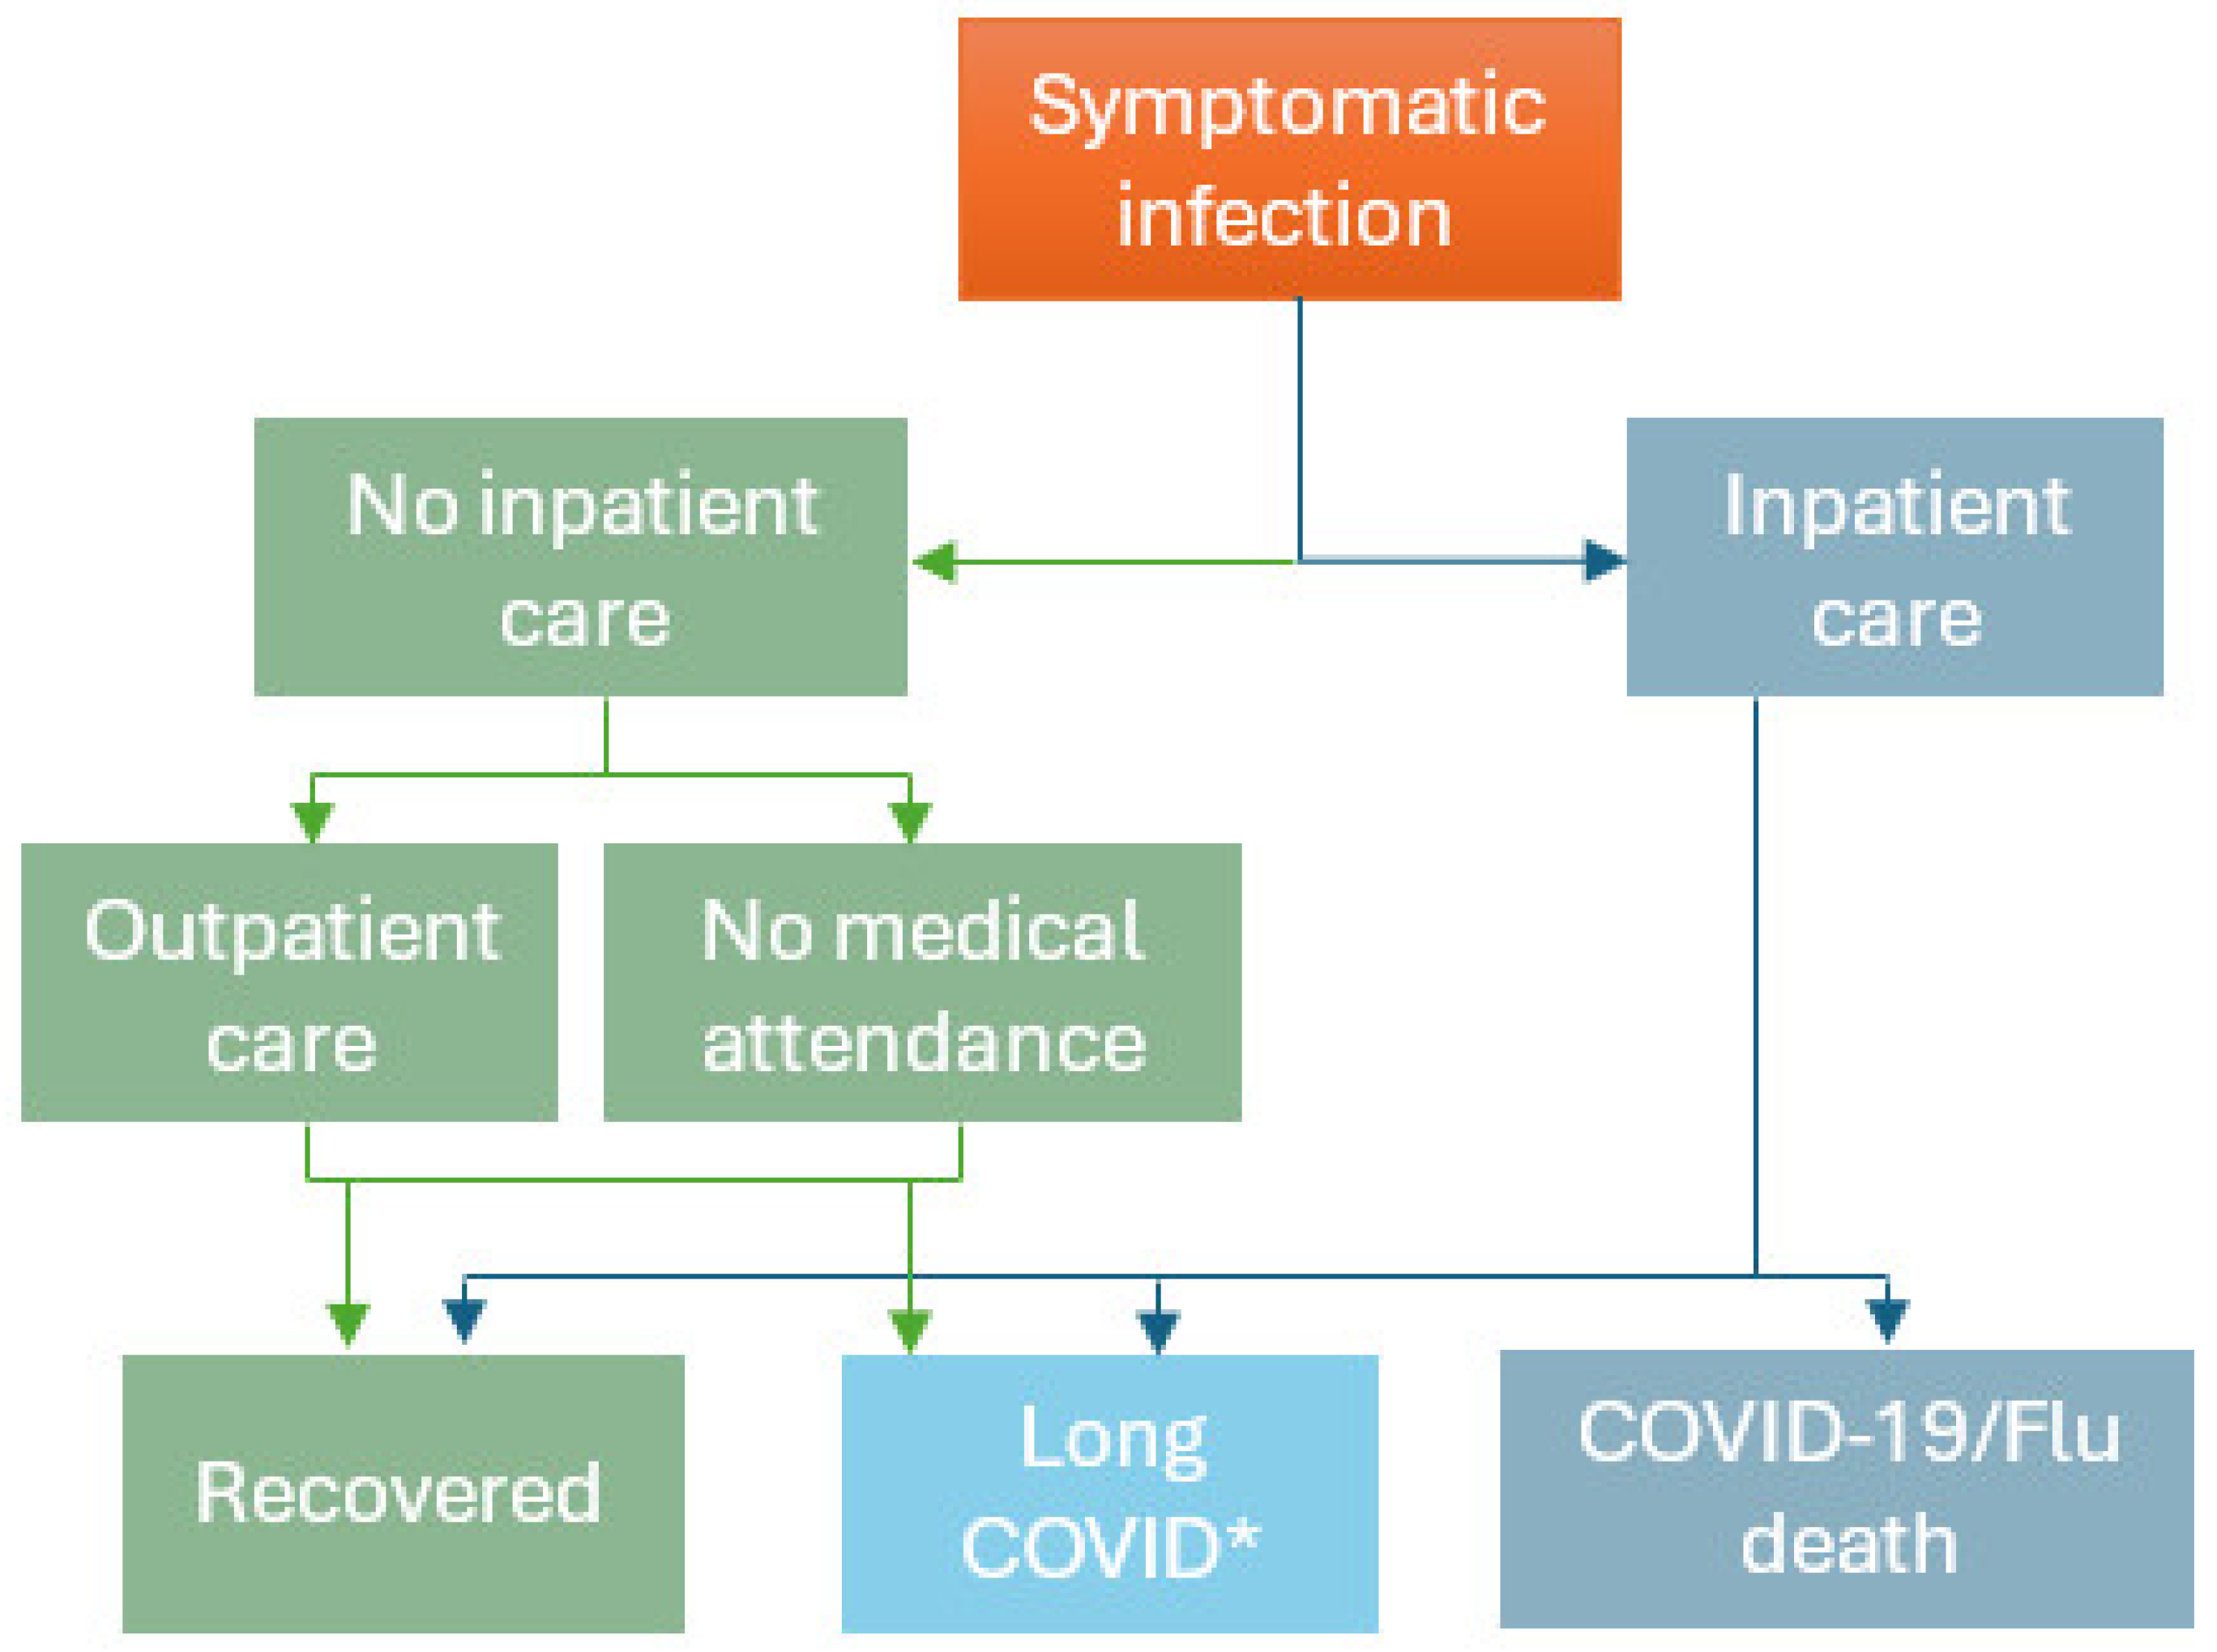
Figure 2.
Disease impact averted with Moderna COVID-19 mRNA Fall 2023/2024 and seasonal influenza vaccination versus no vaccination (business N=10,000 employees). COVID-19: Coronavirus disease 2019; Flu: seasonal influenza; Moderna COVID-19 Fall 23/24: Moderna COVID-19 mRNA Fall 2023/2024 vaccination; VCR: vaccination coverage rate.
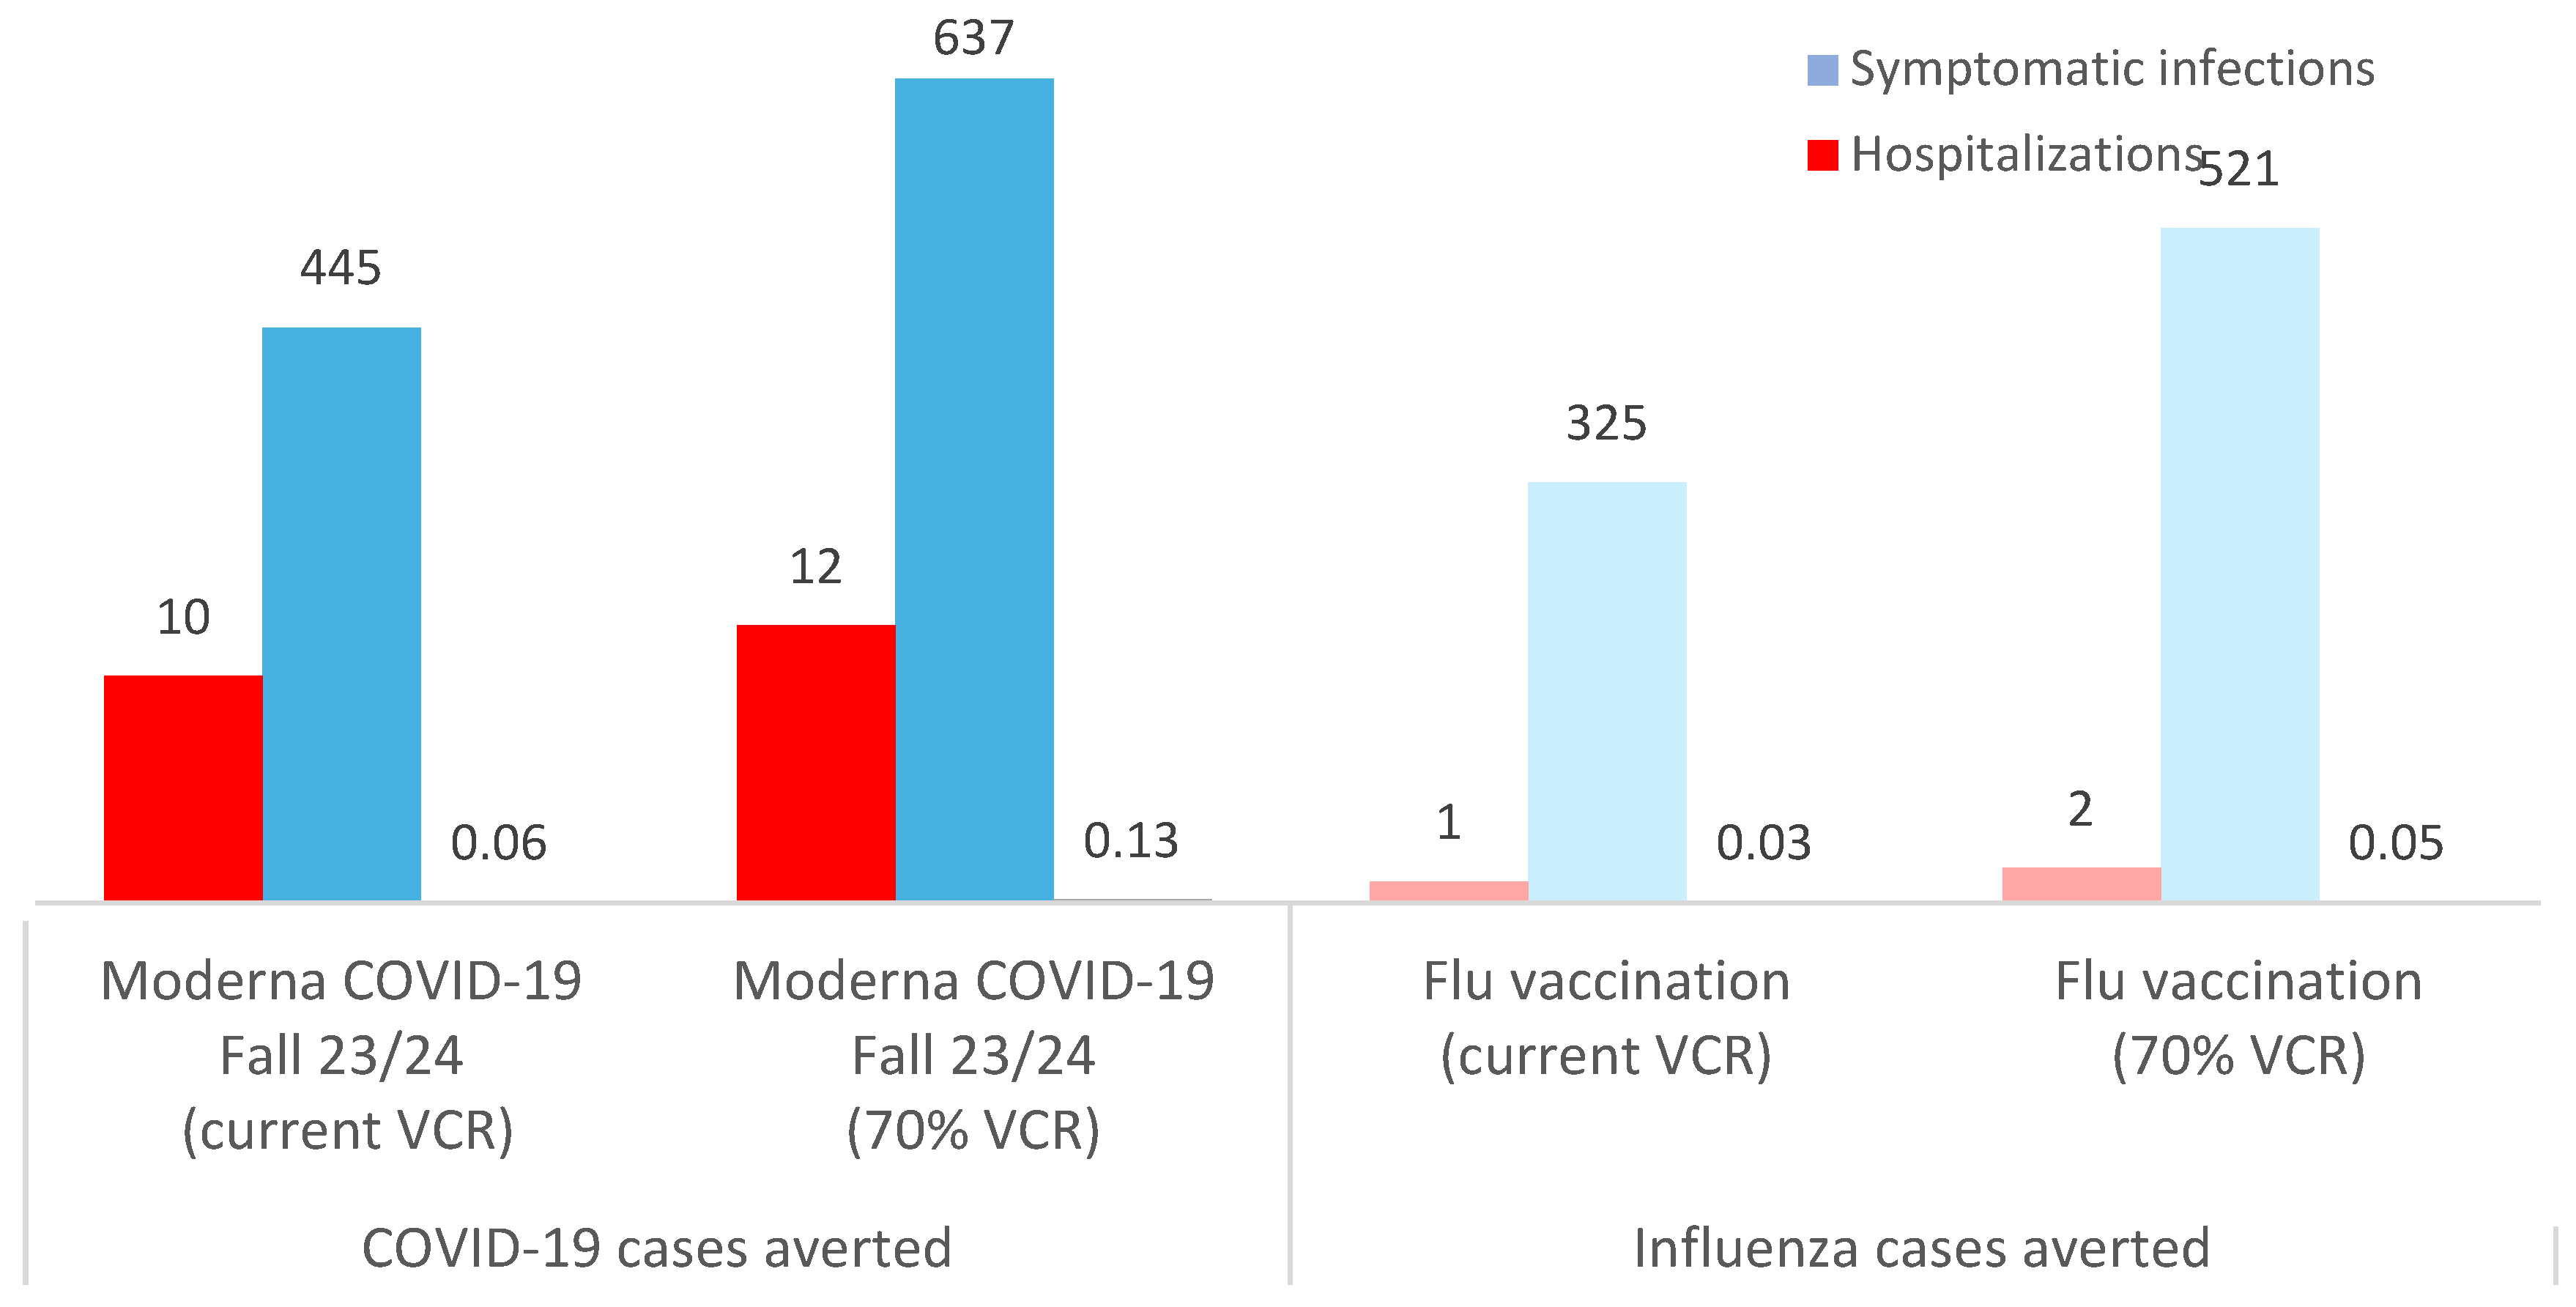
Figure 3.
a) Absent days averted; b) Employer and employee cost savings - with Moderna COVID-19 mRNA Fall 2023/2024 and seasonal influenza vaccination versus no vaccination (N=10,000 employees). Flu: seasonal influenza; M: million; Moderna COVID-19 Fall 23/24: Moderna COVID-19 mRNA Fall 2023/2024 vaccination; VCR: vaccination coverage rate.
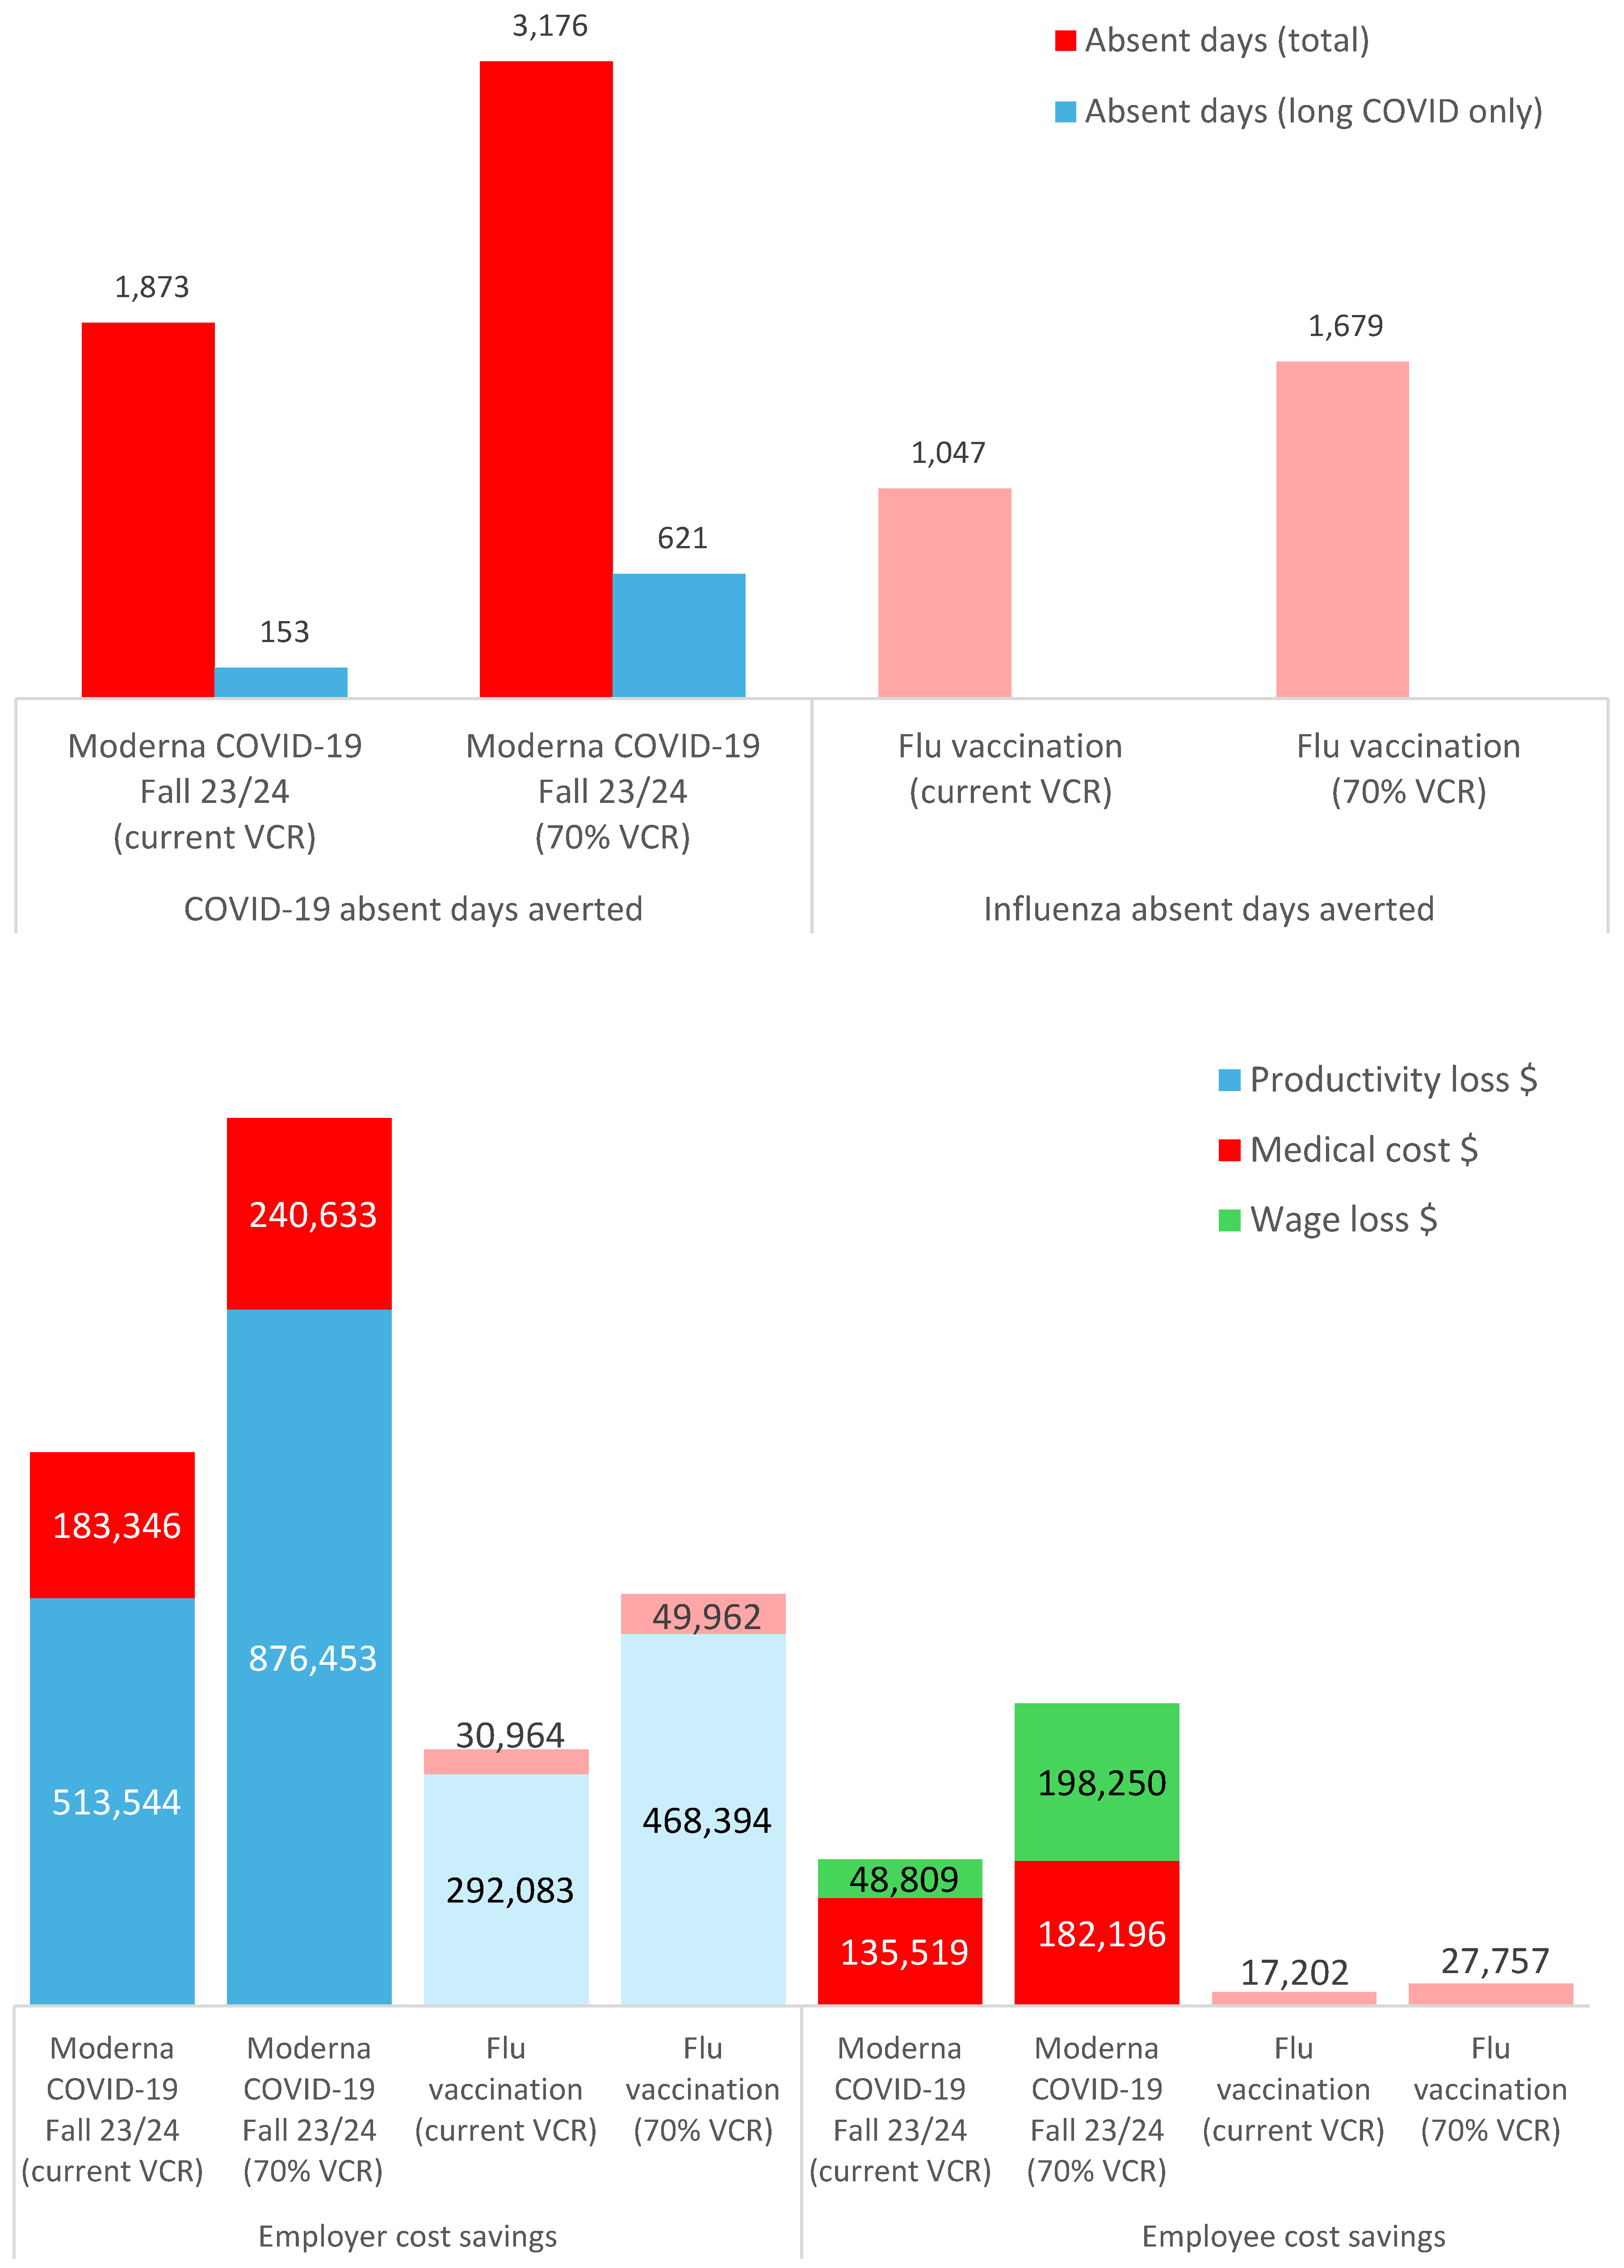
Figure 4.
Vaccination impact: Impact of scenarios on absent days and lost productivity ($) prevented by vaccination with 70% coverage Moderna COVID-19 mRNA Fall 2023/2024 and seasonal influenza workplace vaccination. Flu: seasonal influenza; K: thousand; M: million;.
Figure 4.
Vaccination impact: Impact of scenarios on absent days and lost productivity ($) prevented by vaccination with 70% coverage Moderna COVID-19 mRNA Fall 2023/2024 and seasonal influenza workplace vaccination. Flu: seasonal influenza; K: thousand; M: million;.
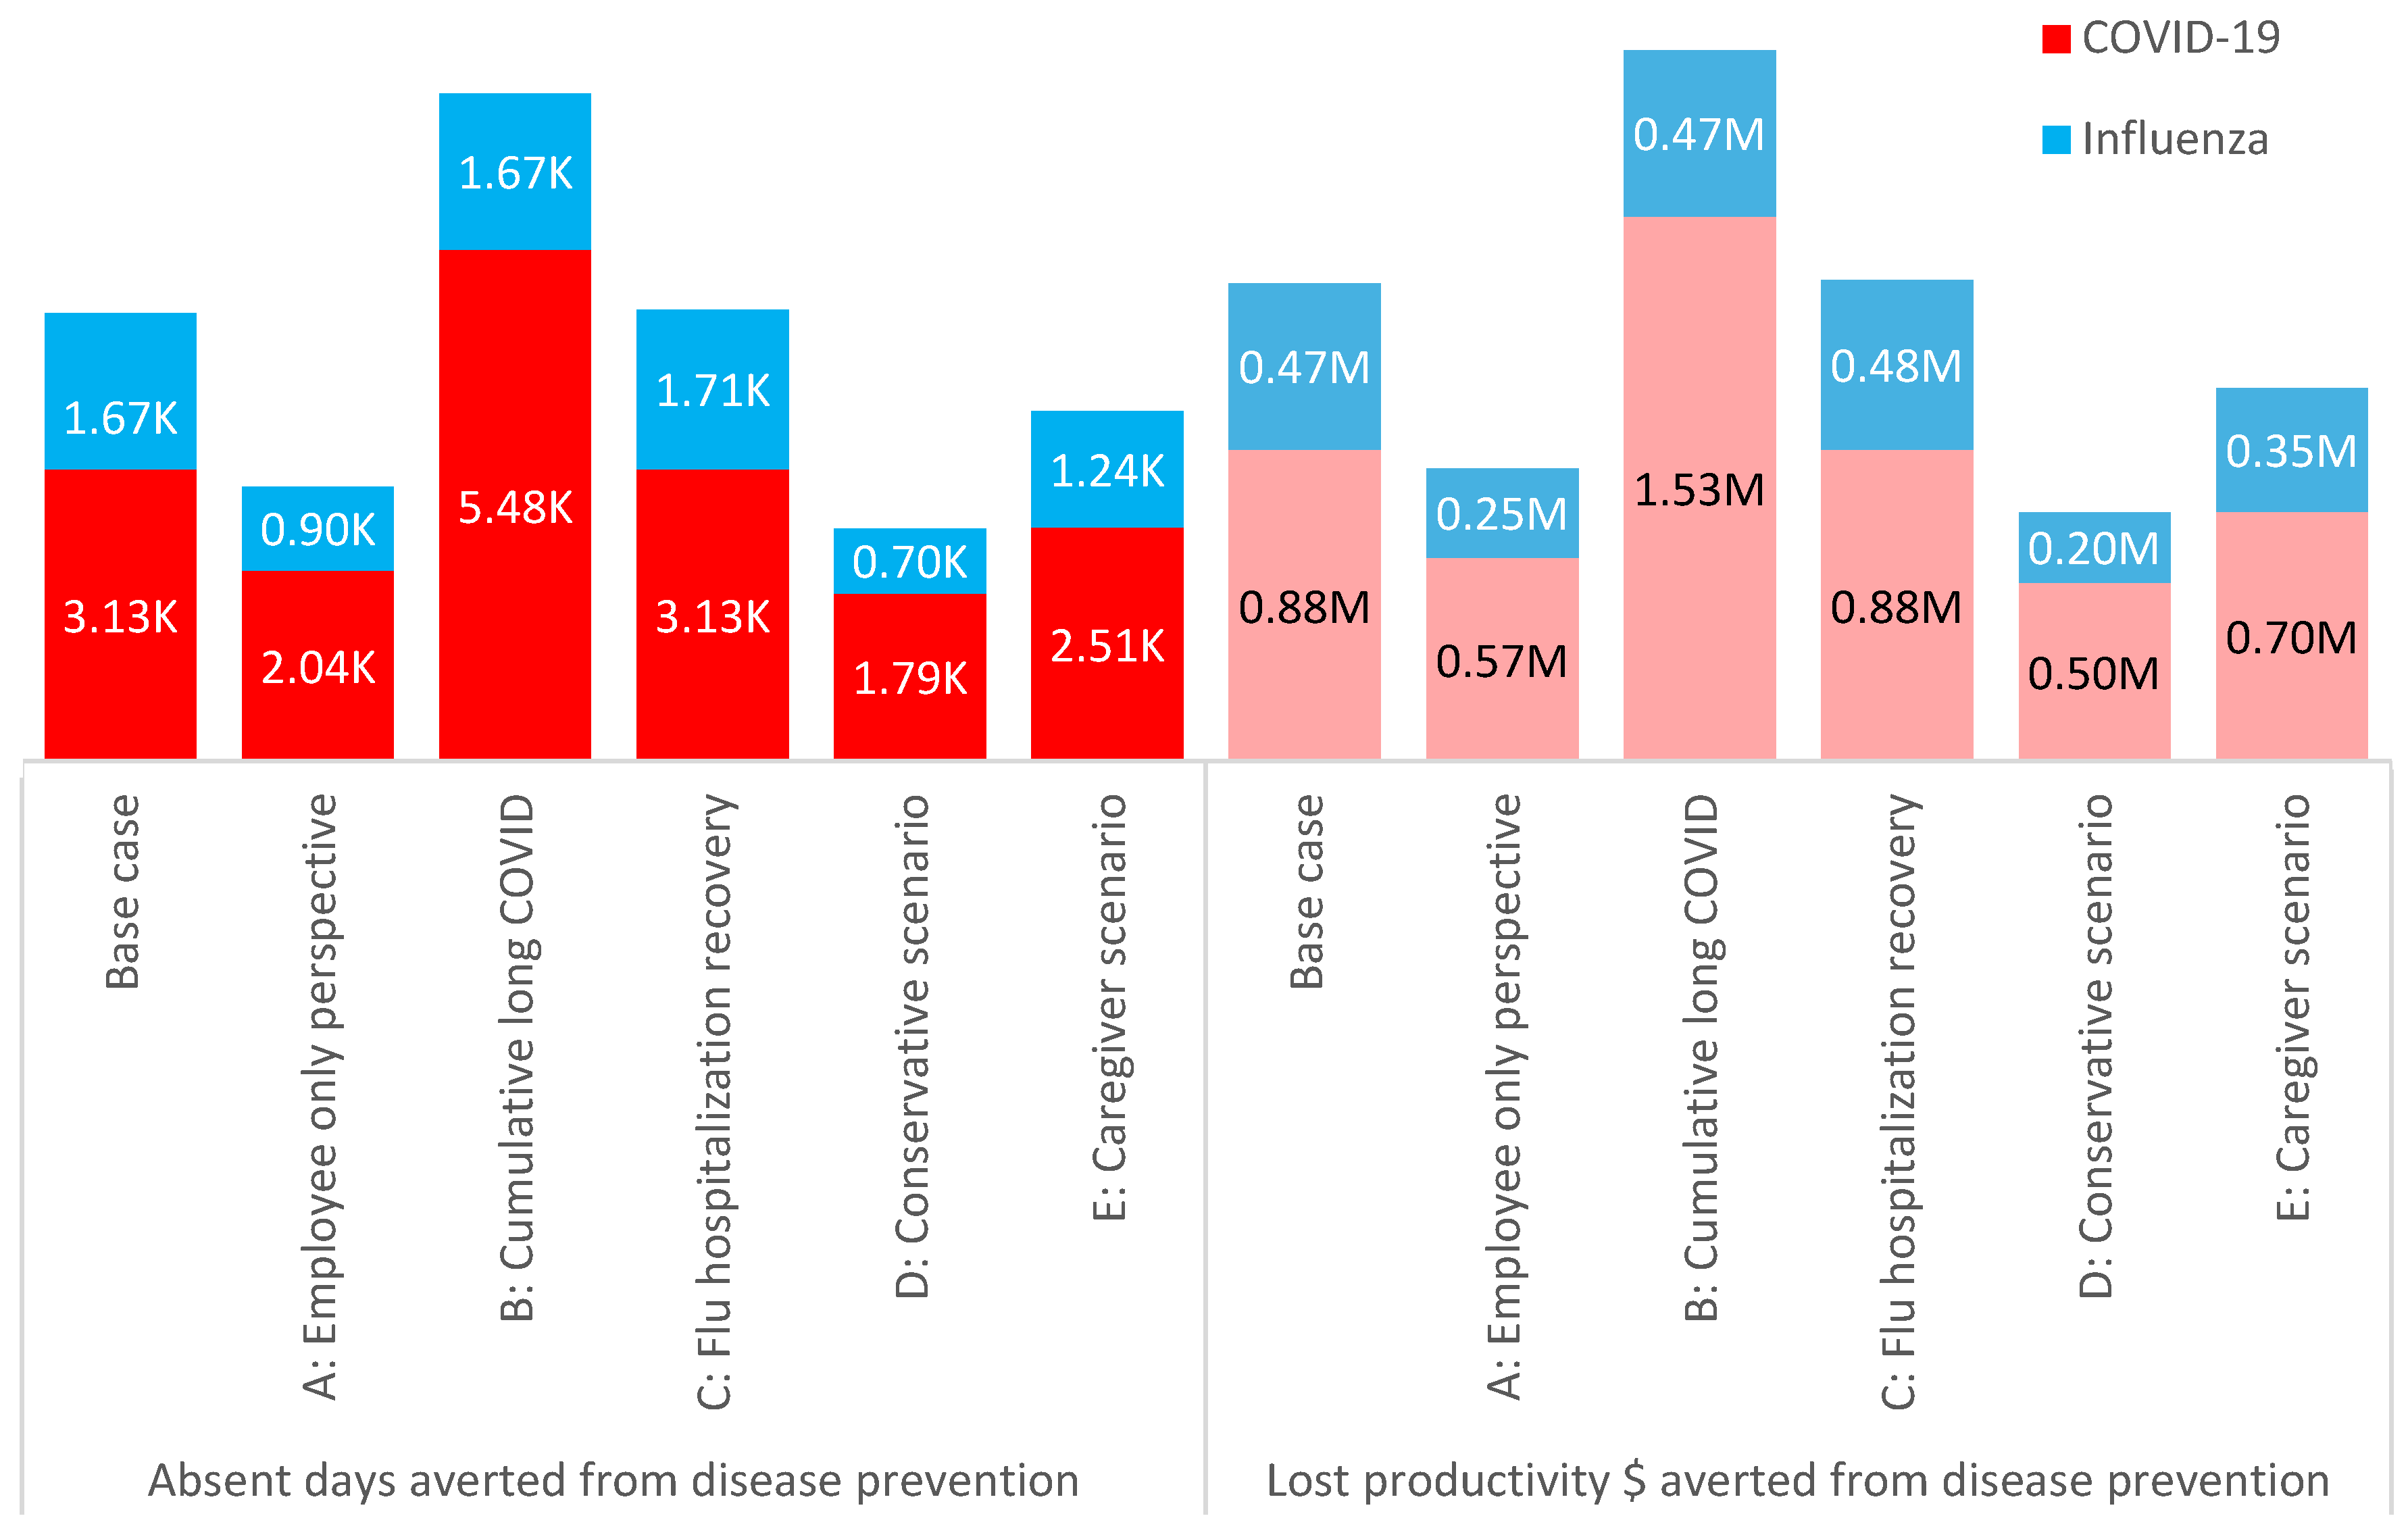
Figure 5.
Vaccination impact: Tornado chart showing impact of varying inputs (+/- 20%) on employer lost productivity ($) prevented by vaccination - with 70% coverage Moderna COVID-19 mRNA Fall 2023/2024 and seasonal influenza workplace vaccination. d: days; flu: seasonal influenza; P: probability; VE: vaccine effectiveness.
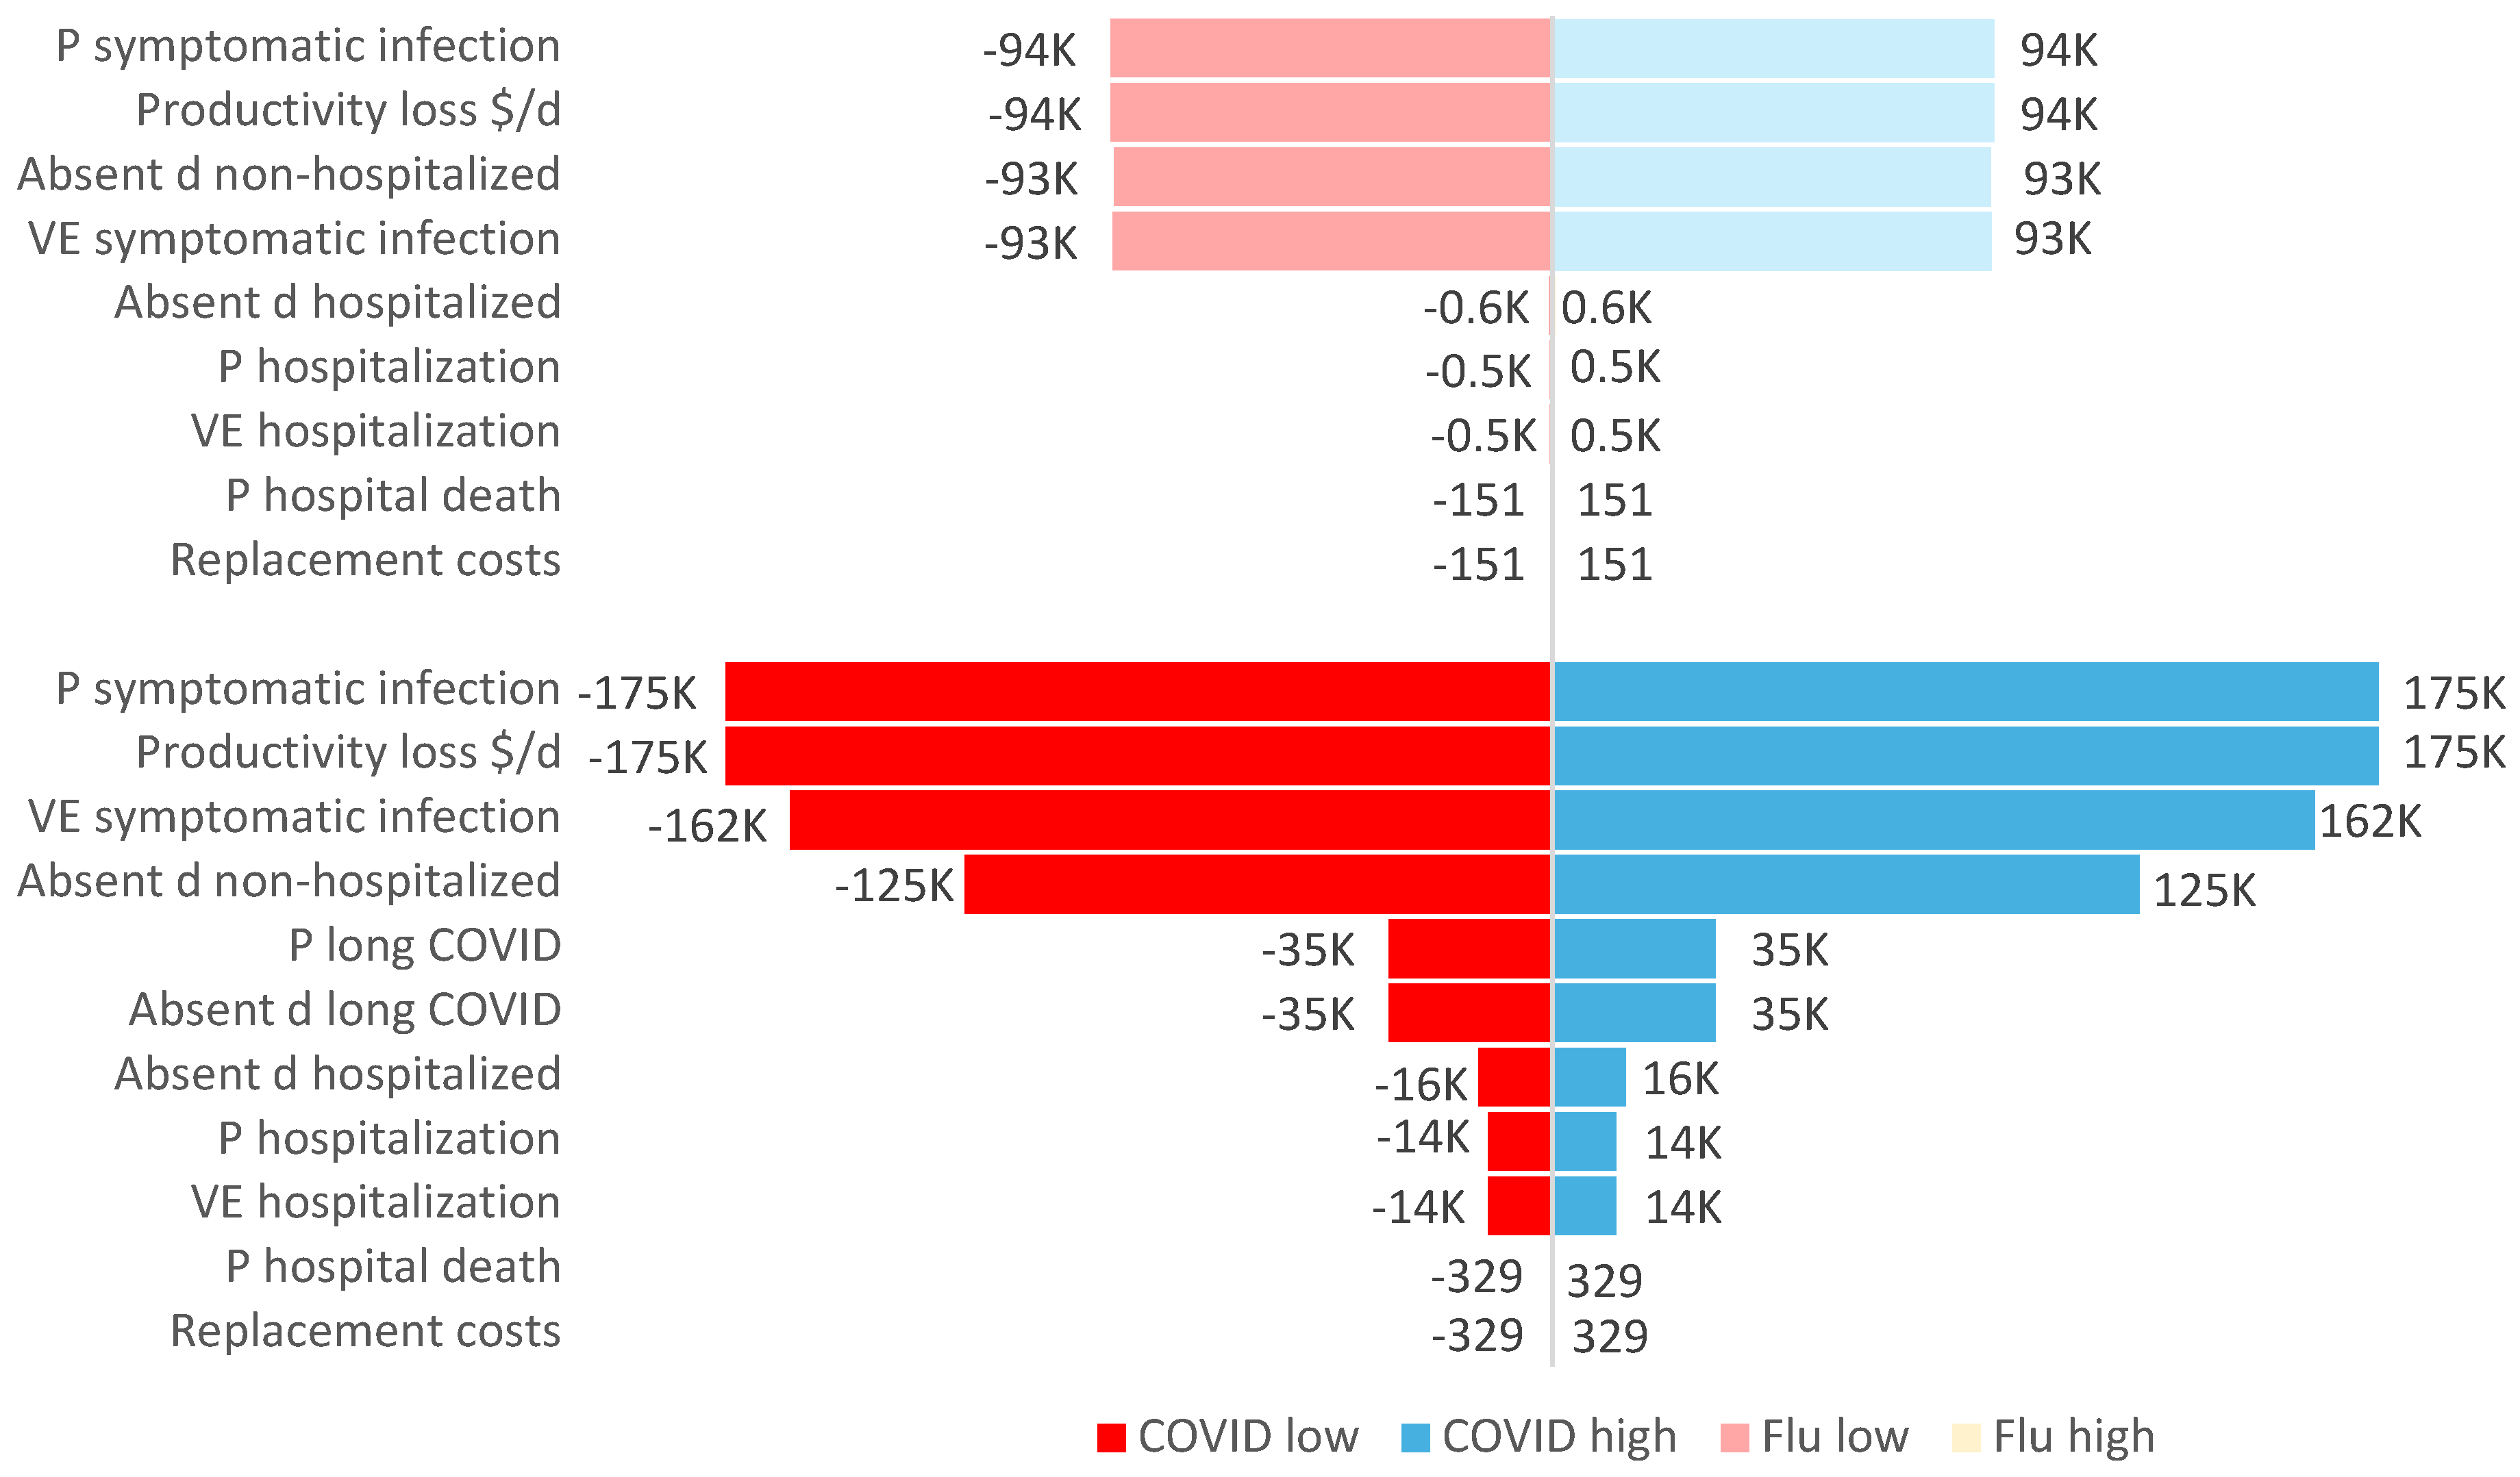

Table 1.
Disease and economic impact for employers and employees – data presented for N=1K, N=10K, and N=100K employees.
Table 1.
Disease and economic impact for employers and employees – data presented for N=1K, N=10K, and N=100K employees.
| No Moderna COVID-19 mRNA Fall 2023/2024 | Moderna COVID-19 mRNA Fall 2023/2024 (current VCR) | Moderna COVID-19 mRNA Fall 2023/2024 (70% VCR) | No Seasonal influenza vaccination | Seasonal influenza vaccination (current VCR) | Seasonal influenza vaccination (70% VCR) | ||||||
|---|---|---|---|---|---|---|---|---|---|---|---|
| Disease impact | Prevented | Total | Prevented | Total | Prevented | Total | Prevented | Total | |||
| Symptomatic infection, n | 387 | 44 | 342 | 64 | 323 | 166 | 33 | 133 | 52 | 113 | |
| 3,869 | 445 | 3,424 | 637 | 3,232 | 1,655 | 325 | 1,330 | 521 | 1,134 | ||
| 36,688 | 4,445 | 32,243 | 6,371 | 30,317 | 16,554 | 3,252 | 13,302 | 5,215 | 11,339 | ||
| Hospitalization, n | 3.1 | 1.0 | 2.1 | 1.2 | 1.8 | 1.0 | 0.1 | 0.9 | 0.2 | 0.8 | |
| 31 | 10 | 21 | 12 | 18 | 9.6 | 1.0 | 8.6 | 1.5 | 8.0 | ||
| 306 | 100 | 206 | 123 | 183 | 96 | 9 | 86 | 15 | 80 | ||
| Death, n | 0.03 | 0.01 | 0.02 | 0.01 | 0.02 | 0.03 | 0.00 | 0.03 | 0.01 | 0.02 | |
| 0.33 | 0.06 | 0.27 | 0.13 | 0.20 | 0.33 | 0.03 | 0.30 | 0.05 | 0.28 | ||
| 3.29 | 0.58 | 2.71 | 1.32 | 1.97 | 3.29 | 0.32 | 2.97 | 0.53 | 2.76 | ||
| Economic impact | Prevented | Total | Prevented | Total | Prevented | Total | Prevented | Total | |||
| Absenteeism (total), d | 1,818 | 184 | 1,634 | 313 | 1,504 | 533 | 104 | 429 | 167 | 366 | |
| 18,175 | 1,837 | 16,338 | 3,132 | 15,043 | 5,333 | 1,044 | 4,289 | 1,674 | 3,659 | ||
| 181,752 | 18,374 | 163,379 | 31,324 | 150,429 | 53,333 | 10,442 | 42,891 | 16,744 | 36,589 | ||
| Absenteeism (long COVID only), d | 377 | 15 | 362 | 62 | 315 | NA | NA | NA | NA | NA | |
| 3,771 | 153 | 3,618 | 621 | 3,150 | |||||||
| 37,706 | 1,529 | 36,178 | 6,209 | 31,497 | |||||||
| Productivity loss* employer, $ | 508,008 | 51,354 | 456,654 | 87,645 | 420,363 | 149,418 | 29,208 | 120,210 | 46,839 | 102,579 | |
| 5,080,084 | 513,544 | 4,566,540 | 876,453 | 4,203,632 | 1,494,180 | 292,083 | 1,202,097 | 468,394 | 1,025,785 | ||
| 50,800,848 | 5,135,445 | 45,665,404 | 8,764,529 | 42,036,319 | 14,941,798 | 2,920,826 | 12,020,972 | 4,683,943 | 10,257,855 | ||
| Medical cost employer, $ | 100,025 | 18,335 | 81,691 | 24,063 | 75,962 | 21,859 | 3,096 | 18,763 | 4,996 | 16,863 | |
| 1,000,253 | 183,346 | 816,907 | 240,633 | 759,620 | 218,595 | 30,964 | 187,631 | 49,962 | 168,633 | ||
| 10,002,530 | 1,833,462 | 8,169,068 | 2,406,327 | 7,596,204 | 2,185,949 | 309,643 | 1,876,307 | 499,619 | 1,686,330 | ||
| Medical cost employee, $ | 85,596 | 13,552 | 72,044 | 18,220 | 67,376 | 12,144 | 1,720 | 10,424 | 2,776 | 9,369 | |
| 855,956 | 135,519 | 720,437 | 182,196 | 673,760 | 121,442 | 17,202 | 104,239 | 27,757 | 93,685 | ||
| 8,559,557 | 1,355,188 | 7,204,369 | 1,821,958 | 6,737,599 | 1,214,416 | 172,024 | 1,042,393 | 277,566 | 936,850 | ||
| Wage loss (unpaid sick leave) employee, $ | 103,975 | 4,881 | 99,094 | 19,825 | 84,150 | 0 | 0 | 0 | 0 | 0 | |
| 1,039,753 | 48,809 | 990,944 | 198,250 | 841,503 | 0 | 0 | 0 | 0 | 0 | ||
| 10,397,527 | 488,092 | 9,909,435 | 1,982,499 | 8,415,028 | 0 | 0 | 0 | 0 | 0 | ||
Disclaimer/Publisher’s Note: The statements, opinions and data contained in all publications are solely those of the individual author(s) and contributor(s) and not of MDPI and/or the editor(s). MDPI and/or the editor(s) disclaim responsibility for any injury to people or property resulting from any ideas, methods, instructions or products referred to in the content. |
© 2024 by the authors. Licensee MDPI, Basel, Switzerland. This article is an open access article distributed under the terms and conditions of the Creative Commons Attribution (CC BY) license (http://creativecommons.org/licenses/by/4.0/).
Copyright: This open access article is published under a Creative Commons CC BY 4.0 license, which permit the free download, distribution, and reuse, provided that the author and preprint are cited in any reuse.


