
Submitted:
17 July 2024
Posted:
18 July 2024
You are already at the latest version
Abstract
Objectives: This study aimed to investigate whether genetic variations in the OPRD1 gene affect psychopathological symptoms and personality dimensions in eating disorders (ED) patients and/or contribute to ED risk.
Methods: The study involved 221 female patients with anorexia nervosa (AN), 88 with bulimia nervosa (BN) and 396 controls. Sixteen tag-SNPs in OPRD1 were identified. Psychometric evalu-ations were conducted using the Symptom Checklist 90 Revised (SCL-90R) and the Eating Dis-orders Inventory Test-2 (EDI-2). P-values obtained by regression models were corrected for mul-tiple testing by the FDR method.
Results: In AN patients, genotypes rs204077TT and rs169450TT were linked to lower BMI values (FDR-q=0.035 and 0.017, respectively), as was rs2234918 in a log-additive model (BMI: 18.0±0.28, 17.22±0.18 and 16.59±0.39 for TT, TC and CC carriers, FDR-q=0.012). Additionally, AN patients carrying the rs72665504AA genotype had higher scores in Interpersonal distrust (FDR-q=0.030), whilst BN carriers of rs513269TT and rs2873795TT showed lower scores in Ineffectiveness (FDR-q=0.041 and FDR-q=0.021). In the AN group, BMI correlated with variability in a distal haplotype (rs508448/rs204077/rs223491, FDR-q=0.028), which was also associated with the global PST index of SCL-90R (FDR-q=0.048). Associations were more noticeable in BN patients; again, the distal region of the gene was linked to EDI-2 total scores (FDR-q=0.004-0.048 for the four last haplotypes) and two global SCL-90R indices (GSI: FDR-q=0.011 and PSDI: FDR-q=0.003 for the last s204077/rs2234918/rs169450 combination). No associations with ED risk were observed.
Conclusions: Genetic variation in the OPRD1 gene, particularly in its distal region, is associated with BMI and psychopathological comorbidities in ED patients.
Keywords:
anorexia
; bulimia
; eating disorders
; opioids
; OPRD1
1. Introduction
Eating disorders (ED) are serious mental health conditions characterized by disturbed eating habits that can significantly impact physical health, psychological well-being, and overall quality of life. Genetics play an important role in the ED; indeed, large-scale twin studies have revealed high heritability estimates for both anorexia (AN) and bulimia nervosa (BN), whilst genome-wide association studies (GWAS) have also identified relevant loci for these disorders [1].
Amongst the pathways of interest, the endogenous opioid system has been related to the onset and progression of ED [2]. Endogenous opioids play an important role in the regulation of energy balance and eating behavior, and dysregulation of this system results in maladaptive dietary responses in ED patients [3]. The intimate involvement of the opioid system with reward mechanisms underlying addictions may also explain the connection with ED, given the rewarding effects of food consumption. PET imaging studies have revealed an increased opioid tone in brain areas of AN patients [4], and opioid antagonists are being evaluated for the treatment of ED [5]. It has been proposed that a malfunction in the systems regulating opioid activity, such as that arising from the presence of variants in the involved genes, would make individuals more susceptible to developing a self-addiction to exercise, food restriction or lead to an abnormal craving for the rewarding effects of binge eating [3,6].
Early linkage studies in AN patients and unaffected relatives identified a region of chromosome 1 that was significant for the disease containing, among others, the OPRD1 gene coding for the delta-opioid receptor [7,8]. Subsequently, three GWAS and follow-up studies identified several OPRD1 variants that could be associated with AN status [9,10,11], although conflicting results also exist [12]. On the other hand, the connection between genetics and ED may also be explained by the impact that genetic variants have on personality traits and psychopathological symptoms that are known predisposing factors of these disorders [13,14,15]. For instance, we have previously shown that variability in cannabinoid receptor genes, also involved in reward mechanisms, is associated with psychiatric comorbidities in AN patients [16].
The goal of this study was to determine whether genetic variation in OPRD1, estimated by 16 identified tag-SNPs, which capture the variability of the whole gene locus, could contribute to the risk for ED and/or affect psychopathological symptoms and personality traits that are commonplace in these disorders.
2. Patients and Methods
2.1. Study Design
The study cohort comprised 221 Caucasian female patients with anorexia nervosa (AN) without a prior history of bulimia nervosa (BN), and 88 patients with BN, all recruited from the Eating Disorders Unit of the Extremadura Health Service in Badajoz, Spain, over a period of five years. Additionally, DNA samples were also obtained from 396 female Caucasian Spanish donors who had a normal body mass index (BMI) and no history of psychiatric or endocrine disorders. These samples were stored at the Carlos III DNA National Bank at the University of Salamanca, Spain. All participants were diagnosed by a psychiatrist and a psychologist using the Eating Disorders section of the Structured Clinical Interview for DSM-IV, and diagnoses were later reassessed to align with DSM-5 criteria. All patients (or their legal guardians) provided written informed consent for study participation and were interviewed to collect psychometric data (details below). Exclusion criteria included conditions such as schizophrenia, intellectual disability, dementia, Turner’s syndrome, or other endocrine or neurological diseases. The study received approval from the Bioethics Committee of the University of Extremadura and was conducted following the Declaration of Helsinki and its subsequent amendments.
2.2. Tag-SNPs Selection and Genotype Analysis
We extracted the coding and adjacent 3’ and 5’ untranslated regions (UTR) sequences of the OPRD1 gene (ENSG00000116329; HGNC:8153) to identify tag-single nucleotide polymorphisms (tag-SNPs) using Haploview 4.2 software. Tag-SNPs are index genetic variants in regions with high linkage disequilibrium (LD), representing groups of variants inherited together. The selection criteria included a pair-wise tagging with r2 > 0.80 and a minor allele frequency threshold of 10%. The sixteen tag-SNPs identified in this manner are listed in Table 1. Whole blood samples (10 ml) were collected from the patients and stored at -80ºC until DNA extraction, which was performed using a standard phenol-chloroform technique. Genotyping was conducted at the Centro Nacional de Genotipado (CeGen) in Santiago de Compostela, Spain, utilizing an OpenArray customized panel on a QuantStudio™ 12K Flex Real-Time PCR System (Life Technologies, Carlsbad, California, USA).
2.3. Personality Dimensions and Psychopathological Symptoms
During their initial visit to the Unit, all patients completed two self-report questionnaires: the Symptom Checklist 90 Revised (SCL-90R) and the Eating Disorders Inventory Test-2 (EDI-2). SCL-90R evaluates a wide array of psychopathological symptoms across nine categories (Somatization, Obsessive-Compulsive, Interpersonal Sensitivity, Depression, Anxiety, Hostility, Phobic Anxiety, Paranoid Ideation, and Psychoticism) as well as three global indices: the Global Severity Index (GSI), the Positive Symptom Distress Index (PSDI), and the Positive Symptom Total (PST). The SCL-90R has been validated for use in Spain, demonstrating robust reliability for its scales [17]. EDI-2 focuses on psychological and behavioral traits commonly associated with ED, covering eight primary scales: Drive for Thinness, Bulimia, Body Dissatisfaction, Ineffectiveness, Perfectionism, Interpersonal Distrust, Interoceptive Awareness, and Maturity Fears. Additionally, Asceticism, Impulse Regulation, and Social Insecurity were later included. The EDI-2 questionnaire has also demonstrated high internal consistency in the Spanish population [18].
2.4. Statistical Analyses
Results from the psychometric evaluation with EDI-2 and SCL-90R are shown as mean ± standard deviation (SD) values. Student's T-tests or Mann-Whitney tests, depending on data distribution, were used to compare quantitative variables between groups. To identify genetic associations with clinical and anthropometric variables, logistic regression models adjusted for age were conducted using the SNPassoc R package (https://cran.r-project.org/web/packages/SNPassoc/index.html). In order to identify broader areas within the OPRD1 gene locus that could modulate BMI and/or the psychometric results of the ED patients, we conducted a sliding window approach to construct successive and adjacent 3-SNP haplotypes establishing a minimum frequency threshold of 0.1 using PLINK v1.07 software [19]. Statistical power was assessed by testing minor allele frequencies with an assumed effect size of 2.0 (type-I error = 0.05). The statistical power ranged from 0.801 to 0.957, depending on the minor allele frequency and specific ED (Quanto software v. 1.2.4, University of Southern California). P-values obtained were adjusted for multiple comparisons by the Benjamini-Hochberg False Discovery Rate (FDR) method considering the number of SNPs and haplotypes analyzed. An FDR-q value < 0.05 was considered statistically significant.
3. Results
Table 2 summarizes clinical and descriptive characteristics of the population of study. As expected, AN patients showed lower weight, BMI and were younger than subjects in the BN group (p <0.05 in all cases). In addition, BN patients scored significantly higher than AN patients in the different scales measured in the psychometric evaluation (p<0.001). The minor allelic frequencies of the 16 tag-SNPs studied in the OPRD1 gene in the whole population of study varied from 0.203 to 0.469. None of these genetic variants showed significant deviations from the Hardy-Weinberg equilibrium (Table 1).
ED, eating disorders; AN, anorexia nervosa; BN, bulimia nervosa; EDI-2, Eating Disorders Inventory Test-2; Global Symptom Index; PST, Positive Symptom Total PSDI, Positive Symptom Distress Index.
3.1. Single-Marker Analysis
We examined whether any of the tag-SNPs were related to significant differences in the BMI of ED patients. In the AN group, two genotypes, rs204077 TT and rs169450 TT were associated with lower BMI values (16.00 ± 0.46 vs. 17.51 ± 0.15 vs the other two genotypes, FDR-q=0.035 and FDR-q=0.017 respectively). Mean values are equal for the two variants because subjects with the TT homozygous variant genotype were the same in both cases. Rs2234918 was also associated with lower BMI in a log-additive model (18.0 ± 0.28, 17.22 ± 0.18 and 16.59 ± 0.39 for TT, TC and CC, respectively, FDR-q=0.012). Figure 1 shows the regression analysis in all models on inheritance for all 16 SNPs assayed in AN patients. In the BN group, none of the genotypes analyzed retained statistical significance after correction for multiple testing (Supplementary Figure S1).
Next, we evaluated the impact of variability in the OPRD1 gene on the psychometric scores obtained by ED patients. After correction for multiple comparisons, AN patients carrying the rs72665504 AA genotype scored significantly higher than GG/AG carriers on the Interpersonal distrust dimension of the EDI-2 inventory (FDR-q=0.030). In BN patients, carriers of rs513269 TT and rs2873795 TT variant genotypes showed lower scores than the other two genotypes in the Ineffectiveness scale of the same questionnaire (FDR-q = 0.041 and FDR-q=0.021, respectively). Figure 2 shows all FDR-corrected q-values for associations with these two scales of the EDI2 inventory in AN and BN patients.
With regard to the risk analysis, rs67244013 and rs72665504 were found to be associated with the development of AN. Nevertheless, none of these genotypes retained statistical significance after correction for multiple testing. None of the SNPs analyzed were found to be individually associated with BN risk. Supplementary Tables S1 and S2 show all p-values obtained for the assayed SNPs.
3.2. Multiple-Marker Analysis—Sliding Windows Approach
To further investigate these observations, we performed a sliding window analysis to identify the associations of the resulting 14 3-SNP haplotypes with both BMI and psychometric scores. In the AN group, BMI correlated significantly with variability in a distal rs508448/rs204077/rs223491 haplotype (FDR-q=0.028). Figure 3 displays the values for the 3-SNP combinations with psychometric scores in AN patients. As it occurred in the single marker study, the Interpersonal Distrust dimension of the EDI-2 inventory showed significant associations with rs513269/rs72665504/rs529520 (FDR-q=0.034) and rs72665504/rs529520/rs499062 haplotypes (FDR-q=0.044). In addition, the global PST index of the SCL-90R test was also associated with the two last 3-SNP combinations, namely rs508448/rs204077/rs2234918 (FDR-q=0.048) and rs204077/rs2234918/rs169450 haplotype (FDR-q=0.025).
With regard to the BN group, whereas there were no significant results for BMI after FDR correction, the degree of the associations with the psychometric scores gradually increased towards the distal part of the gene (Figure 4). Most importantly, this area was strongly linked to the total EDI-2 score (FDR-q values ranging from 0.004 to 0.048 for the four last haplotypes) and two general indices of SCL-90R (FDR-q = 0.011 for GSI and FDR-q = 0.003 for PSDI for the last s204077/rs2234918/rs169450 combination). In general, EDI-2 measurements were much more affected by the variability in OPRD1. In particular, Ineffectiveness (as observed in the single-marker analysis), Perfectionism and Drive for thinness were three dimensions showing significant associations throughout the entire gene locus. The lowest FDR-q-value obtained was 0.007 for the association between Body dissatisfaction and the rs508448/rs204077/rs2234918 haplotype (Figure 4).
4. Discussion
A great challenge in the study on the role of genetics in ED is that, like in most psychiatric disorders, its influence seems to follow a non-Mendelian patter, i.e., there is a great number of genes in various regions of the genome that may play a significant role [20]. OPRD1, coding for the delta opioid receptor, has been suggested to be one such gene [9], as the receptor signaling is believed to contribute to the activity of dopaminergic neurons in the ventral tegmental area, affecting reward mechanisms in the mesolimbic circuit, thus regulating hunger, satiety and hedonic eating [3]. However, to date, there are no genetic association studies assessing its influence on anthropometric or psychometric characteristics of ED patients.
Our findings show that a distal region of the OPRD1 gene locus, encompassing tag-SNPs rs204077, rs2234918 and rs169450, was significantly associated with lower BMI values in AN patients. Previous studies on OPRD1 genetic variability have focused on AN risk, but none has assessed the impact on BMI. Interestingly, Paszynska et al. have shown that the levels of opiorphin, a peptide implicated in the rapid inactivation of endogenous opioids correlate with body weight in AN patients [21], therefore suggesting that changes in opioid levels may translate into BMI changes, most likely because of an alteration in the reward system that regulates food intake. Our findings also support this concept, indicating that genetic variability in OPRD1 could affect the delta receptor function and hence affect reward stimuli. However, we used a tag-SNP design in this study, meaning that chances are that their precise effects are due to other nonsynonymous SNP in high LD. In any case, our findings do pinpoint an area in OPRD1 within chromosome 1 (positions 1:28862203 to 1:28871216) that seems to be important for BMI in AN patients.
Psychiatric comorbidities in patients with disordered eating are frequently as protracted and impairing as the ED itself [22,23]. The analysis of these ED-related phenotypes, as potential intermediate phenotypes, may help determine the biological mechanisms involved in ED and identify genetic variability contributing to these disorders [24,25]. Both our single- and multiple-marker approaches identified a number of traits and symptoms in AN and BN patients that were affected by variability in the OPRD1 gene. To our knowledge, there are no targeted studies that analyze the role of endogenous opioids in these ED-related comorbidities, although there is a GWAS that analyzed the Twins UK cohort dataset for associations with six phenotypes related to ED [26]. In this study, OPRD1 rs1042114 was associated with body dissatisfaction. In line with this, we also observed a strong association (FDR-q=0.007) between this trait and a 3-SNP haplotype formed by rs508448, rs204077 and rs2234918 in patients with BN, a disorder in which body image disturbances constitute a core feature [27]. Although information on the biochemical effects of tag-SNPs is typically scarce, the first SNP in the haplotype, rs508448, is in LD with rs1042114, a non-synonymous coding variant, which has been shown to affect the delta opioid receptor function [28]. In addition, the third variant, rs2234918, has been well studied and reports exist linking its presence to the modulation of oxycodone effects [29] and heroin dependence [30]. It should be noticed that these two tag-SNPs with putative functional impact on receptor activity are contained in the last four consecutive 3-SNP haplotypes identified. This is important because looking at Figure 3 and Figure 4, it seems clear that most of the significant associations with the psychometric measurements stem from variability in this distal region of the gene locus, where the aforementioned variants are harbored. More importantly, the results from the BN group showed that this area was associated with altered scores in the total EDI-2 questionnaire as well as in two global indices of the SCL-90R inventory, GSI and PSDI, which highlights the importance of this distal region in the OPRD1 gene for the development of psychiatric comorbidities that are often coupled with ED. Interestingly, in the AN group, the association with PST, the third general distress index of SCL-90R, and BMI were also located in this region. It is true, however, that less noticeable geno-phenotype associations were identified in the AN patients. An explanation could be that differences in the questionnaires results due to an expected moderate influence of genetic variants would be more noticeable in patients with elevated scores. In this regard, BN patients were found to score significantly higher than AN patients in all scales, as patients with bulimia nervosa have a higher prevalence of comorbidity with other psychopathological disorders [31]. Furthermore, we and others have previously observed that connections among genotypes of genes in the central nervous system and these character scales are more expressed in BN patients than in women with AN [32,33]
Our results did not support a central role of OPRD1 genetic variability in the risk for AN or BN, as only two SNPs in the AN group showed statistical significance, which was lost after correction for multiple testing. In this regard, it should be noted that a GWAS conducted to identify genetic modulators of AN risk did not find SNPs with genome-wide significance [10]. The authors did report an association for rs533123 in OPRD1, which we did not observe, but it was only nominal and hence the evidence must be considered suggestive. Brown et al. have also reported a significant association with AN risk for rs569356, a SNP that was not included in our tag-SNP design, although it should be noted that the authors did not correct their results for multiple testing [11]. In previous studies of our group, we have observed how the connection of central nervous genes with ED susceptibility is somewhat weak, whereas there is a much clearer association with personality dimensions and psychopathological symptoms shown by the patients, which can translate, for instance, into BMI changes [33,34,35,36]. It is tempting to speculate that the altered traits are likely more important with respect to the severity and specific characteristics of the ED than to an elevated susceptibility, where sociocultural or environmental elements may also play a relevant role.
A few limitations must be acknowledged in this study. First, the relatively small size of the BN group might affect the reproducibility of its associated findings. On the other hand, the limited sample allowed that all the patients were Caucasians living in the same geographical area and that were diagnosed and treated by the same doctors in a single healthcare center, all of which reduced the chance that the findings may be due to population structure. Second, we did not consider the different psychopathological scales to correct for multiple testing, as we did with the SNPs and haplotypes determined, as this procedure has been suggested to be too stringent to detect a moderate correlation with different endophenotypes in similar studies [37]. Finally, connecting the observed associations to a precise biochemical effect of a given SNP is challenging, as the study design involved the use of tag-SNPs that often lack functional information.
In summary, we conclude that genetic variability in the OPRD1 gene, and specifically in the distal region of the gene locus (from position 1:28862203 onwards), plays a significant role modulating BMI, personality dimensions, and psychopathological symptoms in patients with ED. These findings suggest that alterations in the reward system regulated by the delta opioid receptor may contribute to the regulation of body weight and the severity of psychiatric comorbidities in ED. Although our study did not identify a central role for OPRD1 in the overall risk for developing AN or BN, the identified genetic associations with BMI and psychiatric symptoms, which were more noticeable in BN patients, highlight its importance in the nuanced expression of ED phenotypes, and underscore the need for further research to elucidate the precise biochemical mechanisms underlying these associations.
Supplementary Materials
The following supporting information can be downloaded at the website of this paper posted on Preprints.org. Figure S1: Significance levels of regression analyses in all models of inheritance for the 16 SNPs assayed in relation to body mass index values of Bulimia Nervosa patients. Table S1: P-values for the association of 16 tag-SNPs in OPRD1 with the risk of developing Anorexia Nervosa. All models of inheritance are shown. Table S2: P-values for the association of 16 tag-SNPs in OPRD1 with the risk of developing Bulimia Nervosa. All models of inheritance are shown.
Author Contributions
GG designed and carried out the study conception, drafted the manuscript and searched for funding. Material preparation was performed by IF, data collection was performed by SM-Z and AG-H, data analysis was performed by LMG and LG-R. All authors read and approved the final manuscript.
Funding
This work was supported in part by the Alicia Koplowitz Foundation, Madrid (Spain).
Institutional Review Board Statement
The study was conducted according to the guidelines of the Declaration of Helsinki and approved by the Bioethics and Biosafety Commission of the University of Extremadura (No 19/2018) on March 6, 2018.
Informed Consent Statement
Informed consent was obtained from all subjects involved in the study.
Data Availability Statement
The data that support the findings of this study are available on Figshare with DOI accession number 10.6084/m9.figshare.26303329
Acknowledgments
We would like to thank the DNA repository of the Instituto de Salud Carlos III (www.bancoadn.org) for providing with genetic material from healthy individuals and the members of the Centro Nacional de Genotipado-Instituto de Salud Carlos III (CEGen) for their technical assistance.
Conflicts of Interest
The authors declare no conflicts of interest. The funders had no role in the design of the study; in the collection, analyses, or interpretation of data; in the writing of the manuscript; or in the decision to publish the results.
References
- Bulik, C.M., J. R.I. Coleman, J.A. Hardaway, et al., Genetics and neurobiology of eating disorders. Nat Neurosci, 2022. 25(5): 543-554. [CrossRef]
- Zuniga, S.S., M. R. Flores, A. Albu, Role of Endogenous Opioids in the Pathophysiology of Obesity and Eating Disorders. Adv Neurobiol, 2024. 35: 329-356. [CrossRef]
- Flores, M.R. and S.S. Zuniga, Endogenous Opioids in the Homeostatic Regulation of Hunger, Satiety, and Hedonic Eating: Neurobiological Foundations. Adv Neurobiol, 2024. 35: 315-327. [CrossRef]
- Galusca, B., B. Traverse, N. Costes, et al., Decreased cerebral opioid receptors availability related to hormonal and psychometric profile in restrictive-type anorexia nervosa. Psychoneuroendocrinology, 2020. 118: 104711. [CrossRef]
- Roden, R.C., M. Billman, S. Lane-Loney, et al., An experimental protocol for a double-blind placebo-controlled evaluation of the effectiveness of oral naltrexone in management of adolescent eating disorders. Contemp Clin Trials, 2022. 122: 106937. [CrossRef]
- Marrazzi, M.A. and E.D. Luby, An auto-addiction opioid model of chronic anorexia nervosa. Int J Eat Disord, 1986. 5(2): 191-208.
- Kaye, W.H., L. R. Lilenfeld, W.H. Berrettini, et al., A search for susceptibility loci for anorexia nervosa: methods and sample description. Biol Psychiatry, 2000. 47(9): 794-803. [CrossRef]
- Grice, D.E., K. A. Halmi, M.M. Fichter, et al., Evidence for a susceptibility gene for anorexia nervosa on chromosome 1. Am J Hum Genet, 2002. 70(3): 787-92. [CrossRef]
- Bergen, A.W., M. B. van den Bree, M. Yeager, et al., Candidate genes for anorexia nervosa in the 1p33-36 linkage region: serotonin 1D and delta opioid receptor loci exhibit significant association to anorexia nervosa. Mol Psychiatry, 2003. 8(4): 397-406. [CrossRef]
- Wang, K., H. Zhang, C.S. Bloss, et al., A genome-wide association study on common SNPs and rare CNVs in anorexia nervosa. Mol Psychiatry, 2011. 16(9): 949-59. [CrossRef]
- Brown, K.M., S. R. Bujac, E.T. Mann, D.A. Campbell, M.J. Stubbins, J.E. Blundell, Further evidence of association of OPRD1 & HTR1D polymorphisms with susceptibility to anorexia nervosa. Biol Psychiatry, 2007. 61(3): 367-73. [CrossRef]
- Boraska, V., C. S. Franklin, J.A. Floyd, et al., A genome-wide association study of anorexia nervosa. Mol Psychiatry, 2014. 19(10): 1085-94. [CrossRef]
- Lilenfeld, L.R., S. Wonderlich, L.P. Riso, R. Crosby, J. Mitchell, Eating disorders and personality: a methodological and empirical review. Clin Psychol Rev, 2006. 26(3): 299-320. [CrossRef]
- Keski-Rahkonen, A. and L. Mustelin, Epidemiology of eating disorders in Europe: prevalence, incidence, comorbidity, course, consequences, and risk factors. Curr Opin Psychiatry, 2016. 29(6): 340-5. [CrossRef]
- Bang, L., S. Bahrami, G. Hindley, et al., Genome-wide analysis of anorexia nervosa and major psychiatric disorders and related traits reveals genetic overlap and identifies novel risk loci for anorexia nervosa. Transl Psychiatry, 2023. 13(1): 291. [CrossRef]
- Gonzalez, L.M., A. Garcia-Herraiz, S. Mota-Zamorano, I. Flores, D. Albuquerque, G. Gervasini, Variability in cannabinoid receptor genes is associated with psychiatric comorbidities in anorexia nervosa. Eat Weight Disord, 2021. 26(8): 2597-2606. [CrossRef]
- Derogaitis, L.R. , SCL-90R: Cuestionario de 90 síntomas. 2002, Madrid: TEA Ed.
- Guimera, E. and R. Torrubia, Adaptación española del "Eating Disorder Inventory Inventory" (EDI) en una muestra de pacientes anoréxicas. Anal Psiquiatr, 1987. 3: 185-190.
- Purcell, S., B. Neale, K. Todd-Brown, et al., PLINK: a tool set for whole-genome association and population-based linkage analyses. Am J Hum Genet, 2007. 81(3): 559-75. [CrossRef]
- Yilmaz, Z., A. S. Kaplan, A.K. Tiwari, et al., The role of leptin, melanocortin, and neurotrophin system genes on body weight in anorexia nervosa and bulimia nervosa. J Psychiatr Res, 2014. 55: 77-86. [CrossRef]
- Paszynska, E., M. Dmitrzak-Weglarz, M. Roszak, et al., Salivary opiorphin levels in anorexia nervosa: A case-control study. World J Biol Psychiatry, 2020. 21(3): 212-219. [CrossRef]
- Martinussen, M., O. Friborg, P. Schmierer, et al., The comorbidity of personality disorders in eating disorders: a meta-analysis. Eat Weight Disord, 2017. 22(2): 201-209. [CrossRef]
- Gazzillo, F., V. Lingiardi, A. Peloso, et al., Personality subtypes in adolescents with anorexia nervosa. Compr Psychiatry, 2013. 54(6): 702-12. [CrossRef]
- Gottesman, II and T.D. Gould, The endophenotype concept in psychiatry: etymology and strategic intentions. AJ Psychiatry, 2003. 160(4): 636-45. [CrossRef]
- Morris, A.P., C. M. Lindgren, E. Zeggini, et al., A powerful approach to sub-phenotype analysis in population-based genetic association studies. Genet Epidemiol, 2010. 34(4): 335-43. [CrossRef]
- Boraska, V., O. S. Davis, L.F. Cherkas, et al., Genome-wide association analysis of eating disorder-related symptoms, behaviors, and personality traits. Am J Med Genet B Neuropsychiatr Genet, 2012. 159B(7): 803-11. [CrossRef]
- Jones, H., V. V.W. McIntosh, E. Britt, J.D. Carter, J. Jordan, C.M. Bulik, The effect of temperament and character on body dissatisfaction in women with bulimia nervosa: The role of low self-esteem and depression. Eur Eat Disord Rev, 2022. 30(4): 388-400. [CrossRef]
- Leskela, T.T., P. M. Markkanen, I.A. Alahuhta, J.T. Tuusa, U.E. Petaja-Repo, Phe27Cys polymorphism alters the maturation and subcellular localization of the human delta opioid receptor. Traffic, 2009. 10(1): 116-29. [CrossRef]
- Olesen, A.E., H. Sato, L.M. Nielsen, et al., The genetic influences on oxycodone response characteristics in human experimental pain. Fundam Clin Pharmacol, 2015. 29(4): 417-25. [CrossRef]
- Huang, C.C., S. C. Kuo, T.C. Yeh, et al., OPRD1 gene affects disease vulnerability and environmental stress in patients with heroin dependence in Han Chinese. Prog Neuropsychopharmacol Bol Psychiatry, 2019. 89: 109-116. [CrossRef]
- Hudson, J.I., E. Hiripi, H.G. Pope, Jr., R.C. Kessler, The prevalence and correlates of eating disorders in the National Comorbidity Survey Replication. Biol Psychiatry, 2007. 61(3): 348-58. [CrossRef]
- Mikolajczyk, E., A. Grzywacz, J. Samochowiec, The association of catechol-O-methyltransferase genotype with the phenotype of women with eating disorders. Brain Res, 2010. 1307: 142-8.
- Gamero-Villarroel, C., L. M. Gonzalez, I. Gordillo, et al., Impact of NEGR1 genetic variability on psychological traits of patients with eating disorders. Pharmacogenomics J, 2015. 15(3): 278-83. [CrossRef]
- Gamero-Villarroel, C., I. Gordillo, J.A. Carrillo, et al., BDNF genetic variability modulates psychopathological symptoms in patients with eating disorders. Eur Child Adolesc Psychiatry, 2014. 23(8): 669-79. [CrossRef]
- Gamero-Villarroel, C., L. M. Gonzalez, R. Rodriguez-Lopez, et al., Influence of TFAP2B and KCTD15 genetic variability on personality dimensions in anorexia and bulimia nervosa. Brain Behav, 2017. 7(9): e00784. [CrossRef]
- Gonzalez, L.M., A. Garcia-Herraiz, S. Mota-Zamorano, I. Flores, D. Albuquerque, G. Gervasini, Variants in the Obesity-Linked FTO gene locus modulates psychopathological features of patients with Anorexia Nervosa. Gene, 2021. 783: 145572. [CrossRef]
- Mercader, J.M., F. Fernandez-Aranda, M. Gratacos, et al., Blood levels of brain-derived neurotrophic factor correlate with several psychopathological symptoms in anorexia nervosa patients. Neuropsychobiology, 2007. 56(4): 185-90. [CrossRef]
Figure 1.
Significance levels of regression analyses in all models of inheritance for the 16 SNPs assayed in relation to body mass index values of Anorexia Nervosa patients. The red dotted line represents the 0.05 adjusted q-level of significance.
Figure 1.
Significance levels of regression analyses in all models of inheritance for the 16 SNPs assayed in relation to body mass index values of Anorexia Nervosa patients. The red dotted line represents the 0.05 adjusted q-level of significance.
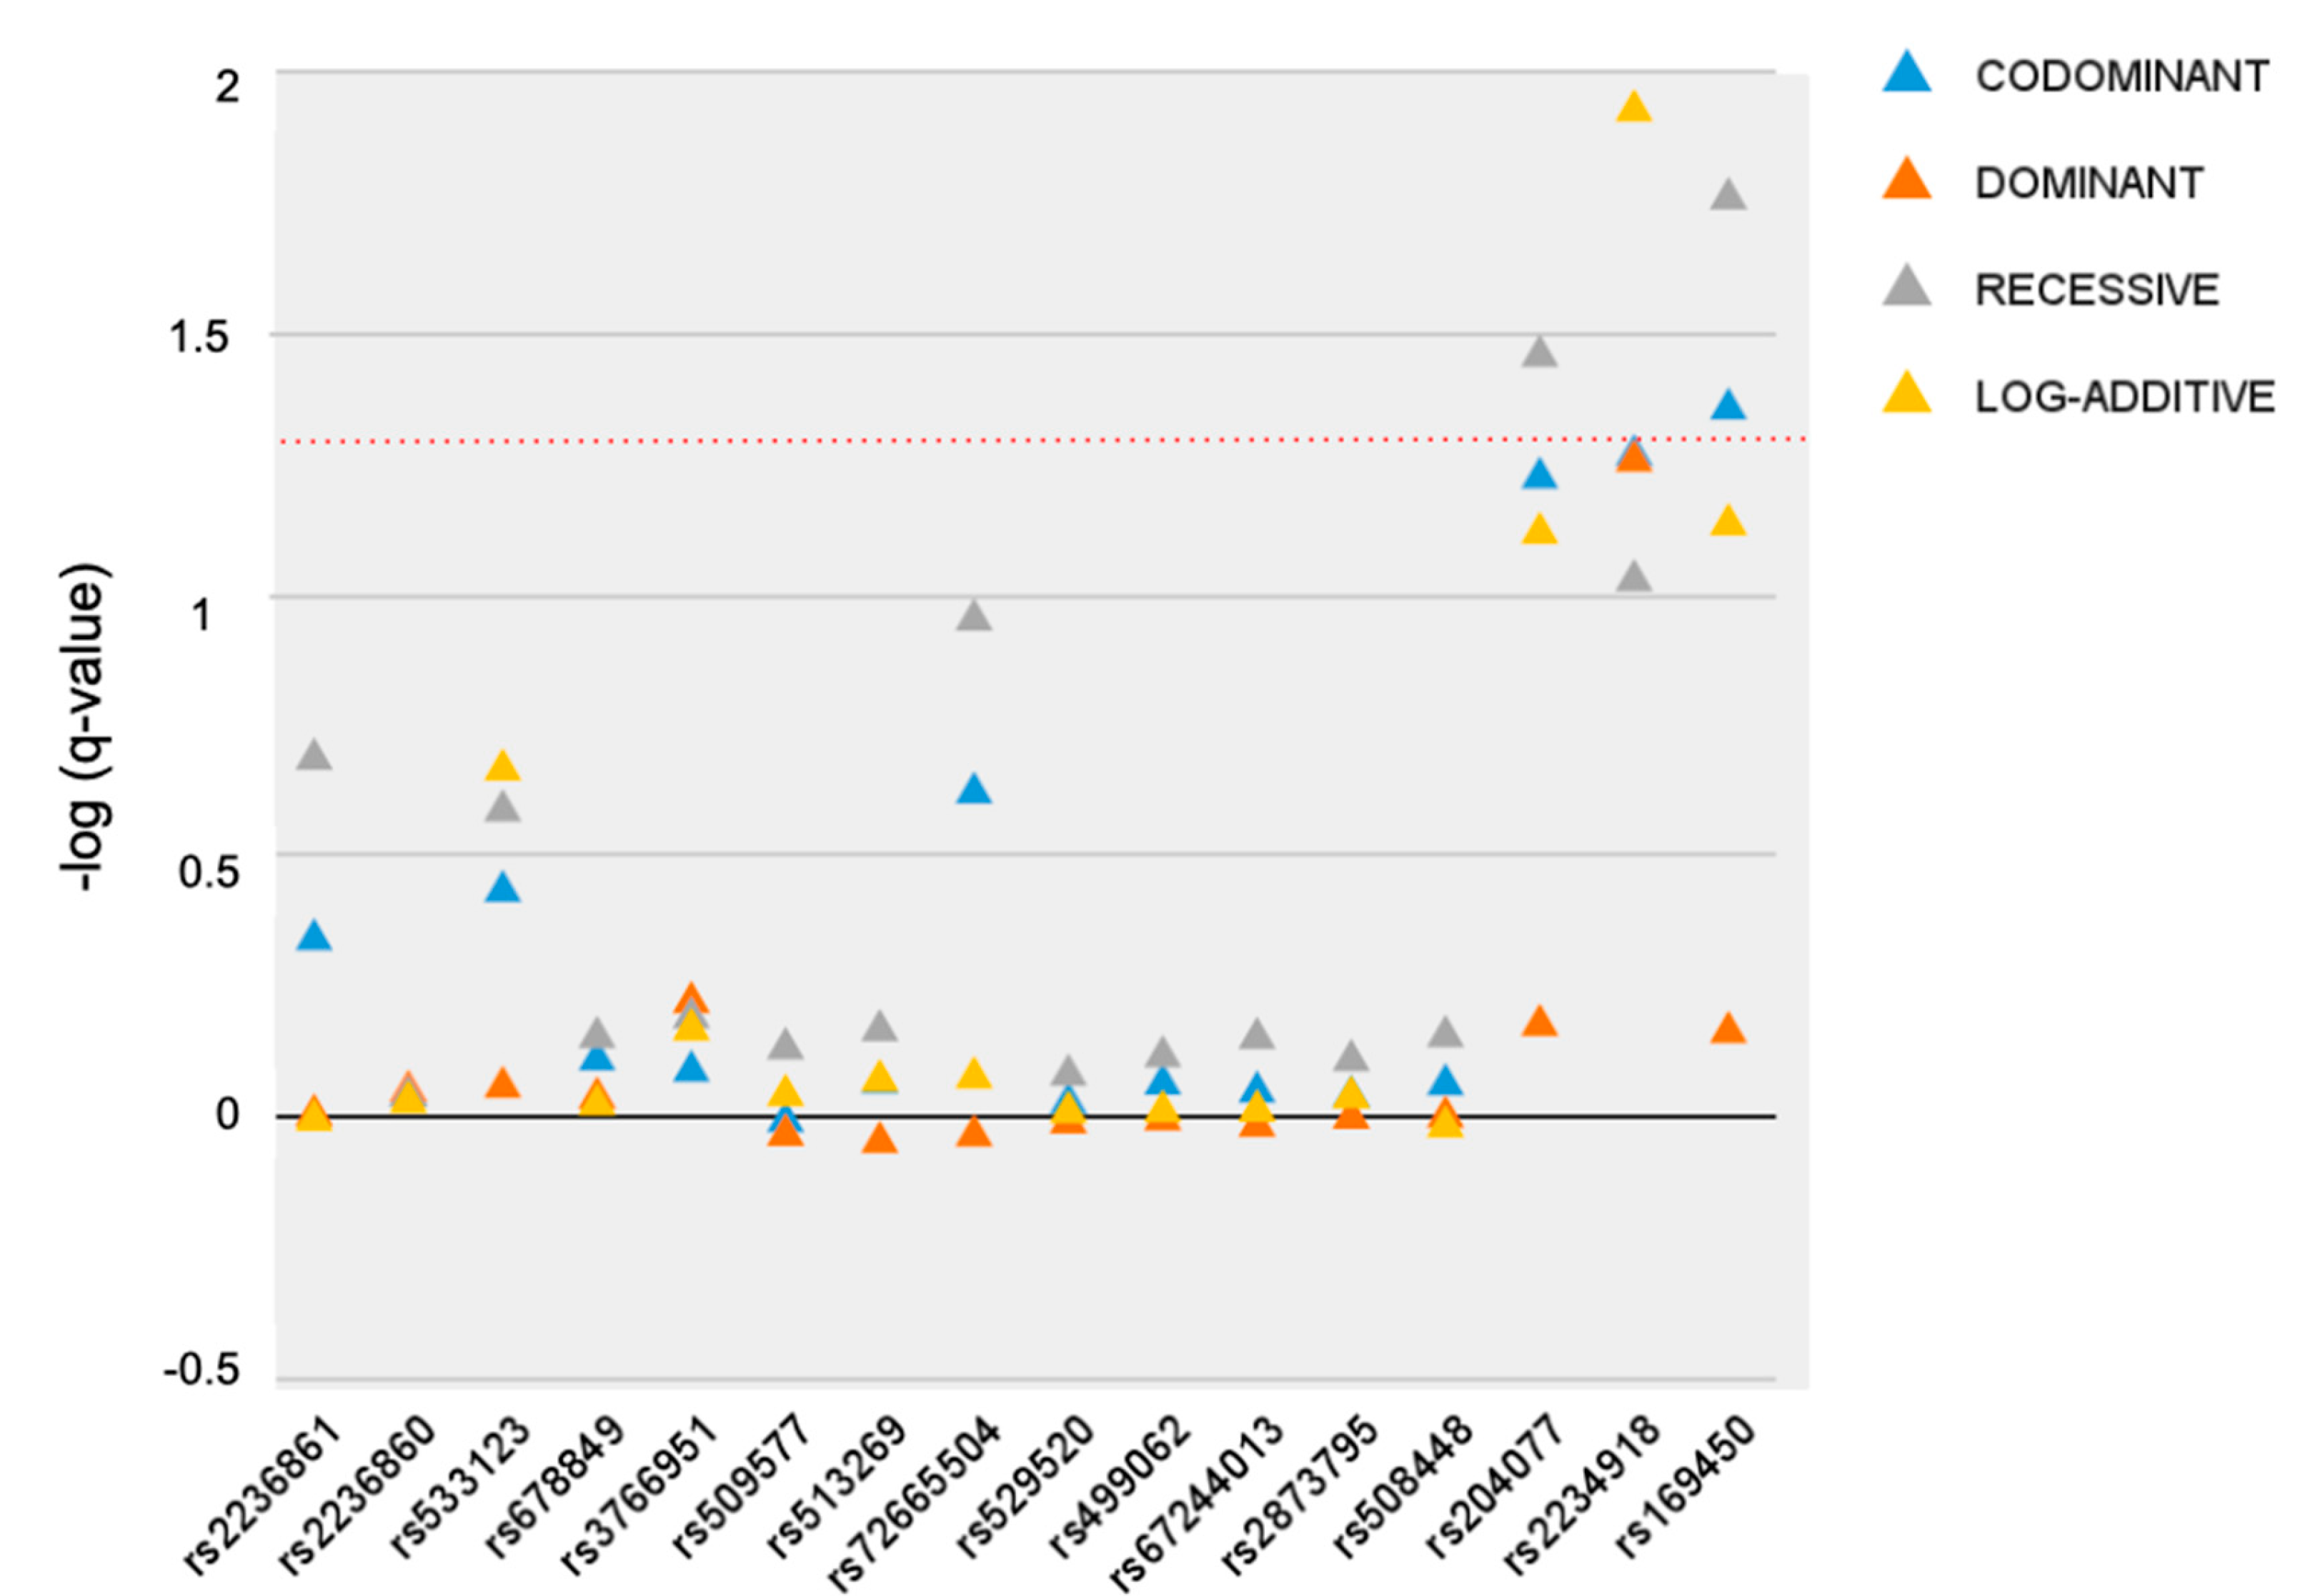
Figure 2.
Impact of OPRD1 tag-SNPs on Interpersonal distrust scores in anorexia patients (A) and on Ineffectiveness in bulimia patients (B) obtained with a recessive model of inheritance. The red dotted line represents the 0.05 adjusted q-level of significance.
Figure 2.
Impact of OPRD1 tag-SNPs on Interpersonal distrust scores in anorexia patients (A) and on Ineffectiveness in bulimia patients (B) obtained with a recessive model of inheritance. The red dotted line represents the 0.05 adjusted q-level of significance.
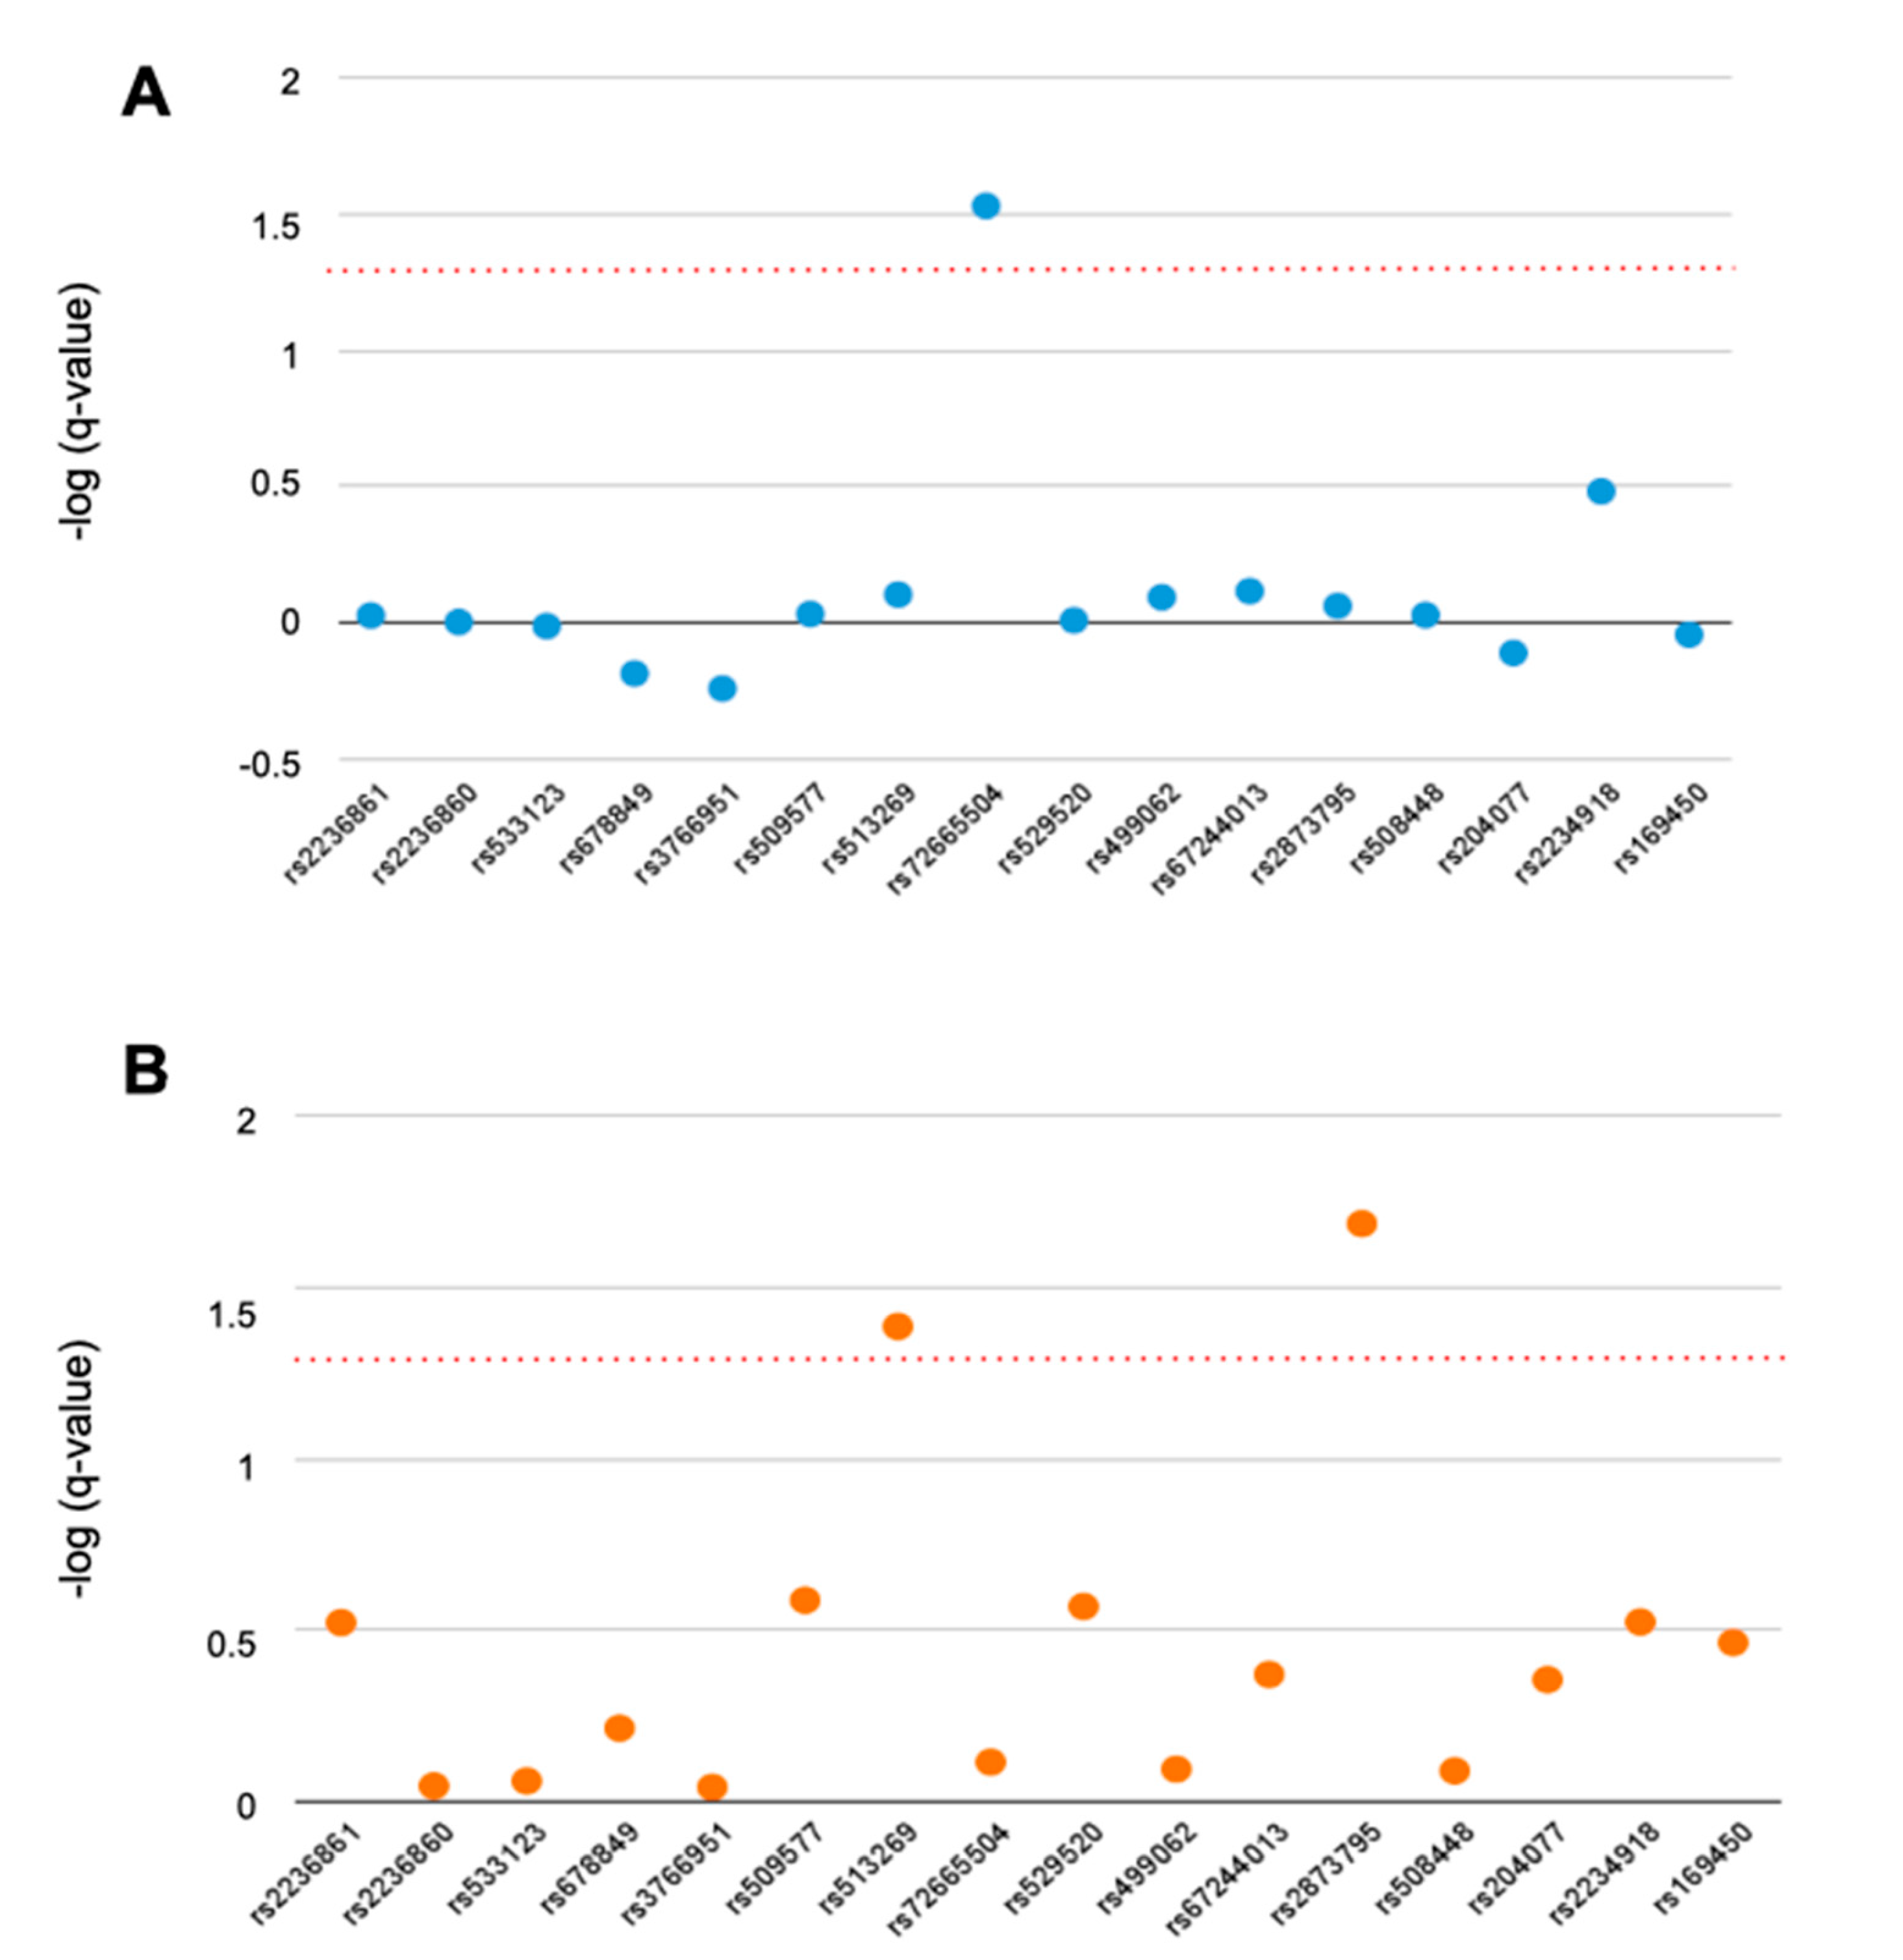
Figure 3.
Three-SNP sliding window analysis for the association of OPRD1 haplotypes with psychometric scores of AN patients. The dotted line denotes the 0.05 adjusted q-level of significance. EDI-2, EDI-2 total score; DT, drive for thinness; B, bulimia; BD, body dissatisfaction; I, ineffectiveness; P, perfectionism; ID, interpersonal distrust; IA, interoceptive awareness; MF, maturity fears; A, asceticism; IR, impulse regulation; SI, social insecurity; GSI, Global Severity Index; PST, Positive Symptom Total; PSDI, Positive Symptom Distress Index; SOM, Somatization; OCD, obsessive-compulsive; ANX, anxiety ; DEP, depression; IP_SENS, interpersonal Sensitivity; HOST, hostility; ANX_PHOB, phobic anxiety; PAR_ID, paranoid ideation; PSYC, psychoticism and ADD, additional items.
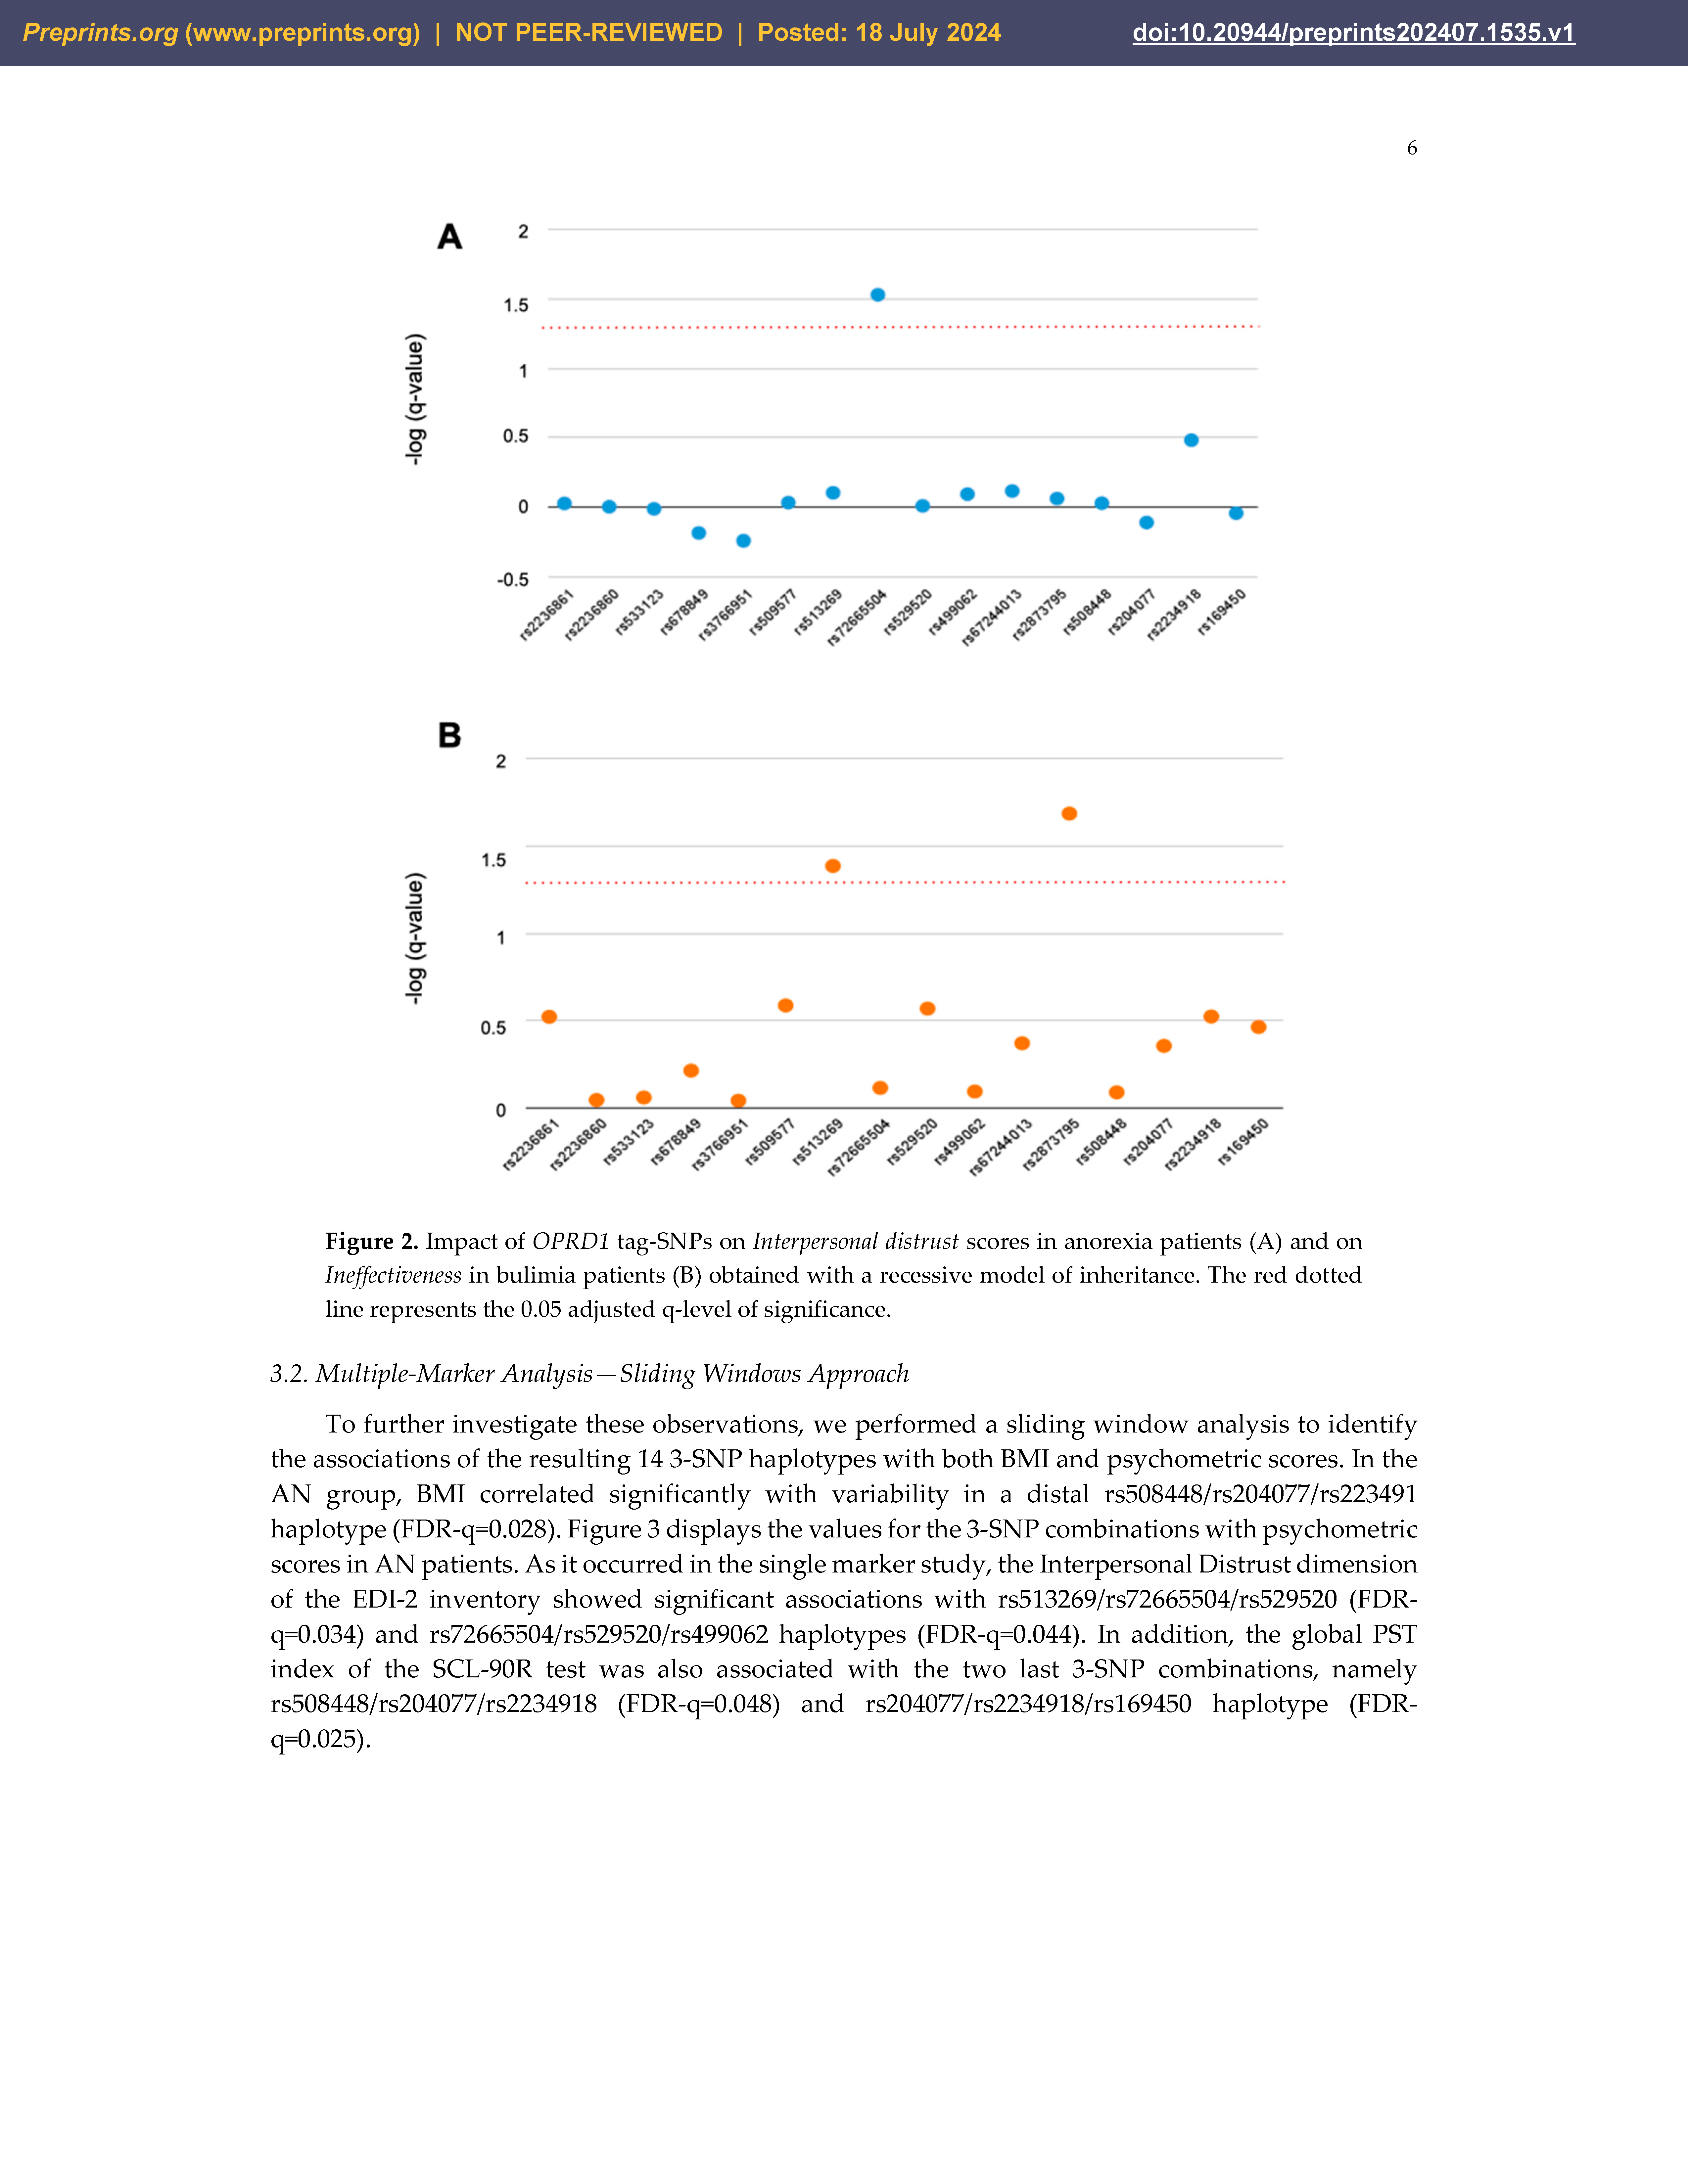
Figure 4.
Three-SNP sliding window analysis for the association of OPRD1 haplotypes with psychometric scores of BN patients. The dotted line denotes the 0.05 adjusted q-level of significance. EDI-2, EDI-2 total score; DT, drive for thinness; B, bulimia; BD, body dissatisfaction; I, ineffectiveness; P, perfectionism; ID, interpersonal distrust; IA, interoceptive awareness; MF, maturity fears; A, asceticism; IR, impulse regulation; SI, social insecurity; GSI, Global Severity Index; PST, Positive Symptom Total; PSDI, Positive Symptom Distress Index; SOM, Somatization; OCD, obsessive-compulsive; ANX, anxiety ; DEP, depression; IP_SENS, interpersonal Sensitivity; HOST, hostility; ANX_PHOB, phobic anxiety; PAR_ID, paranoid ideation; PSYC, psychoticism and ADD, additional items.
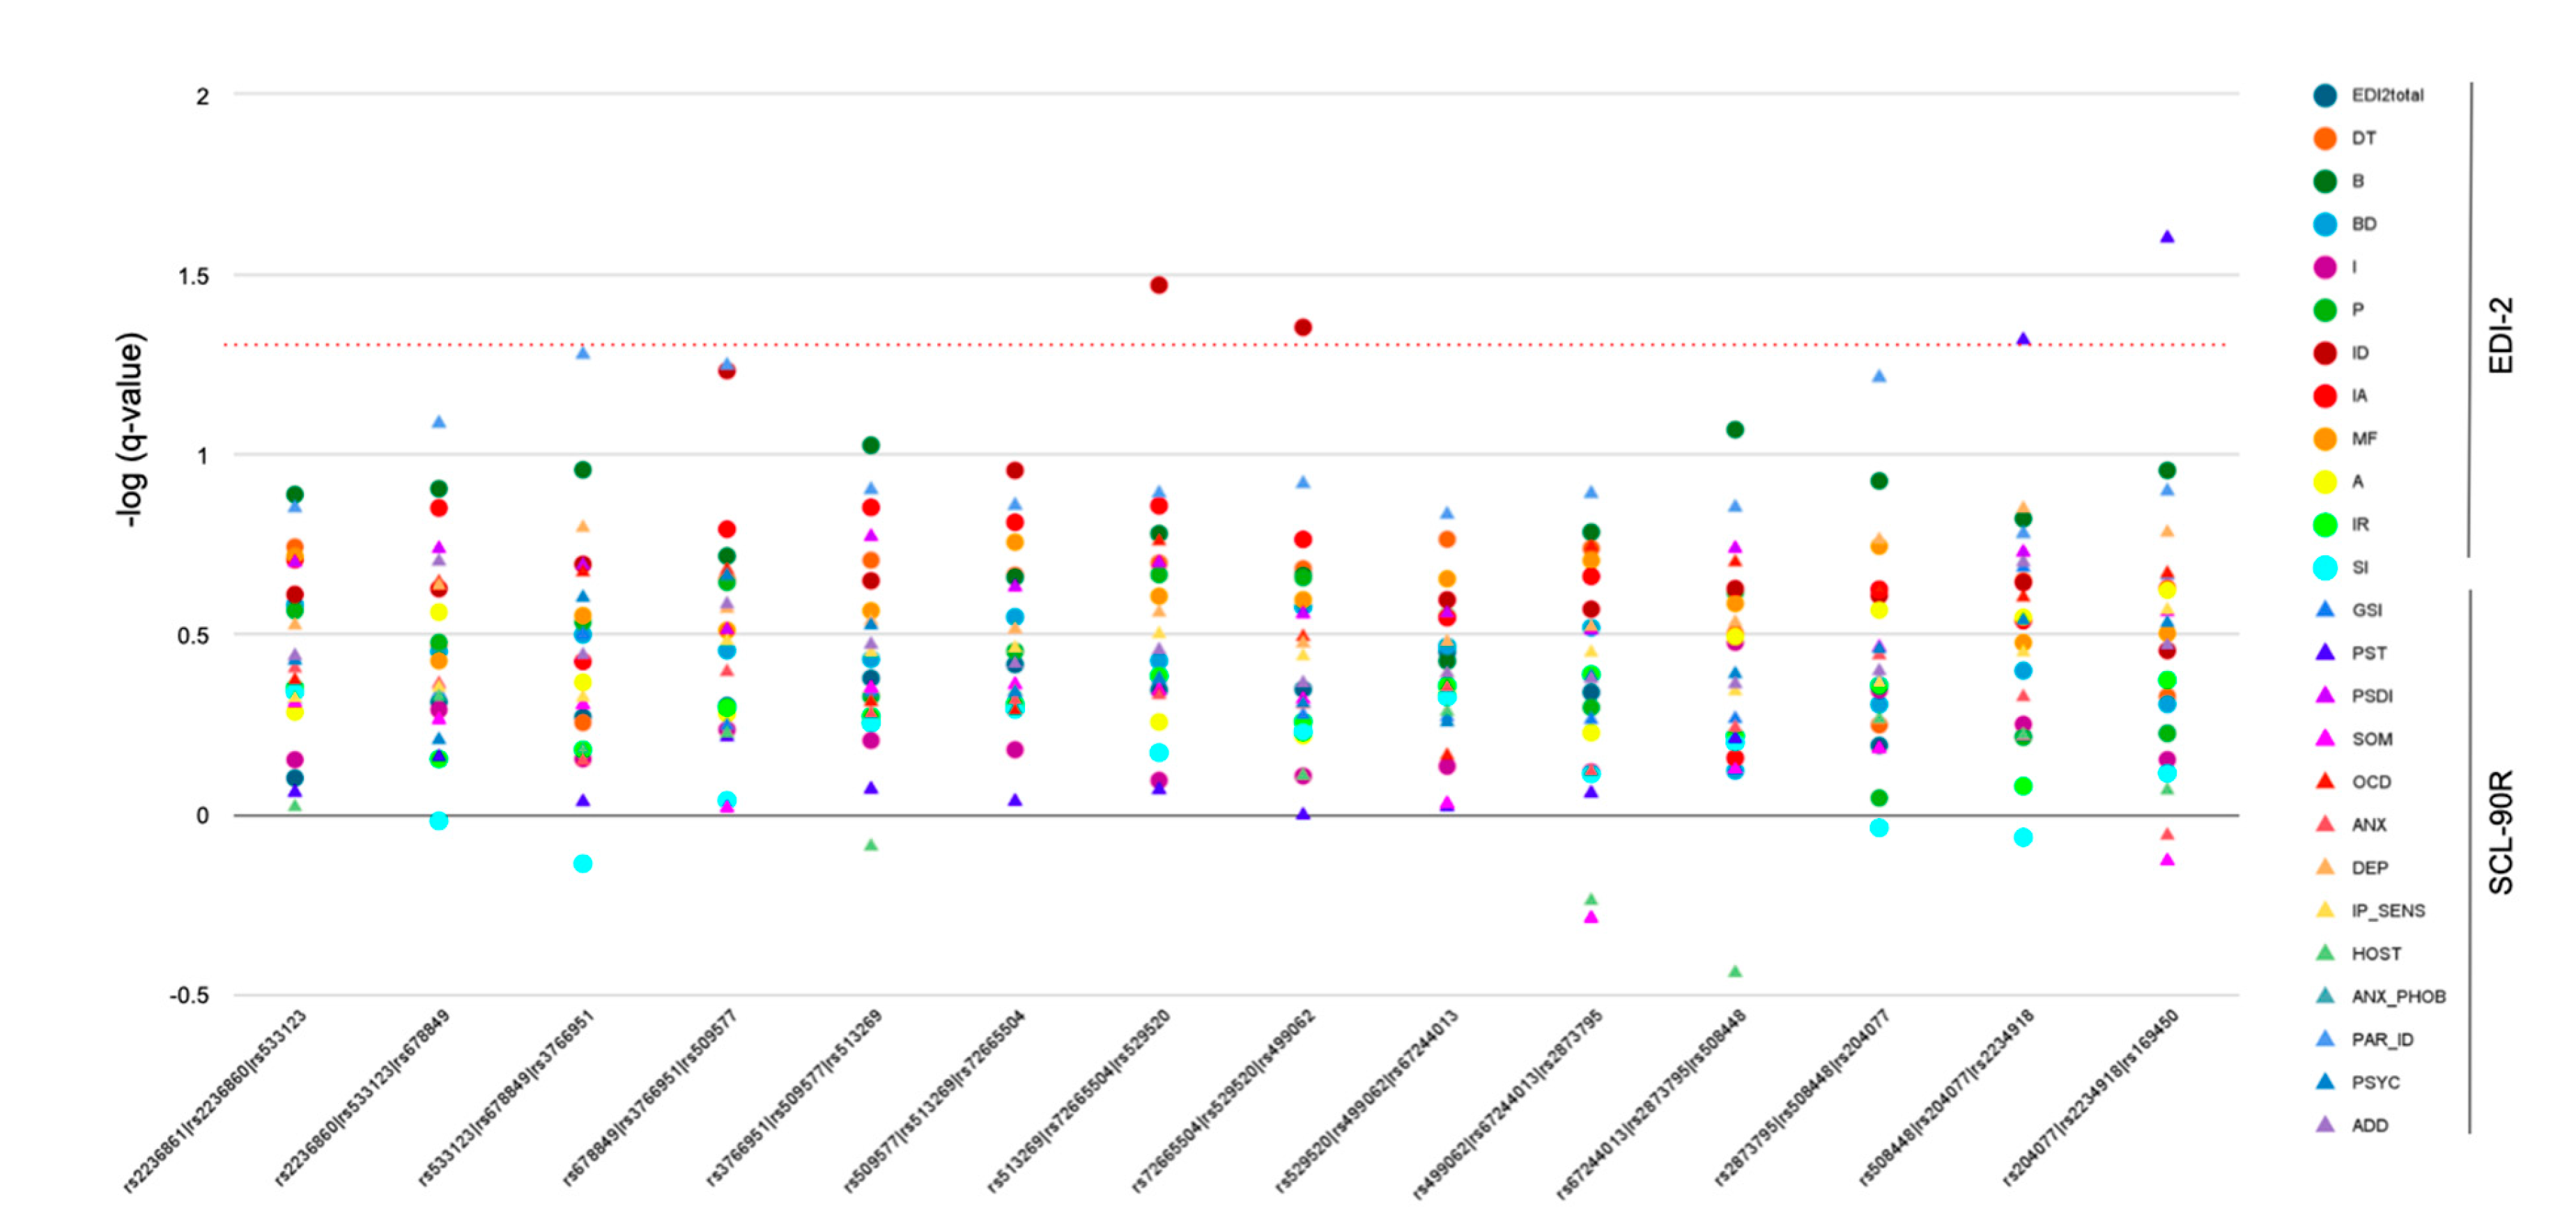

Table 1.
This is a table. Tables should be placed in the main text near to the first time they are cited.
Table 1.
This is a table. Tables should be placed in the main text near to the first time they are cited.
| Tag-SNP | Alleles | Position | MAF | HWE |
|---|---|---|---|---|
| rs2236861 | G/A | 1:28813244 | 0.394 | 0.586 |
| rs2236860 | C/T | 1:28814236 | 0.355 | 0.819 |
| rs533123 | A/G | 1:28814643 | 0.408 | 0.758 |
| rs678849 | C/T | 1:28818676 | 0.25 | 0.483 |
| rs3766951 | T/C | 1:28843047 | 0.433 | 0.531 |
| rs509577 | A/C | 1:28845884 | 0.458 | 0.545 |
| rs513269 | C/T | 1:28846339 | 0.394 | 0.208 |
| rs72665504 | G/A | 1:28847410 | 0.465 | 0.530 |
| rs529520 | A/C | 1:28848434 | 0.203 | 0.420 |
| rs499062 | T/C | 1:28848540 | 0.219 | 1.000 |
| rs67244013 | G/A | 1:28848988 | 0.469 | 0.168 |
| rs2873795 | G/T | 1:28850273 | 0.289 | 0.208 |
| rs508448 | A/G | 1:28855013 | 0.356 | 0.474 |
| rs204077 | C/T | 1:28862203 | 0.448 | 0.329 |
| rs2234918 | T/C | 1:28863085 | 0.334 | 0.543 |
| rs169450 | G/T | 1:28871216 | 0.255 | 0.828 |
HWE, Hardy-Weinberg equilibrium in the control population; MAF, minor allele frequency in the study population.
Table 2.
Descriptive and psychometric features of patients with anorexia nervosa (AN) or bulimia nervosa (BN) and healthy females. Mean ± standard deviation values are shown.
Table 2.
Descriptive and psychometric features of patients with anorexia nervosa (AN) or bulimia nervosa (BN) and healthy females. Mean ± standard deviation values are shown.
| AN | BN | ED | Controls | |
|---|---|---|---|---|
| N | 221 | 88 | 309 | 396 |
| Age, years | 17.0±4.1 | 18.7±5.9ʃ | 17.5±4.7* | 32.6±8.0 |
| Weight, kg | 45.0±7.0 | 68.1±22.3** | 51.5±16.8* | 63.1±7.7 |
| BMI | 17.3±2.1 | 25.9±8.2** | 19.7±6.1* | 23.4±2.72 |
| Height, m | 1.61±0.07 | 1.62±0.06 | 1.61±0.07* | 1.64±0.06 |
| Total EDI2 | 89.9±46.3 | 121.4±41.0** | 98.8±47.0 | - |
| GSI | 1.6±0.8 | 2.0±0.8** | 1.7±0.8 | - |
| PST | 61.1±21.5 | 70.4±16.76** | 63.8±20.6 | - |
| PSDI | 2.2±0.6 | 2.4±0.6** | 2.3±0.6 | - |
*p <0.05 vs. control subjects; ʃp <0.05 vs. AN patients; **p <0.001 vs. AN patients
Disclaimer/Publisher’s Note: The statements, opinions and data contained in all publications are solely those of the individual author(s) and contributor(s) and not of MDPI and/or the editor(s). MDPI and/or the editor(s) disclaim responsibility for any injury to people or property resulting from any ideas, methods, instructions or products referred to in the content. |
© 2024 by the authors. Licensee MDPI, Basel, Switzerland. This article is an open access article distributed under the terms and conditions of the Creative Commons Attribution (CC BY) license (http://creativecommons.org/licenses/by/4.0/).
Copyright: This open access article is published under a Creative Commons CC BY 4.0 license, which permit the free download, distribution, and reuse, provided that the author and preprint are cited in any reuse.


