
Submitted:
11 July 2024
Posted:
12 July 2024
You are already at the latest version
Abstract
Abstract: Obesity and overweight also increasingly affect women of childbearing age and pregnant women. In maternal obesity, the activation of metabolic, inflammatory, and oxidative stress pathways is proven, which appears to be a key step in placental and uterus function pathological changes. Several recent studies have evidenced that aquaporins (AQPs) are critical players in adipose tissue biology and are involved in the onset of obesity. Our studies aimed to investigate the changes in placental volume and vascularization and measure the AQP5 expression and total antioxidant capacity (TAC) in the placenta and uterus tissues in obese and normal-weight mothers. We also aim to measure the AQP5 plasma concentration. We found AQP5 dominance in the uterus and plasma at 34 weeks of normal pregnancy. The placental volume increased, and the vascularization decreased in obese mothers compared to the control. The AQP5 expression increased in the uterus of the obese group and did not change in the placenta. The TAC decreased in the plasma of overweight mothers. We hypothesize that increased AQP5 expression prolongs the length of pregnancy and inhibits the onset of contractions. Based on our findings, we can develop diagnostic tests and provide new targets for tocolytic drug development.
Keywords:
aquaporin
; human pregnancy
; obesity
; uterus
; placenta
1. Introduction
Obesity is a complex disease that has reached pandemic dimensions. Worldwide prevalence of obesity nearly tripled between 1975 and 2023, mainly due to the adoption of a progressively more sedentary lifestyle and the consumption of less healthy diets being worse for women than men [1]. A retrospective study presented the population data in Hungary; Hungary’s obesity prevalence is higher than the regional average of 25.3% [2]. The overall prevalence rate of overweight and obesity among men was 40% and 32%, respectively, while overweight and obesity occurred in 32% and 28% of women [3]. In addition, obesity and overweight also affect women of childbearing age and pregnant women increasingly. Obesity is considered responsible for the increased risk of several diseases, such as diabetes, cardiovascular events, and skeletal diseases, and it is also related to malignancies or mental illness. The fact that maternal obesity produces chronic inflammation known as adipose tissue is capable of contributing to this inflammation by its production of inflammatory mediators, which appears to be a critical step in the pathological changes of placental and uterus function [4]. Obesity exerts an independently increased risk of specific fetal malformations, namely neural tube defects, congenital cardiac anomalies, and orofacial clefts [5]. It is well known that obesity-induced oxidative stress represents the pathophysiological basis for most disorders, including reproductive issues. The above supports the study of factors that can change during obesity and affect pregnancy outcomes and fetal health.
Several recent studies have evidenced that aquaporins (AQPs) are critical players in adipose tissue biology and are involved in the onset of obesity [6]. The AQPs are a family of small (25–34 kDa), hydrophobic, integral membrane channel proteins that facilitate the rapid passive movement of water. AQP5 was found to be expressed in mouse adipose cells to play a crucial role in adipocyte differentiation [7], and AQP5-KO mice have lower body weight than wild-type animals [8]. Interestingly, a high-fat diet induces the expression of AQP5 in subcutaneous adipose tissue [9], suggesting a role for AQP5 in adipose biology and cellular adaptation to fat accumulation.
More AQPs were described in the mammalian female reproductive tract. In previous studies, we demonstrated the dominance of AQP5 during pregnancy in the rat uterus, with a dramatic drop on the last day of gestation. Aquaporin transport activity can be regulated by various factors, e.g., selectively regulated by oxytocin [10], and their expression is influenced by both estrogen and progesterone [11]. We have demonstrated the importance of AQP5 expression in pregnant rat uterus contraction and the initiation of preterm birth [12].
Amniotic fluid volume is partially regulated throughout the placenta, and this maternal-fetal interaction is essential during pregnancy. An inadequate amount of amniotic fluid is one of the indicators of abnormal placental function [13]. Volume abnormalities (polyhydramnios or oligohydramnios) increase fetal morbidity and mortality [14]. High mRNA expression for AQP1, 3, 9, and 11, low for AQP4, 5, and 8, and AQP2, 6, and 7 were undetectable in chorionic villi between the 10th and 14th weeks of human gestation [15].
Our studies determined the expression of AQP5 isotype in the human uterus with different gestation ages. We also investigated AQP5 expression in human placental tissues at the end of pregnancy. Furthermore, we detected the effects of maternal obesity on the expression of AQP5 in the uterus, placenta, and plasma antioxidant capacity.
2. Results
2.1. Placental Sonography Studies
Descriptive statistics are shown in Table 1. In our obese group, mean maternal age (34.52 years) was slightly higher compared to the national average reference age at delivery, which was 29.24 years for primiparous women and 30.54 years for the total number of pregnant women in 2023 [16]. Obese women who participated in our study had a mean BMI of 36.17 kg/m2 at the first medical visit. In the normal group 32% and 24% of obese group were primiparous. The gestation age at delivery was no significant difference, but the fetal weights in obese group were significantly higher.
Figure 1 presents a placental volume analysis by the virtual organ computer-aided analysis (VOCAL) program pertaining to the computer software 4-D VIEW (GE Medical Systems, Austria, version 10.4). The most accurate volume analyses were prepared by 3–dimensional ultrasound. Each image was recovered from the disk in succession for processing. The stored volumes marked by outlining the contour of the placenta repeatedly after rotating its image 6 times by 30° with careful attention to exclude decidua and maternal blood vessels were analyzed using the VOCAL. After the complete rotation was finished, the software automatically calculated the placental volume. The intraobserver correlation coefficient (0.97) regarding measuring placental parameters was excellent.
Figure 2 displays the 3-dimensional power Doppler indices in the placenta. The in vivo vascular analyses were at umbilical insertion in the most vascularized part of the placenta. In the two study groups, the placental volume was significantly elevated, while the vascularization indices (VI: vascularization index, FI: flow index, and VFI: vascularization flow index) were significantly depressed in the obese cases compared to normal-weighted pregnant women (Table 2).
2.2. Molecular Biology Studies
The AQP5 mRNA expression (Figure 3A.) in the uterus did not change significantly from the 36th to 41st weeks of pregnancy. Only protein expression was reduced at week 36 of gestation (Figure 3B.). Surprisingly, the AQP5 mRNA and protein expression showed a dramatic increase in the uterus at the 34th week of pregnancy (Figure 3).
The AQP5 concentration significaltly increased in the plasma samples of pregnancy weeks 34 (Figure 4) compared to the non-pregnant control and other weeks of pregnancy.
The AQP5 mRNA (Figure 5A.) and protein expression (Figure 5B.) significantly increased in the uterus of over weight mothers compared to the normal weight mothers.
No changes in AQP5 mRNA (Figure 6A.) and protein (Figure 6B.) expression were found in the placental tissue of the obese mothers compared to normal weight mothers.
We measured the total antioxidant capacity (TAC) in the plasma of obese and normal-weight mothers. In overweight, the TAC significantly decreased compared to the control pregnant woman (Figure 7.).
3. Discussion
Obesity is a chronic systemic disease that affects all the tissues and organs in the body and increases the risk of a number of common conditions. The reproductive system does not escape the negative effects of obesity. Obesity is commonly classified based on body mass index (BMI), defined as weight in kilograms divided by height in meters squared (kg/m2). The World Health Organization (WHO) defines obesity as BMI > 30 kg/m2 and overweight > 25 kg/m2 [17].
In a sonographic-based cohort study of singleton pregnancies, the estimated placental volumes and fetal weights are higher in pregnancies with obesity compared to the normal-weighted controls. Our data may be consistent with the report that obese mothers have larger placentas, their offspring’s weight is higher, and there is an increased placental ratio, which refers to the ratio of placental weight to fetal weight. Our study suggests disproportionate fetal growth compared to placental development in obesity occurs in late pregnancy.
We found a negative correlation between 3-D power Doppler indices and maternal BMI in obese pregnancies. The control group and the obese groups had overlaps of VI, FI, and VFI values, but all placental vascular indices showed a tendency for a slight reduction in cases complicated by obesity. However, the increased volume expansion of the placenta was observed in connection with BMI. Decreased placental VI and VFI in obesity could be associated with down-regulated angiogenesis and a diminished number of arterioles. At the same time, the depressed FI might represent a narrower inner vascular diameter.
One of the complications described during pregnancy in obese women is a higher risk of early and late miscarriage [18] in both natural and assisted conception, which increases in a BMI-dependent manner [19]. Another problem of obesity during pregnancy is the resulting high rate of cesarean section. The leading cause of this higher frequency of cesarean sections in obese women, compared with that in non-obese women, is an altered myometrial function that leads to lower frequency and potency of contractions. Our previous studies have found a negative correlation between AQP5 expression and uterine contraction, suggesting that a decrease in AQP5 expression results in increased myometrial activity and induction of labour in the rat uterus [12]. Therefore, we considered it essential to determine the ontogeny of AQP5 expression between 34 and 41 weeks of human pregnancy. We measured high AQP5 levels at week 34, which decreased significantly by week 36 and remained low until the end of pregnancy and the last week of the study. We hypothesize that this may support a role for the decreasing expression of AQP5 in the regulation of uterine contractions, in agreement with the results obtained in animal studies. Our hypothesis is supported by the fact that AQPs are also involved in the contraction of other smooth muscle maintaining organs, such as airway smooth muscle. C.M. Krane and colleagues have used Aqp5 knockout (Aqp5-/-) mice to analyze the function of AQP5 in lung physiology. Compared to Aqp5+/+ mice, Aqp5-/- mice exhibit a significantly enhanced concentration-dependent bronchoconstriction to intravenously administered acetylcholine [20]. This examination also proved the importance of AQP5 in smooth muscle contraction.
We also examined plasma AQP5 concentrations to determine its physiological changes and may use these data as a diagnostic marker for future identification of pathological lesions. The change in plasma and uterine AQP5 expression was correlated with a significant increase in week 34 and was significantly low and unchanged in the other weeks studied. We suspect that several factors may have influenced this. There is well-known evidence indicating a beneficial effect of antenatal corticosteroids on fetal lung maturation and widespread recommendations to use this treatment in women at risk of preterm delivery. Women who took part in our studies and delivered at gestational week 34 were also treated with betamethasone. We may suppose that glucocorticoid therapy influenced the AQP5 expression. Chen-Jie Yu et al. determined that glucocorticoids induce AQP5 expression in the sinonasal mucosa of chronic rhinosinusitis rats [21]. Moreover, cortisol modulates the water permeability of AQP2 via rapid non-genomic effects of corticosteroids [22]. Corticosteroids upregulated Aqp5 mRNA and AQP5 protein expression in human alveolar basal epithelial cells and may therefore improve pulmonary function in preterm neonates. AQP5 gene promoter methylation may be cell and tissue specific (e.g., lung). High methylation of AQP5 gene promoter was associated with low AQP5 expression in alveolar epithelial cells In vitro methylation of the AQP5 gene promoter inhibited the transcription of a reporter gene in mouse lung epithelial cells, which support our hypothesis of AQP5 reduction is significant in response to corticosteroid treatment [23].
On the other hand, changes in AQP5 can also provide information about the placenta’s status. By week 12, the placenta is formed and ready to provide nourishment for the baby. It’s considered mature by 34 weeks. Villous maturation can be found a few weeks before or close to term, rarely before 34 weeks of gestation, and clinically associated with maternal metabolic disorder and obesity.
The main obstetric risk factors for preterm birth are preeclampsia, premature rupture of the membranes, rupture of the placenta, and idiopathic cases. For preterm births, the 34th week of pregnancy is also therapeutically significant. Vaginal progesterone significantly reduced the risk of preterm birth or fetal death by 34% in women no older than 34 weeks of gestation [24]. Based on this, we suppose the diagnostic value of the changes in AQP5 expression in the plasma for preterm birth, but this requires further investigation.
The onset of parturition in obese women is frequently delayed. Without induction, obese women are nearly twice as likely as normal-weight women to have prolonged pregnancy (≥41 weeks gestation), particularly with a BMI of 35 kg/m2 or higher [25]. Maternal obesity was associated with higher doses of used prostaglandins, the less frequent success of cervical ripening methods, and higher doses of synthetic oxytocin, as well as a longer time to birth after oxytocin use. AQP5 expression showed significantly higher in the uterus of obese women compared to control mother group. In contrast, we did not find changes in AQP5 expression in the placental tissues. Our group has more results from animal studies about the role of AQP5 in uterus contraction. The dropping of AQP5 expression was proved to be an inducing factor of uterus contraction and premature labor in our earlier studies. Based on these results, we may have supposed that the high concentration of AQP5 in the late pregnant uterus can delay the time of birth. It can be assumed that the AQP5 and other factors e.g., oxytocin and progesterone [10,11] combination effect affect the length of pregnancy and the outcome of childbirth.
The accumulation of reactive oxygen species (ROS) and free radicals in a cell affects many essential compounds, such as lipids, proteins, DNA, carbohydrates, and enzymes, and can damage cells. Pregnancy is an oxidative event in itself. However, in normal pregnancy, there seems to be a balance between antioxidant and oxidant concentrations despite modest oxidative stress. It has been reported that impaired oxidant/antioxidant status is involved in the etiopathogenesis of various obstetrical complications. The oxidant-antioxidant balance varies as the gestational week increases, and the oxidation processes increase during pregnancy. The increase in free radicals becomes especially profound in the late period of pregnancy and leads to increases in the antioxidant mechanisms to compensate for the increased oxidative stress [26]. Our results show that this vital antioxidant capacity is decreased in obese mothers, which can lead to perinatal and postpartum complications. These results correlated with more studies that have suggested that systemic oxidative stress correlates with BMI [27] and that increased oxidative stress in accumulated fat is, at least in part, the underlying cause of the dysregulation of adipocytokines and the development of metabolic syndrome [28].
With our experiments, we got information about the possible correlation between animal and human studies on AQP5 expression and uterus contraction. Furthermore, our research may answer important pathological processes induced by obesity during pregnancy. These results can form the basis for developing diagnostic tests and provide new targets for tocolytic drug development.
4. Materials and Methods
4.1. Samples
A prospective, cross-sectional cohort study was conducted in pregnant women undergoing elective caesarean section at the Department of Obstetrics and Gynecology, University of Szeged, Hungary between June 2023 and March 2024. During the study period, all singleton pregnancies with increased risk of fetal death, where caesarean section was preformed between 34-41 weeks of gestation. The 34+0 and 40+0 weeks of gestation were recruited into our study. Exclusion criteria of the study were identified as follows: multiple pregnancies; fetal or neonatal structural or genetic anomaly; improper localization of the placenta (e.g., placenta praevia); pathological placentation (placenta accreta spectrum); self-reported drug, alcohol, or nicotine abuse.
The determination of gestational age was based on the first day of the last menstrual period and/or on ultrasound biometry (crown-rump-length and biparietal diameter) at 10th week of pregnancy.
The uterus and placental samples collection – from normal and obese women (BMI > 30 kg/m2) - were carried out at the Obstetrics and Gynecology Clinic, University of Szeged. The human study protocol was approved by the Clinical Research Ethics Committee of the University of Szeged (Ref. no.: 57/2020-SZTE). The study was carried out according to the Principles of the Declaration of Helsinki. We obtained written informed consent from all participants.
The human tissues were frozen immediately after collection and stored at -80 °C until assay. The blood samples were collected into EDTA containing polyethylene tubes, centrifuged at 1,500 g for 10 min at 5°C. Separated plasma samples were stored at −80°C until analysis.
4.2. Ultrasound Investigations
The ultrasound investigation performed 16-48 hours before labor. Firtly standard 2D measurements were taken: fetal position and presentation, body movements and fetal heart rate, placental localization. The factorial default setting ‘Obstetrics/2–3 trimester’ was used in 2-D mode.
Then a 3D sweep was obtained through the placenta with power Doppler settings. The 3DPD sweep was obtained through the placenta with a Voluson S10 BT2021 ultrasound machine (RAB 2-5 MHz probe and 4D View version 10.4 program; GE Healthcare, Kretztechnik, Zipf, Austria). The angle of volume acquisition varied from 45–90º according to placental size. The volume acquisition was obtained in ‘maximum’ quality and its duration was between 10 and 15 s keeping the probe perpendicular to the placental plate. The multiplanar technique was applied and after the entire volume was scanned, the 3 orthogonal ultrasonographic sections were analyzed and stored on a removable hard disk. The longest view of the placenta on the A plane of the 3 orthogonal ultrasonographic sections was chosen as the reference image. The same pre-established instrument settings were used in all the cases (power 96%; frequency low; quality normal, density 6, ensemble 16; balance 150; filter 2; smooth 3/5; pulse repetition frequency 0.9 kHz, gain -0.2). Each image was recovered from the disk in succession for processing. The stored volumes were further analyzed using the virtual organ computer-aided analysis (VOCAL) program pertaining to the computer software 4D VIEW (GE Medical Systems, Austria, version 10.4) , which consists of outlining the contour of the placenta repeatedly after rotating its image 6 times by 30°, with careful attention to exclude decidua and maternal vessels. After the complete rotation was finished, the placental volume was automatically calculated by the software. For each patient, placental volumes were measured 3 times by a specifically trained sonographer.
3-D volume is constituted of small units of volume-„voxels”. Voxels contain all the information about grey and color intensity scale ranging from 0 to 100. According to these values, three power Doppler indices suitable for evaluating vessels and blood flow can be derived from this measurement system. These 3-DPD indices are utilized to assess placental perfusion, and it has been accepted that these indices potentially reflect to both uteroplacental and fetoplacental blood flow.
The vascularization index (VI), which refers to the color voxel/total voxel ratio, measures the number of color voxels in the studied volume and represents the blood vessels within the volume of interest, and expresses it as a percentage (vascularity). The flow index (FI) is the average color value of all the color voxels and it shows the average blood flow intensity from 0 to 100 (no unit). The vascularization flow index (VFI), which refers to the weighted color voxel/total voxel ratio, combines the information on vessel presence (vascularity) and amount of blood cells transported (no unit). The value is 0-100. The VOCAL program calculates automatically the indices (VI, FI, VFI) from the acquired samples.
4.3. RT-PCR Studies
Total RNA Preparation from Tissue
Total cellular RNA was isolated by extraction with guanidinium thiocyanate-acid-phenol-chloroform according to the procedure of Chomczynski and Sacchi [29]. After precipitation with isopropanol, the RNA was washed with 75% ethanol and then resuspended in diethylpyrocarbonate treated water. RNA purity was controlled at an optical density of 260/280 nm with BioSpec Nano (Shimadzu, Japan); all samples exhibited an absorbance ratio in the range of 1.6-2.0. RNA quality and integrity were assessed by agarose gel electrophoresis.
4.4. Real-Time Quantitative Reverse Transcription-PCR (RT-PCR)
Reverse transcription and amplification of the PCR products were performed by using the TaqMan RNA-to-CT-Step One Kit (Thermo Fisher Scientific, Hungary) and an ABI StepOne Real-Time cycler. Reverse- transcriptase PCR amplifications were performed as follows: at 48 °C for 15 min and at 95 °C for 10 min, followed by 40 cycles at 95 ° C for 15 sec and at 60 °C for 1 min. The generation of specific PCR products was confirmed by melting curve analysis. The following primers were used: assay ID Rn00562837_m1 for the Aqp5 water channel and Rn00667869_m1 for β-actin as endogenous control (Thermo Fisher Scientific, Hungary). All samples were run in triplicate. The fluorescence intensities of the probes were plotted against the PCR cycle number. The amplification cycle displaying the first significant increase in the fluorescence signal was defined as the threshold cycle (CT).
4.5. Western Blot Analysis
25 μg of protein per well was subjected to electrophoresis on 4-12% NuPAGE Bis-Tris Gel in XCell SureLock Mini-Cell Units (Thermo Fisher Scientific). Proteins were transferred from gels to nitrocellulose membranes using the iBlot Gel Transfer System (Thermo Fisher Scientific). Antibody binding was detected with the WesternBreeze Chromogenic Western blot immunodetection kit (Thermo Fisher Scientific, Hungary). The blots were incubated on a shaker with AQP5 (cat. no AB-15858, 1:200, Sigma-Aldrich) and β-actin (cat. no bs-0061R, 1:200, Bioss Antibody) polyclonal antibody in the blocking buffer. Images were captured with the EDAS290 imaging system (Kodak Ltd., Hungary), and the optical density of each immunoreactive band was determined with Kodak 1D Images analysis software. Optical densities were calculated as arbitrary units after local area background subtraction.
4.6. Total Antioxidant Capacity and ELISA Assay
Following the manufacturers’ recommendations, plasma total antioxidant capacity (T-AOC) and AQP5 concentrationwas measured by colorimetric assay Kit (T-AOC , Elabscience, USA) and ELISA assay kit (AQP5, FineTest, China). All optical density values were measured using a SPECTROStar Nano microplate spectrophotometer (BMG Labtech, Germany).
4.7. Statistical Analysis
Statistical analyzes were performed with the Prism 10.2.1 software (Graphpad Software Inc. San Diego, CA, USA). All data were evaluated with one-way ANOVA-test (Dunett’s post hoc test) or unpaired t-test, and each is presented as the mean ±SEM. Significance was accepted at p<0.05.
Supplementary Materials
The following supporting information can be downloaded at the website of this paper posted on Preprints.org, Pictures of the western blot analysis is attached to the Supplement File.
Author Contributions
Ábel T Altorjay, Zoltan Kozinszky and Bálint Kolcsár collected and prepared the human samples; Kata Kira Kemény participated in the experiments. Eszter Ducza and Andrea Surányi supervised and organized the whole study and manuscript writing as the corresponding author.
Funding
This work was supported by the National Research, Development and Innovation Office, Hungary (grant NKFI-FK19-132499) and “Geza Hetenyi” Grant, University of Szeged [No.:5S 724 (A202)] and by the ÚNKP-23-3 -SZTE-183 New National Excellence Program of the Ministry for Culture and Innovation from the source of the National Research, Development and Innovation Fund.
Conflicts of Interest
The authors declare no conflicts of interest.
References
- Boutari, C.; Mantzoros, C.S. A 2022 Update on the Epidemiology of Obesity and a Call to Action: As Its Twin COVID-19 Pandemic Appears to Be Receding, the Obesity and Dysmetabolism Pandemic Continues to Rage On. Metabolism 2022, 133, 155217. [Google Scholar] [CrossRef] [PubMed]
- Global Nutrition Report. 2022.
- Rurik, I.; Ungvári, T.; Szidor, J.; Torzsa, P.; Móczár, C.; Jancsó, Z.; Sándor, J. Elhízó Magyarország. A túlsúly és az elhízás trendje és prevalenciája Magyarországon, 2015. Orvosi Hetilap 2016, 157, 1248–1255. [Google Scholar] [CrossRef] [PubMed]
- Schiavone, M.J.; Pérez, M.P.; Aquieri, A.; Nosetto, D.; Pronotti, M.V.; Mazzei, M.; Kudrle, C.; Avaca, H. The Role of Obesity in the Development of Preeclampsia. Curr Hypertens Rep 2024. [Google Scholar] [CrossRef] [PubMed]
- Racusin, D.; Stevens, B.; Campbell, G.; Aagaard, K.M. Obesity and the Risk and Detection of Fetal Malformations. Seminars in Perinatology 2012, 36, 213–221. [Google Scholar] [CrossRef] [PubMed]
- da Silva, I.V.; Soveral, G. Aquaporins in Obesity. In Aquaporins; Yang, B., Ed.; Advances in Experimental Medicine and Biology; Springer Nature Singapore: Singapore, 2023; ISBN 978-981-19741-4-4. [Google Scholar]
- Madeira, A.; Mósca, A.F.; Moura, T.F.; Soveral, G. Aquaporin-5 Is Expressed in Adipocytes with Implications in Adipose Differentiation. IUBMB Life 2015, 67, 54–60. [Google Scholar] [CrossRef]
- Verkman, A.S.; Yang, B.; Song, Y.; Manley, G.T.; Ma, T. Role of Water Channels in Fluid Transport Studied by Phenotype Analysis of Aquaporin Knockout Mice. Experimental Physiology 2000, 85. [Google Scholar] [CrossRef] [PubMed]
- da Silva, I.V.; Whalen, C.A.; Mattie, F.J.; Florindo, C.; Huang, N.K.; Heil, S.G.; Neuberger, T.; Ross, A.C.; Soveral, G.; Castro, R. An Atherogenic Diet Disturbs Aquaporin 5 Expression in Liver and Adipocyte Tissues of Apolipoprotein E-Deficient Mice: New Insights into an Old Model of Experimental Atherosclerosis. Biomedicines 2021, 9, 150. [Google Scholar] [CrossRef]
- Ducza, E.; Seres, A.B.; Hajagos-Tóth, J.; Falkay, G.; Gáspár, R. Oxytocin Regulates the Expression of Aquaporin 5 in the Late-pregnant Rat Uterus. Molecular Reproduction Devel 2014, 81, 524–530. [Google Scholar] [CrossRef]
- Csányi, A.; Bóta, J.; Falkay, G.; Gáspár, R.; Ducza, E. The Effects of Female Sexual Hormones on the Expression of Aquaporin 5 in the Late-Pregnant Rat Uterus. IJMS 2016, 17, 1300. [Google Scholar] [CrossRef]
- Seres-Bokor, A.; Kemény, K.K.; Taherigorji, H.; Schaffer, A.; Kothencz, A.; Gáspár, R.; Ducza, E. The Effect of Citral on Aquaporin 5 and Trpv4 Expressions and Uterine Contraction in Rat—An Alternative Mechanism. Life 2021, 11, 897. [Google Scholar] [CrossRef]
- Dubil, E.A.; Magann, E.F. Amniotic Fluid as a Vital Sign for Fetal Wellbeing. Australas J Ultrason Med 2013, 16, 62–70. [Google Scholar] [CrossRef]
- Ducza, E.; Csányi, A.; Gáspár, R. Aquaporins during Pregnancy: Their Function and Significance. IJMS 2017, 18, 2593. [Google Scholar] [CrossRef]
- Escobar, J.; Gormaz, M.; Arduini, A.; Gosens, K.; Martinez, A.; Perales, A.; Escrig, R.; Tormos, E.; Roselló, M.; Orellana, C.; et al. Expression of Aquaporins Early in Human Pregnancy. Early Human Development 2012, 88, 589–594. [Google Scholar] [CrossRef] [PubMed]
- Központi Statisztikai Hivatal Central Statistical Office H. KSH Database 22.1.1.7. Live Births by Mother’s and Born Infant’s Characteristics 1980–2023. 2024.
- Bellver, J. BMI and Miscarriage after IVF. Current Opinion in Obstetrics & Gynecology 2022, 34, 114–121. [Google Scholar] [CrossRef]
- Cai, H.; Mol, B.; Gordts, S.; Wang, H.; Wang, T.; Li, N.; Shi, J. Early and Late Pregnancy Loss in Women with Polycystic Ovary Syndrome Undergoing IVF/ICSI Treatment: A Retrospective Cohort Analysis of 21 820 Pregnancies. BJOG 2021, 128, 1160–1169. [Google Scholar] [CrossRef] [PubMed]
- Romanski, P.A.; Bortoletto, P.; Magaoay, B.; Chung, A.; Rosenwaks, Z.; Spandorfer, S.D. Live Birth Outcomes in Infertile Patients with Class III and Class IV Obesity Following Fresh Embryo Transfer. J Assist Reprod Genet 2021, 38, 347–355. [Google Scholar] [CrossRef]
- Krane, C.M.; Fortner, C.N.; Hand, A.R.; McGraw, D.W.; Lorenz, J.N.; Wert, S.E.; Towne, J.E.; Paul, R.J.; Whitsett, J.A.; Menon, A.G. Aquaporin 5-Deficient Mouse Lungs Are Hyperresponsive to Cholinergic Stimulation. Proc. Natl. Acad. Sci. U.S.A. 2001, 98, 14114–14119. [Google Scholar] [CrossRef]
- Yu, C.-J.; Cui, X.-Y.; Lu, L.; Yang, J.; Chen, B.; Zhu, C.-W.; Gao, X. Effects of Glucocorticoid on the Expression and Regulation of Aquaporin 5 in the Paranasal Sinus of Rats with Chronic Rhinosinusitis. Experimental and Therapeutic Medicine 2017, 13, 1753–1756. [Google Scholar] [CrossRef]
- Mom, R.; Réty, S.; Auguin, D. Cortisol Interaction with Aquaporin-2 Modulates Its Water Permeability: Perspectives for Non-Genomic Effects of Corticosteroids. IJMS 2023, 24, 1499. [Google Scholar] [CrossRef]
- D’Agostino, C.; Parisis, D.; Chivasso, C.; Hajiabbas, M.; Soyfoo, M.S.; Delporte, C. Aquaporin-5 Dynamic Regulation. IJMS 2023, 24, 1889. [Google Scholar] [CrossRef]
- Romero, R.; Nicolaides, K.H.; Conde-Agudelo, A.; O’Brien, J.M.; Cetingoz, E.; Da Fonseca, E.; Creasy, G.W.; Hassan, S.S. Vaginal Progesterone Decreases Preterm Birth ≤ 34 Weeks of Gestation in Women with a Singleton Pregnancy and a Short Cervix: An Updated Meta-analysis Including Data from the OPPTIMUM Study. Ultrasound Obstet Gynecol 2016, 48, 308–317. [Google Scholar] [CrossRef] [PubMed]
- Carlson, N.S.; Hernandez, T.L.; Hurt, K.J. Parturition Dysfunction in Obesity: Time to Target the Pathobiology. Reprod Biol Endocrinol 2015, 13, 135. [Google Scholar] [CrossRef] [PubMed]
- Kaya, S.; Keskin, H.L.; Kaya, B.; Ustuner, I.; Avsar, A.F. Reduced Total Antioxidant Status in Postterm Pregnancies. Hippokratia 2013, 17, 55–59. [Google Scholar] [PubMed]
- Keaney, J.F.; Larson, M.G.; Vasan, R.S.; Wilson, P.W.F.; Lipinska, I.; Corey, D.; Massaro, J.M.; Sutherland, P.; Vita, J.A.; Benjamin, E.J. Obesity and Systemic Oxidative Stress: Clinical Correlates of Oxidative Stress in The Framingham Study. ATVB 2003, 23, 434–439. [Google Scholar] [CrossRef] [PubMed]
- Chrysohoou, C.; Panagiotakos, D.B.; Pitsavos, C.; Skoumas, I.; Papademetriou, L.; Economou, M.; Stefanadis, C. The Implication of Obesity on Total Antioxidant Capacity in Apparently Healthy Men and Women: The ATTICA Study. Nutrition, Metabolism and Cardiovascular Diseases 2007, 17, 590–597. [Google Scholar] [CrossRef]
- Chomzynski, P. Single-Step Method of RNA Isolation by Acid Guanidinium Thiocyanate–Phenol–Chloroform Extraction. Analytical Biochemistry 1987, 162, 156–159. [Google Scholar] [CrossRef]
Figure 1.
Determination of placental volume by VOCAL program.
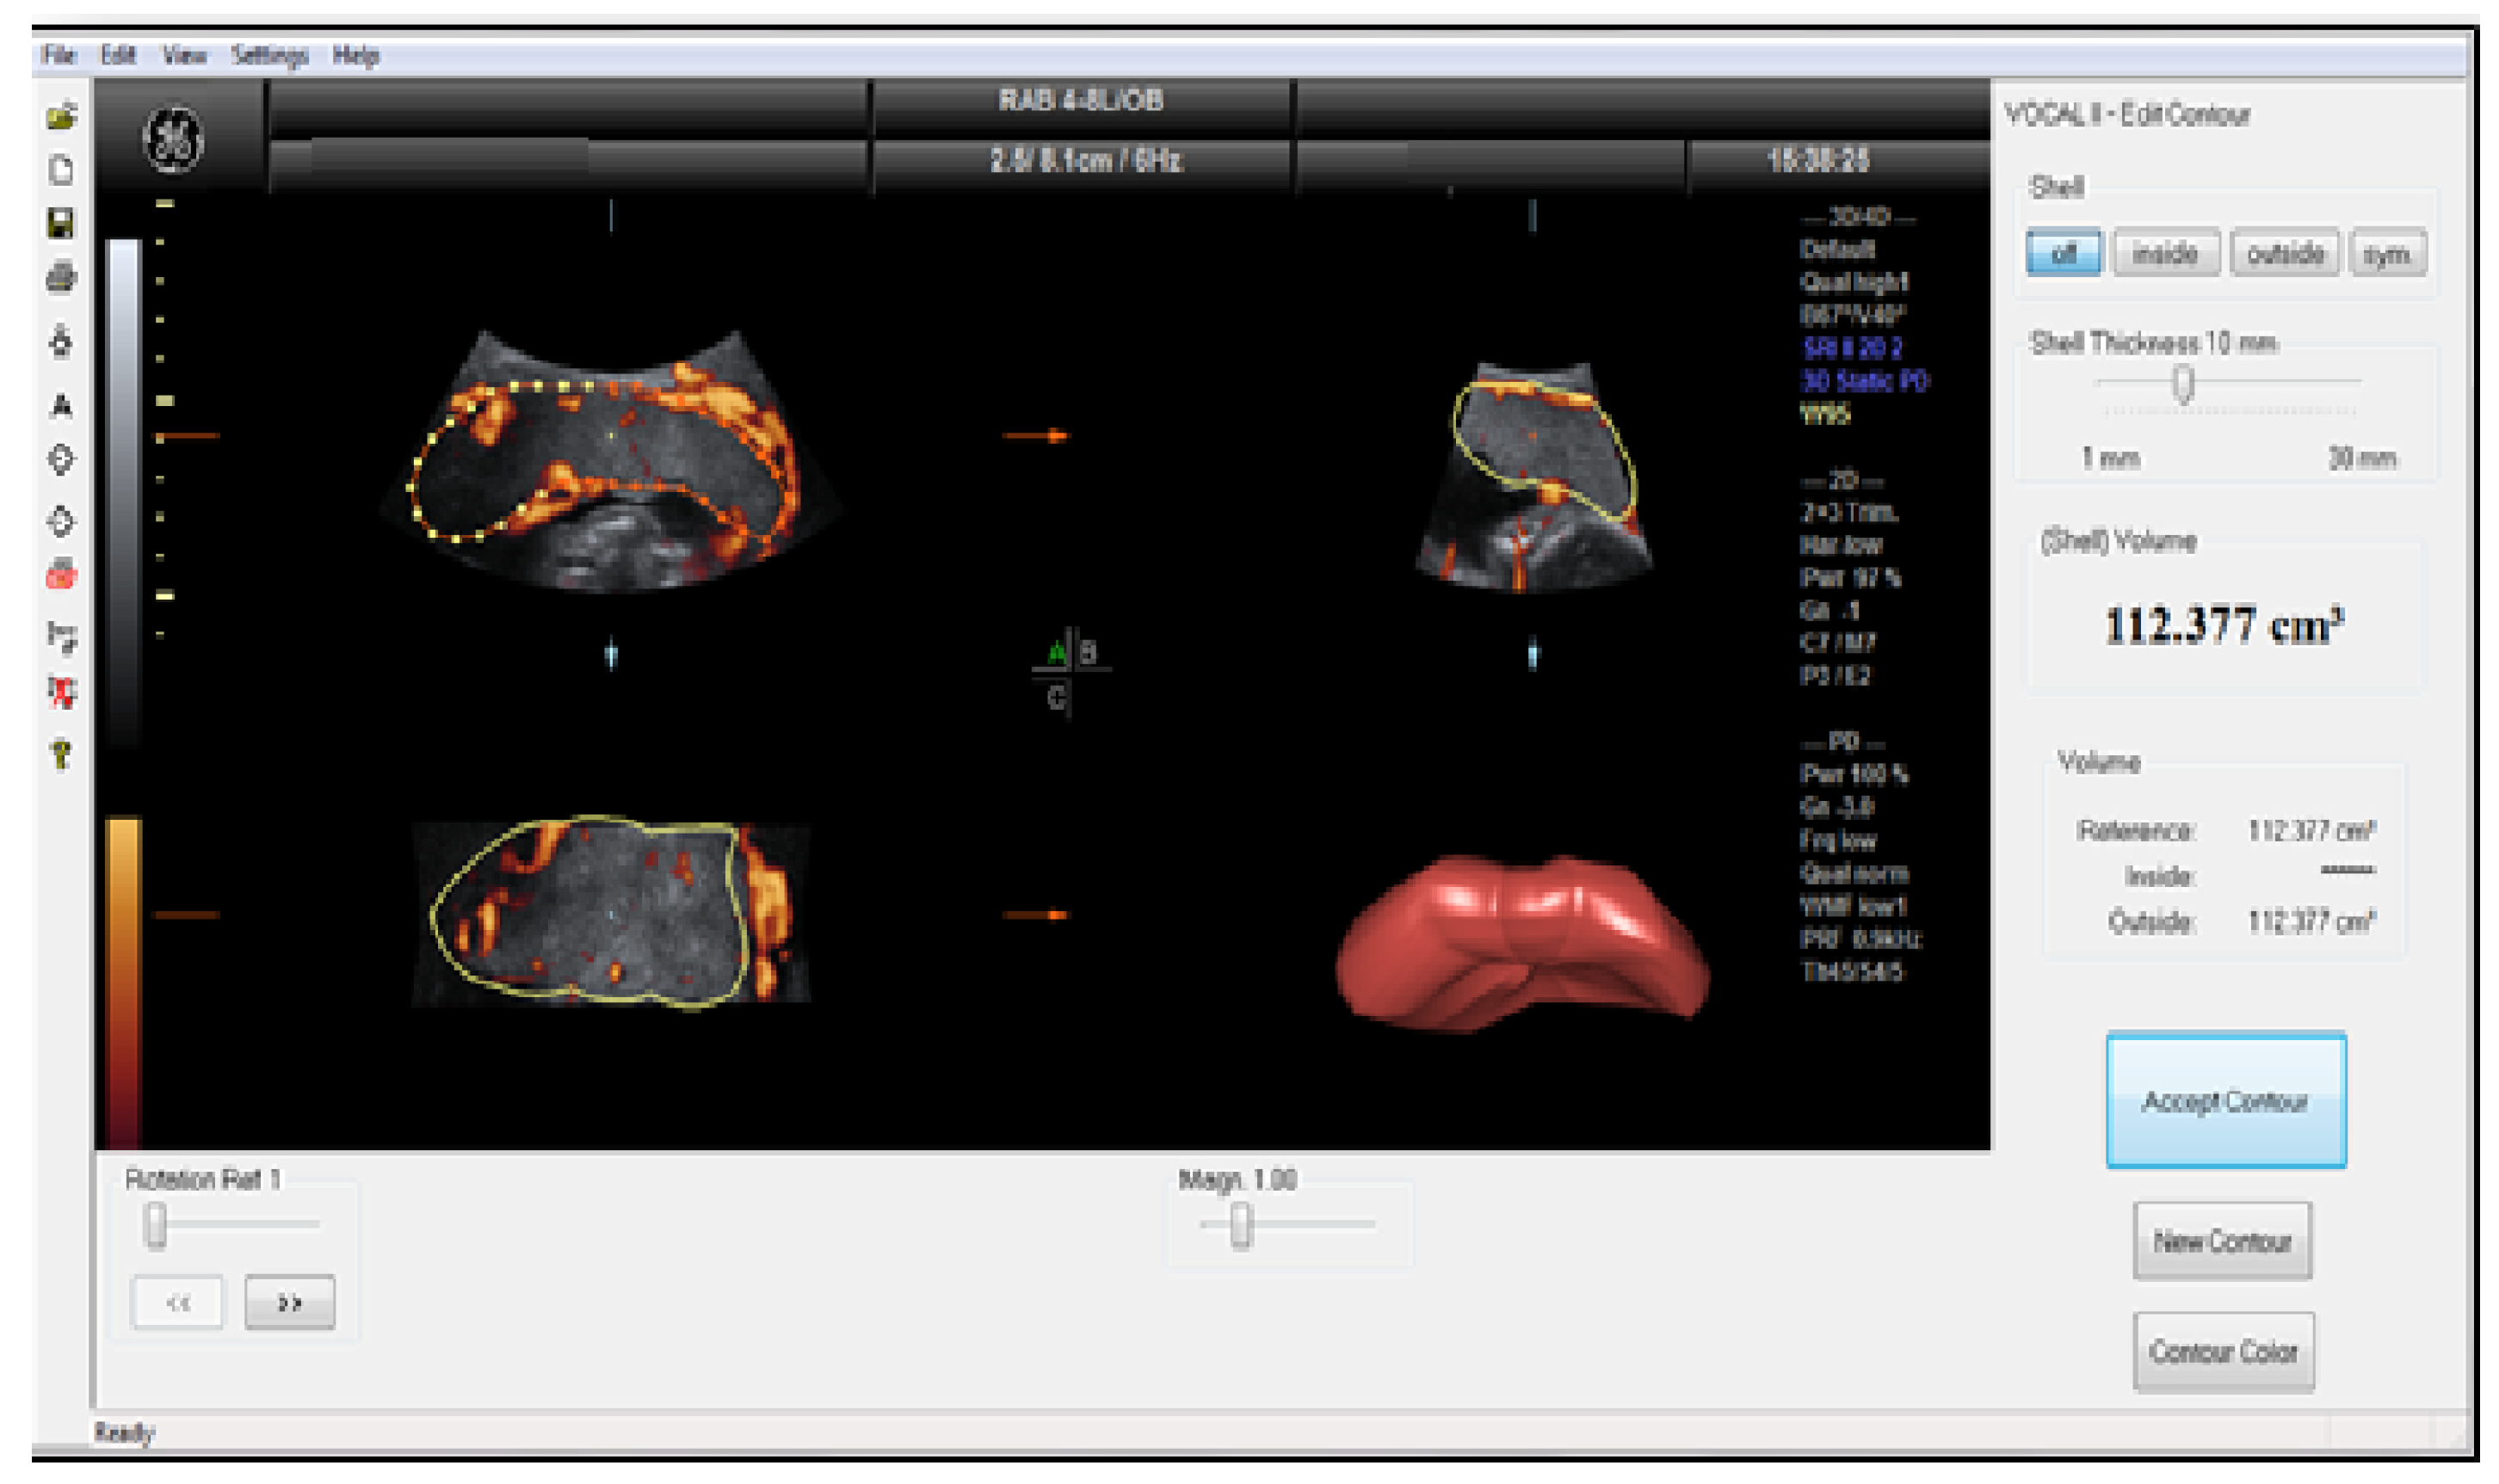
Figure 2.
The VOCAL program shows the results of the histogram analysis of the sphere volume obtained automatically on the screen. The color angio analysis presented VI (vascularisation index), FI (flow index), and VFI (vascularization flow index) values.
Figure 2.
The VOCAL program shows the results of the histogram analysis of the sphere volume obtained automatically on the screen. The color angio analysis presented VI (vascularisation index), FI (flow index), and VFI (vascularization flow index) values.
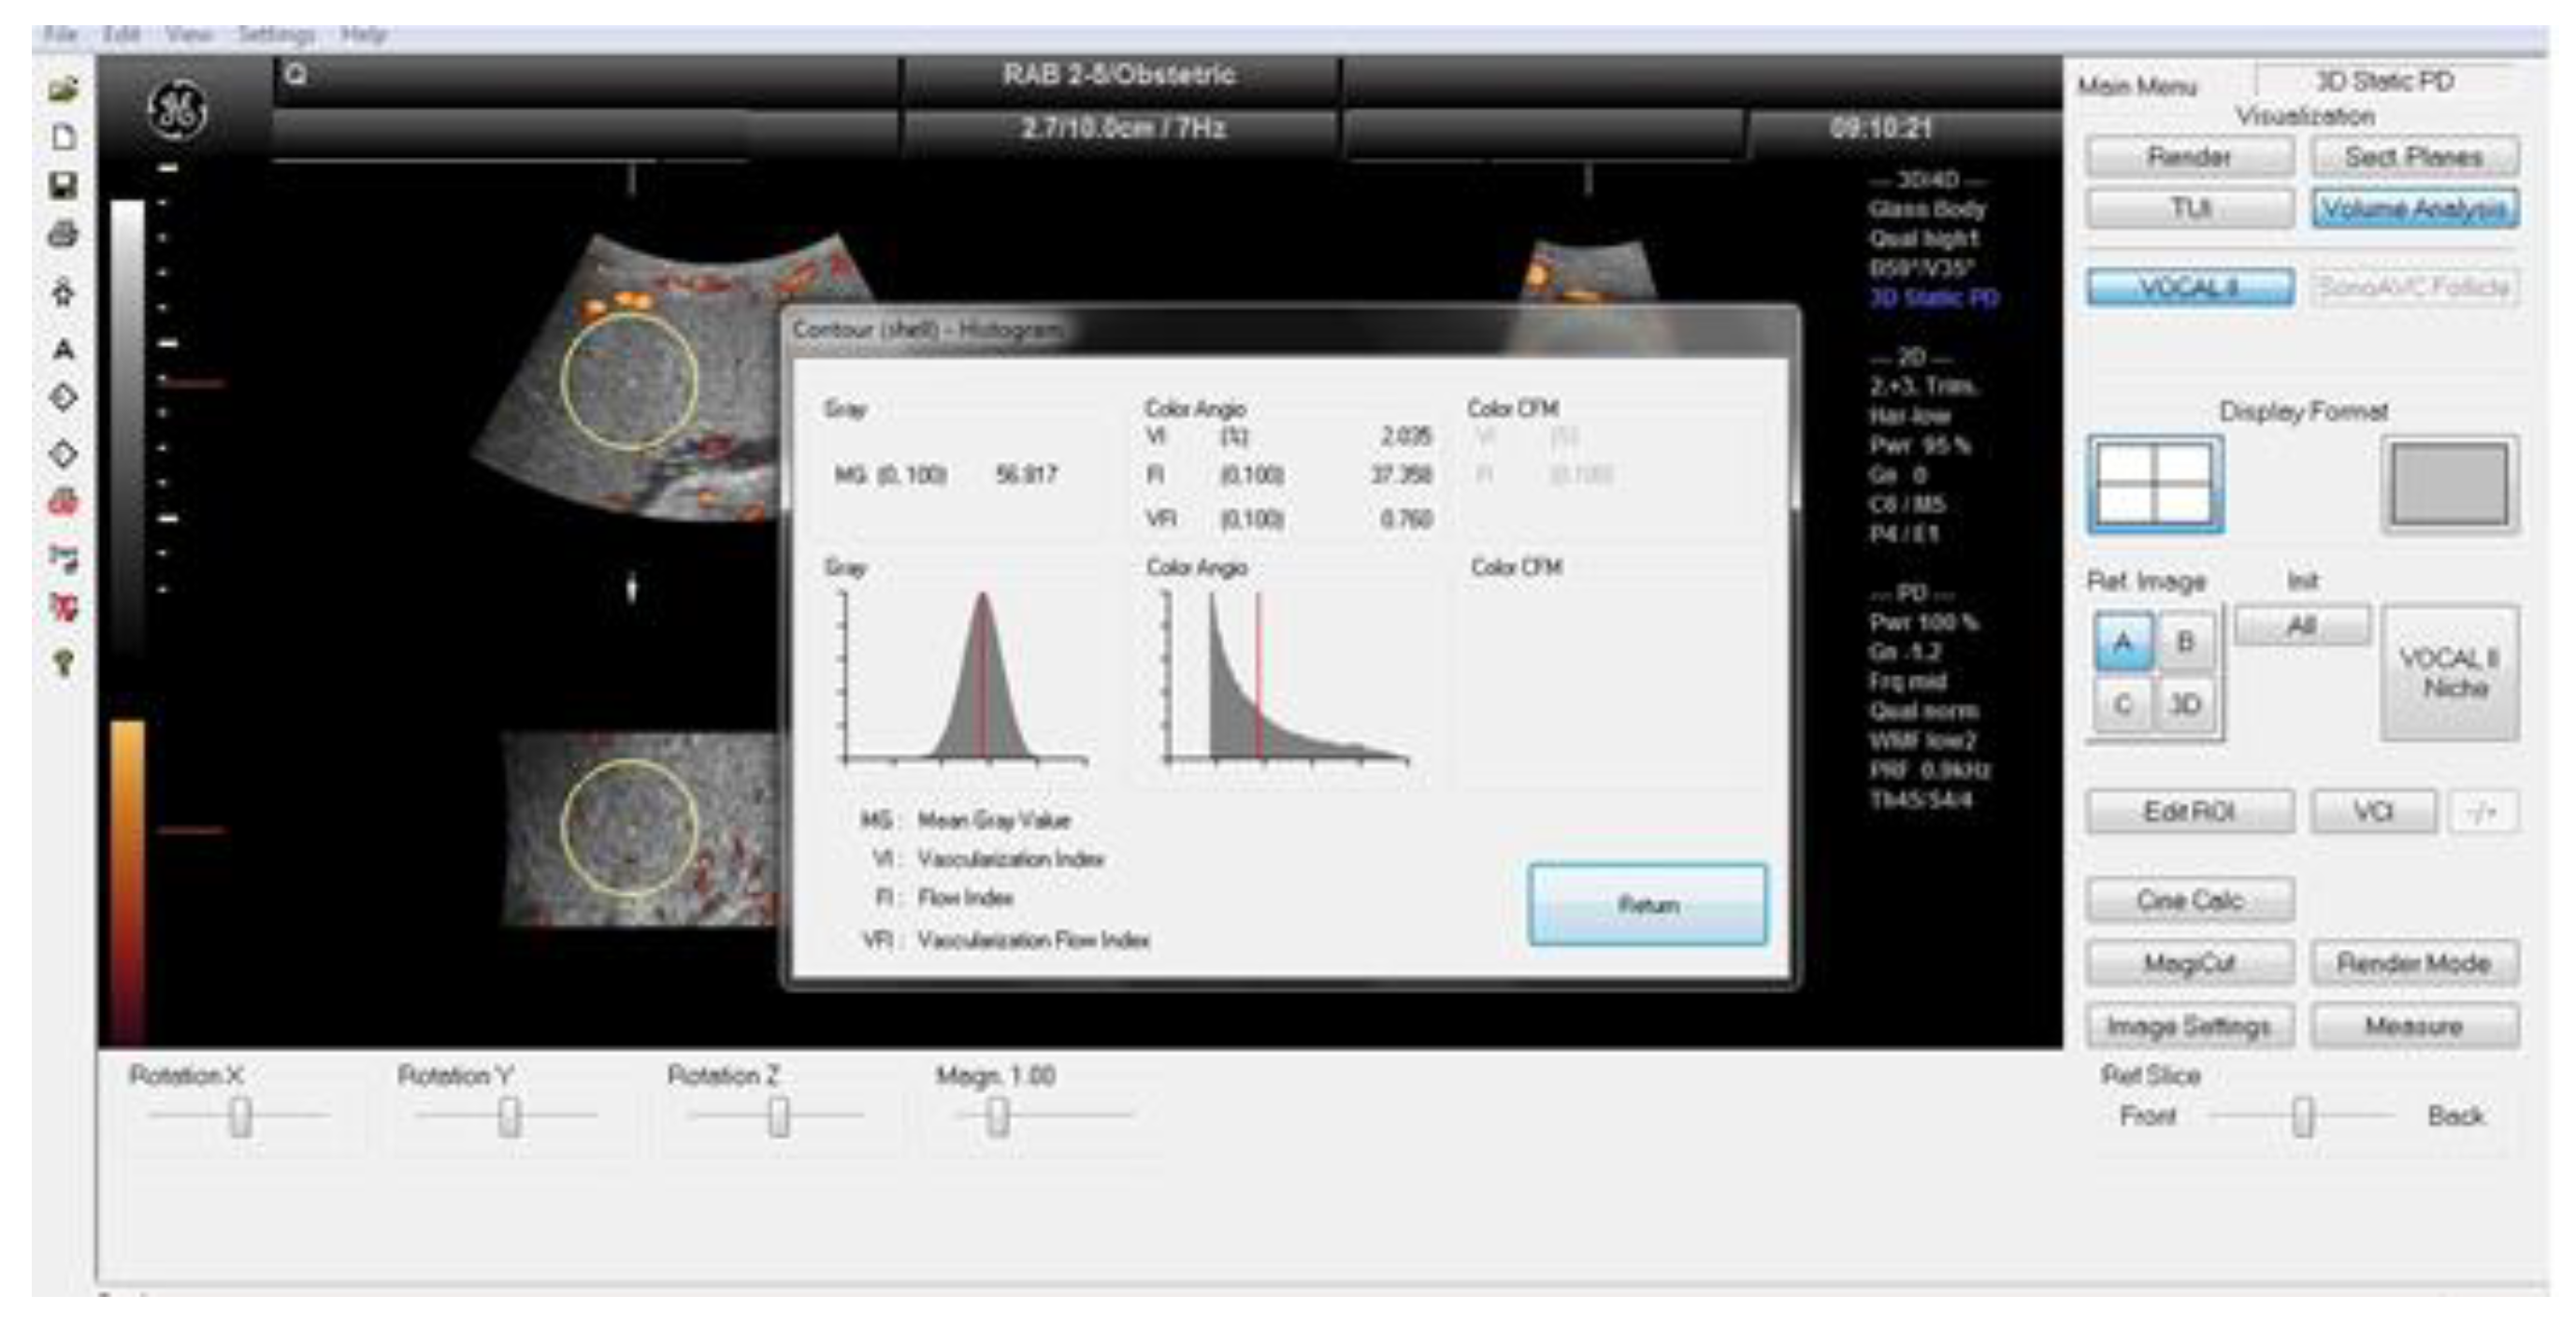
Figure 3.
Changes in the AQP5mRNA (A) and protein (B) expression during different weeks of pregnancy in human uterine samples; ns: p>0.05, * p<0.05, *** p<0.001 compared to the 41st week of pregnancy.
Figure 3.
Changes in the AQP5mRNA (A) and protein (B) expression during different weeks of pregnancy in human uterine samples; ns: p>0.05, * p<0.05, *** p<0.001 compared to the 41st week of pregnancy.
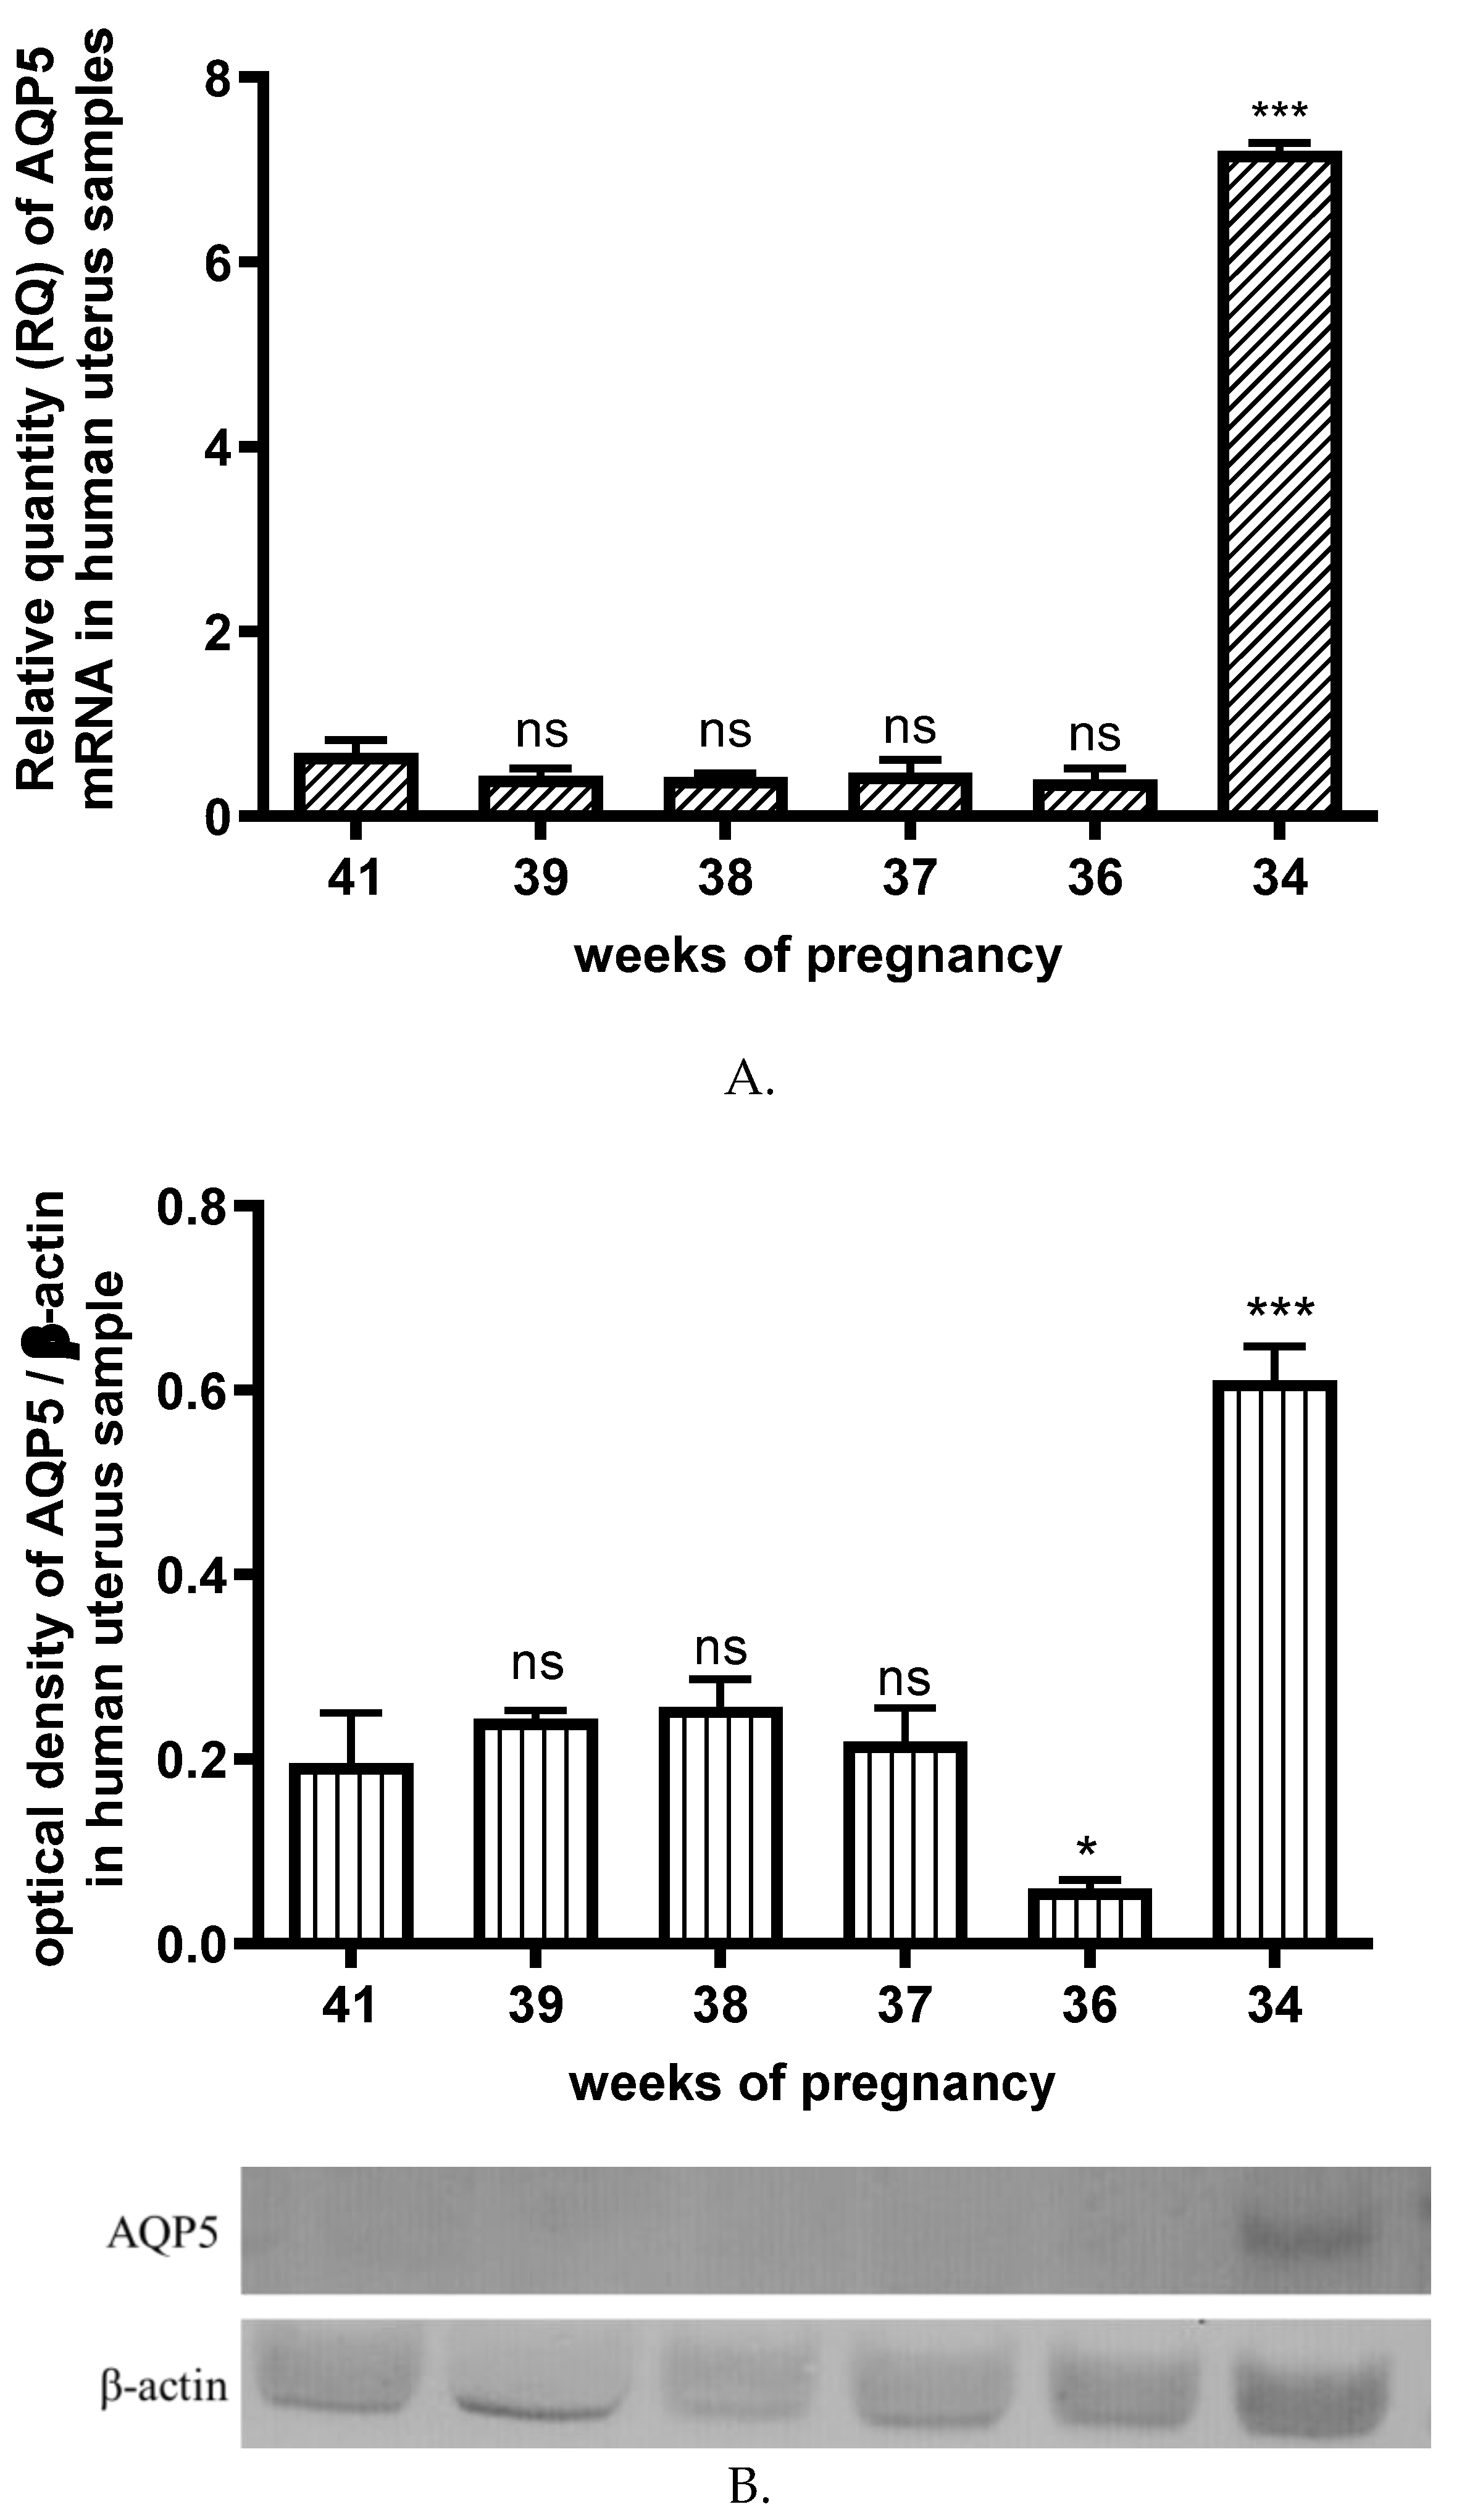
Figure 4.
AQP5 concetration in the different weeks of pregnant and non pregnanat (C) human plasma samples. ns: p> 0.05, **p<0.01 compared to the control.
Figure 4.
AQP5 concetration in the different weeks of pregnant and non pregnanat (C) human plasma samples. ns: p> 0.05, **p<0.01 compared to the control.
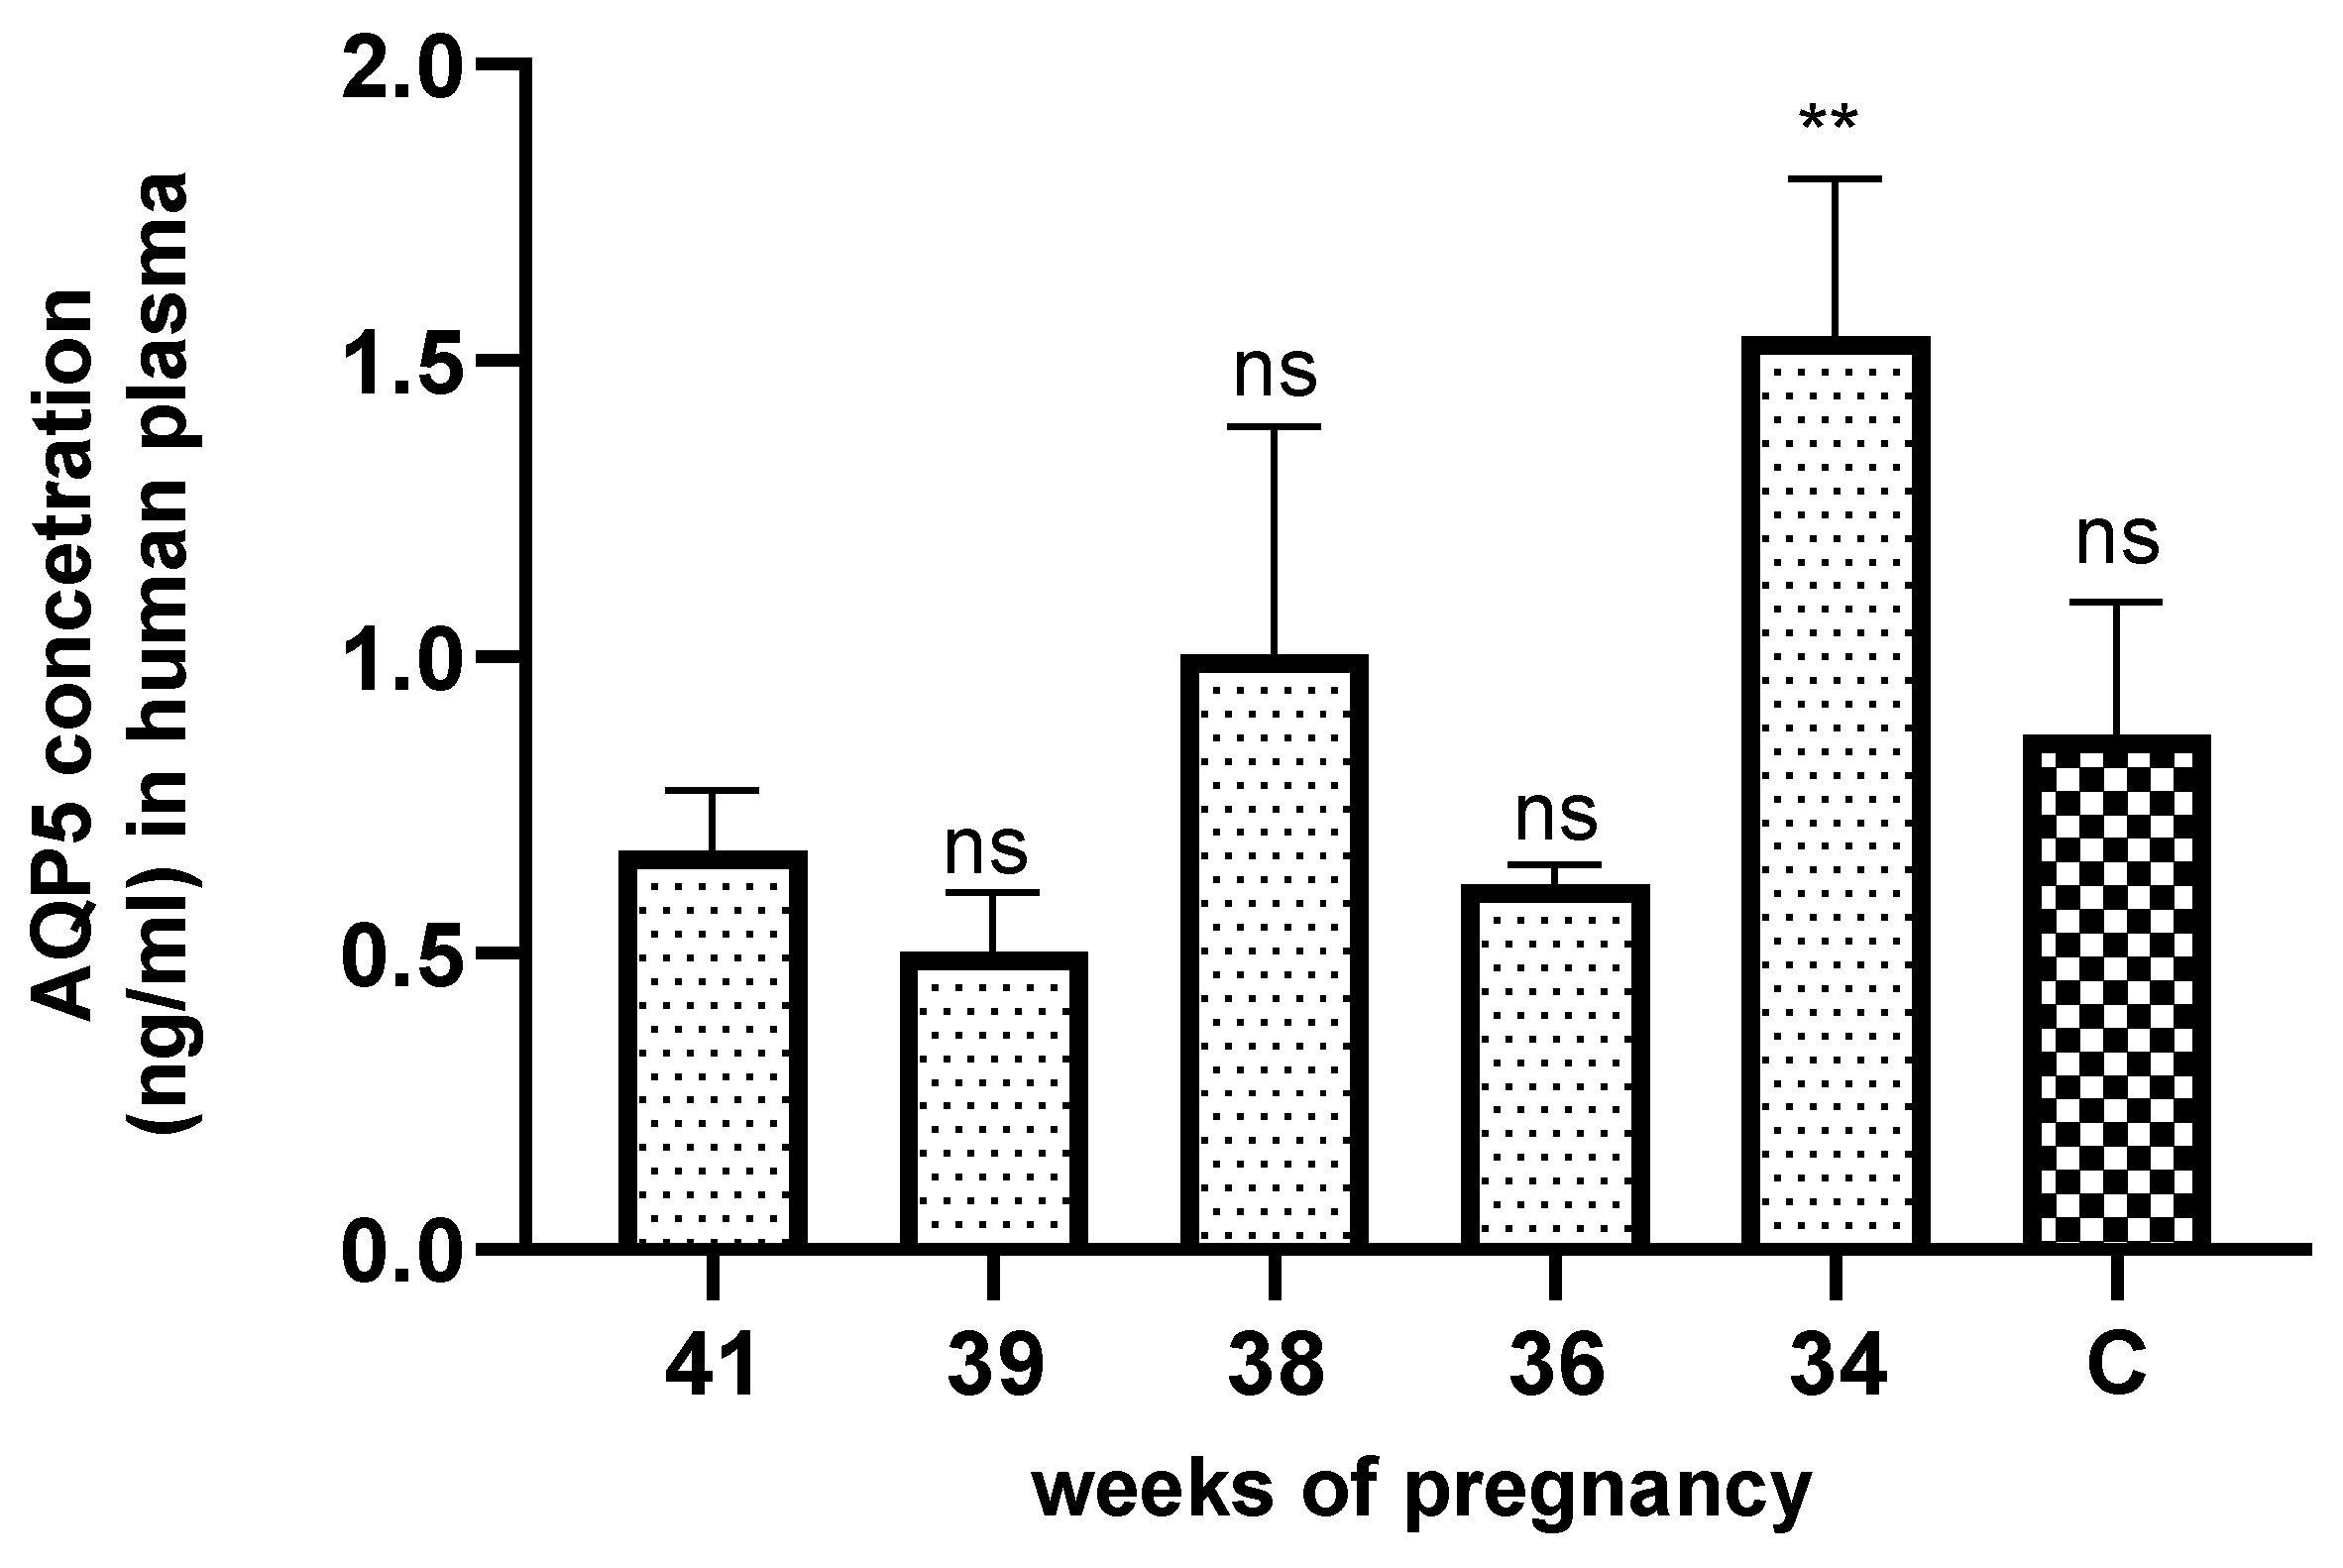
Figure 5.
Changes of AQP5 mRNA (A) and protein (B) expression in uterine samples with normal weight (non-Ob) and obese (Ob) mothers; * p<0.05, ** p<0.01 compared to the control.
Figure 5.
Changes of AQP5 mRNA (A) and protein (B) expression in uterine samples with normal weight (non-Ob) and obese (Ob) mothers; * p<0.05, ** p<0.01 compared to the control.
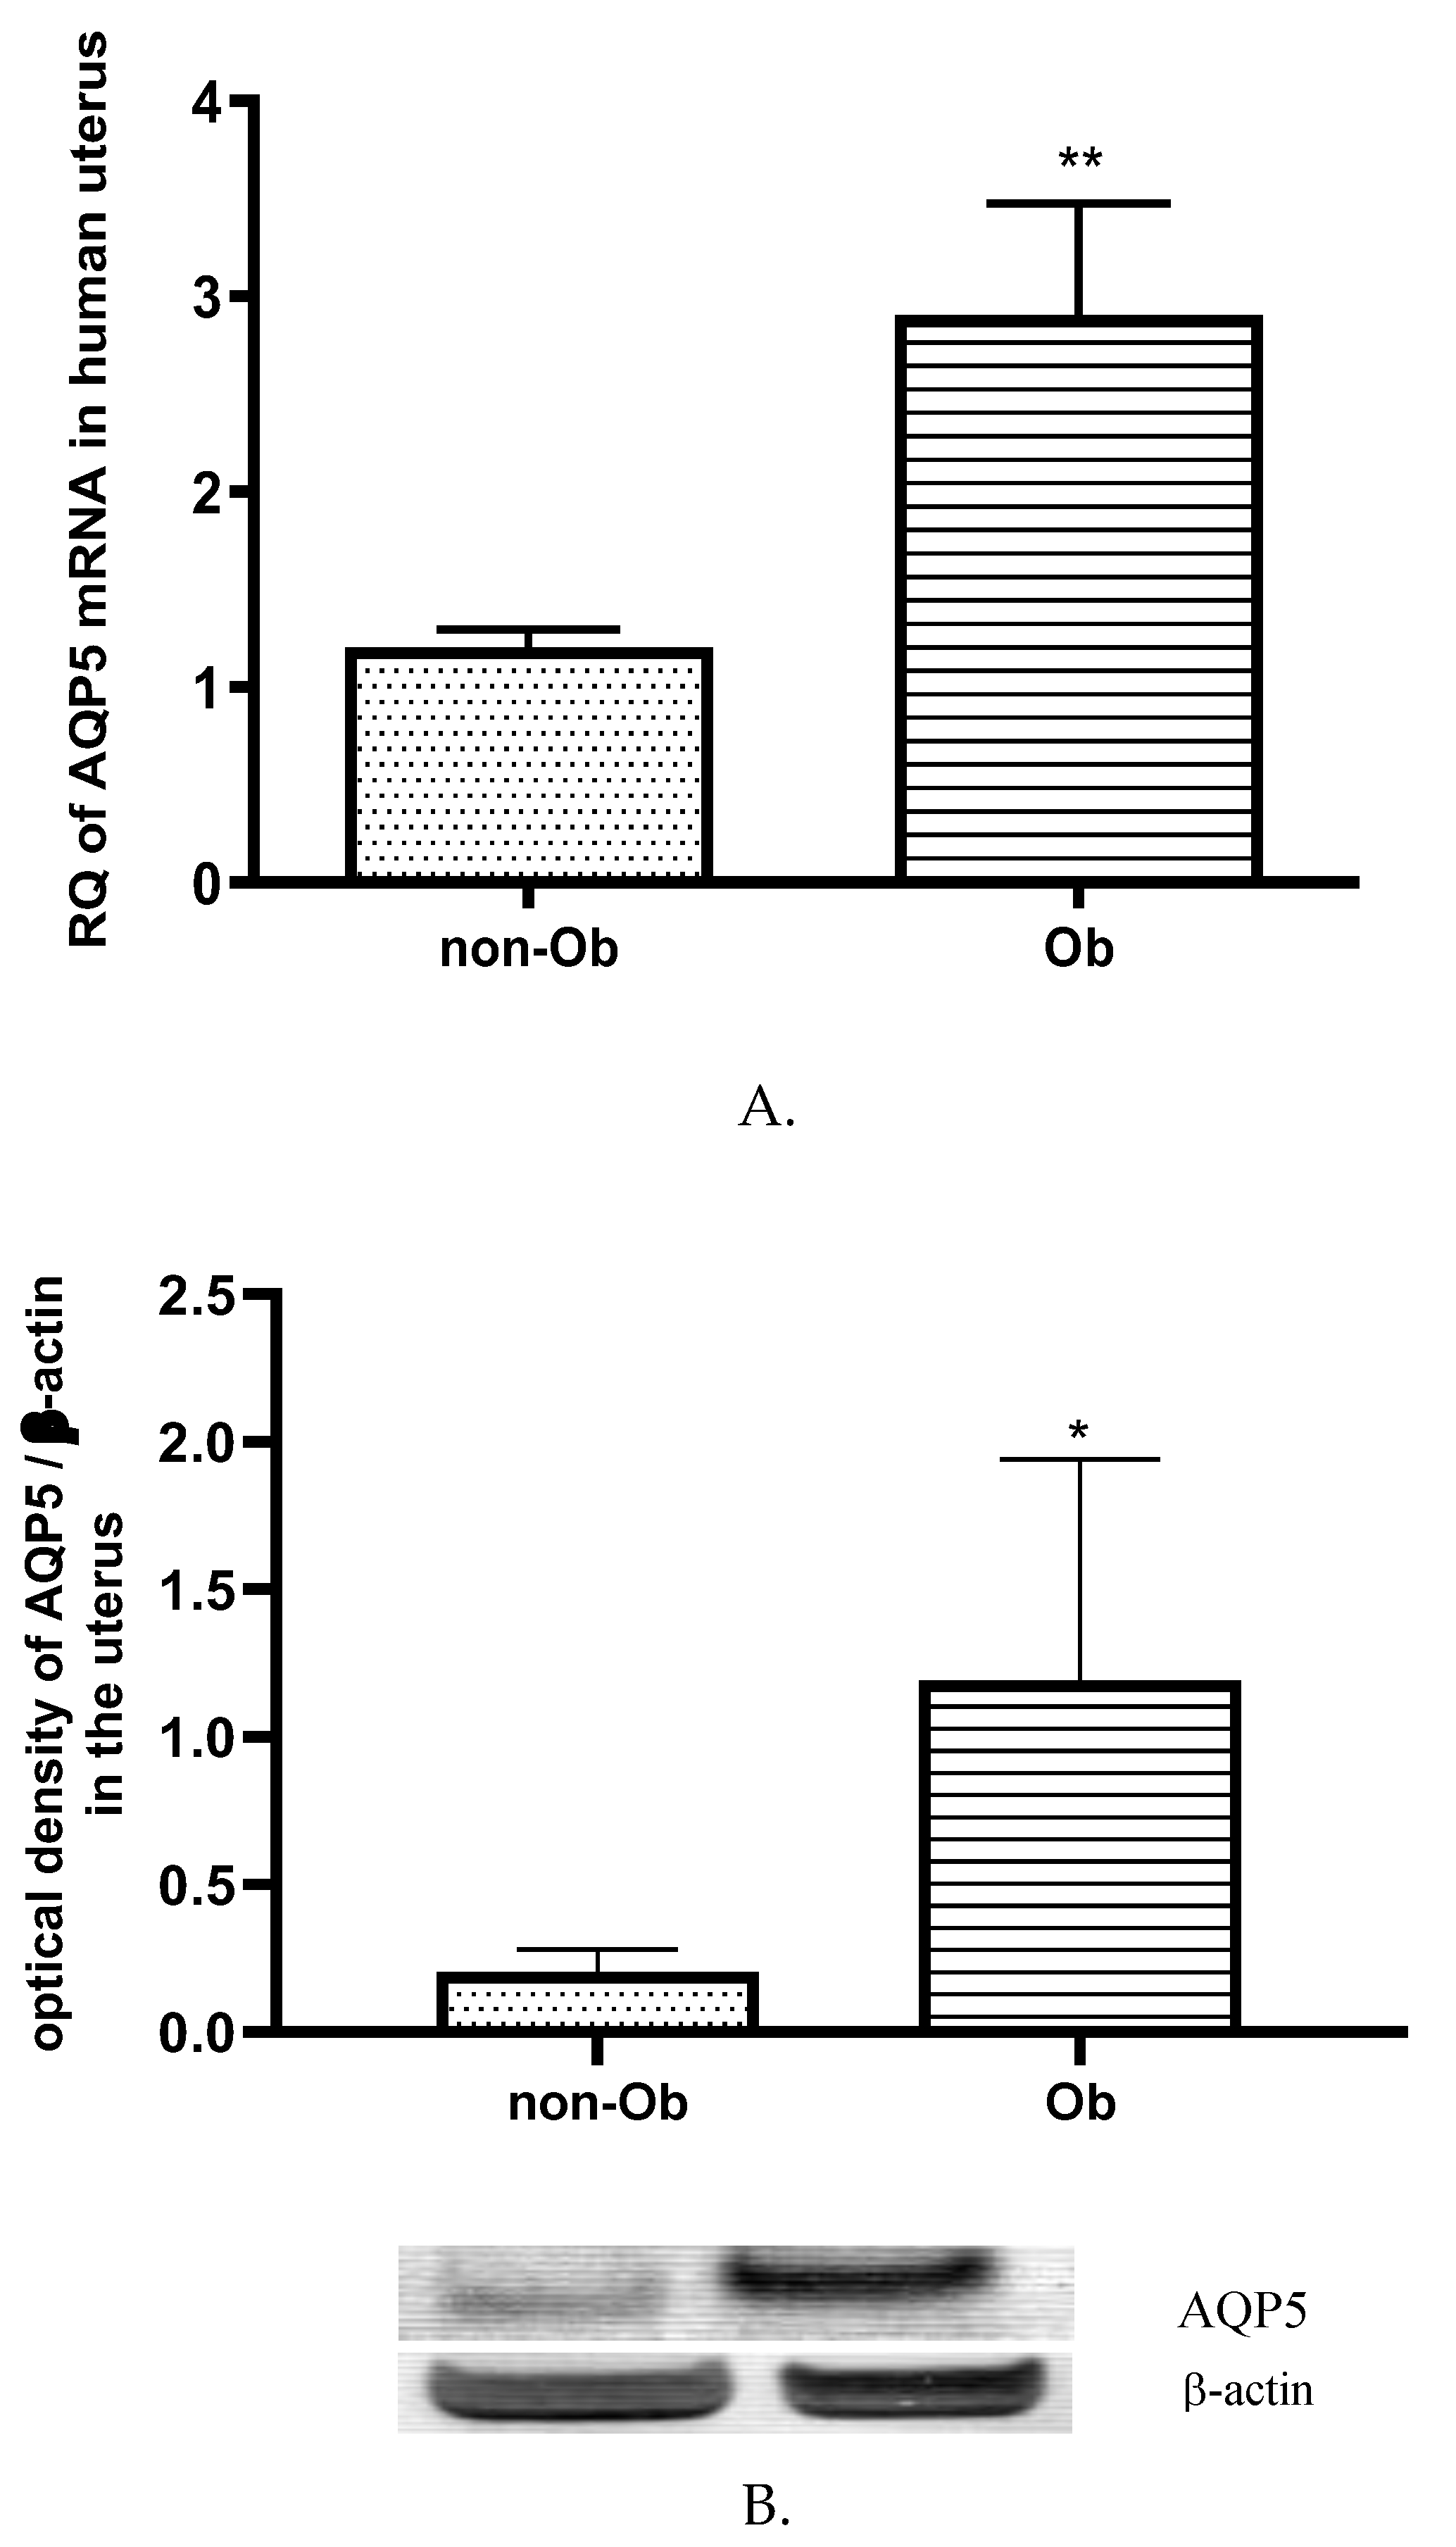
Figure 6.
Changes in the AQP5 mRNA (A) and protein (B) expression in the placental tissue samples collected from obese (Ob) and normal weight mothers (non-Ob); ns p>0.05 compared to the non-obese mothers.
Figure 6.
Changes in the AQP5 mRNA (A) and protein (B) expression in the placental tissue samples collected from obese (Ob) and normal weight mothers (non-Ob); ns p>0.05 compared to the non-obese mothers.
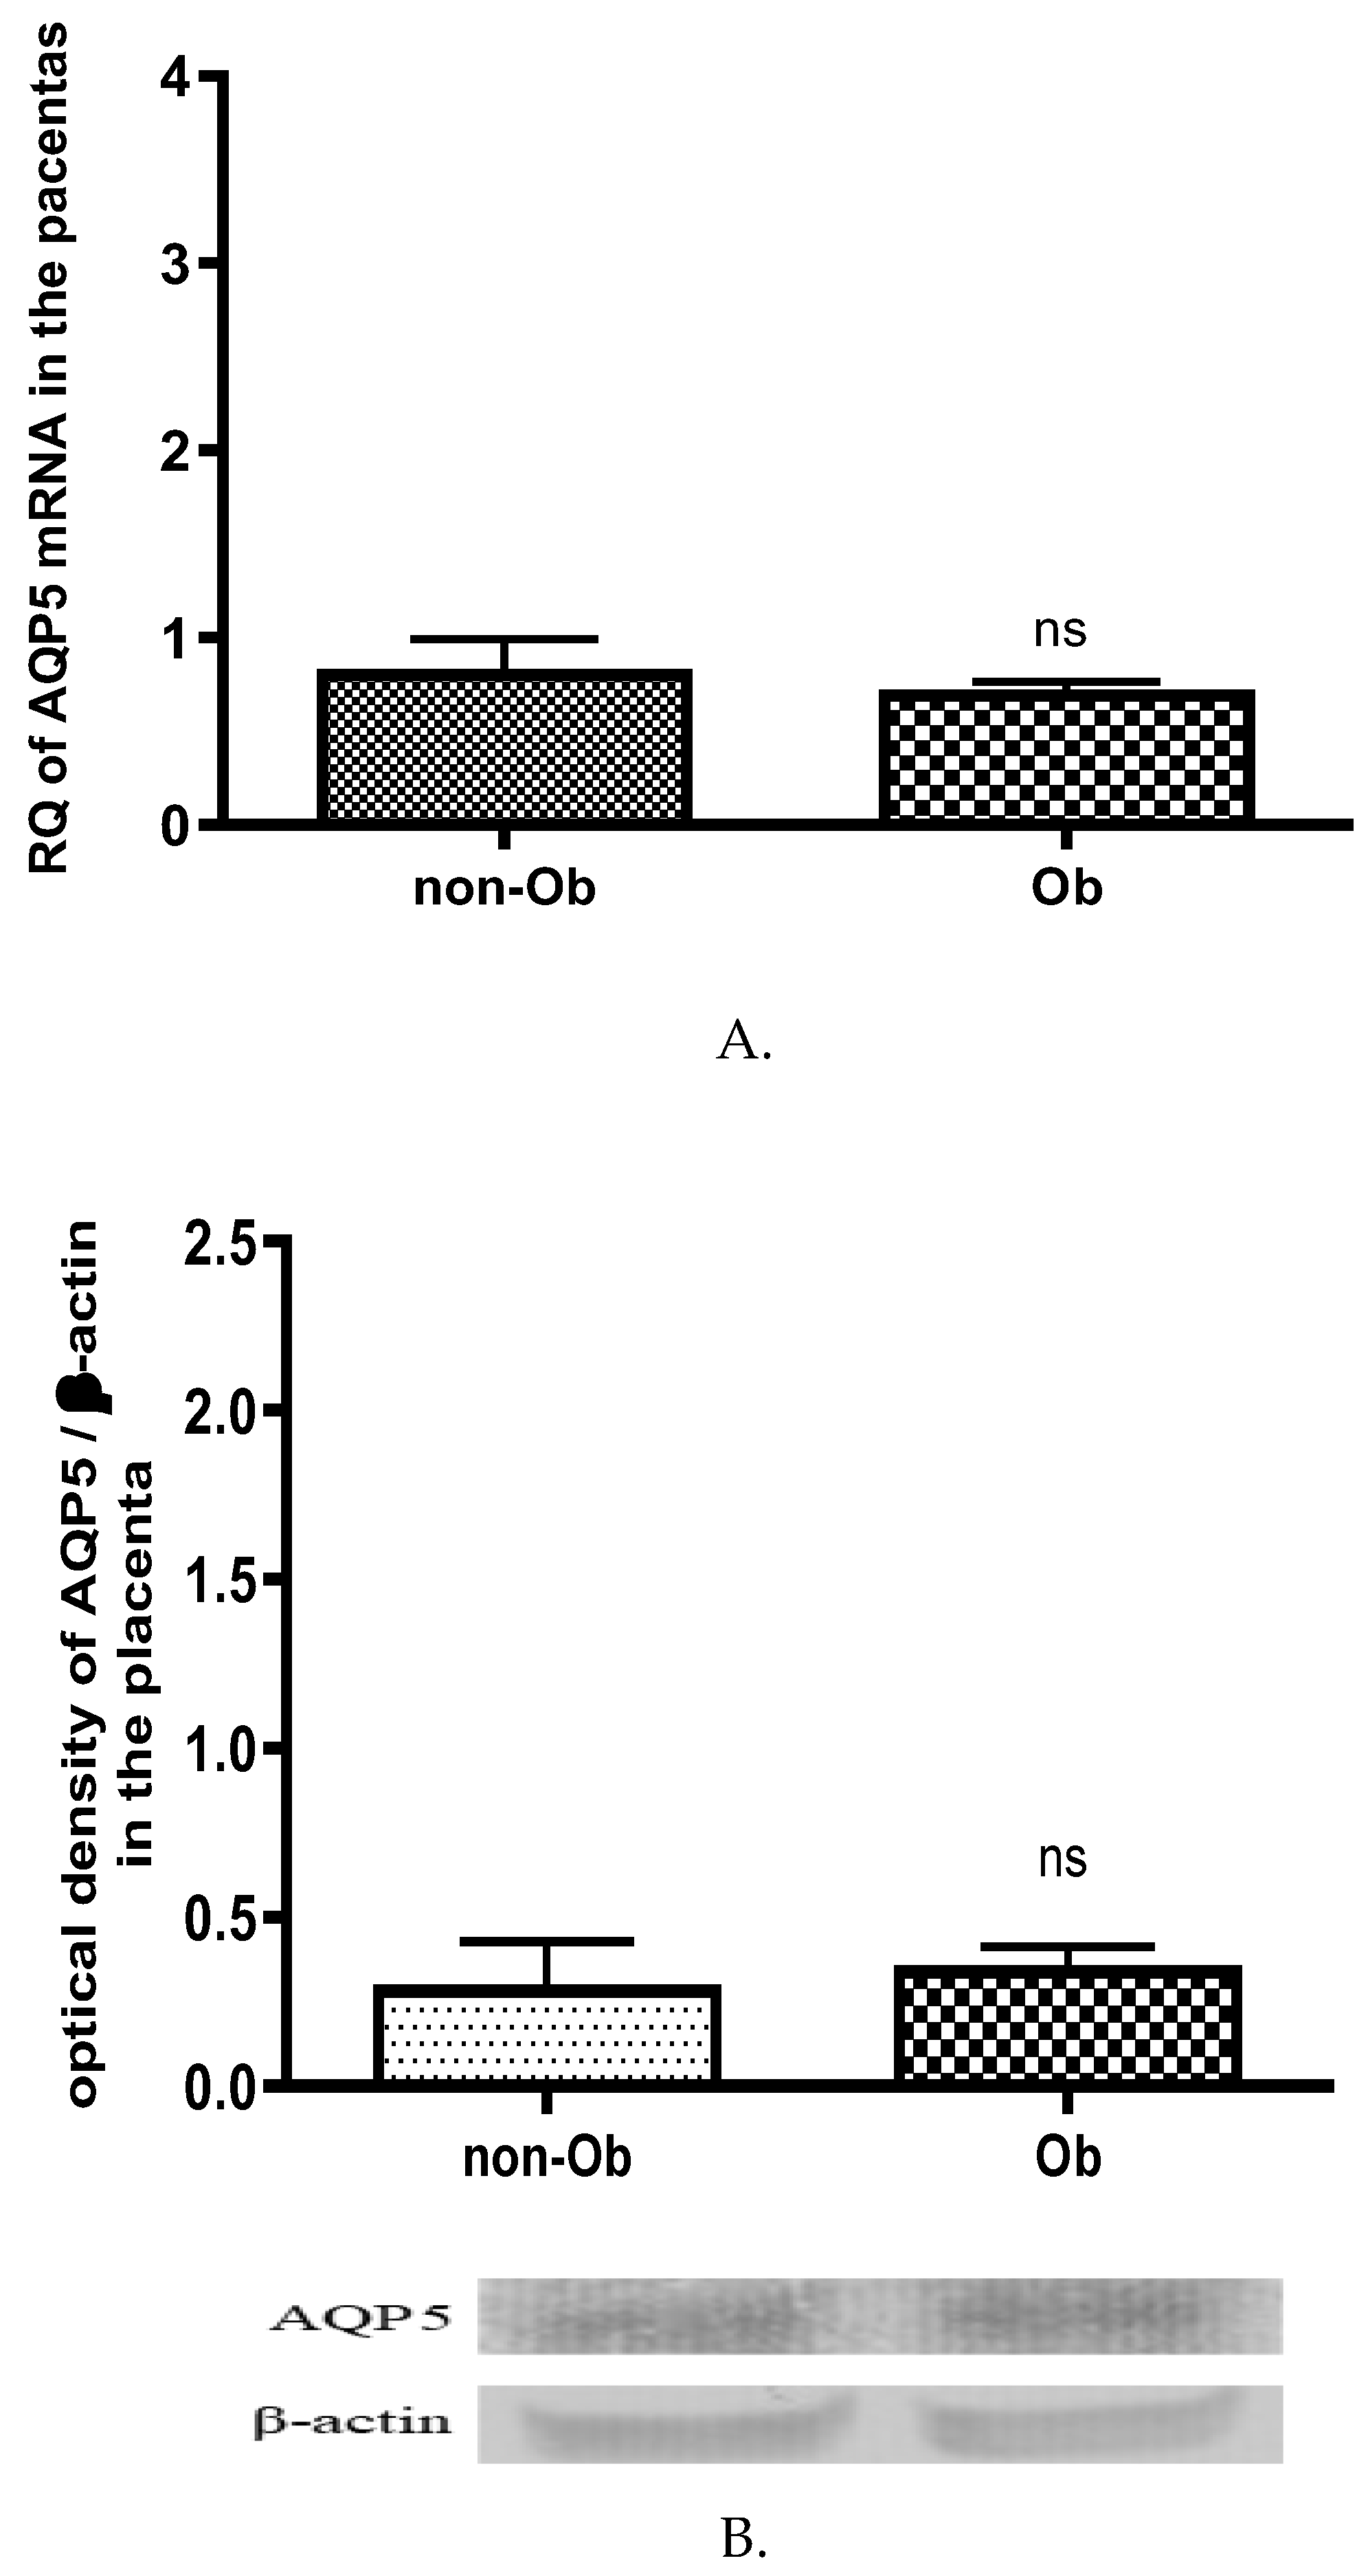
Figure 7.
Change of total antioxidant capacity (TAC) in human plasma in normal weight (non-Ob) and obese (Ob) mothers. * p<0.05, compared to the control (non-Ob) human plasma.
Figure 7.
Change of total antioxidant capacity (TAC) in human plasma in normal weight (non-Ob) and obese (Ob) mothers. * p<0.05, compared to the control (non-Ob) human plasma.
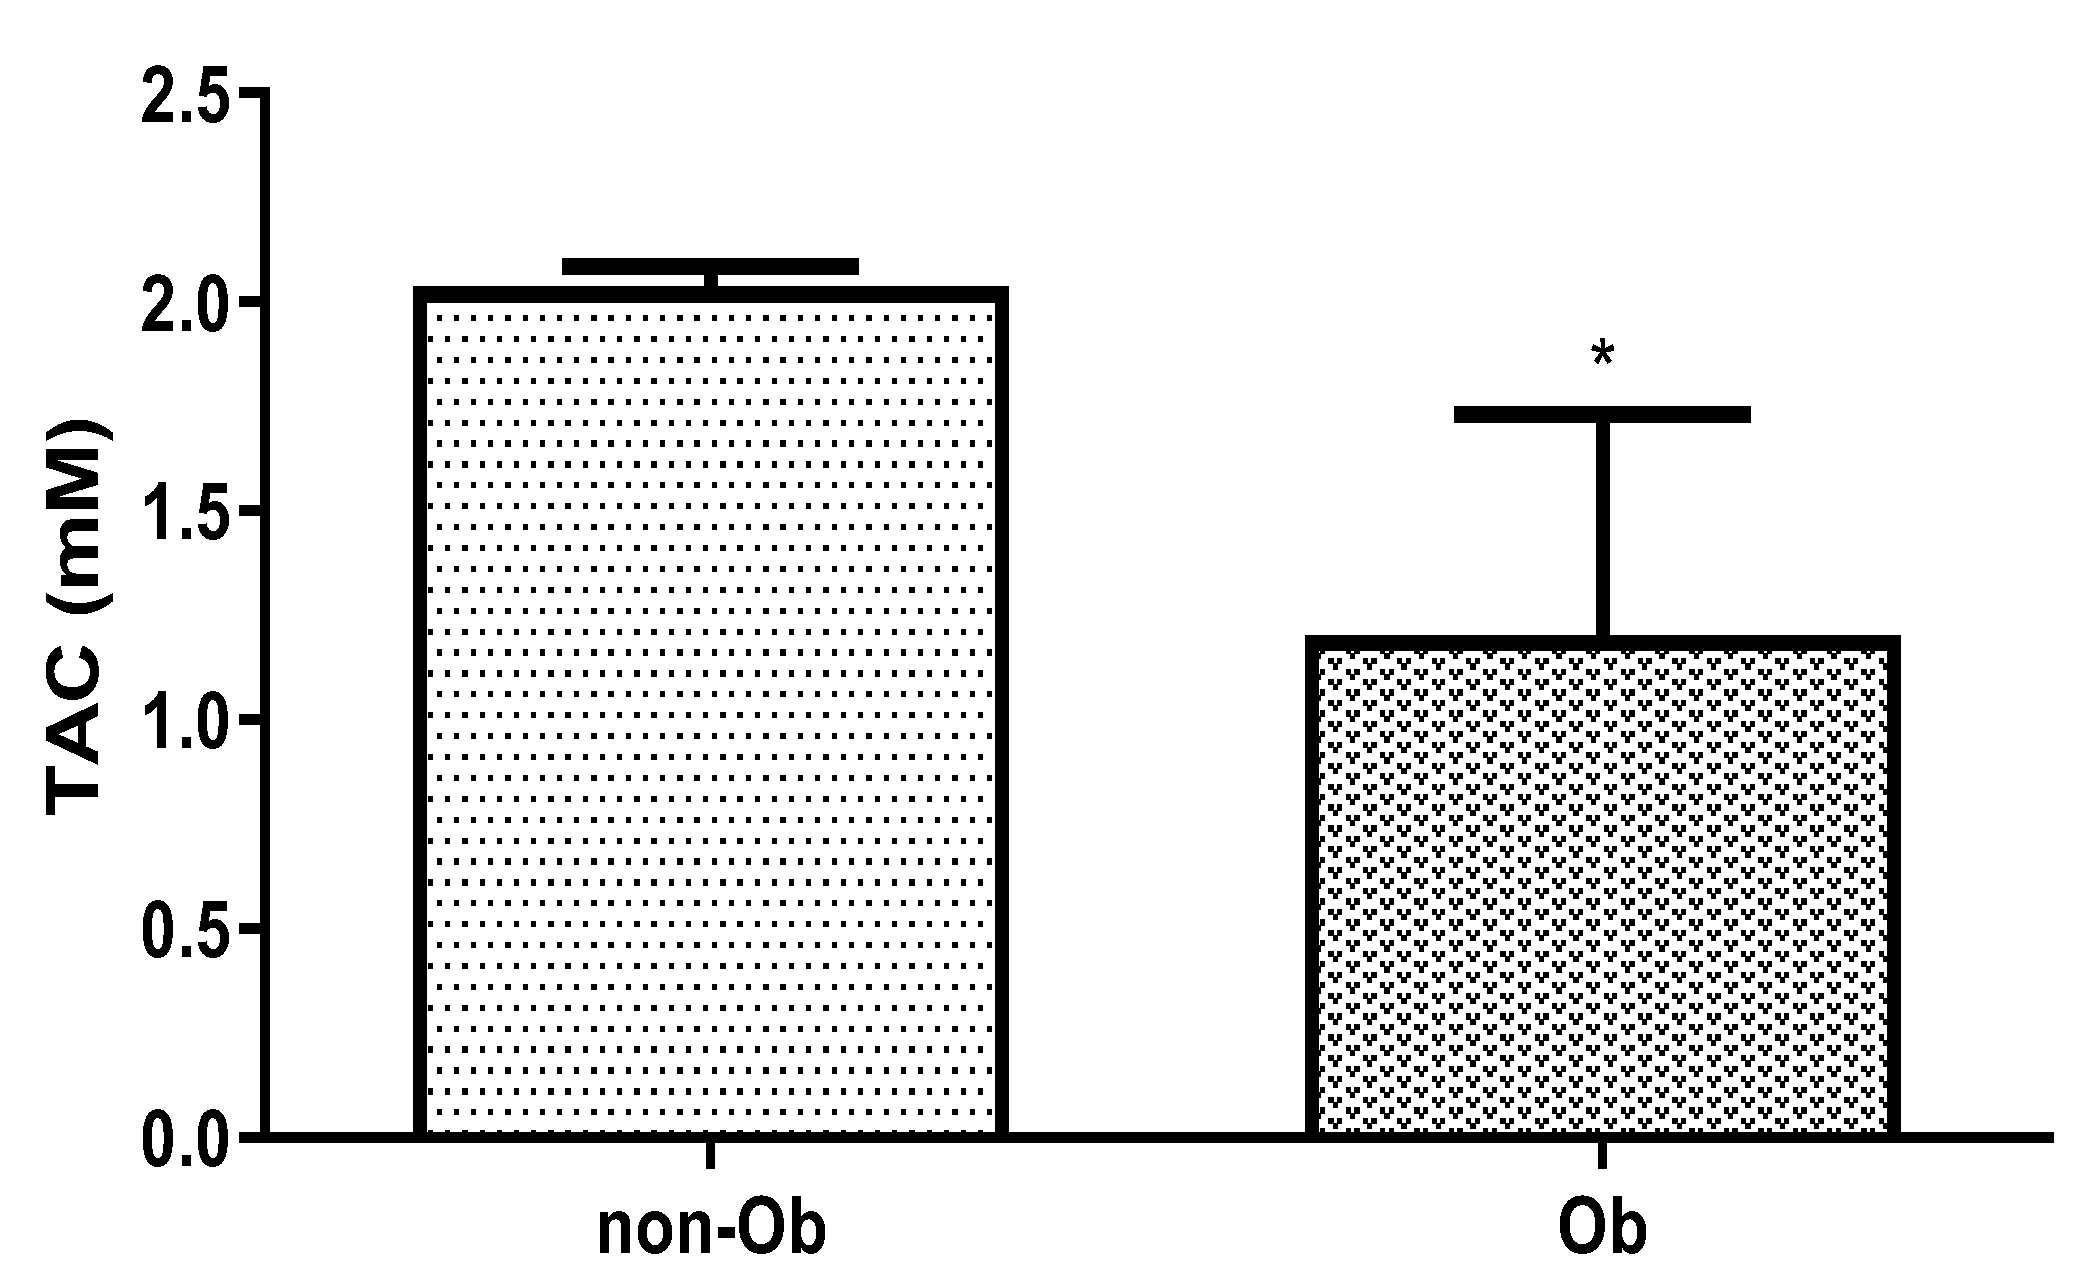

Table 1.
Demographic characteristics of the group normal weighted and obese pregnant women. ns p>0.05, *** p<0.001 compared to normal body weight group.
Table 1.
Demographic characteristics of the group normal weighted and obese pregnant women. ns p>0.05, *** p<0.001 compared to normal body weight group.
| Demographical data | Normal | Obese |
|---|---|---|
| Maternal age (years) (mean ± SD) | 29.44 ± 1,1 | 34.52 ± 5.78 |
| Number of nulliparous women in the study (%) | 32 | 24 |
| BMI at the time of first medical visit (kg/m2) | 22.98 ± 2.90 | 36.17 ± 5.1*** |
| Gestational age at delivery(weeks) | 39.05 ± 1.2 | 39.25 ± 2.3ns |
| Fetal weight at delivery (grams) | 3224.08 ± 243.54 | 3824.08 ± 538.63*** |
Table 2.
The results of placental sonography.
| Placental sonography | Normal | Obese |
|---|---|---|
| Placental volume (ml ± SD) | 527.3 ± 93.1 | 775.6 ± 143.2 *** |
| VI (mean ± SD) | 14.11 ± 5.1 | 8,71 ± 2.4*** |
| FI (mean ± SD) | 44.97 ± 22.64 | 37.4 ± 10.9 * |
| VFI (mean ± SD) | 8.21 ± 3.63 | 4.74 ± 1.34* |
VI: vascularisation index, FI: flow index, and VFI:vascularization flow index. ns p>0.05, * p<0.05, *** p<0.001 compared to pregnant women with normal body weight.
Disclaimer/Publisher’s Note: The statements, opinions and data contained in all publications are solely those of the individual author(s) and contributor(s) and not of MDPI and/or the editor(s). MDPI and/or the editor(s) disclaim responsibility for any injury to people or property resulting from any ideas, methods, instructions or products referred to in the content. |
© 2024 by the authors. Licensee MDPI, Basel, Switzerland. This article is an open access article distributed under the terms and conditions of the Creative Commons Attribution (CC BY) license (http://creativecommons.org/licenses/by/4.0/).
Copyright: This open access article is published under a Creative Commons CC BY 4.0 license, which permit the free download, distribution, and reuse, provided that the author and preprint are cited in any reuse.


