Submitted:
04 July 2024
Posted:
05 July 2024
You are already at the latest version
Abstract
Incidental findings (IFs) depicted in imaging tests during diagnostic evaluation of patients with cleft lip and/or palate (CL/P) can guide clinicians during treatment-planning procedures for effective, comprehensive cleft care. Evidence regarding IFs in different anatomical regions distant from the dentition are scarce. The aim of this study was to compare the prevalence of IFs in various anatomical areas between patients with non-syndromic CL/P and unaffected subjects. Orthopantomographs (OPT), lateral cephalometric (LC) radiographs and cone-beam computed tomography (CBCT) scans of 120 subjects (case group: n = 40, 18 females, age 14.5 ± 5.0 years; control group: n = 80, 36 females, age 14.6 ± 4.9 years) were examined and IFs were assessed by four observers. Significantly higher prevalence of IFs (p < 0.001) was reported in the case group (97.5%) compared with the control group (62.5%). The most prevalent location of IFs in the case group was the maxilla (92.5%), followed by the nasal cavity (75.8%) and the mandible (63.2%), while in the control group, the highest rates of IFs occurred in the maxilla (43.8%), mandible (41.3%) and temporomandibular joint (TMJ) (14.7%). No gender-dependent pattern for IF occurrence was detected overall. Orofacial clefts may affect the mandible. However, the reported IFs were limited compared to those in the maxilla. In conclusion, individuals with CL/P are more likely to present with a range of IFs than their unaffected peers. Understanding the association between CL/P and IFs is critical for successful interdisciplinary treatment, raising awareness of the potential need for future dental care for cleft patients, and managing extra-dental aberrations. A systematic assessment of diagnostic records is required to eliminate the risk of overlooking clinically significant IFs.
Keywords:
cleft lip and palate
; orofacial clefts
; incidental findings
; panoramic radiograph
; cephalometric radiograph
; cone-beam computed tomography
; orthodontics
1. Introduction
1.1. Background
Cleft lip and/or palate (CL/P) is defined as a group of congenital defects that affect the structures surrounding the oral cavity and may extend to the neighboring facial structures, resulting in severe craniofacial deformity [1,2]. CL/P is one of the most common congenital defects affecting the craniofacial structures, with an overall incidence of approximately 1.5 per 1,000 live births (about 220,000 new cases per year) [3]. CL/P is a multifactorial condition, and it has been proven difficult to identify its specific etiologic factors. Since this disease arises in the early stages of embryological development, it appears to result from the interaction of genetic and environmental factors [3,4,5,6]. Mutations in numerous genes, such as Interferon regulatory factor 6 (IRF-6) and Msh homeobox 1 (MSX1) genes, which play a critical role in embryonic development, contribute to the disorder’s complex etiology [4].
Syndromic CL/P is presented in infants with congenital syndromes, such as Pierre Robin, DiGeorge, and Treacher Collins. Most CL/P cases (approximately 70%) are non-syndromic, where CL/P occurs as an isolated entity with no other apparent cognitive or craniofacial structural abnormalities [4]. The internationally accepted incidence of non-syndromic CL/P is 1 in every 1,000 births. This incidence, however, varies according to ethnic background, geographic origin, and socioeconomic status [7]. In general, CL/P cases are not equally distributed by gender. Men are presented with a two times higher incidence of CL/P than women. In contrast, a higher incidence of isolated cleft palate (CP) is reported in women with approximately a 1:2 male-to-female ratio [4].
An incidental finding (IF) is defined as any normal variant, benign or pathological finding randomly discovered and unrelated to the clinical indication by which the imaging test was originally prescribed [8]. Orthodontists request routine imaging tests, which include panoramic radiographs /orthopantomography (OPT) and lateral cephalometric radiographs (LC) for diagnostic and treatment planning purposes. These imaging techniques are two-dimensional (2D) with low radiation doses for orthodontic patients and may reveal abnormalities or pathological findings in structures of the maxillofacial complex [9].
In several cases, IFs might be missed with 2D radiographs, but they can be detected and diagnosed accurately by three-dimensional (3D) images such as cone beam computed tomography (CBCT) [10]. This could also be attributed to the fact that orthodontists and dental clinicians may need to be more experienced with interpreting anatomical structures that are not directly related to their primary area of interest on a radiograph [11]. The guidelines of the European Academy of Dento-MaxilloFacial Radiology (EADMFR) and the American Academy of Oral and Maxillofacial Radiology (AAOMR) outline that every clinician has the moral responsibility to assess the entire volume of radiographic findings, even beyond the diagnostic purpose for which the image was initially ordered. Thus, if a clinician lacks expertise in CBCT interpretation, an appropriate referral is required to an oral and maxillofacial radiologist [12,13].
As the access to and the quality of 3D imaging techniques have been rapidly expanded in the past three decades, reports of IFs are increasing. With a large field of view (FOV), CBCT images encompass a wider anatomical region of the maxillofacial region beyond that of the dentoalveolar complex, which include the paranasal sinuses, airway, middle ear cavity, temporomandibular joint (TMJ) relationships, intracranial and cranial base structures, and other head and cervical spine structures [14,15]. Research has shown that IFs are identified in 6% to 43% of orthodontic patients randomly selected in various clinical sites when conventional 2D radiographs are evaluated [8,16,17,18]. It is, therefore, reasonable that this percentage may be higher when 3D images are analyzed, given the greater volume of data presented in a large FOV CBCT scan. Published research articles have demonstrated that the frequency of IFs observed in CBCT scans ranges from 25% to 94% [15,19,20,21,22,23,24].
In CL/P cases, OPT, LC radiographs, and CBCT scans are usually obtained in the early stages of treatment to evaluate the implications of soft and hard tissues and the extent of the alveolar bone defect. Therefore, any detail or IF depicted in these imaging tests can immensely contribute to appropriate planning for alveolar bone grafting procedures, orthognathic surgery, and comprehensive orthodontic treatment [25].
According to a recent systematic review and meta-analysis [26], individuals with orofacial clefts are more likely to present a variety of dental abnormalities in the maxilla and mandible compared to their unaffected peers. Dental abnormalities appear in most types of clefts, in both cleft and non-cleft sides, and are uniformly distributed in both genders [26]. Tooth agenesis is the most frequently observed dental anomaly among orofacial cleft patients, followed by supernumerary teeth, developmental enamel defects and microdontia/peg-shaped anterior teeth [26,27]. The rate of congenitally missing teeth was reported at 67.6% to 77% of young patients with CL/P [28,29]. It is also known that the frequency of patients with missing teeth increases with the severity of the cleft [30]. The incredibly high prevalence of congenitally missing teeth in patients with CL/P suggests a possible correlation between these two phenomena [31]. Subsequent research has proven that the occurrence of clefts and hypodontia seems to be controlled by MSX1 genes [32].
Following the dentition, paranasal sinuses are the second most common anatomical area where IFs are found. In contrast, IFs in the nasal cavity, orbit, skull and cervical spine are reported to have lower rates [14]. Anomalies in middle and inner ear cavities were reported at 29.9% [14]. Young patients with CL/P are prone to middle ear disease due to dysfunction of the Eustachian tube and soft palate muscle [33,34,35,36]. These patients present a very high incidence of Otitis media with effusion (OME) and multiple tympanostomy tube placements, especially during childhood and adolescence [35,36]. Nevertheless, the long-term otological prognosis is not necessarily ominous since most patients’ tympanic membranes are in good condition, and hearing is restored to normal levels after 10 years of age [36].
Numerous studies [14,25,28,29] have stated that IFs are evident in the oral and maxillofacial areas of patients diagnosed with CL/P. As already mentioned, this proved the correlation between the two entities, suggesting there is a common factor in the pathogenesis of orofacial clefts and the occurrence of IFs [31,32]. Evidence suggests that individuals with a history of CL/P exhibit a high prevalence of IFs, with the estimated rate approaching 95.1% [25] to 95.5% [14]. Non-cleft populations have also undergone investigation to assess the occurrence of IFs. The overall rate of IFs in a young non-cleft population has been reported at 24.6% [15]. However, the results from several studies have not been conclusive [15,16,37,38]. Even though the detection of IFs in CBCT scans and radiographs is well-established, reported frequencies of IFs in both cleft and non-cleft populations may vary owing to the lack of standardized criteria and methodological discrepancies among the published studies. In addition, previous studies have included patients with a broader age range. Thus, there is a higher risk that the number of abnormal findings is biased. For instance, an older group may exhibit higher incidences of vascular or degenerative abnormalities or may appear unidentified dental irregularities since they have already been addressed past a certain age [25].
1.2. Objectives
The primary objective of the present study was to estimate and appraise the prevalence of IFs in different anatomical regions among children, adolescents and young adults diagnosed with non-syndromic CL/P in comparison with unaffected peers, assessed by OPT, LC radiographs, and CBCT scans before any significant dental intervention. Secondary outcome parameters consisted of analyzing potential correlations of type and location of IFs with patients’ gender and cleft type. Third molar aberrations and TMJ disorders were also evaluated. The null hypothesis was that the prevalence of IFs in various anatomical areas does not differ between patients with and without CL/P.
2. Materials and Methods
2.1. Study Design, Ethics and Protocol
This case-control study was based on a retrospective approach, i.e., data collection and outcome assessment took place after the initial records had been obtained for diagnostic purposes and orthodontic treatment planning. It was conducted according to the recommendations of the Strengthening the Reporting of Observational Studies in Epidemiology (STROBE) statement [39]. Ethical approval of the research protocol was granted by the Research and Ethics Committee of the School of Dentistry of the National and Kapodistrian University of Athens to access patients’ records (application No. 592/26.05.2023). Informed consent was obtained from the parents / legal guardians of all participants involved in the study. The study followed the approved protocol without deviation from its original design. The imaging examinations (OPT, LC radiographs and CBCT scans) were conducted according to the ALARA principle, with an indication justifying radiation exposure.
2.2. Study Setting
The present case-control study investigated the prevalence, type, and location of IFs in patients with non-syndromic CL/P and healthy controls recruited from the graduate clinic of the Department of Orthodontics, School of Dentistry, National and Kapodistrian University of Athens, Greece, during October 2023. The overall timeframe for conducting the research was set from October 2023 through March 2024.
2.3. Study Population
The number of cleft cases available in the university’s orthodontic clinic during the study determined the sample size. The study sample included scans and radiographs of a cleft population and controls, all receiving comprehensive orthodontic treatment in the orthodontic clinic until October 2023. Available complete records of patients diagnosed with CL/P were retrieved for 40 cases. The types of non-syndromic orofacial clefts that were investigated in this research study consisted of the unilateral cleft palate at the upper right side (CP—UR), unilateral cleft palate at the upper left side (CP—UL), unilateral cleft lip and palate at the upper right side (CLP—UR), unilateral cleft lip and palate at the upper left side (CLP—UL), bilateral cleft lip and palate (CLP—B) and isolated cleft palate (CP).
2.3.1. Inclusion Criteria
The inclusion criteria were the following: non-syndromic CL/P patients with complete records, including dental casts, photos, OPT, LC radiographs and/or CBCT scans taken during the orthodontic diagnostic evaluation. No age, gender or ethnic limitations were applied.
2.3.2. Exclusion Criteria
Patients with a history of permanent teeth extractions before the initial orthodontic screening were excluded, as well as patients undergone previous orthodontic treatment, pre-surgical orthopedics, gingivoperiosteoplasty or primary bone grafting.
2.3.3. Matching Criteria
The control group comprised of healthy individuals, matched to cases by date of birth and gender. During the matching process, we accepted up to 6 months of age difference (older or younger) of controls compared with cleft cases. Two controls per one cleft case (case: control ratio = 1:2) were selected from the same clinic according to the stated matching criteria. Subjects with craniofacial anomalies, any maxillofacial pathology or trauma were excluded from the study. Consequently, the control group included 80 healthy individuals.
2.4. Study Outcomes
The primary outcome was the comparison of the IF prevalence between patients with and without non-syndromic CL/P. Secondary outcomes included investigating potential correlations of IFs with patients’ gender and cleft type, third molar aberrations, TMJ disorders, and the implications on the mandible.
2.5. Data Collection and Radiographic Evaluation
The OPT, LC radiographs and CBCT scans were taken by expert radiology staff in the Department of Radiology of the School of Dentistry, National and Kapodistrian University of Athens, as part of the orthodontic diagnostic process and treatment planning and not for this study. During the radiographic examination of all participants, the same equipment [Planmeca PM2002CC (Planmeca Oy, Helsinki, Finland)] and standardized method (67 kV, 5.0 mA, 13.9 s) were implemented. All radiographs had been taken according to the ALARA (as low as reasonably achievable) principle with an indication justifying radiation exposure.
Patient characteristics (individual patient file number, age, gender, exam date) and all the IFs found during the radiographic evaluation were recorded on spreadsheets originally designed for this study in Microsoft© Excel© 365 software (version 16.82 for Mac; Microsoft Corp., Redmond, WA, USA). Chronologic age was calculated by subtracting the date of birth from the date of imaging examination, namely either OPT or CBCT, and it was presented as a decimal age.
The data were collected after thoroughly examining the patient’s records, including intraoral photographs, charts, OPT and LC radiographs, in addition to CBCT scans, if available. The findings were based only on a review of the OPT, LC radiographs and CBCTs and were not influenced by what is reported as a clinical observation/finding in the patient’s medical chart. All images were assessed independently by four observers [two oral and maxillofacial radiologists (N.C. and K.B.), an orthodontist (I.S.) and a dental surgeon with three years of experience (I.P.)] under standardized conditions in the same examination setting. In case of disagreement between the observers, consensus was reached by discussion. Unclear findings were further clarified with the assistance of an experienced oral and maxillofacial radiologist (A.M.).
Ten anatomical areas were screened, and the images were reviewed for anomalies in the (i) maxilla, (ii) mandible, (iii) paranasal sinuses, (iv) middle and inner ear cavity, (v) nasal cavity, (vi) orbit, (vii) skull, (viii) cervical spine, (ix) TMJ and (x) soft tissue. The types of IFs investigated in the present study are depicted in Supplementar Table S1. The following types of dental anomalies/aberrations in the dental development of the maxilla and mandible were screened:
- variations in the number of teeth: teeth agenesis (anodontia, hypodontia, or oligodontia) and supernumerary tooth (supplemental tooth, mesiodens, paramolar, or distomolar);
- variations in the morphology of teeth: developmental enamel defects (hypoplasia and/or hypocalcification), microdontia, peg-shaped teeth, taurodontism, root dilaceration, dens invaginatus (dens in dente), dens evaginatus, dentine dysplasia, teeth fusion, tooth gemination, curved maxillary central incisors, macrodontia, compound odontoma, dentinogenesis imperfecta, amelogenesis imperfecta, and
- variations in tooth position include tooth transposition, malposition (including ectopic teeth), rotation, and impaction (including third molars).
- Other abnormalities, such as the presence of mandibular tori, were also reported.
IFs that were studied in paranasal sinuses included retention cysts, obstructed sinuses, inflammatory opacification of the mucosal lining (which may suggest localized sinusitis), mucosal thickening of all the sinuses (which is indicative of pansinusitis), mucous retention pseudocysts, antral polyps, concha bullosa, oroantral fistula, and antrolith.
The middle and inner ears were assessed for inflammatory or abnormal congenital conditions, middle ear opacification and severely underdeveloped vestibule, suggesting a high likelihood of conductive hearing loss. The nasal cavity was screened for deviated septum and nasal polyps, while the orbit was assessed for an enlarged orbit, suggestive of buphthalmia.
Degenerative changes in vertebrae, along with skull malformations suspected to be caused by a congenital deformity, such as craniosynostosis, or an acquired condition, such as plagiocephaly, were examined. Temporomandibular joint abnormalities, including osteoarthrosis, condylar hyperplasia or hypoplasia, condylar degenerative changes, coronoid hyperplasia, subcondylar cyst, flat condylar margin, bifid condyle and osteophyte were recorded. If necessary, further volumetric data analyses were performed to investigate abnormalities in TMJ structures.
Furthermore, the current study screened for soft-tissue calcifications, including sialolith, tonsillolith, calcified pineal gland and calcified stylohyoid ligament. In addition, carotid artery calcification, vertebral artery calcification and thyroid cartilage calcification were documented. Regarding the cleft types, frequencies of the IFs were calculated for each cleft subgroup. Finally, the absolute number of IFs per patient’s anatomical area was recorded.
2.6. Statistical Analysis
All eligible patients served as cases for this case-control study. After obtaining the available records of cases included in the study, controls were identified based on the pre-specified matching criteria. The study sample size consisted of 40 cases and 80 controls. Thus, the statistical power of the study was estimated at 99.43%.
The datasets created in Microsoft© Excel© were merged and then submitted to descriptive statistical analysis. All analyses were conducted using the statistical programming language R (R version 4.3.1 [40]) in R-Studio® software (version 2023.12.1+402, R Foundation, Vienna, Austria). The present study demonstrated descriptive statistics as frequencies for categorical variables, while mean and standard deviation were provided for continuous ones. Descriptive statistics were provided for all patients and cases and controls separately. The Pearson Chi-square test was used to compare the frequencies of IFs, tooth agenesis, microdontia and third molar aberrations between cases and controls. In cases where the criteria for applying this test were not met, Fisher’s exact test was used. Comparisons of IF frequencies between cases and controls were also provided by anatomical area. A Pearson Chi-square test was applied to compare the presence of IFs by gender in case and control groups separately. A Student’s t-test for unmatched data was used to separately evaluate differences in the number of IFs in the maxilla and mandible in overall patients and cases and controls. A Goodness-of-fit Chi-square test was applied to assess differences in frequencies of IFs by cleft type in the case group, assuming that the proportion of IFs in each cleft type was the same, i.e., equal to 16.7%. For the case group, frequencies of tooth agenesis by tooth were also presented, while observations with missing values were excluded from the corresponding analysis. Logistic regression models were applied to assess further any mutually adjusted potential effects of gender and cleft type on IFs and to examine potential confounding.
The significance level was predetermined and set at α = 0.05. The intra-examiner and inter-examiner reliability was not determined in the present study since the discrepancies were resolved by consensus and, if necessary, by consultation with an oral and maxillofacial radiologist.
3. Results
The population of patients with cleft lip and/or palate in the orthodontic graduate clinic of the School of Dentistry, National and Kapodistrian University of Athens, consisted of 45 cases. Five were not eligible for this case-control study, as there were no available radiographic records, or the cleft type was not determined in patients’ files (2 and 3 cases, respectively). Consequently, the case group (CL/P patients) reached 40 patients. Each patient was matched by gender and age to two controls. A total of 120 participants, 54 females (45%) and 66 males (55%), were included in the study. There were 18 females and 22 males in the case group and 36 females and 44 males in the control group. The mean age of the sample was 14.6 ± 5 years (range from 7.9 up to 26.9); it was 14.5 ± 5 years (range from 7.9 up to 26.4) in the case group and 14.6 ± 5 years (range from 8.1 up to 26.9) in the control group. Participants’ characteristics are presented in Table 1. In the case group, 40% of the participants were diagnosed with CLP-UL, the most frequently observed cleft type in this study, followed by CLP-B and CP with a rate of 22.5% and 12.5%, respectively.
3.1. Prevalence of Incidental Findings
74.17% of the total sample presented IFs (Table 2). More specifically, the prevalence of IFs was 97.5% in the case group and 62.5% in the control group (Table 2). According to the Chi-square test, the higher prevalence of IFs that was reported in the case group compared with the control group was statistically significant [χ2 = 17.05, degrees of freedom (df) = 1, p <0.001, Table 3]. Representative radiographic images of CL/P patients are depicted in Figure 1, Figure 2 and Figure 3.
3.2. Correlation of the Occurrence of Incidental Findings with Gender
No statistically significant associations were found regarding the prevalence of IFs and gender in cases and controls separately (Table 4). All of the male (100%) and 94.4% of the female patients in the case group experienced IFs (χ2 = 1.25, df = 1, p = 0.263), while in the control group, the rate of IFs was 65.9% in males and 58.3% in females (χ2 = 0.48, df = 1, p = 0.486).
3.3. Occurrence of Incidental Findings in Each Anatomical Area
The prevalences of IFs in the different anatomical areas are presented in Table 5. Statistically significant differences between cases and controls were observed in the following anatomical regions: maxilla, mandible, paranasal sinuses, nasal cavity and TMJ structures. The occurrence of IFs in the case versus control group was in maxilla 92.5% versus 43.8% (χ2 = 26.4, df = 1, p < 0.001), in mandible 63.2% versus 41.3% (χ2 = 4.95, df = 1, p = 0.026), in paranasal sinuses 54.3% versus 2.7% (χ2 = 41.17, df = 1, p < 0.001), in nasal cavity 75.8% versus 1.5% (χ2 = 63.38, df = 1, p < 0.001) and in TMJ structures 47.1% versus 14.7% (χ2 = 8.87, df = 1, p = 0.003), respectively (Table 5). The case group presented a higher prevalence of IFs in all anatomical areas mentioned above, compared with the control group.
The most common anatomical location that demonstrated IFs in the case group was the maxilla followed by the nasal cavity, mandible and paranasal sinuses. In the control group, most IFs occurred in the dentition, followed by TMJ and paranasal sinuses (Table 5). Regarding the type of IFs reported in nasal cavity, paranasal sinuses and TMJ, the most common in both case and control groups were deviated nasal septum and enlarged inferior nasal concha in nasal cavity, mucosal thickening, retention cysts and obstructed sinus in paranasal sinuses and flat condylar margin in TMJ (data not shown). No IFs were detected in the middle and inner ear, orbit, skull and cervical spine regions of the participants in either group, while only 7.7% of the case group exhibited IFs in soft tissues (Table 2).
Maxilla presented significantly more IFs than the mandible in the overall sample and the case group (Table 6). In all participants, the mean number of IFs was 1.6 (SD = 1.74) in the maxilla and 1.03 (SD = 1.36) in the mandible, where a significant difference was observed (t-test, p = 0.006). In the case group, the mean number of IFs was 2.93 (SD = 1.7) in the maxilla and 1.34 (SD = 1.42) in the mandible, with a statistically significant difference (t-test, p < 0.001). No significant difference was observed in the control group (mean ± SD: 0.94 ± 1.33 versus 0.88 ± 1.32, t-test, p = 0.766, Table 6). For the case group, the prevalence of IFs was estimated at 92.5% in the maxilla, most of whom presented 3 IFs (27.5%), and 63.2% in the mandible, which most commonly (34.2%) had 2 IFs. IFs in the maxilla were present at 60% and in the mandible at 48.3% of the total sample. In both anatomical locations, the majority (17.5% in the maxilla and 27.1% in the mandible) reported 2 IFs (Table 2).
3.4. Prevalence of Incidental Findings by Cleft Type
Prevalence of IFs in different cleft types was not uniformly distributed (Table 7). The cleft-type subgroup CLP-UL was the most common (40%) and presented a higher prevalence of IFs (χ2 = 20.54, df = 5, p < 0.001).
3.5. Frequencies of Tooth Agenesis and Microdontia
Descriptive statistics on tooth agenesis and microdontia are presented in Table 8. In the case group, 72.5% had tooth agenesis, and 2.5% had microdontia. Table 9 presents the results of comparing the prevalence of tooth agenesis and microdontia between cases and controls. For tooth agenesis, 27.5% had no tooth agenesis, while 72.5% presented tooth agenesis among the case group. In contrast, 76.25% had no tooth agenesis, and 23.8% showed tooth agenesis among the control group. The Chi-square test indicated a statistically significant association between tooth agenesis and case-control status (χ2 = 24.41, df = 1, p < 0.001), with a higher frequency of tooth agenesis in the case group. The most commonly missing teeth were the 22, 12, 25, 35, and 45. No statistically significant association was detected concerning microdontia among the case and control groups (Fisher’s exact test p > 0.999, Table 9). Table 10 presents the frequency of tooth agenesis in each tooth. In most individuals of the case group (24.2%), tooth agenesis was found in tooth 22, while tooth agenesis in tooth 12 was also frequent (21.0%).
3.6. Frequencies of Third Molar Aberrations
Most participants in the overall sample (83.3%) as well as specifically in case (75.0%) and control group (87.5%) did not present any third molar aberrations (Table 11). Third molar impaction, tooth agenesis and taurodontism were observed in only 17.5%, 5% and 2.5% of the case group, respectively (Table 11). No statistically significant differences between cases and controls were reported for overall third molar aberrations and third molar impaction, tooth agenesis and taurodontism, separately (p > 0.05, Table 12).
3.7. Temporomandibular Joint (TMJ) Abnormalities
The frequency of IFs in TMJ structures was significantly higher in the case group than in the control group (p = 0.003, Table 5). In the case group, 47.1% of the subjects had IFs in the TMJ region; in the control group, only 14.7% did. Nevertheless, it is worth mentioning that most participants in both groups (52.9% in cases and 85.3% in controls) did not present any TMJ abnormality (Table 5).
3.8. Correlations of Incidental Findings, Tooth Agenesis and Microdontia with Patients’ Gender and Cleft Type
Finally, logistic regression models could be applied to evaluate the association of gender and cleft type with IFs, tooth agenesis, and microdontia in the case group. However, this was not applicable in our study, since all patients in the case group, except for one, had IFs. Thus, no variability in the dependent variable was present.
4. Discussion
To our knowledge, no published study has addressed the prevalence of IFs in several anatomical locations of patients with non-syndromic CL/P compared with healthy controls until today. The frequency of IFs in the cleft and non-cleft populations has been documented only in separate studies for each group [14,15,16,25,28,29,37,38]. Therefore, these results should be assessed cautiously since a direct comparison of the prevalence of IFs between patients with CL/P and controls has not yet been available. More evidence is needed regarding a comprehensive investigation of the prevalence of IFs in various anatomical regions distant from the dentition, which is often the area of primary interest. The current literature also lacks an accurate reporting of the prevalence of IFs in patients with non-syndromic CL/P compared with healthy controls prior to any significant dental intervention. Limited published data concerning potential IFs during the orthodontic diagnostic evaluation of patients with CL/P and healthy orthodontic patients are available in the literature, and their primary focus has been on dentition [26,41]. Based on these premises, we utilized a control group of unaffected individuals to conduct a case-control study for an adequate statistical comparison of the prevalence of IFs in several anatomical areas—not just dental abnormalities like previous studies—between CL/P and control subjects. This is the first comprehensive study regarding IFs in various regions of the oral and maxillofacial area of patients with non-syndromic CL/P compared with unaffected peers. Patients undergone any previous orthodontic/surgical intervention were excluded from the study, since tooth agenesis, as well as structural dental anomalies presented in patients, could be considered iatrogenic.
This study retrospectively assessed OPT, LC radiographs, and CBCT scans to identify IFs in a cleft sample of 40 patients and compare these findings with those of 80 healthy subjects. As described earlier, all IFs were recorded and subdivided into ten anatomical areas. We hypothesized that the prevalence of IFs does not differ between cases of CL/P and controls. However, this hypothesis was not confirmed. After matching for age and gender, highly significant differences in the prevalence of IFs were observed between non-syndromic CL/P patients and unaffected individuals. In addition, we found large differences in the anatomical location of reported IFs, which illustrates the association of IFs’ localization with cleft status. The findings of the present study may provide further insight to the clinicians who treat patients with non-syndromic orofacial clefts in establishing refined comprehensive treatment protocols.
In previous studies [37,38,42], significantly more OPT and LC images of cleft patients or healthy orthodontic samples were assessed than in the present study. Yet, the risk of disregarding findings was probably higher, given that the radiographs were examined by two investigators with minimal involvement of a specialist radiologist. The current study demonstrated markedly more IFs, especially in the control group. One explanation might lie in the absence of a structured assessment method of previously published research; thus, the true diagnoses might have been underestimated.
The present study reported that the prevalence of IFs was significantly higher in the case group than in the control group. These results agree with previous studies [26,41]. The 62.5% rate of IFs that was estimated in the control group of our study was lower than that of relative studies conducted by Allareddy et al. (94.3%) [23], Çaǧlayan & Tozoǧlu (92.8%) [20] and Price et al. (90.7%) [24], and higher than the 21.4% presented in other research reports [15,37,38]. Such variability in findings can be attributed to the various imaging techniques implemented in former investigations. Researchers have evaluated IFs in cleft or non-cleft orthodontic populations based on either 2D imaging, namely panoramic and lateral cephalometric radiographs [10,27,28,29,30,38,41], or 3D techniques with CBCT or CT scans [15,20,21,22,23,24,25,37,42]. In addition, there are different indications for a radiograph or a scan in the existing literature, and other study populations analyzed in various settings could eventually result in fluctuating rates of IFs. Further discrepancies could be observed due to varying age, diagnostic criteria, and total sample size.
No correlation between IFs and gender was found in the case and the control group. After evaluating the prevalence of IFs by cleft type, we concluded that most cleft patients belonged to the CLP-UL subgroup (40%), which is in line with other research analyses [30,42,43].
According to the literature, IFs are more frequently observed in the dental rather than the extra-dental regions. In previous investigations of non-cleft orthodontic samples [37,38], most IFs occurred in the dentition, followed by nasal and paranasal sinuses. We confirmed that the most common anatomical location that demonstrated IFs in the case group was the maxilla, followed by the nasal cavity, mandible and paranasal sinuses. In the control group, a higher prevalence of IFs was presented in the maxilla, followed by the mandible, TMJ and paranasal sinuses. In addition, we reported IFs in the nasal cavity and paranasal sinuses common in both case and control groups that could lead to severe aesthetic and functional implications for the patient. Such IFs are the enlarged inferior nasal concha in the nasal cavity, which often requires rhinoplasty and mucosal thickening, retention cysts and obstructed sinus in the paranasal sinuses, which could be associated with higher risk of inflammation. Our study confirmed the theory supported by Camporesi that the impact of orofacial clefts is more localized on the cleft area than general on the dentition [41].
Regarding the IFs in the dentition, our analysis revealed significantly higher prevalence rates in cleft patients’ maxilla and mandible compared to the non-cleft subjects. It is noteworthy that IFs in the mandible were documented in 63.2% of the cases, in contrast with 41.3% of the controls. Moreover, we observed significantly fewer IFs in the mandible than in the maxilla of patients with CL/P since the former presented a mean number of findings of nearly half the number in the latter. Therefore, we can infer that orofacial clefts may affect anatomical structures outside the cleft’s area, particularly the mandible, yet only to a limited degree
A meta-analysis conducted by Marzouk et al. [26] included 26 studies with 15,213 participants and assessed the frequency of dental anomalies between non-syndromic cleft patients and individuals without clefts. The results suggested a positive association between orofacial clefts and dental abnormalities, which is accounted for surgical interventions, such as primary lip and secondary palate surgery, that may prompt teeth displacement and rotation or affect the development of anterior and posterior permanent teeth [26]. Marzouk et al. showed that tooth agenesis was the most commonly reported dental abnormality. Our investigation revealed that 72.5% of the orofacial cleft patients presented with tooth agenesis and were in line with several studies [23,26,27,28,29] demonstrating a high rate of tooth agenesis in patients with CL/P. In our sample, the highest prevalence of tooth agenesis among cleft cases (excluding third molars) was reported for maxillary permanent lateral incisors in the cleft area, the second maxillary premolars and the second mandibular premolar outside the cleft area. These findings agree with other reports that concluded tooth agenesis occurs mainly at the cleft side, and the most prevalent missing tooth is the lateral incisor [27,28,29,42,43,44]. A cross-sectional study [45] estimated the prevalence of tooth agenesis in a large sample of 5,005 non-cleft individuals at 7.1%, which is comparable to the reports of Rakhshan [46] (0.15-16.2%, excluding the third molars). We also observed a considerably lower rate of tooth agenesis in the non-cleft group than in the cleft group.
The existing body of evidence is ambiguous regarding the association of tooth agenesis with gender. Some studies reported no differences in the distribution of developmental dental abnormalities between male and female patients [42,47], while others suggested a gender-related tendency in the agenesis of maxillary lateral incisors and maxillary second premolars [27]. The lack of variability in the dependent variable in our study rendered the investigation of a potential association between tooth agenesis and gender impossible.
The literature highlights the importance of systematic image screening and thorough interpretation of any potential abnormality in the craniofacial complex since several studies revealed a high prevalence of IFs outside the primary dental focus [23,24]. A study by Klenke et al. [38] reported 66% of the findings having occurred distant from the dentition and suggested that a markedly higher prevalence of IFs located in extra-dental regions is expected as patients’ age increases.
After dentition, paranasal sinuses are the next most common anatomical locations, where IFs were found at 52.6% in a cleft sample [14]. Our study confirmed the same trend since 54.3% of cleft patients presented findings in paranasal sinuses, such as mucosal thickening, antral polyps, antrolith, sinusitis, pansinusitis and retention cysts. In the control group, we reported a 2.7% rate of IFs in paranasal sinuses, a striking difference from the 14.2-59.7% demonstrated in the literature [15,22,24,48]. This discrepancy may indicate the different imaging indications implemented in each study sample.
Temporomandibular joint abnormalities were observed at a high rate in the cleft and control groups in our analysis, with a rate of 47.1% and 14.7%, respectively. Santos et al. [14] did not detect any finding in the TMJ region of cleft patients, while studies on non-cleft populations found the rate of incidental TMJ findings at 4.3% [15] to 11.1% [20]. Four CBCT studies on non-cleft samples [15,20,21,23] detected a variety of abnormal findings (coronoid hyperplasia, condylar hyperplasia, condylar hypoplasia), physiological remodeling (flat condylar margins, subchondral sclerosis) and degenerative alterations (osteophytes, erosions) affecting the TMJ structures.
According to our results, findings in the nasal cavity were present in 75.8% of the cleft patients and 1.49% of the controls. Nasal septum deviation constituted most of the detected findings in the nasal cavity of our sample. This abnormality is mentioned as the most common finding concerning the nasal cavity in patients with CL/P [14], with a prevalence of 34% [25] and is also considered to increase with age [49]. Prevalence rates in former studies on non-cleft subjects range from 0.4 to 56.7% [15,20,49].
Soft tissue calcifications were incidentally detected in 7.69% of both groups in our study, which was lower compared with former studies. CBCT studies indicated that soft tissue calcifications were present in 20% [24] of healthy non-cleft samples, with tonsilloliths, sialoliths, thyroid cartilage and carotid artery calcifications as the most prominent findings [23,24].
4.1. Clinical Implications
The assessment of IFs on radiographic images or CBCT scans bears significant clinical implications. Most clinicians who are not radiologists or radiology-trained are unfamiliar with interpreting anatomical structures and/or abnormal findings beyond the area of their primary interest, as this was typically not incorporated in their training. Published reports, however, underline the clear benefit to the patient from a thorough evaluation of all available radiographic records and screening of all depicted anatomical areas [16,23,50]. Orthodontists, dentists, surgeons, and radiologists who are part of the cleft care team should be aware of the potential pathology or important IFs in the dentition that require further diagnostic examination or treatment, as well as extra-dental abnormalities that may be relevant, necessitate further diagnostics, or alter the patient’s prognosis. Thereby, adequate education on the interpretation of images taken from the cranio-maxillofacial complex is imperative during the training of clinicians.
Clinicians should take into consideration the high prevalence of dental as well as extra-dental IFs for effective interceptive treatment of potentially severe oral rehabilitation issues. Understanding the association between CL/P and IFs is critical not only for providing successful interdisciplinary treatment, but it is also essential for raising awareness of the potential need for future dental care for individuals with CL/P and managing any extra-dental aberrations. Therefore, a systematic approach, including a meticulous review of all images and examination of each anatomical region during diagnostic assessment, is suggested to properly screen orthodontic radiographs and CBCT scans for abnormalities and eliminate the risk of overlooking IFs of clinical significance. To prevent under- or overestimating potential findings, consultations with oral and maxillofacial radiologists and appropriate referrals to specialists are highly recommended.
4.2. Limitations
No limitation concerning the age of this study’s participants was implemented in our research. Since the prevalence of IFs increases with age [38], our estimates may slightly overestimate the true prevalence. This could also explain the higher rate of IFs reported in this study, especially in the control group, compared to previous research.
The limitations of this study can be primarily attributed to the relatively small sample size of the cleft group, especially for the subgroups of cleft lip and palate only at the right side (CLP—UR) and isolated cleft palate (CP—B, CP—UR, CP—UL). Nevertheless, gathering a large sample size can be challenging because orofacial clefts are rare. Another concern is the potential bias resulting from the lack of ethnic variability in the study sample, as all subjects were of Caucasian origin. Furthermore, the radiographic evaluations of this study were based on a retrospective analysis, which constitutes another limitation. However, a prospective study could not be possible due to ethical concerns associated with the radiation exposure of the imaging techniques. Thus, researchers are prohibited from exposing any subject to radiation for research purposes and are restricted to radiographs taken only for therapeutical reasons.
Our study was also limited because a FOV as small as possible is usually selected in each case in CBCT scans; hence, anatomical coverage may vary. The intra-rater and inter-rater reliability were not thoroughly assessed because differences between them were resolved in the present investigation by consensus and, whenever necessary, by a consultant radiologist. Finally, histopathology could not be used to validate our findings due to apparent practical and ethical considerations. The definitive diagnosis was determined merely by imaging.
4.3. Generalizability (External Validity)
The generalizability of this study was limited to the examined population in terms of ethnicity. Our database included patients from the Greek population treated in a single setting. The range of patients was sufficient: male and female, from children and adolescents to young adults, were included. Hence, the major exposure categories were well represented. The severity of orofacial cleft in the case group ranged from isolated cleft palate to cleft lip and palate unilaterally or bilaterally.
4.4. Future Research
Further research regarding potential IFs is still required internationally to determine the most effective approaches to minimize the burden of oral clefts and optimize the quality of care delivered to affected individuals. Therefore, subsequent investigations should incorporate diverse ethnic groups and collect larger sample sizes with a multi-center study design, to fully understand the potential association and illustrate an accurate picture of the prevalence of IFs in the various cleft subgroups compared with the general non-cleft population.
5. Conclusions
IFs in the present study were significantly higher in patients with non-syndromic CL/P (97.5%) than in the control group (62.5%). The most prevalent cleft type was CLP-UL, with a rate of 40% of the cleft patients. Regarding the anatomical localization of IFs, the most prevalent location in the case group was the maxilla, followed by the nasal cavity, while in the control group the highest IFs occurred in the maxilla, the mandible and TMJ. No associations were detected regarding the prevalence of IFs and gender in cases and controls separately. Third molar aberrations, namely third molar impaction, tooth agenesis and taurodontism, occurred at 25% and 12.5% of cases and controls, respectively. TMJ abnormalities were more frequent in patients with CL/P than unaffected individuals. Finally, orofacial clefts may have an impact on the occurrence of IFs in the mandible. However, the reported IFs were limited compared to those in the maxilla.
Supplementary Materials
The following supporting information can be downloaded at: www.mdpi.com/xxx/s1, Table S1: Summary of potential IFs screened in the study by anatomical area.
Author Contributions
Conceptualization, I.P., A.M., D.G.G. and I.S.; methodology, I.P., A.X., A.M., D.G.G. and I.S.; formal analysis, I.P. and A.X.; investigation, I.P., A.M., N.C., K.B. and I.S.; resources, A.M. and I.S.; data curation, I.P.; writing—original draft preparation, I.P. and A.X.; writing—review and editing, I.P., I.K., D.G.G. and I.S.; supervision, I.S. and D.G.G.; project administration, I.P. All authors have read and agreed to the published version of the manuscript.
Funding
This research received no external funding.
Institutional Review Board Statement
The study was conducted in accordance with the Declaration of Helsinki and approved by the Research and Ethics Committee of the School of Dentistry of the National and Kapodistrian University of Athens (592/26.05.2023).
Informed Consent Statement
Informed consent was obtained from all subjects involved in the study.
Data Availability Statement
The data presented in this study are available on request from the corresponding author due to the EU General Data Protection Regulation.
Conflicts of Interest
The authors declare no conflicts of interest.
References
- Wyszynski, D. F.; Beaty, T. H.; Maestri, N. E. Genetics of Nonsyndromic Oral Clefts Revisited. Cleft Palate Craniofac J 1996, 33, 406–417. [Google Scholar] [CrossRef] [PubMed]
- Nasreddine, G.; El Hajj, J.; Ghassibe-Sabbagh, M. Orofacial Clefts Embryology, Classification, Epidemiology, and Genetics. Mutation Research/Reviews in Mutation Research 2021, 787, 108373. [Google Scholar] [CrossRef] [PubMed]
- Allam, E.; Stone, C. Cleft Lip and Palate: Etiology, Epidemiology, Preventive and Intervention Strategies. Anatomy & Physiology 2013, 04. [Google Scholar] [CrossRef]
- Dixon, M. J.; Marazita, M. L.; Beaty, T. H.; Murray, J. C. Cleft Lip and Palate: Understanding Genetic and Environmental Influences. Nat Rev Genet 2011, 12, 167–178. [Google Scholar] [CrossRef] [PubMed]
- Oner, D.; Tastan, H. Cleft Lip and Palate: Epidemiology and Etiology. Otorhinolaryngol Head Neck Surg 2020, 5. [Google Scholar] [CrossRef]
- Pavlova, N. I.; Kurtanov, K. A.; Diakonova, A. T.; Mironova, L. S.; Solovyeva, N. A.; Borisova, Y. P.; Dodokhov, V. V.; Ushnitsky, I. D. Genetic Predictors for the Development of Congenital Orofacial Clefts. International Journal of Biomedicine 2020, 10, 50–53. [Google Scholar] [CrossRef]
- Brito, L. A.; Cruz, L. A.; Rocha, K. M.; Barbara, L. K.; Silva, C. B. F.; Bueno, D. F.; Aguena, M.; Bertola, D. R.; Franco, D.; Costa, A. M.; Alonso, N.; Otto, P. A.; Passos-Bueno, M. R. Genetic Contribution for Non-Syndromic Cleft Lip with or without Cleft Palate (NS CL/P) in Different Regions of Brazil and Implications for Association Studies. Am J Med Genet A 2011, 155A, 1581–1587. [Google Scholar] [CrossRef] [PubMed]
- Edwards, R.; Altalibi, M.; Flores-Mir, C. The Frequency and Nature of Incidental Findings in Cone-Beam Computed Tomographic Scans of the Head and Neck Region: A Systematic Review. J Am Dent Assoc 2013, 144, 161–170. [Google Scholar] [CrossRef] [PubMed]
- Choi, J. Y.; Oh, S. H.; Kim, S. H.; Ahn, H. W.; Kang, Y. G.; Choi, Y. S.; Kook, Y. A.; Nelson, G. Effectiveness of 2D Radiographs in Detecting CBCT-Based Incidental Findings in Orthodontic Patients. Sci Rep 2021, 11. [Google Scholar] [CrossRef]
- Tetradis, S.; Kantor, M. L. Prevalence of Skeletal and Dental Anomalies and Normal Variants Seen in Cephalometric and Other Radiographs of Orthodontic Patients. Am J Orthod Dentofacial Orthop 1999, 116, 572–577. [Google Scholar] [CrossRef]
- Bahaziq, A.; Jadu, F.; Jan, A.; Baghdady, M.; Feteih, R. A Comparative Study of the Examination Pattern of Panoramic Radiographs Using Eye-Tracking Software. J Contemp Dent Pract. 2019, 20, 1436–1441. [Google Scholar] [PubMed]
- Carter, L.; Farman, A. G.; Geist, J.; Scarfe, W. C.; Angelopoulos, C.; Nair, M. K.; Hildebolt, C. F.; Tyndall, D.; Shrout, M. American Academy of Oral and Maxillofacial Radiology Executive Opinion Statement on Performing and Interpreting Diagnostic Cone Beam Computed Tomography. Oral Surg Oral Med Oral Pathol Oral Radiol Endod 2008, 106, 561–562. [Google Scholar] [CrossRef] [PubMed]
- Horner, K.; Islam, M.; Flygare, L.; Tsiklakis, K.; Whaites, E. Basic Principles for Use of Dental Cone Beam Computed Tomography: Consensus Guidelines of the European Academy of Dental and Maxillofacial Radiology. Dentomaxillofac Radiol 2009, 38, 187–195. [Google Scholar] [CrossRef] [PubMed]
- Santos, G.; Ickow, I.; Job, J.; Brooker, J. E.; Dvoracek, L. A.; Rigby, E.; Shah, N.; Chen, W.; Branstetter, B.; Schuster, L. A. Cone-Beam Computed Tomography Incidental Findings in Individuals With Cleft Lip and Palate. Cleft Palate Craniofac J 2020, 57, 404–411. [Google Scholar] [CrossRef] [PubMed]
- Cha, J. Y.; Mah, J.; Sinclair, P. Incidental Findings in the Maxillofacial Area with 3-Dimensional Cone-Beam Imaging. Am J Orthod Dentofacial Orthop 2007, 132, 7–14. [Google Scholar] [CrossRef] [PubMed]
- Kuhlberg, A. J.; Norton, L. A. Pathologic Findings in Orthodontic Radiographic Images. American Journal of Orthodontics and Dentofacial Orthopedics 2003, 123, 182–184. [Google Scholar] [CrossRef] [PubMed]
- Granlund, C. M.; Lith, A.; Molander, B.; Gröndahl, K.; Hansen, K.; Ekestubbe, A. Frequency of Errors and Pathology in Panoramic Images of Young Orthodontic Patients. Eur J Orthod 2012, 34, 452–457. [Google Scholar] [CrossRef] [PubMed]
- Bondemark, L.; Jeppsson, M.; Lindh-Ingildsen, L.; Rangne, K. Incidental Findings of Pathology and Abnormality in Pretreatment Orthodontic Panoramic Radiographs. Angle Orthod. 2006, 76, 98–102. [Google Scholar] [PubMed]
- Dief, S.; Veitz-Keenan, A.; Amintavakoli, N.; McGowan, R. A Systematic Review on Incidental Findings in Cone Beam Computed Tomography (CBCT) Scans. Dentomaxillofac Radiol 2019, 48. [Google Scholar] [CrossRef]
- Çaǧlayan, F.; Tozoǧlu, Ü. Incidental Findings in the Maxillofacial Region Detected by Cone Beam CT. Diagn Interv Radiol 2012, 18, 159–163. [Google Scholar] [CrossRef]
- Edwards, R.; Alsufyani, N.; Heo, G.; Flores-Mir, C. The Frequency and Nature of Incidental Findings in Large-Field Cone Beam Computed Tomography Scans of an Orthodontic Sample. Prog Orthod 2014, 15. [Google Scholar] [CrossRef] [PubMed]
- Pazera, P.; Bornstein, M. M.; Pazera, A.; Sendi, P.; Katsaros, C. Incidental Maxillary Sinus Findings in Orthodontic Patients: A Radiographic Analysis Using Cone-Beam Computed Tomography (CBCT). Orthod Craniofac Res 2011, 14, 17–24. [Google Scholar] [CrossRef] [PubMed]
- Allareddy, V.; Vincent, S. D.; Hellstein, J. W.; Qian, F.; Smoker, W. R. K.; Ruprecht, A. Incidental Findings on Cone Beam Computed Tomography Images. Int J Dent 2012, 2012. [Google Scholar] [CrossRef] [PubMed]
- Price, J. B.; Thaw, K. L.; Tyndall, D. A.; Ludlow, J. B.; Padilla, R. J. Incidental Findings from Cone Beam Computed Tomography of the Maxillofacial Region: A Descriptive Retrospective Study. Clin Oral Implants Res 2012, 23, 1261–1268. [Google Scholar] [CrossRef] [PubMed]
- Kuijpers, M. A. R.; Pazera, A.; Admiraal, R. J.; Bergé, S. J.; Vissink, A.; Pazera, P. Incidental Findings on Cone Beam Computed Tomography Scans in Cleft Lip and Palate Patients. Clin Oral Investig 2014, 18, 1237–1244. [Google Scholar] [CrossRef] [PubMed]
- Marzouk, T.; Alves, I. L.; Wong, C. L.; DeLucia, L.; McKinney, C. M.; Pendleton, C.; Howe, B. J.; Marazita, M. L.; Peter, T. K.; Kopycka-Kedzierawski, D. T.; Morrison, C. S.; Malmstrom, H.; Wang, H.; Shope, E. T. Association between Dental Anomalies and Orofacial Clefts: A Meta-Analysis. JDR Clin Trans Res 2021, 6, 368–381. [Google Scholar] [CrossRef] [PubMed]
- Wangsrimongkol, T.; Manosudprasit, M.; Pisek, P.; Chittiwatanapong, N. Prevalence and Types of Dental Anomaly in a Thai Non-Syndromic Oral Cleft Sample. J Med Assoc Thai. 2013, 96 Suppl 4, S25–35. [Google Scholar]
- Aizenbud, D.; Camasuvi, S.; Peled, M.; Brin, I. Congenitally Missing Teeth in the Israeli Cleft Population. Cleft Palate Craniofac J 2005, 42, 314–317. [Google Scholar] [CrossRef] [PubMed]
- Shapira, Y.; Lubit, E.; Kuftinec, M. Hypodontia in Children with Various Types of Clefts. Angle Orthod. 2000, 70, 16–21. [Google Scholar]
- Shapira, Y.; Lubit, E.; Kuftinec, M. M. Congenitally Missing Second Premolars in Cleft Lip and Cleft Palate Children. Am J Orthod Dentofacial Orthop 1999, 115, 396–400. [Google Scholar] [CrossRef]
- Bailit, H.; Doykos, J.; Swanson, L. Dental Development in Children with Cleft Palates. J Dent Res. 1968, 47, 664–664. [Google Scholar] [CrossRef]
- Satokata, I.; Maas, R. Msx1 Deficient Mice Exhibit Cleft Palate and Abnormalities of Craniofacial and Tooth Development. Nat Genet 1994, 6, 348–356. [Google Scholar] [CrossRef] [PubMed]
- Dhillon, R. S. The Middle Ear in Cleft Palate Children Pre and Post Palatal Closure. J R Soc Med 1988, 81, 710–713. [Google Scholar] [CrossRef] [PubMed]
- Sheahan, P.; Miller, I.; Sheahan, J. N.; Earley, M. J.; Blayney, A. W. Incidence and Outcome of Middle Ear Disease in Cleft Lip and/or Cleft Palate. Int J Pediatr Otorhinolaryngol 2003, 67, 785–793. [Google Scholar] [CrossRef] [PubMed]
- Flynn, T.; Lohmander, A.; Moller, C.; Magnusson, L. A Longitudinal Study of Hearing and Middle Ear Status in Adolescents with Cleft Lip and Palate. Laryngoscope 2013, 123, 1374–1380. [Google Scholar] [CrossRef] [PubMed]
- Timmermans, K.; Vander Poorten, V.; Desloovere, C.; Debruyne, F. The Middle Ear of Cleft Palate Patients in Their Early Teens: A Literature Study and Preliminary File Study. . B-ENT. 2006, 2 Suppl 4:95, 95–101.
- Kocsis, C.; Sommerlath Sohns, J.; Graf, I.; et al. Incidental Findings on Craniomaxillofacial Cone Beam Computed Tomography in Orthodontic Patients. Int J Comput Dent. 2019, 22, 149–162. [Google Scholar] [PubMed]
- Klenke, D.; Santander, P.; Vehring, C.; Quast, A.; Sommerlath Sohns, J.; Krohn, S.; Meyer-Marcotty, P. Prevalence of Incidental Findings in Adult vs. Adolescent Patients in the Course of Orthodontic X-Ray Diagnostics. J Orofac Orthop 2023, 84, 298–310. [Google Scholar] [CrossRef] [PubMed]
- Vandenbroucke, J. P.; Von Elm, E.; Altman, D. G.; Gøtzsche, P. C.; Mulrow, C. D.; Pocock, S. J.; Poole, C.; Schlesselman, J. J.; Egger, M. Strengthening the Reporting of Observational Studies in Epidemiology (STROBE): Explanation and Elaboration. PLoS Med 2007, 4, 1628–1654. [Google Scholar] [CrossRef] [PubMed]
- R Core Team (2023). R: A Language and Environment for Statistical Computing. R Foundation for Statistical Computing, Vienna, Austria. Available at: Https://Www.R-Project.Org/.
- Camporesi, M.; Baccetti, T.; Marinelli, A.; Defraia, E.; Franchi, L. Maxillary Dental Anomalies in Children with Cleft Lip and Palate: A Controlled Study. Int J Paediatr Dent 2010, 20, 442–450. [Google Scholar] [CrossRef]
- Konstantonis, D.; Alexandropoulos, A.; Konstantoni, N.; Nassika, M. A Cross-Sectional Analysis of the Prevalence of Tooth Agenesis and Structural Dental Anomalies in Association with Cleft Type in Non-Syndromic Oral Cleft Patients. Prog Orthod 2017, 18, 1–9. [Google Scholar] [CrossRef]
- Bartzela, T. N.; Carels, C. E. L.; Bronkhorst, E. M.; Jagtman, A. M. K. Tooth Agenesis Patterns in Unilateral Cleft Lip and Palate in Humans. Arch Oral Biol 2013, 58, 596–602. [Google Scholar] [CrossRef]
- Lourenço Ribeiro, L.; Teixeira das Neves, L.; Costa, B.; Ribeiro Gomide, M. Dental Anomalies of the Permanent Lateral Incisors and Prevalence of Hypodontia Outside the Cleft Area in Complete Unilateral Cleft Lip and Palate. Cleft Palate Craniofac J 2003, 40, 172–175. [Google Scholar] [CrossRef] [PubMed]
- Laganà, G.; Venza, N.; Borzabadi-Farahani, A.; Fabi, F.; Danesi, C.; Cozza, P. Dental Anomalies: Prevalence and Associations between Them in a Large Sample of Non-Orthodontic Subjects, a Cross-Sectional Study. BMC Oral Health 2017, 17. [Google Scholar] [CrossRef] [PubMed]
- Rakhshan, V. Congenitally Missing Teeth (Hypodontia): A Review of the Literature Concerning the Etiology, Prevalence, Risk Factors, Patterns and Treatment. Dent Res J (Isfahan) 2015, 12, 1–13. [Google Scholar] [CrossRef] [PubMed]
- Baek, S. H.; Kim, N. Y. Congenital Missing Permanent Teeth in Korean Unilateral Cleft Lip and Alveolus and Unilateral Cleft Lip and Palate Patients. Angle Orthod 2007, 77, 88–93. [Google Scholar] [CrossRef] [PubMed]
- Raghav, M.; Karjodkar, F. R.; Sontakke, S.; Sansare, K. Prevalence of Incidental Maxillary Sinus Pathologies in Dental Patients on Cone-Beam Computed Tomographic Images. Contemp Clin Dent 2014, 5, 361–365. [Google Scholar] [CrossRef]
- Reitzen, S. D.; Chung, W.; Shah, A. R. Nasal Septal Deviation in the Pediatric and Adult Populations. Ear Nose Throat J 2011, 90, 112–115. [Google Scholar] [CrossRef]
- Newaz, Z. A.; Barghan, S.; Katkar, R. A.; Bennett, J. A.; Nair, M. K. Incidental Findings of Skull-Base Abnormalities in Cone-Beam Computed Tomography Scans with Consultation by Maxillofacial Radiologists. Am J Orthod Dentofacial Orthop 2015, 147, 127–131. [Google Scholar] [CrossRef]
Figure 1.
Orthopantomogram (OPT) of a male patient (10.9 years old) diagnosed with CLP—UL presenting various incidental findings: agenesis of tooth 12 (bold red arrow), malposition of tooth 22 (thin diagonal red arrow), impaction of tooth 23 (thin diagonal red arrow), rotation of tooth 11 (thin vertical red arrows), supernumerary tooth between teeth 22-23 (red circle) and deviated nasal septum to the right (red asterisk).
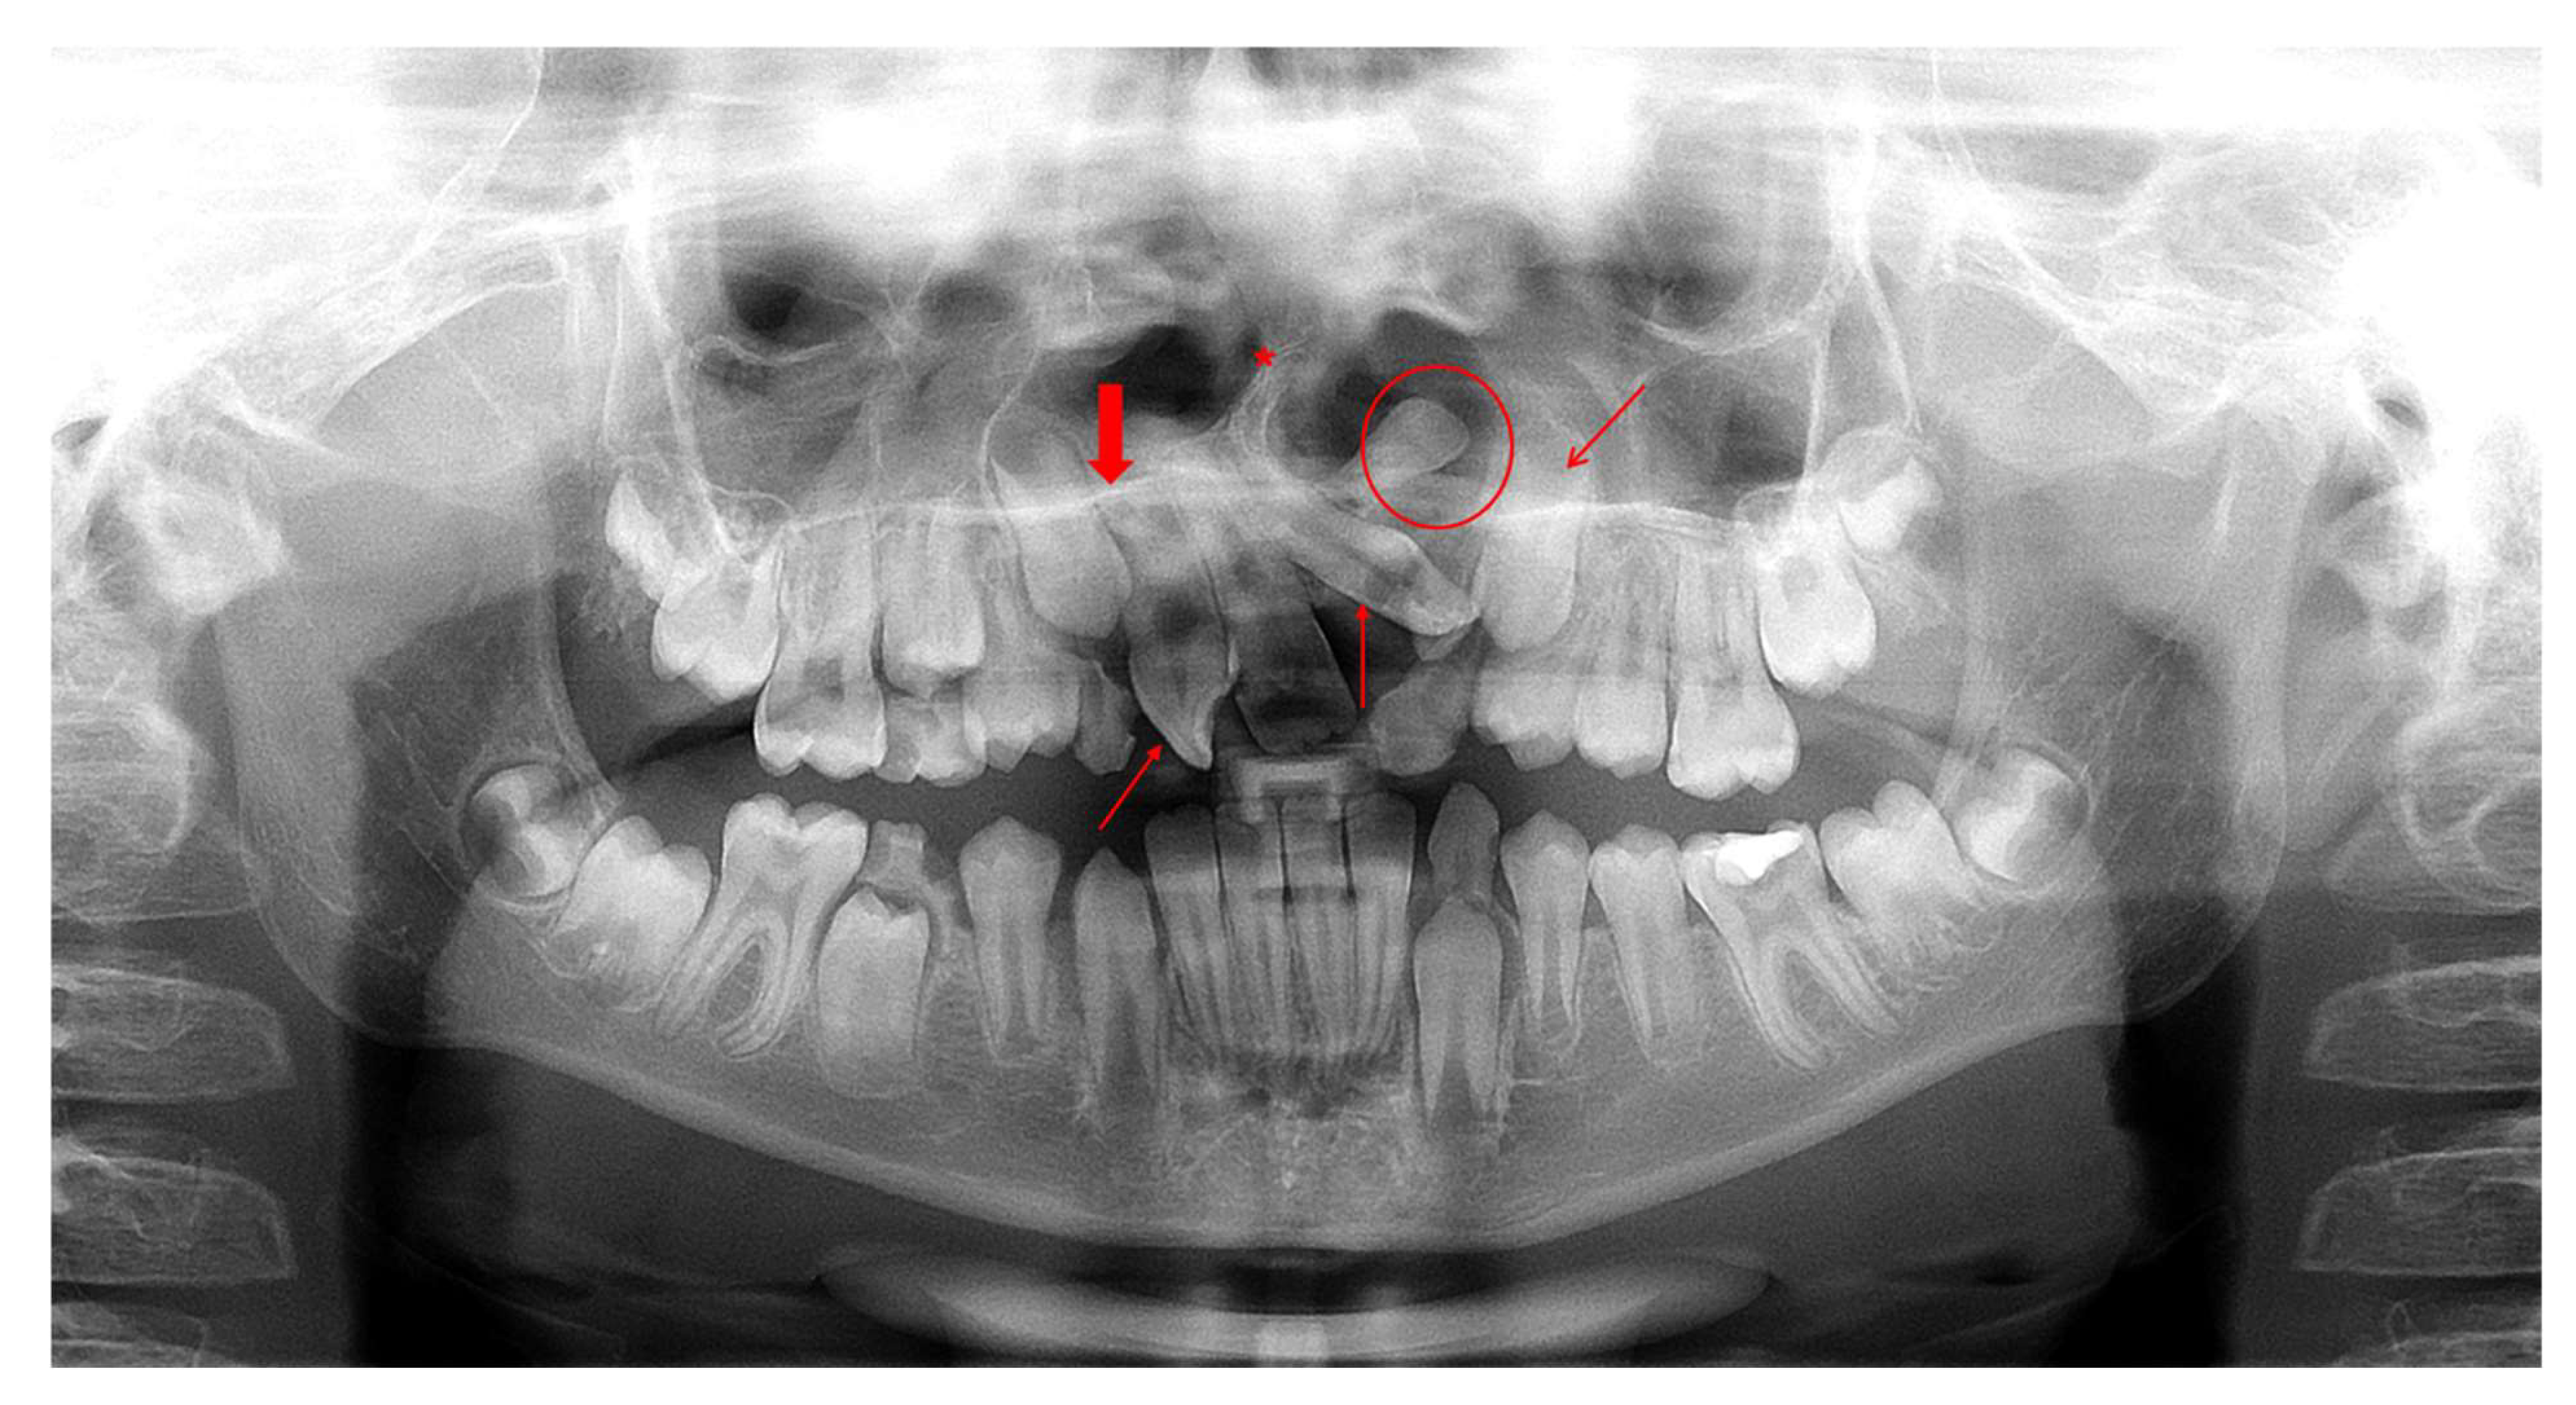
Figure 2.
Imaging records of a male patient (10.7 years old) diagnosed with CP—UR presenting various incidental findings: (a) OPT indicates agenesis of teeth 12, 22 and 25 (bold red arrows), impaction of tooth 13 (thin diagonal red arrow), taurodontism of teeth 16, 26, 36 and 46 (thin horizontal red arrows) and deviated nasal septum to the right (red asterisk). (b) Cone-beam computed tomography (CBCT) image of two incidentally detected tonsilloliths (axial view; red arrows). R: right, L: left.
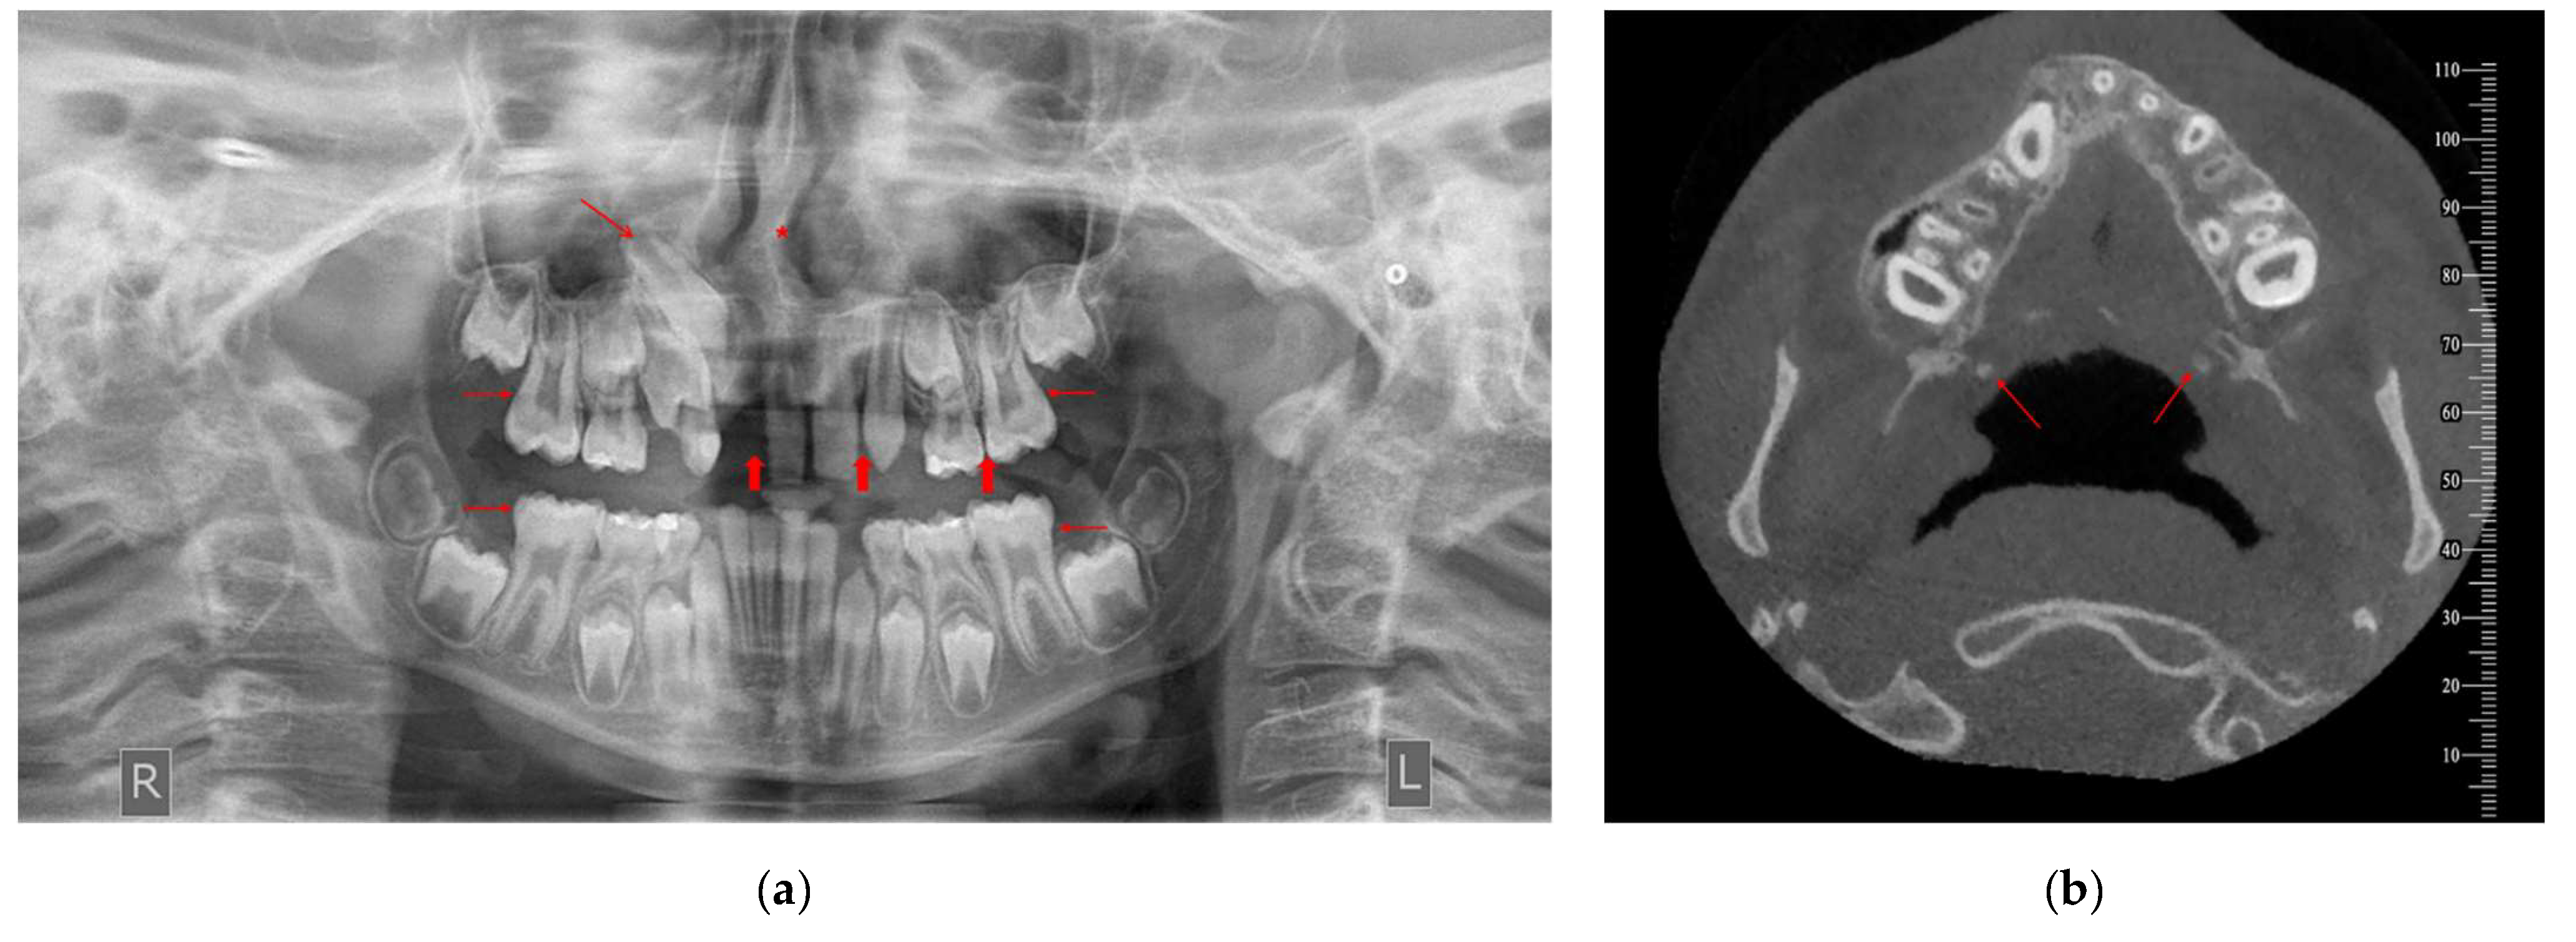
Figure 3.
CBCT image of incidentally detected flat condylar margins bilaterally on TMJ of a male patient (10.7 years old) diagnosed with CP—UR. The findings are imaged in sagittal view [right (a) and left TMJ (c)], coronal view [right (b) and left TMJ (d)] and 3D reconstruction [right (e) and left TMJ (f)]. R: right, L: left.
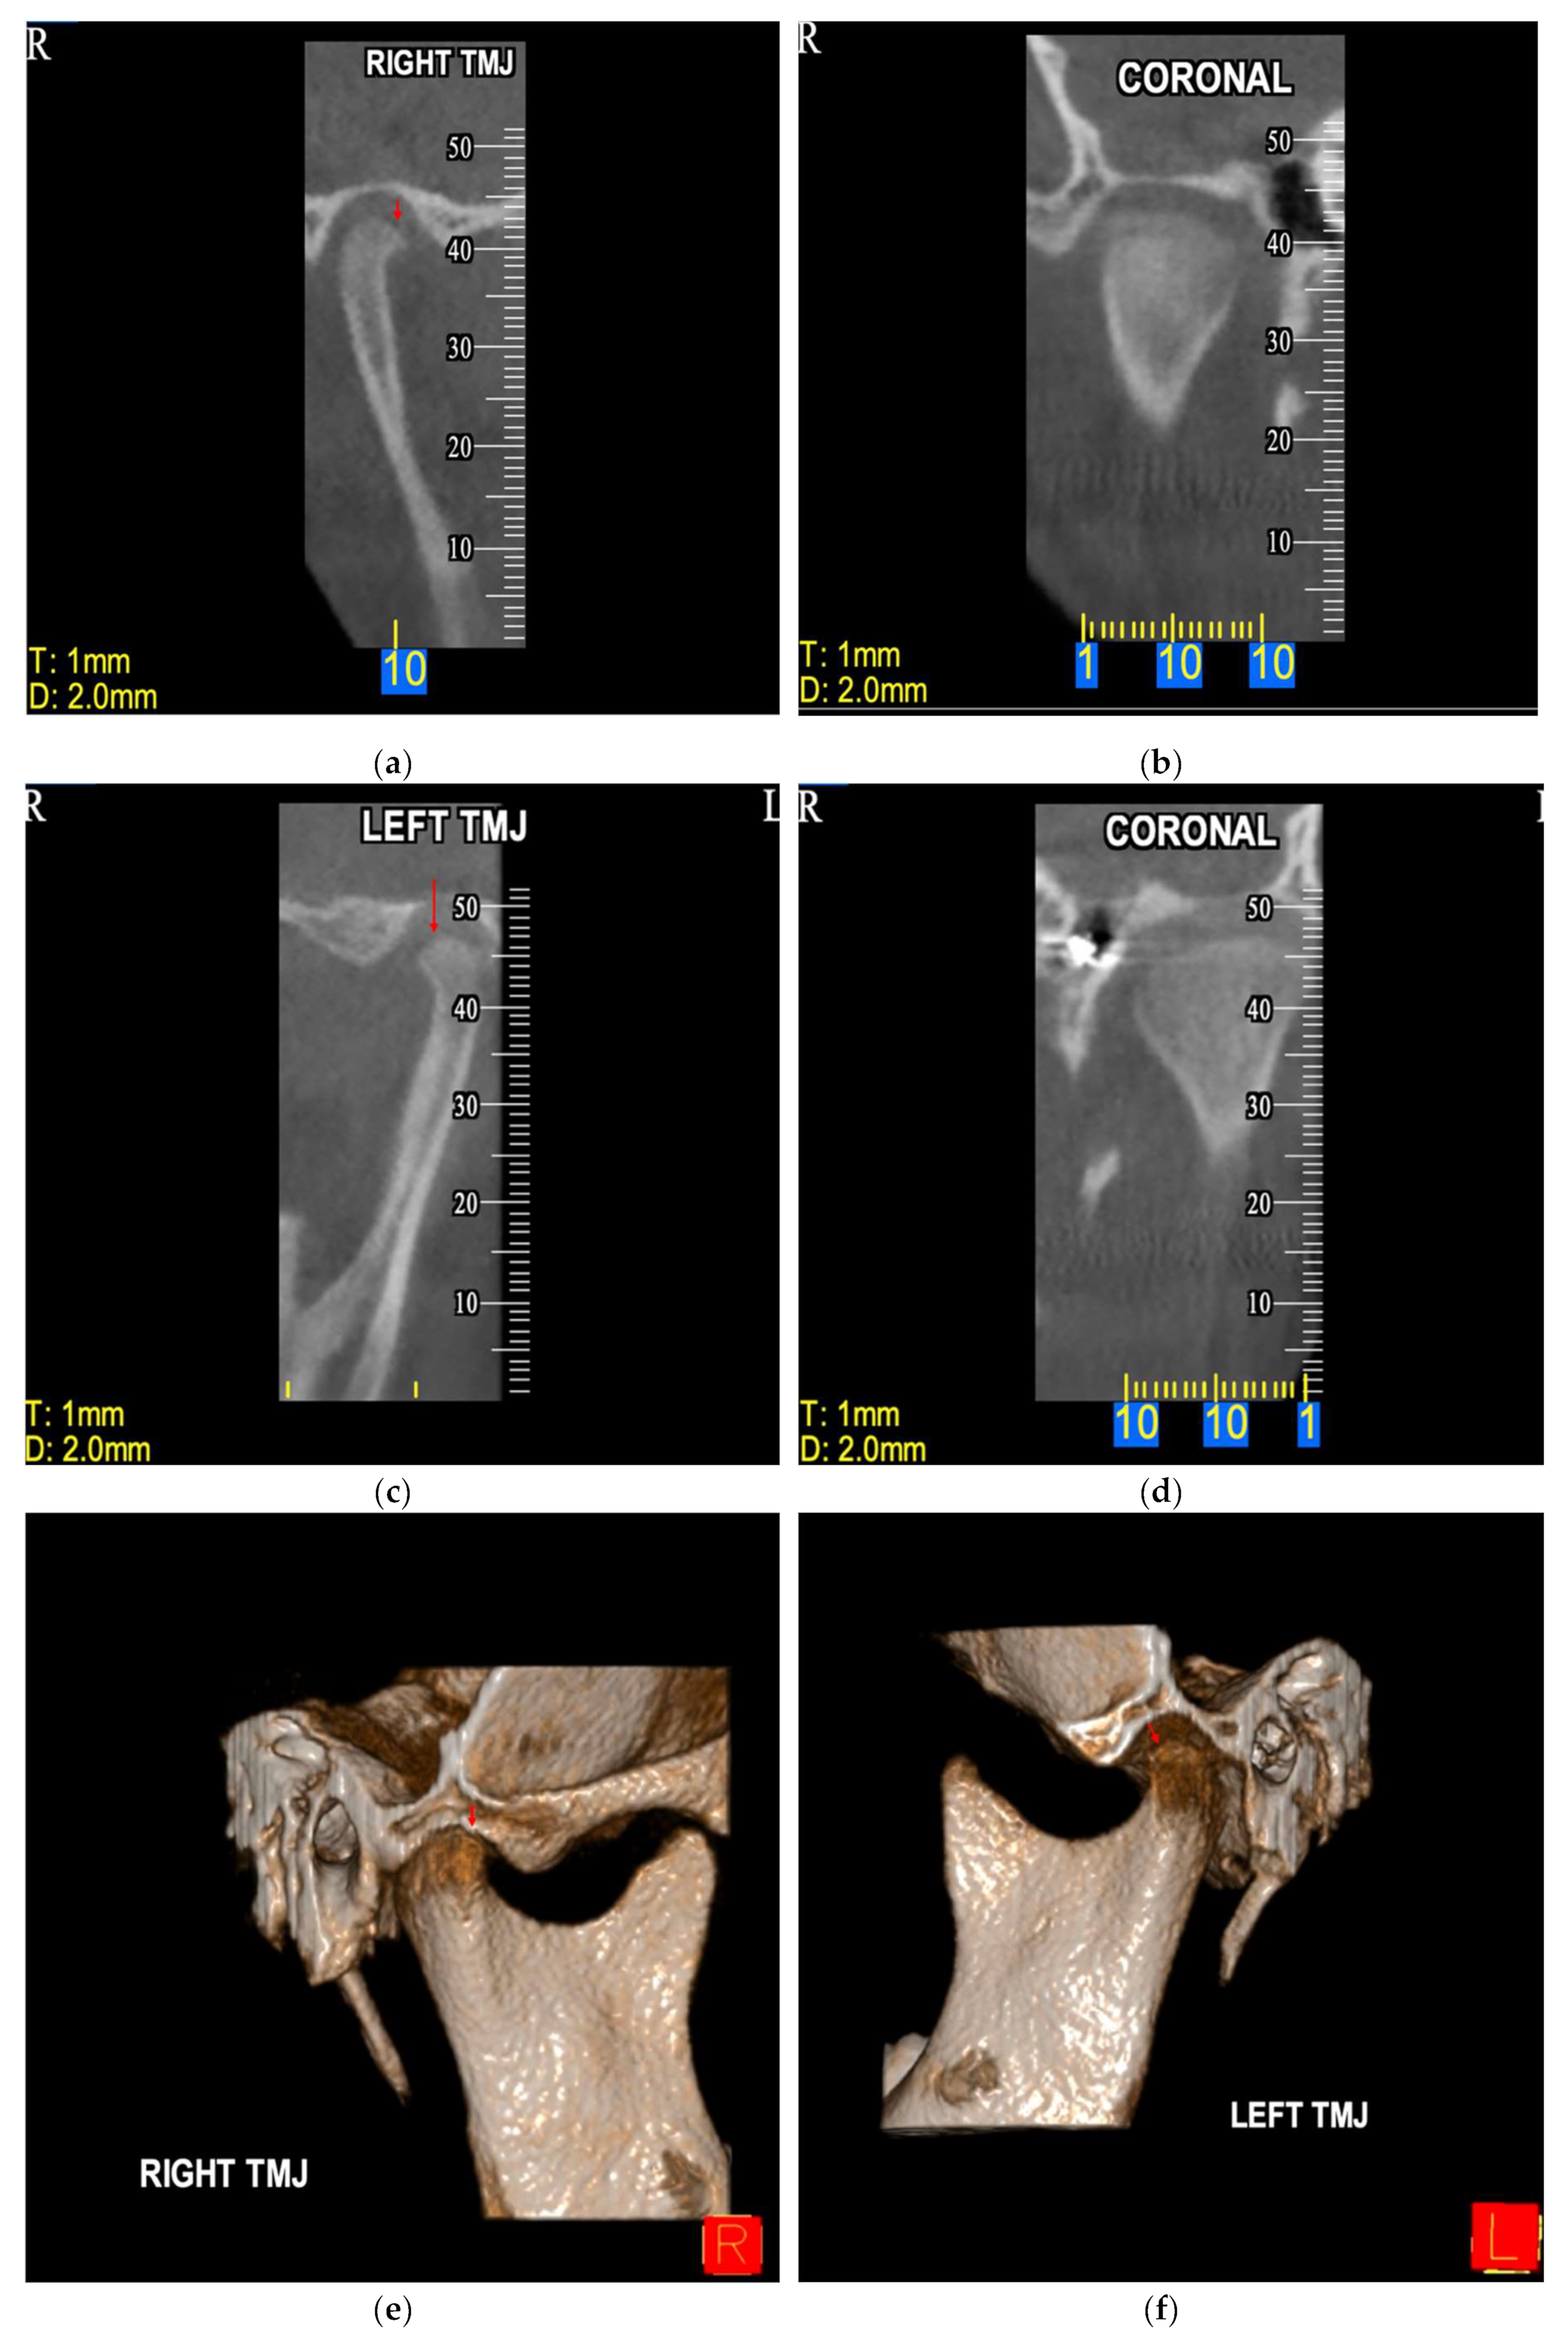

Table 1.
Demographic and disease characteristics of the study population.
| All participants | Controls | Cases | |
|---|---|---|---|
| N=120 | N=80 | N=40 | |
| Gender, n(%) | |||
| Females | 54 (45.0%) | 36 (45.0%) | 18 (45.0%) |
| Males | 66 (55.0%) | 44 (55.0%) | 22 (55.00%) |
| Age (years), mean (SD1) | 14.6 (5.0) | 14.6 (5.0) | 14.5 (5.0) |
| Cleft type, n(%) | |||
| CLP—B | 9 (7.5%) | 0 (0.0%) | 9 (22.5%) |
| CLP—UL | 16 (13.3%) | 0 (0.0%) | 16 (40.0%) |
| CLP—UR | 4 (3.3%) | 0 (0.0%) | 4 (10.0%) |
| CP | 5 (4.1%) | 0 (0.0%) | 5 (12.5%) |
| CP—UL | 3 (2.5%) | 0 (0.0%) | 3 (7.5%) |
| CP—UR | 3 (2.5%) | 0 (0.0%) | 3 (7.5%) |
| No | 80 (66.7%) | 80 (100.0%) | 0 (0.0%) |
1 SD: standard deviation.
Table 2.
Descriptive statistics on Incidental Findings (IFs).
| All participants | Controls | Cases | |
|---|---|---|---|
| N=120 | N=80 | N=40 | |
| IFs, n(%) | |||
| No | 31 (25.8%) | 30 (37.5%) | 1 (2.5%) |
| Yes | 89 (74.2%) | 50 (62.5%) | 39 (97.5%) |
| IFs in Maxilla, n(%) | |||
| No | 48 (40.0%) | 45 (56.3%) | 3 (7.5%) |
| Yes | 72 (60.0%) | 35 (43.8%) | 37 (92.5%) |
| Number of IFs in Maxilla, n(%) | |||
| 0 | 48 (40.0%) | 45 (56.3%) | 2 (5.0%) |
| 1 | 19 (15.0%) | 10 (12.5%) | 9 (22.5%) |
| 2 | 21 (17.5%) | 17 (21.3%) | 4 (10.0%) |
| 3 | 15 (12.5%) | 4 (5.0%) | 11 (27.5%) |
| 4 | 10 (8.3%) | 3 (3.8%) | 7 (17.5%) |
| 5 | 3 (2.5%) | 0 (0.0%) | 3 (7.5%) |
| 6 | 4 (3.3%) | 0 (0.0%) | 4 (10.0%) |
| 7 | 1 (0.8%) | 1 (1.3%) | 0 (0.0%) |
| IFs in Mandible, n(%) | |||
| No | 61 (51.7%) | 47 (58.8%) | 14 (36.8%) |
| Yes | 57 (48.3%) | 33 (41.3%) | 24 (63.2%) |
| Number of IFs in Mandible, n(%) | |||
| 0 | 61 (51.7%) | 47 (58.8%) | 14 (36.8%) |
| 1 | 16 (13.6%) | 9 (11.3%) | 7 (18.4%) |
| 2 | 32 (27.1%) | 19 (23.8%) | 13 (34.2%) |
| 3 | 1 (0.9%) | 1 (1.3%) | 0 (0.0%) |
| 4 | 5 (4.2%) | 2 (2.5%) | 3 (7.9%) |
| 5 | 0 (0.0%) | 0 (0.0%) | 0 (0.0%) |
| 6 | 3 (2.5%) | 2 (2.5%) | 1 (2.6%) |
| IFs in Paranasal sinuses, n(%) | |||
| No | 89 (80.9%) | 73 (97.3%) | 16 (45.7%) |
| Yes | 21 (19.1%) | 2 (2.7%) | 19 (54.3%) |
| IFs in Nasal cavity, n(%) | |||
| No | 74 (74.0%) | 66 (98.5%) | 8 (24.2%) |
| Yes | 26 (26.0%) | 1 (1.5%) | 25 (75.8%) |
| IFs in Middle and inner ear, n(%) | |||
| No | 3 (100.0%) | 1 (100.0%) | 2 (100.0%) |
| IFs in Orbit, n(%) | |||
| No | 71 (100.0%) | 67 (100.0%) | 4 (100.0%) |
| IFs in Skull, n(%) | |||
| No | 7 (100.0%) | 3 (100.0%) | 4 (100.0%) |
| IFs in Cervical spine, n(%) | |||
| No | 86 (100.0%) | 66 (100.0%) | 20 (100.0%) |
| IFs in TMJ structures, n(%) | |||
| No | 73 (79.4%) | 64 (85.3%) | 9 (52.9%) |
| Yes | 19 (20.6%) | 11 (14.7%) | 8 (47.1%) |
| IFs in Soft-tissues, n(%) | |||
| No | 24 (92.3%) | 24 (92.3%) | |
| Yes | 2 (7.7%) | 2 (7.7%) |
Table 3.
Comparison of the prevalence of IFs between cases and controls.
| No IFs | IFs | |
|---|---|---|
| Controls | 30 (37.5%) | 50 (62.5%) |
| Cases | 1 (2.5%) | 39 (97.5%) |
| χ2 = 17.05, df = 1, p < 0.001** | ||
df: degrees of freedom, ** highly statistically significant (p < 0.001).
Table 4.
Comparison of the prevalence of IFs by gender.
| Cases | No IFs | IFs |
|---|---|---|
| Females | 1 (5.6%) | 17 (94.4%) |
| Males | 0 (0.0%) | 22 (100.0%) |
| χ2 = 1.25, df = 1, p = 0.263 (ns) | ||
| Controls | No IFs | IFs |
| Females | 15 (41.7%) | 21 (58.3%) |
| Males | 15 (34.1%) | 29 (65.9%) |
| χ2 = 0.48, df = 1, p = 0.486 (ns) | ||
df: degrees of freedom, ns: not significant.
Table 5.
Comparison of prevalence of IFs by anatomical area.
| Maxilla | No IFs | IFs |
|---|---|---|
| Cases | 3 (7.5%) | 37(92.5%) |
| Controls | 45 (56.3%) | 35 (43.8%) |
| χ2 = 26.4, df = 1, p < 0.001 | ||
| Mandible | No IFs | IFs |
| Cases | 14 (36.8%) | 24 (63.2%) |
| Controls | 47 (58.8%) | 33 (41.3%) |
| χ2 = 4.95, df = 1, p = 0.026 | ||
| Paranasal sinuses | No IFs | IFs |
| Cases | 16 (45.7%) | 19 (54.3%) |
| Controls | 73 (97.3%) | 2 (2.7%) |
| χ2 = 41.17, df = 1, p < 0.001 | ||
| Nasal cavity | No IFs | IFs |
| Cases | 8 (24.2%) | 25 (75.8%) |
| Controls | 66 (98.5%) | 1 (1.5%) |
| χ2 = 63.38, df = 1, p < 0.001 | ||
| TMJ structures | No IFs | IFs |
| Cases | 9 (52.9%) | 8 (47.1%) |
| Controls | 64 (85.3%) | 11 (14.7%) |
| χ2 = 8.87, df = 1, p = 0.003* | ||
df: degrees of freedom, * statistically significant (p <0.05).
Table 6.
Comparison of number of IFs in maxilla and mandible.
| Mean (SD) | p-Value† | ||
|---|---|---|---|
| Number of IFs in Maxilla | Number of IFs in Mandible | ||
| All participants | 1.60 (1.74) | 1.03 (1.36) | 0.006* |
| Cases | 2.93 (1.70) | 1.34 (1.42) | <0.001** |
| Controls | 0.94 (1.33) | 0.88 (1.32) | 0.766 |
* statistically significant (p <0.05), ** highly statistically significant (p <0.001). † p-value derived from independent sample t-test.
Table 7.
Comparison of the prevalence of IFs by cleft type in the case group.
| No IFs | IFs | |
|---|---|---|
| CLP—B | 0 (0.0%) | 9 (22.5%) |
| CLP—UL | 0 (0.0%) | 16 (40.0%) |
| CLP—UR | 0 (0.0%) | 4 (10.0%) |
| CP | 1 (2.5%) | 4 (10.0%) |
| CP—UL | 0 (0.0%) | 3 (7.5%) |
| CP—UR | 0 (0.0%) | 3 (7.5%) |
| χ2 = 20.54, df = 5, p < 0.001** | ||
df: degrees of freedom, ** highly statistically significant (p < 0.001).
Table 8.
Descriptive statistics on tooth agenesis and microdontia.
| All participants | Controls | Cases | |
|---|---|---|---|
| N=120 | N=80 | N=40 | |
| Tooth agenesis, n(%) | |||
| No | 72 (60.0%) | 61 (76.3%) | 11 (27.5%) |
| Yes | 48 (40.0%) | 19 (23.7%) | 29 (72.5%) |
| Microdontia, n(%) | |||
| No | 117 (97.5%) | 78 (97.5%) | 39 (97.5%) |
| Yes | 3 (2.5%) | 2 (2.5%) | 1 (2.5%) |
Table 9.
Comparison of prevalence of tooth agenesis and microdontia between cases and controls.
| No Tooth agenesis | Tooth agenesis | |
|---|---|---|
| Cases | 11(27.5%) | 29 (72.5%) |
| Controls | 61(76.3%) | 19 (23.8%) |
| χ2 = 24.41, df = 1, p < 0.001** | ||
| No Microdontia | Microdontia | |
| Cases | 39 (97.5%) | 1 (2.5%) |
| Controls | 78 (97.5%) | 2 (2.0%) |
| Fisher’s exact test p > 0.999 (ns) | ||
df: degrees of freedom, ** highly statistically significant (p < 0.001), ns: not significant.
Table 10.
Frequency of Tooth agenesis by tooth.
| Tooth | n (%) |
|---|---|
| 12 | 13 (21.0%) |
| 14 | 2 (3.2%) |
| 15 | 2 (3.2%) |
| 18 | 2 (3.2%) |
| 22 | 15 (24.2%) |
| 25 | 5 (8.1%) |
| 28 | 3 (4.8%) |
| 32 | 1 (1.6%) |
| 35 | 4 (6.5%) |
| 36 | 1 (1.6%) |
| 37 | 1 (1.6%) |
| 38 | 2 (3.2%) |
| 42 | 2 (3.2%) |
| 45 | 4 (6.5%) |
| 46 | 1 (1.6%) |
| 47 | 1 (1.6%) |
| 48 | 3 (4.8%) |
Table 11.
Descriptive statistics on third molar aberrations.
| All participants | Controls | Cases | |
|---|---|---|---|
| N=120 | N=80 | N=40 | |
| Third molar aberrations, n(%) | |||
| No | 100 (83.3%) | 70 (87.5%) | 30 (75.0%) |
| Yes | 20 (16.7%) | 10 (12.5%) | 10 (25.0%) |
| Third molar Impaction, n(%) | |||
| No | 108 (90.0%) | 75 (93.8%) | 33 (82.5%) |
| Yes | 12 (10.0%) | 5 (6.3%) | 7 (17.5%) |
| Third molar Tooth agenesis, n(%) | |||
| No | 113 (94.2%) | 75 (93.8%) | 38 (95.0%) |
| Yes | 7 (5.8%) | 5 (6.3%) | 2 (5.0%) |
| Third molar Taurodontism, n(%) | |||
| No | 119 (99.2%) | 80 (100.0%) | 39 (97.5%) |
| Yes | 1 (0.8%) | 0 (0.0%) | 1 (2.5%) |
Table 12.
Comparison of prevalence of Third molar aberrations.
| No Third molar aberrations | Third molar aberrations | |
|---|---|---|
| Cases | 30 (75.0%) | 10 (25.0%) |
| Controls | 70 (87.5%) | 10 (12.5%) |
| χ2 = 3.00, df = 1, p = 0.083 (ns) | ||
| No Impaction | Impaction | |
| Cases | 33 (82.5%) | 7 (17.5%) |
| Controls | 75 (93.8%) | 5 (6.3%) |
| χ2 = 3.75, df = 1, p = 0.053 (ns) | ||
| No Tooth agenesis | Tooth agenesis | |
| Cases | 38 (95.0%) | 2 (5.0%) |
| Controls | 75 (93.8%) | 5 (6.3%) |
| Fisher’s exact test p > 0.999 (ns) | ||
| No Taurodontism | Taurodontism | |
| Cases | 39 (97.5%) | 1 (2.5%) |
| Controls | 80 (100.0%) | 0 (0.0%) |
| Fisher’s exact test p = 0.333 (ns) | ||
df: degrees of freedom, ns: not significant.
Disclaimer/Publisher’s Note: The statements, opinions and data contained in all publications are solely those of the individual author(s) and contributor(s) and not of MDPI and/or the editor(s). MDPI and/or the editor(s) disclaim responsibility for any injury to people or property resulting from any ideas, methods, instructions or products referred to in the content. |
© 2024 by the authors. Licensee MDPI, Basel, Switzerland. This article is an open access article distributed under the terms and conditions of the Creative Commons Attribution (CC BY) license (http://creativecommons.org/licenses/by/4.0/).
Copyright: This open access article is published under a Creative Commons CC BY 4.0 license, which permit the free download, distribution, and reuse, provided that the author and preprint are cited in any reuse.


