Submitted:
04 July 2024
Posted:
04 July 2024
You are already at the latest version
Abstract
Despite the known benefits of precision agriculture, the adoption is challenging due to the cost of investment and the farm sizes. Therefore, profitability is an important aspect to consider. This study aimed to evaluate the net returns, profitability, and investment efficiencies of PA by different economic farm sizes. The study was based on data retrieved from FADN and Eurostat. The study examined four countries (Poland, Germany, France, and Romania) under field crop farming using an investment cost of €35 941 - €71 883, and a 20% and 15% reduction in the cost of crop protection and fertilizer usage respectively without compromising productivity. There is a positive relationship between the adoption of PA and farm returns for larger-scale farms. The result of the profitability and analysis of investment efficiency using NPV showed a positive value for economic farm sizes of €100 000 and above. Hence, it is not economically advisable that all farmers use PA technologies with the hope that they will be profitable but with public support (subsidies) more farms will be able to use PA and be profitable. Also, an opportunity to meet the goal of the European Union Green Deal of minimizing emissions that cause climate change.
Keywords:
Precision agriculture
; sustainability
; net present value
; profitability of precision agriculture
; farm returns
; cash flow
; public support for precision agriculture
1. Introduction
Agriculture is vital in the global economy, as it supplies food and raw materials to support the increasing worldwide population. It is also crucial for sustaining human existence, and to increase food availability, and facilitating food security, the agricultural sector is of utmost significance [1,2]. However, the current state of agriculture faces substantial problems that need to be tackled to ensure food security and sustainability. One of the primary issues is the need to feed a rapidly growing global population, while at the same time reducing the environmental impact and preserving natural resources for future generations.
This puts significant pressure on agriculture to produce more food, often leading to the intensification of production systems, which can have negative environmental consequences. The rivalry for the already limited resources of land and water will intensify quickly as a result of this growth [3]. In addition to the need to produce more food, agriculture also faces other challenges related to the sustainability of its practices.
The interdependence between food production and environmental protection is a crucial issue that must be addressed. Several agricultural practices impede long-term sustainability. Traditional farming applies inputs uniformly, regardless of potential variability or heterogeneity, throughout the field which damages the environment [4]. Conventional farming methods often result in excessive use of water, fertilizers, and pesticides, leading to soil degradation, water pollution, loss of biodiversity, and climate change [5,6]. Therefore, it is increasingly important that we discover innovative methods to develop and manage our agricultural systems. In response to these challenges, precision agriculture (PA) has emerged as a transformative and innovative approach that leverages advanced technologies to optimize crop yields, while minimizing inputs, reducing environmental impact, and boosting agricultural profitability [7,8]. Unlike traditional farming, precision farming focuses on managing and maintaining individual fields rather than the entire acreage, utilizing a system-based methodology to optimize both economic and environmental benefits. Precision agriculture according to [9] is defined as a highly effective farming system that utilizes the latest technology and management techniques to achieve maximum agricultural productivity. By adopting best practices in crop planning, tillage, planting, chemical application, harvesting, and post-harvest processing, farmers can significantly enhance productivity, improve product quality, and minimize the impact of their activities on the environment. Such a strategy involves careful consideration of various factors, including optimal crop rotation, judicious use of fertilizers and pesticides, and the use of energy-efficient technologies, among others [9]. By leveraging advanced technologies such as remote sensing, satellite navigation systems, and geographic information systems, farmers can now track and analyze various factors such as soil quality, crop health, pest infestations, humidity, and temperature levels. This data-driven approach empowers farmers to make informed decisions about planting, fertilizing, harvesting, and achieving their goals leading to a more sustainable and profitable farming enterprise [10].
Furthermore, precision agriculture is a vital approach that can significantly help to improve agricultural production, enable farmers to understand crop conditions, prevent damages, and optimize resource usage by applying just the right quantity of pesticide, nutrients, and irrigation water [11,12]. This comprehensive method of precision agriculture involves various components, such as data analysis, decision-making processes, background data, record-keeping systems, specialized equipment, and evaluation and revision. Precision agriculture is also particularly crucial in light of climate change and the increasing world population as it helps reduce resource consumption and achieve maximum harvest potential. The system also relies on sensors to measure environmental parameters and control climate conditions for each crop, making it a highly effective and efficient approach to farming [13]. Precision agriculture has grown to encompass various fields, such as precision horticulture, precision viticulture, and precision livestock farming.
One of the most compelling advantages of precision agriculture lies in its capacity to lessen the environmental implications of farming. In addition, [14] discovered that precision agriculture technologies promote productivity, raise net return, and increase input utilization efficiency while minimizing the producer’s increased risk associated with net return variability. Producers can precisely calculate the necessary quantity of fertilizer and select the most efficacious varieties for a specific region. Moreover, the indirect benefits, such as minimizing environmental impact by decreasing pesticide usage on crops are associated with several PA technologies. It also helps in the reduction of groundwater depletion [15]. PA enhances fertilizer usage, reduces nitrogen losses, reduces cost, and promotes farm profitability by matching input needs with crop requirements. Along with cost-effective plant pest and disease management that enhances production and supports environmental sustainability, precision agricultural technology also gives farmers access to accurate pest monitoring and forecasts [16].
Precision agriculture has many established advantages and has gained significant interest as a potential solution for the challenges confronting modern agriculture, but implementing these technologies is not without difficulties, especially in places with little infrastructure and resources. Hence, it is important to thoroughly analyze the cost and profitability associated with these technologies to make an informed conclusion regarding the implementation of PA technologies. Understanding the economic implication and investment efficiency of precision agriculture adoption is also crucial for both farmers and policymakers, as it can impact investment decisions, technology acceptance, and ultimately, the nation’s capacity to sustain agricultural output.
The aim of the study is to determine the economic viability of precision farming techniques, depending on the economic size of the farm, in selected countries of the European Union. An additional objective is to indicate the scale of public support for the development of this system.
2. Materials and Methods
Study Area
Four countries were chosen (Poland, Germany, France, and Romania). These countries represent different regions in Europe, each of which has a unique mix of soil types, farming practices, and agricultural landscapes. Poland and Romania represent the new Member States, where the socialist system prevailed until the end of the 1980s. Germany and France (both in Western Europe), are the biggest European Union (EU) agriculture. They have similar agriculture and the same climatic zone. Poland, Germany, and France have similar crops e.g., cereals, sugar beets, potatoes, etc. Romania is different, has specific agriculture and dual agriculture. There is a big domination of private farms.
Materials and Methodology
This study was primarily based on variables retrieved from the Farm Accountancy Data Network (FADN) database and Eurostat. The FADN database provided detailed information on farm economic parameters, such as family farm income, production costs, agricultural output, cost of crop protection and fertilizer used, and the relation between chemical cost and crop production. The type of farming used is field crops only. The statistical data from the Eurostat database were used in the research to provide data on the number of holdings and their areas according to economic size classes.
The main aim of applying precision agriculture on farms in this research is to reduce the use of chemical input. It was thought that there would be no detrimental effects on yield levels from a 20% reduction in plant protection products and a 15% reduction in mineral fertilization [17]. So for this research, a 20% reduction in plant protection and a 15% reduction in fertilizer usage were assumed, after the implementation and use of precision techniques. Precision farming necessitates an additional expenditure for each agricultural farm ranging from 35 941 to 71 883 Euros.
The Net Present Value (NPV) and Internal Rate of Return (IRR) methods were crucial factors to evaluate while analyzing investment efficiency from the standpoint of our study’s objectives.
The present value of cash inflows less the present value of cash outflows over time is known as net present value, or NPV [18]. In the present study, cash flows were indicated as the amount saved by the reduction in the cost of fertilizer and crop protection and were used in making investment decisions on the profitability of using precision techniques by the farmers. To obtain NPV, there is a need to estimate the time that the investment generates cash flows and the amount of future cash flows generated, which is the extra income generated from the reduction in the use of fertilizers and crop protection, as well as a discount rate (inflation rate). The inflation rate of 2021 for each country was used, the last one before the war on Ukraine. The formula of the NPV method is defined by:
NPV = Net Present Value
= discount rate (inflation rate, 2021)
t = time
Cash flow = Sum of the 20% reduction in the cost of crop protection and the 15% reduction in the cost of fertilizer.
A positive NPV means the investment is profitable and a negative NPV indicates a potential loss.
The Agricultural tractors are classed as type 746 “Tractors” under the Classification of Fixed Assets (KŚT). The “List of fixed assets” specifies that they are subject to an annual depreciation rate of 14% [19]. This rate of depreciation is equivalent to 7 years of use (100/14) = 7.14.
Considering the objectives of the analysis, it was important to determine the value of public support to expand the land area under PA usage. The difference between the real value of the investment and the value of the investment at zero profitability is the necessary value of public support for single farms. The total value of public support was calculated by multiplying the total number of farms in each economic farm size by the value of public support needed per farm. These variables for this study were estimated based on this methodology, using this formula:
VPS
= R – V
Where:
VPS = Value of Public Support (€/farm)
R = Real value of investment (€/farm)
V = value of the investment at zero profitability, calculated as:
Where:
= discount rate (inflation rate, 2021)
t = time
Cash flow = Sum of the 20% reduction in the cost of crop protection and the 15% reduction in the cost of fertilizer.
3. Results and Discussion
Table 1 shows the relationship between chemical costs and crop production, the reduction in fertilizer and crop protection usage, and the cash flow in Poland, Germany, France, and Romania for the year 2021 segmented into different economic farm sizes for field crop types of farming. The table presents several important findings about how crop production is affected by chemical costs as well as the possible advantages of cutting back on fertilizer and crop protection costs. This shows how much money farmers spend on chemical inputs to support crop development and protection. In all the economic size groups, implementing a 15% reduction in fertilizer usage and a 20% reduction in crop protection owing to PA results in significant savings irrespective of the country. The results indicate that the volume of chemical input cost savings depends on the economic size and associated scale of production rather than on the country. The volume of savings in each country increases with successive economic size classes.
The results of the research are in line with other studies that the use of PA causes a reduction in chemical usage. [20] Studied the effects of variable application (VA) of inputs on orange plants vs conventional uniform application (UA) fertilizations. Indicators of soil fertility, leaf nutritional status, and surface production maps were used by the researchers to determine the VA requirements (P and K). Their results indicated that an average of 39% less input was required per ha and per year. [21] Also used the plantation’s production map to measure how much nitrogen each plant and orchard area absorbed from the soil in their investigation of the variable nitrogen application for apple trees. The research showed that the VA of N saved up to 38% of N for comparable crop production. Also, compared to uniform fertilizer treatments, variable rate fertilizer applications reduced the amount of nitrogen fertilizer used by 56% and 50% in 2012 and 2013, respectively [22]. Furthermore, up to 38% of expenditures may be avoided with precision agriculture; the majority of these savings will come from using less fertilizers. Farmers that adopt variable application techniques can save as much as 51% on phytosanitary pesticides and 46% on fertilizers [23]. In the study conducted by [24], it was found that there were lower variable costs as a result of the precision system’s reduced input utilization and reduced overlap of input, which resulted in a higher level of profitability compared to a more traditional method. In addition, [25] in their study on measuring farm profitability after adopting precision agriculture technologies stated that the entire net savings amount to 4,3% per hectare, with a capital cost of €44,08/ha derived by taking into account the full investment in PA technologies and a net save of €33,47 per hectare. Their research revealed that the adoption of PA technologies led to a noticeable but small drop in the cost of production. They were able to conclude that even with the relatively small net savings of 4,3% per hectare, PA technologies’ cost-effectiveness increased farming enterprises’ overall profitability and sustainability.
- Analysis of the Investment Efficiency of Precision Agriculture (PA) with the Use of the Net Present Value (NPV) Method
The NPV method was used to evaluate the economic implications of adopting PA technologies. The table below (Table 2) shows a comprehensive result of the analysis of investment efficiency for each country studied with the use of NPV. It was assumed that the additional cost of investment of about €35 941 - €71 883 is needed to implement PA technologies. The calculation was done for both the minimum investment cost of €35 941 and the maximum of €71 883 for each country analyzed. The initial investment cost was not discounted because it is in today’s money (year 0), it is in its present value.
For Table 2, the cash flow was discounted and deducted from the initial investment of €35 941 and €71 883 to get the NPV. The discounting was done using an annual depreciation rate of 14% as stated in the methodology and this is equivalent to 7 years of use. A 5% discount rate (inflation rate for Poland) was used [26]. For Germany, a 3% discount rate was used [27]. The inflation rate of 1.6% was applied as the discount rate [28] for France and the inflation rate of 5% for Romania [29].
From Table 2, with an investment of €35 941 only farms with an economic farm size of 100 000 EUR and above gave a positive return on investment for each country.
But with a higher investment cost of €71,883 in the use of precision technologies, only the economic farm size of >= 500,000 Euro was positive and profitable as shown in Table 2. Therefore with lower investment, more farms can use precision tools and be profitable. As evident from Table 2, the lower the economic farm sizes, the greater the loss (negative return on investment). It is difficult for smaller farms to use PA technologies because of the large investment cost. Therefore, before the adoption and implementation of precision technologies, some important factors to take into consideration are the farm sizes and the cost of investment. This correlates with the research conducted by [30], which examined the complex aspects influencing the likelihood of an Italian farmer’s adoption of new PA technologies. The authors discovered that the most technologically adept farmers shared comparable characteristics, such as having extensive agricultural fields that usually covered an area of 143 hectares. Also, numerous factors such as farm size, as well as others such as, technologies utilized, and the regional heterogeneity of soil conditions and yield response, impact how profitable PA can be. Another study also highlighted how crucial farm scale is for PA technologies’ acceptability and profitability. Large farms can earn greatly from the scale-related gains that come with implementing PATs, but smaller farms might meet problems because of the high costs and significant investment necessary. Therefore, when examining the viability and effectiveness of applying PA technologies, farm scale becomes a crucial element [25]. A study was also conducted on the evaluation of the financial effects of utilizing precision agricultural technologies on cotton crops and the research was conducted in a 3,500 ha overall agricultural area. The result showed that farmer’s profitability was boosted by the PA system, which enhances operational income and profitability index. The positive net present value (NPV) was an improvement over the conventional method, according to the investment feasibility indicators [31]. Moreover, [32] discovered that the net present value (NPV) at a 12-percent discount rate after ten years was positive. This demonstrated that the technology investment was both financially and practically possible.
- Share of Farms in Total Numbers of holdings and Agricultural Area in the Examined Countries That Can Implement Precision Agriculture
Table 3 reflects the number of farms in holdings and total agricultural areas in each economic farm size that can implement precision agriculture and be profitable in examined counties. This table shows the share of farms in the total number of holdings and agricultural areas by economic class.
The result from Table 3 then shows that with an investment of €35 941, only 3,2% of farms and 28,6 % of land in Poland can implement PA. But only 0,3% of farms and 8.6% of land in Poland can implement precision agriculture with an investment of €71 883. For Germany with an investment of €71 883, PA can be implemented successfully on only 7,7% of farms and 37,6% of the land, whereas with an investment of €35 941, 36,6% of farms and 77,7% of the land in Germany can implement PA. Only 6,2% of farms and 12,3% of land in France can implement PA when €71 883 is invested. But with an investment of €35 941, 45,5% of total agricultural land owned by a farmer or farming entity managing 75,5% of all agricultural land in France can effectively implement PA. This means more farmers can use precision agriculture and be profitable in France compared to the other countries. In Romania, only very few farmers manage larger farm sizes and over 70% of farmers manage small farm sizes. Therefore with an investment of €71 883, only 0,1% of agricultural entities managing 19% of land can implement PA. An investment of €35 941 allows only 0,5% of holdings and 41,8% of land. All farmers should not jump to the conclusion that using precision technologies will lead to an increase in their profitability. This research has shown the total number of farms in each country studied that can implement precision agriculture and be profitable based on the calculation of the NPV and IRR. A study was also conducted by [33] who discovered that farmers shouldn’t adopt PA technologies in the hopes of enhancing farm profitability, even though they might be cost-effective investments and increase some operational efficiency. [34] found that younger farm owners and those with a farm size larger than 300 hectares were the two criteria that affected and determined Hungarian farmers’ usage of PA technology. Another research conducted in Germany showed that among German crop producers, farm size had a strong link with PA adoption, more notably if they possess a substantial amount of arable land, then they are more inclined to adopt precision agricultural technologies as indicated by [35] study.
- Need for Support for Precision Agriculture (PA) from Public Funds
Only for the largest farms (Table 3) is the use of precision farming technologies profitable. Nevertheless, public support in the form of investment subsidies can significantly increase the number of farms and the area where it can be applied. The required value of investment at zero profitability for every economic size that was not profitable was calculated. This was done to determine how much is needed to support the farmers in various farm sizes to be able to use PA with the investment cost of €35 941 and be profitable. Public support is not necessary for economic farm sizes of 100 000 EUR and above with a minimum investment cost of €35 941. Table 2 shows that the value of the discounted flows increases in successive economic size classes. According to the methodology used, this means that the gap between investment at zero profitability and the real value of investment is decreasing. It was therefore assumed that public support should only apply to farm sizes of 50 000 to less than 100 000 EUR. In practice, it is more realistic and necessary to offer support only to this economic farm size. In this class in every country value of support per farm is the smallest, so taking into account only these holdings is in line with the principle of rationality of public spending.
The value of investment at zero profitability in each economic farm size by the farmers, the value of support per farm (additional amount of money needed to reach the minimum required investment cost for PA usage), and the total value of public support needed to enable all farms in each economic size to implement PA are shown in Table 4. The amount farmers can invest to use precision agriculture and be at zero profitability decreases as the economic farm size increases meaning more support is needed for smaller farm sizes for the four countries as shown in Table 4.
The result from Table 4 shows that 62 610 farms in Poland are classified as having an economic size between 50 000 - < 100 000 EUR. This equates to a national investment of about €1 billion. Therefore, 15% more agricultural land (2 237 890 hectares) in Poland, will be able to implement PA with public support, meaning close to half of the total agricultural area (43,8%) will be covered by precision agriculture. In Germany, there are 32 860 farms in the economic size of 50 000 - < 100 000 EUR which translates into an investment of about €395 million on a national scale for all farms in this economic size. This farm size covers 8,9% (1 480 940 ha) of the total agricultural area. This indicates that with support, 86,6% of the total agricultural area will be covered by precision agriculture, which is a significant portion. Similarly, in France farmers in the economic size range of 50 000 - < 100 000 EUR require total support of €10 963 to make use of PA, as they may only invest €24 978 without incurring a loss per farm. France has a total of 60 340 farms in this particular economic farm size, which amounts to a total investment of €662 million on a national scale for all farms in this category. This farm size also covers 13,3% (3 637 530 ha) of the total agricultural area. Therefore, if all farms sized of at least 50 000 EUR implement precision agriculture, it would account for more than 88% of France’s total agricultural land. Furthermore, to facilitate the use of PA by farmers in Romania with economic sizes ranging from 50 000 - < 100 000 EUR, public support of €19 172 per farm is necessary. This amounts to a total national investment of €248 million for all farms falling within these economic sizes. Also, 8,9% (1 126 230) of the entire agricultural area corresponds to this economic size. This means with the subsidies, precision agriculture will cover over half (50,7%) of Romania’s whole agricultural land.
When the EU helps and supports these farms by subsidizing PATs, then more than half of the total agricultural area can be covered by PATs, which serves as an opportunity to meet the goal of the European Union Green Deal of minimizing emissions into the environment which causes climate change. Therefore, there is a need for support for precision agriculture from public funds. With investment support (subsidy) from public funds, many more farms will be able to use PATs even in Poland and Romania.
Figure 1 below shows the share of farms that can use PA and be profitable with and without public support for the minimum value of investment €35 941. The figure indicates clearly that more farms (total holdings and agricultural areas) in Poland, Germany, France, and Romania will be covered by PA with subsidies. The importance of public support cannot be over-emphasized, because there is a significant increase in the share of farms in the total numbers of farms that can implement PA with public support (subsidies).
4. Conclusions
In this present study, it was discovered that the application of PA allows farmers the ability to increase their financial performances while also potentially reducing the environmental impact associated with reduced chemical application. Due to the high value of precision agriculture equipment investment, larger farms profit more from the reduction in chemical usage in crop production than smaller farms and the amount saved rises with the economic farm size. Even with variances in total output and chemical cost across all economic size groups, the savings from reductions were significant. PA aids in the optimization of chemical use, enhancing financial sustainability and cost-effectiveness while also minimizing the impact on the environment.
Furthermore, it can be concluded from the result of the profitability analysis of investment efficiency that regardless of the country, larger farms had a positive net present value (NPV), and smaller farms with an economic size of less than 100 000 EUR demonstrated a negative NPV. Consequently, farm size is a key aspect when considering the profitability and cost efficiency of adopting PA technologies. The scale-related gains that come with deploying PA technologies can be particularly useful for large farms, but the significant investment expenditures may cause issues for smaller farms.
Moreover, precision farming has enormous potential as a means of minimizing the environmental effects of agriculture by lowering chemical usage, all without compromising productivity. The cost and profitability of employing PA make it evident from these studies that they are only profitable for larger farm sizes, hence it doesn’t follow that all farms should use PA technologies in the hopes of making a profit.
Finally, to avoid financial losses as well as minimize environmental damage, farmers should have organizational support and public support in the form of subsidies to enable more agricultural areas to use PA. The NPV was equated to zero to get the amount of investment needed to make farmers in each economic size break even (zero profitability). From this, the additional amount needed to reach the minimum threshold for PA technology usage was calculated which is the value of public support (subsidy) to be provided to the farmers. It is also more realistic and necessary to offer support only to the economic farm size of 50 000 - < 100 000 EUR as others are too small for public support to be justified. For all farms in this economic size, the total value of the public needed is €1 083 112 135 in Poland, €394 931 390 in Germany, €661 525 072 in France, and €247 510 940 in Romania. Additionally, there is a chance to achieve the European Union Green Deal’s target of reducing emissions into the atmosphere that contribute to climate change. Therefore, public support is essential to assist precision agriculture usage.
References
- Otsuka, K. Food insecurity, income inequality, and the changing comparative advantage in world agriculture. Agricultural Economics 2013, 44, 7–18. [Google Scholar] [CrossRef]
- Wegren, S.K.; Elvestad, C. Russia’s food self-sufficiency and food security: an assessment. Postcommunist Econ 2018, 30, 565–587. [Google Scholar] [CrossRef]
- Vörösmarty, C.J.; Green, P.; Salisbury, J.; Lammers, R.B. Global Water Resources: Vulnerability from Climate Change and Population Growth. Science 1979, 289, 284–288. [Google Scholar] [CrossRef]
- Hyytiäinen, K.; Niemi, J.K.; Koikkalainen, K.; Palosuo, T.; Salo, T. Adaptive optimization of crop production and nitrogen leaching abatement under yield uncertainty. Agric Syst 2011, 104, 634–644. [Google Scholar] [CrossRef]
- Aune, J.B. Conventional, Organic and Conservation Agriculture: Production and Environmental Impact. In Agroecology and Strategies for Climate Change; Springer: Dordrecht, The Netherlands, 2012; pp. 149–165. [Google Scholar]
- de Ponti, T.; Rijk, B.; van Ittersum, M.K. The crop yield gap between organic and conventional agriculture. Agric Syst. 2012, 108, 1–9. [Google Scholar] [CrossRef]
- Abobatta, W.F. Precision. Agriculture 2021, 23–45. [Google Scholar] [CrossRef]
- Mishra, S. Emerging Technologies—Principles and Applications in Precision Agriculture. 2022, pp. 31–53.
- Nabi, A.; Narayan, S.; Afroza, B.; Mushtaq, F.; Mufti, S.; Ummyiah, H.M.; Malik, A.A. Precision farming in vegetables. Journal of Pharmacognosy and Phytochemistry 2017, 6, 370–375. [Google Scholar]
- Karunathilake, E.M.B.M.; Le, A.T.; Heo, S.; Chung, Y.S.; Mansoor, S. The Path to Smart Farming: Innovations and Opportunities in Precision Agriculture. Agriculture 2023, 13, 1593. [Google Scholar] [CrossRef]
- United Nations Development Programme. Precision agriculture for smallholder farmers. Singapore, 2021.
- Petrović, B.; Bumbálek, R.; Zoubek, T.; Kuneš, R.; Smutný, L.; Bartoš, P. Application of precision agriculture technologies in Central Europe-review. J Agric Food Res 2024, 15, 101048. [Google Scholar] [CrossRef]
- Zaman, Q.U. Precision agriculture technology. Precision Agriculture 2023, pp. 1–17.
- Liu, Y.; Langemeier, M.R.; Small, I.M.; Joseph, L.; Fry, W.E. Risk Management Strategies using Precision Agriculture Technology to Manage Potato Late Blight. Agron J 2017, 109, 562–575. [Google Scholar] [CrossRef]
- West, G.; Kovacs, K. Addressing Groundwater Declines with Precision Agriculture: An Economic Comparison of Monitoring Methods for Variable-Rate Irrigation. Water 2017, 9, 28. [Google Scholar] [CrossRef]
- Kanwal, S.; Khan, M.A.; Saleem, S.; Tahir, M.N.; Muntaha, S.T.; Samreen, T.; Javed, S.; Nazir, M.Z.; Shahzad, B. Integration of Precision Agriculture Techniques for Pest Management. Environmental Sciences Proceedings 2022, 23, 19. [Google Scholar]
- Madej, A.; Pecio, A. Możliwości ograniczenia strat biogenów poprzez optymalizację nawożenia w warunkach rolnictwa precyzyjnego w Polsce (Opportunities to reduce nutrient losses through optimised fertilisation under conditions of precision agriculture in Poland), Studia i Raporty IUNG-PIB 2022, 69, 99–111. 69.
- Fernando, J. Net Present Value (NPV): What It Means and Steps to Calculate It. Investopedia 2024. [Google Scholar]
- Olech, M. Depreciation of Fixed Assets by Agricultural Producers. Agro-manager, 2023. [Google Scholar]
- Colaço, A.F.; Molin, J.P. Variable rate fertilization in citrus: a long term study. Precis Agric 2017, 18, 169–191. [Google Scholar] [CrossRef]
- Aggelopoulou, K.D.; Pateras, D.; Fountas, S.; Gemtos, T.A.; Nanos, G.D. Soil spatial variability and site-specific fertilization maps in an apple orchard. Precis Agric 2011, 12, 118–129. [Google Scholar] [CrossRef]
- Vatsanidou, A.; Nanos, G.D.; Fountas, S.; Baras, J.; Castrignano, A.; Gemtos, T.A. Nitrogen replenishment using variable rate application technique in a small hand-harvested pear orchard. Spanish Journal of Agricultural Research 2018, 15, 209. [Google Scholar] [CrossRef]
- Núñez-Cárdenas, P.; Diezma, B.; San Miguel, G.; Valero, C.; Correa, E.C. Environmental LCA of Precision Agriculture for Stone Fruit Production. Agronomy 2022, 12, 1545. [Google Scholar] [CrossRef]
- Tozer, P.R. Uncertainty and investment in precision agriculture – Is it worth the money? Agric Syst 2009, 100, 80–87. [Google Scholar] [CrossRef]
- Bucci, G.; Bentivoglio, D.; Belletti, M.; Finco, A. Measuring a farm’s profitability after adopting precision agriculture technologies: A case study from Italy. Acta Imeko 2020, 9, 65–74. [Google Scholar] [CrossRef]
- Central Statistical Office of Poland. Annual consumer price indices since 1950. 2024.
- Federal Statistical Office of Germany. Consumer price index (CPI) - monthly rates of change. 2024.
- World Bank. Inflation, consumer prices (annual %) – France. 2024a.
- World Bank. Inflation, consumer prices (annual %) – Romani. 2024b.
- Vecchio, V.; De Rosa, M.; Adinolfi, F.; Bartoli, L.; Masi, M. Adoption of precision farming tools: A context-related analysis. Land Use Policy 2020, 94, 104481. [Google Scholar] [CrossRef]
- Baio, F.H.R.; da Silva, S.P.; da, H. Camolese, S.; Neves, D.C. Financial analysis of the investment in precision agriculture techniques on cotton crop. Engenharia Agrícola 2017, 37, 838–847. [Google Scholar] [CrossRef]
- Shruthi, K.; Hiremath, G.M.; Joshi, A.T. Financial feasibility of precision farming in paddy- a case study. Current Agriculture Research Journal 2017, 5, 318–324. [Google Scholar]
- Dhoubhadel, S.P. Precision agriculture technologies and farm profitability. Journal of Agricultural and Resource Economics 2021, 46, 256–268. [Google Scholar]
- Lencsés, E.; Takács, I.; Takács-György, K. Farmers’ Perception of Precision Farming Technology among Hungarian Farmers. Sustainability 2014, 6, 8452–8465. [Google Scholar] [CrossRef]
- Paustian, M.; Theuvsen, L. Adoption of precision agriculture technologies by German crop farmers. Precis Agric 2017, 18, 701–716. [Google Scholar] [CrossRef]
Figure 1.
Share of farms in total numbers of holdings and agricultural area with and without public support (€35 941). Source: Own calculation based on Eurostat Database.
Figure 1.
Share of farms in total numbers of holdings and agricultural area with and without public support (€35 941). Source: Own calculation based on Eurostat Database.
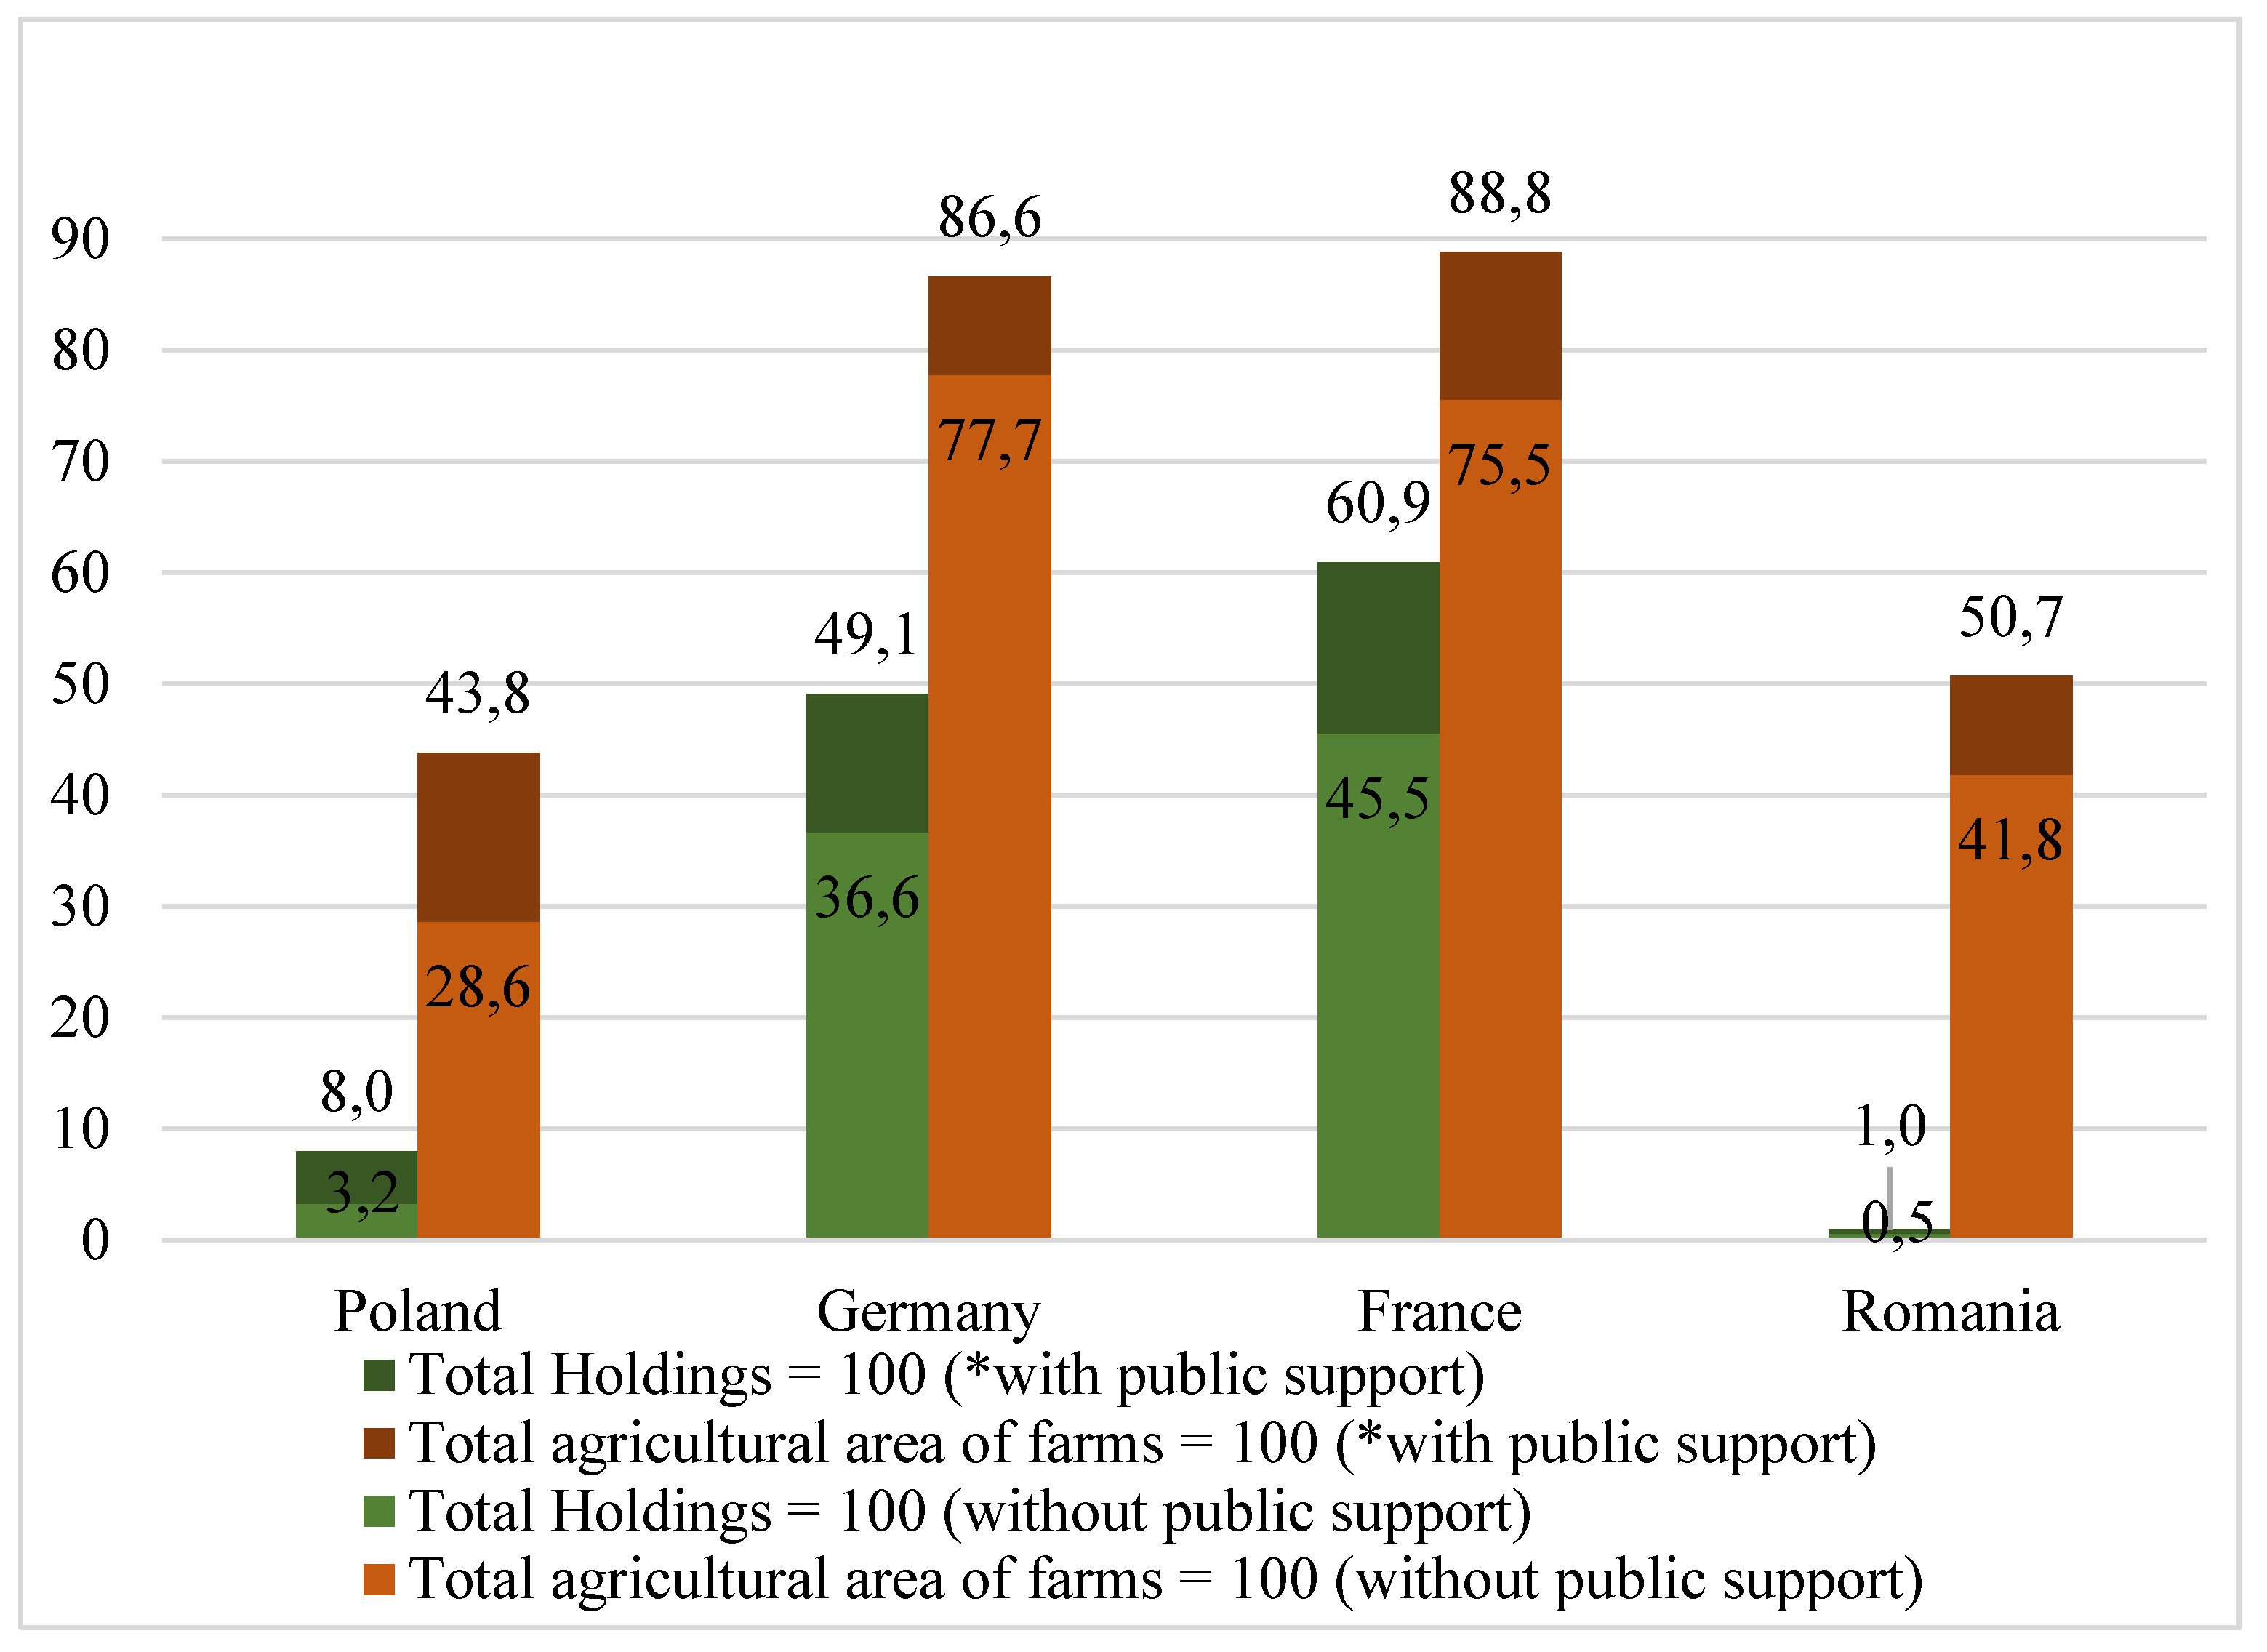

Table 1.
Costs of chemical means of crop production and potential savings due to the use of precision agriculture for field crop type of farming in 2021.
Table 1.
Costs of chemical means of crop production and potential savings due to the use of precision agriculture for field crop type of farming in 2021.
| Metrics | Poland | Germany | France | Romania | |
|---|---|---|---|---|---|
| 2 000 - < 8 000 EUR | Cost of fertilizers (€) | 1 022 | - | - | 657 |
| Cost of crop protection (€) | 237 | - | - | 465 | |
| 20% Reduction in crop protection (€) | 47 | - | - | 93 | |
| 15% Reduction in fertilizer (€) | 153 | - | - | 99 | |
| Cash flow (€) | 201 | - | - | 192 | |
| 8 000 - < 25 000 EUR | Cost of fertilizers (€) | 2 327 | - | 2 982 | 1 838 |
| Cost of crop protection (€) | 812 | - | 1 192 | 1 221 | |
| 20% Reduction in crop protection (€) | 162 | - | 239 | 244 | |
| 15% Reduction in fertilizer (€) | 349 | - | 447 | 276 | |
| Cash flow (€) | 512 | - | 686 | 520 | |
| 25 000 - < 50 000 EUR | Cost of fertilizers (€) | 6 416 | 7 418 | 6 938 | 4 828 |
| Cost of crop protection (€) | 2 656 | 3 722 | 4 468 | 3 190 | |
| 20% Reduction in crop protection (€) | 531 | 744 | 894 | 638 | |
| 15% Reduction in fertilizer (€) | 962 | 1 113 | 1 041 | 724 | |
| Cash flow (€) | 1 494 | 1 857 | 1 934 | 1 362 | |
| 50 000 - < 100 000 EUR | Cost of fertilizers (€) | 13 168 | 14 755 | 13 152 | 10 530 |
| Cost of crop protection (€) | 6 156 | 8 112 | 9 092 | 6 524 | |
| 20% Reduction in crop protection (€) | 1 231 | 1 622 | 1 818 | 1 305 | |
| 15% Reduction in fertilizer (€) | 1 975 | 2 213 | 1 973 | 1 580 | |
| Cash flow (€) | 3 206 | 3 836 | 3 791 | 2 884 | |
| 100 000 - < 500 000 EUR | Cost of fertilizers (€) | 36 977 | 36 597 | 30 731 | 35 640 |
| Cost of crop protection (€) | 19 386 | 23 663 | 25 055 | 23 467 | |
| 20% Reduction in crop protection (€) | 3 877 | 4 733 | 5 011 | 4 693 | |
| 15% Reduction in fertilizer (€) | 5 547 | 5 490 | 4 610 | 5 346 | |
| Cash flow (€) | 9 424 | 10 222 | 9 621 | 10 03 | |
| >= 500 000 EUR | Cost of fertilizers (€) | 252 845 | 129 043 | 62 585 | 148 899 |
| Cost of crop protection (€) | 154 059 | 97 919 | 65 736 | 98 653 | |
| 20% Reduction in crop protection (€) | 30 812 | 19 584 | 13 147 | 19 731 | |
| 15% Reduction in fertilizer (€) | 37 927 | 19 357 | 9 388 | 22 335 | |
| Cash flow (€) | 68 739 | 38 940 | 22 535 | 42 066 | |
Source: own calculation based on FADN Database.
Table 2.
Discounted* cash flow in euro.
| Investment cost | €35 941 | €71 883 | |||||||
|---|---|---|---|---|---|---|---|---|---|
| Metrics | Poland | Germany | France | Romania | Poland | Germany | France | Romania | |
| 2 000 - < 8 000 EUR | Year 0 | 35,9 | - | - | 35,9 | 71,9 | - | - | 71,9 |
| Year 1 | 0,2 | - | - | 0,2 | 0,2 | - | - | 0,2 | |
| Year 2 | 0,2 | - | - | 0,2 | 0,2 | - | - | 0,2 | |
| Year 3 | 0,2 | - | - | 0,2 | 0,2 | - | - | 0,2 | |
| Year 4 | 0,2 | - | - | 0,2 | 0,2 | - | - | 0,2 | |
| Year 5 | 0,2 | - | - | 0,1 | 0,2 | - | - | 0,1 | |
| Year 6 | 0,1 | - | - | 0,1 | 0,1 | - | - | 0,1 | |
| Year 7 | 0,1 | - | - | 0,1 | 0,1 | - | - | 0,1 | |
| Sum | 1,2 | - | - | 1,1 | 1,2 | - | - | 1,1 | |
| IRR | -34,8 | - | - | -34,8 | -70,7 | - | - | -70,8 | |
| 8 000 - < 25 000 EUR | Year 0 | 35,9 | - | 35,9 | 35,9 | 71,9 | - | 71,9 | 71,9 |
| Year 1 | 0,5 | - | 0,7 | 0,5 | 0,5 | - | 0,7 | 0,5 | |
| Year 2 | 0,5 | - | 0,7 | 0,5 | 0,5 | - | 0,7 | 0,5 | |
| Year 3 | 0,4 | - | 0,7 | 0,4 | 0,4 | - | 0,7 | 0,4 | |
| Year 4 | 0,4 | - | 0,6 | 0,4 | 0,4 | - | 0,6 | 0,4 | |
| Year 5 | 0,4 | - | 0,6 | 0,4 | 0,4 | - | 0,6 | 0,4 | |
| Year 6 | 0,4 | - | 0,6 | 0,4 | 0,4 | - | 0,6 | 0,4 | |
| Year 7 | 0,4 | - | 0,6 | 0,4 | 0,4 | - | 0,6 | 0,4 | |
| Sum | 3,0 | - | 4,5 | 3,0 | 3,0 | - | 4,5 | 3,0 | |
| IRR | -33,0 | - | -31,4 | -32,9 | -68,9 | - | -67,4 | -68,9 | |
| 25 000 - < 50 000 EUR | Year 0 | 35,9 | 35,9 | 35,9 | 0,0 | 71,9 | 71,9 | 71,9 | 71,9 |
| Year 1 | 1,5 | 1,9 | 1,9 | 1,4 | 1,5 | 1,9 | 1,9 | 1,4 | |
| Year 2 | 1,4 | 1,7 | 1,9 | 1,2 | 1,4 | 1,7 | 1,9 | 1,2 | |
| Year 3 | 1,3 | 1,7 | 1,8 | 1,2 | 1,3 | 1,7 | 1,8 | 1,2 | |
| Year 4 | 1,2 | 1,6 | 1,8 | 1,1 | 1,2 | 1,6 | 1,8 | 1,1 | |
| Year 5 | 1,2 | 1,6 | 1,8 | 1,1 | 1,2 | 1,6 | 1,8 | 1,1 | |
| Year 6 | 1,1 | 1,5 | 1,8 | 1,0 | 1,1 | 1,5 | 1,8 | 1,0 | |
| Year 7 | 1,1 | 1,5 | 1,7 | 1,0 | 1,1 | 1,5 | 1,7 | 1,0 | |
| Sum | 8,7 | 11,6 | 12,7 | 7,9 | 8,7 | 11,6 | 12,7 | 7,9 | |
| IRR | -27,3 | -24,4 | -23,2 | -28,0 | -63,2 | -60,3 | -59,1 | -64,0 | |
| 50 000 - < 100 000 EUR | Year 0 | 35,9 | 35,9 | 35,9 | 35,9 | 71,9 | 71,9 | 71,9 | 71,9 |
| Year 1 | 3,2 | 3,8 | 3,8 | 2,9 | 3,2 | 3,8 | 3,8 | 2,9 | |
| Year 2 | 2,9 | 3,6 | 3,7 | 2,6 | 2,9 | 3,6 | 3,7 | 2,6 | |
| Year 3 | 2,8 | 3,5 | 3,6 | 2,5 | 2,8 | 3,5 | 0,0 | 2,5 | |
| Year 4 | 2,6 | 3,4 | 3,6 | 2,4 | 2,6 | 3,4 | 3,6 | 2,4 | |
| Year 5 | 2,5 | 3,3 | 3,5 | 2,2 | 2,5 | 3,3 | 3,5 | 2,2 | |
| Year 6 | 2,4 | 3,2 | 3,4 | 2,1 | 2,4 | 3,2 | 3,4 | 2,1 | |
| Year 7 | 2,3 | 3,1 | 3,4 | 2,0 | 2,3 | 3,1 | 3,4 | 0,0 | |
| Sum | 18,6 | 23,9 | 25,0 | 16,8 | 18,6 | 23,9 | 25,0 | 16,8 | |
| IRR | -17,3 | -12,0 | -11,0 | -19,2 | -53,2 | -48,0 | -46,9 | -55,1 | |
| 100 000 - < 500 000 EUR | Year 0 | 35,9 | 35,9 | 35,9 | 35,9 | 0,1 | 71,9 | 71,9 | 71,9 |
| Year 1 | 9,4 | 10,2 | 9,6 | 10,0 | 9,4 | 10,2 | 9,6 | 10,0 | |
| Year 2 | 8,5 | 9,6 | 0,0 | 9,1 | 8,5 | 9,6 | 9,3 | 9,1 | |
| Year 3 | 8,1 | 9,3 | 9,2 | 8,6 | 8,1 | 9,3 | 9,2 | 8,6 | |
| Year 4 | 7,7 | 9,0 | 9,0 | 8,2 | 7,7 | 9,0 | 9,0 | 8,2 | |
| Year 5 | 7,3 | 8,8 | 8,9 | 7,8 | 7,3 | 8,8 | 8,9 | 7,8 | |
| Year 6 | 7,0 | 8,5 | 8,7 | 7,4 | 7,0 | 8,5 | 0,0 | 7,4 | |
| Year 7 | 6,7 | 8,3 | 8,6 | 7,1 | 6,7 | 8,3 | 8,6 | 7,1 | |
| Sum | 54,8 | 63,8 | 63,4 | 58,4 | 54,8 | 63,8 | 63,4 | 58,4 | |
| IRR | 18,8 | 27,8 | 27,4 | 22,4 | -17,1 | -8,1 | -8,5 | 0,0 | |
| >= 500 000 EUR | Year 0 | 35,9 | 35,9 | 35,9 | 35,9 | 71,9 | 71,9 | 71,9 | 71,9 |
| Year 1 | 68,7 | 38,9 | 22,5 | 42,1 | 68,7 | 38,9 | 22,5 | 42,1 | |
| Year 2 | 62,2 | 36,6 | 21,8 | 38,1 | 62,2 | 36,6 | 21,8 | 38,1 | |
| Year 3 | 59,2 | 35,5 | 21,5 | 36,2 | 59,2 | 35,5 | 21,5 | 36,2 | |
| Year 4 | 56,3 | 34,5 | 21,1 | 34,5 | 56,3 | 34,5 | 21,1 | 34,5 | |
| Year 5 | 53,6 | 33,4 | 20,8 | 32,8 | 53,6 | 33,4 | 20,8 | 32,8 | |
| Year 6 | 51,0 | 32,4 | 20,5 | 31,2 | 51,0 | 32,4 | 20,5 | 31,2 | |
| Year 7 | 48,5 | 31,4 | 20,2 | 29,7 | 48,5 | 31,4 | 20,2 | 29,7 | |
| Sum | 399,6 | 242,9 | 148,5 | 244,6 | 399,6 | 242,9 | 148,5 | 244,6 | |
| IRR | 363,7 | 206,9 | 112,5 | 208,6 | 327,8 | 171,0 | 76,6 | 172,7 | |
*Discounted cash flow is the equivalent benefit expected yearly from the use of PATs considering the inflation rate Source: own calculation based on FADN Database.
Table 3.
Farm structure by economic size.
| Economic size | Total Holdings = 100 | Total agricultural area of farms = 100 | ||||||
|---|---|---|---|---|---|---|---|---|
| Poland | Germany | France | Romania | Poland | Germany | France | Romania | |
| < 2 000 EUR | 26,2 | 0,5 | 5,5 | 72,2 | 4,8 | 0,1 | 1,1 | 13,7 |
| 2 000 - < 8 000 EUR | 37,5 | 15,2 | 8,5 | 21,4 | 16,4 | 1,9 | 1,4 | 16,4 |
| 8 000 - < 25 000 EUR | 20,3 | 22,7 | 13,7 | 4,5 | 20,3 | 5,6 | 3,2 | 11,1 |
| 25 000 - < 50 000 EUR | 8,0 | 12,4 | 11,4 | 1,0 | 14,8 | 5,9 | 5,6 | 8,1 |
| 50 000 - < 100 000 EUR | 4,8 | 12,5 | 15,4 | 0,5 | 15,2 | 8,9 | 13,3 | 8,9 |
| 100 000 - < 500 000 EUR | 2,9 | 28,9 | 39,3 | 0,4 | 20,0 | 40,1 | 63,2 | 22,8 |
| >= 500 000 EUR | 0,3 | 7,7 | 6,2 | 0,1 | 8,6 | 37,6 | 12,3 | 19,0 |
Source: own calculation based on Eurostat Database.
Table 4.
Gap in the value of investment costs, and the general value of public support needed to use precision agriculture (Economic size 50 000 - < 100 000 EUR).
Table 4.
Gap in the value of investment costs, and the general value of public support needed to use precision agriculture (Economic size 50 000 - < 100 000 EUR).
| Specification | Poland | Germany | France | Romania | |
|---|---|---|---|---|---|
| The real value of investment (€/farm) | 35 941 | 35 941 | 35 941 | 35 941 | |
| The value of the investment at 0 profitability (€/farm) | 18 642 | 23 923 | 24,978 | 16 769 | |
| Value of public support (€/farm) - difference between the gap real investment costs and 0 profitability | 17 299 | 12 019 | 10 963 | 19 172 | |
| No of farms (50 000 - < 100 000 EUR) | 62 610 | 32 860 | 60 340 | 12 910 | |
| Area of agricultural land | ha | 2 237 890 | 1 480 940 | 3 637 530 | 1 126 230 |
| Total area of agricultural land = 100 | 15,2 | 8,9 | 13,3 | 8,9 | |
| The total value of public support (€) – value of support per farm * number of farms | 1 083 112 135 | 394 931 390 | 661 525 072 | 247 510 940 | |
Source: own calculation based on Eurostat and FADN Database.
Disclaimer/Publisher’s Note: The statements, opinions and data contained in all publications are solely those of the individual author(s) and contributor(s) and not of MDPI and/or the editor(s). MDPI and/or the editor(s) disclaim responsibility for any injury to people or property resulting from any ideas, methods, instructions or products referred to in the content. |
© 2024 by the authors. Licensee MDPI, Basel, Switzerland. This article is an open access article distributed under the terms and conditions of the Creative Commons Attribution (CC BY) license (http://creativecommons.org/licenses/by/4.0/).
Copyright: This open access article is published under a Creative Commons CC BY 4.0 license, which permit the free download, distribution, and reuse, provided that the author and preprint are cited in any reuse.


