
Submitted:
28 June 2024
Posted:
01 July 2024
You are already at the latest version
Abstract
Marine sand, in addition to oil and gas resources, is the second largest marine mineral resource. The rational development and utilization of marine sand resources are conducive to the growth of the marine economy. Marine sand can be categorized into surface marine sand and buried marine sand. Buried marine sand deposits are buried beneath the sea floor, making it challenging to locate them due to their thin distribution. Consequently, there exist numerous technical difficulties associated with marine sand exploration. In this study, various geophysical methods such as sub-bottom profile survey and single-channel seismic survey were employed in the northern offshore waters of the South China Sea along with offshore engineering geological drilling. As a result, two distinct marine sand bodies were delineated within the study area. Additionally, five reflective interfaces (R0, R1, R2, R3 and R4) were identified from top to bottom. These interfaces can be divided into five seismic sequences: A2, B2, C2, D2 and E2 respectively. Three sets of strata were recognized: the Quaternary Holocene Marine sedimentary layer (Q4m), the Upper Pleistocene alluvial layer, and the diluvial sedimentary layer (Q3al+pl) as well as the Upper Pleistocene Marine sedimentary layer (Q3m). Sequence A2 and B2 corresponded to Quaternary Holocene Formation (Q4m) within the study area while sequence C2 corresponded to B2 as well as upper Pleistocene alluvial and alluvial deposits (Q3al+pl), which represent one of the main occurring layers of sand in this region. Lastly, E2 represents a layer composed mainly of silty clay and round gravel known as upper Pleistocene marine sediment layer (Q3m). In total, two ore bodies containing marine sand have been discovered during this study. The estimated total resource amounts approximately 46 million m³ with an average thickness around 11 meters.
Keywords:
Marine sand
; Sub-bottom profile survey
; Single-channel seismic survey
; South China Sea
1. Introduction
Marine sand is a significant marine solid mineral resource and the second-largest marine mineral resource after oil and gas resources [1,2]. It serves as a crucial natural sand source [3]. The primary use of marine sand lies in its role as a raw material for engineering construction, particularly in large-scale land reclamation projects that contribute significantly to infrastructure development and economic growth. Additionally, marine sand plays an essential role in maintaining the balance of the marine ecosystem alongside seawater, biology, and landform. To ensure high-quality industry development, Wang Qiong et al. suggest guiding enterprises towards employing new technologies and processes for marine sand production [4]. Rational utilization of marine sand resources not only promotes the advancement of the maritime economy but also contributes to environmental protection during mining activities [5].
Marine sand can be categorized into surface marine sand and buried marine sand [6]. Surface marine sand refers to the marine sand directly exposed on the seabed surface, which is considered an "active sand source." On the other hand, buried marine sand is located below the sea surface and covered with a certain thickness of other sediment, making it a "stable sand source" [7]. Previous studies primarily employed seabed sediment sampling and columnar samplers to investigate sediment sources and related information. While single-channel seismic data are commonly used in fault research and seabed strata analysis [8,9,10,11,12,13,14,15], a more detailed analysis of single-channel seismic data is required for precise exploration of marine sands.
The marine sand ore layer is primarily distributed in the shallow coastal area, exhibiting a relatively scattered pattern with minimal variations in physical properties, inadequate compaction, and limited impedance differences. Generally characterized by thin thickness ranging from a few meters to ten meters, the exploration accuracy and resolution requirements for marine sand bodies are exceptionally high [2]. Therefore, in order to achieve the goal of placer exploration, it is imperative to rely on advanced earthquake detection technology and other geophysical and drilling engineering operations simultaneously. Single-channel seismic imaging has emerged as a prominent approach due to its remarkable advantages in terms of efficiency, resolution, and cost-effectiveness [16,17]. After undergoing meticulous treatment, the single-channel seismic data acquired during marine sand resources survey exhibit enhanced capability in distinguishing various geological formations, including sand layers, mud layers, and ancient river channels. Consequently, this refinement significantly augments the precision of marine sand exploration [18]. In recent years, the marine sand survey projects in numerous cities within Guangdong province have also adopted the shallow stratum profile and single-channel seismic survey methods, yielding favorable outcomes [19,20,21]. The present study primarily focuses on the utilization of sub-bottom profile and single-channel seismic measurement in conjunction with offshore engineering geological drilling to investigate marine sand resources in the northern region of the South China Sea. A total of five reflection interfaces, namely R0, R1, R2, R3, and R4 are identified from top to bottom. These interfaces are further divided into five seismic sequences: A2, B2, C2, D2, and E2. Three distinct sets of strata have been recognized including upper alluvial (Q3al+pl) and alluvial deposits (Q3m), as well as Updatary Holocene strata (Q3m). Sequence A2 and B2 correspond to Quaternary Holocene Formation (Q4m) within the study area. Sequence C2 corresponds to B2 along with upper plistocene alluvial and alluvial deposits (Q3al+pl), which represent one of the primary occurrences of sand layers in this region. Lastly, sequence E2 represents marine sedimentary rock consisting mainly of silty clay and rounded gravel that corresponds to upper Pleistocene marine sediment layer (Q3m). Two significant marine sand ore bodies were discovered with a total resource estimation of approximately 46 million m3 having an average thickness around 11 m; thus indicating substantial economic potential.
2. Geological Setting
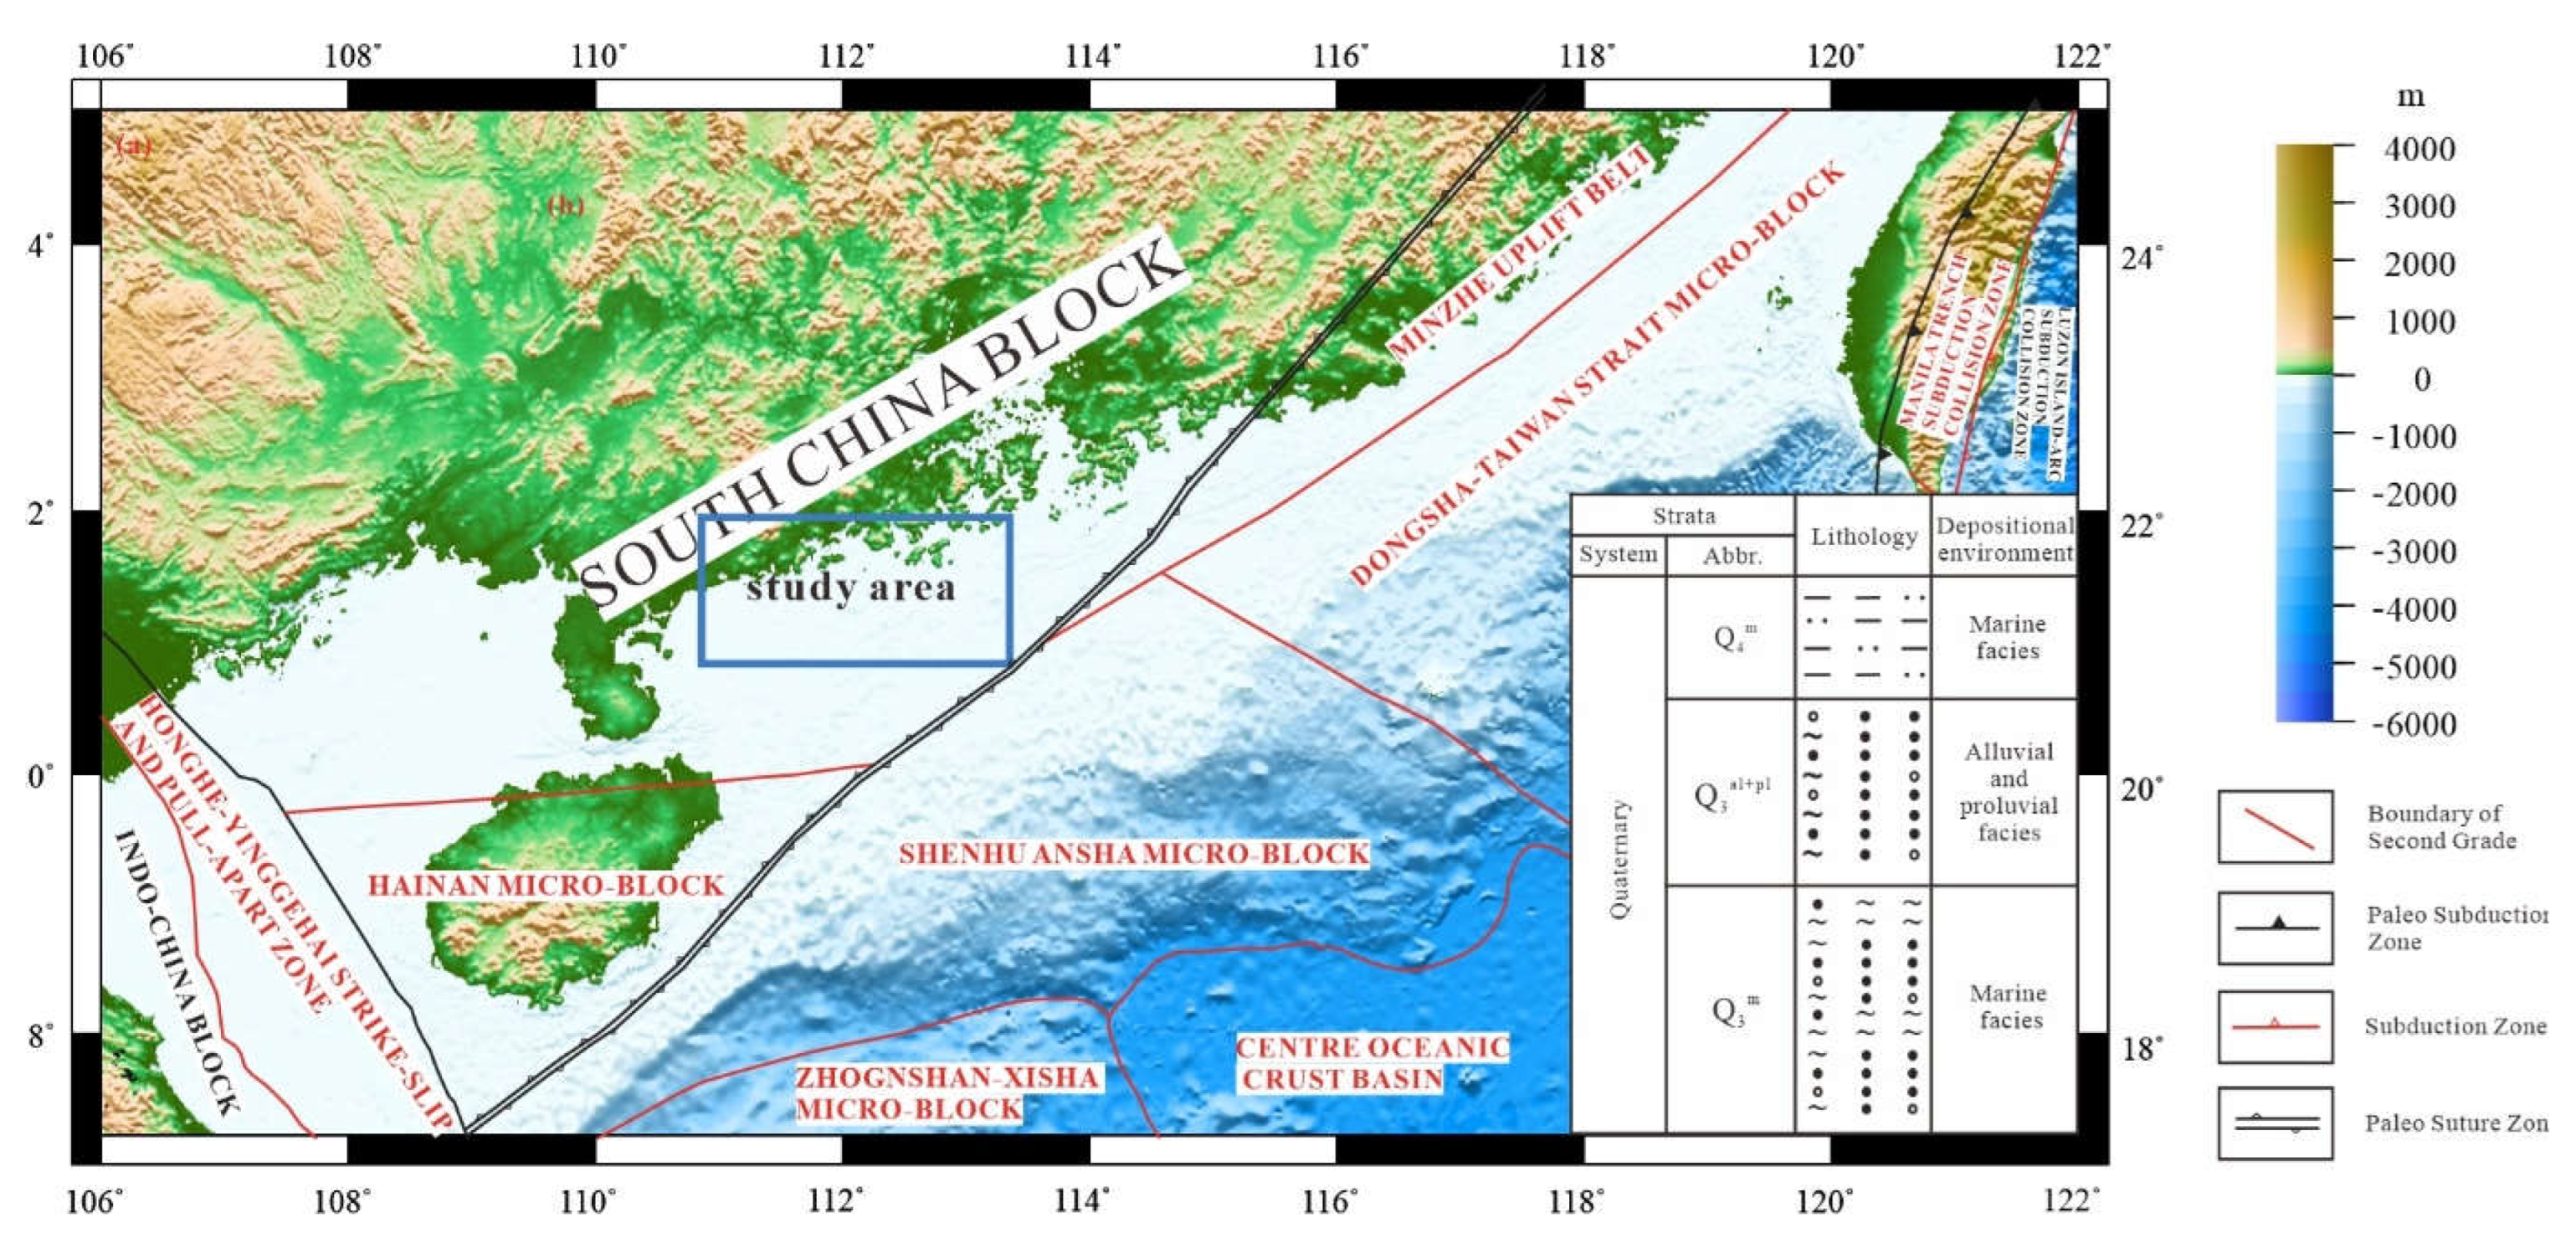
The study area is situated at the southeastern periphery of the South China plate (Figure 1). Based on the drilling data obtained in this investigation, we analyzed lithological characteristics and sedimentary environment [22,23]. The marine sedimentary strata in the study area can be roughly classified into three layers from top to bottom, as follows:
1) Quaternary Holocene sediment layer (Q4m)
This layer is widely distributed and consists of gray sandy mud, mud, argillaceous sand, and sand. It primarily comprises silty clay with occasional thin layers of fine and coarse sand. The plasticity ranges from flow plastic to soft plastic. Some shell debris is present in the upper part, while a small amount of organic matter can be found locally.
2) Upper alluvial deposit (Q3al+pl)
Formed during the late Pleistocene to early Holocene period (10~37ka ago), this layer represents a time of frequent transitions between sea and land. Intense sedimentation occurred mainly in ancient river environments followed by shallow marine environments.
Existing data indicate widespread distribution of this layer in the study area with well-preserved riverbed phases characterized by coarse sediment particles and lithology ranging from yellowish-brown to shallow yellow-brown gravelly sands, sands, muddy sands, and mud-sand-gravels.
3) Upper istocene sediment (Q3m)
Pleistocene marine phase deposits (Q3m) are found throughout the mining area. Drilling reveals one or two layers of marine sediments with lithology varying from ash-colored to light ash-gray-black-yellow-gray sandy muds, muddy sands, gravelly sands.
Wang Sheng et al. contend that the coastal sand sediment in the South China Sea, spanning from the western region of the Pearl River Estuary to the northern area of the Leizhou Peninsula, exhibits remarkable richness [24]. The report also highlights the presence of an ancient coastal sand body, with an average thickness of approximately 10m, in the nearshore region of the northern South China Sea within Guangdong Province [25].
Figure 1.
Geographical location and geotectonic map of the study area (revised after Atlas of Geology and Geophysics of the South China Sea [26]).
Figure 1.
Geographical location and geotectonic map of the study area (revised after Atlas of Geology and Geophysics of the South China Sea [26]).
3. Methodology
3.1. Single-Channel Seismic Profile Acquisition
The single-channel seismic profile exploration is a high-resolution seismic detection technique with submeter resolution[27,28], which can be effectively employed for conducting high-resolution nearshore surveys targeting layers less than 100 m in thickness. This method is particularly suitable for offshore marine sand resources exploration.
The Geo-Spark 2000X negative electrode discharge spark seismic system, with a maximum energy output of 2000J and a detection depth greater than 40m, was utilized in this study. A total of 24 receiver streamers were deployed, spanning the first 121m and second 122m respectively.
The single-channel seismic detection system primarily comprises three components: the focal source, receiver, and acquisition workstation. The focal source emits low-frequency acoustic wave signals through an electric spark, while the receiver captures the echo signals reflected from the seabed and stratum to generate an acoustic image. The acquisition station records the collected signals in "SEG-Y" format on a hard disk.
The selection of parameters is based on the analysis of test results and the overall design requirements of the project. For instance, the principle for selecting recording range aims to achieve optimal vertical resolution while ensuring a certain penetration depth. Similarly, the principle for selecting excitation energy aims to ensure clear reflections at both deep and shallow depths without significant multiple interference, thereby setting instrument parameters to obtain superior recording quality.
In this investigation, the source and receiver towers were positioned fixedly behind the stern, respectively. The source energy of 1000J was utilized with equal time excitation at an interval of 1s, while the data acquisition length was set to 0.15s.
After the collection of single-channel seismic data, including data unwinding and header finishing, the following steps were undertaken: (1) Definition of a 2D observation system; (2) Application of band-pass filtering within the frequency range of 100-300-3000-3200Hz; (3) Identification and extraction of reflected seismic phases from the seabed; (4) Removal of data located above the reflected seismic phase; (5) Implementation of automatic gain control; (6) Conversion from time to depth using seawater velocity at 1500 m/s and sediment velocity at 1600 m/s. The aforementioned processing tasks for single-channel seismic data were performed utilizing TomoPlus software.
This study employs multiple geophysical detection techniques, including sub-bottom profile survey and single-channel seismic survey. The measuring lines are arranged based on a 200m by 200m grid pattern, consisting of 13 east-west survey lines (designated as B-DDL-1 to B-DDL-13) and 13 north-south survey lines (designated as B-DDJ-1 to B-DDJ-13). Please refer to Figure 2 for the layout diagram of the composite detection line. The total length of the surveyed lines amounts to 76km.
3.2. Collection of the Sub-Bottom Profiles
The objective of the sub-bottom profile is to investigate the shallow stratum structure in the study area and identify the upper interface of marine sand. With a total length of 76km, this profile utilizes a higher signal frequency compared to single-channel seismic surveys, allowing for good penetration through mud layers but experiencing significant attenuation within sand layers. By integrating data from single-channel seismic exploration, this characteristic can be leveraged to effectively exclude mud layers and directly identify sand layers, which has been verified through drilling, thereby enhancing the accuracy of sand detection [6].
The shallow stratum profile is conducted using the EdgeTech 3400-OTS instrument, specifically designed for shallow stratum profiling. The instrument parameters include a working frequency range of 2~16 kHz, vertical resolution ranging from 6 to 10 cm, sand bottom penetration capability up to 6 m, mud bottom penetration capability up to 80 m, and a maximum working water depth of 100 m.
Before the operation, the transmitting frequency is meticulously adjusted to a range of 3~10 kHz based on considerations of water depth and substrate conditions. All necessary measures are taken to minimize noise and other sources of interference, thereby enhancing the signal-to-noise ratio and ensuring the integrity of recorded data. Additionally, the recording time delay is fine-tuned to align with the recording range of each corresponding measuring line.
During the study, based on the stratum profile data, we interpreted the acoustic reflection interface to delineate the shallow strata and fractures as well as the distribution of shallow gas. Additionally, sediment sampling and drilling provided geological data for drawing a formation geological profile. By analyzing material composition, structure, buried geological bodies (including structures), we assessed the engineering geological conditions of the research area.
3.3. Drilling Engineering Verification
The operating vessel is securely positioned for drilling using four anchor ropes (two at the bow and two at the stern). When sampling at a depth of 40m, adhere to the following principles: if a non-sand layer is encountered between 40-50m, terminate the drilling and sampling process; if a sand layer persists within the 40-50m range, conclude drilling and sampling at 50m. The retrieval rate of all drill cores meets the specified criteria, with no less than 85% comprising mud layers and no less than 60% consisting of sand layers. Geological drill samples are meticulously documented, photographed, divided, and preserved on-site to ensure their suitability for subsequent geomechanical testing.
4. Results
4.1. Characteristics of the Sub-Bottom Profile Data
The sub-bottom profile data were processed using SonarWiz software for gain, base tracking, and color tuning. Based on the analysis of grayscale variations and wave morphology reflected by changes in reflection intensity, the reflection interfaces R0, R1, and R2 were identified from the sub-bottom profile in the study area:
R0 represents a highly reflective seabed surface with strong amplitude and consistent continuity. The undulating pattern observed in this interface reflects variations in seabed topography.
R1 exhibits strong amplitude reflections with good continuity, significant fluctuations, and distinct stratigraphic interfaces.
R2 displays strong amplitude reflections with good continuity, substantial fluctuations, and clear formation boundaries.
4.2. Single-Channel Seismic Data Characteristics
In the sub-bottom profile, the mud layer exhibits "easy penetration" while in the single-channel seismic profile, it displays "good stratification". The single-channel seismic signature of the mud layer is characterized by layered or weak amplitude reflections with consistent medium strength to medium weakness and good continuity (if the seabed surface consists of a mud layer). Conversely, the sand layer is identified by disorderly reflections with poor continuity and medium strong amplitudes [6].
According to the principle of seismostratigraphy, we integrated the seismic phase reflection structure characteristics, wavegroup characteristics, and reflection interface characteristics of each profile. We conducted continuous tracking of five main seismic reflection interfaces in the study area within a single seismic profile: R0, R1, R2, R3, and R4 from top to bottom. The key features of these five reflection interfaces are as follows:
R0 interface: This is the seabed reflection surface exhibiting strong amplitude and high energy with good continuity. It varies with fluctuations in the seabed and represents the most distinguishable reflection interface.
R1 interface: Distributed throughout the entire area, this interface demonstrates medium-strong amplitude and good continuity similar to that of seabed reflections while also integrating contact relationships.
R2 interface: Also distributed across the entire area, this interface exhibits overall medium-strong amplitude and good continuity approximately parallel to overlying reflection layers.
R3 interface:Similarly distributed across the whole area, this weak-medium amplitude interface shows general continuity approximately parallel to overlying reflection layers.
R4 interface: Found throughout the entire region, this low-medium amplitude reflects poor continuity with a large fluctuation range.
4.3. Drilling Engineering
Based on the integrated analysis of the sub-bottom profile profiles and single-channel seismic data, we have preliminarily identified the presence of a marine sand enrichment layer within the study area. Consequently, four drilling sites have been selected, each with an approximate depth of 40m (Figure 3).
1. The YXZK-B1 and YXZK-B3 boreholes are distributed in the northern region of the study area, where both holes have been identified. The average thickness of the sand layer is approximately 11.24m.
2. The YXXK-B2 and YXZK-B4 boreholes are located in the southern part of the study area, with both holes being discovered. The average thickness of the orebody sand layer is around 11.47m.

Table 1.
Drilling lithology table.
| Drilling number | Depth/m | Layering/m | Lithology |
|---|---|---|---|
| YXZK-B1 | 30.6 | 0~4.30 | Silt |
| 4.30~6.60 | Sandy silt | ||
| 6.60~9.10 | Silty sand | ||
| 9.10~12.6 | Sandy silt | ||
| 12.60~14.20 | Silty sand | ||
| 14.20~16.50 | Silty sand | ||
| 16.50~22.90 | Mud | ||
| 22.90~24.50 | Pebbly muddy sand | ||
| 24.50~27.70 | Silty sand | ||
| 27.60~32.40 | Argillaceous sandy gravel | ||
| 32.40~34.70 | Pebbly muddy sand | ||
| 34.70~39.20 | Pebbly muddy sand | ||
| 39.20~40.00 | Pebbly muddy sand | ||
| YXZK-B2 | 30.74 | 0~1.60 | Silt |
| 1.60~6.70 | Silt | ||
| 6.70~16.30 | Sandy silt | ||
| 16.30~18.40 | Silty sand | ||
| 18.40~24.60 | Mud | ||
| 24.60~29.00 | Silty sand | ||
| 29.00~40.10 | Muddy sand gravel | ||
| 40.10~42.50 | Gravel mud | ||
| YXZK-B3 | 30.71 | 0~2.50 | Sandy mud |
| 2.50~5.60 | Pebbly mud | ||
| 5.60~6.80 | Silty sand | ||
| 6.80~18.80 | Silt | ||
| 18.80~19.90 | Silty sand | ||
| 19.90~22.90 | Sandy silt | ||
| 22.90~25.50 | Pebbly muddy sand | ||
| 25.50~31.80 | Mud gravel sand | ||
| 31.80~35.30 | Muddy sand gravel | ||
| 35.30~40.70 | Gravel mud | ||
| YXZK-B4 | 30.81 | 0~5.90 | Gravel mud |
| 5.90~7.50 | Pebbly muddy sand | ||
| 7.50~19.00 | Gravel mud | ||
| 19.00~22.10 | Silty sand | ||
| 22.10~35.90 | Muddy sand gravel | ||
| 35.90~37.30 | Sandy silt | ||
| 37.30~38.00 | Sandy silt | ||
| 38.00~39.00 | Muddy sand gravel | ||
| 39.00~40.00 | Gravel mud |
5. Discussion
5.1. Geophysical Interpretation and Identification of the Sedimentary Strata
5.1.1. The Sub-Bottom Profile Data
According to the sub-bottom profile data, this study classifies two sets of reflection sequences, C1 and C2, on the sub-bottom profile as follows (Figure 4):
Layer C1: It represents the reflection sequence between R0 and R1, which corresponds to a set of surface deposition layers exhibiting medium-strong amplitude and strong reflection energy. Additionally, it displays a parallel/subflat capping reflection structure. The thickness of layer C1 is approximately 5m. Based on drilling core data analysis, this layer can be identified as seabed surface mud primarily composed of silt silty clay and silty clay lithology.
Layer C2: This refers to the reflection sequence between the reflection interface R1 and R2. Notably, this layer exhibits robust reflection energy enabling clear observation of ancient river channels along with boundaries from sand layers. According to drilling core data analysis, the lithology predominantly consists of silt mixed with fine sand and medium-coarse sand intermingled with silty clay. Due to secondary reflections impacting the sand layer, weak formation reflection energy is observed below this layer making identification of its bottom boundary challenging.
5.1.2. The Single-Channel Seismic Profile Data
According to the seismic reflection interface division of a single-channel seismic profile and the internal structural characteristics of the sequence, combined with an analysis of existing drilling data, five interfaces (R0, R1, R2, R3, and R4) are classified into five seismic sequences (A2, B2, C2, D2, and E2). The characteristics of these divided seismic sequences are described as follows (Figure 4):
Seismic sequence A2 (R0-R1): The top interface R0 represents the seabed while the bottom interface R1 is a reflection interface. The internal reflection layer group is characterized by medium-low frequency with strong amplitude and good horizontal continuity. It generally exhibits parallel reflection characteristics. This stratum is considered to be the youngest in the study area belonging to Holocene River-Sea mixed facies. Based on drilling data analysis, this layer consists mainly of sandy mud or silty clay.
Seismic sequence B2 (R1-R2): The top interface R1 represents a reflection interface while the bottom interface R2 also serves as a reflection interface. The internal reflection layer group is characterized by low frequency with strong amplitude and relatively better continuity overall. It exhibits an overall parallel and flat reflection structure but may have local disorderly reflections resembling mat shapes. There exists some integration relationship at certain locations between this layer and shallow marine depositions including ancient river formations. According to drilling data analysis, this layer primarily consists of silty clay and medium-coarse sand.
Seismic sequence C2 (R2-R3) exhibits a top reflection interface R2 and a bottom reflection interface R3, with an internal layer group showing low frequency, medium-weak amplitude, generally continuous reflections. The overall structure is characterized by parallel and flat reflections, while local areas display disorderly reflection patterns resembling mat shapes. Notably, the integration relationship between the bottom interface R3 and adjacent layers suggests shallow marine deposition. Based on drilling data analysis, this layer primarily consists of silty clay, medium coarse sand, and silt.
Seismic sequence D2 (R3-R4) exhibits a reflection interface at the top, denoted as R3, and another reflection interface at the bottom, referred to as R4. This sequence is characterized by a chaotic structure with medium-high frequency and medium-strong amplitude. The reflections show poor continuity, indicating marine sedimentary deposits. Based on drilling data, this layer primarily consists of medium to coarse sand, silt, and silty clay lithologies.
Seismic sequence E2 (below R4) is characterized by a top interface represented by R4, exhibiting chaotic structures with medium-low frequency and amplitude, as well as poor continuity of reflection, indicating its marine depositional origin. Based on drilling data, this layer predominantly consists of silty clay and rounded gravel lithologies.
According to the integrated analysis of geophysical data and drilling results, the sedimentary strata in the study area can be classified into three distinct units:
Quaternary Holocene Formation (Q4m): Sequence A2 representing surface sediments, consists of a heterogeneous mixture of mud from Haihe River, widely distributed across the entire region. Underlying sequence B2 comprises shallow marine silty clay and medium coarse sand layers with localized occurrences throughout the study area. Notably, sequence A2 corresponds to the Quaternary Holocene stratum (Q4m) identified within this specific research context.
Upper alluvial and delluvial deposits (Q3al+pl): sequence C2 represents shallow marine deposits consisting primarily of silty clay, medium coarse sand, and silt, while sequence D2 comprises marine sedimentary strata composed mainly of medium coarse sand, silt, and silty clay. Both sequences B2 and C2 correspond to the upper alluvial and diluvial deposits (Q3al+pl), which are significant sand formations in the study area.
Upper Pleistocene sediment (Q3m) in sequence E2 predominantly consists of silty clay and rounded gravel, which corresponds to the geological formation found in the study area. This particular block does not penetrate into the underlying granite bedrock.
5.2. Resource Potential Evaluation
Through lithology analysis from drilling, the marine sand layer in the study area is found to correspond well with the results obtained from joint interpretation of shallow stratum profiles and single channel seismic data, confirming the presence of this layer in all four boreholes. By integrating drilling lithology, shallow stratum profiles, and single channel seismic data, we were able to calculate the volume and thickness of the marine sand layer. The buried sand deposits are primarily distributed within sequence D2 and sequence E2. Through comprehensive application of various geophysical methods and drilling engineering techniques in this study, we identified two marine sand ore bodies controlled by four drilling systems along with single seismic profile data that delineate their approximate locations. The three-dimensional spatial distribution is illustrated in Figure 5. Using SonarWiz software, we determined the elevation positions of both top and bottom layers of these marine sand ore bodies. After GIS treatment and analysis combined with water depth data, information regarding area coverage, average thickness, volume, and resource estimation for each marine sand ore body was obtained (Table 2). The northern ore body exhibits an average thickness of approximately 11.0m over an area of about 2.5 km2 with estimated resources totaling around 25 million m3; it appears thicker towards northwestern regions while thinner towards southeastern areas. On the other hand, the southern side displays an average thickness of about 11.5m covering an area roughly measuring 2.1 km2 with estimated resources amounting to approximately 21 million m3; similar to its counterpart in northwestern regions it also thins out towards southeastern areas.
6. Conclusions
In this study, we conducted sub-bottom profile measurements, single-channel seismic surveys, and offshore engineering geological drilling in the research area of marine sand in the northern South China Sea. By combining these methods with sample test data analysis, we identified a significant marine sand deposit and comprehensively mapped the distribution of marine sand resources in the study area. Furthermore, we estimated the volume of marine sand and achieved highly favorable results.
This study demonstrates the effective application of multiple geophysical exploration methods in investigating marine sand resources in the northern offshore waters of the South China Sea. The exploration of marine sand resources can yield favorable results through the combined use of various geophysical exploration techniques, reducing the need for extensive drilling engineering verification. In this study, five reflective interfaces were identified as R0, R1, R2, R3, and R4 from top to bottom. These interfaces correspond to A2, B2, C2, D2 and E2 respectively. Three sets of strata were distinguished: alluvial (Q3al+pl) and alluvial deposits (Q3m) on the upper part; Quaternary Holocene strata (Q3m); Sequence A2 and B2 represent Quaternary Holocene Formation (Q4m) within the study area; Sequence C2 corresponds to B2 as well as upper Pliocene alluvial and alluvial deposits (Q3al+pl), which are among the main occurring sand layers in this region; Sequence E2 represents marine sedimentary rock consisting mainly of silty clay and rounded gravel that corresponds to upper Pleistocene marine sediment layer (Q3m). Two distinct marine sand ore bodies were discovered with a total resource estimate of approximately 46 million m3 and an average thickness around 11 m. These findings hold significant economic potential.
Author Contributions
Methodology, X.H. and G.Y.; Software, X.H., Y.Y. and Y.Z.; Formal analysis, X.H., Y.Y. and Y.Z.; Investigation, X.H., J.F., Y.Y., Y.Z., J.L.(Jinhui Lin) and J.L.(Jingyi Liu); Resources, G.Y. and L.Q.; Data curation, X.H., Y.Y. and Y.Z.; Writing—original draft, X.H.; Writing—review & editing, X.H., Y.G., Y.Y., Y.Z. and J.L.(Jingyi Liu); Supervision, L.Q. and G.Y.; Project administration, G.Y.; Funding acquisition, L.Q. and G.Y. All authors have read and agreed to the published version of the manuscript.
Funding
This research was funded by the independent project of Key Laboratory of Marine Environmental Survey Technology and Application, Ministry of Natural Resources, P.R.China (MESTA-2022-D004) and the Special Projects for Promoting High Quality Economic Development (Marine Economic Development) in Guangdong Province, P.R.China (GDNRC[2023]42).
Institutional Review Board Statement
Not applicable.
Informed Consent Statement
Not applicable.
Conflicts of Interest
The authors declare no conflicts of interest.
References
- Tong, C.L.; Zhang, K.H. The potential evaluation of marine sand resources in the northern sea areas of Hainan Island. Geology in China 2020, 47(5), 1567–1575. [Google Scholar] [CrossRef]
- Tong, C.L.; Li, G. Geological characteristics and origin of marine sandsin the northeast sea off Hainan Island. Marine Geology Frontiers 2018, 34(1), 12–19. [Google Scholar]
- Xia, L.X.; Wu, R. Properties of artificial sand and natural sand. Concrete 2008, 7, 60–61. [Google Scholar] [CrossRef]
- Wang, Q.; Yang, L.Q. Problems and Countermeasures of Development and Utilization of Sea Sand Resources in Guangdong. China Resources Comprehensive Utilization 2021, 39(6), 73–76. [Google Scholar] [CrossRef]
- Su, D.F.; Wang, G.Q. Discussion of the Current Status and Management Strategies of Sea Sand Resource Development in China. Ocean Development and Management 2010, 4, 64–67. [Google Scholar] [CrossRef]
- Ni, Y.G.; Xia, Z. Combined application of sub-bottom and single-channel seismic profiles to marine sand and gravel resource prospecting. Marine Geology & Quaternary Geology 2018, 41(4), 207-214. [CrossRef]
- Bendixen, M.; Best, J. Time is running out for sand. Nature 2019, 571(7763), 29–31. [Google Scholar] [CrossRef] [PubMed]
- Lu, K.; Hou, F.H. Using Single-Channel Seismics For Active Faults Investigation In Yellow Sea And Bohai Sea. Marine Geology Frontiers 2012, 28(8), 27–30. [Google Scholar]
- Cao, J.H.; Sun, J.L.; Xu, H.L.; Xia, S.H. Seismological features of the littoral fault zone in the Pearl River Estuary. Chinese Journal of Geophysics 2014, 57(2), 498–508. [Google Scholar] [CrossRef]
- Zhang, X.Y.; Cao, J.H. Seismological Features and Geological Implication of the NW Faults in the Pearl River Estuary. South China Of Seismology 2019, 39(04), 1–9. [Google Scholar] [CrossRef]
- Wan, P.; Wen, M.M. The application study of high-resolution single-channel seismic technology in deep-sea exploration. Equipment for Geotechnical Engineering 2014, 15(4), 33–41. [Google Scholar] [CrossRef]
- Wan, P.; Mou, Z.L. Marine single-channel seismic exploration and focal source technology. China Science and technology information 2015, (8), 65–67. [Google Scholar] [CrossRef]
- Li, S.J.; Chu, F.Y. Associated interpretation of sub-bottom and single-channel seismic profiles from Shenhu area in the north slope of south china sea - characteristic of gas hydrate sediment. Advanced Materials Research 2011, 217-218, 1430–1437. [Google Scholar] [CrossRef]
- Zheng, H.H.; Tong, S.Y. Improvement of towing type sub-bottom seismic profile acquisition system. Marine Geology Frontiers 2018, 34(1), 65–70. [Google Scholar]
- Liu, Q.; Tang, M.Q. Sedimentary Characteristics of Buried Ancient Channels in Shapa Area of Yangxi, Guangdong Province. Journal of Jilin University: Earth Science Edition 2022, 52(6),1791-1799. [CrossRef]
- He, H.Y. High-resolution seismic technology at sea and its applications. Geological Publishing House: Beijing, China 2001.
- Weber, N.; Chaumillon, E. Architecture and morphology of the outer segment of a mixed tide and wavedominated-incised valley, revealed by HR seismic reflection profiling: the paleo-Charente River, France. Marine Geology 2004, 207(1), 17–38. [Google Scholar] [CrossRef]
- Liu, Y.P.; Zhang, H.H. Research on Fine Processing and Application of Marine High Resolution Single Channel Seismic Data. South China Journal of Seismology 2023, 43(1): 121-128. [CrossRef]
- Guangdong Guanghai Marine Exploration and Development Co., Ltd., Shanwei, Guangdong, China. Verification Report on the Reserves of Sea Sand Resources for Backfilling in the JH21-09 Mining Area of the Jurisdiction of Shanwei City, Guangdong Province. Unpublished work, 2021. Shanwei.
- Guangdong Guanghai Marine Exploration and Development Co., Ltd., Zhanjiang, Guangdong, China. Verification Report on the Reserves of Sea Sand Resources for Backfilling in the JH20-02 Mining Area of Zhanjiang City, Guangdong Province. Unpublished work, 2020. Zhanjiang.
- Guangdong Guanghai Marine Exploration and Development Co., Ltd., Yangjiang, Guangdong, China. Verification Report on the Sea Sand Resources Reserves for Backfilling in the JH22-01 Mining Area, Southern Waters of Hailing Island, Yangjiang City, Guangdong Province. Unpublished work, 2021.Yangjiang.
- Yang, D.F. Sea level change since quaternary deposition and late Pleistocene in Yangjiang-Dianbai coastal area. Guangdong geology 1988, 13(4), 50–58. [Google Scholar]
- Kang, C.S.; Yang, S.M. Quaternary sediments in Red Bay, Pearl River Estuary and Dianbai-Yangjiang offshore in Guangdong. Tropical ocean 1997, 16(1), 39–48. [Google Scholar]
- Wang, S.J.; Liu, X.Q. Distribution Characteristics of Marine Aggregate Resources And Potential Prospect In China. Marine Geology & Quaternary Geology 2003, 23(3), 83-89.
- Guangzhou Marine Geology Survey Bureau, Guangzhou, Guangdong, China.Guangdong Province Sea Sand Resource Survey Project Report.Unpublished work, 2016. Guangzhou.
- Yang, S.; Qiu, Y. Atlas of Geology and Geophysics of the South China Sea. China Navigation Publication: Tianjin, China, 2015.
- Feng J.; Wei J. Complementarity analysis of parametric array and.
- spark source sub-bottom profilers. Marine Geology Frontiers 2019, 35(9), 63–68.
- Wang, Z.Y.; Huang, Y.F. High-resolution multi-channel seismic detection technology and its application in shallow Marine strata. The Ocean Press: Beijing, China, 2011; 8.
Figure 2.
Schematic diagram of two shallow stratum section, single-channel seismic survey line layout and actual survey line.
Figure 2.
Schematic diagram of two shallow stratum section, single-channel seismic survey line layout and actual survey line.
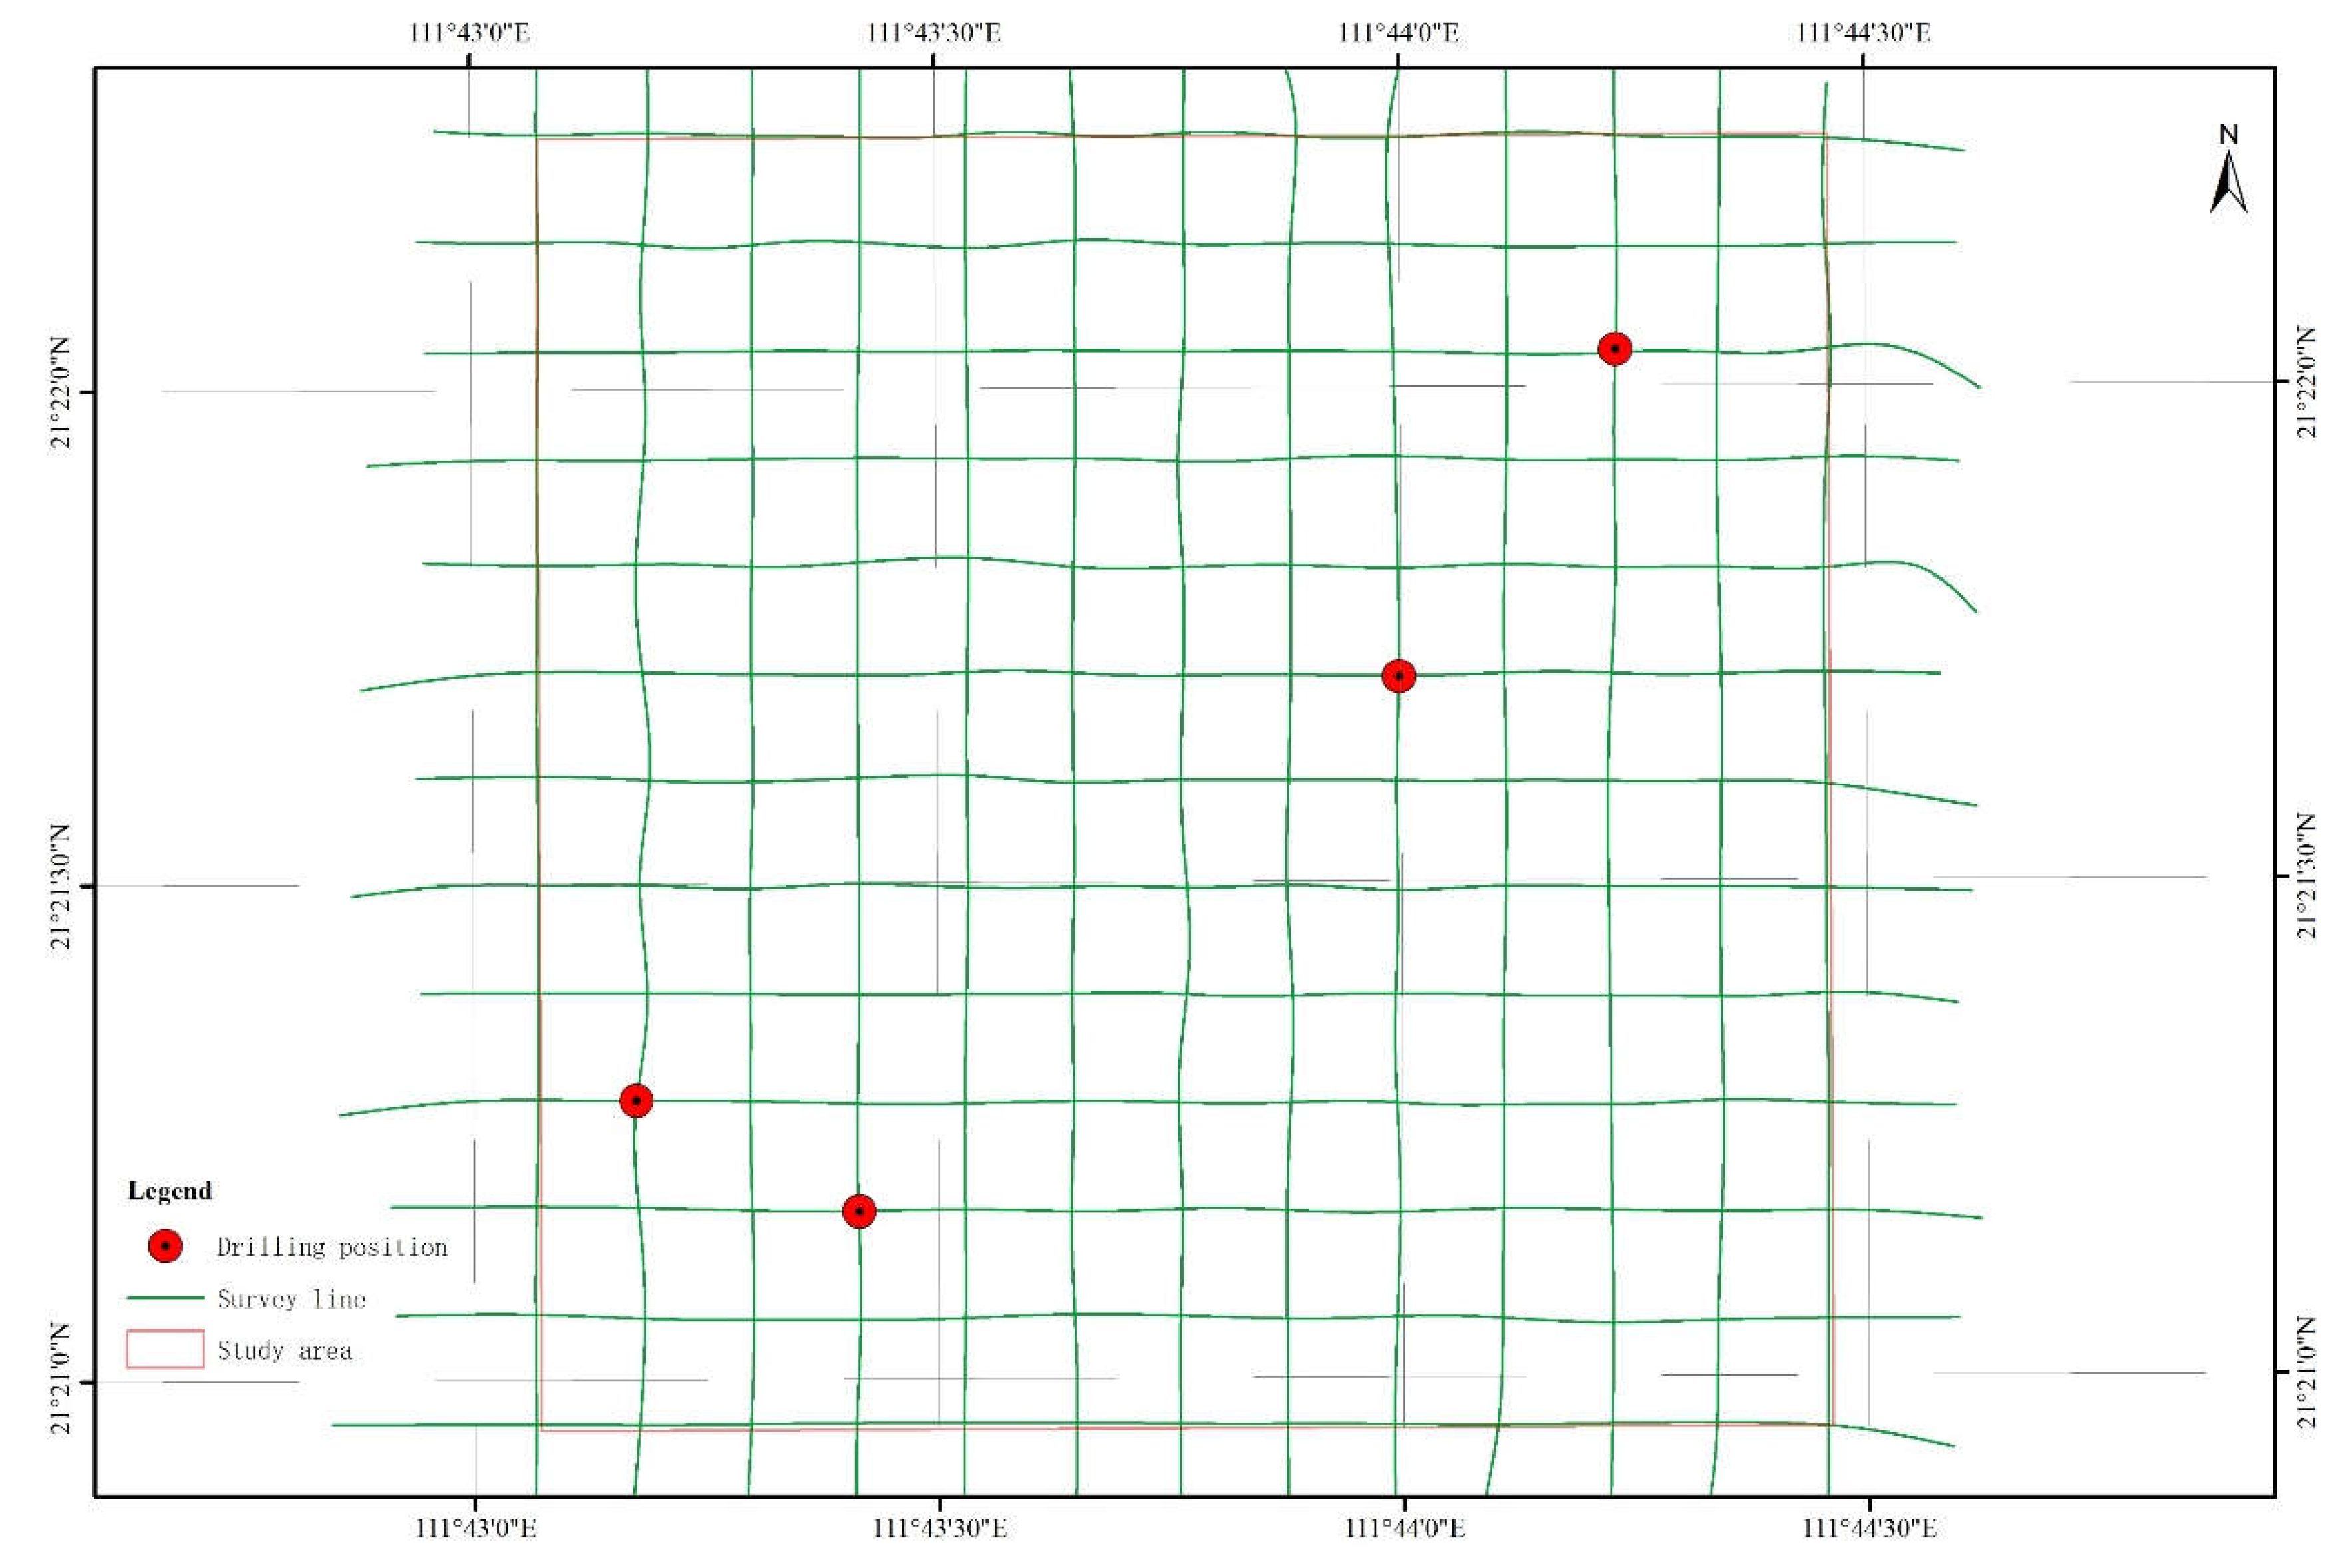
Figure 3.
Upper Pleistocene alluvial and proluvial sediment sand layer (YXZK-B3 drilling hole, 30~35m depth).
Figure 3.
Upper Pleistocene alluvial and proluvial sediment sand layer (YXZK-B3 drilling hole, 30~35m depth).
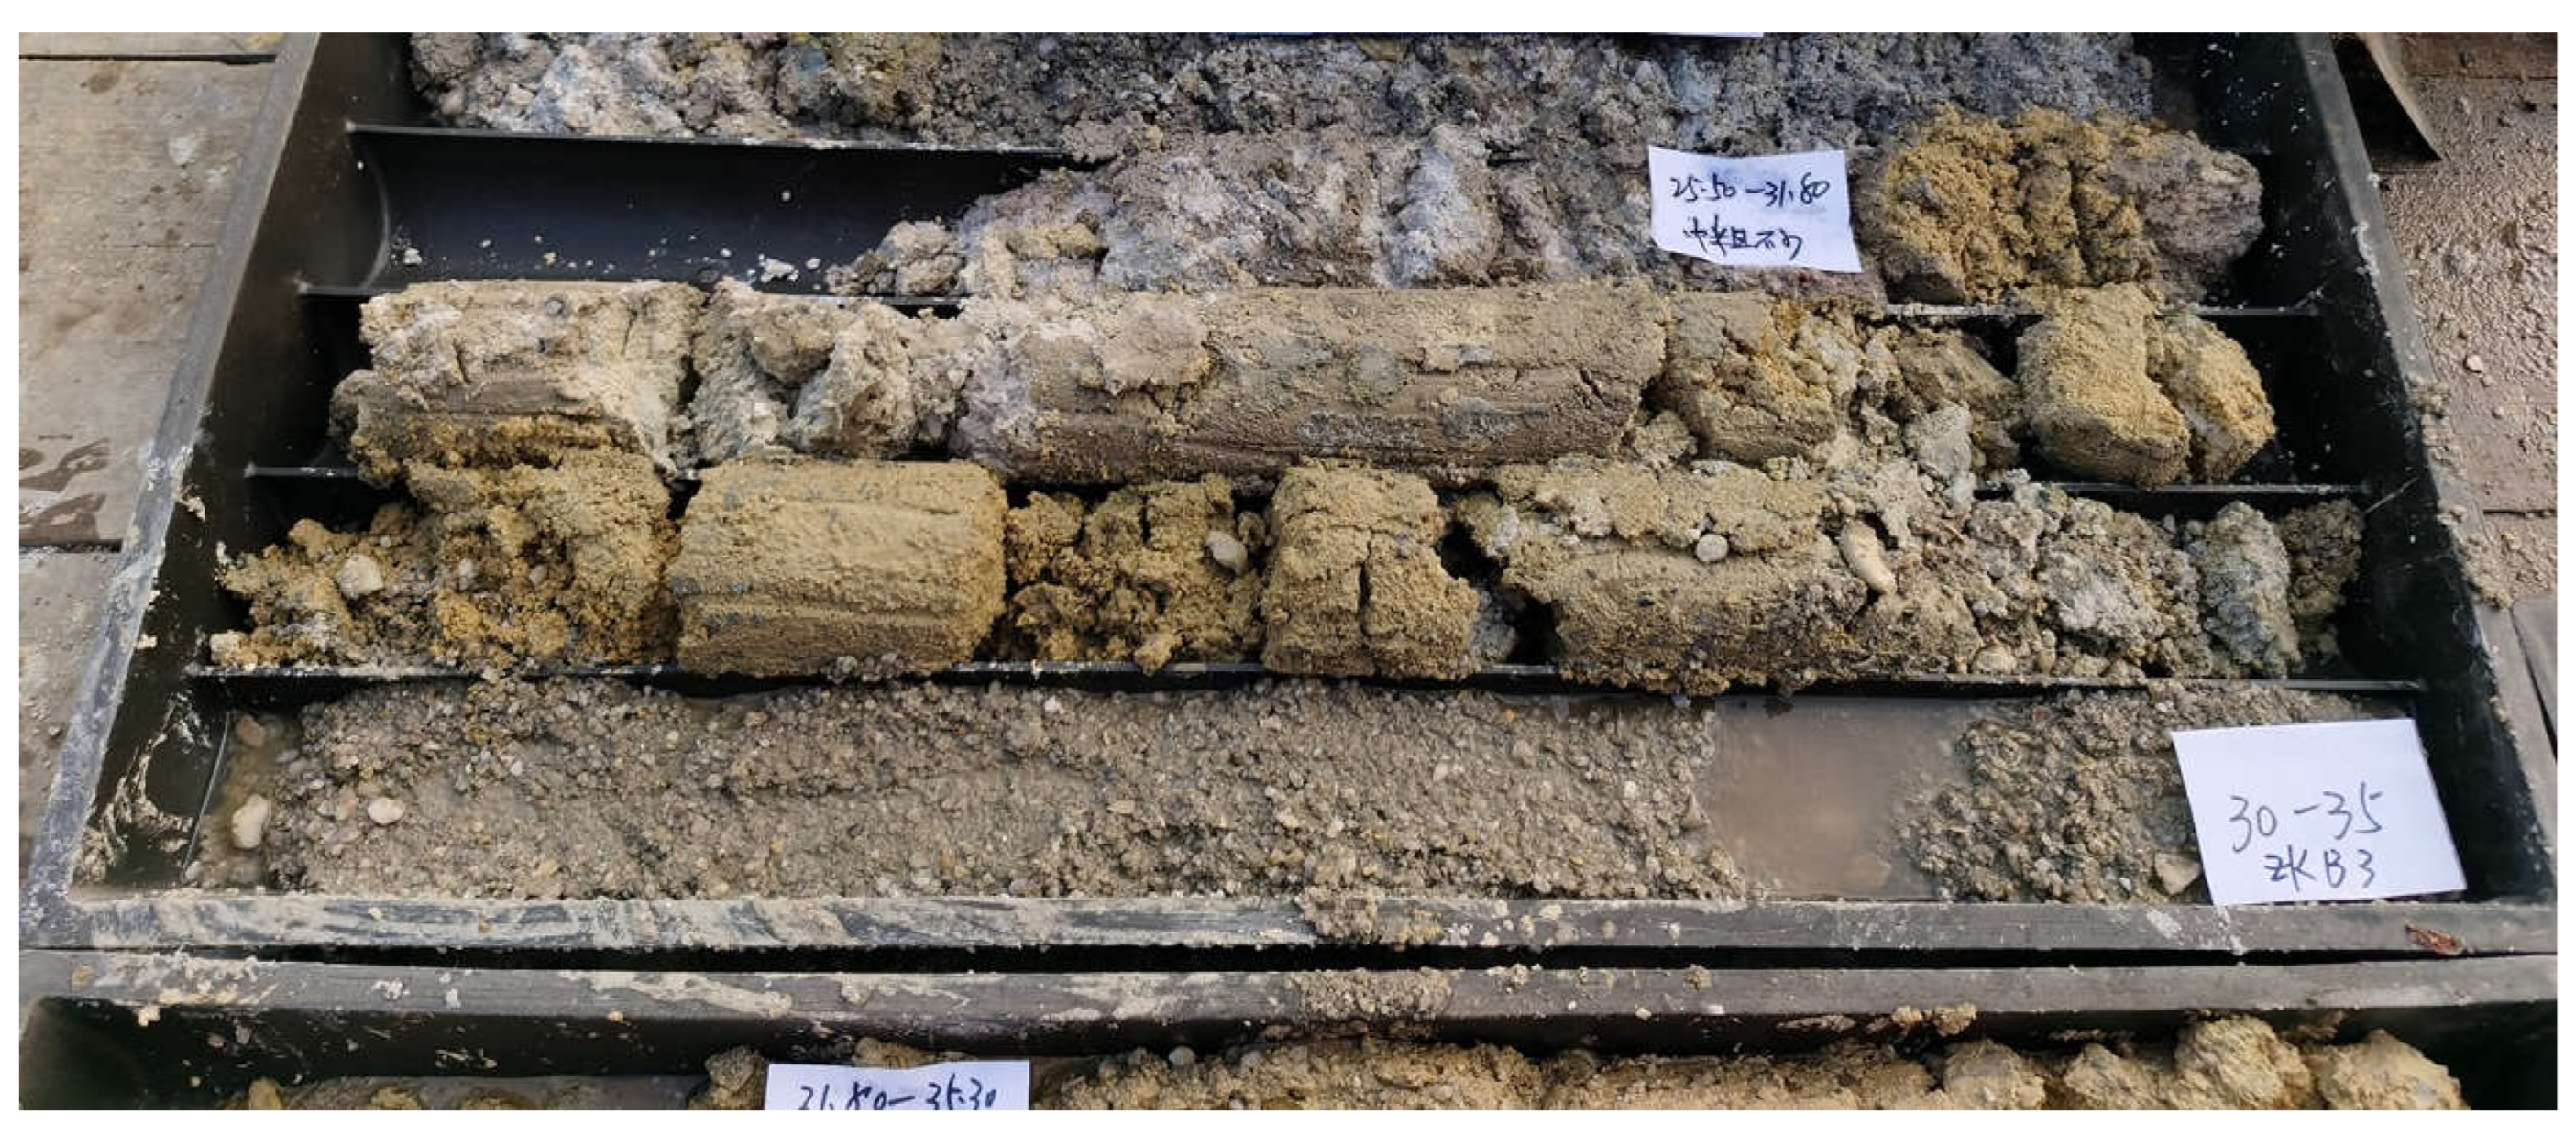
Figure 4.
Schematic diagram of typical geophysical feature profile (sub-bottom profile on top and single-channel seismic profile below).
Figure 4.
Schematic diagram of typical geophysical feature profile (sub-bottom profile on top and single-channel seismic profile below).
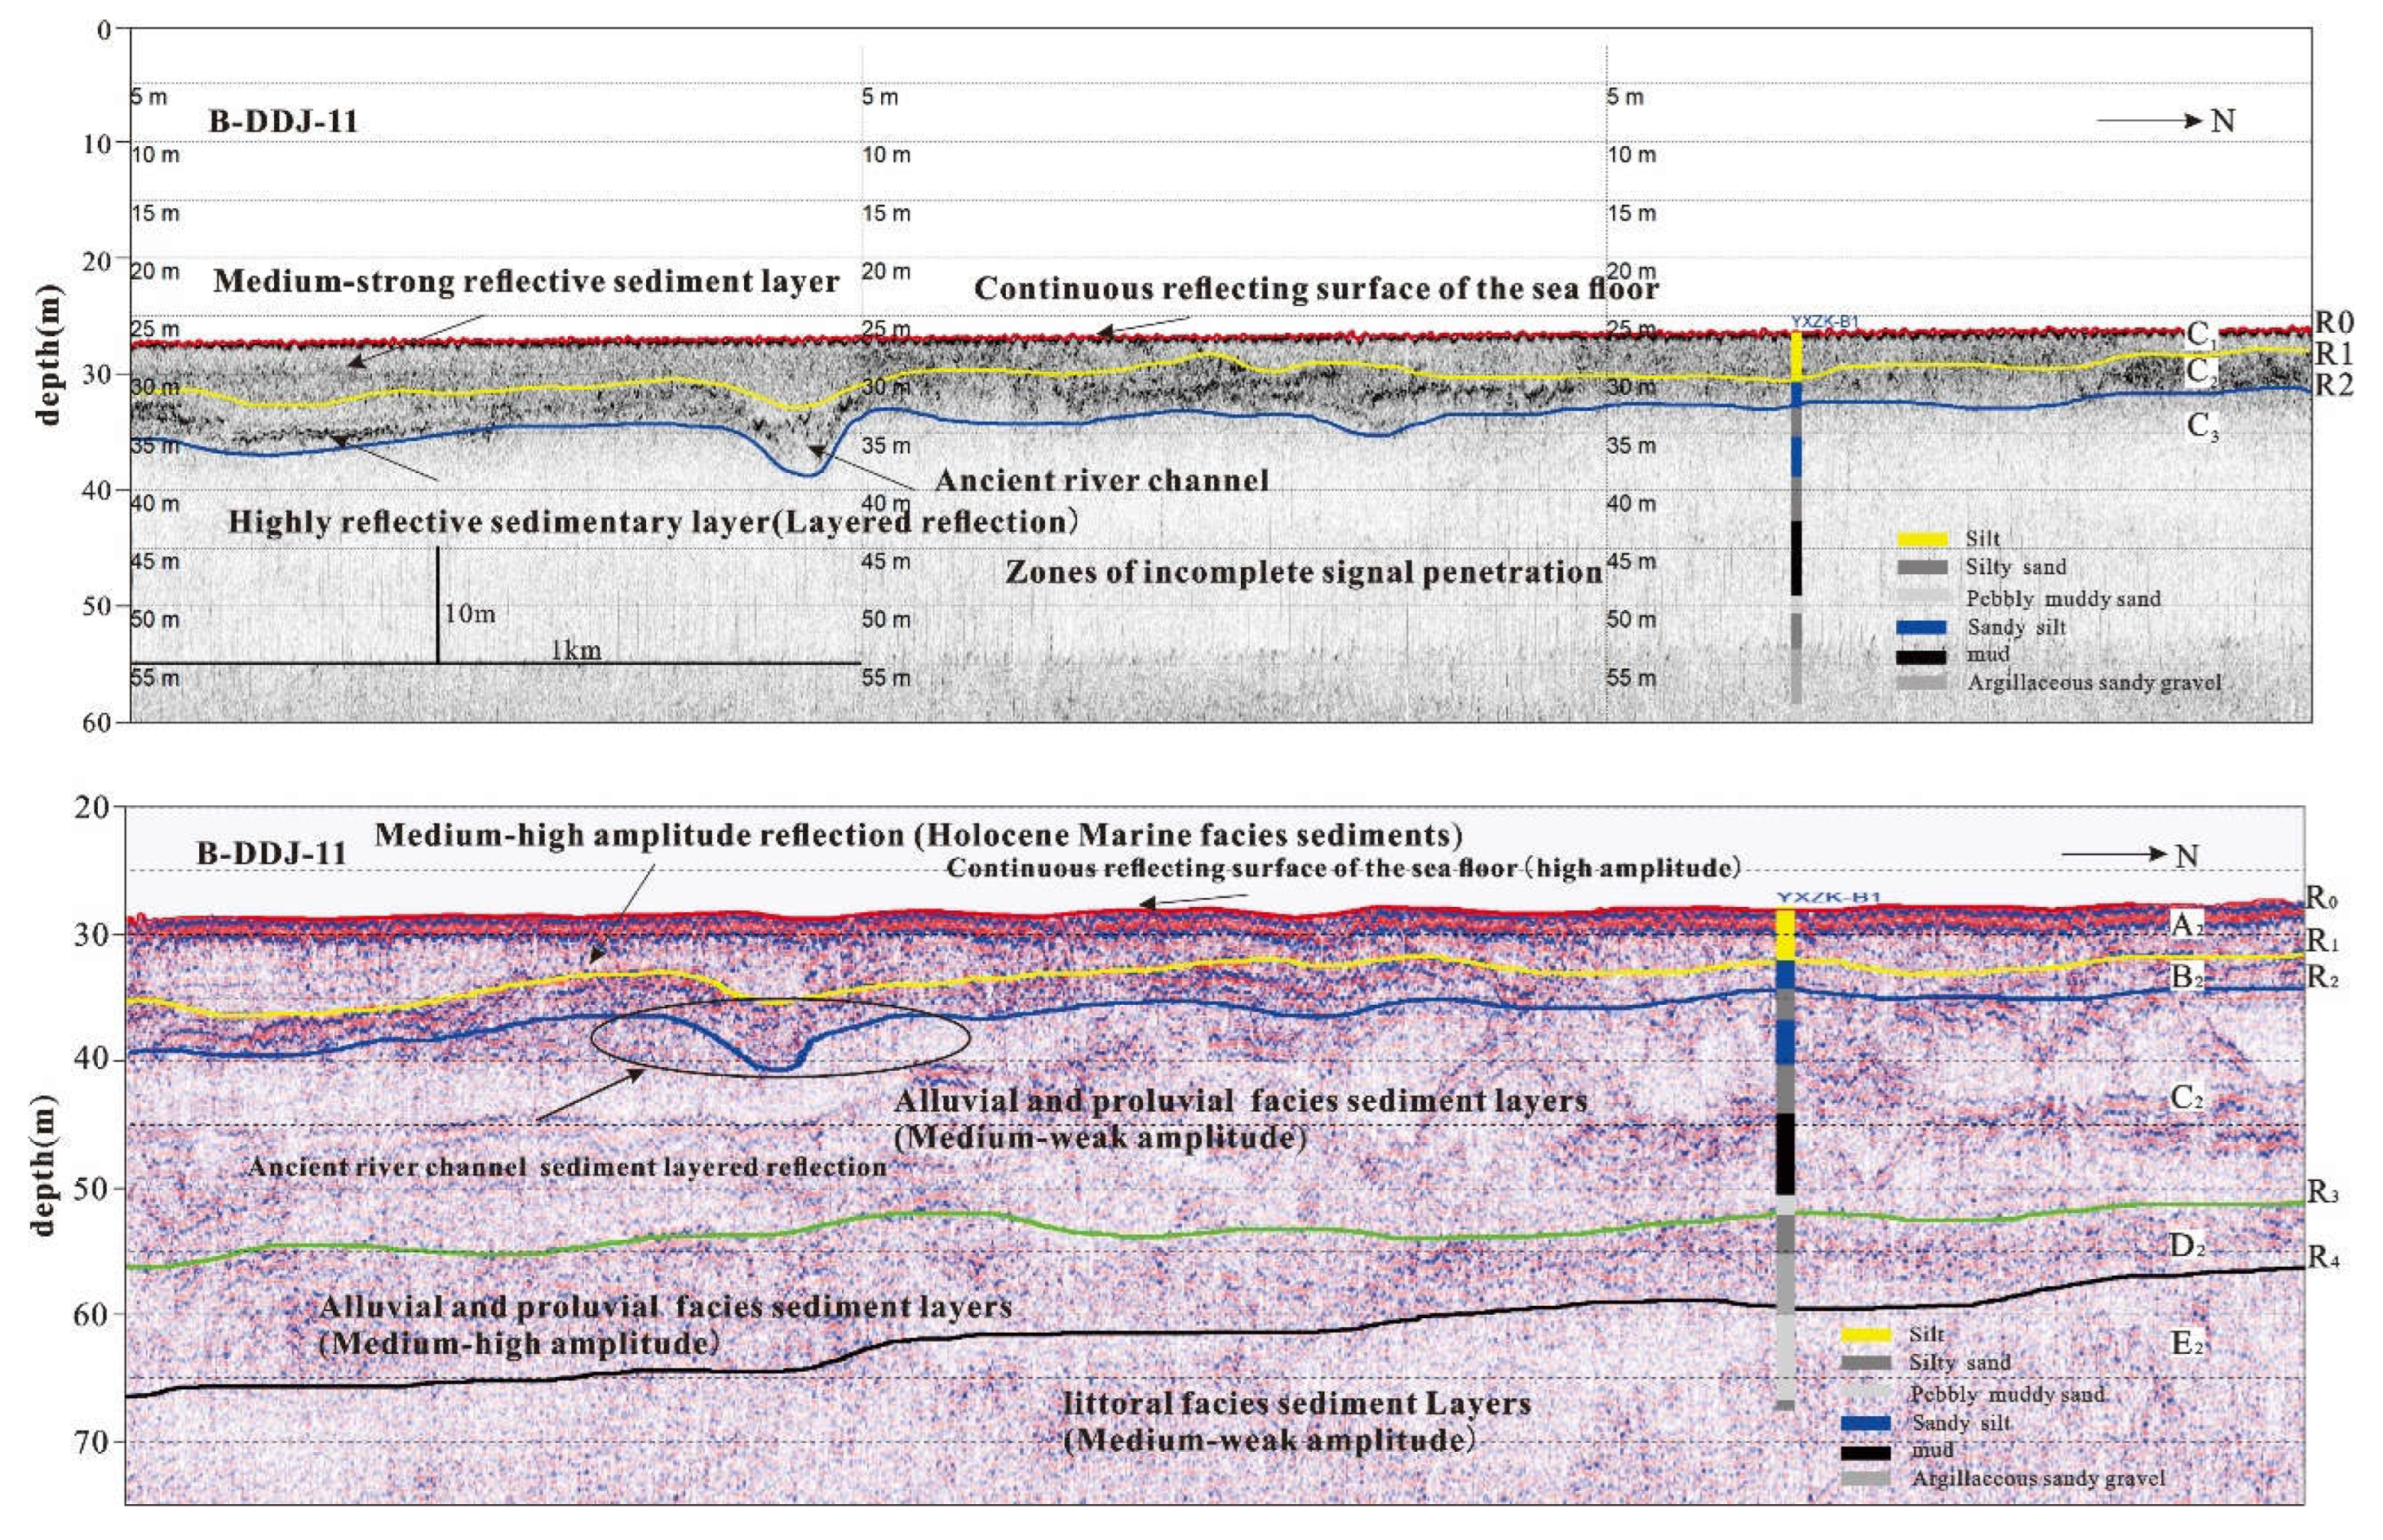
Figure 5.
3-dimensional schematic diagram of marine sand ore body (southwest perspective).
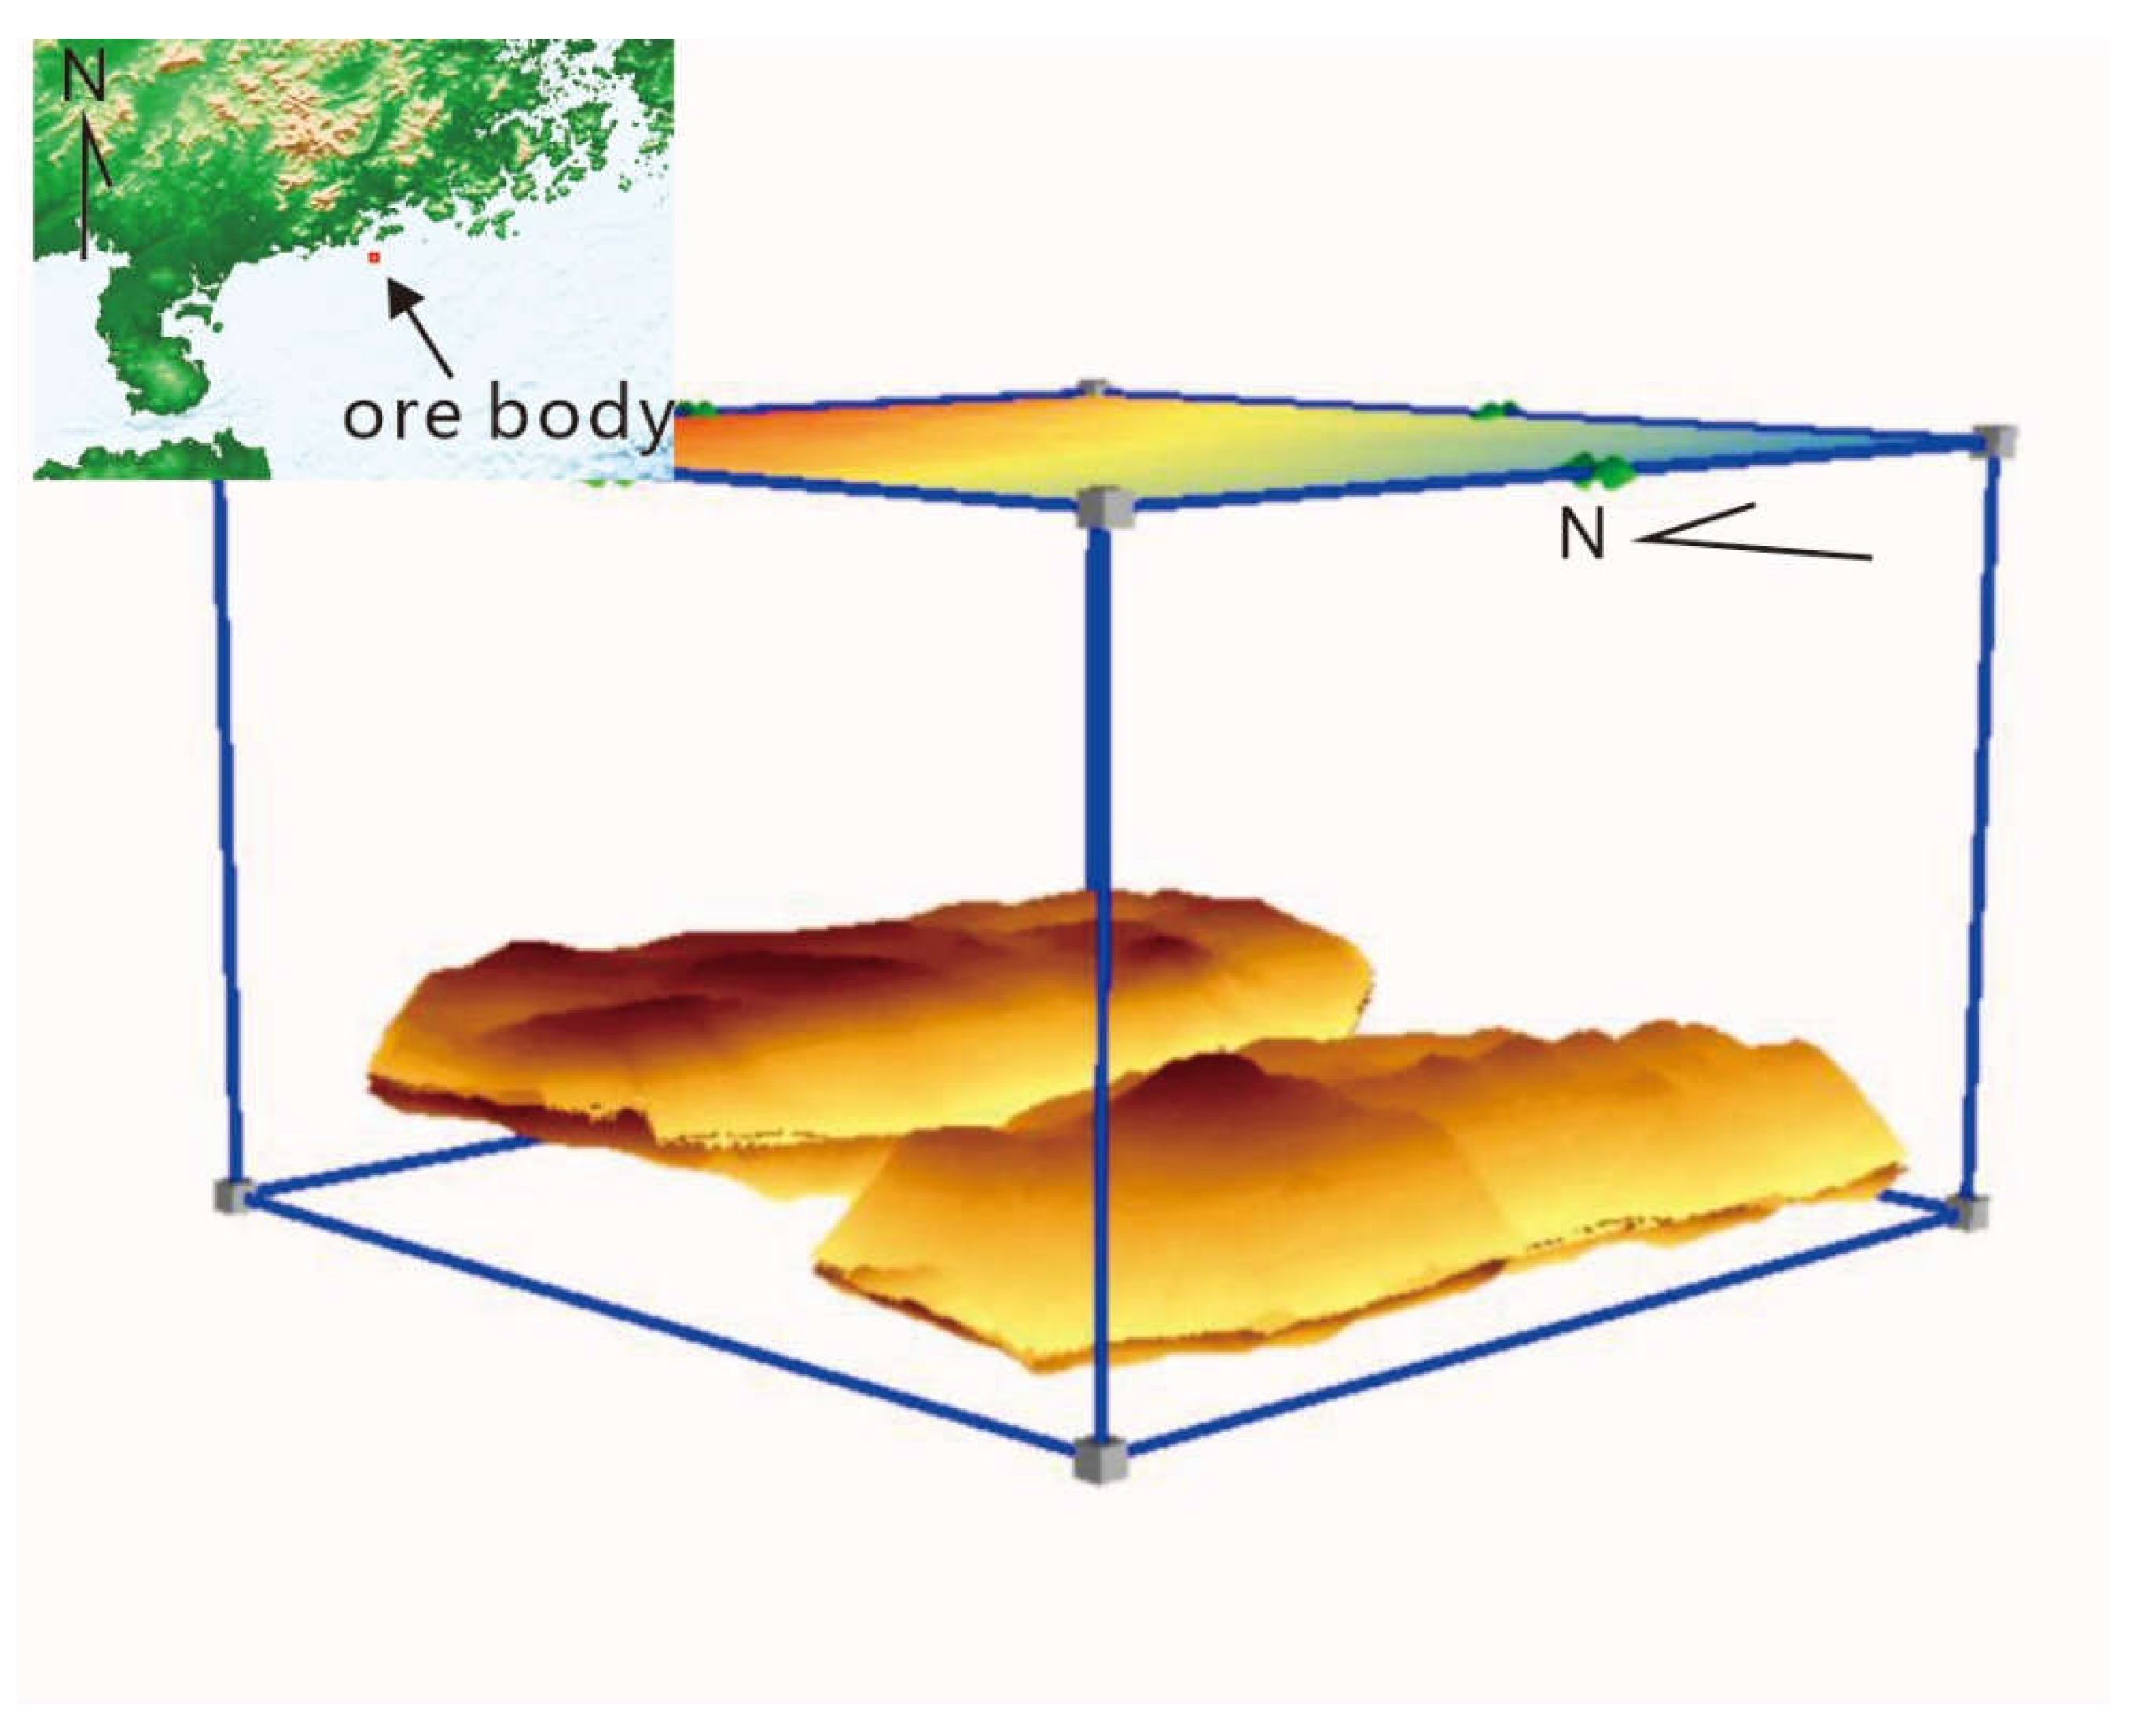
Table 2.
Estimation table of marine sand resources in the exploration area.
| Ore Body | Average Thickness(m) |
Area (km2) |
Volume (Million m3) | Mud Content (%) |
Resource Volume (million m3) |
|---|---|---|---|---|---|
| North Ore body | 11.0 | 2.5 | 29 | 13 | 25 |
| South Ore body | 11.5 | 2.1 | 24 | 13 | 21 |
Disclaimer/Publisher’s Note: The statements, opinions and data contained in all publications are solely those of the individual author(s) and contributor(s) and not of MDPI and/or the editor(s). MDPI and/or the editor(s) disclaim responsibility for any injury to people or property resulting from any ideas, methods, instructions or products referred to in the content. |
© 2024 by the authors. Licensee MDPI, Basel, Switzerland. This article is an open access article distributed under the terms and conditions of the Creative Commons Attribution (CC BY) license (http://creativecommons.org/licenses/by/4.0/).
Copyright: This open access article is published under a Creative Commons CC BY 4.0 license, which permit the free download, distribution, and reuse, provided that the author and preprint are cited in any reuse.


