Submitted:
27 June 2024
Posted:
02 July 2024
You are already at the latest version
Abstract
In this study, AlSi12 alloy was fabricated using the selective laser melting (SLM) technique to produce high density components with complex and customized parts for railway applications. Nonetheless, the production of dense samples necessitates the optimization of production process parameters. As a statistical design of experimental technique, the response surface methodology was used to optimise different combination of SLM parameters. The results were analysed using analyse of variance (ANOVA) and the signal-to-noise(S/N) ratios. The relationship between the hardness response to the process parameters (scanning speed and lase power) for determining the optimal processing conditions were examined. A hardness value of 133 HV was obtained. The process parameters were successfully optimized and the relationship between the parameters and the structures of the fabricated samples were reported.
Keywords:
Selective Laser Melting
; ANOVA
; Mechanical properties
; Microstructure
; Response Surface Methodology
1. Introduction
Aluminium and its alloys are known for their outstanding characteristics which includes them being light in weight, weldable and corrosion resistant. These properties make them ideal to be applied in different industrial engagements such as aerospace, defence, automotive etc. Aluminum-silicon-based alloys (Al-Si), notably AlSi12, AlSi10Mg, A357 (AlSi7Mg0.7), and A356 (AlSi7Mg0.3), have been hugely employed in the SLM mechanism due to their fabricability [1]. However, AlSi12 alloy still have many disadvantages such as the high content level of silicon, it being weaker, susceptibility to wear, tear and thermal expansion [19].To break the bottleneck, new manufacturing techniques like selective laser melting have been developed [2]. Selective laser melting is the mostly utilized technique for AlSi12 material. In this additive manufacturing process, metal powder is melted via a laser. The laser passes over the powder, forming a solid object one layer at a time. During Selective Laser Melting, the AlSi12 alloy goes through rapid melting and solidification cycles. These cycles allow for grain refining, which is necessary for producing a strong alloy. The SLM method enables the creation of almost completely dense materials. This is crucial for reducing porosity and improving the mechanical features of the alloy. The SLM process includes layering the AlSi12 alloy. This can result in direction-dependent mechanical characteristics. This attribute can vary along and perpendicular to the building's direction [19]. A recent study on SLM found that, in addition to scanning speed, laser power was an essential process component. In fact, scanning speed had a bigger impact on the mechanical qualities and microstructure of the produced components than hatch spacing or powder layer thickness [3]. Nigon et al. [4] used the SLM approach to create 2205 samples with densification of 98.6% by optimising the scanning speeds range, however the samples’ mechanical features were not studied. Davidson et al.[5] discovered a considerable rise in the SLM 2507 material’s Vickers hardness as the scanning speed was reduced.
In the investigation of the impact of scanning speed on the mechanical and microstructure characteristics of SLM-formed Inconel 718 specimens, Wang et al. [6] discovered that the grain size could be influenced by the high laser scanning speeds, thereby lessening the mechanical properties’ anisotropy and decreasing the intensity of the〈001〉 texture. The 316 L samples, which had an overall elongation to failure of 55% and good ductility, were shown to have SLM by Liu et al. [7]. Reduced scanning speed removed melting pool borders and remaining pores, which resulted in excellent ductility of the samples. To minimise porosity, numerous research has optimised the SLM parameters for various materials. Most of them produce cubes and tensile samples with varying SLM parameters, then choose the ones that ultimately result in the maximum density as determined by the Archimedes density technique. Dilip et al. [8] used this process for HY100 steel, Read at al. [9] also utilized the processes using AlSi10Mg, and Wen et al. [10] used tungsten .This procedure takes a lot of time and materials to make and test all these cubes, thus, this process is inefficient. Furthermore, it's possible that ideal parameters won't be shown in the end.
On the other hand, it has been demonstrated that design of experiments (DOE) methods like the Response Surface Method and statistical analysis employing the analysis of variance (ANOVA) are helpful ways to investigate the impact of numerous aspects in material processing applications. The importance of the selective laser sintering (SLS) process factors on surface roughness has been investigated using the Response Surface design of experiment and ANOVA approach [11]. Similarly, Carter [12] optimised SLM for CMSX-486 Ni-superalloy using the response surface approach and ANOVA methodologies, examining the effects of process parameters (laser power, scan speed, scan spacing, and island size) on crack density and porosity percentage.
Optimising system performance and process yield while keeping costs down are critical goals.. The standard procedure for identifying the ideal operating conditions while maintaining the others at a steady level involves a parameter adjustment. The term "one-variable-at-a-time technique" describes this. This technique's main drawback is that it excludes the impacts of interactions between the variables and, therefore, fails to show all of the effects that the parameters have on the process. Response surface methodology (RSM) can be utilised in optimisation studies to solve this issue.
According to Montgomery et al. [13], The RSM is a sort of statistical and mathematical methods suitable for the analysis and modelling of problems in which an interest response is affected by various parameters and the goal is to optimise this response. Ti6Al4V, Invar36 and SS316L, iron-based powders, Maraging steel, AlSi12, and other materials were subjected to this process. Using DOE has the advantages of potentially showing the optimal parameters and requiring less time than the previous method.
This paper uses ANOVA to optimise the selective laser melting process parameters for AlSi12 alloy. The SLM parameters were analysed and optimised using statistical experimental techniques, including Taguchi and regression analysis. The hardness and microstructure of the formed samples are tested.
2. Experimental Method
2.1. Equipment and Materials
The AlSi12 powder, with the composition shown in Table 1, was supplied by Applied Engineering Materials (AEM).
Figure 1 illustrates a scanning electron microscopy (SEM) micrograph of the powder. It is evident from then image that the powder particles are evenly spherical, which indicates a good powder flowability.
2.2. Statistical Design of Experiment Using Response Surface
An approximation model between the input and output parameters is found using the response surface methodology, a statistical technique used to develop an experimental design that maximises process responses. It is an assortment of mathematical and statistical techniques for simulating and analysing engineering issues. The primary goal of this method is to maximise the response surface, which is affected by several process variables.
The response surface methodology's experimental design process can be summed up as follows:
- Determining the essential process variable.
- Deciding on the upper and lower limit process parameters
- Choosing the output response.
- Creating the matrix for the experimental design.
- Following the design matrix when conducting the studies
- Noting the response from the output
- Creating a mathematical model to connect the output response and the process parameters.
- Making that model more optimal via a genetic algorithm.
2.3. Selective Laser Melting
All samples were fabricated using a Concept Laser M2 Cusing ® SLM machine. The M2 system is equipped with a Yb-Fibre laser, which can produce up to 200 W of laser power, 150 μm of laser track width, and 7000 mm/s of laser scan speed. To create the specimens, stripe scanning strategy was used in order to achieve samples with low pororosity.
2.4. Building of Samples and Preparation
Using a fractional factorial DOE, 16 parametric combinations were employed to create samples to execute the DOE and parametric optimisation. 16 multi tracks samples were produced, each sample had numerous tracks (10X) and was 50 mm in length. This type of DOE was used to determine at what levels of the inputs will the outputs be optimized. The range and amounts of the important process variables under investigation are displayed in Table 2.
2.3. Hardness Testing
In determining the isotropy and mechanical property of the AM products, the micro-hardness test is an important test for this determination. Vickers microhardness was determined via indenter made of diamond pyramid with 100 gf applied force for 10 s dwelling. Five measurement values were recorded randomly from each specimen and the average was calculated.
2.4. Microstructural Analysis
The samples were cut on a cross-sectional area, grinded and polished according to standard procedures. They were etched using the keller’s solution comprising of 96.22% distilled water, 2.59 Nitric acid, 0.64% Hydrochloric Acid, and 0.55% Hydroflouric Acid for 10 s. The microstructures were examined via the BX51 polarizing microscope (OM, Olympus, Japan)
3. Results and Discussion
This section includes the experimental data pertaining to the microhardness measurement, the response's analysis of variance (ANOVA), and the response's optimisation in relation to the processing parameters.
3.1. Microhardness and Microstructure Analysis
Table 3 gives the experimental outcomes of the measured micro hardness (HV). The varying hardness values with the variation in laser power and scanning speed for AlSi12 is depicted in Figure 3. The laser power was discovered to greatly affect the fabricated samples’ hardness. The hardness steadily declined from 131 HV to about 97 HV (B1-1 to C1-1), as the laser power reduced from 200 W to 50 W. The maximum hardness value of about 131 HV was observed at a laser power of 200W and a scanning speed of 1000 mm/s. the processing parameters for Sample 13 and 14 as shown on Figure 4, could not fabricate to produce any specimen, this is owed solely to the combination of very low laser power and high scanning speed. Figure 5 shows the OM micrographs describing the microstructure of the SLM fabricated AlSi12 specimen from a laser power of 200W and scanning speed of 200-1000mm/s. All samples showed similar micrographs. Figure 5 (a) represent the sample with the maximum hardness of 131.48. The observed microstructures were not uniform throughout the material but it exhibit the typical laser tracks of SLM processing also observed by and Su & Yang (2012) [15] and Thijs et al [16]. The tracks consists of scale-like morphology, which was also detected by Liu et al. [17] The cellular and dendrite growth within the grain was also seen in the work by Prashanth et al [18] which they ascribed to the eutectic silicon particles being located at the cellular boundaries. The boundaries in Figure 5 match the portions where two unlike laser tracks are overlapped (revealing a hatch overlaps), which are hence melted two times.
3.2. Results on the ANOVA
The relationship between processing control parameters and manufacturing performance can be shown through statistical analysis. The statistical method of ANOVA was applied to the measured data in order to determine the impact of the input factors on the overall variation of responses. The STAT EASE Design Expert 13 programme was used for response optimisation and statistical analysis to establish the design matrix, as revealed in Table 4.
Owing to the analyzed outcomes, SLM method behaviour has been enhanced via the optimizing process control conditions. The aim of optimization is to improve the products hardness value which are made via the SLM technique. Table 5, highlighted the optimal values of the processing parameters for hardness performance measurement. Furthermore, the expected outcomes were obtained via the model by engaging varying processing parameters.
Process control parameter optimisation has improved the performance of the SLM process, according to the analysis's findings. Maximising hardness value of the produced samples using SLM technology is the aim of optimisation. Table 5 lists the ideal settings for the processing parameters in order to measure hardness performance. Values of hardness that were anticipated and measured in the experiment confirmed the validity of the numerical optimisation. By adjusting the processing parameters, this model allowed for the achievement of the necessary hardness results.
The developed model was then tested for adequacy by applying the ANOVA technique. The F-value and the P-values on Table 6 shows that the input parameters, laser power and scanning speed are significant on the microhardness. From the outcomes of using this technique, it can be noted that the model is significant showing p 0.05 and with F value 21.0, there is only a 0.01% chance that an F-value this large could occur due to noise. For further illustration of adequacy, the hardness model was established via the regression analysis that is contingent on significant processing parameters.
Based on important processing factors, regression analysis was used to build the hardness model.
The coefficient of determination (R2) for the Ra model was 0.8402, R2 adjusted was 0.8003, and the predicted R2 was 0.7168 as shown on Table 7. The Predicted R² of 0.7168 is in realistic concordance with the Adjusted R² of 0.8003; meaning the variation is < 0.2. Adeq Precision calculates the signal to noise ratio. A ratio beyond 4 is obtainable. The obtained ratio of 14.287 reveals a satisfactory signal. The validity of regression model developed is further tested by plotting a scatter diagram Figure 6, which shows the predicted values and actual values of the response are scattered close to 45º line, revealing a practically perfect fit of the developed empirical model. Via an approximate correlation between predicted and adjusted values, the model stability was validated. Hence, the model can be capably used to estimate the SLM products hardness, especially for any sort of processing parameters within this experimental research.
The tight correlation between the adjusted and anticipated values supported the stability of the model. The model may thus be effectively used to predict the hardness of SLM products for any set of processing parameters that fall within the scope of this experimental investigation.
Figure 7 represents the influence of controlling parameters on the microhardness of the SLM build samples. When the laser power and scan speed is elevated, the hardness is at its highest. Laser power had a huge impact on the hardness than the scanning speed. It can be observed that even at the lower laser power we still obtain the hardness that is closer to the maximum hardness obtained.
4. Conclusions
This study elaborates the influence of processing parameters on the hardness of SLM built AlSi12 alloy samples based on full factorial DoE technique. Also, the determined experimental outcomes were achieved via regression and ANOVA analysis. In maximizing the hardness, the regression analysis was employed. From the results achieved, the following important conclusions can be drawn:
- The increasing of the laser power, consequently, makes the hardness to increase because of the increment in the laser beam intensity.
- Scanning speed does not have much impact on the resultant hardness.
- Optimized processing parameters were achieved, which gave a hardness value of 131.48 Hv
Future research should focus on enhancing the obtained optimised AlSi12 alloy hardness and looking into the microstructural evolution and other mechanical properties by using the Cu and Mg additives. This proposed alloy may be applicable to the railway industry, since recently aluminium is very crucial in modernising trains and boosting energy efficiency.
Author Contributions
Writing- original draft preparation, N Kekana. Review and editing, M.B Shongwe, K Mpofu and R Muvunzi. All authors have read and agreed to the published version of the manuscript.
Funding
This research was funded by the National Research Foundation (NRF Grant 123575).
Acknowledgments
We would like to thank the Technology Innovation Agency (TIA) South Africa, Gibela Rail Transport Consortium (GRTC), National Research Foundation (NRF Grant 123575), and the Tshwane University of Technology (TUT).
Conflicts of Interest
The authors declare no conflicts of interest.
References
- Ponnusamy, P.; et al. Mechanical Properties of SLM-Printed Aluminium Alloys: A Review. Materials (Basel) 2020, 13. [Google Scholar] [CrossRef] [PubMed]
- Sun, J.; Yang, Y.; Wang, D. Parametric optimization of selective laser melting for forming Ti6Al4V samples by Taguchi method. Optics & Laser Technology 2013, 49, 118–124. [Google Scholar]
- Guan, K.; et al. Effects of processing parameters on tensile properties of selective laser melted 304 stainless steel. Materials & Design 2013, 50, 581–586. [Google Scholar]
- Nigon, G.N.; Isgor, O.B.; Pasebani, S. The effect of annealing on the selective laser melting of 2205 duplex stainless steel: Microstructure, grain orientation, and manufacturing challenges. Optics & Laser Technology 2021, 134. [Google Scholar]
- Davidson, K.; Singamneni, S. Selective Laser Melting of Duplex Stainless Steel Powders: An Investigation. Materials and Manufacturing Processes 2016, 31, 1543–1555. [Google Scholar] [CrossRef]
- Wang, R.; et al. Effects of laser scanning speed and building direction on the microstructure and mechanical properties of selective laser melted Inconel 718 superalloy. Materials Today Communications 2022, 30. [Google Scholar] [CrossRef]
- Liu, J.; et al. Effect of scanning speed on the microstructure and mechanical behavior of 316L stainless steel fabricated by selective laser melting. Materials & Design 2020, 186. [Google Scholar]
- Dilip, J.J.S.; et al. Selective laser melting of HY100 steel: Process parameters, microstructure and mechanical properties. Additive Manufacturing 2017, 13, 49–60. [Google Scholar] [CrossRef]
- Read, N.; et al. Selective laser melting of AlSi10Mg alloy: Process optimisation and mechanical properties development. Materials & Design (1980-2015) 2015, 65, 417–424. [Google Scholar]
- Wen, S.; et al. High-density tungsten fabricated by selective laser melting: Densification, microstructure, mechanical and thermal performance. Optics & Laser Technology 2019, 116, 128–138. [Google Scholar]
- Bacchewar, P.B.; Singhal, S.K.; Pandey, P.M. Statistical modelling and optimization of surface roughness in the selective laser sintering process. Proceedings of the Institution of Mechanical Engineers, Part B: Journal of Engineering Manufacture. 2007, 221, 35–52. [Google Scholar] [CrossRef]
- Carter, L.N. Selective laser melting of nickel superalloys for high temperature applications. Doctoral dissertation, University of Birmingham, 2013. [Google Scholar]
- Montgomery, D.C. Design and analysis of experiments; John wiley & sons, 2017. [Google Scholar]
- Thijs, L.; Verhaeghe, F.; Craeghs, T.; Van Humbeeck, J.; Kruth, J.P. A study of the microstructural evolution during selective laser melting of Ti–6Al–4V. Acta materialia, 2010, 58, 3303–3312. [Google Scholar] [CrossRef]
- Su, X.; Yang, Y. Research on track overlapping during Selective Laser Melting of powders. Journal of Materials Processing Technology 2012, 212, 2074–2079. [Google Scholar] [CrossRef]
- Thijs, L.; et al. Fine-structured aluminium products with controllable texture by selective laser melting of pre-alloyed AlSi10Mg powder. Acta Materialia 2013, 61, 1809–1819. [Google Scholar] [CrossRef]
- Liu, J.; et al. Effect of laser hatch style on densification behavior, microstructure, and tribological performance of aluminum alloys by selective laser melting. Journal of Materials Research 2018, 33, 1713–1722. [Google Scholar] [CrossRef]
- Prashanth, K.G.; et al. Microstructure and mechanical properties of Al–12Si produced by selective laser melting: Effect of heat treatment. Materials Science and Engineering: A 2014, 590, 153–160. [Google Scholar] [CrossRef]
- Available online: https://www.sunrise-metal.com/alsi12-alloy-mechnical-properity/ (accessed on 16 February 2024).
Figure 1.
SEM morphology of AlSi12 powder.
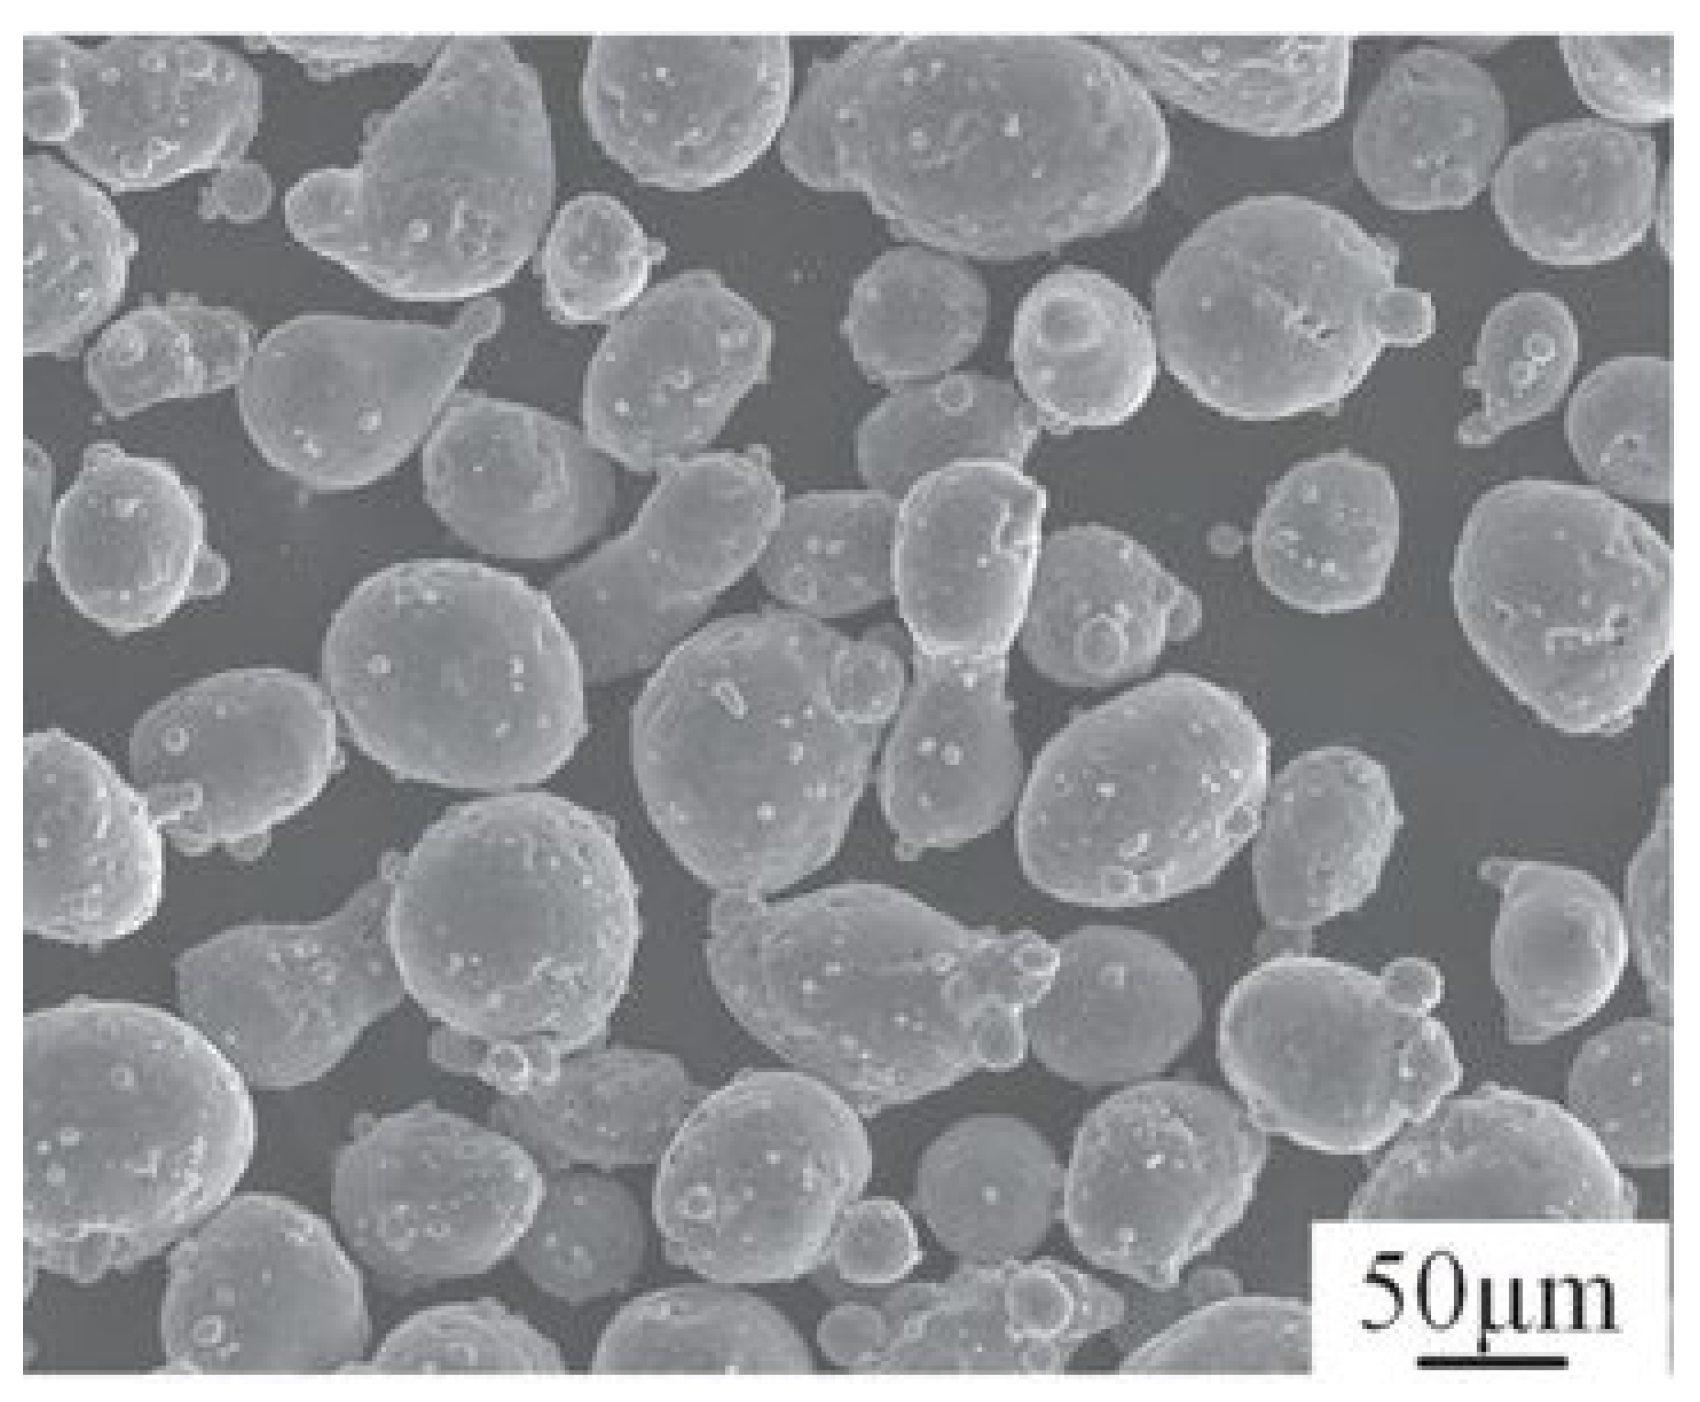
Figure 3.
Hardness values of AlSi12 alloy.
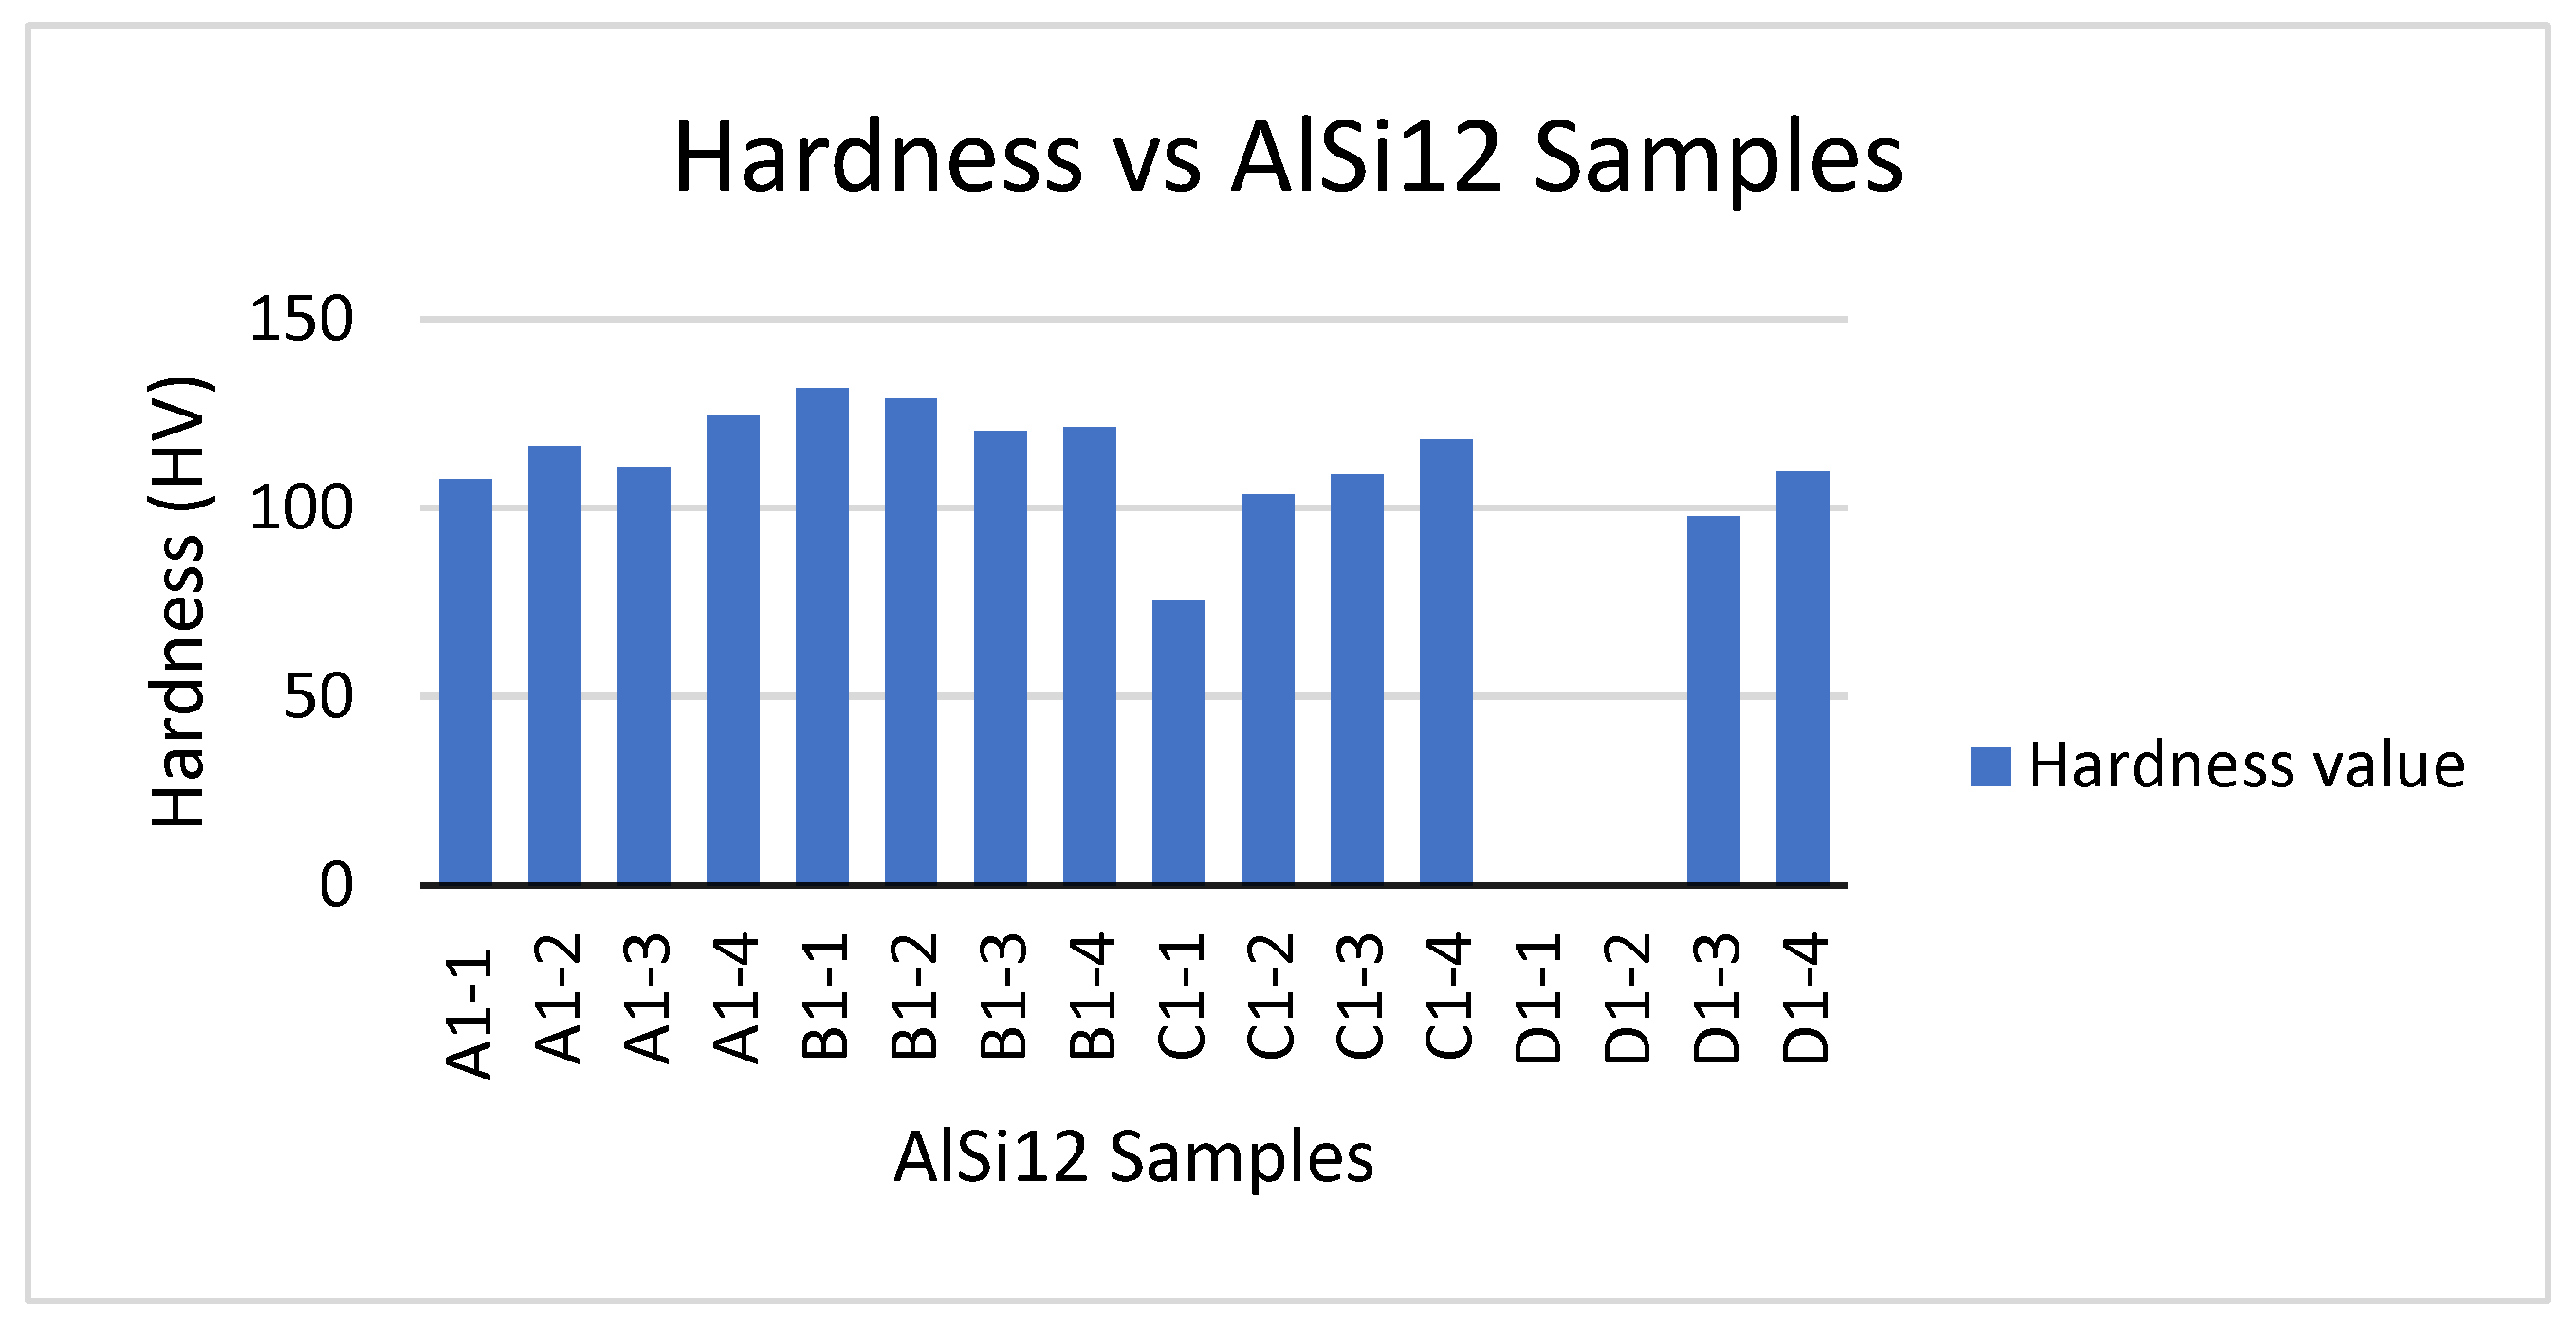
Figure 4.
As-Built Samples.
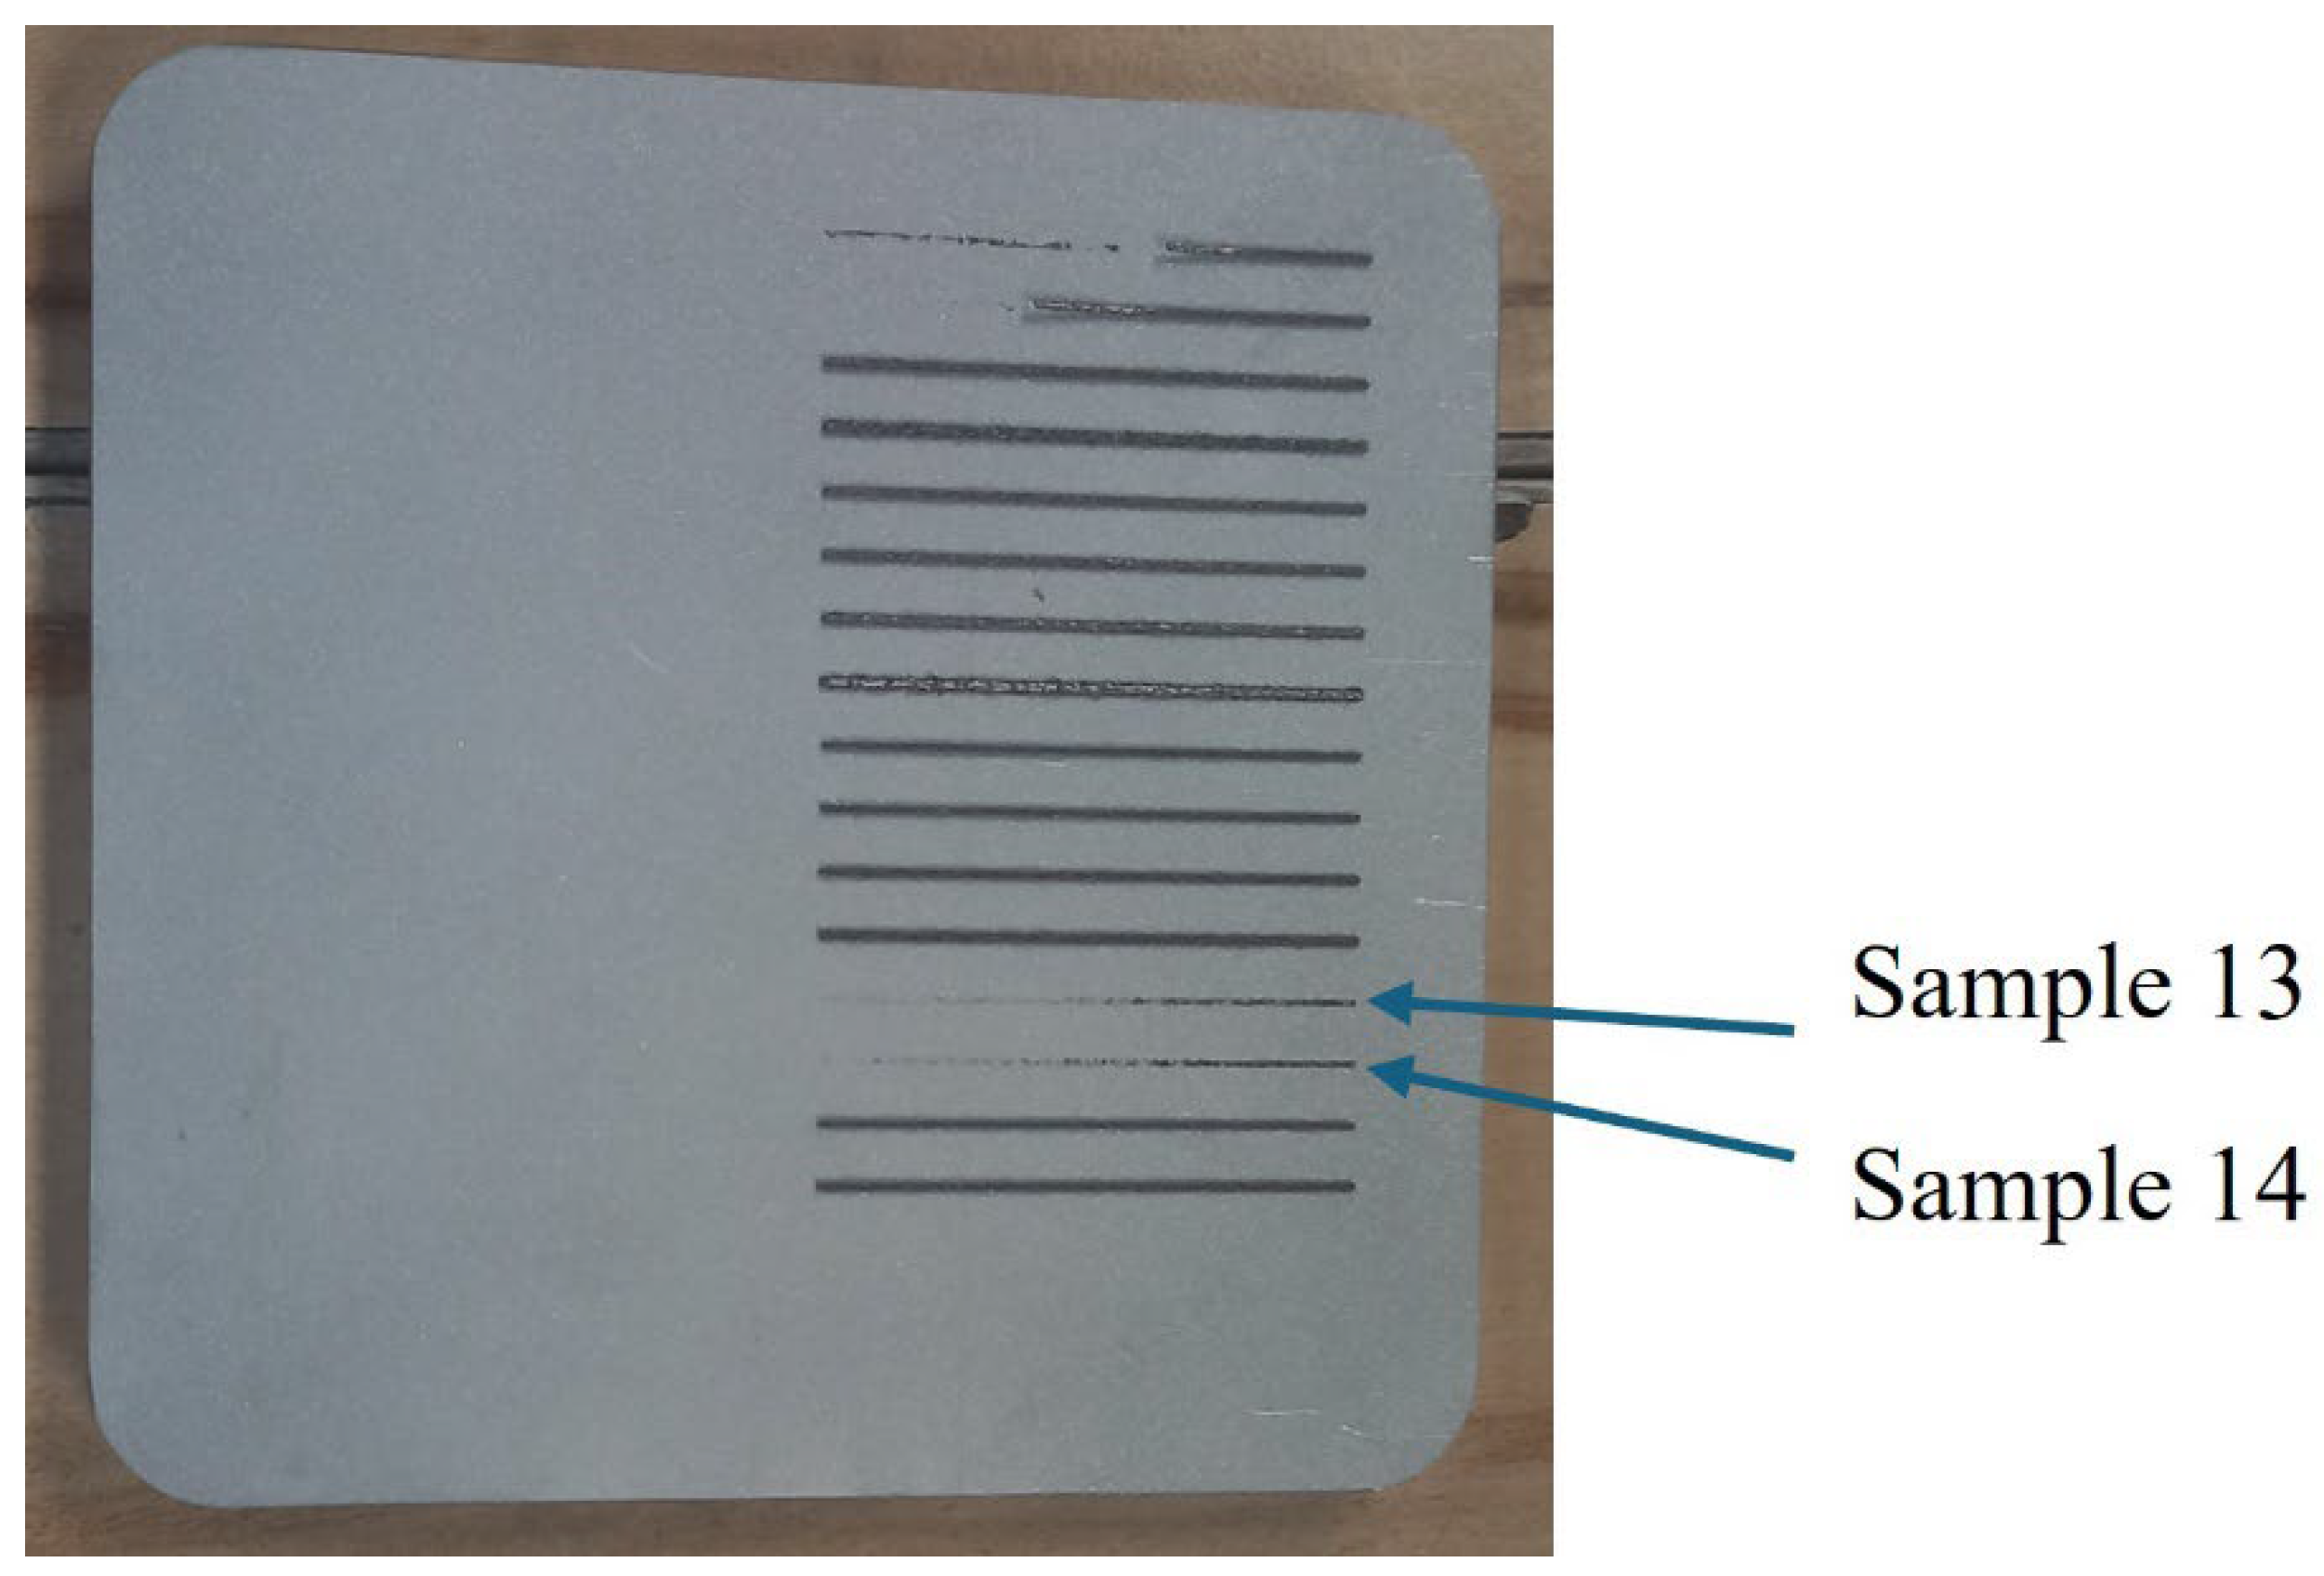
Figure 5.
OM images of a cross sectional multiple track of SLM produced samples.
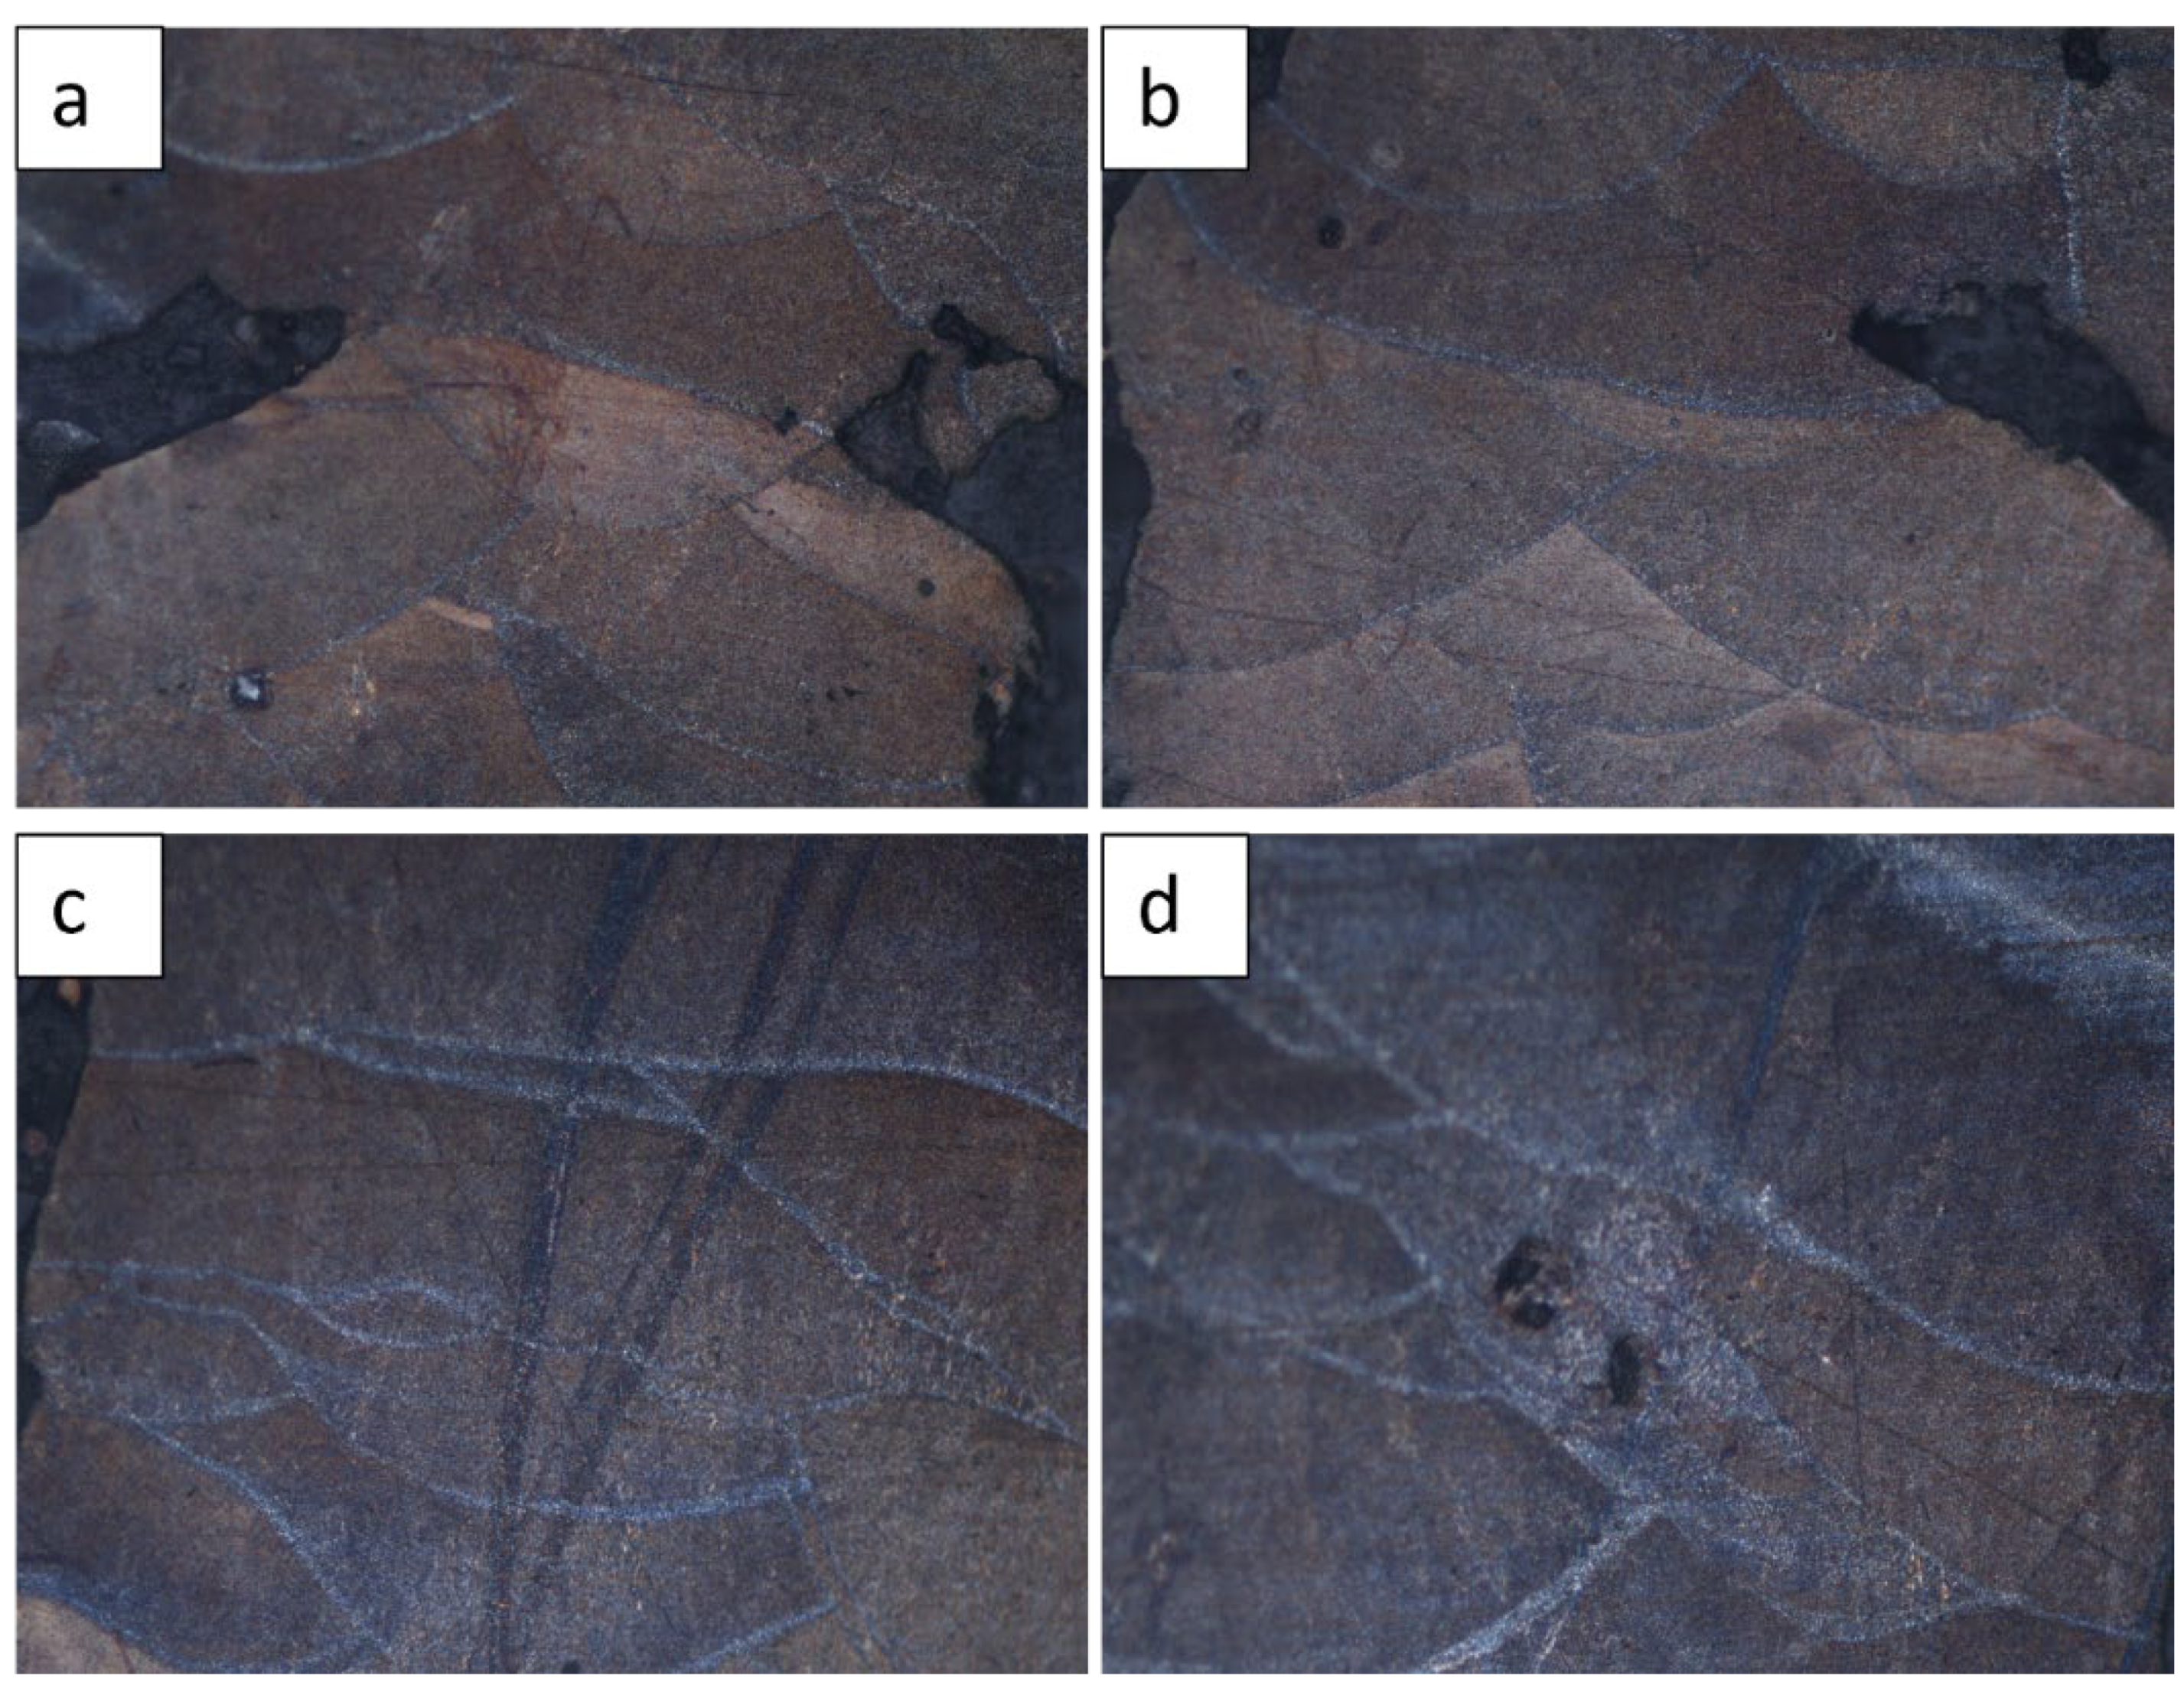
Figure 6.
The predicted values vs actual values of hardness.
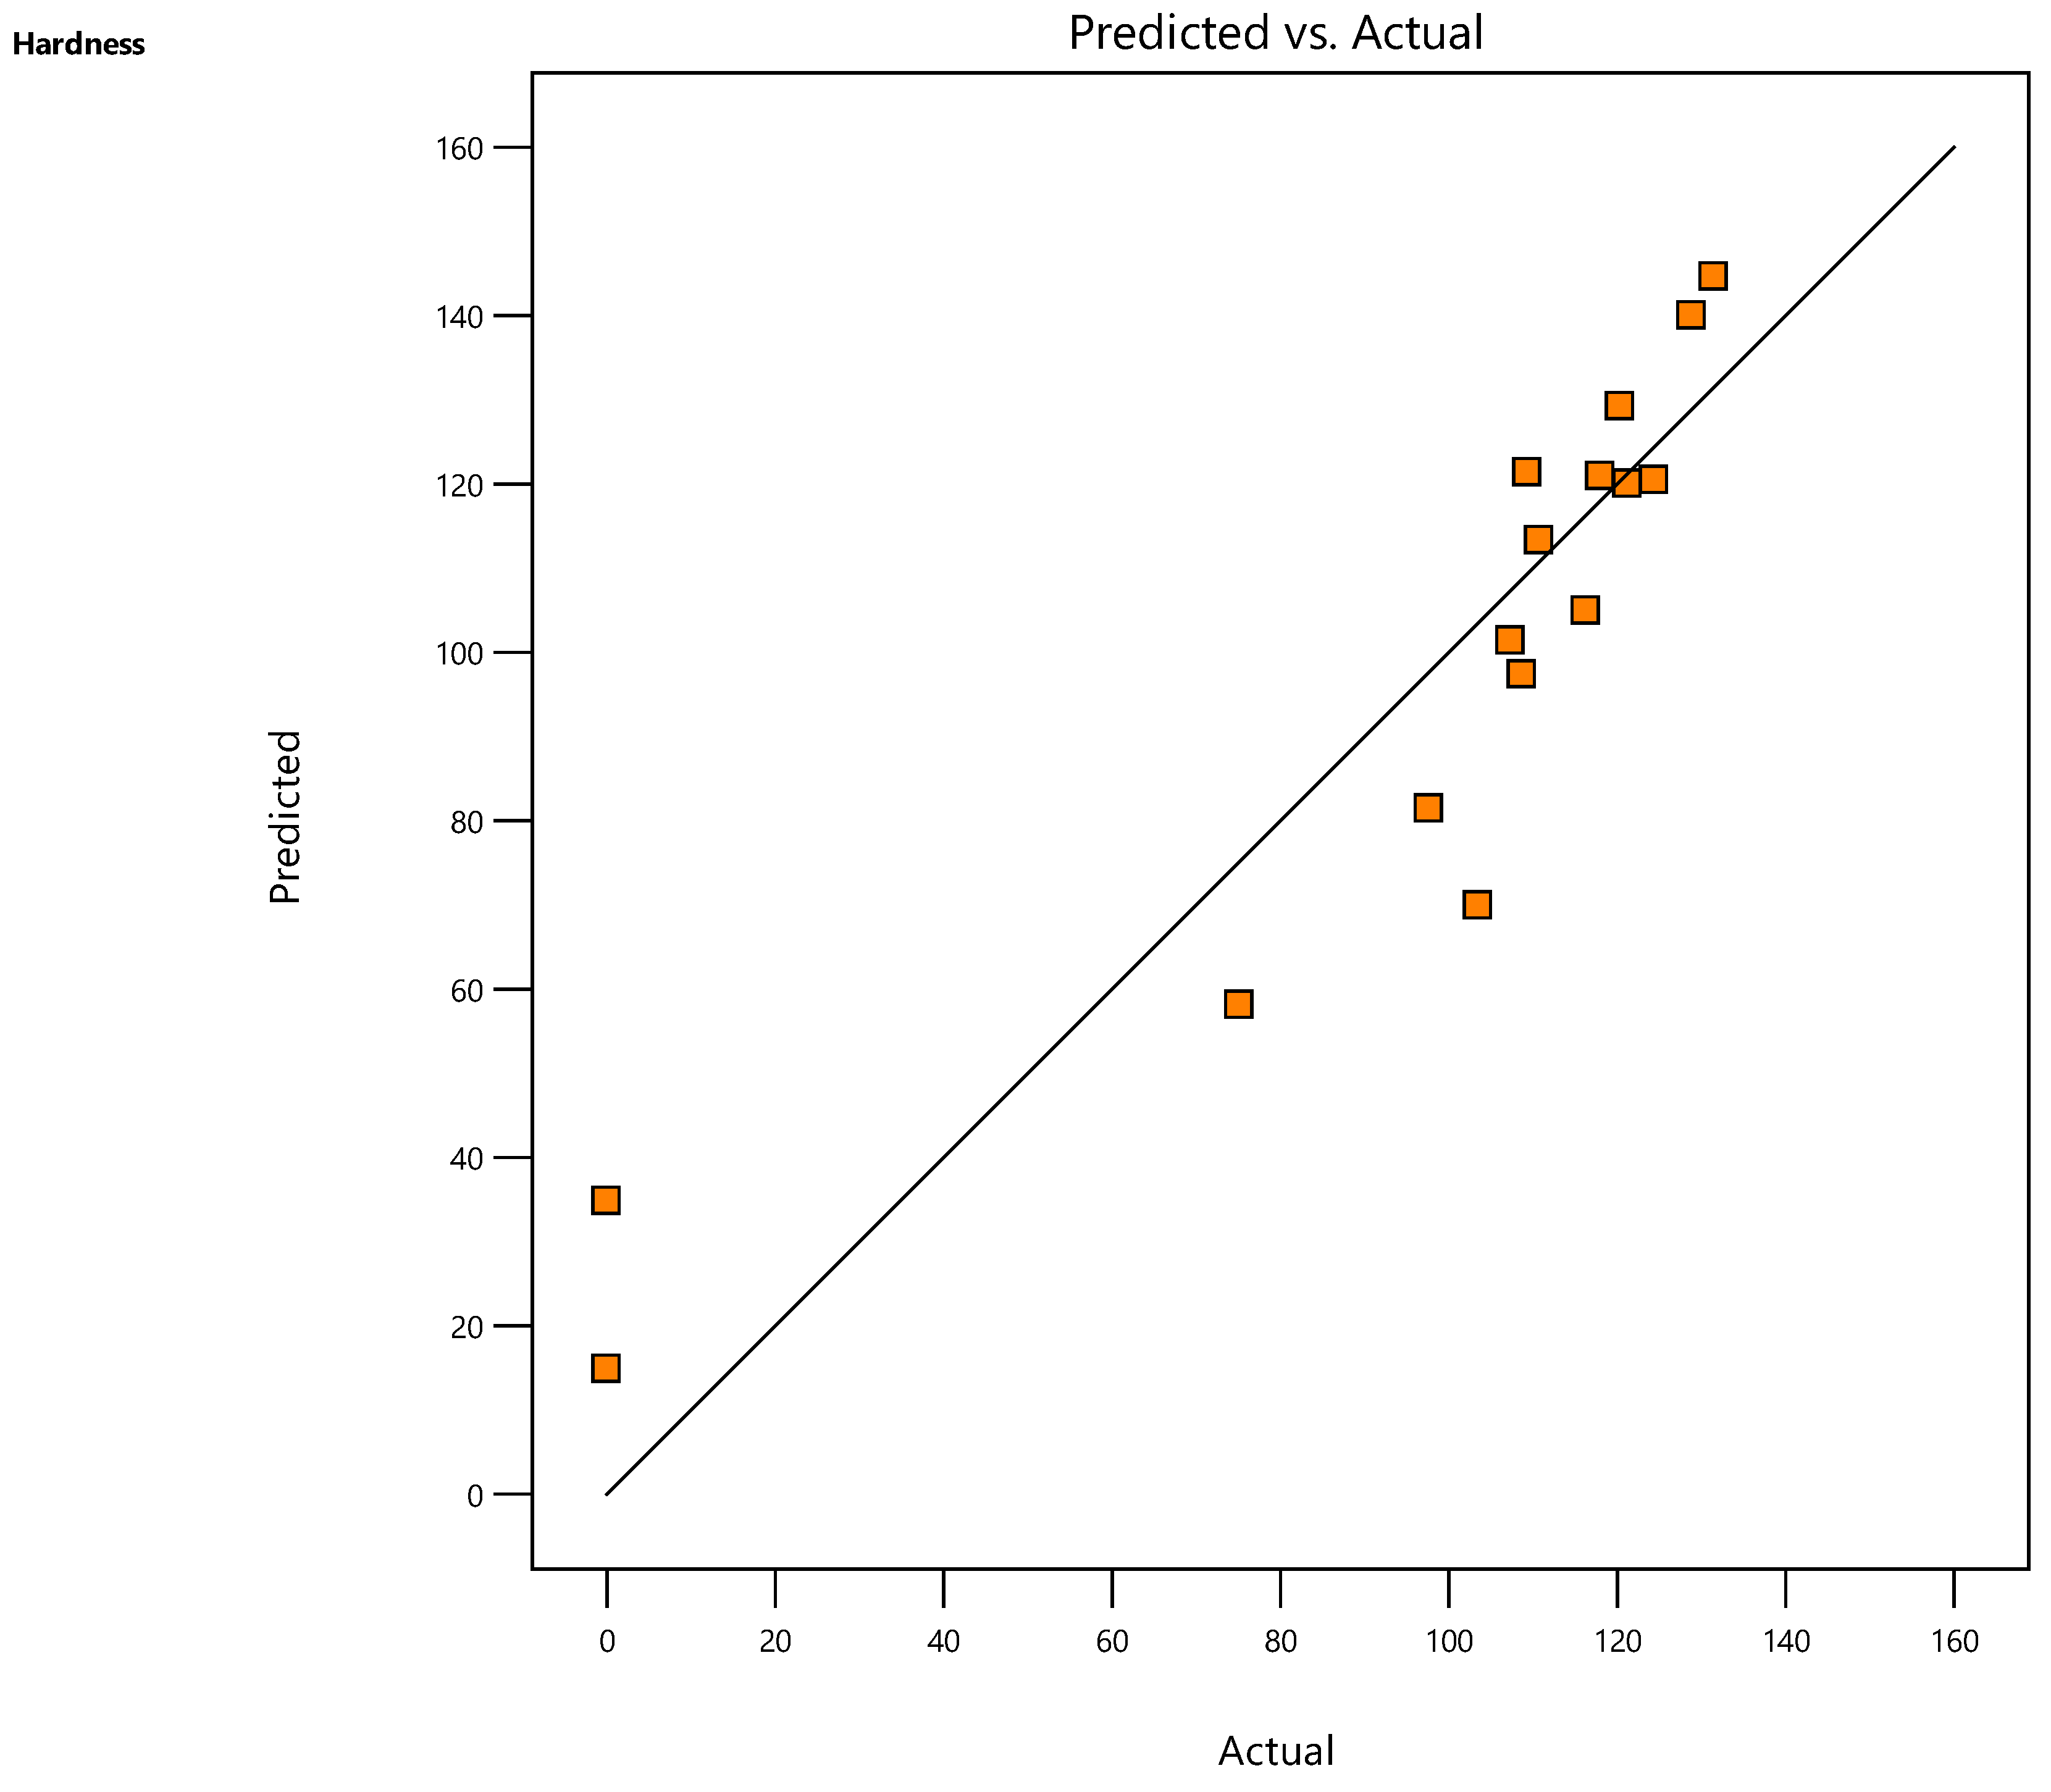
Figure 7.
Contour plot of laser power and scanning speed for hardness.
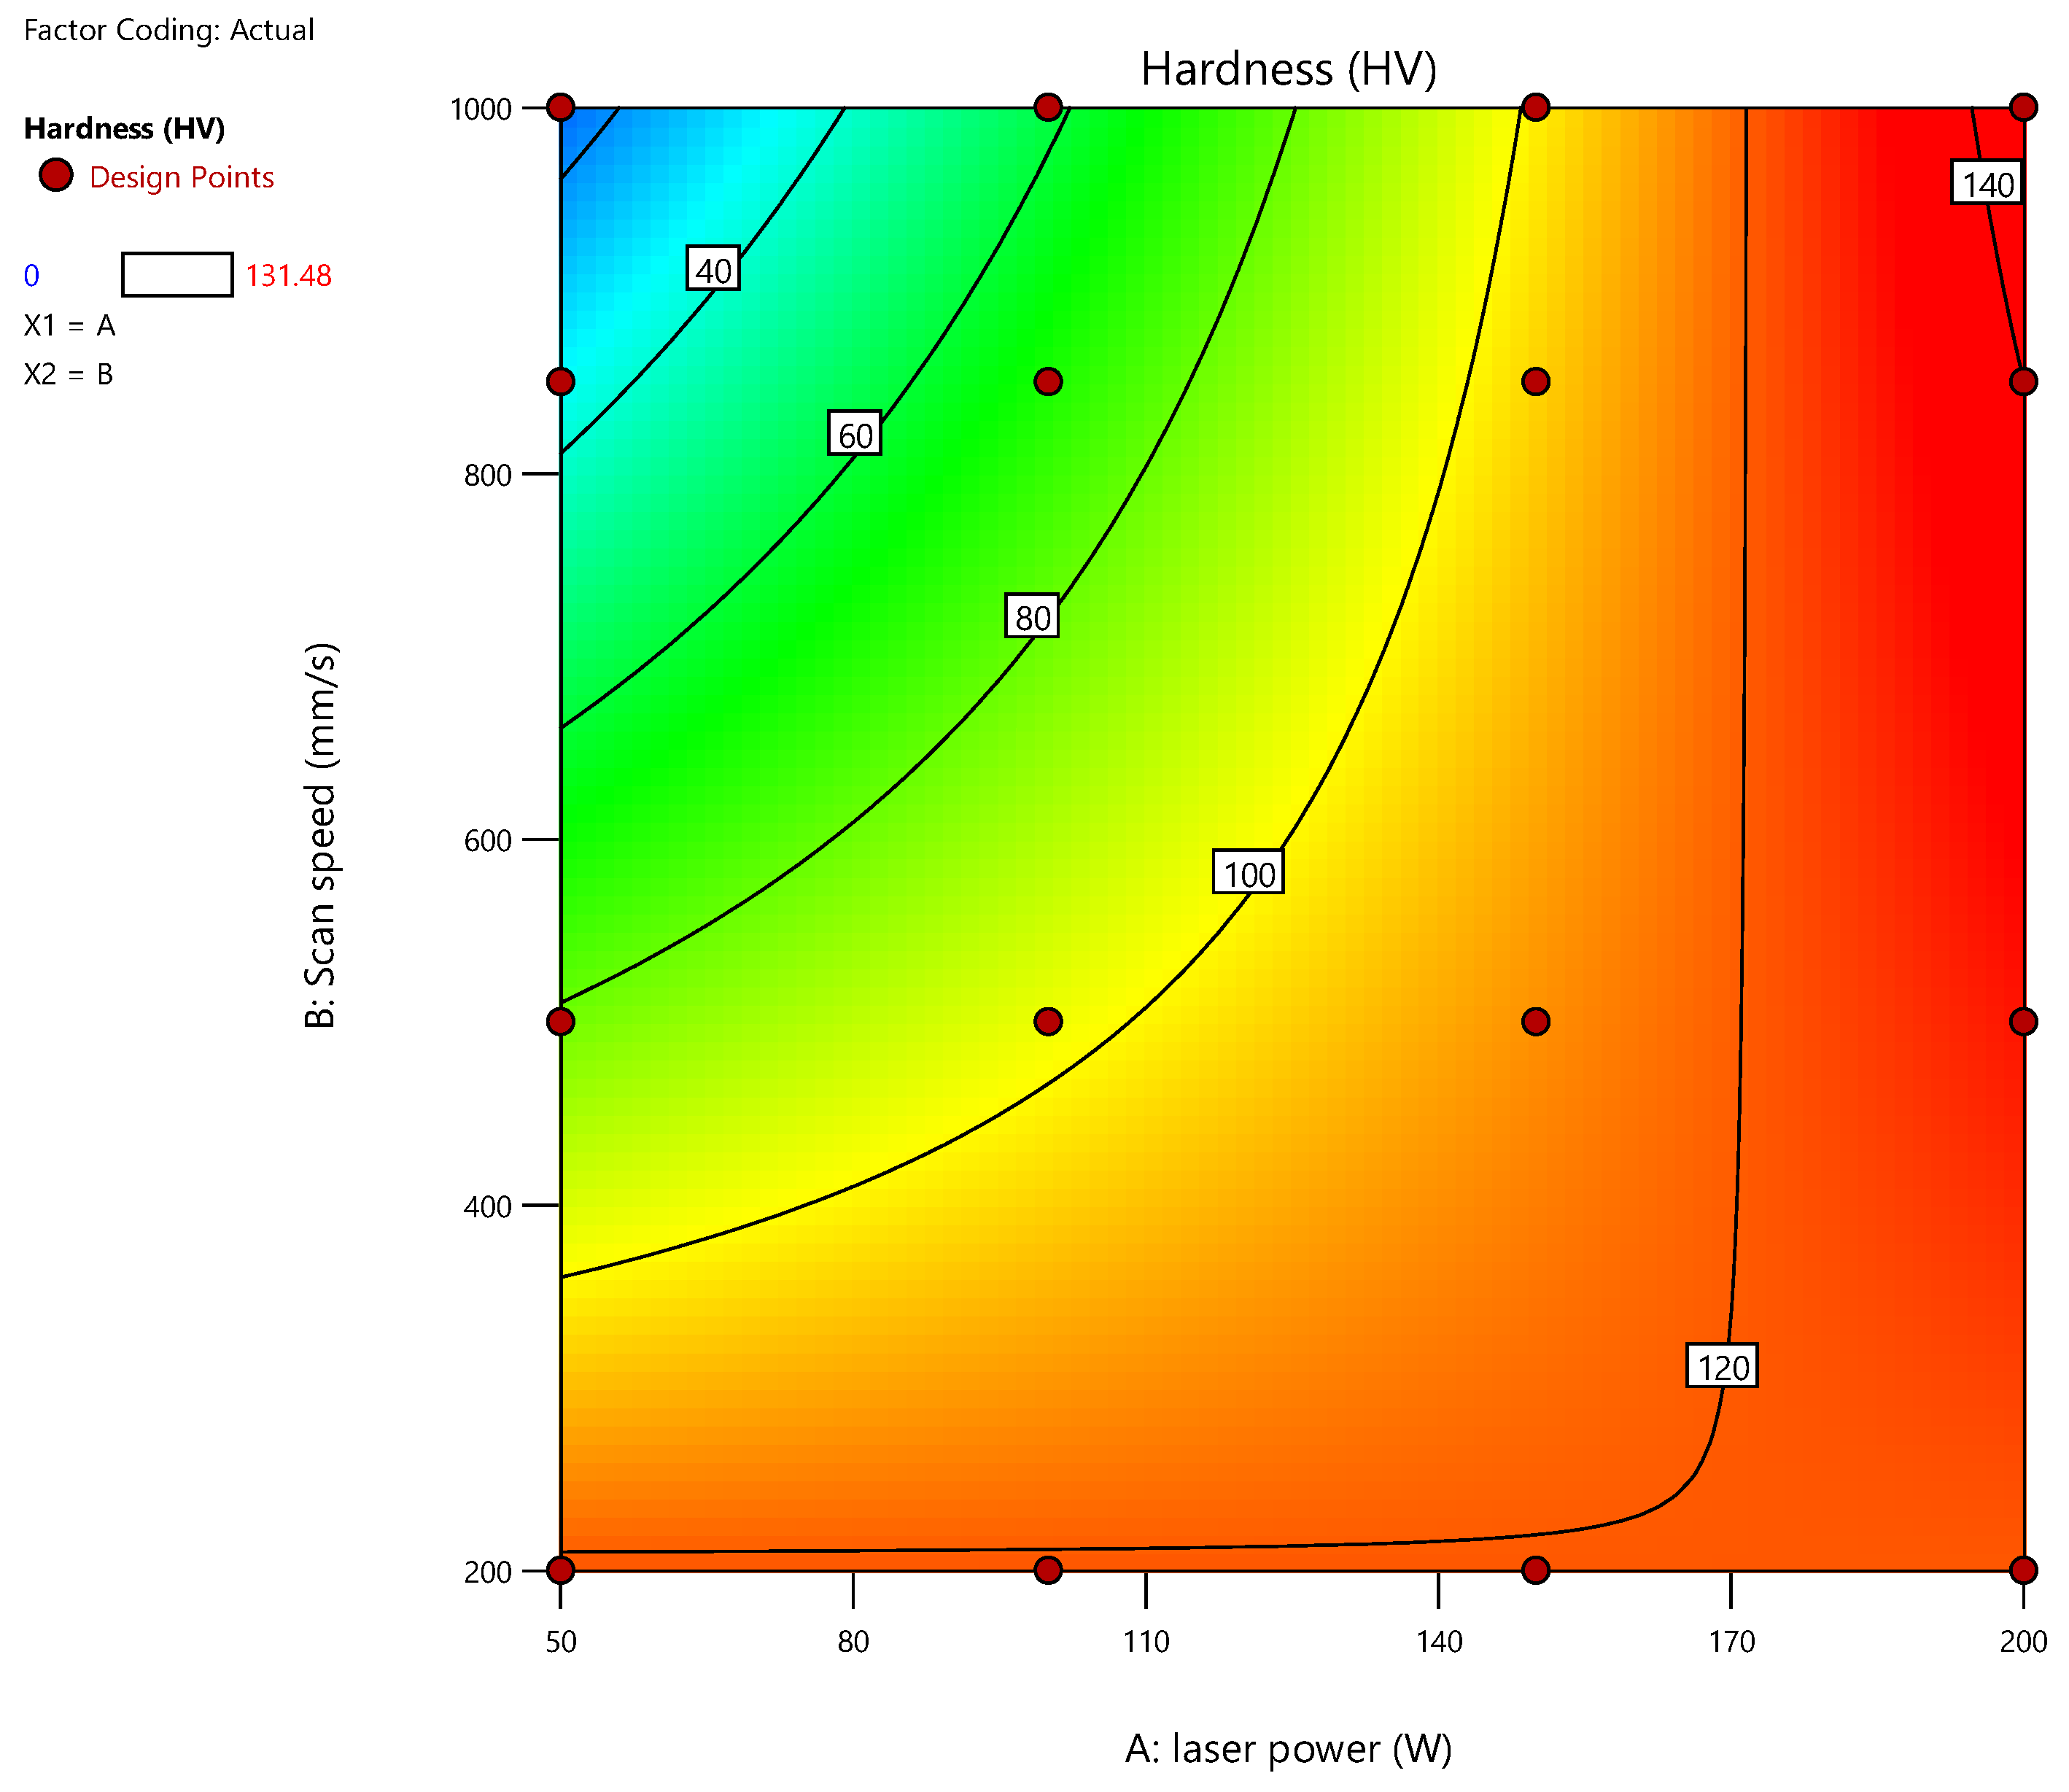

Table 1.
The AlSi12 powder Chemical composition.
| Elements | Si | Fe | Mn | Zn | Al | Cu | Mg | Pb | Sn | O |
| Wt% | 11.0-13.3 | Balance |
Table 2.
The range of matrix building parameters.
| Parameter | units | levels | |||
| Scanning speed | mm/s | 200 | 500 | 850 | 1000 |
| Laser power | W | 50 | 100 | 150 | 200 |
Table 3.
Microhardness values of AlSi12 alloy.
| Sample No | Material AlSi12 | LP (W) | SS (mm/s) | Hardness value | |
|---|---|---|---|---|---|
| 1 | A1-1 | 150 | 1000 | 107.32 | |
| 2 | A1-2 | 150 | 850 | 116.27 | |
| 3 | A1-3 | 150 | 500 | 110.75 | |
| 4 | A1-4 | 150 | 200 | 124.40 | |
| 5 | B1-1 | 200 | 1000 | 131,48 | |
| 6 | B1-2 | 200 | 850 | 128.82 | |
| 7 | B1-3 | 200 | 500 | 120.36 | |
| 8 | B1-4 | 200 | 200 | 121.23 | |
| 9 | C1-1 | 100 | 1000 | 75.15 | |
| 10 | C1-2 | 100 | 850 | 103.48 | |
| 11 | C1-3 | 100 | 500 | 108.70 | |
| 12 | C1-4 | 100 | 200 | 118.02 | |
| 13 | D1-1 | 50 | 1000 | - | |
| 14 | D1-2 | 50 | 850 | - | |
| 15 | D1-3 | 50 | 500 | 97.66 | |
| 16 | D1-4 | 50 | 200 | 109.34 |
Table 4.
Design matrix and experimentally recorded responses.
| Run Order | Actual Value | Predicted Value | Residual | Leverage | Internally Studentized Residuals | Externally Studentized Residuals | Cook's Distance | Influence on Fitted Value DFFITS | Standard Order |
|---|---|---|---|---|---|---|---|---|---|
| 1 | 107.32 | 101.39 | 5.93 | 0.177 | 0.360 | 0.346 | 0.007 | 0.161 | 11 |
| 2 | 116.27 | 104.97 | 11.30 | 0.110 | 0.659 | 0.643 | 0.013 | 0.226 | 4 |
| 3 | 110.75 | 113.32 | -2.57 | 0.090 | -0.148 | -0.142 | 0.001 | -0.045 | 10 |
| 4 | 124.40 | 120.47 | 3.93 | 0.223 | 0.245 | 0.235 | 0.004 | 0.126 | 8 |
| 5 | 131.48 | 144.65 | -13.17 | 0.413 | -0.946 | -0.942 | 0.157 | -0.789 | 7 |
| 6 | 128.82 | 140.03 | -11.21 | 0.257 | -0.716 | -0.700 | 0.044 | -0.412 | 5 |
| 7 | 120.36 | 129.25 | -8.89 | 0.209 | -0.550 | -0.534 | 0.020 | -0.275 | 13 |
| 8 | 121.23 | 120.01 | 1.22 | 0.521⁽¹⁾ | 0.097 | 0.093 | 0.003 | 0.097 | 6 |
| 9 | 75.15 | 58.13 | 17.02 | 0.177 | 1.033 | 1.036 | 0.057 | 0.480 | 12 |
| 10 | 103.48 | 69.90 | 33.58 | 0.110 | 1.959 | 2.274 | 0.119 | 0.800 | 1 |
| 11 | 108.70 | 97.38 | 11.32 | 0.090 | 0.653 | 0.637 | 0.010 | 0.200 | 3 |
| 12 | 118.02 | 120.93 | -2.91 | 0.223 | -0.182 | -0.174 | 0.002 | -0.094 | 2 |
| 13 | 0.0000 | 14.86 | -14.86 | 0.413 | -1.067 | -1.074 | 0.200 | -0.901 | 9 |
| 14 | 0.0000 | 34.84 | -34.84 | 0.257 | -2.224 | -2.777 | 0.427 | -1.632⁽²⁾ | 14 |
| 15 | 97.66 | 81.44 | 16.22 | 0.209 | 1.004 | 1.004 | 0.067 | 0.516 | 15 |
| 16 | 109.34 | 121.39 | -12.05 | 0.521⁽¹⁾ | -0.959 | -0.955 | 0.250 | -0.997 | 16 |
Table 5.
The predicted and actual measured results of optimized processing parameters.
| Objective | Optimized processing parameter |
Predicted Value |
Experimental Value | |
|---|---|---|---|---|
| Maximize hardness |
Laser power = 200W | 144,65 | 131,48 | |
| Scanning speed =1000 mm/s | ||||
Table 6.
ANOVA Table for output.
| Source | Sum of Squares | df | Mean Square | F-value | p-value | |
|---|---|---|---|---|---|---|
| Model | 20831.78 | 3 | 6943.93 | 21.03 | < 0.0001 | significant |
| A-laser power | 9029.59 | 1 | 9029.59 | 27.35 | 0.0002 | |
| B-Scan speed | 4054.14 | 1 | 4054.14 | 12.28 | 0.0043 | |
| AB | 5778.18 | 1 | 5778.18 | 17.50 | 0.0013 | |
| Residual | 3961.39 | 12 | 330.12 | |||
| Cor Total | 24793.17 | 15 |
Table 7.
R2 Test for hardness regression model.
| Std. Dev. | 18.17 | R² | 0.8402 |
| Mean | 98.31 | Adjusted R² | 0.8003 |
| C.V. % | 18.48 | Predicted R² | 0.7168 |
| Adeq Precision | 14.2870 |
Disclaimer/Publisher’s Note: The statements, opinions and data contained in all publications are solely those of the individual author(s) and contributor(s) and not of MDPI and/or the editor(s). MDPI and/or the editor(s) disclaim responsibility for any injury to people or property resulting from any ideas, methods, instructions or products referred to in the content. |
© 2024 by the authors. Licensee MDPI, Basel, Switzerland. This article is an open access article distributed under the terms and conditions of the Creative Commons Attribution (CC BY) license (http://creativecommons.org/licenses/by/4.0/).
Copyright: This open access article is published under a Creative Commons CC BY 4.0 license, which permit the free download, distribution, and reuse, provided that the author and preprint are cited in any reuse.


