Submitted:
19 June 2024
Posted:
20 June 2024
You are already at the latest version
Abstract
Few studies have explored the gender wage gap among farmworkers, and there is a notable absence of research on how farm wages impact household welfare differently based on gender. This study aims to fill this gap by examining how farm wages affect gender disparities in household welfare among farmworkers in Nigeria. Using survey data from 720 farmworkers, we investigated gender-based differences in household welfare. Our approach combined parametric methods (Blinder-Oaxaca decomposition) to assess gender gaps in household welfare and non-parametric techniques (Propensity Score Matching, PSM) to estimate the effects of farm wages. The analysis reveals that female farmworkers experience significantly lower per capita food consumption expenditure (₦11,486.51 less) compared to their male counterparts. These disparities partly stem from differences in socioeconomic factors, job characteristics, and enterprise attributes between male and female farmworkers. The study underscores the role of farm wages in mitigating gender gaps in household welfare, demonstrating that farm wages have increased per capita food consumption expenditure for female farmworkers by ₦6,640.698. This finding highlights the potential of wage increases to enhance livelihoods, underscoring the importance of equitable wage policies in farming. Furthermore, our findings emphasize that the impact of farm wages on welfare varies with household characteristics, suggesting the need for targeted interventions tailored to enhance identified household attributes. Addressing these factors could effectively reduce gender inequalities in farm work and contribute to overall welfare improvements.
Keywords:
Farmworkers
; gender gap
; wage inequalities
; household welfare
; effect
; labour
1. Introduction
In Nigeria, the agricultural sector holds considerable importance in terms of GDP contribution, employment rates, and export earnings. However, several challenges hinder its global performance, including women's limited access to crucial markets, services, and resources [1]. Investing in this sector has been shown to reduce poverty, enhance employment opportunities and productivity, and promote sustainable development [2]. Rural employment encompasses various roles such as farming, self-employment in trade, operating small enterprises, and both agricultural and non-agricultural wage labour. Many of these occupations involve long hours and inadequate compensation. Gender inequality persists across economic sectors in Nigeria, particularly within agriculture. The Federal Ministry of Agriculture and Rural Development of Nigeria [3] reports that despite women constituting 60–79% of the rural labour force, they are five times less likely than men to own land. In terms of earnings, there are significant salary discrepancies between male (₦1,454) and female (₦1,246) agricultural workers [4]. The gender gap in the agricultural sector compromises goals for overall socioeconomic growth and productivity. The FAO highlights that women in developing countries face comparable challenges in accessing resources such as labour, land, education, livestock, extension services, and financial support.
Globally, there is a growing chorus advocating for gender equality through protests and activism. Achieving gender equality and empowering all women is the fifth Sustainable Development Goal (SDG), a goal that hinges on dismantling barriers based on gender—whether societal, legal, or economic. The elimination of gender disparities has become a key priority for international development efforts. In rural areas, both men and women often juggle diverse job responsibilities and engage in multiple concurrent activities, sometimes switching roles depending on the season or experiencing periods of underemployment or unemployment. Women, particularly in rural settings, play crucial roles in both agricultural and non-agricultural activities, crucially contributing to their families' financial stability and food security [5]. They constitute approximately 43% of the agricultural labour force in developing nations [1]. Despite their significant contributions, women worldwide are less likely than men to participate in formal employment and hold leadership positions. The International Labour Organization [6] reported a global gender gap in labour force participation of 25% in 2022, with women comprising 47% of the workforce compared to men's 72%. This gap is more pronounced in regions like the Arab States, South Asia, and Africa, where it can reach 50% or higher. Women also face disparities in pay, often earning less than men for similar work. In 2022, women globally earned nearly 20% less than men (6). Furthermore, women remain underrepresented in leadership roles, holding only 27% of management positions worldwide according to the World Economic Forum's Global Gender Gap Report [7]. These statistics underscore the persistent gender disparities in economic participation and opportunity, highlighting the ongoing need for concerted efforts to achieve true gender equality.
Recent strides have been made in narrowing gender gaps in education, health, and political representation; however, similar progress has not been seen in the outcomes of women in the agricultural labour market. Despite significant improvements in female participation in the farm labour force over the past 25 years, gender disparities remain prevalent and persistent [8]. Research from both developed and developing countries indicates that, on average, women are paid 10–30% less than men for performing the same work [9]. In Sub-Saharan Africa, women's employment in professional and technical roles, as well as their earning potential, lags significantly behind [10]. Beyond agriculture, gender wage gaps are widespread across all sectors in Sub-Saharan African labour markets, with an average unadjusted gap of 30%. This means that women earn 70 cents for every US dollar earned by men in sectors like manufacturing, services, and trade [11]. Women often hold the lowest-paid and least protected jobs, and discriminatory attitudes frequently hinder their access to better opportunities [8], 2021). A study by Mukasa and Salami [12] found an 18.6% gender gap in agricultural output in Nigeria, attributing this disparity to challenges women face in accessing labour, large land holdings, and quality land. This reinforces earlier findings by Oseni, Goldstein, and Utah [13], who identified unequal access to land, labour, inputs, tools, and information as contributing factors to gender disparities in agricultural earnings in Nigeria.
Reducing the gender wage gap could benefit women and their families in agriculture, while perpetuating it may hinder women's access to economic opportunities and restrict their overall development [14]. Despite this, discussions on gender disparities in farm labour have primarily centered on differences in economic opportunities [15]. Given concerns about gender pay gaps in agriculture, it is crucial to examine wage discrepancies and their impact on broader development outcomes, such as women's household welfare, rather than solely focusing on labour force participation in agriculture. This raises the question: does farm wages affect the gender gap in household welfare? This specific query remains largely unaddressed in existing literature. Most studies have concentrated on how gender inequality influences economic development at a macro level [16,17,18,19,20,21], with fewer examining links between gender inequality, poverty, and domestic violence [22,23]. Notably, these studies often rely on cross-country comparisons and emphasize economic growth, highlighting a gap that our study aims to address.
This study seeks to deepen our understanding of the relationship between farm wages and household welfare by investigating two primary aspects. First, we analyze how farm wages impact household welfare for both men and women. Second, we explore the barriers or factors that contribute to widening the gender gap in farm wages. Our research contributes significantly to the literature by examining how gender disparities influence a crucial household outcome—welfare—in sub-Saharan Africa, where empirical studies on this topic are notably scarce. Methodologically, our study introduces and utilizes decomposition-matching techniques that represent an advancement in current approaches within the literature. This methodological innovation enhances our ability to dissect and understand the dynamics at play.
2. Review of Relevant Literature
Over the past two decades, gender equality concerns and related development goals, such as women's household welfare, have garnered significant global attention. The Sustainable Development Goals (SDGs) underscore the importance of gender equality and the empowerment of women and girls (SDG 5), alongside promoting productive employment and decent work for all (SDG 8) to foster inclusive and sustainable economic growth. Research on women's empowerment indicates that increased representation in decision-making roles positively impacts family well-being (Doss, 2006; Doepke and Tertilt, 2011; Cuberes and Teignier, 2016; Annan et al., 2020).
The academic literature has extensively explored the gender wage gap within the global agricultural sector. Numerous studies, primarily focusing on developed countries, have investigated the extent, patterns, and underlying causes of this disparity [28,29,30,31,32,33,34,35]. For instance, Eastough and Miller [28] examined gender pay disparities among self-employed individuals in Australia, attributing a significant portion of the gap to liquidity constraints, which are more challenging for self-employed women to overcome compared to men. Christofides et al. [31] analyzed data across 26 European countries and highlighted substantial variation in the magnitude of the gender wage gap due to differences in definitions and selection-correction mechanisms. Cardoso et al. [34] investigated factors influencing gender wage disparities in Portugal, revealing that job segregation across firms accounted for a significant portion of the wage gap. Blau and Kahn [35] used panel data spanning from 1980 to 2010 in the US to offer updated empirical insights into the persistence of gender disparities across industries and occupations. They found that traditional human capital variables could not fully explain the observed wage gap, which was influenced by factors such as educational attainment, work experience, demographics, occupation, industry, access to financing, job characteristics, religious affiliation, gender roles in parental care, traditional ideologies, ethnicity, and race. Regarding the importance of agriculture, Akter et al. [36] focused on four Asian countries—Philippines, Thailand, Indonesia, and Myanmar—advocating for tailored gender interventions to address agricultural gender disparities. Winther et al. [37] explored the impact of access to electricity on welfare in developing contexts, highlighting its implications for gender relations which remain largely understudied.
In Nigeria, women have made significant strides in the workforce over the past thirty years, marked by increased participation in the labour force, substantial gains in education, growth in higher-paying jobs, and notable rises in real income. Despite these advancements, men consistently earn higher wages than women across nearly all professions [38]. The existence of a gender wage gap is widely acknowledged, despite Nigeria having passed equal pay legislation nearly forty years ago. Regulations such as the Gender Equality Duty 2007 and the Equality Act 2010 reinforce gender equality mandates within public entities, yet achieving employment parity remains a formidable challenge for the country. According to the UNDP [39], Nigeria exhibits one of the largest gender pay gaps globally, with women underrepresented in higher-paying and more influential occupations. Research by Ekerebi and Adeola [40] underscores the critical role of women in agriculture, where they contribute significantly to the sector's labour force—comprising between 60% to 80%—and perform a diverse array of tasks. Despite this, women farmers typically have less control over their land and limited access to resources compared to their male counterparts, as highlighted by the FAO [1]. The decision for women to enter the workforce is influenced by a complex interplay of individual traits and broader institutional, social, and economic factors within each nation [41]. Improved educational attainment levels among women have positively impacted their participation in the labour market, a trend supported by studies such as those by Heath and Jayachandran [42] and Klasen [41]. Educational achievement is consistently identified as a critical driver in this regard.
The literature review underscores that disparities in wages between male and female farmworkers significantly limit household welfare in Nigeria. Targeted interventions could improve the welfare of farmworkers, especially women, and narrow the gender gap. Various approaches exist for integrating gender considerations into decomposition-matching models, yet our study specifically examined the impact of gender-specific farm wages on household welfare.
3. Materials and Methods
3.1. Study Area:
This study was conducted in the southwest region of Nigeria, encompassing six states: Ekiti, Lagos, Ogun, Ondo, Osun, and Oyo. Positioned between latitudes 6° N and 4° S, and longitudes 4° W and 6° E, the region covers approximately 114,271 km². It experiences an annual rainfall ranging from 1,200 to 1,500mm, with mean monthly temperatures varying from 18 to 24°C during the rainy season and 30 to 37°C in the dry season. The area is predominantly agricultural due to its fertile alluvial soil. Key crops cultivated include cassava, maize, yam, cocoyam, cowpea, various vegetables, and cash crops such as cocoa, kola nut, rubber, citrus, coffee, cashew, mango, and oil palm. The study included all rural farming households within this region.
3.2. Data and Sampling Methods:
Our study utilized data from a survey conducted among farmworkers between August and November 2023. We employed a multi-level stratified random sampling technique to select our sample. Initially, we randomly chose 50% of the six states in the southwest region, specifically Ogun, Osun, and Oyo. In the next phase, we purposively selected 8 agricultural firms per state, covering crop production, poultry and livestock, fishery and aquaculture, and agro-processing, totalling 24 firms. We obtained lists of registered farmworkers from these firms and farmworkers' associations. Subsequently, we randomly selected 30 farmworkers (15 male and 15 female) from each chosen agricultural firm, resulting in a total of 720 respondents (360 male and 360 female) for the study. However, despite our intention to sample an equal number of male and female farmworkers, our final sample comprised 323 male and 397 female participants.
We employed a structured questionnaire for data collection, administered through Kobotoolbox on electronic Android tablets. The questionnaire was divided into sections aligned with the study objectives. We gathered information on socioeconomic and household characteristics, farm specifics, access to institutions, credit and extension services, household food expenditures, job details, farm wages, and other relevant factors. Table 1 provides descriptions of all covariates used in our analytical models. Prior to conducting the survey, we obtained consent from all participants and assured them of their right to withdraw at any point if they felt uncomfortable. Following established impact studies [43,44,45,46], we measured household welfare using per capita food consumption expenditure as an outcome variable. This measure was determined by querying respondents about their total annual food expenditure over the preceding 12 months, consistent with the World Bank's LSMS-ISA standard module. To analyze the gender wage gap and its impact on household welfare, we employed both parametric (Blinder–Oaxaca decomposition) and non-parametric (Propensity Score Matching, PSM) techniques. The Blinder–Oaxaca decomposition [47,48] allowed us to estimate the extent of the gender wage gap and discern how much of it could be attributed to various covariates included in our models, versus potentially discriminatory factors. Meanwhile, PSM, as recommended by Ñopo [49], offered advantages in handling heterogeneity issues without relying on parametric assumptions. The combination of these approaches provided robustness checks for our estimations, ensuring comprehensive insights into the dynamics of gender wage differentials and their implications for household welfare.
3.3. Empirical Estimation Method
3.3.1. Ordinary Least Squares (OLS) Regression Model:
The empirical analysis starts with estimating a log-linear regression model using a combined sample of female and male farmworkers. The primary objective is to discern which farmworker and job-related characteristics correlate with household welfare. The regression model is formulated as follows:
From equation 1, the dependent variable Y is the natural log of per capita food consumption expenditure, our sole measure of farmworker’ household welfare; F indicates the farmworker is female; X is a vector of control variables (household demographics, socio-economic, and farm job-level characteristics); and are parameters to be estimated; and is the error term.
3.3.2. Blinder-Oaxaca Decomposition
The Blinder-Oaxaca decomposition technique, extensively utilized in previous studies [35,50,51], is employed to investigate potential reasons behind differences in outcome variables between groups. In this study, we apply the Blinder-Oaxaca decomposition technique [47,48] to assess and explain gender disparities in household welfare among farmworkers. This method has become standard for disentangling gaps in outcome variables across different demographic groups. The initial step in the Blinder-Oaxaca decomposition involves estimating the household welfare equation (per capita food consumption) for male and female sub-samples using Equation (2):
where Y is the natural log of household welfare, i represents male (m) and female (f) farmworkers, X represent a vector of control variables, parameter indicates the average change in Y that is associated with a unit change in X, whilst controlling for the other explanatory variables in the model); and is the statistical error term; that is, it is a random variable that accounts for the failure of the model to fit the data exactly. Next, the estimated male-female gap in farmworkers’ household welfare is decomposed into explained and unexplained components as expressed in Equation (3):
where and denote average values of the dependent and explanatory variables, and are parameters from estimating equation (2) separately for male and female farmworkers, are the predicted average values of dependent variable for male and female farmworkers, which determine their household welfare and, denote the vector of estimated household welfare determinants for male and female farmworkers respectively. The portion of the average male-female difference in household welfare and farm wages that is due to differences in men's and women's measured characteristics is represented by the first set of terms after the first equal sign in equation (3); this is commonly referred to as the "explained gap" or "endowment effect" (E). The second set of terms after the first equals sign in equation (3) represents the portion of the gender gap in household welfare stemming from differences in the returns to unmeasured characteristics. This component is often referred to as the "unexplained gap" (U). The term “U” serves as an upper-bound measure of discrimination as it encompasses the effects of both discriminatory practices and any unmeasured factors that correlate with both gender and household welfare among farmworkers.
3.3.3. Propensity Score Matching (PSM):
Due to differences in the empirical distribution of the female and male farmworkers' characteristics, the Blinder-Oaxaca decomposition may be misspecified [49,52]. This misspecification, according to Frölich [52], can be addressed with propensity score matching (PSM), which allows us to identify and compare female and male farmworkers who are observationally comparable. PSM, according to Frölich [52], is highly suited for discriminating between disparities in earnings attributable to unequal human capital endowments and those due to discrimination and other unobserved factors. Meara et al. [53] and Fisher et al. [50] are two recent studies that used PSM to investigate the gender wage difference in the United States. The average difference in an outcome variable (household welfare) between a treatment group (i.e., female farmworkers) and a control group (i.e., male farmworkers) would be assessed using PSM. A binary choice model estimates the propensity score, which in our instance is the likelihood that a farmworker is female, in the first PSM step. A logit model regresses the female binary variable on the previously given explanatory factors X. Then, depending on the similarity of their propensity scores, a matching algorithm matches each female farmworker with one or more male farmworkers. After estimating the propensity for each set of farmworkers, the study would calculate the ATT using the most widely used matching approaches in the literature, such as nearest neighbour matching (NNM) and kernel-based matching (KBM), pioneered by Heckman [54]. The nearest neighbour matching compares the propensity scores of the treatment and control groups. The counterfactual for the treated units is then constructed using these matched control units. By subtracting a weighted average of outcomes from each outcome observation in the treated group from the control group, kernel matching measures treatment effects. The weighting of each control group is determined by its distance from the treatment unit. A general outline for comprehending different matching estimators is provided by [55,56,57]. Using their framework, all two matching estimators of ATT can be represented in line with Hosny [58], as follows:
where is the number of treatment cases, and r represents a set of scaled weights that measure the distance between each control unit and the target treatment unit. According to Morgan and Harding [59], the primary distinctions between these estimators lie in the number of matches assigned to each target case and how these multiple matches are weighted (if more than one match is used). The Average Treatment Effect on the Treated (ATT) is determined by averaging the differences in outcome variables (such as household welfare) within matched pairs of treated and control groups, as established by Rosenbaum and Rubin [60] and Dehejia and Wahba [56].
In the final phase of propensity score matching (PSM), differences in the outcome variable between matched treatment and control cases are estimated. The average treatment effect, which quantifies the unexplained gender gap in household welfare (measured by per capita food consumption expenditure), is derived from these differences. Additionally, we assessed the robustness of our estimations using the bounding approach proposed by Rosenbaum [61]. The core assumption of matching is selection based on observable characteristics. However, if there are unobserved variables that influence both the treatment assignment (being a female farmworker) and the outcome variable (per capita food consumption expenditure), it could introduce hidden biases that affect the estimates of matching techniques [61]. This technique by Rosenbaum relies on a sensitivity parameter Γ, which gauges the extent to which treatment assignment deviates from random. Household pairs with identical observable characteristics may differ in their odds of farm wages by a factor of Γ at most. To determine upper bounds, values of Γ are incrementally calculated until the threshold of a 10% p-value is reached, indicating sensitivity to unobserved confounders. A higher Γ signifies greater robustness of our model against biases from unobserved factors. This sensitivity analysis was conducted using the Wilcoxon signed-rank test. Despite conducting these robustness checks, it's important to note that PSM only addresses biases stemming from observed characteristics.
4. Results and Discussion
4.1. Summary of Descriptive Statistics
Table 2 presents and compares the descriptive statistics of household characteristics between male and female farmworkers using mean differences and t-tests. This analytical approach allowed us to assess differences between the treatment group (female farmworkers) and control group (male farmworkers) regarding explanatory variables, which were represented as binary variables taking values of 1 and 0, respectively. Significant differences were observed in both binary and continuous variables included in our descriptive analysis of the sampled farmworkers.
The outcome variable in our study was farmworkers’ household welfare, measured as per capita food consumption expenditure (in Naira) per month. Figure 1 compares density estimates of this outcome variable between male and female farmworkers, showing higher estimates for male farmworkers. Specifically, per capita food consumption expenditure was NGN4,233.32 higher among male farmworkers compared to female farmworkers. This difference is statistically significant (p < 0.01), indicating a gender gap in per capita food consumption expenditure among farmworkers. This finding aligns with the work of Fisher et al. [50], which highlighted gender disparities in real wages among US farmworkers. While farm wages likely contributed to the observed differences in per capita food consumption expenditure between male and female farmworkers, attributing the entire disparity to wages without controlling for other household characteristics would be misleading. Therefore, we included additional covariates that are assumed to influence the outcome variable among both male and female farmworkers. These covariates encompassed age, marital status, education, household size, farm work experience, membership in labour unions, farm salary or wages, job status, job skills, residence on the farm, average work hours per month, access to training, and involvement in various farm enterprises (such as crop farming, poultry, livestock, agro-processing, and fishery/aquaculture).
Our results revealed statistically significant differences in most of these covariates between male and female farmworkers' household characteristics. Male farmworkers tended to be older, more likely to be married, better educated, and had larger household sizes with more farm work experience compared to their female counterparts. Additionally, a higher proportion of male farmworkers were members of labour organizations, earned higher salaries/wages, and held permanent jobs with specialized skills. For instance, the average age of farmworkers across the sample was 51.27 years. Comparatively, male farmworkers had an average age of 52.65 years, while female farmworkers averaged 49.88 years, showing a significant age difference between genders at the 0.01% level. This finding suggests that both male and female farmworkers are predominantly in their middle and active years. Regarding marital status, approximately 89% of male farmworkers and 86% of female farmworkers were married, with no significant difference observed between genders. On average, male farmworkers had 14.98 years of schooling, while female farmworkers had 12.85 years, indicating a significant difference in educational attainment between the two groups. The high rate of transition from basic to higher education among male and female farmworkers underscores the value placed on education in southwestern Nigeria, supporting claims by the FAO [62] regarding Nigeria's rising literacy rates since 1991, which increased from 66.4% in 2008 to about 80% in 2015.
The results reveal that male farmworkers had an average household size of 9.86 persons, whereas their female counterparts had an average of 8.32 persons, indicating a statistically significant difference at the 1% level. Additionally, a majority of both male and female farmworkers possessed at least 15 years of farm working experience, with a significant disparity observed between the two groups (p<0.01). Furthermore, Table 2 illustrates that 93% of male farmworkers and 59% of female farmworkers in their respective sub-samples were members of labour unions, showing a significant difference between genders at the 1% level. On average, the results indicate that farm wages were ₦45,533.15 per month for men and ₦39,915.10 per month for women farmworkers, revealing a statistically significant (p<0.01) gap of ₦5,618.05 in farm wages between male and female farmworkers. Table 2 also highlights gender-based disparities in job status among farmworkers, which were statistically significant (p<0.1). Additionally, significant gender-based differences were found in several job characteristics. For instance, 54% of male farmworkers held permanent positions at their farms compared to only 42% of female farmworkers, indicating that temporary or casual labour was more prevalent among female farmworkers than among their male counterparts. This reliance on casual labour among female farmworkers contradicts International Labour Law standards. Moreover, female farmworkers exhibited lower job skills, with approximately 29% having lower skills compared to 43% of male farmworkers. A substantial majority (94%) of male farmworkers had received training in their respective farming enterprises, whereas this figure was over 65% for female farmworkers. On average, male farmworkers worked 147.95 hours per month, slightly more than the 135.48 hours per month worked by female farmworkers. Furthermore, male farmworkers were slightly more involved in crop farming activities (35%) compared to female farmworkers (28%), reflecting a significant difference at the 0.05 level. In contrast, female farmworkers were less engaged in poultry (21%), livestock (26%), and fishery/aquaculture (14%) enterprises compared to their male counterparts. However, they were more involved in agro-processing farms (37%) compared to male farmworkers.
4.2. Determinants of Farmworkers Household Welfare
The results from the logistic regression analysis on factors influencing farmworkers’ household welfare are presented in Table 2. The logit regression model estimates demonstrate that it is a robust predictor of farmworkers' welfare, as evidenced by the results of two alternative tests assessing model fit: the Hosmer and Lemeshow (H-L) test and the chi-square test. The H-L goodness of fit test yielded a statistic of 386.04, which was non-significant (p = 0.279), indicating that the model fits well. It is widely accepted that for logit models, a non-significant H-L statistic suggests good model fit (Mapila et al., 2012; Ogunniyi et al., 2017). On the other hand, the chi-square statistic was 576.79 and statistically significant. This implies that all the predictors included in the model jointly contribute to predicting farmworkers’ household welfare. Our findings underscore that farmworkers’ household welfare is significantly associated with both socioeconomic factors and characteristics of farm jobs.
We identified several key factors that positively influence farmworkers' welfare, including years of schooling, household size, membership in a labour union, farm salary/wages, job status, job skill, average work hours, access to training, and involvement in crop farming and agro-processing activities. Education, measured by years of schooling, was found to have a positive and significant impact on household welfare. The marginal effect indicates that an increase in years of schooling by one unit leads to a 0.4% increase in the likelihood of improving farmworkers' household welfare. This could be attributed to educated farmworkers potentially occupying higher positions or managerial roles within their firms, earning higher salaries/wages that contribute to improved welfare. Similarly, household size was found to positively affect farmworkers' household welfare significantly. Farmworkers with larger household sizes, or more members in their families, have a 9.2% higher likelihood of increasing their per capita food consumption expenditure. Belonging to a labour union positively and significantly impacts household welfare. This suggests that farmworkers affiliated with labour unions are more likely to benefit from improved salary and wage packages negotiated by the union. Labor organizations focus primarily on enhancing the welfare and advancement opportunities for their members.

Table 3.
Logistic regression of the factors influencing farmworkers’ household welfare.
| Variable | Logistic regression | Marginal effects | ||
|---|---|---|---|---|
| Coefficient | Std. error | dy/dx | Std. error | |
| Age of farmworker (years) | -0.047 | 0.015 | 0.029 | 0.006 |
| Marital status (1=married, 0=otherwise) | 1.357 | 0.021 | 0.416 | 0.234 |
| Education (Years of schooling) | 0.205*** | 0.010 | 0.004*** | 0.011 |
| Household size (number) | 0.319*** | 0.044 | 0.092*** | 0.028 |
| Farmwork experience (years) | 0.019 | 0.023 | 0.004 | 0.003 |
| Membership of labour union (1=yes, 0=otherwise) | 1.028** | 0.359 | 0.362** | 0.001 |
| Farm salary/wage (₦/month) | 2.639* | 0.461 | 0.145* | 0.049 |
| Job status (1=permanent, 0=otherwise) | 0.207** | 0.117 | 0.017** | 0.034 |
| Job skill (1=skilled, 0=otherwise) | 0.185* | 0.012 | 0.084* | 0.422 |
| Lives on farm (1=yes, 0=otherwise) | 0.421 | 0.145 | 0.193 | 0.056 |
| Average work hour (hour/month) | 1.402*** | 0.253 | 0.381*** | 0.083 |
| Access to training (1=yes, 0=otherwise) | 1.109*** | 0.411 | 0.335*** | 0.136 |
| Crop farming (1=yes, 0=otherwise) | 0.162*** | 0.524 | 0.198*** | 0.251 |
| Poultry (1=yes, 0=otherwise) | 0.028 | 0.273 | 0.025 | 0.018 |
| Livestock (1=yes, 0=otherwise) | 0.584 | 0.362 | 0.147 | 0.063 |
| Agro-processing (1=yes, 0=otherwise) | 0.241*** | 0.117 | 0.192*** | 0.034 |
| Fishery/aquaculture (1=yes, 0=otherwise) | 0.012 | 0.024 | 0.006 | 0.007 |
| Log likelihood = -76.85303; Pseudo R² = 0.8412; LR chi2 (17) = 576.79***; Observation = 720 | ||||
Note: *, **, ***represent statistically significant at 10, 5 and 1%, respectively. Robust standard errors are reported in parentheses. Source: Author’s computation, 2023.
Farm salaries and wages demonstrated a positive and significant correlation with household welfare among farmworkers. This indicates that higher farm salaries and wages are likely to lead to increase per capita food consumption within farmworker households. According to the marginal effects, there is a 14.5 percent probability that per capita food consumption (welfare) will rise with an increase in farm salary or wages. This aligns with expectations that higher farm income is a crucial factor influencing household food expenditure. Additionally, holding a permanent job showed a positive and significant relationship with farmworker welfare. Being a permanent employee in an agricultural firm allows farmworkers to negotiate for improved salary and wage packages from their employers. This opportunity for negotiation can potentially lead to enhanced welfare for the workers.
The coefficient for job skill showed a significant positive impact on enhancing the likelihood of farmworkers receiving improved welfare packages from their employers. Having adequate farm skills makes a farmworker a valuable asset to the company, thereby increasing the probability of receiving enhanced welfare benefits. Moreover, our study revealed a positive and significant association between average work hours and farmworkers' household welfare. Specifically, farmworkers were 38.1 percent more likely to enhance their welfare if they worked additional hours to earn higher wages. These findings underscore the importance of average work hours in influencing employers to provide improved salary and wage packages to workers. Likewise, access to training was identified as significantly enhancing the probability of farmworkers improving their household welfare. Access to training equips farmworkers with skills and knowledge in their respective fields, opening up opportunities for advancement. This finding aligns with Auta et al. [65], who noted that training in agricultural practices, small business management, and leadership is crucial for rural youth to engage effectively in agriculture in Nigeria.
4.3. Blinder-Oaxaca Decomposition
Table 4 presents the results of the Blinder-Oaxaca decomposition, which estimated the gender gap in household welfare (measured by per capita food consumption expenditure) and dissected it into its explained and unexplained components. The findings reveal that female farmworkers had an average per capita food consumption expenditure of ₦11,486.51, which was lower compared to their male counterparts, indicating an unadjusted gender gap. The explained portion of the gender gap accounts for 9.81%, indicating that most of the differences in household welfare between male and female farmworkers can be attributed to the variables included in our model. These variables represent the measurable characteristics and endowments that vary between genders.
On the other hand, the unexplained gender gap shows that female farmworkers had ₦10,359.85 less in monthly per capita food consumption expenditure compared to male farmworkers. This unexplained component suggests that factors not accounted for in our model, possibly including discrimination or unmeasured variables, contribute to the disparity in household welfare. These results align with previous findings by Goldin [66], who suggested that unexplained gender gaps often stem from factors such as women's preferences for job flexibility and other subtle forms of discrimination in the workplace.
4.4. Contributions of Individual Covariates to Explained Gender Gap in Farmworkers’ Household Welfare
Table 5 presents the contributions of each covariate included in the model to the explained portion of the gender gap in household welfare (per capita food consumption expenditure) among farmworkers. Positive percentage values indicate covariates that contribute to increasing gender inequality in per capita food consumption expenditure, while negative values suggest the opposite effect. Our findings highlight that eleven covariates play significant roles in explaining the gender gap in household welfare between male and female farmworkers. These covariates span socioeconomic factors such as household size, farm work experience, membership in labour unions, and farm salaries/wages, as well as job characteristics including job status, residency on the farm, average monthly work hours, and access to on-the-job training.
Specifically, our results show that 65% of the explained gender gap in household welfare can be attributed to differences such as female farmworkers having smaller household sizes, less farm work experience, fewer memberships in labour unions, and lower salaries/wages compared to their male counterparts. Additionally, female farmworkers tend to work fewer hours and are less involved in various farming enterprises compared to male farmworkers. These factors collectively contribute to the observed disparities in household welfare between male and female farmworkers.
Table 2 illustrates that, on average, female farmworkers have 1.54 fewer household members compared to male farmworkers. Furthermore, the results in Table 5 indicate that household size among farmworkers contributes approximately 6.4% to the explained gender gap in household welfare. Additionally, approximately 4.0% of the explained gender gap in household welfare is attributed to female farmworkers having less experience compared to their male counterparts.
We also observed that a smaller proportion of female farmworkers hold membership in labour unions compared to male farmworkers, which explains about 1% of the explained gender gap in household welfare. Similarly, female farmworkers earn lower salaries/wages than male farmworkers, accounting for a significant portion (75.8%) of the explained gender gap in farmworkers’ per capita food consumption expenditure. Moreover, the predominance of female farmworkers engaged in casual rather than permanent farm work contributes approximately 2.8% to the explained gender gap in household welfare.
Living on the farm is responsible for about 2.2% of the explained gender differences in per capita food consumption expenditure between female and male farmworkers. Results from Table 5 indicate that, on average, female farmworkers work 12.47 hours less than their male counterparts, and this difference in work hours directly contributes approximately 8% to the explained gender gap in household welfare. These findings are consistent with Cha and Weeden [67], who suggest that differences in working hours between men and women, coupled with differential returns to overwork versus full-time work, are significant factors contributing to persistent male-female wage differentials. Additionally, less access to on-the-job training among female farmworkers explains approximately 3% of the explained gender differences in the outcome variable (household welfare). Recent studies [50,68,69] similarly highlight that demographic, socioeconomic, and physical characteristics strongly influence the gender gap in outcome variables.
4.5. Influence of Farm Wage on Household Welfare: Propensity Score Matching
In our study, we conducted several diagnostic tests before estimating how farm wages influence farmworkers’ household welfare using the propensity score matching (PSM) estimator. This approach focuses solely on observable characteristics to ensure the quality of the matched pairs and the adequacy of the PSM model specification, while addressing the challenges of heterogeneity associated with parametric methods like the Blinder-Oaxaca method. Additionally, we assessed overall covariate balance and overlap across the common support range. Visual inspection revealed substantial overlap in the distribution of propensity scores between the treatment group (female farmworkers) and the control group (male farmworkers). This overlap indicates that there are observations in the control group that can effectively match with observations in the treatment group.
Figure 2 displays the distribution of matching propensity scores and the common support region, illustrating female farmworkers in the upper portion and male farmworkers in the lower portion. By effectively addressing selection bias stemming from observed covariates and overcoming challenges related to heterogeneity, our study can now confidently attribute any variations in farmworkers’ household welfare (measured by per capita food consumption expenditure) to gender differences.
Further inspection was conducted to assess the quality of covariate balancing achieved by the matching technique, ensuring adherence to the common support condition. This verification was essential to confirm that both the treatment (female farmworkers) and control (male farmworkers) groups exhibited similar characteristics following the estimation of propensity scores. Table 6 presents the results of our covariate balancing checks for all included variables in the estimation models. Our findings indicate that none of the covariates remained statistically significant after matching, indicating satisfactory quality of matching across all variables used in the analysis. This corroborates with previous research by Bello et al. [70], which similarly found no statistically significant covariates post-matching, suggesting similarity in covariate qualities between the treatment and control groups.
Moreover, following conditioning on the propensity scores using two algorithms—nearest neighbour matching (NNM) and kernel-based matching (KBM)—we conducted tests to assess the balance of measured covariates between treatment and matched control groups based on three indices: pseudo-R², p-values of LR test, and mean standard bias. The results of these balance tests are summarized in Table 7. Post-matching with NNM and KBM, the pseudo-R² decreased substantially from 77.4% before matching to 2.3% and 4.5%, respectively. This indicates that our matching approach effectively minimized systematic differences or biases in the distribution of covariates between the treatment and matched control groups.
Moreover, the LR test for the joint significance of the covariates indicates significant differences in measured covariates between unmatched samples but not among matched samples. Consequently, we do not reject the hypothesis that the distributions of covariates are approximately the same after matching between the treatment and control groups. This suggests that there is no substantial difference in the distribution of covariates between matched samples of the treatment and control groups. Additionally, our findings reveal that the mean standard deviation markedly decreased from approximately 91.2% with NNM to 92.9% with KBM, while the mean bias across all covariates reduced from 298.20 to 26.30 and 21.19, respectively. Consistent outcomes were observed across both matching algorithms, affirming the satisfactory quality of matching, which supports the assumption of conditional independence and underscores the importance of proper model specification. This assumption posits that, after accounting for observable covariates, the assignment of farmworkers to farm salaries/wages is effectively randomized, ensuring that potential outcomes are independent of gender status.
The results presented in Table 8 detail the average treatment effects estimated using the PSM models, employing two distinct matching algorithms: nearest neighbour matching (NNM) and kernel-based matching (KBM). According to the NN matching algorithm, the causal impact of farm wages on household welfare (per capita food consumption expenditure) for male and female farmworkers is statistically significant and negative, amounting to ₦-3,974.73. This indicates that, on average, female farmworkers experience a decrease in per capita food consumption expenditure compared to their male counterparts. Specifically, the Average Treatment Effect on the Treated (ATT) among the sampled farmworkers is estimated at ₦-3,974.73, illustrating a notable disparity in per capita food consumption expenditure between male and female farmworkers. For instance, randomly selecting a female farmworker would result in an Average Treatment Effect (ATE) of ₦-8,423.92, indicating a reduction in per capita food consumption expenditure by ₦8,423.92.
In contrast, results from the KB matching algorithm also show a negative and statistically significant effect on the welfare outcome variable. The ATT for female farmworkers is ₦-16,596.99, implying a substantial reduction in per capita food consumption expenditure due to farm wages. This finding underscores a significant disparity in per capita food consumption expenditure between female (treatment) and male (control) farmworkers. Moreover, the ATE of ₦6,640.69 suggests a noteworthy positive impact on per capita food consumption expenditure if a female farmworker is chosen at random. Overall, the estimated effects of farm wages on gender disparities in household welfare exhibit consistency across different matching specifications, highlighting robust findings across alternative methodological approaches.
Therefore, in the absence of observable selection bias, it can be inferred that farm wages significantly contribute to narrowing the gender gap in household welfare (per capita food consumption expenditure) between male and female farmworkers. We conducted robustness tests on the PSM model results by estimating the Rosenbaum bounds {71], the results of which are presented in Table 9. The upper bound results, along with their corresponding p-values, were computed to assess the sensitivity of treatment effects that differ significantly from zero. The Rosenbaum bounds were calculated across all PSM specifications to determine the range of Γ values. The smallest value of Γ ranged from 1.20 to 1.25, observed with nearest neighbour algorithms, while the largest value ranged from 1.45 to 1.50, observed with kernel matching algorithms. For instance, in the context of assessing the impact of farm wages on farmworkers’ household welfare using the Nearest Neighbour PSM approach, the sensitivity analysis suggests that at a Γ value of 1.25, the causal effect of farm wages warrants critical consideration among farmworkers. This indicates that if male or female farmworkers with similar observable characteristics differ in their odds of farm wages by up to 30%, the significance of farm wages on their welfare outcomes may be questionable. This threshold of Γ = 1.25 is relatively low compared to the standard threshold of 60% commonly used in social sciences. Therefore, these findings suggest that the influence of farm wages in reducing the gender gap in farmworkers’ household welfare may be sensitive to unobservable or hidden biases at certain levels.
5. Conclusion
Using both parametric (Blinder-Oaxaca decomposition) and non-parametric (Propensity Score Matching, PSM) models, this study investigates whether farm wages have contributed to narrowing the gender gap in household welfare, measured by per capita food consumption expenditure, among farmworkers in Nigeria. The data were collected from a cross-sectional survey of farmworkers conducted in the Southwest region of the country. The findings highlight several factors positively and significantly associated with per capita food consumption expenditure for both male and female farmworkers. These factors include education (measured by years of schooling), household size, membership of labour unions, farm salary/wages, job status, job skill, average work hours, access to training, and engagement in crop farming and agro-processing activities.
In the parametric model, the results reveal that female farmworkers had ₦11,486.51 less in per capita food consumption expenditure compared to their male counterparts, indicating an unadjusted gender gap. The explained portion of this unadjusted gender gap was 9.81%, with socioeconomic, job-related, and enterprise characteristics included in the model explaining most of the differences in household welfare (per capita food consumption expenditure) between female and male farmworkers. Overall, the study underscores the importance of these covariates in understanding and potentially addressing gender disparities in household welfare outcomes among farmworkers in Nigeria. The findings underscore the significant role of farm wages in narrowing the gender gap in household welfare among farmworkers, as revealed across two different matching algorithms employed in the study. Specifically, farm wages were associated with an increase in per capita food consumption expenditure for female farmworkers by ₦6,640.69. This outcome highlights the potential of higher farm salaries and wages to enhance livelihood outcomes, underscoring the necessity of improving compensation for farmworkers. Moreover, the study emphasizes the substantial contribution of individual characteristics—such as household size, farm work experience, job skills, average work hours, and access to training—to explaining the gender gap. Enhancing these identified variables could effectively reduce gender disparities in agricultural employment, ultimately leading to improved welfare for farmworkers.
The study also investigated how the impact of farm wages on household welfare varies across different levels of specific household characteristics. Using Ordinary Least Squares (OLS) regression, the research demonstrated that the effects of farm wages differ significantly depending on certain household attributes. Factors such as the education level of farmworkers, household size, membership in a labour union, and farm salary/wage were found to exert statistically significant effects at various points in the distribution. This indicates the presence of heterogeneous effects based on household characteristics, underscoring the necessity for targeted interventions tailored to specific groups of farmworkers. However, a key limitation of this study is its reliance on a sample that represents only one out of six regions in Nigeria, which may not fully capture the diversity of the country's farmworker population. As a result, the findings may not be generalizable to all farmworkers across Nigeria. Therefore, it is recommended that this study be replicated in other regions of the country to validate and extend its findings.
Author Contributions
Conceptualization, A.K.D.; A.A.K; and O.W.K.; methodology, A.K.D.; A.A.K; O.W.K.; L.K.O.; T.A.D.; H.O.E.; L.L.A.; and S.A.A.; software, A.K.D.; A.A.K; and O.W.K.; validation, A.K.D.; A.A.K; O.W.K.; L.K.O.; T.A.D.; H.O.E.; L.L.A.; and S.A.A.; formal analysis, A.K.D.; and A.A.K; investigation, A.K.D.; A.A.K; O.W.K.; L.K.O.; T.A.D.; H.O.E.; L.L.A.; and S.A.A.; resources, A.K.D.; A.A.K; O.W.K.; L.K.O.; T.A.D.; H.O.E.; L.L.A.; and S.A.A.; data curation, A.K.D.; A.A.K; O.W.K.; L.K.O.; T.A.D.; H.O.E.; L.L.A.; and S.A.A.; writing—original draft preparation, A.K.D.; A.A.K; O.W.K.; L.K.O.; T.A.D.; H.O.E.; L.L.A.; and S.A.A.; writing—review and editing, A.K.D.; A.A.K; O.W.K.; L.K.O.; T.A.D.; H.O.E.; L.L.A.; and S.A.A.; visualization, A.K.D.; A.A.K; O.W.K.; L.K.O.; T.A.D.; H.O.E.; L.L.A.; and S.A.A.; supervision, A.K.D.; A.A.K; O.W.K.; L.K.O.; T.A.D.; H.O.E.; L.L.A.; and S.A.A.; project administration, A.K.D.; A.A.K; O.W.K.; L.K.O.; T.A.D.; H.O.E.; L.L.A.; and S.A.A.; funding acquisition, A.K.D. and A.A.K. All authors have read and agreed to the published version of the manuscript.
Funding
Not applicable.
Institutional Review Board Statement
Not applicable.
Informed Consent Statement
Not applicable.
Data Availability Statement
The data presented in this study are available on request from Authors.
Acknowledgments
The authors are grateful to the State Ministry of Agriculture and Rural Development for granting permission to use their Extension agents as enumerators for data collection. We also recognize the contribution of the enumerators and agricultural extension agents in data collection. We thank the farmworkers for providing very useful data and information during the survey, without which this study could not have been accomplished.
Conflicts of Interest
The authors declare no conflicts of interest.
References
- Food and Agriculture Organization of the United Nations (FAO). The state of food and agriculture 2010–2011: Women in agriculture: Closing the gender gap for development Rome. Food Policy, 44, 272–284, 2011.
- World Bank. Levelling the playing field: Improving opportunities for women farmers in Africa. Washington: World Bank Group, 2014.
- Federal Ministry of Agriculture and Rural Development. National Gender Policy in Agriculture. Abuja, Nigeria: FMARD, 2019. Available at https://fmard.gov.ng/nationalgender-policy-in-agriculture/. (accessed on 15 October 2023).
- National Bureau of Statistics and the World Bank (2019). LSMS Integrated Surveys on Agriculture: Nigeria General Household Survey, Panel (Wave 4). Abuja, Nigeria: National Bureau of Statistics, 2019. Available at https://www.nigerianstat.gov.ng/pdfuploads/LSMS_Integrated_Panel_Survey_Report.pdf/. (accessed on 12 October 2023).
- FAO, IFAD, UNICEF, WFP and WHO. (2019). The state of food security and nutrition in the world 2019. Safeguarding against economic slowdowns and downturns. Rome, FAO. http://www.fao.org/3/ca5162en/ca5162en.pdf. (accessed on 10 October 2023).
- International Labour Organization, and ILO Regional Office for Africa. Report on Employment in Africa (Re-Africa): Tackling the Youth Employment Challenge. Geneva: ILO, 2022.
- World Economic Forum. The Global Gender Gap Report 2021. World Economic Forum, Geneva Available at https://www.weforum.org/reports/the-global-gender-gap-report-2021.
- Danquah, M.; Iddrisu, A.M.; Boakye, E.O.; Owusu, S. Do gender wage differences within households influence women's empowerment and welfare? Evidence from Ghana. J. Econ. Behav. Organ. 2021, 188, 916–932. [Google Scholar] [CrossRef]
- ILO. Global Wage Report 2018/19: What Lies Behind Gender Pay Gaps. International Labour Office (ILO), Geneva, 2018. Available at: https://www.ilo.org/wcmsp5/groups/public/—dgreports/—dcomm/—publ/documents/publication/wcms_650553.pdf (accessed February 2021).
- World Economic Forum. The Global Gender Gap Report 2017. World Economic Forum, Geneva Available at https://www.weforum.org/reports/the-global-gender-gap-report-2017.
- UN Women. Annual Report 2015–2016. UN Women, New York, 2016. Available at https://www.unwomen.org/en/digital-library/publications/2016/6/ annual-report.
- Mukasa A., N. and Salami, A. O. Gender Productivity Differentials Among Smallholder Farmers In Africa: A Cross-Country Comparison. Working Paper Series No. 231. Abidjan, Cote d’Ivoire: African Development Bank, 2015.
- Oseni, G. , Goldstein, M., and Utah, A. Gender Dimensions in Nigerian Agriculture. African Region Gender Practice Policy Brief, 6, 1-4. Washington, DC: The World Bank, 2013.
- Blau, F.D.; Kahn, L.M. The U.S. Gender Pay Gap in the 1990S: Slowing Convergence. ILR Rev. 2006, 60, 45–66. [Google Scholar] [CrossRef]
- World Bank. World Development Report 2012: Gender Equality and Development. World Bank, Washington, DC, 2012. [CrossRef]
- Barro, R.J.; Lee, J.-W. Sources of economic growth. Carnegie-Rochester Conf. Ser. Public Policy 1994, 40, 1–46. [Google Scholar] [CrossRef]
- Barro, R.J. , Sala-i-Martin, X. Economic Growth. McGraw-Hill, New York, 1995.
- Forbes, K.J. A Reassessment of the Relationship Between Inequality and Growth. Am. Econ. Rev. 2000, 90, 869–887. [Google Scholar] [CrossRef]
- Seguino, S. Gender Inequality and Economic Growth: A Cross-Country Analysis. World Dev. 2000, 28, 1211–1230. [Google Scholar] [CrossRef]
- Klasen, S. Low Schooling for Girls, Slower Growth for All? Cross-Country Evidence on the Effect of Gender Inequality in Education on Economic Development. World Bank Econ. Rev. 2002, 16, 345–373. [Google Scholar] [CrossRef]
- Knowles, S.; Lorgelly, P.K.; Owen, P.D. Are educational gender gaps a brake on economic development? Some cross-country empirical evidence. Oxf. Econ. Pap. 2002, 54, 118–149. [Google Scholar] [CrossRef]
- Angel-Urdinola, D.F.; Wodon, Q. The Gender Wage Gap and Poverty in Colombia. Labour 2006, 20, 721–739. [Google Scholar] [CrossRef]
- Aizer, A. The Gender Wage Gap and Domestic Violence. Am. Econ. Rev. 2010, 100, 1847–1859. [Google Scholar] [CrossRef]
- Doss, C. The Effects of Intrahousehold Property Ownership on Expenditure Patterns in Ghana. J. Afr. Econ. 2006, 15, 149–180. [Google Scholar] [CrossRef]
- Doepke, M.; Tertilt, M. Does Female Empowerment Promote Economic Development? The World Bank: Washington, DC, United States, 2011. [Google Scholar]
- Cuberes, D.; Teignier, M. Aggregate Effects of Gender Gaps in the Labor Market: A Quantitative Estimate. J. Hum. Cap. 2016, 10, 1–32. [Google Scholar] [CrossRef]
- Annan, J.; Donald, A.; Goldstein, M.; Martinez, P.G.; Koolwal, G. Taking power: Women’s empowerment and household Well-being in Sub-Saharan Africa. World Dev. 2020, 140, 105292. [Google Scholar] [CrossRef]
- Eastough, K.; Miller, P.W. The Gender Wage Gap in Paid- and Self-Employment in Australia. Aust. Econ. Pap. 2004, 43, 257–276. [Google Scholar] [CrossRef]
- Ilkkaracan, I.; Selim, R. The Gender Wage Gap in the Turkish Labor Market. Labour 2007, 21, 563–593. [Google Scholar] [CrossRef]
- Casale, D.; Posel, D. Unions and the Gender Wage Gap in South Africa. J. Afr. Econ. 2010, 20, 27–59. [Google Scholar] [CrossRef]
- Christofides, L.N.; Polycarpou, A.; Vrachimis, K. Gender wage gaps, ‘sticky floors’ and ‘glass ceilings’ in Europe. Labour Econ. 2013, 21, 86–102. [Google Scholar] [CrossRef]
- Langdon, D.L. , Klomegah, R.. Gender wage gap and its associated factors: an examination of traditional gender ideology, education, and occupation. Int. Rev. Mod. Sociol. 2013, 39 (2), 173–203. https://www.jstor.org/stable/43496468.
- Bhorat, H.; Goga, S. The Gender Wage Gap in Post-Apartheid South Africa: A Re-examination. J. Afr. Econ. 2013, 22, 827–848. [Google Scholar] [CrossRef]
- Cardoso, A.R.; Guimarães, P.; Portugal, P. What drives the gender wage gap? A look at the role of firm and job-title heterogeneity. Oxf. Econ. Pap. 2016, 68, 506–524. [Google Scholar] [CrossRef]
- Blau, F.D.; Kahn, L.M. The Gender Wage Gap: Extent, Trends, and Explanations. J. Econ. Lit. 2017, 55, 789–865. [Google Scholar] [CrossRef]
- Akter, S.; Rutsaert, P.; Luis, J.; Htwe, N.M.; San, S.S.; Raharjo, B.; Pustika, A. Women’s empowerment and gender equity in agriculture: A different perspective from Southeast Asia. Food Policy 2017, 69, 270–279. [Google Scholar] [CrossRef]
- Winther, T.; Matinga, M.N.; Ulsrud, K.; Standal, K. Women’s empowerment through electricity access: scoping study and proposal for a framework of analysis. J. Dev. Eff. 2017, 9, 389–417. [Google Scholar] [CrossRef]
- Fapohunda, T.M. The gender pay gap in Nigeria: Causes and remedies Mediterranean Journal of Social Sciences 4(2) Rome: MCSER–CEMAS–Sapienza University of Rome, 2013. [CrossRef]
- UNDP. Human development report 1995. New York: Oxford University Press, 2009.
- Ekerebi, E; Adeola, O. Estimation of the difference in agricultural yield between male and female farmers in Nigeria Feed the Future Innovation Lab for Food Security Policy Research Brief 28, 2017. Available at https://www.nigeriaagriculturalpolicy net/2017/10/03/.
- Klasen, S.; Le, T.T.N.; Pieters, J.; Silva, M.S. What Drives Female Labour Force Participation? Comparable Micro-level Evidence from Eight Developing and Emerging Economies. J. Dev. Stud. 2020, 57, 417–442. [Google Scholar] [CrossRef]
- Heath, Rachel, and Seema Jayachandran. The causes and consequences of increased female education and labor force participation in developing countries. In The Oxford Handbook of Women and the Economy. Oxford: Oxford University Press, 2017, pp. 345–67.
- Wossen, T.; Abdoulaye, T.; Alene, A.; Haile, M.G.; Feleke, S.; Olanrewaju, A.; Manyong, V. Impacts of extension access and cooperative membership on technology adoption and household welfare. J. Rural. Stud. 2017, 54, 223–233. [Google Scholar] [CrossRef]
- Abdoulaye, T.; Wossen, T.; Awotide, B. Impacts of improved maize varieties in Nigeria: ex-post assessment of productivity and welfare outcomes. Food Secur. 2018, 10, 369–379. [Google Scholar] [CrossRef]
- Ahimbisibwe, B.P.; Morton, J.F.; Feleke, S.; Alene, A.; Abdoulaye, T.; Wellard, K.; Mungatana, E.; Bua, A.; Asfaw, S.; Manyong, V. Household welfare impacts of an agricultural innovation platform in Uganda. Food Energy Secur. 2020, 9, e225. [Google Scholar] [CrossRef]
- Oyetunde-Usman, Z.; Ogunpaimo, O.R.; Olagunju, K.O.; Ambali, O.I.; Ashagidigbi, W.M. Welfare Impact of Organic Fertilizer Adoption: Empirical Evidence From Nigeria. Front. Sustain. Food Syst. 2021, 5, 691667. [Google Scholar] [CrossRef]
- Blinder, A.S. Wage Discrimination: Reduced Form and Structural Estimates. J. Hum. Resour. 1973, 8, 436–455. [Google Scholar] [CrossRef]
- Oaxaca, R. Male–female wage differentials in urban labor markets International Economic Review, 1973, 14(3): 693–709.
- opo, H. Matching as a tool to decompose wage gaps: The Review of Economics and Statistics, 2008, 90(2): 290–299.
- Fisher, M.; Lewin, P.A.; Pilgeram, R. Farmworkers and the gender wage gap: An empirical analysis of wage inequality in US agriculture. Appl. Econ. Perspect. Policy 2021, 44, 2145–2163. [Google Scholar] [CrossRef]
- Daudu, A.K.; Kareem, O.W.; Olatinwo, L.K.; Shuaib, S.B.; Abdulrahman, A.I. Does Gender Wage Gap Exist among Farm Workers in Nigeria? Evidence from Decomposition-Matching Analysis. Acta Univ. Sapientiae, Econ. Bus. 2023, 11, 115–137. [Google Scholar] [CrossRef]
- Frölich, M. Propensity score matching without conditional independence assumption—with an application to the gender wage gap in the United Kingdom. Econ. J. 2007, 10, 359–407. [Google Scholar] [CrossRef]
- Meara, K.; Pastore, F.; Webster, A. The gender pay gap in the USA: a matching study. J. Popul. Econ. 2019, 33, 271–305. [Google Scholar] [CrossRef]
- Heckman, J. Instrumental variables: A study of implicit behavioural assumptions used in making program evaluations J. Hum. Resour. 1997, 32: 441–462.
- Heckman, J.; Ichimura, H.; Smith, J.; Todd, P. Characterizing selection bias using experimental data Econometrica, 1998, 66: 1017–1098.
- Dehejia, R.H.; Wahba, S. Propensity Score-Matching Methods for Nonexperimental Causal Studies. Rev. Econ. Stat. 2002, 84, 151–161. [Google Scholar] [CrossRef]
- Frölich, M. Finite-sample properties of Propensity Score Matching and weighting estimators Rev. Econ. Stat. 2004, 86: 77–90.
- Hosny, A. S. Theories of economic integration: A survey of the economic and political literature Int. J. Econ. Manag. Soc. Sci. 2013, 2: 133–155.
- Morgan, S.L. , and Harding, D. J. Matching estimators of causal effects: Prospects and pitfalls in theory and practice. Sociol. Methods Res., 2006, 35, 3–60. [Google Scholar]
- Rosenbaum, R. P.; Rubin, B.D. Constructing a control group using multivariate matched sampling methods that incorporate the propensity score. Am. Stat. 1985, 39: 33–38.
- Rosenbaum, P. Observational Studies, Springer Series in Statistics, Springer, 2002.
- FAO Regional Office for Africa. Africa African Youth in Agriculture, Natural Resources and Rural Development. Nat. Faune 2013, 38, 1–106. Available online: http://www.fao.org/3/as290e/as290e.pdf (accessed on 12 May 2022).
- Mapila, M.; Njuki, J.; Delve, R.J.; Zingore, S.; Matibini, J. Determinants of fertiliser use by smallholder maize farmers in the Chinyanja Triangle in Malawi, Mozambique and Zambia. Agrekon 2012, 51, 21–41. [Google Scholar] [CrossRef]
- Ogunniyi, A.; Oluseyi, O.K.; Adeyemi, O.; Kabir, S.K.; Philips, F. Scaling Up Agricultural Innovation for Inclusive Livelihood and Productivity Outcomes in Sub-Saharan Africa: The Case of Nigeria. Afr. Dev. Rev. 2017, 29, 121–134. [Google Scholar] [CrossRef]
- Auta, S.J.; Abdullahi, Y.M.; Nasiru, M. Rural Youths’ Participation in Agriculture: Prospects, Challenges and the Implications for Policy in Nigeria. J. Agric. Educ. Ext., 2010, 16, 297–307. [Google Scholar] [CrossRef]
- Goldin, C. A Grand Gender Convergence: Its Last Chapter. Am. Econ. Rev. 2014, 104, 1091–1119. [Google Scholar] [CrossRef]
- Cha, Y.; Weeden, K.A. Overwork and the Slow Convergence in the Gender Gap in Wages. Am. Sociol. Rev. 2014, 79, 457–484. [Google Scholar] [CrossRef]
- Kiefer, K.; Heileman, M.; Pett, T.L. Does gender still matter? An examination of small business performance. Small Bus. Econ. 2020, 58, 141–167. [Google Scholar] [CrossRef]
- Fairlie, R.W.; Robb, A.M. Gender differences in business performance: evidence from the Characteristics of Business Owners survey. Small Bus. Econ. 2009, 33, 375–395. [Google Scholar] [CrossRef]
- Bello, L.O.; Baiyegunhi, L.J.S.; Danso-Abbeam, G. Productivity impact of improved rice varieties’ adoption: case of smallholder rice farmers in Nigeria. Econ. Innov. New Technol. 2020, 30, 750–766. [Google Scholar] [CrossRef]
- Becker, S.O.; Caliendo, M. Sensitivity Analysis for Average Treatment Effects. Stata Journal 2007, 7, 71–83. [Google Scholar] [CrossRef]
Figure 1.
Kernel density estimate of the log of per capital food consumption expenditure for treatment and control among farmworkers
Figure 1.
Kernel density estimate of the log of per capital food consumption expenditure for treatment and control among farmworkers
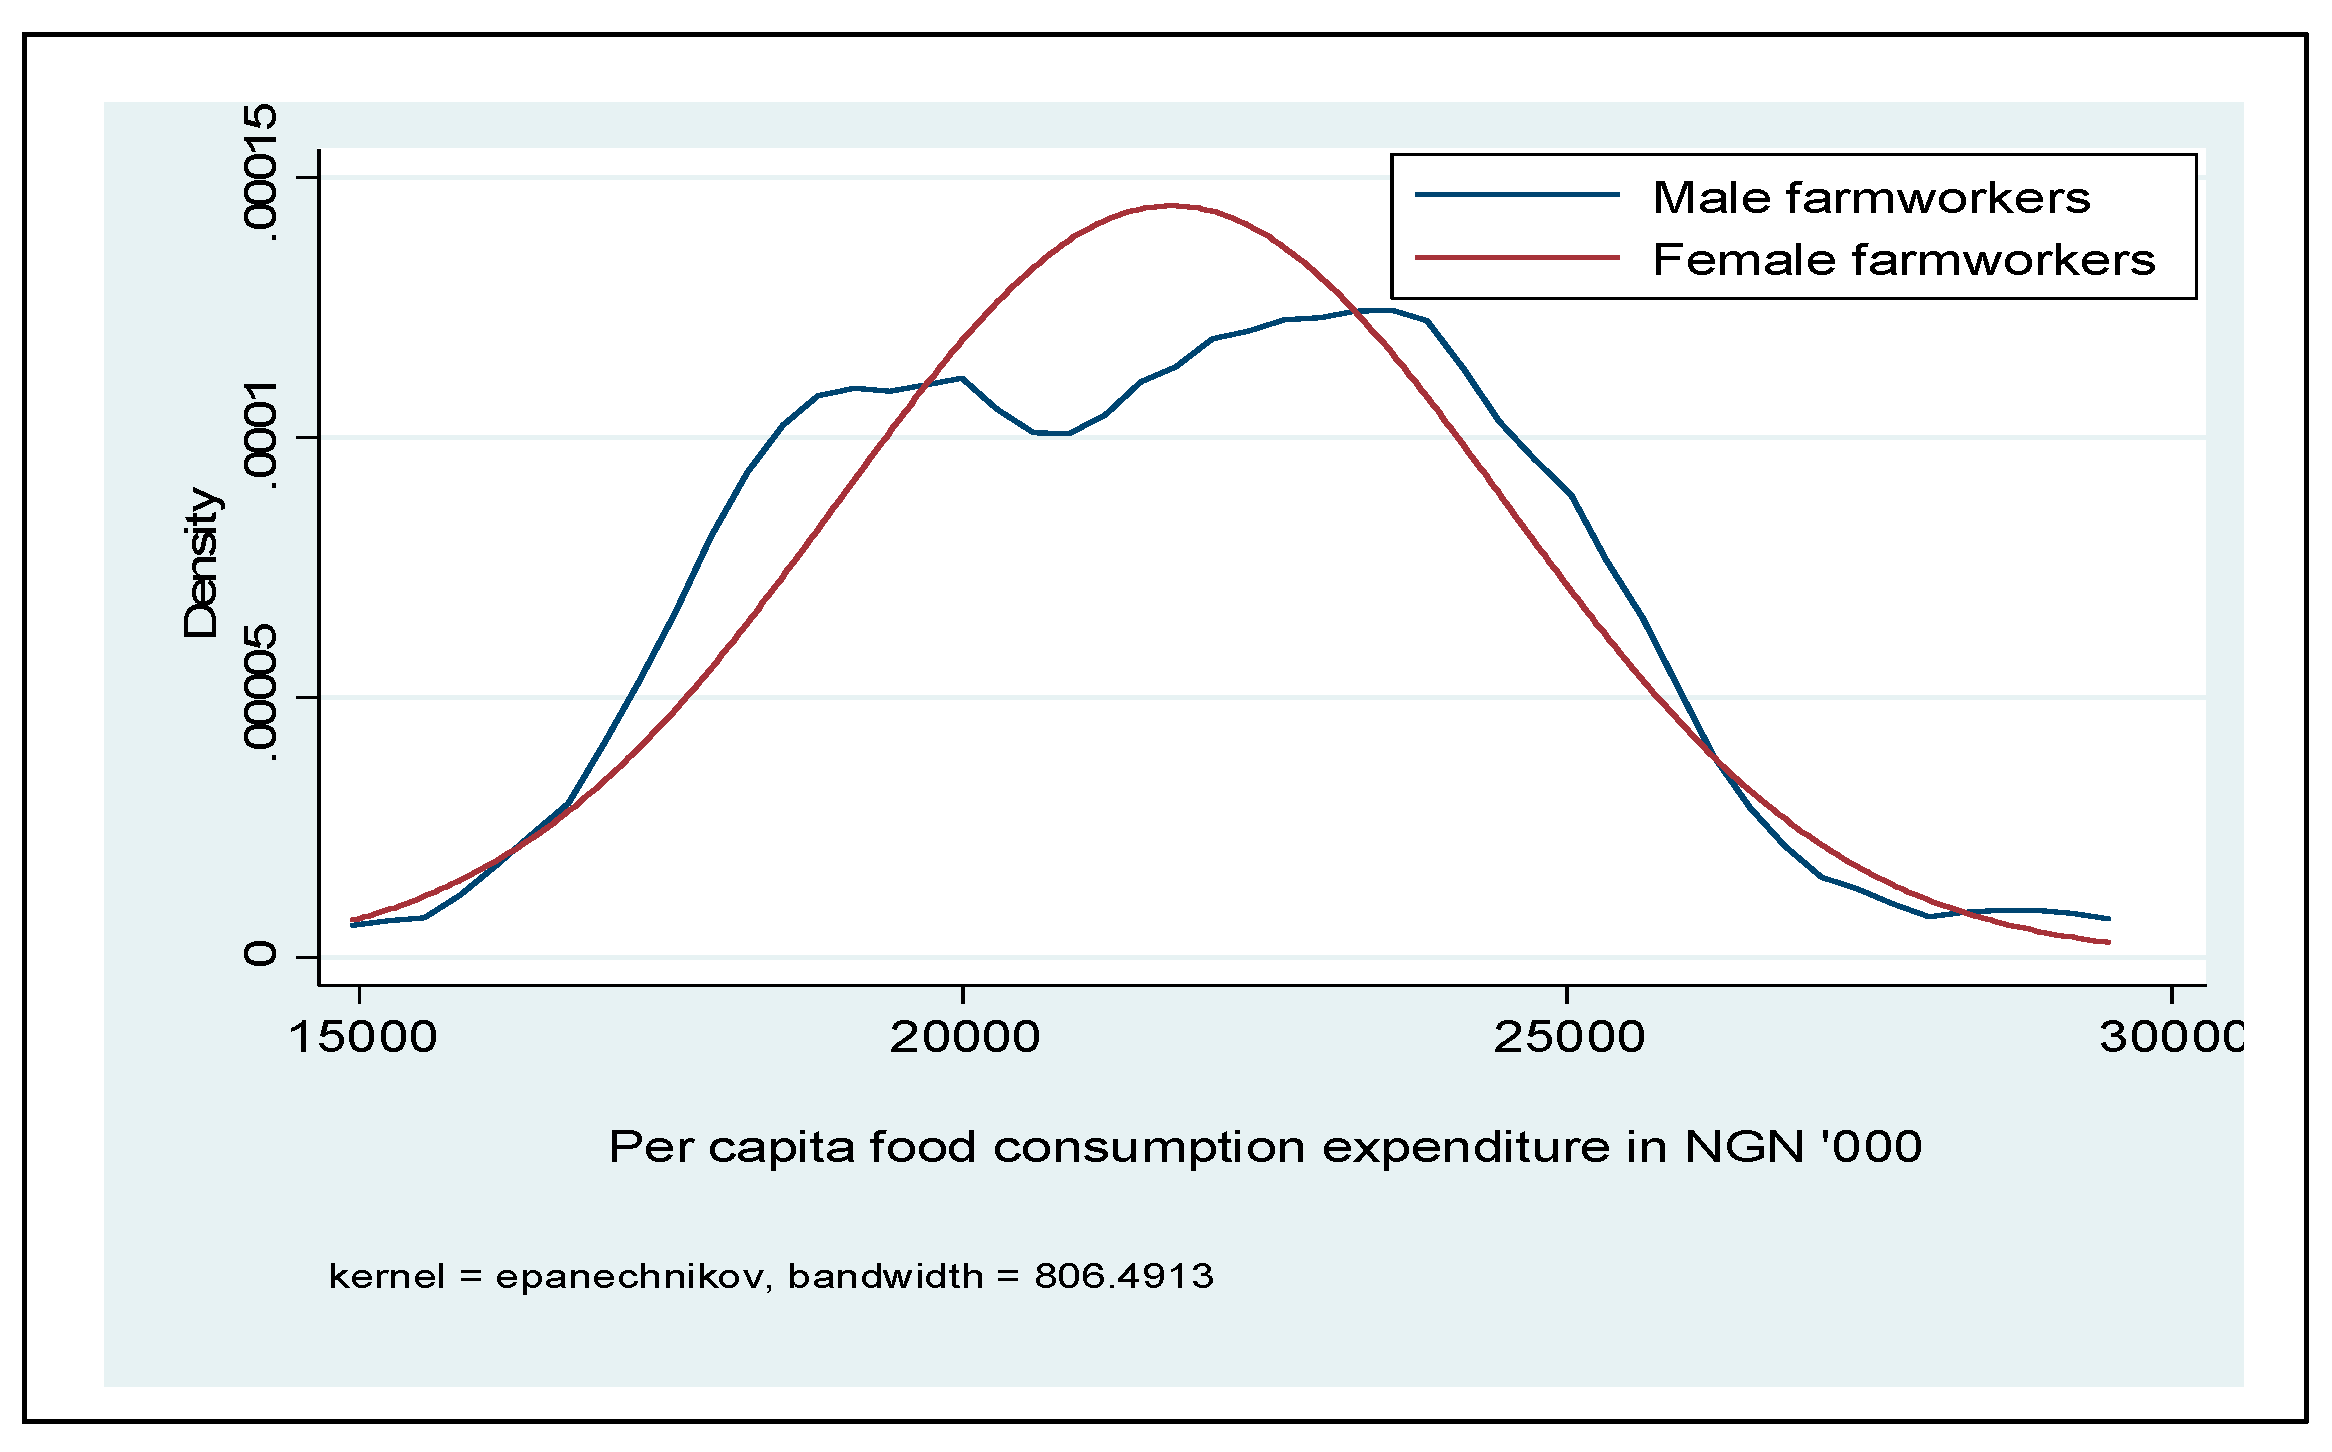
Figure 2.
Propensity score distribution displaying common support condition for per capita food consumption expenditure (₦ '000) among farmworker households.
Figure 2.
Propensity score distribution displaying common support condition for per capita food consumption expenditure (₦ '000) among farmworker households.
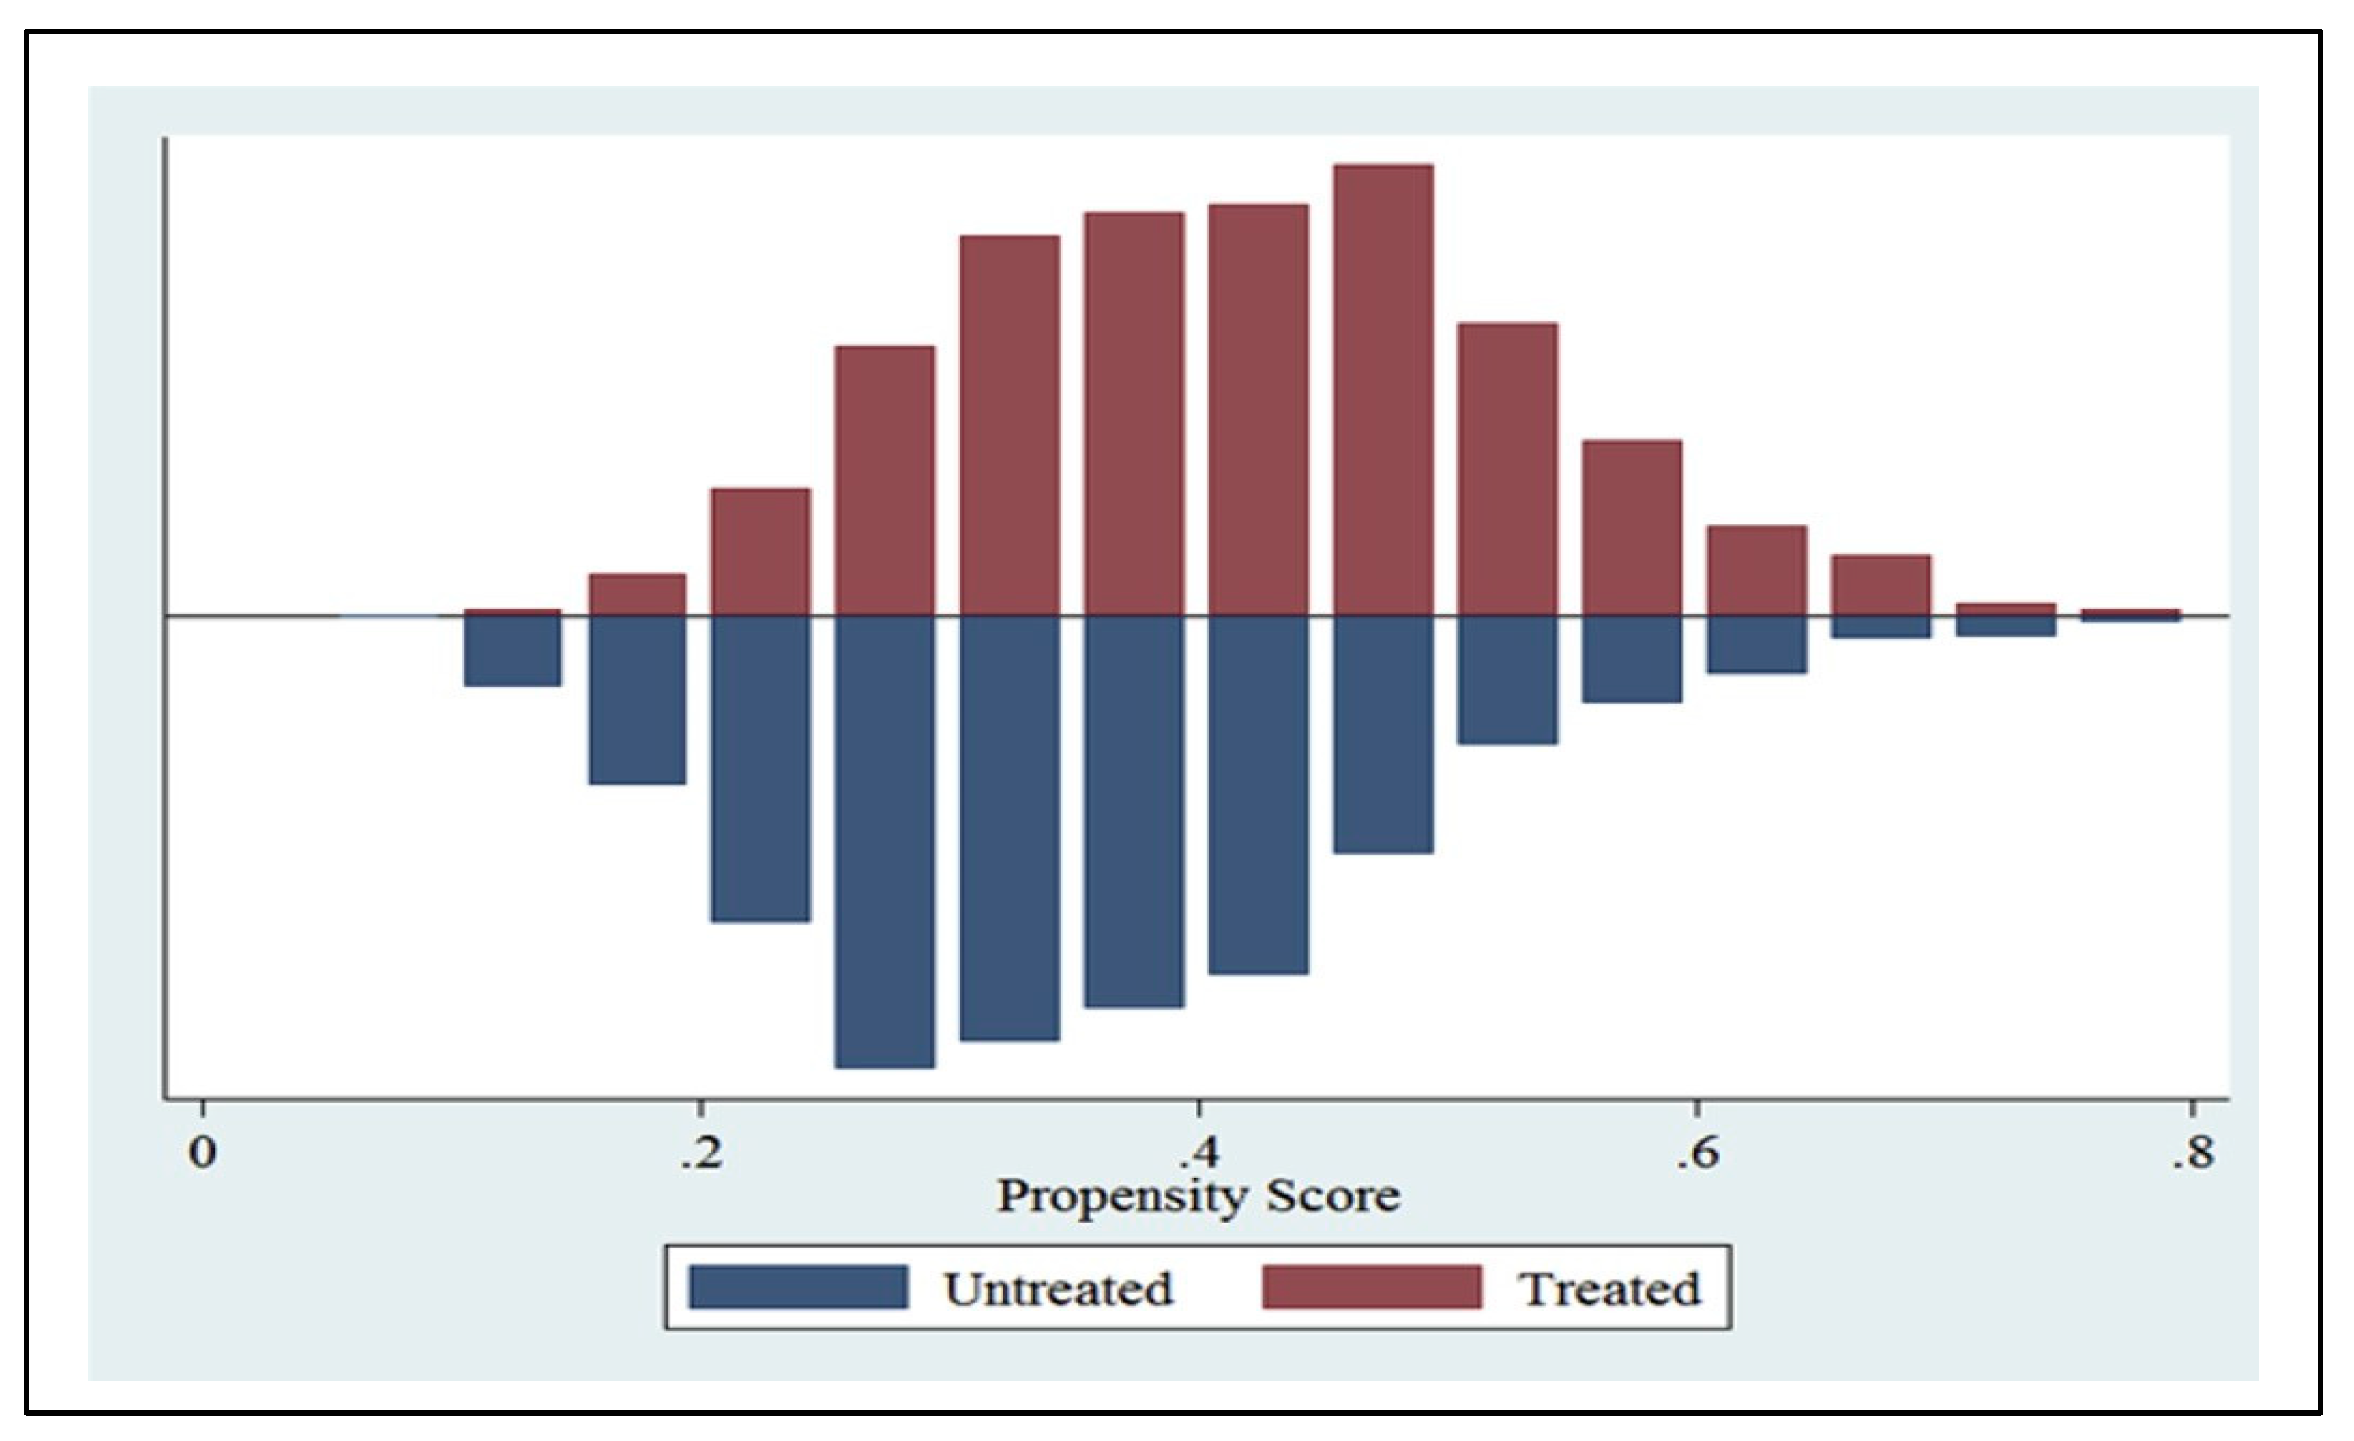
Table 1.
Description of variables included in the model.
| Variable | Description |
|---|---|
| Outcome variable | |
| Per capita food consumption expenditure | Total expenditures spent on food in Nigeria naira (₦) divided by the total number of household members |
| Treatment variable | |
| Gender | Dummy = 1 if farmworker is female; 0 otherwise |
| Control variables | |
| Age | Age of farmworker (years) |
| Marital status | Dummy = 1 if married; 0 otherwise |
| Education | Years of schooling |
| Household size | Total number of people in the household |
| Farmwork experience | Number of years of farming (years) |
| Membership of farm labour union | Dummy = 1 if yes; 0 otherwise |
| Farm salary/wage | Total farm salary/wage per month in Nigeria naira (₦/month) |
| Job characteristics | |
| Job status | Dummy = 1 if permanent; 0 otherwise |
| Job skill | Dummy = 1 if skilled; 0 otherwise |
| Lives on farm | Dummy = 1 if yes; 0 otherwise |
| Average work hour (hour/month) | Total number of hours worked in a month |
| Attended training | Dummy = 1 if the farmworker has attended at least one training, 0 if otherwise |
| Farm enterprise | |
| Crop farming | Dummy = 1 if yes; 0 otherwise |
| Poultry | Dummy = 1 if yes; 0 otherwise |
| Livestock | Dummy = 1 if yes; 0 otherwise |
| Agro-processing | Dummy = 1 if yes; 0 otherwise |
| Fishery/aquaculture | Dummy = 1 if yes; 0 otherwise |
Source: Field survey, 2023.
Table 2.
Summary descriptive statistics, overall and by gender.
| Variable | Full sample (N=720) | Male sub-sample (n=323) | Female sub-sample (n=397) | Mean difference | t-Test (p-value) | |||
|---|---|---|---|---|---|---|---|---|
| 1 | 2 | 3 | ||||||
| Mean | S.D. | Mean | S.D. | Mean | S.D. | (2-3) | ||
| Dependent variable | ||||||||
| Per capita food consumption expenditure (₦ '000) | 46,785.52 | 8,036.96 | 48,813.64 | 8,454.21 | 44,579.34 | 8,721.50 | 4,233.32 | <0.01 |
| Other covariates | ||||||||
| Age of farmworker (years) | 51.27 | 12.69 | 52.65 | 13.76 | 49.88 | 11.63 | 2.77 | 2.593*** |
| Marital status (1=married, 0=otherwise) | 0.88 | 0.42 | 0.89 | 0.46 | 0.86 | 0.39 | 0.03 | 2.862* |
| Education (Years of schooling) | 13.92 | 9.15 | 14.98 | 8.95 | 12.85 | 6.78 | 2.13 | 1.744*** |
| Household size (number) | 9.09 | 5.01 | 9.86 | 5.12 | 8.32 | 4.86 | 1.54 | 6.351*** |
| Farm work experience (years) | 15.68 | 7.07 | 16.17 | 7.69 | 15.19 | 6.44 | 0.98 | 2.154* |
| Membership of labour union (1=yes, 0=otherwise) | 0.76 | 0.36 | 0.93 | 0.26 | 0.59 | 0.45 | 0.34 | 4.792*** |
| Farm salary/wage (₦/month) | 42,744.13 | 8395.42 | 45,533.15 | 9,486.55 | 39,915.10 | 7,452.48 | 5,618.05 | 38.415*** |
| Job status (1=permanent, 0=otherwise) | 0.48 | 0.51 | 0.54 | 0.50 | 0.42 | 0.50 | 0.12 | 1.757*** |
| Job skill (1=skilled, 0=otherwise) | 0.70 | 0.51 | 0.81 | 0.43 | 0.58 | 0.59 | 0.23 | 1.534** |
| Lives on farm (1=yes, 0=otherwise) | 0.36 | 0.44 | 0.43 | 0.45 | 0.29 | 0.42 | 0.14 | 4.368** |
| Average work hour (hour/month) | 141.71 | 19.37 | 147.95 | 17.24 | 135.48 | 16.73 | 12.47 | 7.517*** |
| Access to training (1=yes, 0=otherwise) | 0.79 | 0.50 | 0.94 | 0.52 | 0.65 | 0.48 | 0.29 | 6.832** |
| Crop farming (1=yes, 0=otherwise) | 0.32 | 0.44 | 0.35 | 0.48 | 0.28 | 0.39 | 0.07 | 2.792** |
| Poultry (1=yes, 0=otherwise) | 0.33 | 0.44 | 0.45 | 0.48 | 0.21 | 0.39 | 0.24 | 1.969*** |
| Livestock (1=yes, 0=otherwise) | 0.30 | 0.42 | 0.33 | 0.46 | 0.26 | 0.34 | 0.07 | 1.503* |
| Agro-processing (1=yes, 0=otherwise) | 0.31 | 0.46 | 0.25 | 0.43 | 0.37 | 0.48 | -0.12 | -2.148*** |
| Fishery/aquaculture (1=yes, 0=otherwise) | 0.23 | 0.31 | 0.32 | 0.34 | 0.14 | 0.26 | 0.18 | 1.172*** |
The t-test was carried out to test for difference in outcome and other covariates between male and female farmworkers; *, **, ***represent statistically significant at 10, 5 and 1%, respectively. Source: Field survey, 2023.
Table 4.
Summary of Blinder-Oaxaca decomposition results.
| Farm wage decomposition | Coefficient | Robust Standard Error |
|---|---|---|
| Predicted natural log of per capital food consumption expenditure for male farmworkers | 44015.48*** | 334.406 |
| Predicted natural log of per capital food consumption expenditure for female farmworkers | 32528.97*** | 205.021 |
| Difference (unadjusted gap) | 11486.51*** | 392.251 |
| Explained gap | 1126.658 | 699.215 |
| % Explained gap (% of total) | 9.81 | |
| Unexplained gap | 10359.85*** | 797.199 |
| % Unexplained gap (% of total) | 90.19 |
***Statistically significant at 0.01 level. Source: Author’s computation, 2023.
Table 5.
Detailed estimates of Blinder-Oaxaca decomposition analysis: Model Variables and their percent contribution to the explained gap.
Table 5.
Detailed estimates of Blinder-Oaxaca decomposition analysis: Model Variables and their percent contribution to the explained gap.
| Variable | Coefficient | Standard error | % contribution |
|---|---|---|---|
| Socioeconomic characteristics | |||
| Age of farmworker (years) | -112.175 | 78.473 | -0.022 |
| Marital status (1=married, 0=otherwise) | 139.383 | 103.933 | 0.027 |
| Education (Years of schooling) | -32.577 | 56.667 | -0.006 |
| Household size (number) | 328.041** | 445.766 | 0.064 |
| Farm work experience (years) | 206.737* | 120.214 | 0.040 |
| Membership of labour union (1=yes, 0=otherwise) | 28.401** | 105.658 | 0.006 |
| Farm salary/wage (₦/month) | 3898.65*** | 1388.718 | 0.758 |
| Job characteristics | |||
| Job status (1=permanent, 0=otherwise) | 141.575*** | 71.329 | 0.028 |
| Job skill (1=skilled, 0=otherwise) | -256.362* | 100.183 | -0.050 |
| Lives on farm (1=yes, 0=otherwise) | 114.894** | 73.591 | 0.022 |
| Average work hour (hour/month) | 411.708*** | 387.407 | 0.080 |
| Access to training (1=yes, 0=otherwise) | 154.399* | 101.035 | 0.030 |
| Farm enterprise | |||
| Crop farming (1=yes, 0=otherwise) | 113.691*** | 66.756 | 0.022 |
| Poultry (1=yes, 0=otherwise) | -54.588** | 66.188 | -0.011 |
| Livestock (1=yes, 0=otherwise) | 11.03*** | 76.292 | 0.002 |
| Agro-processing (1=yes, 0=otherwise) | 59.639*** | 87.142 | 0.012 |
| Fishery/aquaculture (1=yes, 0=otherwise) | -12.236* | 121.741 | -0.002 |
*, **, ***significant at 10, 5 and 1%, respectively. Source: Author’s computation, 2023.
Table 6.
Test of equality of means of variables before and after matching.
| Variable | Unmatched Sample | Matched Sample | ||||||
|---|---|---|---|---|---|---|---|---|
| Mean | % bias | p>t | Mean | % bias | p>t | |||
| Female (treatment) | Male (control) | Female (treatment) | Male (control) | |||||
| Age | 49.88 | 52.65 | -6.60 | 0.004** | 49.88 | 52.12 | -29.00 | 0.457 |
| Marital status | 0.86 | 0.89 | -1.10 | 0.029** | 0.86 | 0.85 | 24.60 | 0.856 |
| Education | 12.85 | 14.98 | -63.40 | 0.000*** | 12.85 | 14.76 | 19.70 | 0.822 |
| Household size | 8.32 | 9.86 | -12.20 | 0.025** | 8.32 | 9.59 | -16.60 | 0.295 |
| Farmwork experience | 15.19 | 16.17 | -11.61 | 0.004*** | 15.19 | 16.08 | -5.24 | 0.691 |
| Membership of labour union | 0.59 | 0.93 | -33.54 | 0.000*** | 0.59 | 0.96 | -39.70 | 0.485 |
| Farm salary/wage | 39,915.10 | 45,533.15 | -295.30 | 0.000*** | 39,915.10 | 45,438.03 | -121.10 | 0.539 |
| Job status | 0.42 | 0.54 | -12.60 | 0.030** | 0.42 | 0.52 | -15.80 | 0.756 |
| Job skill | 0.58 | 0.81 | -39.90 | 0.083* | 0.58 | 0.84 | -56.60 | 0.476 |
| Lives on farm | 0.29 | 0.43 | -42.50 | 0.001*** | 0.29 | 0.38 | -12.10 | 0.801 |
| Average work hour | 135.48 | 147.95 | -11.40 | 0.000*** | 135.48 | 147.45 | -4.00 | 0.483 |
| Attended training | 0.65 | 0.94 | -10.00 | 0.000*** | 0.65 | 0.91 | -14.40 | 0.831 |
| Crop farming | 0.28 | 0.35 | -85.70 | 0.000*** | 0.28 | 0.33 | -2.90 | 0.472 |
| Poultry | 0.21 | 0.45 | -23.70 | 0.018** | 0.21 | 0.49 | -29.60 | 0.626 |
| Livestock | 0.26 | 0.33 | -10.60 | 0.016** | 0.26 | 0.31 | -9.70 | 0.725 |
| Agro-processing | 0.37 | 0.25 | -17.50 | 0.083* | 0.37 | 0.28 | -28.30 | 0.918 |
| Fishery/aquaculture | 0.14 | 0.32 | -19.60 | 0.017** | 0.14 | 0.30 | -20.40 | 0.515 |
Source: Author’s computation (2023). Note: *, ** and *** represent, respectively, statistical significance at the 0.1, 0.05, and 0.01 level.
Table 7.
Overall quality test of the propensity scores under different matching algorithms.
| Status | Matching method | Pseudo R² | LR χ² | p>(χ²) | Mean Standard bias | Bias | Total % mean bias reduction |
|---|---|---|---|---|---|---|---|
| Unmatched | 0.774 | 284.05 | 0.000*** | 66.50 | 298.20 | ||
| Matched | NNM | 0.023 | 5.37 | 0.275 | 23.80 | 26.30 | 91.2 |
| KBM | 0.045 | 12.92 | 0.359 | 19.60 | 21.19 | 92.9 |
Source: Author’s computation, 2023. Note: ***significance level at 1%.
Table 8.
Propensity score algorithms: impact of farm on welfare outcome.
| Variables | Parameters | Female farmworkers | Male farmworkers | Difference | Standard Error | T-stat |
|---|---|---|---|---|---|---|
| Nearest Neighbour Matching (NNM) | ||||||
| Per capita food consumption expenditure (₦ '000) | Unmatched | 44,579.340 | 48,813.640 | -4,234.300 | 543.272 | 19.15*** |
| ATT | 44,356.443 | 48,331.173 | -3,974.730 | 3361.460 | 3.20*** | |
| ATU | 29,600.682 | 36,686.939 | -7,086.257 | |||
| ATE | -8,423.917 | |||||
| Kernel-based Matching (KBM) | ||||||
| Per capita food consumption expenditure (₦ '000) | Unmatched | 44,579.340 | 48,813.640 | -4,234.300 | 543.272 | 19.15*** |
| ATT | 44,656.349 | 61,253.341 | -16,596.992 | 4290.150 | 2.53*** | |
| ATU | 12,917.217 | 6,745.118 | 6,172.099 | |||
| ATE | 6,640.698 | |||||
***represent statistical significance at 1%. S.E denote standard errors. Source: Authors’ computation, 2023.
Table 9.
Results of Rosenbaum Γ sensitivity analysis for hidden bias.
| Outcome variable | Matching Methods | Gamma (Г) | P-value |
|---|---|---|---|
| Per capita food consumption expenditure | NNM | 1.20 - 1.25 | 0.058 - 0.126 |
| KBM | 1.45 - 1.50 | 0.076 - 0.145 |
Source: Author’s computation, 2023.
Disclaimer/Publisher’s Note: The statements, opinions and data contained in all publications are solely those of the individual author(s) and contributor(s) and not of MDPI and/or the editor(s). MDPI and/or the editor(s) disclaim responsibility for any injury to people or property resulting from any ideas, methods, instructions or products referred to in the content. |
© 2024 by the authors. Licensee MDPI, Basel, Switzerland. This article is an open access article distributed under the terms and conditions of the Creative Commons Attribution (CC BY) license (https://creativecommons.org/licenses/by/4.0/).
Copyright: This open access article is published under a Creative Commons CC BY 4.0 license, which permit the free download, distribution, and reuse, provided that the author and preprint are cited in any reuse.


