

Submitted:
20 June 2024
Posted:
20 June 2024
You are already at the latest version
Abstract
Although promoting healthy eating is a policy objective, the controllability of dietary habits remains uncertain. The personal dietary patterns reflect many factors, of which some are relatively controllable for individual, and others are not. In this article, assuming that some sort of information about controllability of dietary habits is contained in the observed pattern of food consumptions, we focused on dietary pattern on its own. We introduced a statistical descriptive model for data on food frequency questionnaire, estimated strength of pairwise linkage between foodstuffs, and grouped foodstuffs by applying community detection to the networks of the estimated inter-food linkages. Those linkages represent co-movement of pairs of foods consumption. Furthermore, we demonstrated an analysis on the relationship between health of mind and dietary habits considering the aspect of controllability of dietary habits. Using an observational study in Japan, we obtained the following results: 115 foodstuffs were divided into 3 groups for both of genders, but the compositions were different by gender; in the analysis of mental health, some stress response items were associated with the dependence on some of those food groupings. As the grouping of foodstuffs based on our estimation depicted the internal structure of dietary habit that a healthy eating policy should regard as constraint, it follows that we should design the policy along the line with that grouping.
Keywords:
food consumption pattern
; internal structure of dietary habit
; healthy eating policy
; statistical model
1. Introduction
In the general context of investigating the relationships between dietary habits and health, motivated by healthy eating policies, it is assumed that dietary habits are controllable means aimed at a healthy life. But what sense does the “controllable dietary habits” make? As pointed by researchers, food choices are affected by and complicated by a variety of factors [1]. Among these factors of food choice, some ones are external or exogenous and others are internal or endogenous depending on standpoint of decision makers. For instance, sociocultural factors such as economic variables are external and cognitive factors such as attitude, liking and preferences are internal for individual persons, while they are the opposite for policy makers. In some cases, in the real world, decisions regarding food choice are “seen as heavily influenced by factors outside the control of individual” [2]. Therefore, any control of dietary habits aimed to healthy life might be, to a greater or lesser extent, restricted by several factors influencing food choices.
From the viewpoint of controlling dietary habits aimed to healthcare, we particularly focused on internal structure of dietary habits represented by food consumption patterns. The restriction upon the controllability of dietary habits would be, conceptually, reflected as a range of probable choice set in a food choice space. If someone arbitrarily tries to change her/his dietary habits with free movement in a food choice space ignoring her/his conventional food choice range, that practice would be a burdensome for her/him and not long-lasting diet modification.
In an improvement of diet, for example, if a person is advised to eat more tomatoes and s/he makes effort to do so, then s/he is likely not only to increase the amount of tomatoes intake but also to change other foods intake. It might be because s/he likes to eat some foods with tomatoes and dislikes to eat other foods with tomatoes, or because her/his lifestyle or custom imposes her/him to do so. In other words, peoples’ dietary habits are formed by their tastes, preferences, tradition, or other factors. The same presumably holds true in terms of nutrient (e.g., lycopene) instead of food (e.g., tomatoes). This implies that controlling of dietary habits should consider the possibility of an external change in one food intake provoking unintended internal changes in other foods intakes, which is induced by the internal structure of dietary habits caused by many factors. As those many factors influencing food choices are not only explicitly but also implicitly imbedded in decision making [3], focusing on food consumption patterns by itself as the representation of internal structure of dietary habits enables a simple approach.
With the perspective discussed above, this article investigated the relationship between dietary habits and health of mind based on an observational study in Ebetsu city, Japan. The study includes items of outcome scales in occupational stress measures, food frequency questionnaire (FFQ), and physical and demographic attributes among others for each participant. In the focused relationship which was captured by the regressions of stress degrees on dietary habits and other covariates, the independent variables for dietary habits were devised to deal with the internal structure problem. In particular, we introduced a statistical descriptive model assuming that in the FFQ data observations for every pair of two foods had generated from bivariate multinomial distribution, so that a scale of degrees of simultaneous intake of two foods could be estimated by gender. Then, we divided foods into some groups according to the propensity of simultaneous intakes. At last, ordered logit regressions of the occupational stress measures on degrees of dependence on each group of foods were conducted controlling of confounders. This setup is intended to provide an example in which group level insights of foods intake relationship with health rather than individual item level might enable dietary habits management to be more careful, meticulous, and hence long-lasting for practitioners.
According to our results, males and females showed their distinctive characteristics in their dietary patterns. Some foodstuffs were intensively combined with other foodstuffs and played a key role in the dietary habits. Based on the pairwise connectivity between foodstuffs, internal structures of dietary habit manifested as three groups of foods for both genders, besides the contents of each group were different by gender. Dependencies on some of food groupings were shown to be associated with some of aspects of mental health with adjusting for confounders. This demonstration provided a way to find the target group of foodstuffs that internally co-move together in a healthy eating policy.
2. Materials and Methods
2.1. Participants and Study Design
We exploited secondary data derived from ‘the comprehensive survey to establish an integrated database of food, gut microbiome, and health information (Sukoyaka Health Survey)’. The detailed explanation of the study protocol haves been previously reported [4]. Although the Sukoyaka Health Survey was implemented in five municipalities in Hokkaido, Tokyo, Kyoto, Nagasaki, and Miyazaki prefectures across Japan, we only used subsample of Hokkaido focusing on one region and relying on the predominant integrity of that subsample. Data collections occurred in 2019 summer and 2020 winter.
The derived dataset is a cross-sectional data with men and women in their 20s to 70s located in Ebetsu city, Hokkaido, Japan. The exclusion criteria were persons with serious cerebrovascular, heart, liver, kidney, or gastrointestinal diseases, infections requiring notification, blood donation within a certain period (last 16 weeks for women 400ml donation, last 12 weeks for men 400ml, last 4 weeks for 200ml, last 2 weeks for component donation), and pregnant of breastfeeding women.
From 803 participants including 211 males and 592 females in the subsample of Hokkaido, we excluded 1 male and 2 female because of missing data in FFQ, so left with 210 males and 592 females in the dataset. This is the sample that we used for the first part of our analysis. When we conducted regression analysis as the last part of our analysis described below, the sample size declined to 205 males and 587 females with completed data of the dependent and the independent variables in the regression. Regarding the latter sample, mean age of female is 50.1 (S.D. 11.3), while that of male is 53.4 (S.D. 12.6).
This study was approved by the Ethics Committee of the Hokkaido Information University, and written consent was obtained from the participants. The research was conducted in accordance with the Helsinki Declaration.
2.2. Data Analysis
2.2.1. Statistical Model
We employed a statistical descriptive model to deal with the internal structure of dietary habits in food-health analysis. For a generic pair of two foodstuffs and , on every eating occasion, the intake of these foods was assumed to be determined by four-states Bernoulli trial: food without food is eaten with probability , food without food is eaten with probability , both of food and are eaten with probability , and both of them are not eaten with . The pair of frequencies of food and intakes during a given period follow the bivariate multinomial distribution with parameters and the number of trials . Especially, the number of times of the Bernoulli trial is set corresponding to weekly frequency of food intake (3 times a day for 7 days). Since our data include the observations with higher frequency strata than times intakes a week (Table A1 in Appendix A), we introduced into the model an irregular mode into which the food intake switches independently with probability . denotes the probability of food ’s higher frequency mode. If food is in higher frequency mode and food is not, the other food intake occurs with probability conditional on both food’s mode (unconditional probability is ). See Appendix B for the log likelihood function.
Straightforwardly, the estimated values for each pair of foods provide an indicator of closeness between the two foods. On average, these two foods are simultaneously consumed times a week. However, for each pair of two foods, if either of the foods is more highly frequently consumed, the chance of two foods meeting on the same dining table is larger. Two foods on the same table may be independently picked out or may be chosen collectively. In our model, we could distinguish between the preferred/intended and the incidental/unintended combination of two foods. To distinguish the two possibilities, we test a null hypothesis that the estimated model has generated lesser simultaneous intakes of two foods than the special case model in which two foods intakes are independent. In the special case model, assuming that food and are consumed independently at every trial with probability and respectively, the incidental combination of them occurs with probability (Appendix C). As the special case of the estimated model, the relations of and hold, so the null hypothesis is . We calculated the p-value of this non-linear hypothesis by simulation: we drew 1,000 samplings of from and evaluated the null. For significant pairs of foods with level , we assigned each of these pairs with the value as a measure of closeness between two foods in the internal structure of dietary habits. is nothing less than “excess degree of combination” of the two foods pair.
2.2.2. Analysis
We conducted the estimation and testing of the two-foods models for subsamples divided by gender. In FFQ data, participants were asked the frequency of intakes for 128 foods in the same strata choice format. The strata are shown in the second column of Table A1. Among the 128 food items, 17 items duplicate in terms of foodstuff and are distinct in recipes. We consolidated these 17 items into 4 items (beef, pork, chicken, and bean curd) in line with a rule described in Appendix D. Then we have 115 foods in our analysis (listed in Table A2). Unfortunately, these 115 foods do not include rice, miso soup, and drink including alcohol since these items are asked in different strata choice format. We were compelled to exclude the principal food for Japanese and beverage from our analysis.
Although our model would generate data of an exact number of times of food intakes, the FFQ in our study is stratified data. Coping with this, we specify the range of frequency for each stratum, and calculate likelihood function for stratified data by summing likelihood over the interval for each stratum. The specification of the class interval is shown in Table A1.
With the results of the estimated model discussed earlier, we constructed networks of foods in which a vertex denotes a food item, and an edge denotes the average degree of combination of two food items. This network includes only the edges with 1%-significant positive . Then we classified the foods according to the result of community detection on the network [5]. Since the network community analysis maximizes the modularity which takes into account connectedness even under randomness, we use instead of for the edge weights.
The food items in the same community are seen as closely related in combinatorial intake, and the foods in different communities are more likely separately consumed. The co-movement of foods within a community and the separation of foods across communities make a sense of controllability of dietary habits. Groupwise alteration of eating would be more stress-free than individual food modification.
Therefore, eventually in our analysis, we demonstrated an application of food-health analysis considering the internal structure of dietary habits. Especially, the association of health of mind with dietary habits was estimated by an ordered logit model adjusted for age, housemates, occupation, etc. In this analysis, mental health is measured by responses to question items from the category of stress response in the occupational stress test “the Brief Job Stress Questionnaire” [6,7]. The explanatory variables of dietary habits are the dependence of energy, carbohydrate, protein, and lipid on each group of foodstuffs divided in the foregoing analysis. The four types of dependency measures based on energy, carbohydrate, protein, and lipid are exploited for robustness check. Note that the denominator of the dependency variables is total intake of energy, carbohydrate, protein, or lipid including other food items (rice, miso soup, beverage), which were excluded from 115 food items in our model estimation. We could use the information of total intake of energy, etc. included in the secondary data of Sukoyaka Health Survey.
By looking at the relationship between health and food groups based on their combinatorial consumption, we can consider the implication of dietary habits for health conditional on the restriction of propensity of simultaneous intake imposed on the dietary habits.
3. Results
3.1. Model Estimation
For each of 6,555 pairs of two food items out of 115 foodstuffs, and for each subsample by gender, we estimated bivariate multinomial distribution model discussed above. Table 1 shows the number of pairs in which the excess degree of combination is significantly greater than 0. For each significance levels of =0.01, 0.05, and 0.10, the number of significant pairs for female is nearly two times as many as for male.
The top 10 pairs for 1%-significant value of are shown in Table 2. For female on average, out of =21 meals in a week, carrot and onion are simultaneously consumed =1.77 times, only carrot =0.98 times, and only onion =1.94 times. As discussed in previous section, the simultaneous consumption of 1.77 times might include both intended and unintended choices. At least, however, =1.28 times out of 1.77 can be seen as intended simultaneous consumption. Combinations of onion with carrot, cabbage, tomatoes, long green onion, or radish precede for male and female.
3.2. Community Analysis
The results of community analysis in the food combination networks are presented in Table 3 and Figure 1. According to Table 3, groupings of foods exhibit both affinity and difference between male and female. For instance, carrot and onion are in the same group for male and female in common; egg and onion are in the same group for female but not for male; females combine tomato and cucumber, but males do not, and so on. In addition, sea breams and eel are isolated for male and female. For male, amberjack, rice cake, and taros also are not combined closely with other food items.
All vegetables except tomatoes are in the same group for males (group 3 of males), while vegetables are divided across groups for females. All fishes except canned tuna are in the same group for females (group 2 of females), but fishes are scattered across several groups for males. All fruits and pickles belong to the same group for both genders, except pickled turnip for male.
Figure 1 makes up for inadequacies of impression from Table 3. Although detection of community structure in networks provides clear cut grouping, the intra-community closeness among food items is not uniform. For each group of food items denoted by vertex color, foodstuffs are separated into central ones and peripheral ones. The former foods have many links with others and organize the community. The latter foods have links mainly with the former and so are accessional in the network community. The central foodstuffs in the entire networks are onion, tomatoes, egg, carrot etc. for female, and onion, egg, yogurt, tomatoes etc. for male.
Closer look at data behind the network plots finds out distribution of intra- and inter-community linkages. Foodstuffs with higher intra-community centrality are onion, egg, cabbage, bean curd etc. for female, and tomatoes, cucumber, lettuce, broccoli etc. for male. Foodstuffs with higher inter-community centrality are tomatoes, onion, cucumber, carrot etc. for female, and egg, onion, cabbage, yogurt etc. for male. See the supplementary material S1 for detail.
If we summarize the grouping by typical elements of foodstuffs, the groupings for each gender are as follows. For female, group 1 consists of onion, egg, yogurt, pork, etc.; group 2 consists of cabbage, bean curd, radish, fermented soybeans, etc.; group 3 consists of tomatoes, cucumber, mandarin, lettuce, etc. For male, group 1 consists of tomatoes, apple, banana, yogurt, etc.; group 2 consists of egg, salad dressings, bread, chicken, etc.; group 3 consists of cucumber, lettuce, broccoli, onion, etc. Since these food items play a central role within their respective groups, consciously altering the consumption of these foods is likely to lead to unintentional changes in the intake of other foods within the same group.
3.3. Ordered Logit Regression
The results of ordered logit regression are summarized in Table 4. The summary statistics of samples for ordered logit analysis is provided in supplementary material S2. In Table 4, the rows show 29 question items from category of stress response in the occupational stress questionnaire [6,7]. These question items are measured by a four-point Likert scale (0=” Almost never”, 1=”Sometimes”, 2=”Often”, and 3=”Almost always”). Note that, depending on question items, the value of answer should be interpreted inversely as a stress measure. Though the ordered logit model should be evaluated in terms of marginal effects on probabilities, we saw the relationship between mental health and dietary habits by the signs and significances of coefficients of ordered logit regression for sake of simplicity.
According to Table 4, the robust results are as follows: the item “I have felt extremely tired” is negatively associated with food group 3 (tomatoes, cucumber, mandarin, lettuce, etc.) for female; the item "I have felt worried or insecure" and " I have felt gloomy" are positively associated with food group 1 (onion, egg, yogurt, pork, etc.) for female; the item "I have felt restless" is positively associated with food group 2 (cabbage, bean curd, radish, fermented soybeans, etc.) for female; the items "I have felt angry" and " I have felt tense" are negatively associated with food group 3 (cucumber, lettuce, broccoli, onion, etc.) for male; the items “I have experienced stomach and/or intestine problems” and “I have experienced diarrhea and/or constipation” are negatively associated with food group 1 (tomatoes, apple, banana, yogurt, etc.) for male; all of these are with adjusting for confounders.
Regarding confounders in the regression analysis, we obtained the following robust results. Conditional on other confounders: age is negatively associated with almost all items in scales of anger-irritability, fatigue, and anxiety for male and female, and depression only for male; BMI is positively associated with several items in scales of anger-irritability and physical stress reaction for female; Caregiving is positively associated with several items in scales of anger-irritability, fatigue, anxiety, and depression for female, and fatigue, anxiety, depression, and physical stress reaction for male (supplementary material S3).
4. Discussion
We estimated dietary patterns for each gender based on a statistical model. The patterns of combination of foodstuffs are different between male and female. Females showed greater persistence in combining food items than males (Table 1). The fact that females traditionally cook more often than males might be behind the result.
Pairwise linkage of food items expressing the propensity of combinatorial/simultaneous intake of two foodstuffs presented the internal structure of dietary habits. According to this structure, we grouped food items by network community detection analysis. Some foodstuffs were isolated in the networks: sea breams and eel for both genders. Traditionally, these foods are fare of a festive occasion or linked to a particular season, and so rare in Japan.
Our method with a model of simultaneous intake of two foodstuffs and network community detection can be seen as a device of data dimension distraction. If we had numerical data on food intake frequency rather than stratified data as in FFQ, we could perform principal component analysis. It would be expected that several components reflect relatively controllable variations in dietary habits and the others relatively uncontrollable ones. At least, controllable and uncontrollable variations in food intakes are likely orthogonal each other. In our framework with stratified data, we segregated several sets of axes along which some groups of food items comove. For example, onion, egg, and yogurt comove together for female; cabbage, bean curd, and radish comove for female; tomatoes, apple, and banana comove for male; egg, salad dressings, and bread comove for male, etc. (Supplementary material S1.) Thus, the food groupings derived from our analysis are seen as dimensions along which changes of dietary habits are low load on food combination habits. Therefore, in the framework of health as dependent variable and dietary habits as independent variable, it is straightforward to use the measures by the groups for dietary habits. That was the sense of our ordered logit regression of mental health on diet.
As for the results of the regression analysis (Table 4), for male, the food group including all fruits items and the food group including almost all vegetables items were negatively associated with several stress reactions, that is comparable to the positive association of fruits and vegetables with well-being [8]. While it is pointed that intake of fishes is positively associated with vigor for working people [9], the food group including almost all fishes was not negatively correlated with stress items for females in our sample.
On a theoretical basis, an additional remark on our methodology is appropriate. The parameter of our model is closely related to economics concepts of complementarity and substitutability between two foodstuffs. Despite the definition of the latter is built in terms of cross-price elasticity within demand system of foods, it seems like that positive significant corresponds to complementarity, and negative significant , though we didn’t focus on in our analysis, corresponds to substitutability. Actually, in the various disciplines related to food consumptions, estimations of complementarity and substitutability among foods have been conducted applying the method of Almost Ideal Demand System [10,11] and others [12].
The difference of two concepts is merely about-what: is about eating, and the two economics concepts are about purchasing. However, the correspondence between and complementarity/substitutability might be dissolved by the preservative quality of some foods. If consumers could buy some preservative foods at the time of their low price regardless of prices of related foods, the complementarity or substitutability might be underrepresented. Our method has an advantage of focusing directly on consumption rather than purchase.
This article has several limitations. First, in our analysis for internal structure of dietary habits, some important food items, i.e., rice, miso soup, and beverages (alcohol, teas, coffee, fruit/vegetable juices, etc.) are excluded because of inconsistencies in the data format. If rice was able to be included in Figure 1, rice must have had greater centrality in the network, i.e. have large frequency of combinatorial intake with many more other foods. Although the result of community detection in food network (Table 3 and Figure 1) is critically affected by the exclusion of those food items, the result of each pairwise estimation of the simultaneous intake model (Table 1 and Table 2) is unaffected by the exclusion. Individual results on co-movement of food pairing are still valid.
Second, acceptability of the results of model estimation are mixed. The results in Table 2 contained some estimates values difficult to interpret. For example, pork and chicken for male have =1.65 and =1.25 (p-value=0.00) literary meaning that pork and chicken are simultaneously eaten 1.65 times a week, broken down into at least 1.25 times of insisted combinatorial intake and at most 0.40 times of incidental simultaneous intake. This relatively high combination of pork and chicken hardly fits the actual societal experience in Japan. That might be a spurious correlation, or, so far as meat and bean curd, might be alleviated by an adjustment of the way of data consolidation (Appendix D). As an extension, the model can be estimated using Bayesian methods with a prior distribution that incorporates external information about reasonable combinations of foods on general Japanese recipes.
Third, we estimated our model on a weekly basis, i.e., times of meal occasions in 7 days, although we could have chosen a monthly basis. This decision was driven by the significant time consumption of computer processing. Saving time costed some loss of information precision. Especially, the strata of “less than 1 per month” and “1~2 per month” were consolidated to “0 per week” by our choice (see Table A1).
Supplementary Materials
The following supporting information can be downloaded at the website of this paper posted on Preprints.org. Table S1: Community Detection in Foods Simultaneous Intake Network; Table S2: Summary Statistics of Sample for Ordered Logit Regression; Table S3: Results for Confounders of Ordered Logit Regression.
Author Contributions
Conceptualization, M.H., K.S. and J.N.; methodology, M.H. and K.S; formal analysis, M.H.; writing—original draft preparation, M.H.; writing—review and editing, M.H., K.S. and J.N.; supervision, M.M.Y. and J.N.; project administration, M.M.Y. and J.N.; funding acquisition, M.M.Y. and J.N. All authors have read and agreed to the published version of the manuscript.
Funding
This research was funded by the cross-ministerial Strategic Innovation Promotion Program (SIP), “Technologies for Smart Bio-industry and Agriculture” (funding agency: Bio-oriented Technology Research Advancement Institution, NARO, Japan), grant number: SIP2B.
Institutional Review Board Statement
The “Sukoyaka Health Survey” was conducted following the ethical principles based on the Declaration of Helsinki (revised by the World Medical Association Fortareza General Assembly in October 2013) and in compliance with the Ethical Guidelines for Medical Research for Persons (revised by the Ministry of Education, Culture, Sports, Science, and Technology and the Ministry of Health, Labour, and Welfare on 28 February 2017). We obtained written informed consent from all subjects. The Bioethics Committee of the Hokkaido Information University reviewed and approved the feasibility of clinical trials and the ethical and scientific validity (approval date: 22 April 2019; approval number: 2019-04).
Informed Consent Statement
Informed consent was obtained from all subjects involved in the study.
Data Availability Statement
The data obtained from the “Sukoyaka Health Survey” are available in a publicly accessible repository from a publicly accessible repository managed by the DNA Data Bank of Japan (DDBJ) Japanese Genotype-phenotype Archive at https://www.ddbj.nig.ac.jp/jga/index-e.html.
Acknowledgments
This work was supported by Cross-ministerial Strategic Innovation Promotion Program (SIP), “Building a Resilient and Nourishing Food Chain for a Sustainable Future” (Grant Number JPJ012287; funding agency: Bio-oriented Technology Research Advancement Institution) and “Technologies for Smart Bio-industry and Agriculture” (funding agency: Bio-oriented Technology Research Advancement Institution, NARO). We would like to acknowledge stuffs of Department of Medical Management and Informatics, Hokkaido Information University, especially, Akiko Oda and Tamae Shimawaki for their advices about nutrition.
Conflicts of Interest
The authors declare no conflicts of interest. The funders had no role in the design of the study; in the collection, analyses, or interpretation of data; in the writing of the manuscript; or in the decision to publish the results.
Appendix A

Table A1.
Transformation of stratified FFQ data.
| Strata | FFQ | Monthly | Weekly |
|---|---|---|---|
| 1 | Less than 1 per month | 0 | 0 |
| 2 | 1~2 per month | ||
| 3 | 1~2 per week | ||
| 4 | 3~4 per week | ||
| 5 | 5~6 per week | ||
| 6 | 1 per day | ||
| 7 | 2~3 per day | ||
| 8 | 4~6 per day | ||
| 9 | 7 or more per day |
Note: Transformation between monthly (), weekly (), and daily () numbers is based on the following formulas:
Appendix B
In our model, the probability of times food intakes and times food intakes in times occasions is:
Observation where and are the stratum of FFQ for food and has the log likelihood function:
In above equation, we use the symbol and to mean both the stratum of frequency observed in data and the value of frequency unobserved in data interchangeably.
Occasionally, the maximum likelihood estimate of turned out to be the corner solution , so the Hessian of the log likelihood is not invertible, hence cannot be obtained. In such cases, we set p-value of equal 1 as a trivial.
Appendix C
Hypothesis test for significant combination of two foods:
| Estimated model | Independent model | ||||
| 0 | 1 | 0 | 1 | ||
| 0 | 0 | ||||
| 1 | 1 | ||||
The rows indicate the states of food and the columns food . 0 and 1 mean eat and not eat respectively. The left table describes the probability distribution of four-states Bernoulli trial for each eating occasion. As the special case of the left table, the model in which intakes of food and are independent is shown in the right table. The inclusion of the right model in the left model is represented by and . Food and are significantly combined if is rejected.
Appendix D
Consolidation of FFQ items:
In food frequency questionnaire (FFQ) data, participants are asked frequency of intakes for 128 foods in the same format of multiple-choice question. Among these 128 items, 17 items are duplicated in terms of foodstuffs but subdivided by cooking methods. We consolidated these 17 items into 4 items: beef (steak, broiled, stir-fries, stewing), pork (stir-fries, deep-fried, stewing, simmered, soup, liver), chicken (broiled, stir-fries, simmered, deep-fried, liver), and bean curd (miso soup, boiled tofu).
To sum up the intake frequencies of each subdivided item, we considered the totals of the lower (upper)-limits of stratum for subdivided items as the lower (upper)-limits of stratum for consolidated item. The lower- and upper-limits of stratum are indicated in Table A1. An example is following:
An example
| Beef steak: less than 1 per month | Beef: | |||
| Beef broiled: 1~2 per month | ||||
| Beef stir-fries: 1~2 per week | ||||
| Beef stewing: 1~2 per month |
Appendix E
Table A2.
List of food items.
| Meats 1. beef 2. pork 3. chicken 4. ham 5. sausage 6. bacon Fishes and shellfishes 7. salted fish 8. dried fish 9. canned tuna 10. salmon, trout 11. tunas, bonito 12. amberjack 13. pollack, flatfish 14. sea breams 15. horse mackerel, sardine 16. pacific saury, mackerel 17. shirasuboshi 18. cod roe, salmon roe 19. eel 20. squid 21. octopus 22. shrimp 23. clam, corb shell 24. fish sausage (chikuwa) 25. boiled fish paste (kamaboko) 26. fried fish paste (satsuma-age) Eggs and dairy products 27. low fat milk 28. milk 29. egg 30. cheeses 31. yogurt Pulses 32. bean curd 33. bean curd (koya-tofu) 34. fried bean curd 35. deep-fried bean curd 36. fermented soybeans |
Fruits 37. mandarin 38. other oranges 39. apple 40. persimmon 41. strawberry 42. grapes 43. melon 44. watermelon 45. peach 46. pears 47. kiwi fruit 48. pineapple 49. banana Vegetables 50. pickled radish 51. pickled green vegetables 52. pickled plum 53. pickled Chinese cabbage 54. pickled cucumber 55. pickled eggplant 56. pickled turnip 57. carrot 58. spinach 59. pumpkin 60. cabbage 61. radish 62. green pepper 63. tomatoes 64. long green onion 65. leek 66. green chive 67. green vegetable (shungiku) 68. green vegetable (komatsuna) 69. broccoli 70. onion 71. cucumber 72. eggplant 73. Chinese cabbage 74. burdock 75. bean sprout 76. snap bean 77. lettuce 78. green asparagus 79. garlic |
Cereals 80. bread 81. Japanese noodles (udon) 82. Japanese noodles (soba) 83. Chinese noodles 84. pasta 85. Japanese noodles (soumen) 86. rice cake Potatoes 87. sweet potatoes 88. potatoes 89. taros 90. yams 91. konjac Confectioneries 92. Japanese cake 93. cakes 94. biscuit, cookie 95. chocolate 96. ice cream 97. snacks 98. rice cracker Miscellaneous 99. sesame 100. peanuts 101. mushroom (shitake) 102. mushroom (enokitake) 103. mushroom (shimeji) 104. seaweed (wakame) 105. seaweed (hijiki) 106. dried seaweed (nori) 107. butter 108. margarine 109. jam 110. salad dressings 111. mayonnaise 112. Worcester sauce 113. ketchup 114. mustard 115. wasabi |
References
- Chen, P.-J.; Antonelli, M. Conceptual Models of Food Choice: Influential factors related to foods, individual differences, and society. Foods 2020, 9, 1898. [Google Scholar] [CrossRef]
- Van Dyke, N.; Murphy, M.; Drinkwater, E.J. We know what we should be eating, but we don’t always do that. How and why people eat the way they do: A qualitative study with rural Australians. BMC Public Health 2024, 24, 1240. [Google Scholar] [CrossRef] [PubMed]
- Mai, R.; Hoffmann, S.; Hoppert, K.; Schwarz, P.; Rohm, H. The spirit is willing, but the flesh is weak: The moderating effect of implicit associations on healthy eating behaviors. Food Qual. Prefer. 2015, 39, 62–72. [Google Scholar] [CrossRef]
- Kagami-Katsuyama, H.; Sato-Ueshima, M.; Satoh, K.; Tousen, Y.; Takimoto, H.; Maeda-Yamamoto, M.; Nishihira, J. The relationship between mental and physical minor health complaints and the intake of dietary nutrients. Nutrients 2023, 15, 865. [Google Scholar] [CrossRef]
- Brandes, U.; Delling, D.; Gaertler, M.; Gorke, R.; Hoefer, M.; Nikoloski, Z.; Wagner, D. On modularity clustering. IEEE Transactions on Knowledge and Data Engineering 2008, 20, 2, 172–188. [Google Scholar] [CrossRef]
- Shimomitsu, T.; Haratani, T.; Nakamura, K.; Kawakami, N.; Hayashi, T.; Hiro, H. The final development of the Brief Job Stress Questionnaire mainly used for assessment of the individuals. In Ministry of Labor Sponsored Grant for the Prevention of Work-related Illness: The 1999 report; Kato, M. Ed.; Tokyo: Tokyo Medical University, 126–164. (in Japanese language).
- Inoue, A.; Kawakami, N.; Shimomitsu, T.; Tsutsumi, A.; Haratani, T.; Yoshikawa, T.; Shimazu, A.; Odagiri, Y. Development of a short questionnaire to measure an extended set of job demands, job resources, and positive health outcomes: The New Brief Job Stress Questionnaire, Industrial Health, 2014, 52, 3, 175-189. [CrossRef]
- Holder, M.D. The Contribution of Food Consumption to Well-Being. Ann. Nutr. Metab. 2019, 74, 44–52. [Google Scholar] [CrossRef] [PubMed]
- Nishi, D.; Suzuki, Y.; Nishida, J.; Mishima, K.; Yamanouchi, Y. Personal lifestyle as a resource for work engagement. Jour. Occupational Health 2017, 59, 17–23. [Google Scholar] [CrossRef]
- Deaton, A.; Muellbauer, J. An Almost Ideal Demand System. Am. Econ. Rev. 1980, 70, 312–326. [Google Scholar]
- Hoenink, J.C.; Waterlander, W.E.; Mackenbach, J.D.; Mhurchu, C.N.; Wilson, N.; Beulens, J.W.J.; Nghiem, M. Impact of taxes on purchases of close substitute foods: analysis of cross-price elasticities using data from a randomized experiment. Nutr J. 2021, 20, 75. [Google Scholar] [CrossRef]
- Tian, Y.; Lautz, S.; Wallis, A.O.G.; Lambiotte, R. Extracting complements and substitutes from sales data: a network perspective. EPJ Data Sci. 2021, 10, 45. [Google Scholar] [CrossRef]
Figure 1.
a). Food combination network for female. See Table A2 for label numbers of nodes. The size of vertex is proportional to the sum of degree of simultaneous intakes
Figure 1.
a). Food combination network for female. See Table A2 for label numbers of nodes. The size of vertex is proportional to the sum of degree of simultaneous intakes
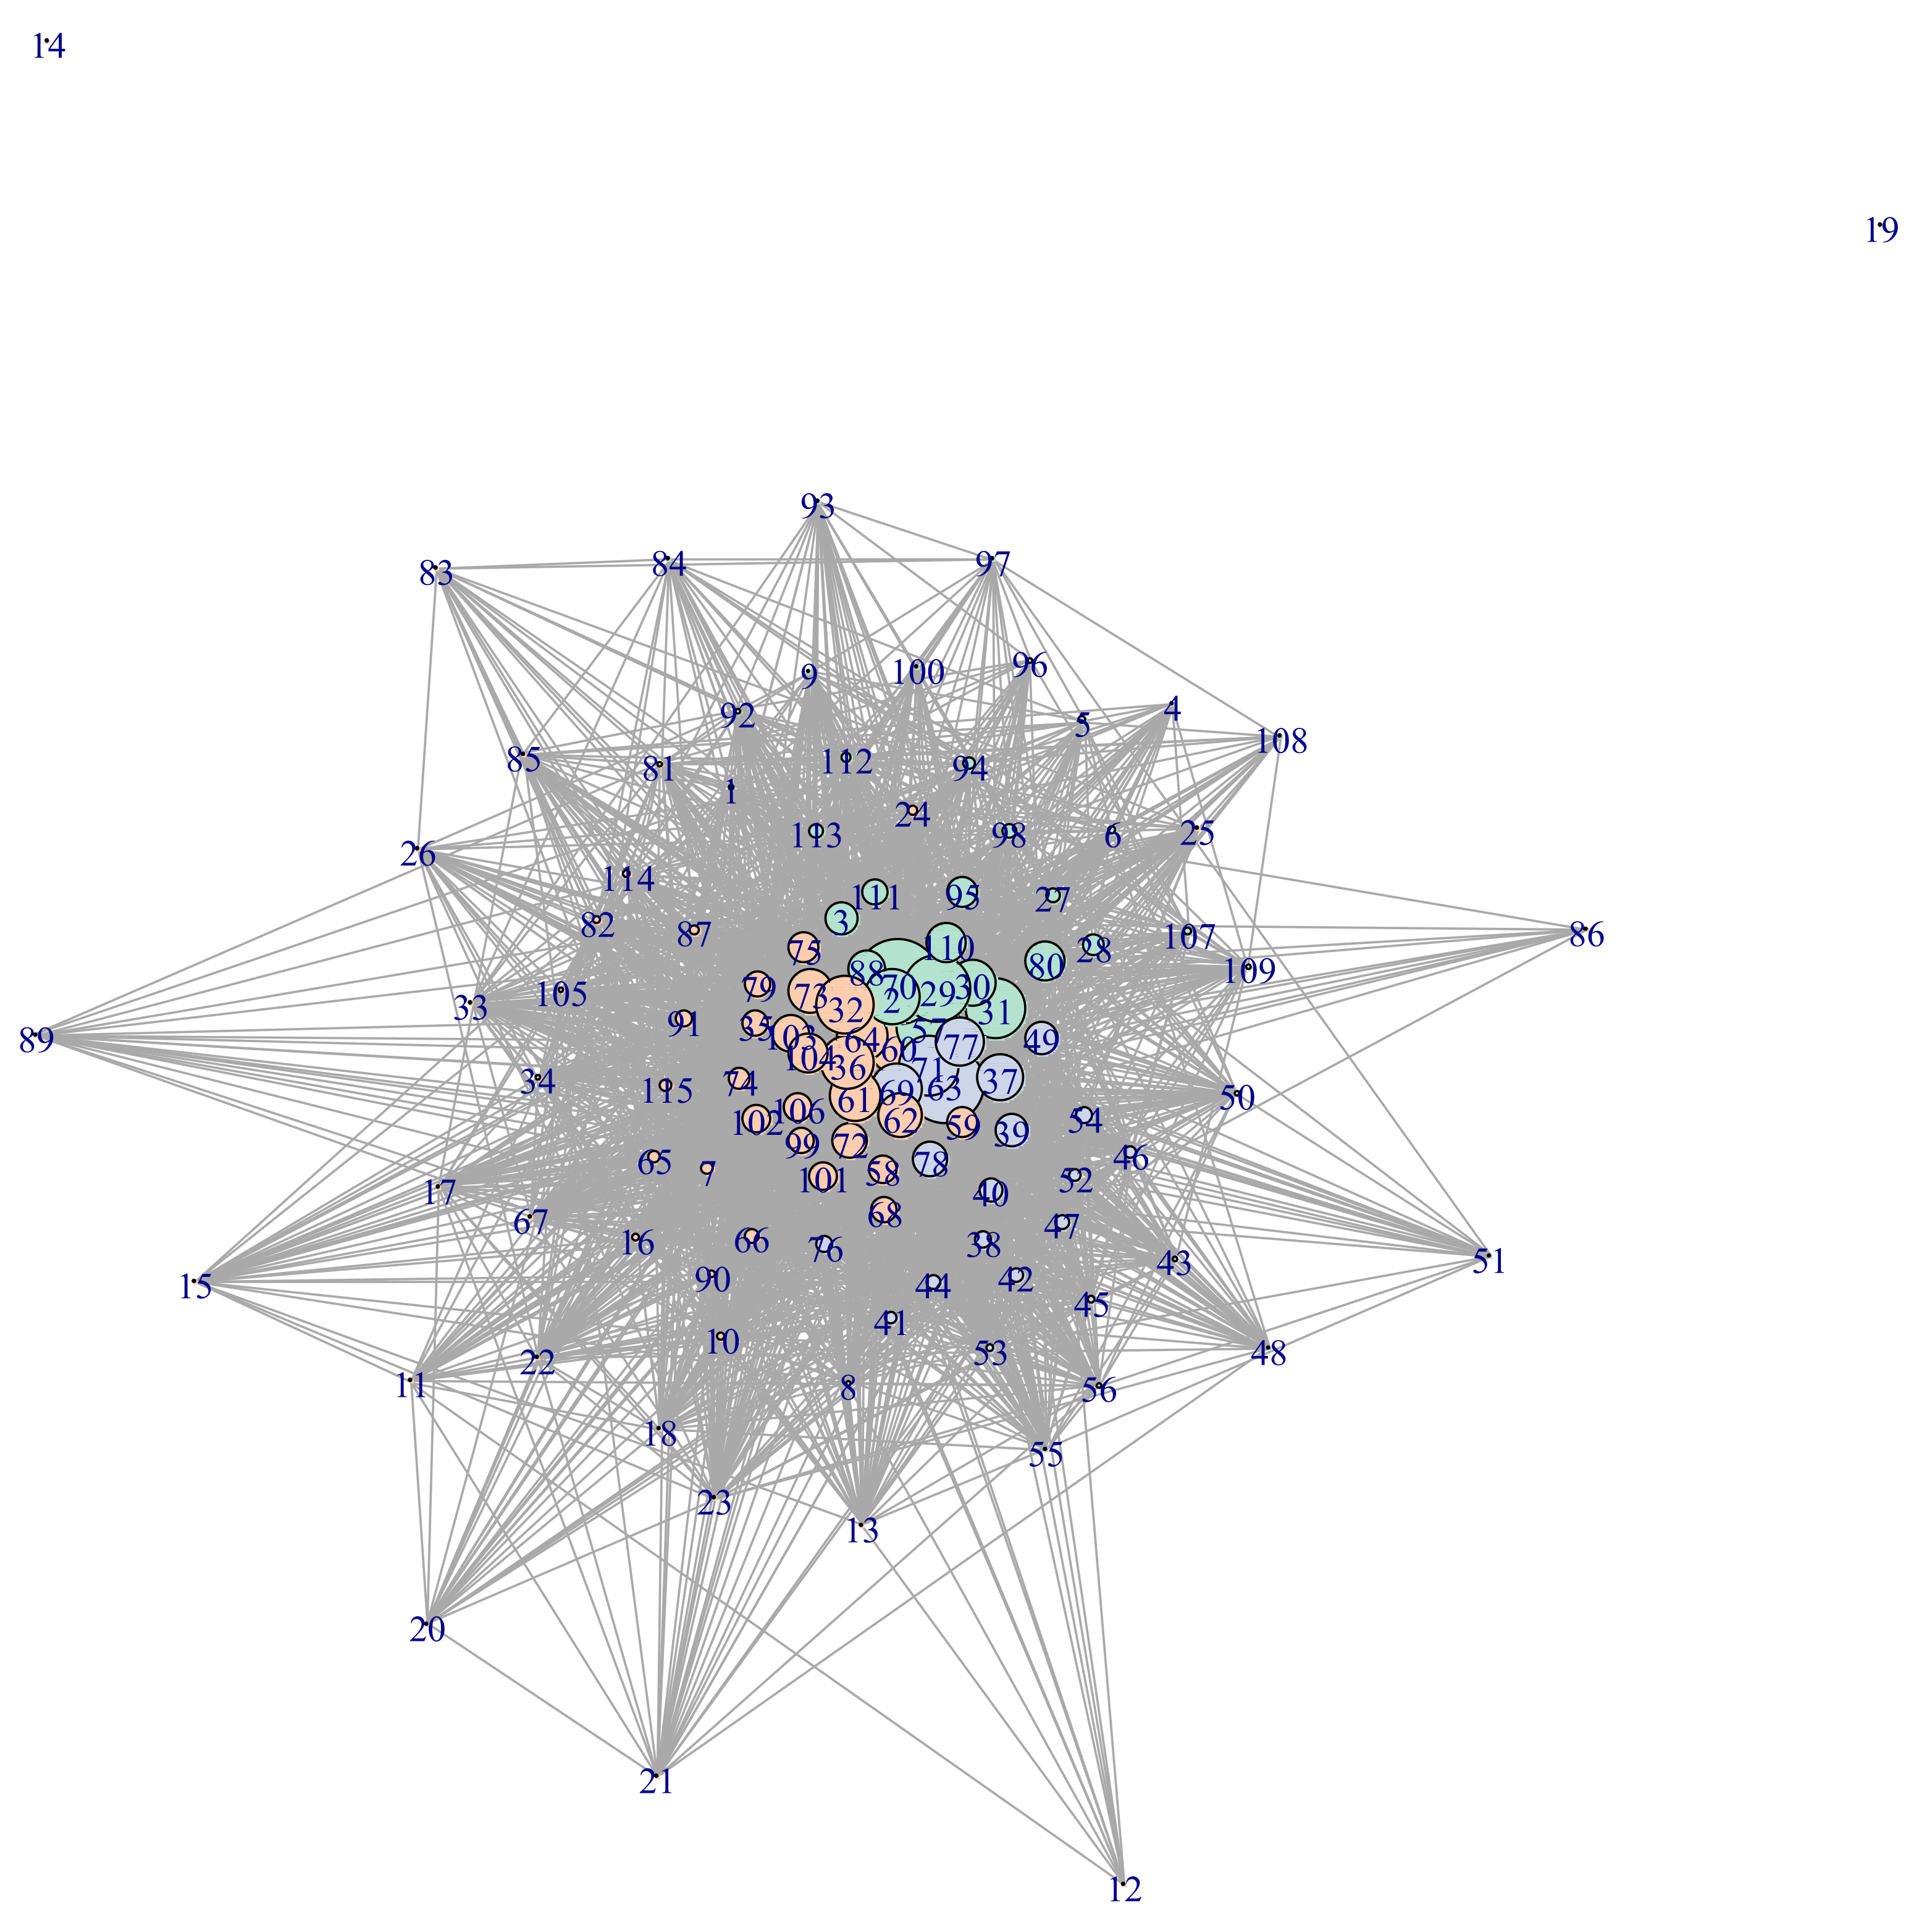
Figure 2.
b). Food combination network for male. See Table A2 for label numbers of nodes. The size of vertex is proportional to the sum of degree of simultaneous intakes
Figure 2.
b). Food combination network for male. See Table A2 for label numbers of nodes. The size of vertex is proportional to the sum of degree of simultaneous intakes
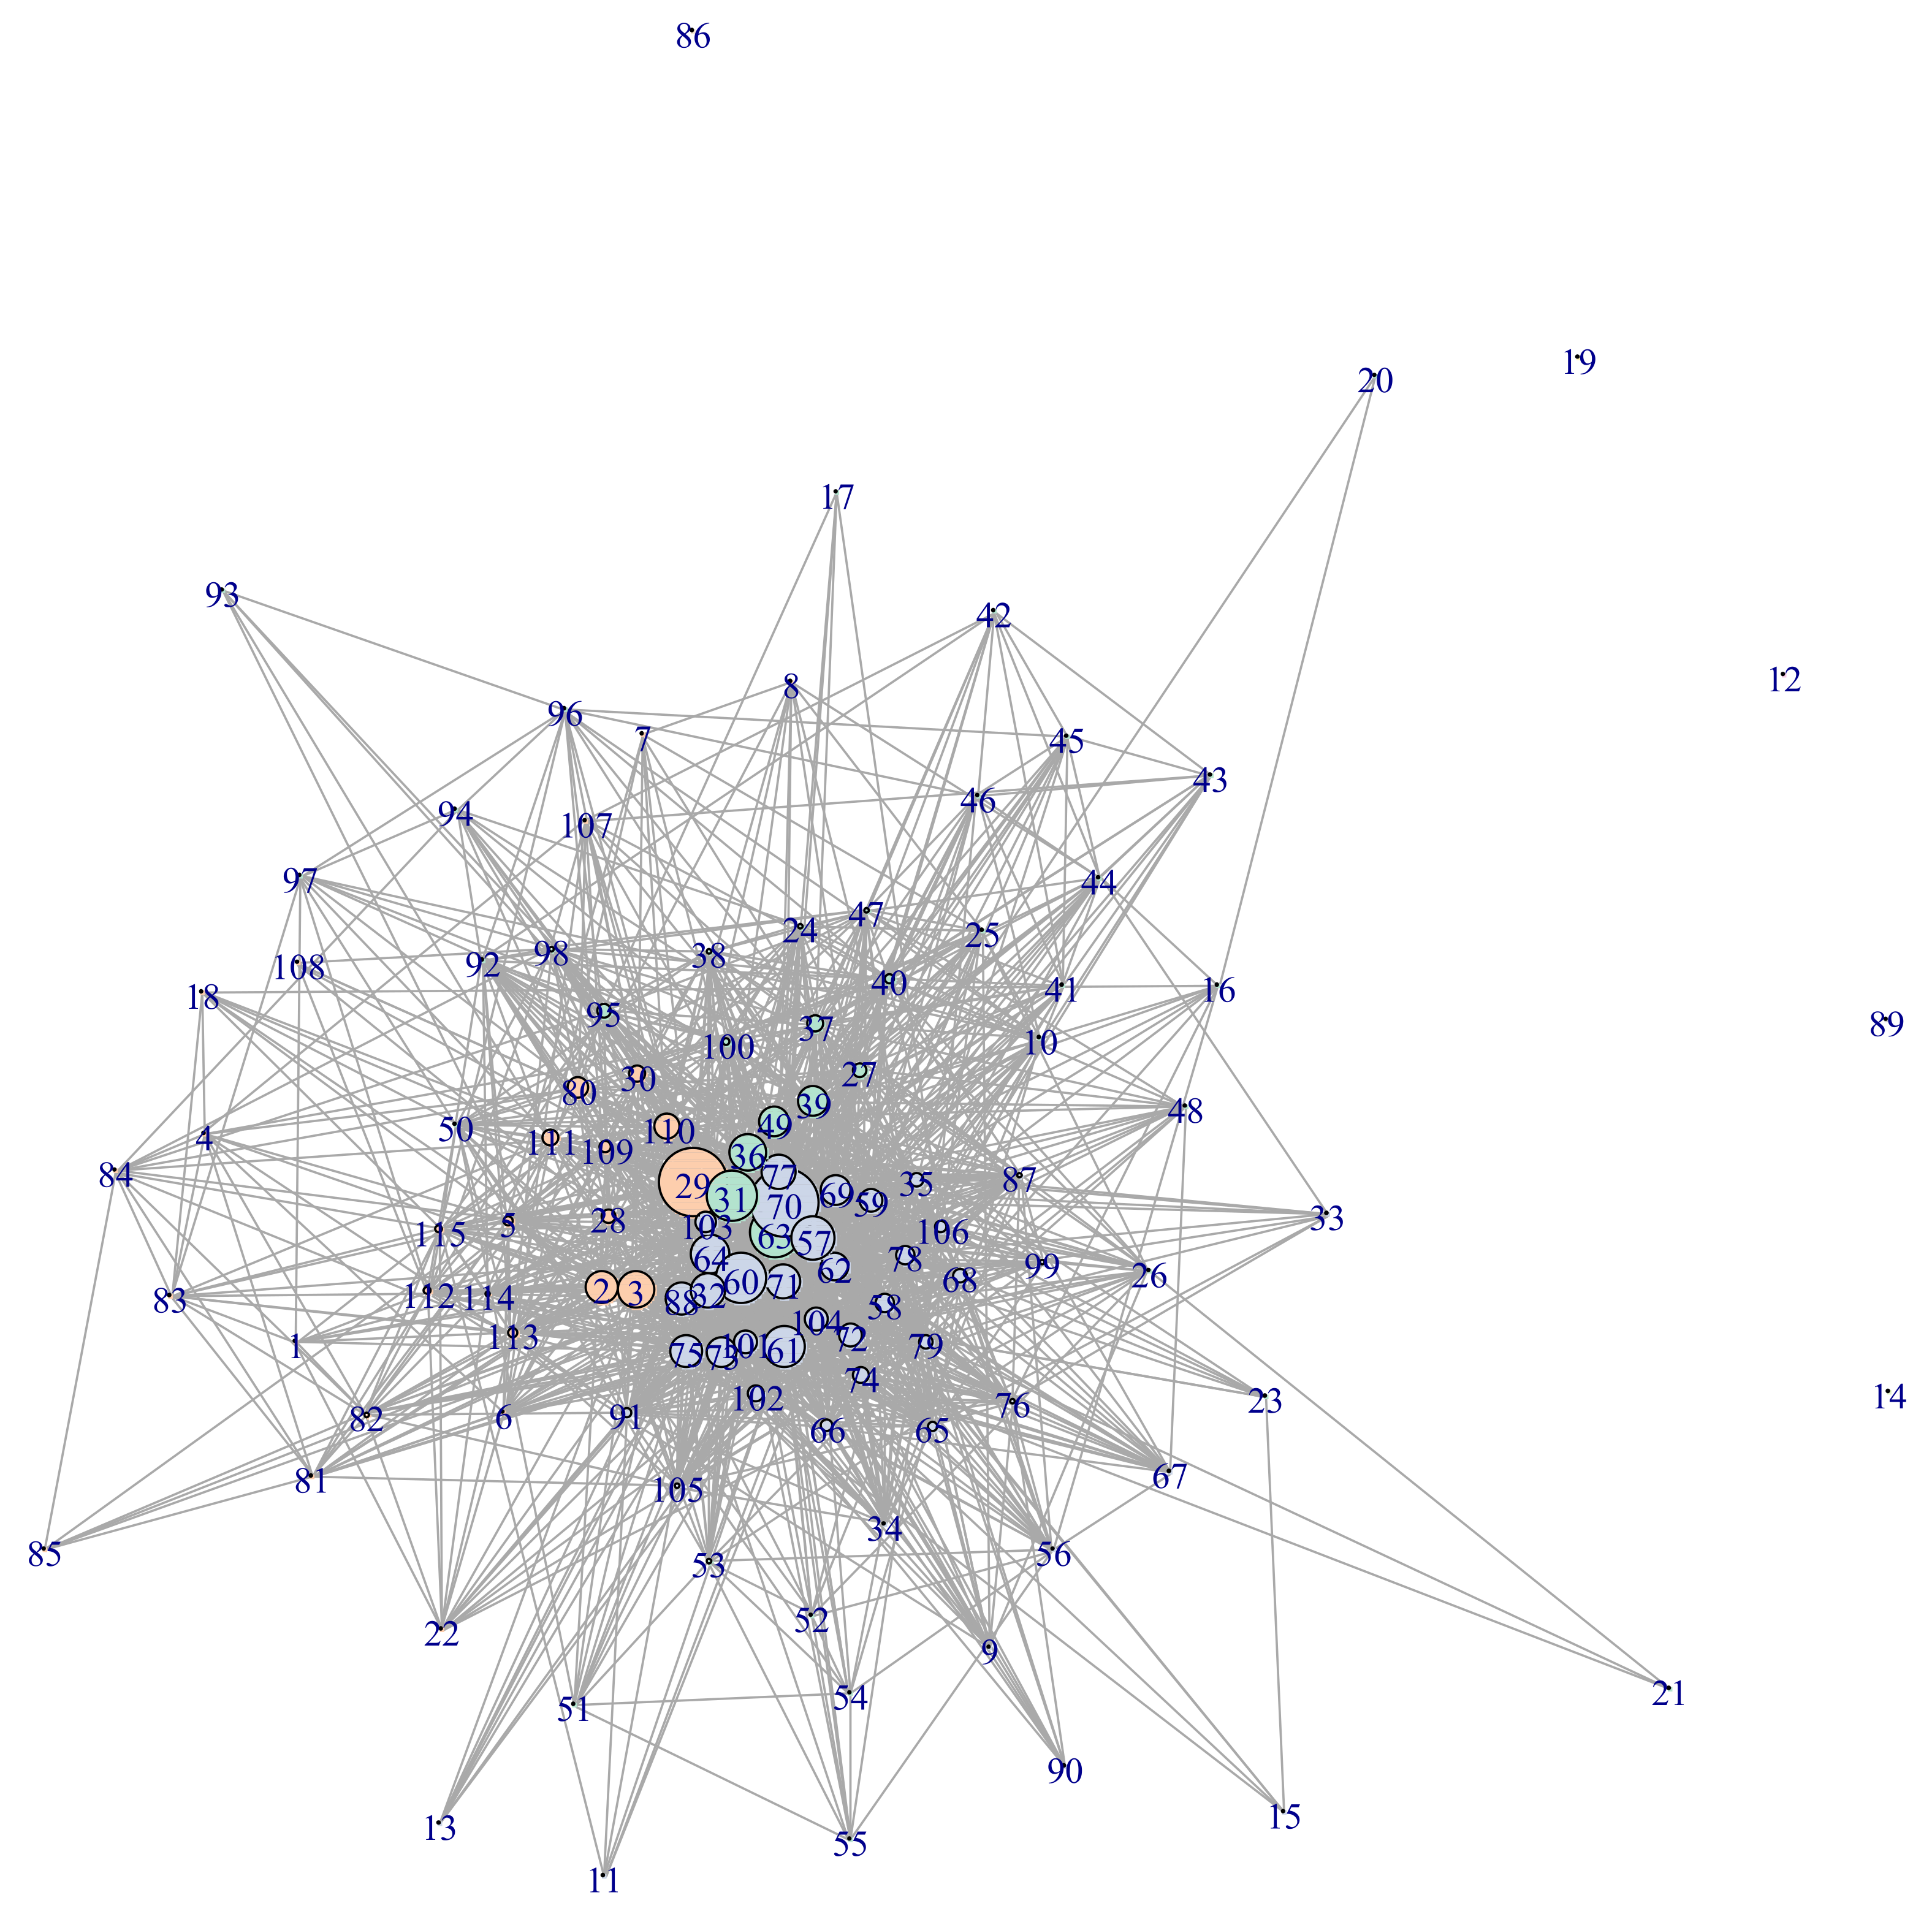
Table 1.
The number of significant combinations.
| 0.01 | 0.05 | 0.10 | ||||
|---|---|---|---|---|---|---|
| Female | 3,560 | (54.3%) | 4,417 | (67.4%) | 4,863 | (74.2%) |
| Male | 1,716 | (26.2%) | 2,527 | (38.6%) | 3,110 | (47.4%) |
Note: The number of pairs with significant positive excess degree of combination by significant level . The number of all pairs of two foods out of 115 items is 6,555.
Table 2.
Top 10 list of excess degree of combination .
| Female | ||||||||
| Food | Food | p-value | ||||||
| carrot | onion | 0.98 | 1.94 | 1.77 | 1.28 | 0.00 | 0.01 | 0.01 |
| tomatoes | cucumber | 2.23 | 0.96 | 1.64 | 1.16 | 0.00 | 0.02 | 0.00 |
| pork | chicken | 1.71 | 1.33 | 1.42 | 1.01 | 0.00 | 0.00 | 0.00 |
| long green onion | onion | 1.02 | 2.30 | 1.42 | 0.99 | 0.00 | 0.00 | 0.01 |
| cabbage | onion | 1.15 | 2.26 | 1.44 | 0.98 | 0.00 | 0.01 | 0.01 |
| tomatoes | onion | 2.31 | 2.13 | 1.59 | 0.90 | 0.00 | 0.02 | 0.01 |
| cabbage | radish | 1.47 | 0.75 | 1.11 | 0.88 | 0.00 | 0.01 | 0.00 |
| tomatoes | lettuce | 2.63 | 0.90 | 1.24 | 0.85 | 0.00 | 0.02 | 0.00 |
| radish | onion | 0.70 | 2.53 | 1.16 | 0.83 | 0.00 | 0.00 | 0.01 |
| carrot | cabbage | 1.57 | 1.41 | 1.17 | 0.83 | 0.00 | 0.01 | 0.01 |
| Male | ||||||||
| Food | Food | p-value | ||||||
| pork | chicken | 1.27 | 1.21 | 1.65 | 1.25 | 0.00 | 0.00 | 0.00 |
| carrot | onion | 0.65 | 1.69 | 1.58 | 1.23 | 0.00 | 0.00 | 0.01 |
| long green onion | onion | 0.70 | 1.77 | 1.52 | 1.17 | 0.00 | 0.00 | 0.01 |
| egg | onion | 2.89 | 1.44 | 1.88 | 1.12 | 0.00 | 0.03 | 0.01 |
| tomatoes | onion | 1.56 | 1.80 | 1.44 | 0.98 | 0.00 | 0.00 | 0.01 |
| cabbage | onion | 1.39 | 1.91 | 1.35 | 0.93 | 0.00 | 0.00 | 0.01 |
| egg | cabbage | 3.21 | 1.24 | 1.55 | 0.92 | 0.00 | 0.03 | 0.00 |
| carrot | radish | 1.18 | 0.67 | 1.04 | 0.86 | 0.00 | 0.00 | 0.00 |
| radish | onion | 0.59 | 2.12 | 1.12 | 0.86 | 0.00 | 0.00 | 0.01 |
| egg | pork | 3.22 | 1.45 | 1.52 | 0.85 | 0.00 | 0.03 | 0.00 |
Table 3.
Food groups divided based on propensity to combination.
| 1 | 2 | 3 | 4 | 5 | |
|---|---|---|---|---|---|
| 1 | yogurt (29.0, 33.2), chocolate (8.2, 17.7), low fat milk (8.5, 8.5), rice cracker (3.7, 8.2), biscuit, cookie (1.7, 7.5), peanuts (5.5, 2.6), Japanese cake (1.9, 3.4), ice cream (1.4, 3.2), snacks (1.6, 2.9), cakes (0.3, 1.3) |
fermented soybeans (20.5, 30.0), fish sausage (chikuwa) (3.4, 5.9), salmon, trout (1.8, 4.4), pacific saury, mackerel (0.9, 4.8), boiled fish paste (kamaboko) (1.9, 2.1), fried fish paste (satsuma-age) (1.7, 1.4), clam, corb shell (0.7, 1.9), shirasuboshi (0.3, 2.0), squid (0.1, 0.6), octopus (0.1, 0.5) |
tomatoes (28.9, 44.2), mandarin (10.5, 25.9), apple (17.1, 19.2), banana (17.6, 18.1), persimmon (5.8, 13.8), other oranges (3.9, 10.0), kiwi fruit (4.0, 8.5), pickled cucumber (1.6, 9.7), watermelon (2.0, 8.3), pears (1.8, 8.0), grapes (1.2, 8.4), strawberry (2.0, 7.0), pickled plum (1.7, 7.0), pickled Chinese cabbage (3.3, 5.0), peach (1.2, 5.6), pickled radish (2.2, 3.6), melon (0.9, 4.0), pickled eggplant (0.9, 2.8), pineapple (1.3, 2.0), pickled green vegetables (1.0, 0.7) |
||
| 2 | egg (38.5, 37.5), pork (18.5, 30.8), chicken (20.9, 19.3), salad dressings (15.3, 22.3), cheeses (9.5, 26.0), bread (12.7, 22.4), mayonnaise (10.2, 14.4), milk (8.3, 11.9), ketchup (6.3, 8.8), jam (7.7, 4.3), Worcester sauce (5.2, 6.3), sausage (6.5, 4.6), bacon (3.0, 5.2), butter (2.0, 5.4), beef (2.7, 4.4), ham (1.1, 2.6), margarine (1.3, 2.4), pasta (1.4, 1.7) |
wasabi (5.5, 8.0), salted fish (1.3, 7.7), mustard (4.0, 4.5), Japanese noodles (soba) (3.4, 4.5), Japanese noodles (udon) (2.3, 4.1), dried fish (0.7, 3.8), shrimp (1.2, 1.9), cod roe, salmon roe (0.7, 2.3), Chinese noodles (1.8, 1.1), Japanese noodles (soumen) (0.4, 1.9) |
|||
| 3 | onion (38.6, 46.8), carrot (24.6, 36.7), potatoes (18.3, 21.7), canned tuna (1.0, 2.9) |
cabbage (28.8, 33.8), bean curd (19.8, 32.9), radish (23.0, 29.3), long green onion (21.8, 28.2), Chinese cabbage (17.9, 24.9), green pepper (16.6, 24.7), bean sprout (18.6, 17.9), seaweed (wakame) (13.7, 21.9), mushroom (shimeji) (13.0, 20.8), eggplant (13.4, 20.0), pumpkin (13.1, 17.7), mushroom (shitake) (13.7, 16.6), spinach (10.6, 16.5), mushroom (enoki) (10.3, 16.0), garlic (9.1, 14.9), deep-fried bean curd (9.1, 14.7), dried seaweed (nori) (7.7, 16.0), green vegetable (komatsuna) (8.4, 14.9), burdock (9.9, 12.8), sesame (3.7, 14.9), konjac (5.9, 10.5), green chive (7.6, 8.3), leek (5.8, 7.1), sweet potatoes (3.7, 6.0), seaweed (hijiki) (3.8, 4.3), fried bean curd (2.9, 4.1), yams (0.5, 5.4), green vegetable (shungiku) (1.1, 3.1), bean curd (koya-tofu) (0.6, 3.0), pollack, flatfish (0.4, 1.7), tunas, bonito (0.4, 1.1), horse mackerel, sardine (0.2, 0.6) |
cucumber (19.5, 33.7), lettuce (20.4, 27.1), broccoli (17.6, 28.4), green asparagus (10.6, 19.7), snap bean (4.3, 10.4), pickled turnip (1.9, 3.7) |
||
| 4 | amberjack (0.0, 0.2) | ||||
| 5 | rice cake (0.0, 0.4) | ||||
| 6 | taros (0.0, 0.3) | ||||
| 7 | sea breams (0.0, 0.0) |
||||
| 8 | eel (0.0, 0.0) |
Note: Grouping of food items for male (rows) and female (columns). The values in parenthesis are the sum of degree of simultaneous intakes for male and female in order.
Table 4.
Ordered logit regression.
| (a) Female | ||||||||||||
| X1 (energy) | X2 (carb) | X3 (protein) | X4 (lipid) | |||||||||
| 1 | 2 | 3 | 1 | 2 | 3 | 1 | 2 | 3 | 1 | 2 | 3 | |
| Vigor | ||||||||||||
| Very active | - | - | ||||||||||
| Full of energy | + | |||||||||||
| Lively | - | + | + | - | + | |||||||
| Anger-irritability | ||||||||||||
| Angry | - | - | ||||||||||
| Inwardly annoyed or aggravated | ||||||||||||
| Irritable | ++ | ++ | ||||||||||
| Fatigue | ||||||||||||
| Extremely tired | -- | -- | - | |||||||||
| Exhausted | - | |||||||||||
| Weary or listless | ||||||||||||
| Anxiety | ||||||||||||
| Tense | ||||||||||||
| Worried or insecure | ++ | + | + | |||||||||
| Restless | ++ | -- | ++ | +++ | - | -- | ||||||
| Depression | ||||||||||||
| Depressed | ||||||||||||
| Doing anything was a hassle | ||||||||||||
| Unable to concentrate | + | + | + | |||||||||
| Gloomy | ++ | + | +++ | |||||||||
| Unable to handle work | ||||||||||||
| Sad | + | |||||||||||
| Physical stress reaction | ||||||||||||
| Dizzy | ||||||||||||
| Joint pains | + | |||||||||||
| Headaches | ||||||||||||
| A stiff neck and/or shoulders | ||||||||||||
| Lower back pain | ||||||||||||
| Eyestrain | ||||||||||||
| Heart palpitations or shortness of breath | + | |||||||||||
| Stomach and/or intestine problems | -- | + | ||||||||||
| Lost my appetite | - | - | ||||||||||
| Diarrhea and/or constipation | -- | - | ++ | |||||||||
| Unable to sleep well | ++ | ++ | ||||||||||
| (b) male | ||||||||||||
| X1 (energy) | X2 (carb) | X3 (protein) | X4 (lipid) | |||||||||
| 1 | 2 | 3 | 1 | 2 | 3 | 1 | 2 | 3 | 1 | 2 | 3 | |
| Vigor | ||||||||||||
| Very active | + | + | ||||||||||
| Full of energy | + | |||||||||||
| Lively | ||||||||||||
| Anger-irritability | ||||||||||||
| Angry | -- | + | + | - | -- | -- | ||||||
| Inwardly annoyed or aggravated | + | - | ||||||||||
| Irritable | + | + | +++ | - | - | |||||||
| Fatigue | ||||||||||||
| Extremely tired | ++ | |||||||||||
| Exhausted | ++ | + | ||||||||||
| Weary or listless | ++ | |||||||||||
| Anxiety | ||||||||||||
| Tense | - | - | - | - | -- | - | ||||||
| Worried or insecure | ||||||||||||
| Restless | ||||||||||||
| Depression | ||||||||||||
| Depressed | -- | ++ | -- | |||||||||
| Doing anything was a hassle | -- | + | -- | + | ||||||||
| Unable to concentrate | ||||||||||||
| Gloomy | ||||||||||||
| Unable to handle work | ||||||||||||
| Sad | ||||||||||||
| Physical stress reaction | ||||||||||||
| Dizzy | ++ | ++ | ||||||||||
| Joint pains | ++ | + | ||||||||||
| Headaches | - | |||||||||||
| A stiff neck and/or shoulders | - | ++ | ||||||||||
| Lower back pain | + | + | ||||||||||
| Eyestrain | - | - | ||||||||||
| Heart palpitations or shortness of breath | + | + | ||||||||||
| Stomach and/or intestine problems | -- | -- | -- | +++ | ||||||||
| Lost my appetite | + | |||||||||||
| Diarrhea and/or constipation | --- | -- | --- | -- | ||||||||
| Unable to sleep well | - | - | -- | - | ||||||||
Note: Signs and significances of estimated coefficients of ordered logit model regressing health of mind on dependences on each food group. The number of signs denotes the significance of coefficients. One for 10%, two for 5%, tree for 1%. X1 (energy) through X4 (lipid) are substitute measures for dependence on each of 3 food groups shown in Table 3. X1 (energy), for example, is rate of energy took from each food group.
Disclaimer/Publisher’s Note: The statements, opinions and data contained in all publications are solely those of the individual author(s) and contributor(s) and not of MDPI and/or the editor(s). MDPI and/or the editor(s) disclaim responsibility for any injury to people or property resulting from any ideas, methods, instructions or products referred to in the content. |
© 2024 by the authors. Licensee MDPI, Basel, Switzerland. This article is an open access article distributed under the terms and conditions of the Creative Commons Attribution (CC BY) license (http://creativecommons.org/licenses/by/4.0/).
Copyright: This open access article is published under a Creative Commons CC BY 4.0 license, which permit the free download, distribution, and reuse, provided that the author and preprint are cited in any reuse.