Submitted:
13 June 2024
Posted:
14 June 2024
You are already at the latest version
Abstract
This study aims to quantify greenhouse gas (GHG) emissions from China's sludge treatment industry and explore the potential of novel technologies to mitigate these emissions, promoting sustainable sludge management practices. Using a life cycle assessment approach, the total GHG emissions from sludge treatment in 2017 were estimated at 18.54 Mt CO2-eq, with significant regional variations. Incineration contributed the highest emissions (1,011.53 kg CO2-eq/t dry sludge), followed by landfill (717.51 kg CO2-eq/t) and land application (276.41 kg CO2-eq/t). The uneven distribution of emissions across cities highlights the need for targeted mitigation strategies that consider local sustainability challenges. Principal component analysis revealed that economic factors and treatment scale significantly influence emissions, emphasizing the importance of integrating sustainability goals with economic development. To reduce the carbon footprint of sludge treatment and enhance sustainability, the mitigation potential and costs of various technologies were evaluated, including thermal conversion, anaerobic digestion, hydrothermal processes, and wet oxidation. These technologies offer GHG emission reductions ranging from 0.09 to 0.46 t CO2-eq/t dry solids compared to conventional methods, while also promoting resource recovery and circular economy principles. However, further optimization is necessary to enhance their environmental and economic performance, ensuring long-term sustainability. By implementing these technologies and adopting optimization strategies, China's sludge treatment industry can significantly contribute to achieving the country's carbon neutrality goal and fostering sustainable development.
Keywords:
Greenhouse gas emission
; life cycle assessment
; sludge management
; sustainability.
1. Introduction
Sludge management has become a critical issue in China due to rapid urbanization and population growth. As a byproduct of wastewater treatment, sludge contains a variety of pollutants, such as heavy metals, pathogens, and organic contaminants, which pose significant risks to human health and the environment if not properly treated [1]. In 2020, China generated approximately 55 million tonnes of wet sludge, and this figure is expected to reach 60 million tonnes by 2025 [2]. The treatment and disposal of such a large volume of sludge not only require substantial energy and financial resources but also contribute significantly to greenhouse gas (GHG) emissions. It is estimated that sludge treatment accounts for 40% of the total GHG emissions from the wastewater sector in China [3]. Therefore, sustainable sludge management strategies that minimize GHG emissions while ensuring safe and efficient treatment are urgently needed.
Recent studies have attempted to quantify GHG emissions from sludge treatment in China. For example, Guo et al. [4] estimated that the total GHG emissions from sludge treatment in China reached 18.6 million tonnes of CO2 equivalent (CO2-eq) in 2018, with anaerobic digestion and landfilling being the primary contributors. Similarly, Liu et al. [1] reported that the GHG emissions from sludge incineration in China amounted to 5.2 million tonnes of CO2-eq in 2017. However, these estimations often have limitations due to unclear system boundaries and methodological inconsistencies. Many studies only consider direct emissions from sludge treatment processes while neglecting indirect emissions from energy consumption, transportation, and disposal of treatment residues [5]. Moreover, the emission factors used in these calculations are often based on default values or limited local data, which may not reflect the actual emission levels under different treatment conditions. Therefore, a comprehensive and systematic re-evaluation of GHG emissions from sludge treatment in China is necessary to provide a more accurate and reliable basis for decision-making.
Traditionally, landfilling and composting have been the most common methods for sludge disposal in China due to their simplicity and low cost. However, these methods have significant drawbacks in terms of environmental sustainability and GHG emissions. Landfilling of sludge can lead to the release of methane (CH4), a potent GHG with a global warming potential 28 times higher than CO2 [6]. In addition, landfilling requires large areas of land and may cause groundwater contamination if not properly managed [7]. Composting, on the other hand, can reduce the volume of sludge and produce valuable fertilizer, but it also emits GHGs such as CH4 and nitrous oxide (N2O) during the decomposition process [1]. To overcome these limitations, various novel sludge treatment technologies have been developed and implemented in recent years. For instance, thermal treatment methods such as incineration, pyrolysis, and gasification can effectively reduce sludge volume and destroy pathogens while recovering energy [4]. Advanced anaerobic digestion techniques, such as temperature-phased anaerobic digestion (TPAD) and anaerobic membrane bioreactors (AnMBR), can enhance biogas production and nutrient recovery from sludge [8]. However, the GHG emission reduction potential of these emerging technologies compared to traditional methods remains largely unknown, hindering their widespread adoption.
This study aims to provide a comprehensive assessment of GHG emissions from the sludge treatment industry in China and explore the potential of novel technologies to reduce these emissions. Firstly, we will estimate the total GHG emissions from sludge treatment in China using a life cycle assessment (LCA) approach, considering both direct and indirect emissions from various treatment processes. The spatial distribution of these emissions across different provinces will be analysed to identify regional hotspots and priorities for emission reduction. Secondly, we will investigate the influence of socio-economic factors, such as GDP, population density, and urbanization rate, on the regional variation of sludge treatment emissions. This analysis will provide insights into the drivers of sludge generation and treatment practices in different parts of China. Finally, we will evaluate the GHG emission reduction potential of selected novel sludge treatment technologies, including thermal treatment, advanced anaerobic digestion, and wet oxidation. The environmental and economic performance of these technologies will be compared with traditional methods to assess their feasibility and sustainability. By quantifying the GHG emissions from sludge treatment and exploring innovative mitigation strategies, this study aims to contribute to the development of a low-carbon and sustainable sludge management system in China.
2. Materials and Methods
2.1. System Boundary and Data Sources
A life-cycle sludge treatment industry begins with sludge collection from WWTPs, followed by treatment and disposal, as depicted in Figure 1. Traditional sludge treatment and disposal methods include landfill, incineration, building materials application, and land application. In China, due to limited data, the primary methods are considered landfill, incineration, and land application, referred to as solid waste treatment [9]. CH4 emissions from sludge AD are not calculated in this study due to their minimal application (nearly 3%) at WWTPs in China [10]. The geographical scope covers the 31 provincial administrative districts in mainland China. Based on regional economic zones, China is divided into six regions in this study:
Northern region: Beijing, Tianjin, Hebei, Shanxi, Inner Mongolia, and Shandong.
Northeastern region: Liaoning, Jilin, and Heilongjiang.
Eastern region: Shanghai, Jiangsu, Zhejiang, Anhui, and Fujian.
Central region: Jiangxi, Henan, Hubei, Hunan, Chongqing, and Sichuan.
Southern region: Guangdong, Guangxi, Hainan, Guizhou, and Yunnan.
Northwestern region: Tibet, Shaanxi, Gansu, Qinghai, Ningxia, and Xinjiang.
The base year of 2017 was used for GHG emission quantification from the sludge treatment industry in this study. Data on urban population, population density, GDP, daily water consumption, fixed investment, sewer density, sludge production, and sludge disposal methods for 660 Chinese cities were obtained from the Statistical Yearbook of Urban Construction [9]. These data were used to calculate GHG emissions from wastewater collection and sludge disposal. Additionally, the regional power grid baseline emission factor for six regions in 31 provinces was collected by the Ministry of Ecological Environment [11].
2.2. GHG Emission Calculation
The total GHG emissions from the sludge treatment industry are quantified using a LCA method, as described by Equation (1):
where E is the total GHG emissions; AD represents the activity amount (e.g., volume of treated wastewater); EF is the emission factor of different processes.
On-site GHG emissions originate from direct CO2, N2O and CH4 emissions during landfill, incineration, and composting. Off-site emissions are due to electricity, chemicals, and fuel consumption during wastewater treatment, sludge transportation, and disposal [12]. GHG emissions for N2O and CH4 are expressed in CO2 equivalent (CO2-eq), with global warming potentials (GWP) of 1, 25, and 298 for CO2, N2O and CH4 respectively [6].
Total GHG emissions from different sludge disposal methods (R1: landfill; R2: incineration, and R3: composting + land application) in various cities are calculated using:
where, K1, K2, and K3 are disposal method proportions.
Specific emissions for each method are calculated as:
where, GHGCH4-1 is the CO2-eq produced during anaerobic digestion during landfill, 60.6 kg/t dry sludge (DS) [13]. CO2-bio is the biogenic CO2 emitted from landfills, 17.2 kg/t DS [14]. GHGCH4-2 and GHGN2O are the equivalent CO2 emissions of CH4 and N2O emissions from sludge incineration, 0.049 and 0.99 kg CO2-eq/t DS (IPCC, 2007). CO2-eq1 is the equivalent CO2 emitted during the sludge aerobic compost, 210 kg CO2-eq/t DS [16]. CO2-avoided is the CO2-eq from the subsequent sludge land utilization in the form of replacement chemical fertilizer, 66.8 kg CO2-eq/t DS [17]. GHGt is the CO2-eq from sludge transportation, which is presented as followed:
where Dt is the transportation distance from WWTPs to each site of three methods, which is assumed as 30 km, 70 km, and 30 km for landfill, incineration, and land application (Liu et al., 2013). The distance of incineration is longer than that of sludge landfill because incineration ash will be transported to landfill. f1, f2, and f3 are the effective EFs of average GHGs for a heavy-duty diesel truck with a 20-ton load under Chinese emission standard IV, which was 2.6 kg CO2, 1.4×10⁻⁴ kg CH4, and 1.4×10⁻⁴ kg N2O for each liter of diesel consumption, 0.2 L/km [18].
GHGdiesel is the CO2-eq of diesel use from aerobic compost and incineration, as shown in followed:
where T1 is the diesel consumption from the sludge landfill, 3.1 L diesel/ton (Chen and Kuo et al., 2016). f4, f5, and f6 are the effective EF of GHGs from diesel consumption, which was 7.4×10⁻² kg CO2, 2.5×10⁻⁵ kg CH4, and 4.5×10⁻⁴ kg N2O for each liter of diesel consumption [19].
CO2-electricity is the CO2-eq of electricity consumption from sludge landfill, incineration, and aerobic compost, which is calculated in Equation (8):
Where f7 is the EF of electricity, which was 0.785 kg CO2/kWh [16]. T2 is the electricity consumption from sludge landfill, incineration, and aerobic compost, which was 219 kWh/t DS, 70 kWh/t DS, and 730 kWh/t DS, respectively [16].
GHGcoal is the CO2-eq of coal used from aerobic compost and incineration, as shown in followed:
where T3 is the amount of coal used from aerobic compost (65 MJ/t DS) (Murray et al., 2008) and incineration (8,049 MJ/t DM) [18]. f8, f9, and f10 is the effective emission factor of CO2, CH4, and N2O of coal, which are assumed to be 0.098 kg/MJ, 0.25×10⁻⁴ kg/MJ, and 0.45×10⁻³ kg/MJ, respectively [16].
2.3. Principal Component Analysis
Because the varying measurement scales of evaluation indicators affect total GHG emissions from the sludge treatment industry, data standardization is essential. Principal Component Analysis (PCA) effectively reduces dimensionality while retaining significant information by transforming data into a new subspace with high variance [20]. The new coordinate axes are oriented based on the maximum variance from the original data. Five socio-economic indicators (population density, construction land, fixed investment, GDP, and daily water consumption) and sludge treatment characteristics were selected as input parameters. Additionally, infrastructure and operational parameters, including sewer pipeline density, treated wastewater volume, and treated sludge volume, were included.
3. Results and Discussion
3.1. Statement of Sludge Treatment Industry in China
Figure 2 illustrates the treated sludge volumes and disposal methods across 31 provinces in China [9]. The provinces of Guangdong, Beijing, and Zhejiang treated the most sludge, accounting for about 40% of the national total. Landfilling was the most common disposal method, used for 56.5% of the sludge, consistent with Zhang et al.'s (2016) finding of 50%. Nearly 40% of sludge was incinerated, while only 3.5% was composted. Cities with high GDP and large sludge production volumes tend to prefer incineration, as it effectively reduces volume despite higher costs for fuel and equipment. Notably, Jiangyin, Wuxi, Shihezi, and Dali achieved a 100% incineration rate. In East China, incineration rates were particularly high, with Jiangsu at 74.2%, Fujian at 62.3%, Zhejiang at 56.7%, Anhui at 54.7%, and Shanghai at 48.6%. Additionally, Hainan and Yunnan exhibited significant incineration rates of 68.9% and 55.2%, respectively.
Conversely, provinces with over 50% landfill rates, particularly in Northwest China, had rates exceeding 60%, with Shaanxi and Qinghai reaching 100% and 98.1%, respectively. This trend is attributed to the availability of extensive land resources and the relatively low costs associated with landfilling. Sludge composting was the least prevalent disposal method, with rates ranging from 0 to 17.3%, the highest being in Beijing (17.3%), Heilongjiang (12.6%), and Liaoning (8.2%). These trends highlight regional disparities in sludge treatment methods and volumes, reflecting the economic, geographical, and infrastructural differences across China's provinces, and emphasizing the need for tailored sludge management strategies to address regional challenges effectively [16].
3.2. Quantification of GHG Emission
In 2017, total GHG emissions from sludge treatment industry was 18.54 Mt. Various countries reported that GHG emission from sludge treatment industry ranged from 0.15 to 1.2 t CO2-eq per functional unit (e.g., per ton of dry matter or per m3 of treated wastewater) [12,14,22,23,24,25]. The main contributors to these emissions include electricity consumption, direct emissions from treatment processes, and specific treatment methods such as incineration, landfilling, and anaerobic digestion. The variations in reported emissions can be attributed to differences in treatment methods, energy sources, and country-specific factors. These findings underscore the need for considering local conditions and treatment practices when assessing the carbon footprint of sludge management and developing mitigation strategies.
Figure 3 reveals that incineration contributes the highest total GHG emissions among the three sludge treatment methods, with a total of 1,011.53 kg CO2-eq per ton of dry sludge. This is primarily due to the substantial CO2 emissions from incineration (897.56 kg CO2-eq), which are approximately 38% higher than the CO2 emissions from landfill (647.25 kg CO2-eq) and more than three times the CO2 emissions from land application (276.17 kg CO2-eq). Landfill has the second-highest total GHG emissions (717.51 kg CO2-eq), followed by land application (276.41 kg CO2-eq). The composition of GHG emissions and the contribution of different emission sources vary among the three methods, highlighting the importance of considering these factors when assessing the environmental impact of sludge treatment. The reliance on coal in incineration, the high CH4 emissions from landfills, and the potential for emission offsets in land application are notable differences that should be considered when developing sustainable sludge management strategies.
The composition of GHG emissions varies among the three methods. While CO2 is the primary GHG emitted by all three methods, landfills also have significant CH4 emissions (617.65 kg CO2-eq), which account for 86.1% of their total emissions. In contrast, CH4 emissions from incineration (0.47 kg CO2-eq) and land application (0.24 kg CO2-eq) are minimal, representing only 0.05% and 0.09% of their total emissions, respectively. N2O emissions are relatively low for all three methods, with incineration having the highest N2O emissions at 113.10 kg CO2-eq (11.2% of total emissions), followed by landfill at 7.01 kg CO2-eq (0.98% of total emissions) and land application at 0.0002% of total emissions. The contribution of different emission sources varies among the treatment methods. Incineration heavily relies on coal, which contributes 7.44 kg CO2-eq to its total emissions, whereas coal is not applicable for landfill and land application. Electricity consumption is highest for landfills (0.29 kg CO2-eq), followed by incineration (0.09 kg CO2-eq) and land application (0.01 kg CO2-eq). Transportation emissions are highest for incineration (0.15 kg CO2-eq), followed by landfill (0.08 kg CO2-eq).
The total GHG emissions from sludge treatment vary significantly among Chinese provinces, as shown in Figure 4. Guangdong has the highest total emissions at 2,741.94 t CO2-eq, followed by Zhejiang (1,371.97 t CO2-eq) and Shandong (1,367.49 t CO2-eq). In contrast, Tibet has the lowest total emissions at 22.87 t CO2-eq, followed by Qinghai (93.23 t CO2-eq) and Ningxia (145.73 t CO2-eq). The composition of GHG emissions also differs among provinces. CO2 is the primary contributor across all provinces, ranging from 56.7% to 91.6% of total emissions. Yunnan has the highest share of CO2 emissions at 91.6% (786.68 t CO2-eq), while Ningxia has the lowest at 56.7% (82.62 t CO2-eq). CH4 emissions vary more significantly among provinces, with Ningxia having the highest share at 36.75% (53.54 t CO2-eq) and Hainan the lowest at 10.25% (24.49 t CO2-eq). N2O emissions generally account for a smaller portion of total emissions, ranging from 0.03% in Tibet (0.01 t CO2-eq) to 6.64% in Shaanxi (18.80 t CO2-eq).
Comparing the different greenhouse gases, CO2 emissions dominate across all provinces, with a total of 20,796.94 t CO2-eq. The top three provinces for CO2 emissions are Guangdong (2,562.98 t CO2-eq), Zhejiang (1,265.26 t CO2-eq), and Jiangsu (1,179.90 t CO2-eq). CH4 emissions amount to 3,502.17 t CO2-eq nationwide, with Guangdong (172.81 t CO2-eq), Shandong (135.95 t CO2-eq), and Jiangsu (117.80 t CO2-eq) being the top contributors. N2O emissions are comparatively lower, totalling 371.84 t CO2-eq. The provinces with the highest N2O emissions are Guangdong (52.23 t CO2-eq), Hubei (22.18 t CO2-eq), and Jiangsu (21.07 t CO2-eq).
At the regional level, the Northern region has the highest total GHG emissions at 6,176.14 t CO2-eq, followed by the Eastern region (5,836.77 t CO2-eq) and the Central region (5,209.68 t CO2-eq). The Northeastern and Northwestern regions have significantly lower emissions at 1,520.52 t CO2-eq and 1,122.65 t CO2-eq, respectively. CO2 emissions are the main contributor across all regions, with the Northern region emitting 5,148.80 t CO2-eq, followed by the Eastern region (4,969.63 t CO2-eq) and the Central region (4,418.78 t CO2-eq). The Northern region also leads in CH4 emissions (902.83 t CO2-eq), followed by the Eastern region (774.10 t CO2-eq) and the Central region (726.02 t CO2-eq). N2O emissions are highest in the Northern region (124.51 t CO2-eq), followed by the Eastern region (93.04 t CO2-eq) and the Central region (64.88 t CO2-eq). The Southern region ranks fourth in total emissions (4,805.19 t CO2-eq), with 4,195.72 t CO2-eq from CO2, 568.49 t CO2-eq from CH4, and 40.98 t CO2-eq from N2O.
Figure 5 presented is a Lorenz curve showing the cumulative proportion of total GHG emissions from China's sludge treatment industry across 660 cities. The curve reveals a highly uneven distribution of emissions among cities, with a small number of cities contributing to a significant portion of the total emissions. Interestingly, 7 cities (approximately 1% of the total) account for a staggering 34.2% of the total GHG emissions. These cities are Beijing, Shenzhen, Shanghai, Changsha, Hangzhou, Shaoxing, and Inner Mongolia. Expanding the scope, the top 188 cities (28.5% of the total) are responsible for 90% of the total emissions. Furthermore, 50% of the emissions come from just 18 cities, which include the aforementioned 7 cities along with Suzhou, Guangzhou, Chengdu, Chongqing, Qingdao, Nanjing, Xiangyang, Wuhan, Tianjin, Zhengzhou, and Shijiazhuang.
The frequency results indicate that the average total GHG emission of the sludge treatment industry per city is 0.11 Mt CO2-eq, with 77.3% of the cities emitting between 0.0001 and 0.10 Mt CO2-eq. The spatial distribution shows that the top 1% of cities, which are mainly cosmopolises and metropolises, contribute to more than 20% of the total emissions. Beijing, as the biggest emitter, accounts for 5.8% of the total GHG emissions with 4.26 Mt CO2-eq. These high-emitting cities are either municipalities directly under the Central Government or economically developed coastal cities, characterized by large populations, higher GDP, and developed industries, which result in higher wastewater production and, consequently, higher GHG emissions. The next 167 cities (top 1.1% to 26.3%) generate 43.83 Mt CO2-eq, contributing to 60% of the total emissions. Most of these cities are located in Eastern China, with a few in Western China, such as Ataylor, Urumqi, Kunming, Honghe, Yinchuan, Lanzhou, Xining, Deyang, Mianyang, Nanchong, and Leshan. In contrast, the remaining 486 cities, which are mainly underdeveloped or have relatively low urbanization levels and are in the Northwestern and Southeastern regions, only emit 20% of the total GHG emissions.
Given this uneven distribution of emissions, GHG emission mitigation strategies should prioritize developed cities with higher total emissions. Upgrading WWTPs with energy recovery technologies can help reduce off-site GHG emissions and potentially offset the energy consumption demand for their operation. For larger-scale cities with substantial sludge production, sludge thermal conversion technologies can be employed to reduce both sludge volume and GHG emissions. For example, a carbonization co-digestion sludge system could achieve net 219 GJ energy and reduce GHG emissions by 25%, with zero N2O emissions by utilizing biochar biochar [26]. Integrated pyrolysis systems can also achieve net energy output when the volatile solids in total solids (VS/TS) ratio is greater than 63%. However, these technologies are currently studied at a lab scale and require significant investment in equipment and operational costs, making them more suitable for cities with higher GDP and fixed investment.
3.3. Impacts of GHG Emissions
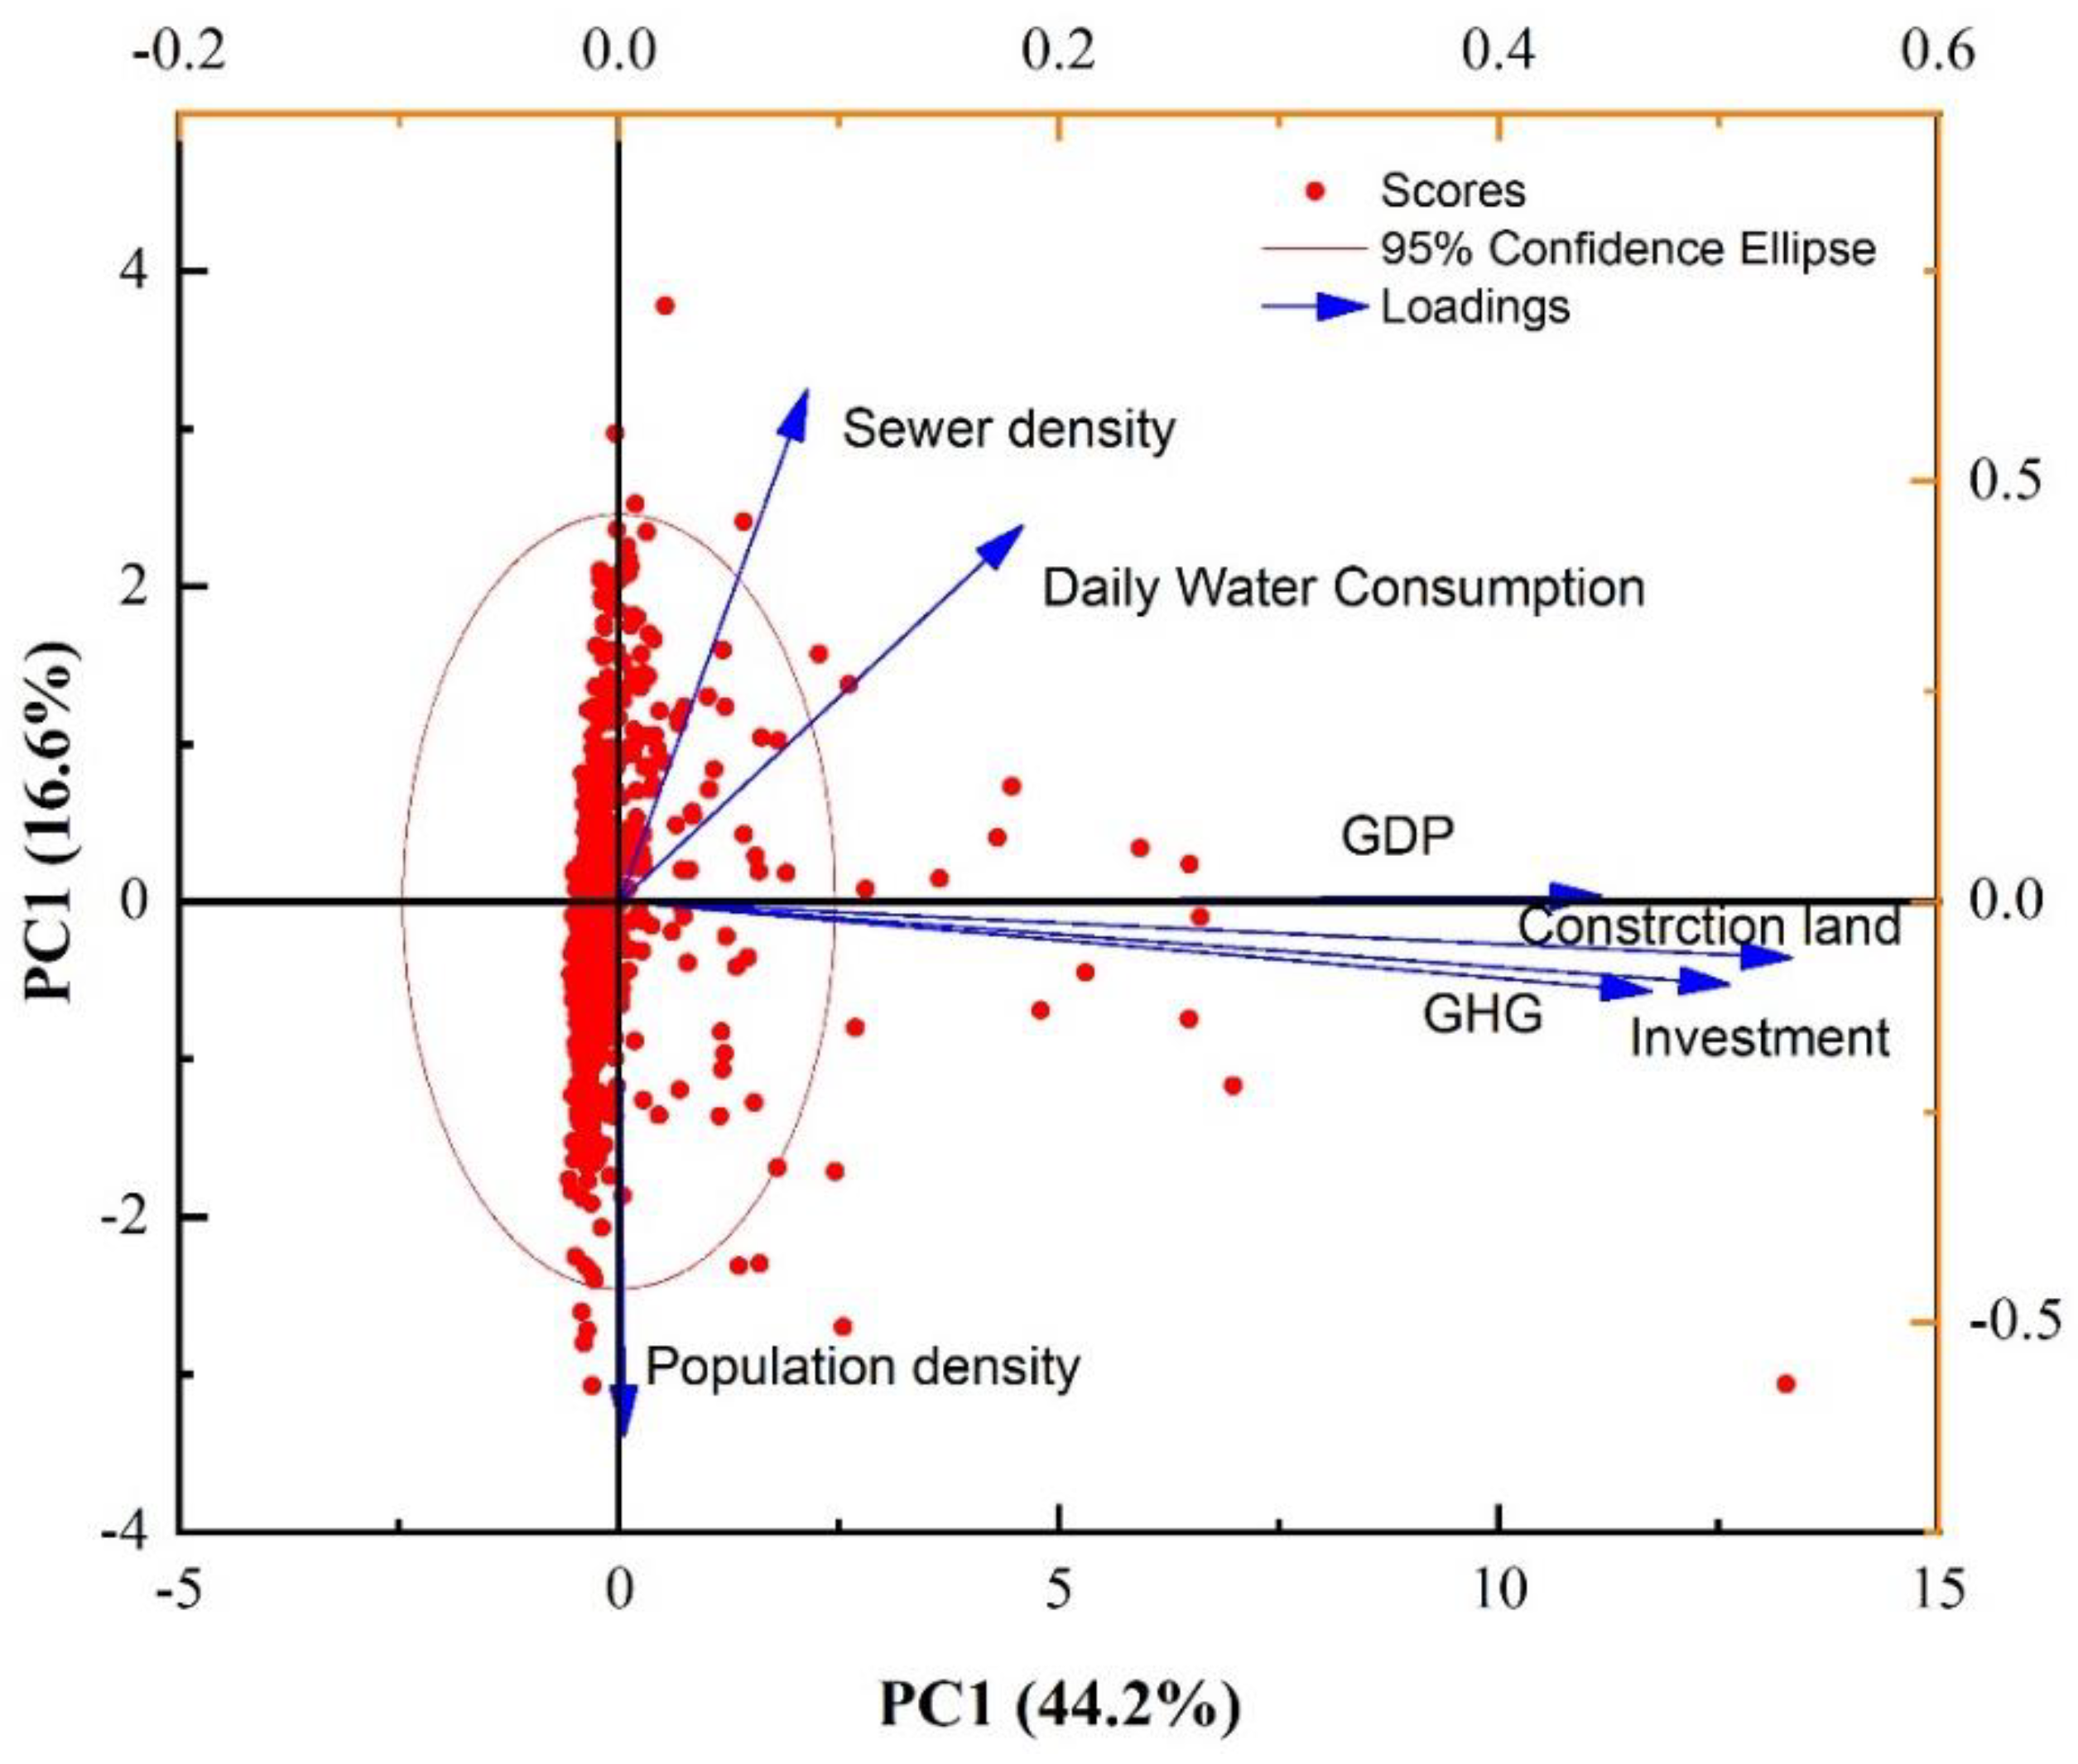
The PCA loading plot illustrates the influences of various factors on GHG emissions from the sludge treatment industry. The first two principal components (PC1 and PC2) explain 60.8% of the variation in the input data, indicating their significance in understanding GHG emissions across different cities. Indicators such as GDP, daily water consumption, and construction land, located in the first quadrant, positively affect total GHG emissions, suggesting that higher values of these indicators correlate with increased emissions. Specifically, GDP and treated sludge show the highest correlations with GHG emissions, reflecting the impact of economic and treatment scale factors. Sewer density and population density primarily influence PC2 but in opposite directions, with higher sewer density linked to increased emissions and higher population density showing a mitigating effect. First-tier cities like Beijing, Shanghai, and Shenzhen are significantly influenced by GDP and treated volumes of wastewater and sludge due to their extensive treatment infrastructure and economic activities. Tianshui and Sanya are notably affected by sewer and population densities, respectively, due to their unique geographic and demographic characteristics. To mitigate GHG emissions, particularly in developed cities, adopting novel technologies like sludge pyrolysis and wet oxidation can effectively reduce sludge volume and emissions.
Figure 6.
Principal component analysis.
4. Potential of GHG Emission Mitigation
Sludge treatment is a significant contributor to greenhouse gas (GHG) emissions in the sludge treatment industry. To achieve China's goal of carbon neutrality by 2060, it is crucial to evaluate and optimize sludge treatment technologies to minimize their carbon footprint. This analysis focuses on the GHG emission mitigation potential and cost analysis of various sludge treatment methods, including thermal conversion technologies (pyrolysis, gasification, and incineration), AD, hydrothermal processes (HTP), and wet oxidation (WO). Table 1 shows the comparison of reduction potential and cost analysis of these sludge treatment technologies.
Incineration is a widely used method for sludge treatment, but it emits the largest GHG emissions among different disposal methods due to the demand for coal during the process and the electricity consumption for sludge drying [32]. Other thermal technologies, such as carbonization, gasification, and pyrolysis, can also be used for sludge volume reduction with net GHG emission [8,26]. However, most of these technologies are applied at a lab-scale without large-scale applications and require sludge drying to almost 30% water content, which necessitates higher energy and chemical consumption. A 15% reduction in energy and material recovery in pyrolysis would result in an additional 195.96 kg CO2-eq of carbon emissions, emphasizing the need to focus on stabilizing the yield of high calorific value products [31]. Gasification of sewage sludge can reduce GHG emissions by 0.33-0.46 t CO2-eq/t dry solids compared to incineration [22].
Advanced AD coupled with thermal hydrolysis is a promising solution to expand methane yield, achieving a net energy production of 372 kWh/t DS [33]. If 60% ~ 70% of organic matter is converted into biogas energy and recycled, it can meet the energy demand of a WWTP [4]. AD can reduce GHG emissions by 0.09-0.3 t CO2-eq/t dry solids compared to conventional sludge treatment [28]. The cost of AD ranges from 100-200 USD/t dry solids [27]. Hydrothermal processes, such as HTP and ATH, can also effectively treat sludge while recovering valuable resources. However, the high energy consumption in the hydrolysis process leads to substantial carbon emissions. When the energy and resource consumption is reduced by 15%, GWP is reduced by 194.04 kg CO2-eq and 181.98 kg CO2-eq, and HTP is reduced by 75.55 kg CO2-eq and 44.5 kg CO2-eq for two different routes [31,34]. HTP can reduce GHG emissions by 0.2-0.4 t CO2-eq/t dry solids compared to incineration [23]. The cost of HTP ranges from 300-500 USD/t dry solids [28]. Wet oxidation of sludge could be considered as a possible solution to reduce GHG emissions from sludge drying, as it can directly oxidize organics in sludge to realize volume reduction under the liquid phase. Moreover, it facilitates product recovery (e.g., acetic acid, P, and N), which could be reused during biological treatment processes at WWTPs. Wet oxidation can reduce GHG emissions by 0.1-0.3 t CO2-eq/t dry solids compared to incineration [27]. The cost of wet oxidation ranges from 150-300 USD/t dry solids [4].
LCA results indicate that emerging sludge treatment routes can provide favorable environmental benefits through the utilization of sludge resources. However, they still require improvement compared to traditional sludge treatment routes in effectively controlling both environmental pollution and carbon emissions. Optimization strategies, such as the development and utilization of resource-based clean chemicals, the selection of clean heat sources, and the optimization of heat recovery systems, are promising options to demonstrate the carbon emission reduction benefits of these technologies [31,34]. While thermal conversion technologies, AD, hydrothermal processes, and wet oxidation offer potential for GHG emission mitigation in sludge treatment, further research and optimization are necessary to enhance their environmental performance and economic feasibility. The cost analysis reveals that AD is the most cost-effective option, followed by wet oxidation, pyrolysis, gasification, and HTP. However, the actual costs may vary depending on factors such as plant scale, location, local regulations, and market conditions. By implementing these technologies and adopting optimization strategies, the sludge treatment industry can significantly contribute to achieving China's carbon neutrality goal.
5. Conclusions
This study provides a comprehensive assessment of GHG emissions from China's sludge treatment industry and explores the potential of novel technologies to mitigate these emissions, promoting sustainable sludge management practices. The quantification of GHG emissions using a life cycle assessment approach reveals that the total emissions from sludge treatment in 2017 were 18.54 Mt CO2-eq, with incineration contributing the highest emissions, followed by landfill and land application. The spatial distribution of emissions across cities highlights the need for targeted mitigation strategies that consider local sustainability challenges and regional disparities in economic development and treatment infrastructure. PCA analysis demonstrates that economic factors, such as GDP and treatment scale, significantly influence GHG emissions from sludge treatment. This finding emphasizes the importance of integrating sustainability goals with economic development and adopting technologies that can effectively reduce emissions while promoting resource recovery and circular economy principles. The evaluation of various novel sludge treatment technologies, including thermal conversion, anaerobic digestion, hydrothermal processes, and wet oxidation, shows that these methods offer GHG emission reductions ranging from 0.09 to 0.46 t CO2-eq/t dry solids compared to conventional methods. However, further optimization is necessary to enhance their environmental and economic performance, ensuring long-term sustainability. To achieve China's carbon neutrality goal and foster sustainable development in the sludge treatment industry, a multi-faceted approach is required. This includes implementing novel technologies, adopting optimization strategies, and promoting policy incentives that encourage the adoption of sustainable sludge management practices. Future research should focus on further refining the life cycle assessment methodology, incorporating more granular data on regional sludge treatment practices, and evaluating the long-term environmental and economic impacts of novel technologies. Moreover, investigating the social acceptance and policy implications of sustainable sludge management strategies can provide valuable insights for decision-makers and facilitate the widespread adoption of sustainable practices.
Author Contributions
Conceptualization, Hu D.M. and Liu, S.; methodology, Hu D.M.; software, Hu D.M., Peng Jiang; validation, Hu D.M. and Liu, S.; formal analysis, Hu D.M. and Liu, S.; investigation, Peng Jiang, Yipei Chen and Liu, S.; resources, Hu D.M. and Liu, S.; data curation, Hu D.M. and Liu, S..; writing—original draft preparation, Hu D.M.; writing—review and editing, Hu D.M., Peng Jiang, Chen Y.P., Gao F.Y. and Liu, S.; visualization, Hu D.M., Peng Jiang, Chen Y.P., Gao F.Y. and Liu, S.; supervision, Hu D.M. and Liu, S.; project administration, Liu, S.; funding acquisition, Gao F.Y.. All authors have read and agreed to the published version of the manuscript.
Funding
This research was funded by Zhejiang Provincial Natural Science Foundation of China, grant number: LZ21E060002.
Acknowledgments
The authors are grateful to the anonymous reviewers for their insightful comments and suggestions on our work.
Conflicts of Interest
The authors declare that they have no known competing financial interests or personal relationships that could have appeared to influence the work reported in this paper.
References
- Xu, Y., Liu, R., Yang, D. & Dai, X. Sludge treatment and resource recovery towards carbon neutrality in China: current status and future perspective. Blue-Green Systems 3, 119–127 (2021). [CrossRef]
- Statistical Yearbook of Urban Construction, 2021. Ministry of Ecology and Environment of China (2021).
- Yu, Y. & Zhang, W. Greenhouse gas emissions from solid waste in Beijing: The rising trend and the mitigation effects by management improvements. Waste Management and Research 34, 368–377 (2016).
- Guo, D. et al. Revisiting China’s domestic greenhouse gas emission from wastewater treatment: A quantitative process life-cycle assessment. Science of the Total Environment 876, (2023).
- Ding, A. et al. Life cycle assessment of sewage sludge treatment and disposal based on nutrient and energy recovery: A review. Science of the Total Environment vol. 769 Preprint at (2021). [CrossRef]
- Kumar, A. et al. Greenhouse gases emission control in WWTS via potential operational strategies: A critical review. Chemosphere vol. 273 Preprint at (2021). [CrossRef]
- Tarpani, R.R.Z. & Azapagic, A. Life cycle sustainability assessment of advanced treatment techniques for urban wastewater reuse and sewage sludge resource recovery. Science of the Total Environment 869, (2023). [CrossRef]
- Zhou, H., Zhang, W., Li, L., Zhang, M. & Wang, D. Environmental impact and optimization of lake dredged-sludge treatment and disposal technologies based on life cycle assessment (LCA) analysis. Science of the Total Environment 787, (2021).
- SYUC. Statistical Yearbook of Urban Construction. (https://www.mohurd.gov.cn/file/old/2020/20200327/w02020032722244243052500000.xls, China, 2017).
- Guo, S.J., H.H.W. & D. X. Y. et al. Calculation of greenhouse gas emissions of municipal wastewater treatment and its temporal and spatial trend in China (in Chinese). Water & Wastewater Engineering 45, (2019).
- MEE. Ministry of Ecological Environment. Ministry of Ecological Environment (http://www.tanjiaoyi.com/article-25419-1.html, China, 2017).
- Shrestha, A. et al. Estimation of greenhouse gases emission from domestic wastewater in Nepal: A scenario-based analysis applicable for developing countries. Chemosphere 300, (2022). [CrossRef]
- Yin, Z., Y.C.Z., H.J., et al. Predictive method research of sludge landfill gas production (in Chinese). China Environ. Sci. 30, (2010).
- Hong, J., Hong, J., Otaki, M. & Jolliet, O. Environmental and economic life cycle assessment for sewage sludge treatment processes in Japan. Waste Management 29, 696–703 (2009).
- IPCC. 2007 IPCC Guidelines for National Greenhouse Gas Inventories. (2007).
- Wei, L. et al. Development, current state and future trends of sludge management in China: Based on exploratory data and CO2-equivaient emissions analysis. Environ Int 144, (2020).
- Liu, H.T., Zheng, H.X., Chen, T.B., Zheng, G.D. & Gao, D. Reduction in greenhouse gas emissions from sewage sludge aerobic compost in China. Water Science and Technology 69, 1129–1135 (2014). [CrossRef]
- Liu, B., Wei, Q., Zhang, B. & Bi, J. Life cycle GHG emissions of sewage sludge treatment and disposal options in Tai Lake Watershed, China. Science of the Total Environment 447, 361–369 (2013).
- IPCC. 2006 IPCC Guidelines for National Greenhouse Gas Inventories. Intergovernmental Panel on Climate Change, Japan. (Japan, 2006).
- Li, Y., Chen, Y. & Wu, J. Enhancement of methane production in anaerobic digestion process: A review. Applied Energy vol. 240 120–137 Preprint at (2019). [CrossRef]
- Zhang, Q.H. et al. Current status of urban wastewater treatment plants in China. Environment International vols 92–93 11–22 Preprint at (2016). [CrossRef]
- Twagirayezu, E. et al. Comparative life cycle assessment of sewage sludge treatment in Wuhan, China: Sustainability evaluation and potential implications. Science of the Total Environment 913, (2024). [CrossRef]
- Lishan, X., Tao, L., Yin, W., Zhilong, Y. & Jiangfu, L. Comparative life cycle assessment of sludge management: A case study of Xiamen, China. J Clean Prod 192, 354–363 (2018).
- Zhang, H. et al. Environmental and economic assessment of electro-dewatering application to sewage sludge: A case study of an Italian wastewater treatment plant. J Clean Prod 210, 1180–1192 (2019).
- Pradel, M. & Reverdy, A.L. Assessing GHG Emissions from Sludge Treatment and Disposal Routes: The Method behind GESTABoues Tool. https://hal.science/hal-00781673 (2020).
- Nakakubo, T., Yoshida, N. & Hattori, Y. Analysis of greenhouse gas emission reductions by collaboratively updating equipment in sewage treatment and municipal solid waste incineration plants. J Clean Prod 168, 803–813 (2017).
- Liu, Y. et al. Feasibility of using different hydrothermal processes for sewage sludge management in China. Science of the Total Environment vol. 838 Preprint at (2022). [CrossRef]
- Chen, W. et al. The GHG mitigation opportunity of sludge management in China. Environ Res 212, (2022).
- Yuan, H. et al. Environmental and economic life cycle assessment of emerging sludge treatment routes. J Clean Prod 449, (2024).
- Guo, D., Li, B., Yu, W., Baroutian, S. & Young, B.R. A system engineering perspective for net zero carbon emission in wastewater and sludge treatment industry: A review. Sustainable Production and Consumption vol. 46 369–381 Preprint at (2024). [CrossRef]
- Huang, Y. et al. Comprehensive competitiveness assessment of four typical municipal sludge treatment routes in China based on environmental and techno-economic analysis. Science of the Total Environment 895, (2023).
- Hao, X., Chen, Q., van Loosdrecht, M.C.M., Li, J. & Jiang, H. Sustainable disposal of excess sludge: Incineration without anaerobic digestion. Water Research vol. 170 Preprint at (2020). [CrossRef]
- Gahlot, P. et al. Principles and potential of thermal hydrolysis of sewage sludge to enhance anaerobic digestion. Environ Res 214, (2022).
- Yin, Z. et al. Application and improvement methods of sludge alkaline fermentation liquid as a carbon source for biological nutrient removal: A review. Science of the Total Environment vol. 873 Preprint at (2023). [CrossRef]
Figure 1.
The system boundary of GHG emissions quantification from sludge treatment industry.
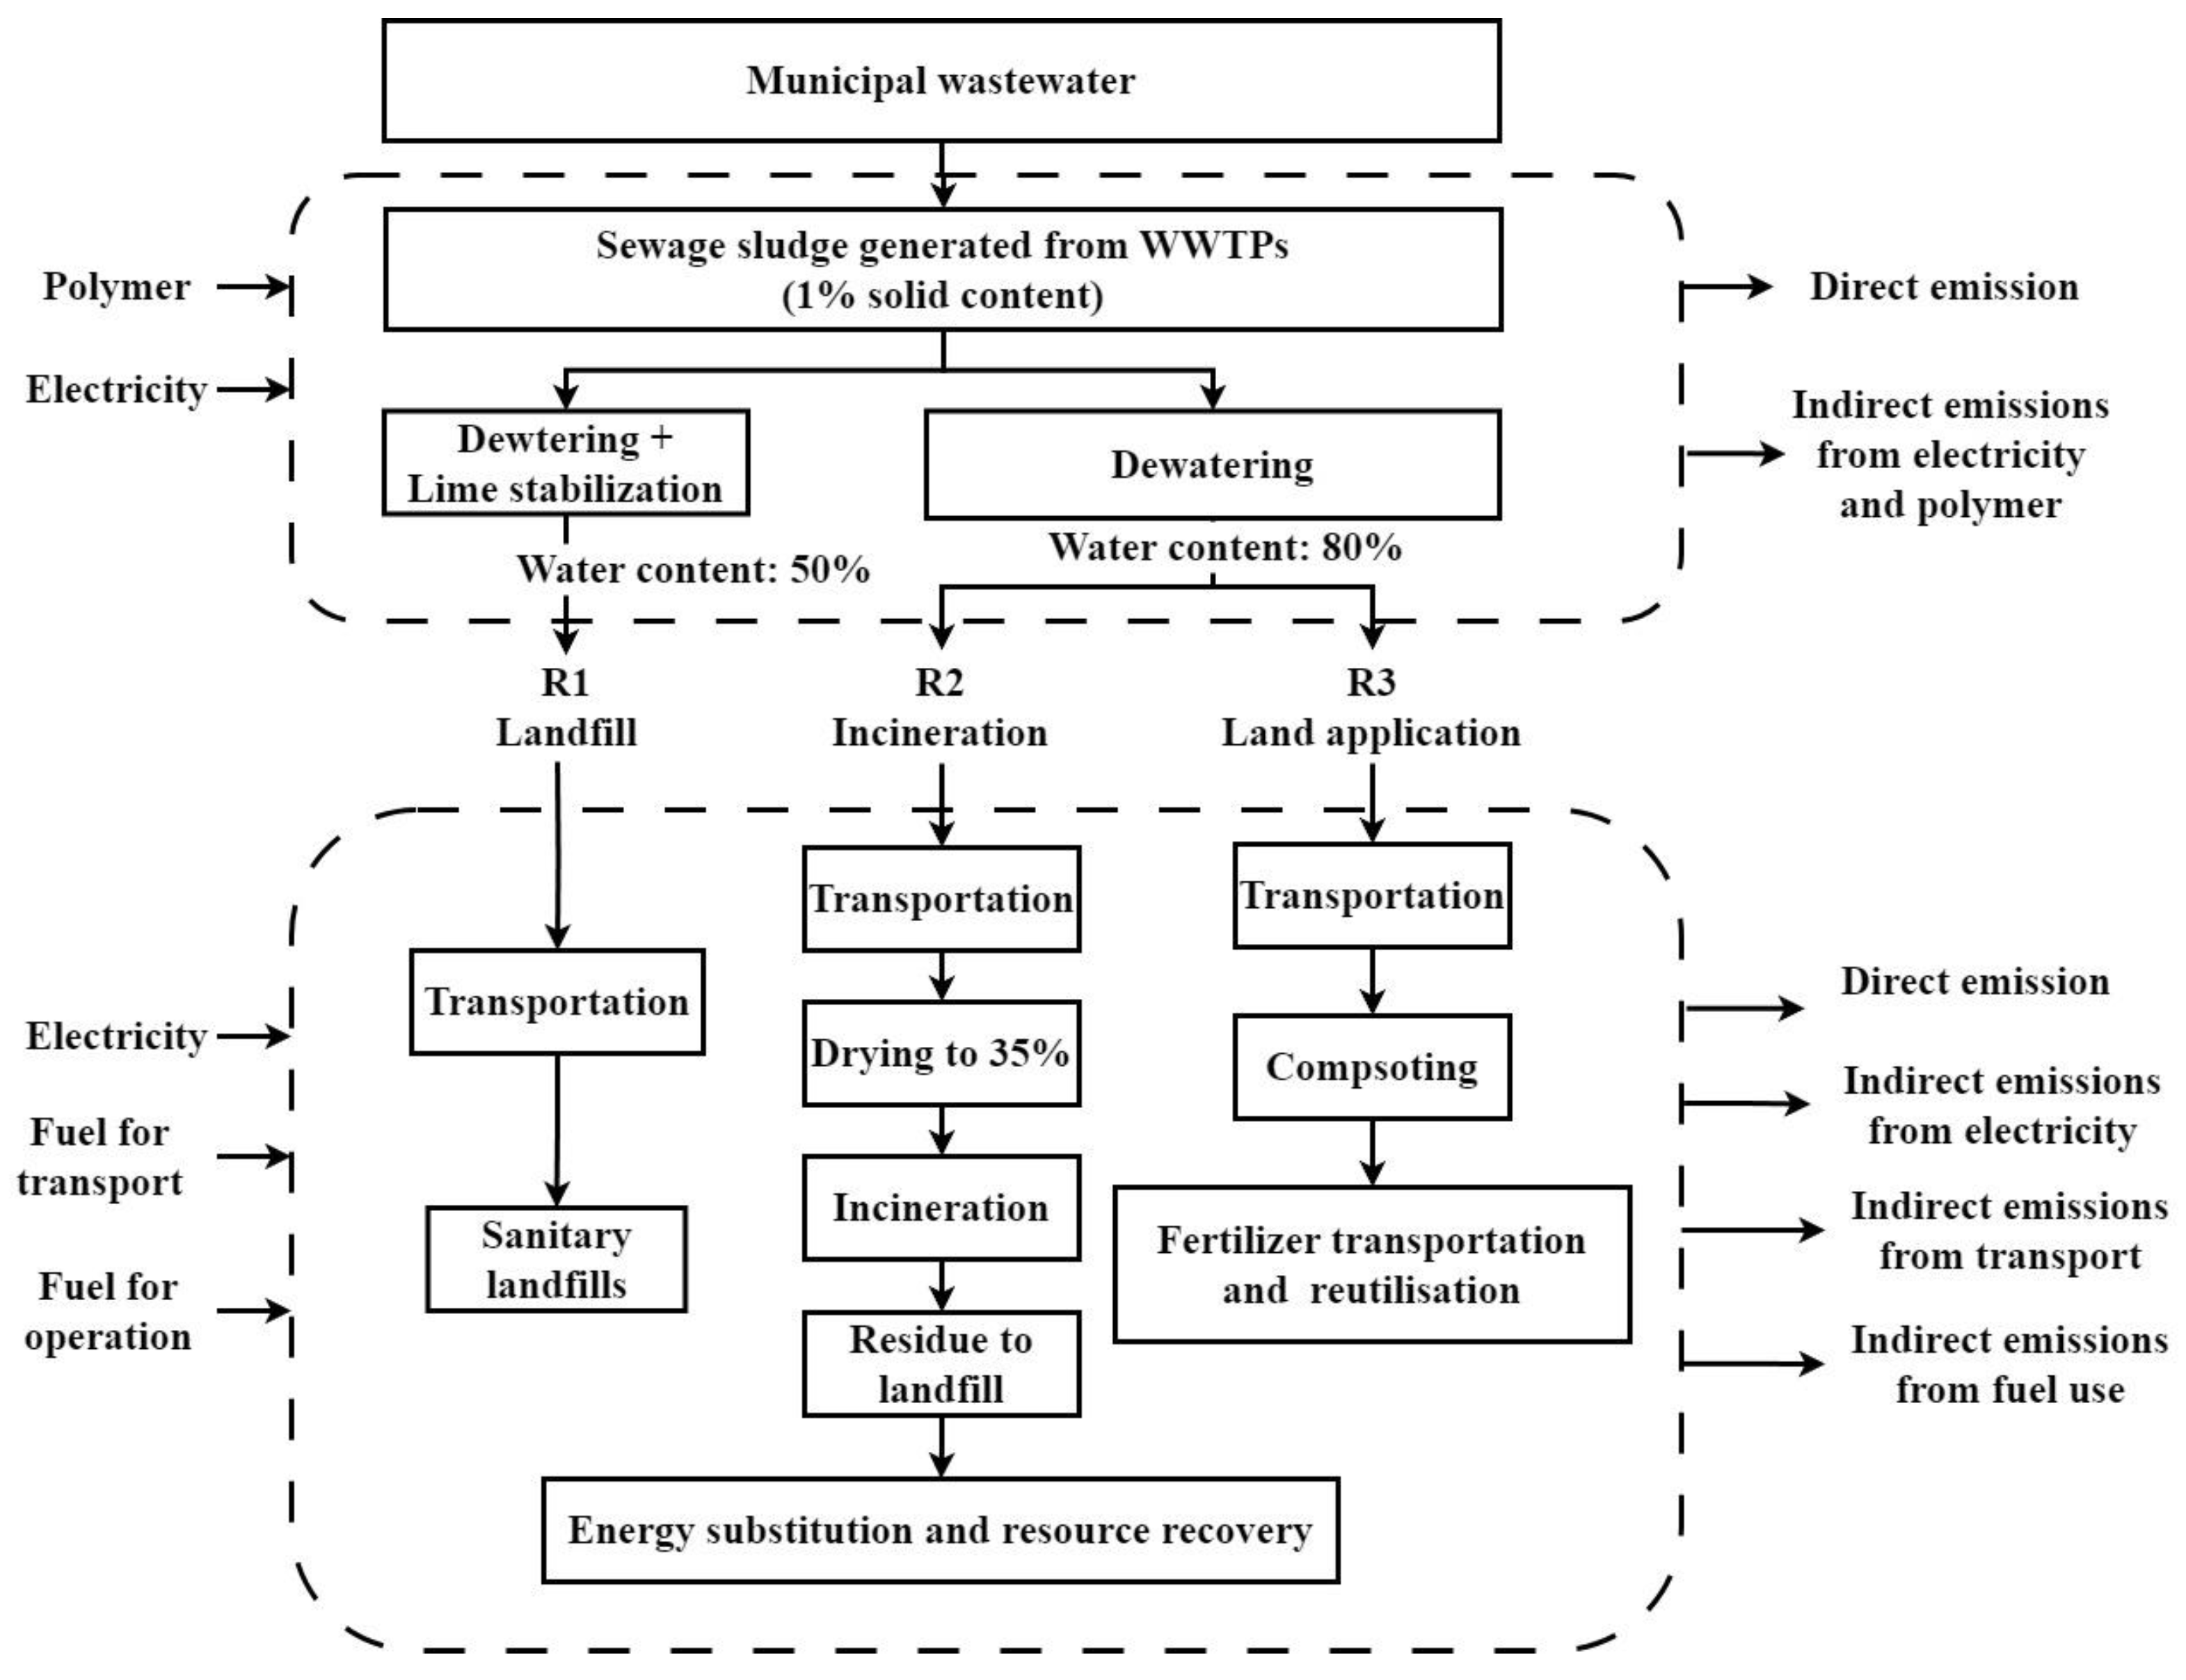
Figure 2.
The production of treated sludge volume with different treatment disposals in 31 provinces (SYUC, 2017).
Figure 2.
The production of treated sludge volume with different treatment disposals in 31 provinces (SYUC, 2017).
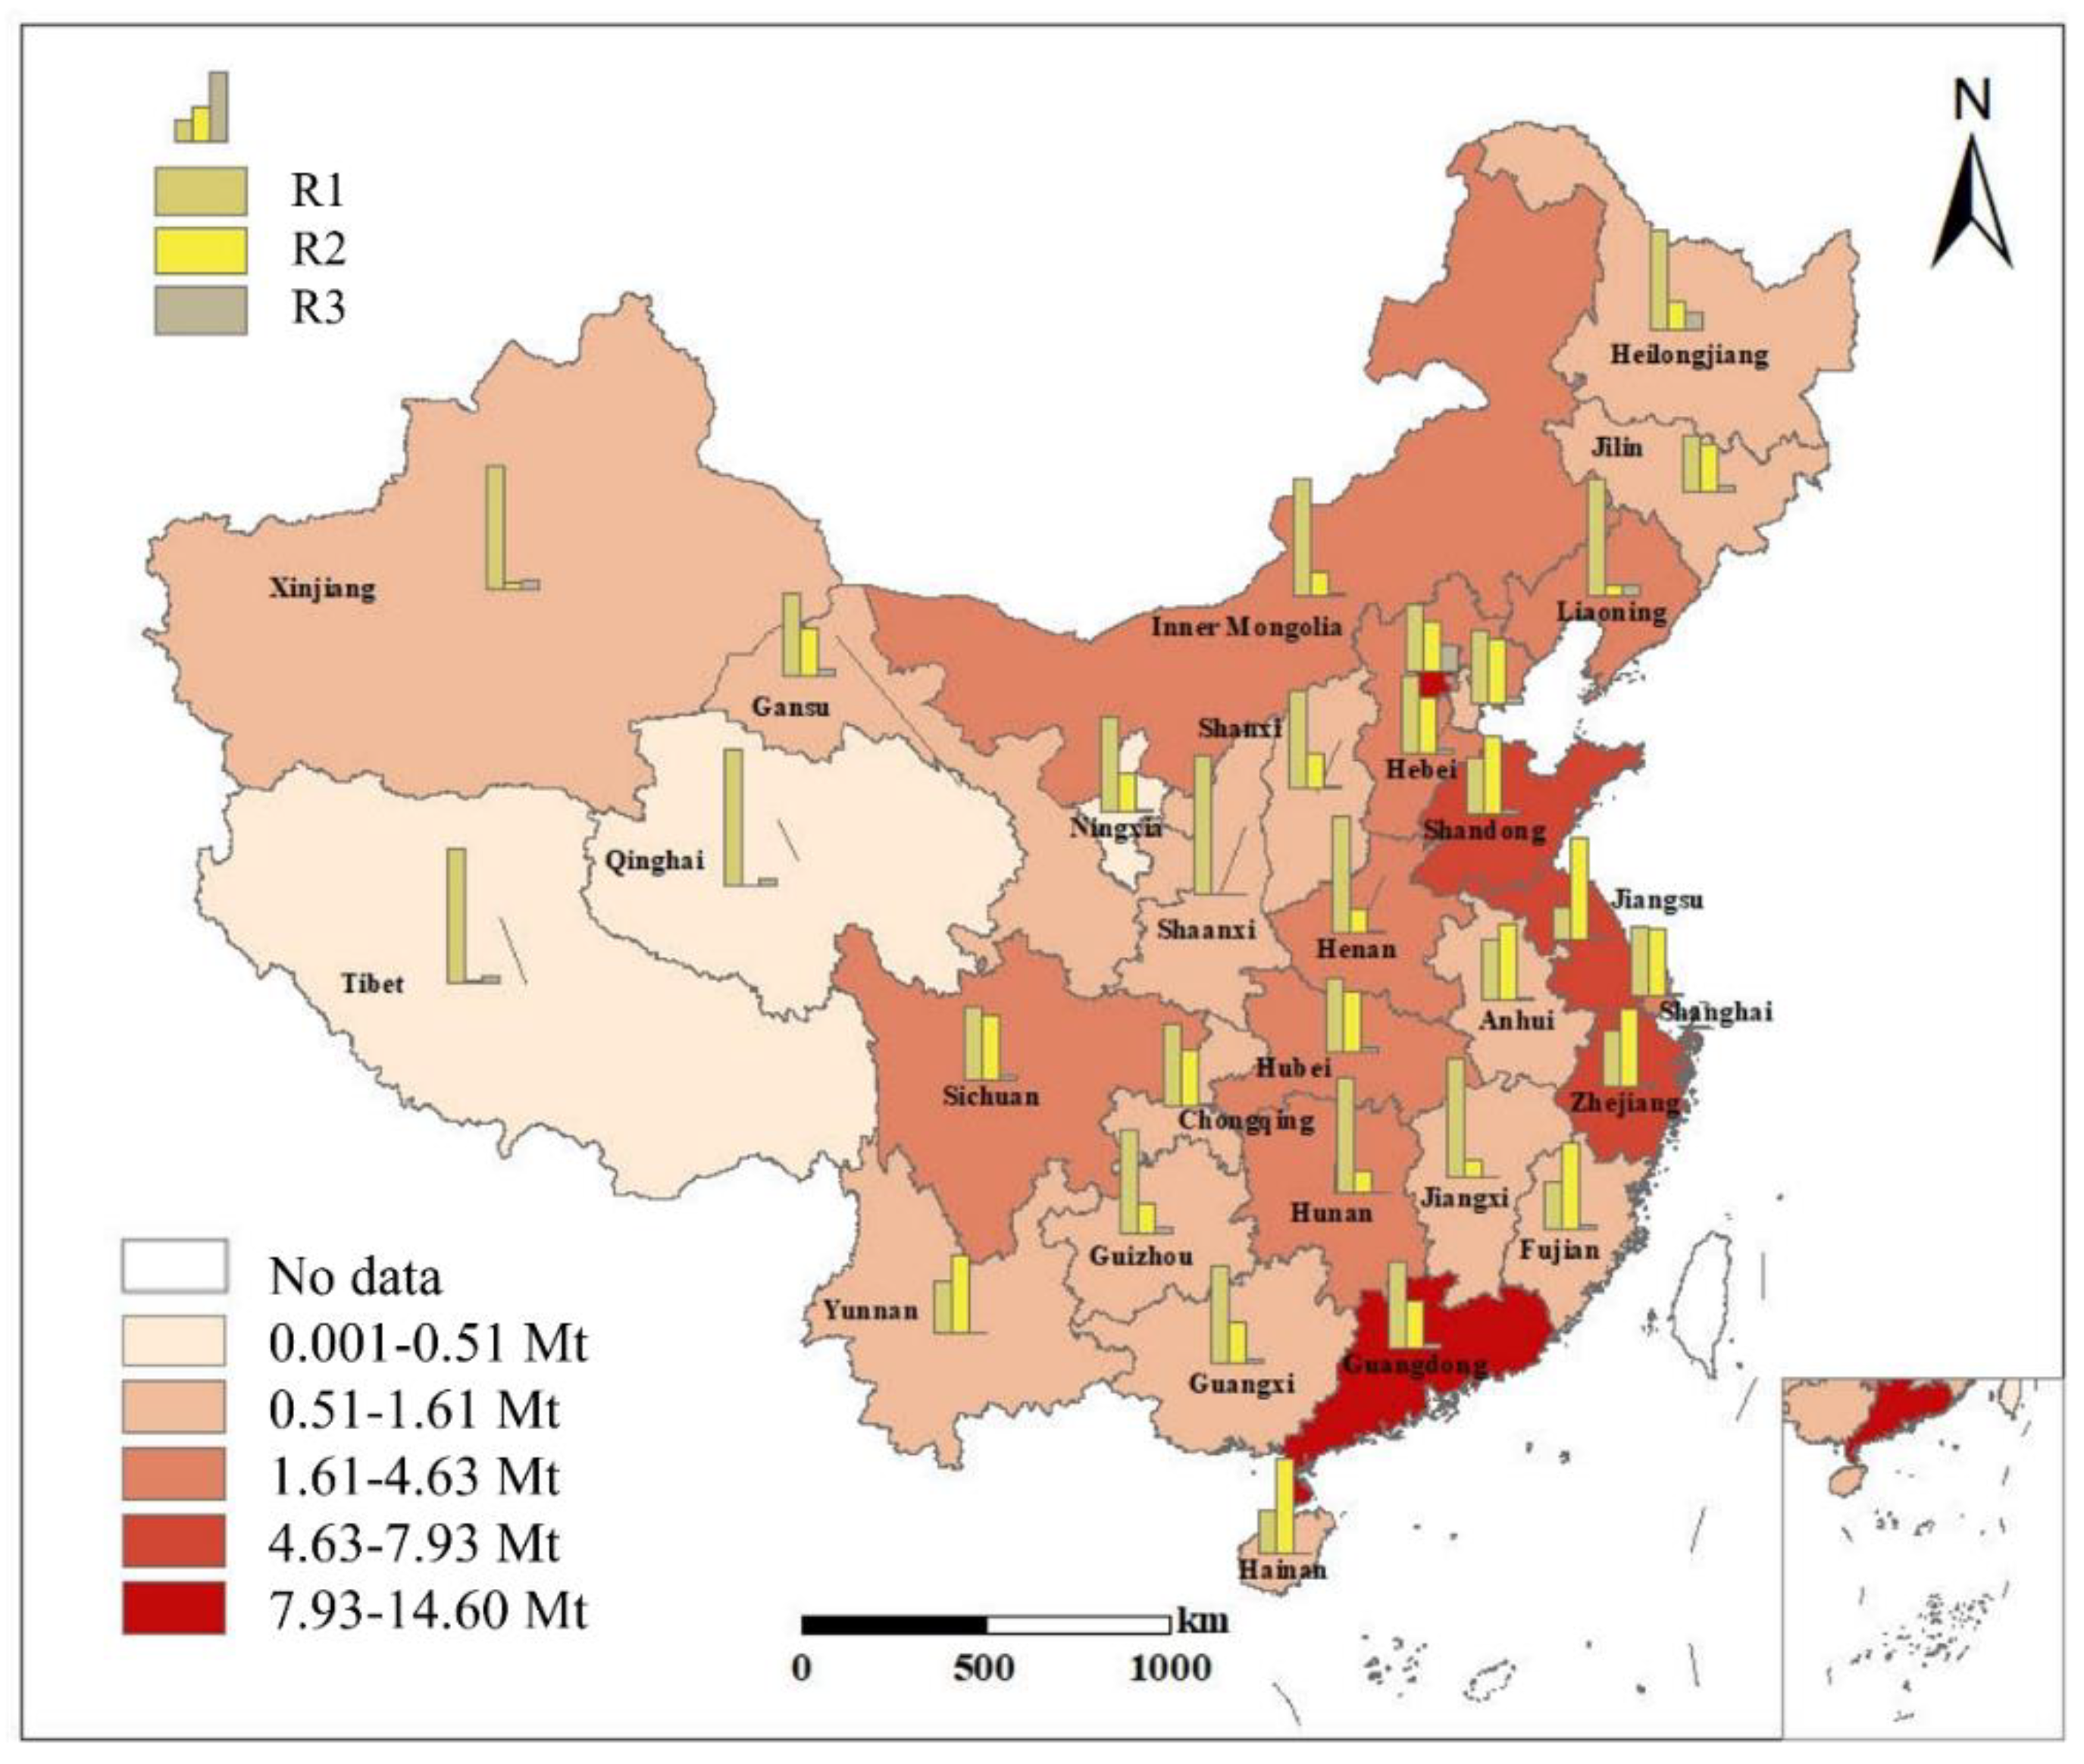
Figure 3.
GHG emission from various sources of different sludge treatment methods.
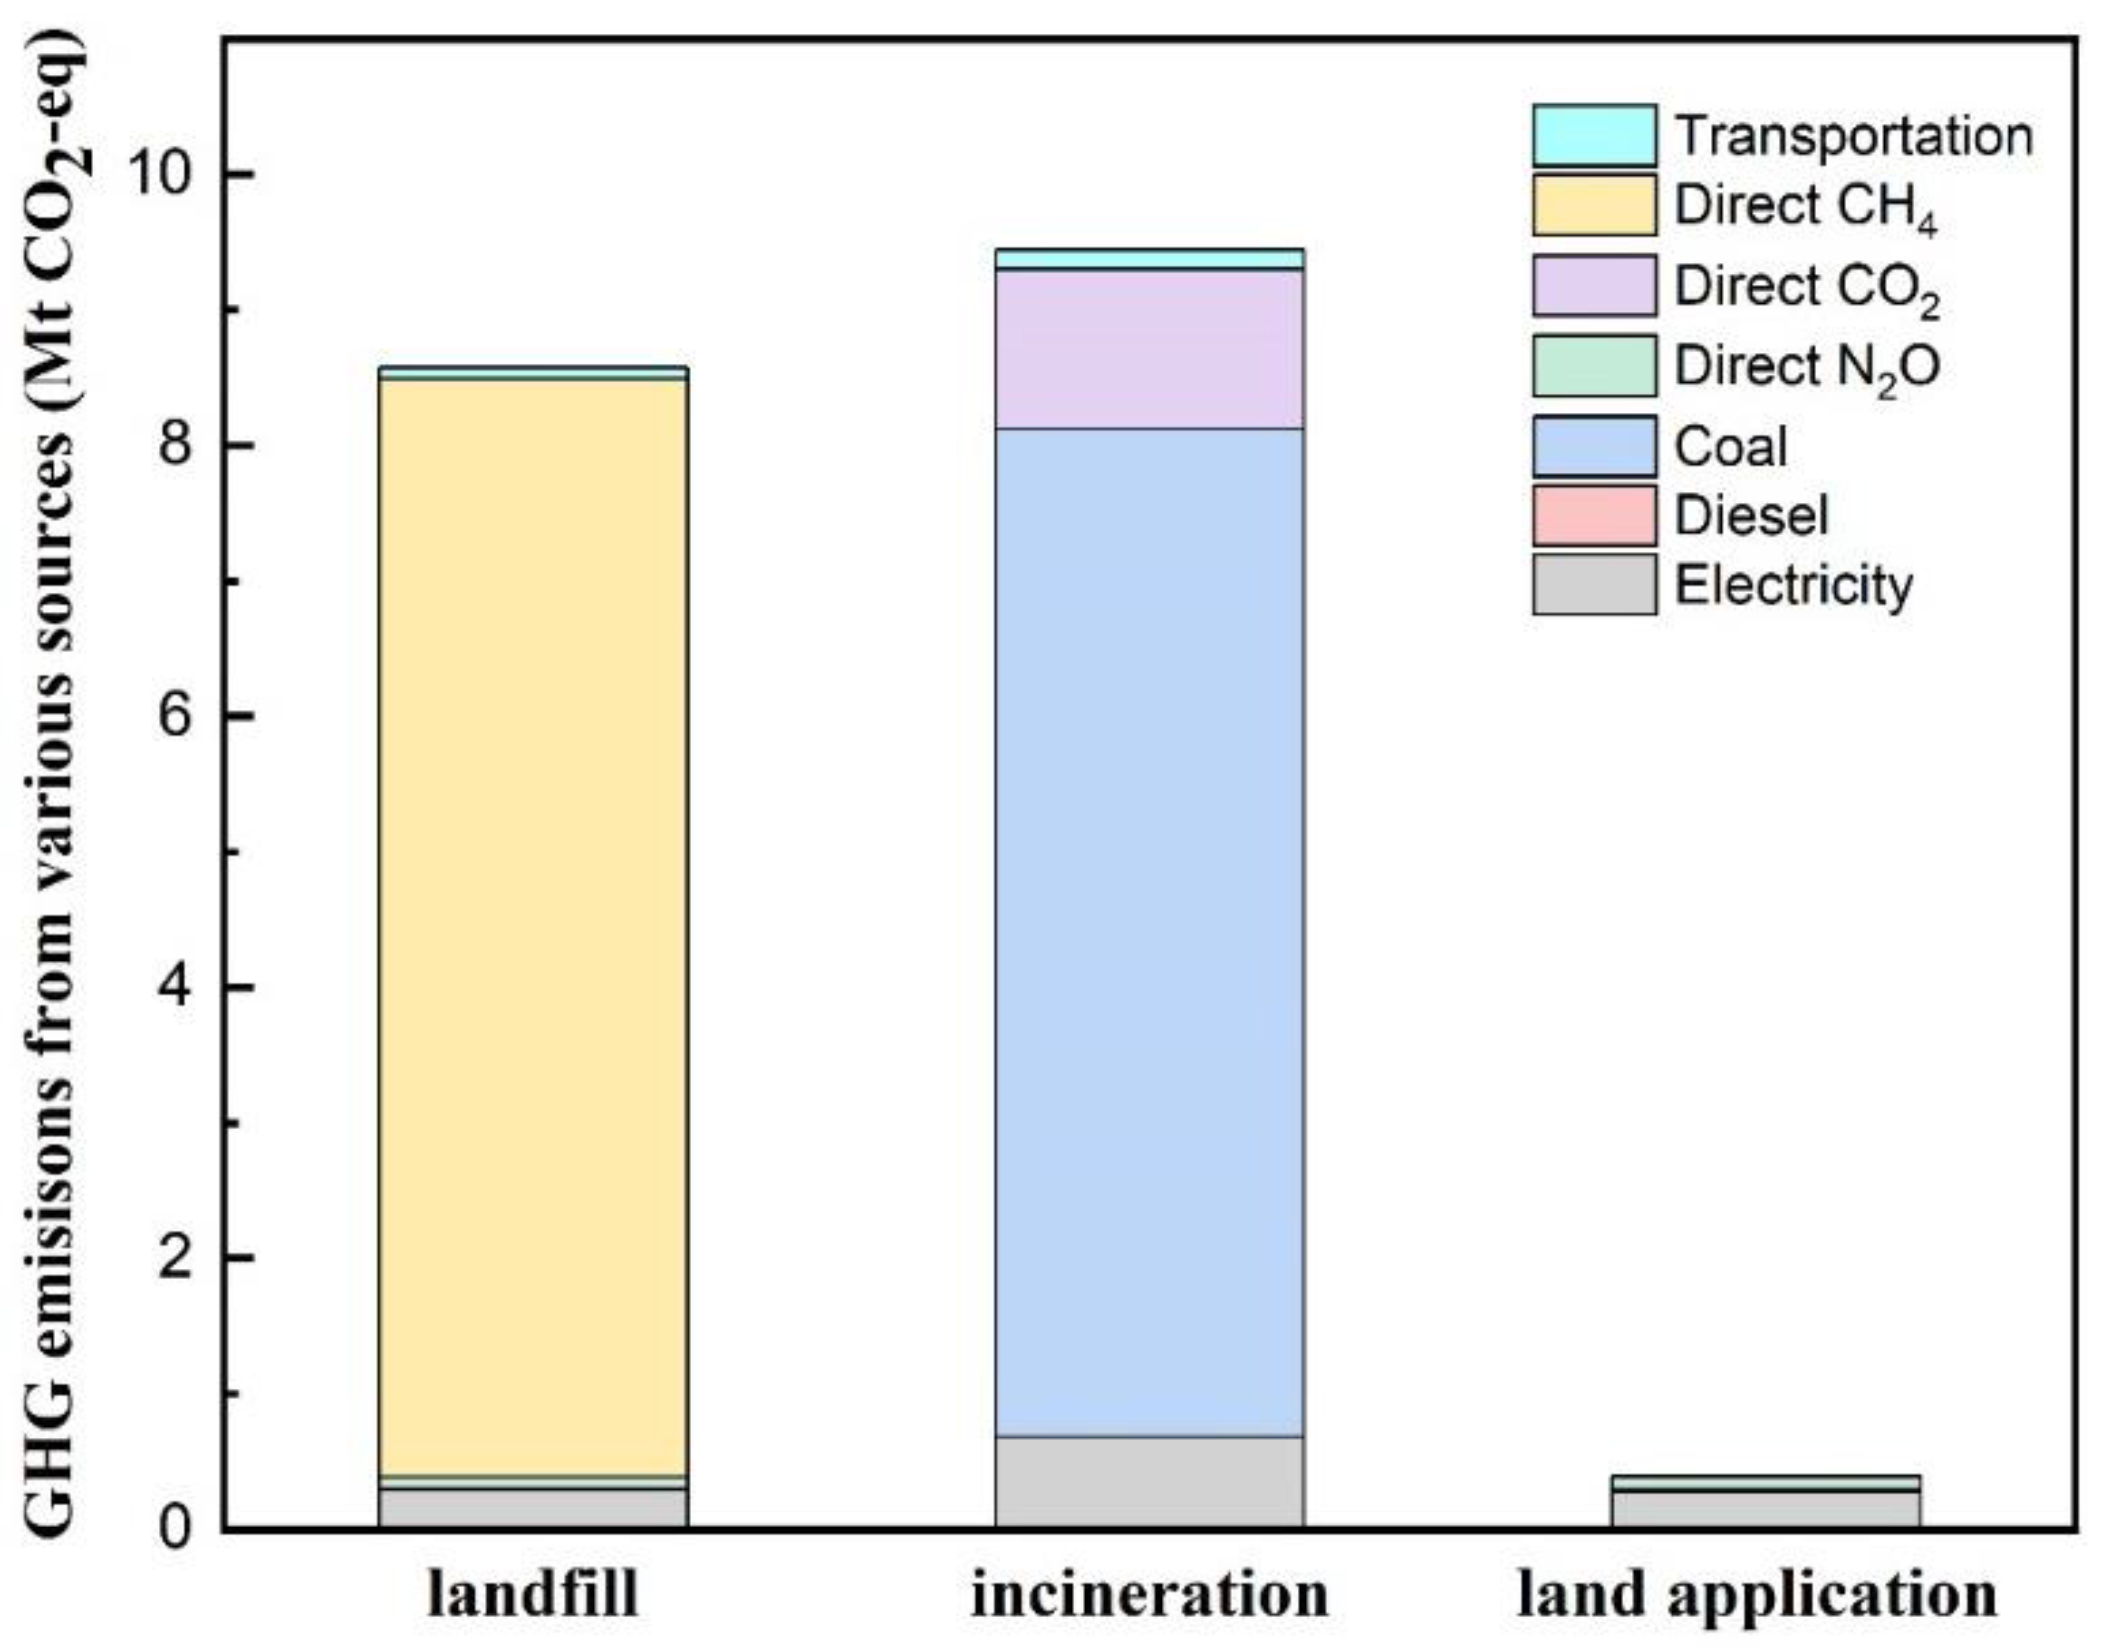
Figure 4.
Total and decomposition of GHG emission characteristics from sludge treatment industry in 31 provinces.
Figure 4.
Total and decomposition of GHG emission characteristics from sludge treatment industry in 31 provinces.
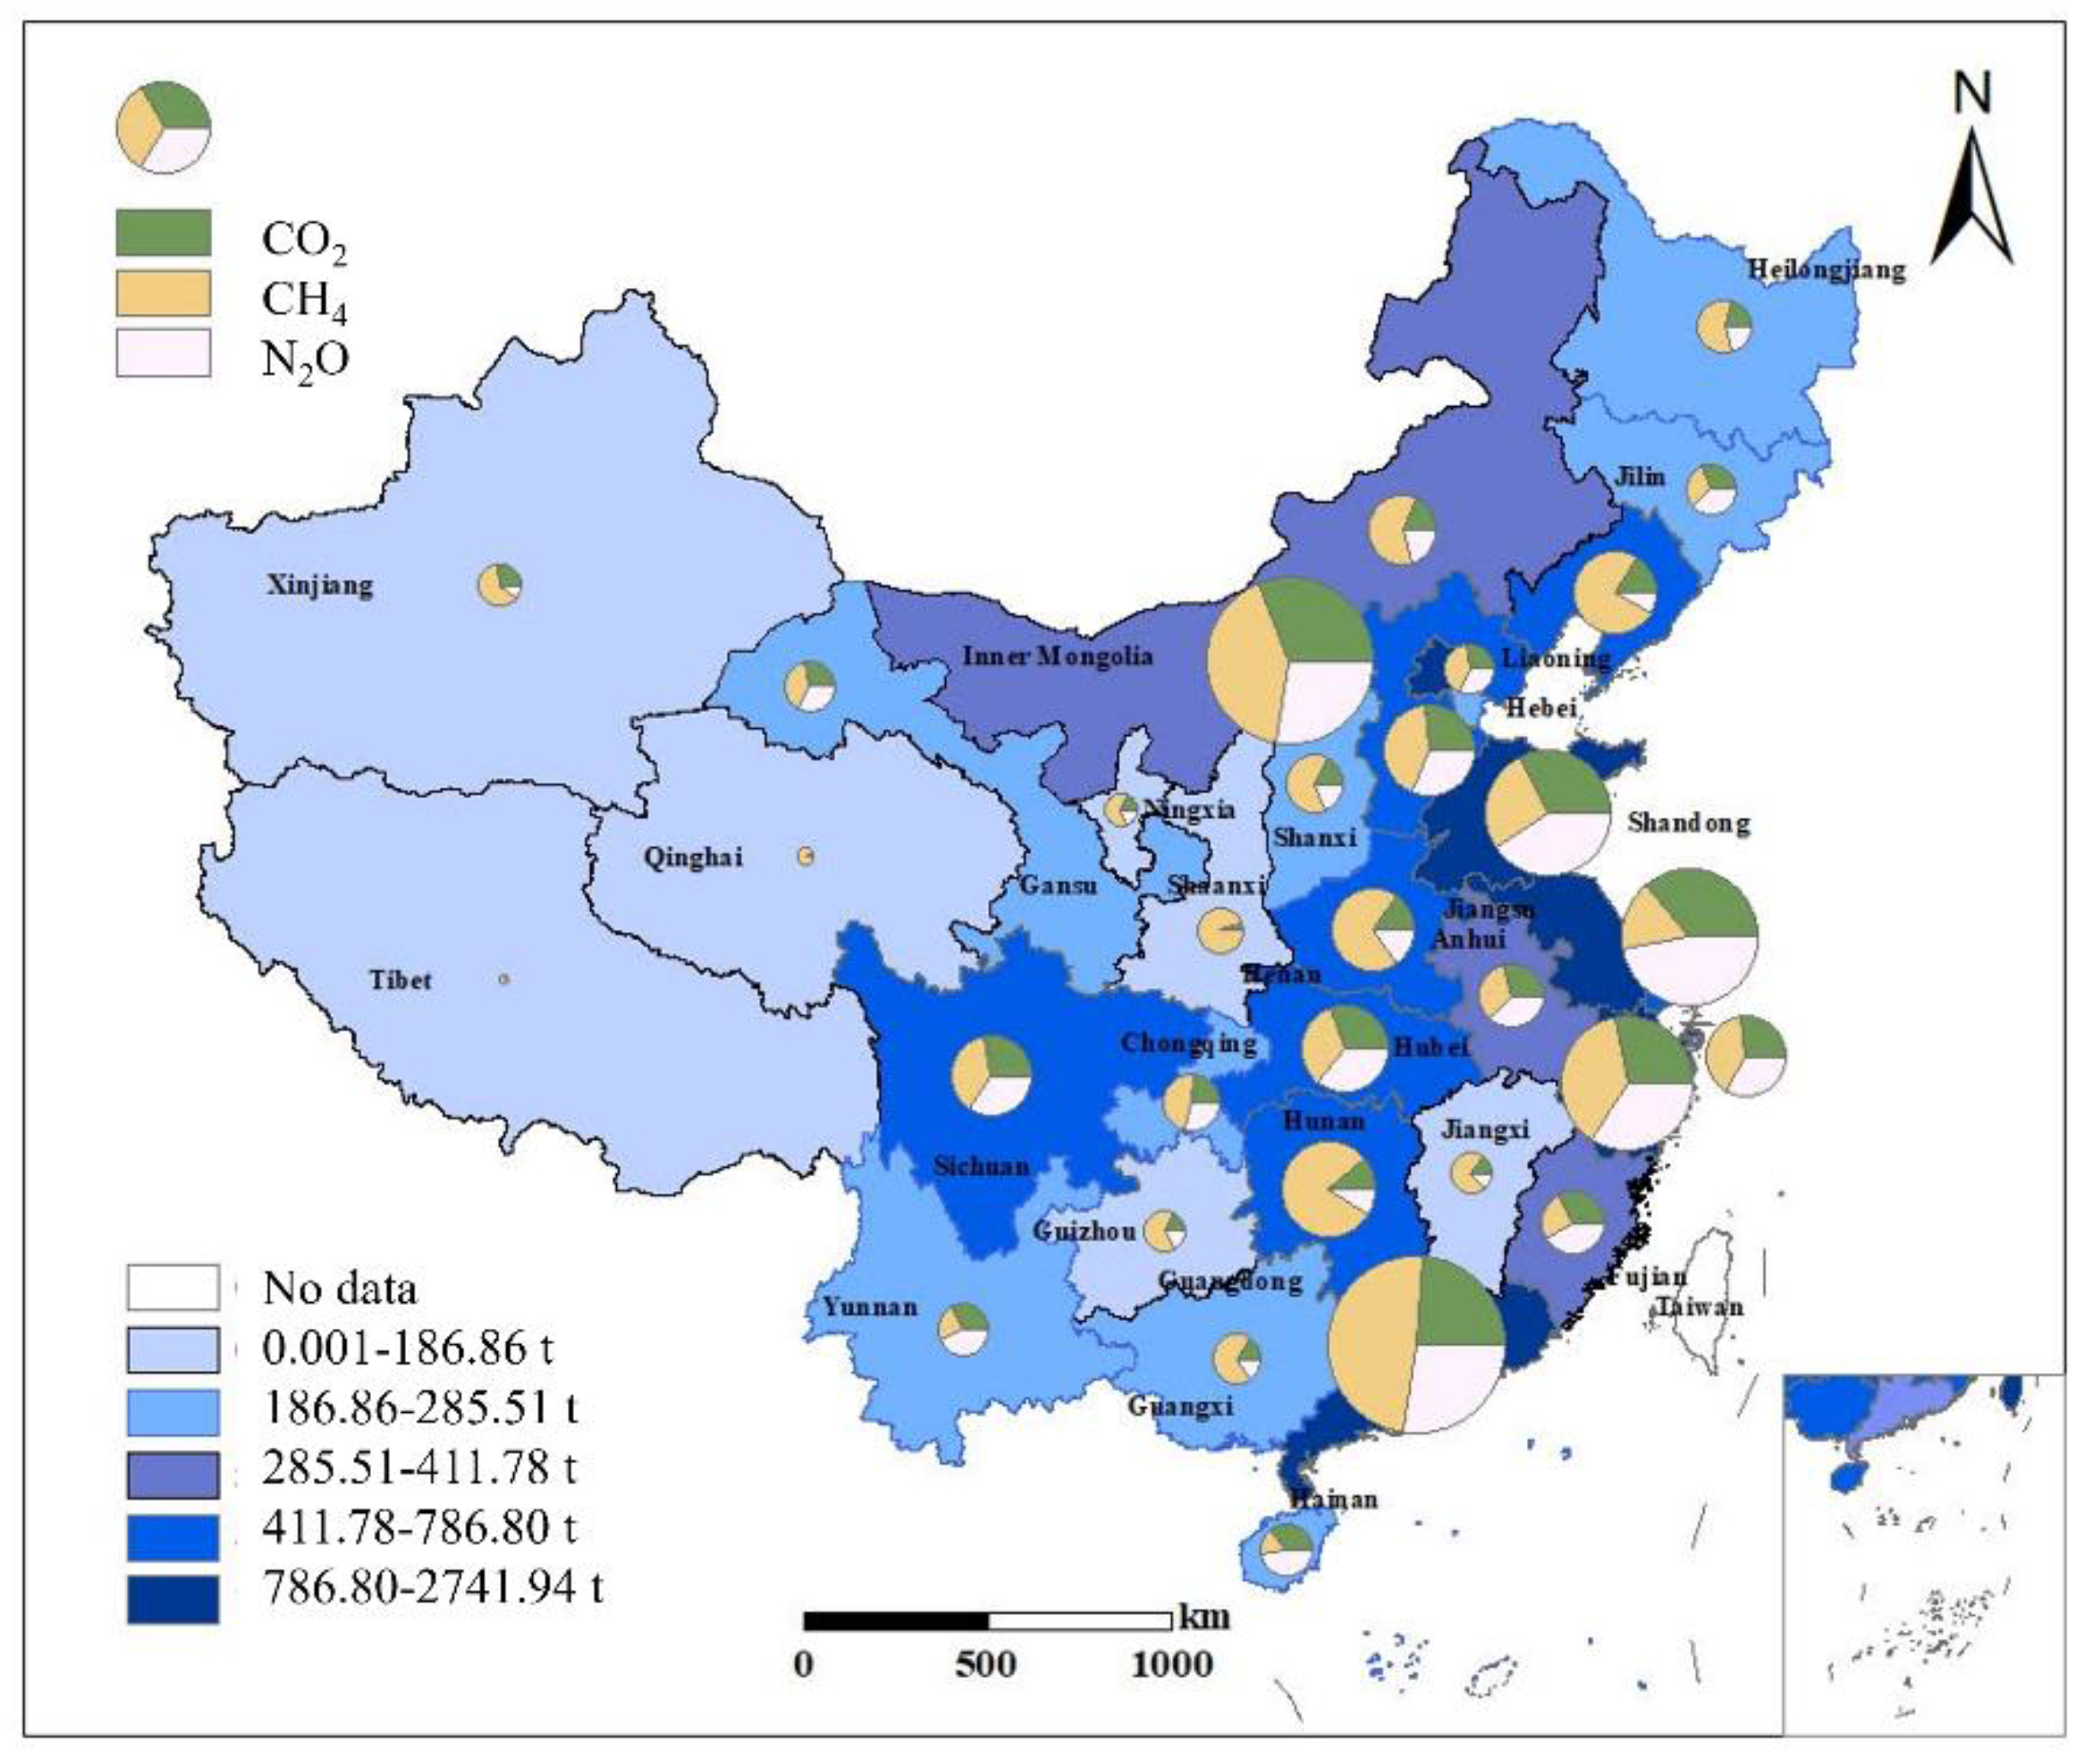
Figure 5.
Frequency counts of total GHG emission from sludge treatment industry in 660 cities.
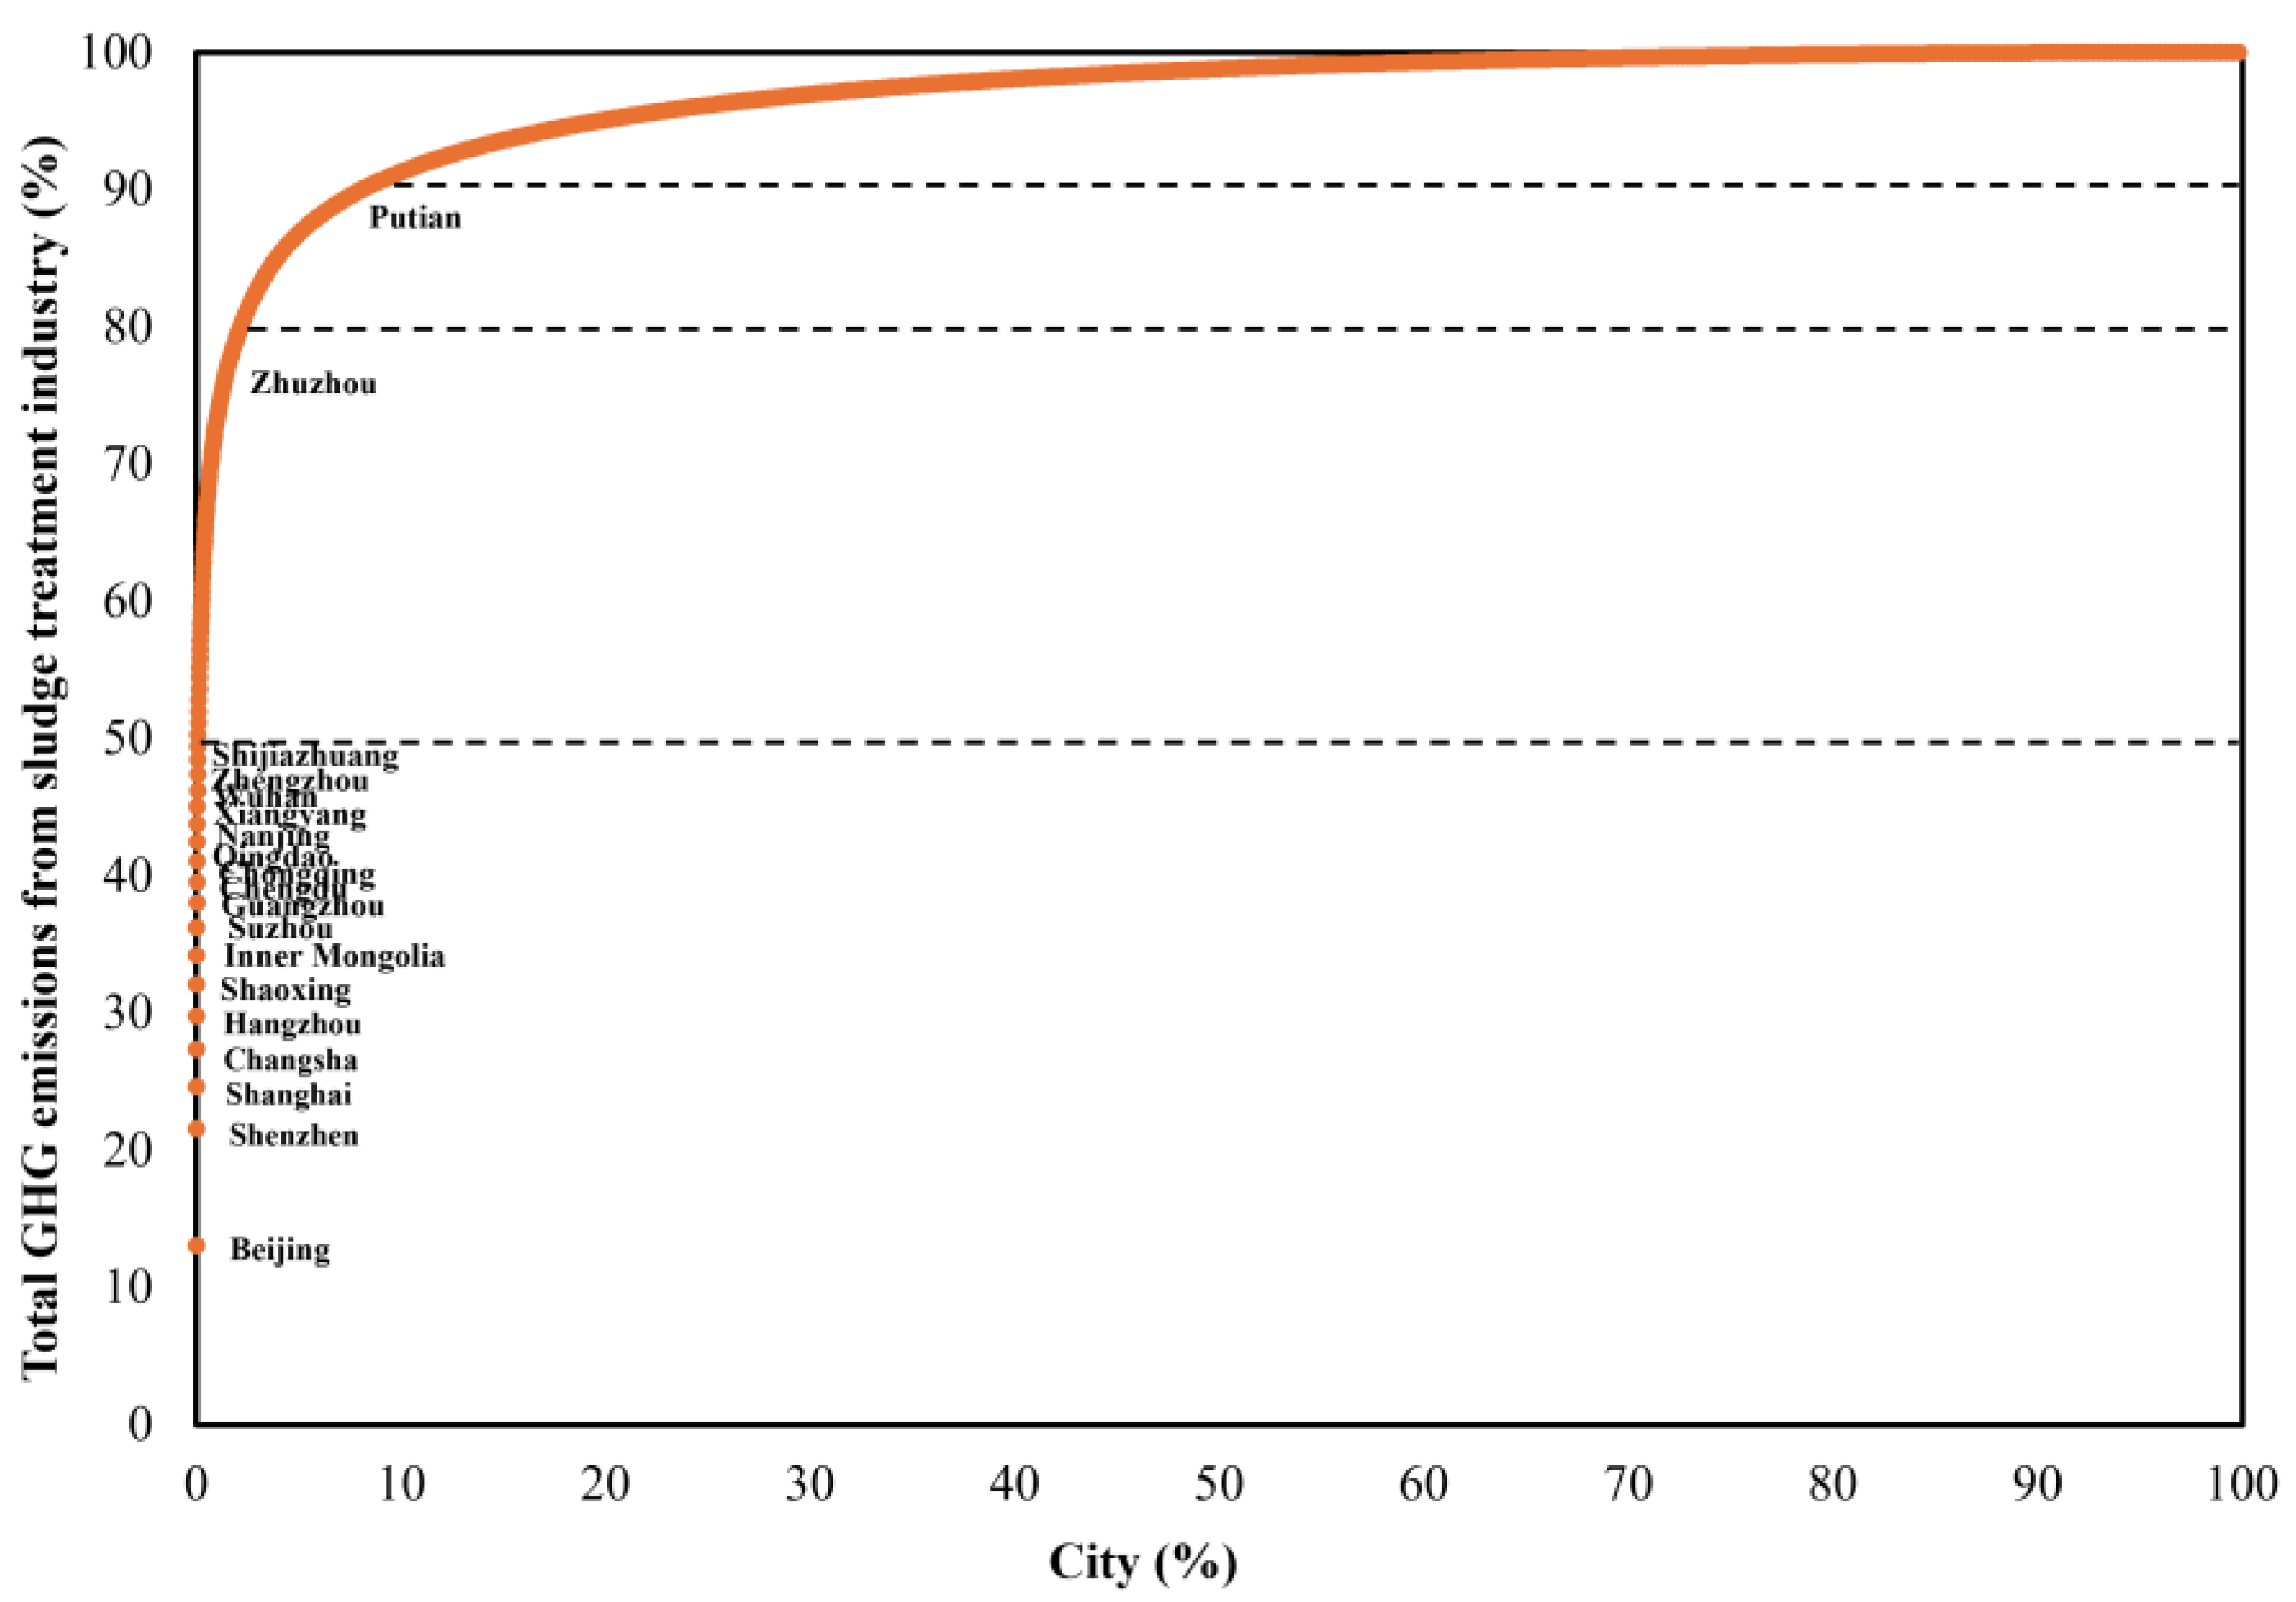

Table 1.
Reduction potential of GHG emissions and cost estimation of different sludge treatment industry.
Table 1.
Reduction potential of GHG emissions and cost estimation of different sludge treatment industry.
| Methods | Reduction potential (t CO2-eq/t DS) | Cost (USD/t DS) | References |
|---|---|---|---|
| Gasification | 0.33-0.46 | 200-400 | [22] |
| AD | 0.09-0.30 | 100-200 | [27,28] |
| HTP | 0.20-0.40 | 300-500 | [23,27] |
| WO | 0.10-0.30 | 150-300 | [29,30] |
| Pyrolysis | 0.15-0.30* | 250-450 | [27,31] |
*The GHG emission reduction potential for pyrolysis is inferred from the additional emissions resulting from a 15% reduction in energy and material recovery.
Disclaimer/Publisher’s Note: The statements, opinions and data contained in all publications are solely those of the individual author(s) and contributor(s) and not of MDPI and/or the editor(s). MDPI and/or the editor(s) disclaim responsibility for any injury to people or property resulting from any ideas, methods, instructions or products referred to in the content. |
© 2024 by the authors. Licensee MDPI, Basel, Switzerland. This article is an open access article distributed under the terms and conditions of the Creative Commons Attribution (CC BY) license (http://creativecommons.org/licenses/by/4.0/).
Copyright: This open access article is published under a Creative Commons CC BY 4.0 license, which permit the free download, distribution, and reuse, provided that the author and preprint are cited in any reuse.


