
Submitted:
06 June 2024
Posted:
07 June 2024
You are already at the latest version
Abstract
Sustainable development advocates for an environmentally friendly and resource-saving approach, fostering a new quality of productivity that is green and sustainable, and achieving a sustainable development where the economy and the environment are in harmony. The paper is based on clarifying the effects of coordinated development between the economy and the environment, and by establishing an indicator system, applying a remote sensing ecological index, entropy weight method, gray relational degree model, and a coupling coordination model, the relationship of coordinated development of Ordos in 2016-2022 is analyzed from a spatial-temporal perspective. The results are as follows: ① The years of coordinated development between the ecological environment and the economy are in the majority, while the uncoordinated years are fewer. ② The level of coordinated development between the ecological environment and the economy in the various regions of Ordos has been increasing year by year, but it still remains at the barely coordinated and primary coordinated levels. ③ The types of coordinated development between the ecological environment and the economy in Ordos exhibit significant spatial differentiation in terms of spatial distribution and clustering.Therefore, it is necessary to formulate coordinated development policies and measures according to the constraining factors of different regions.
Keywords:
sustainable development
; coupled coordination
; ecosystem
; economic system
; entropy method
; ordos
1. Introduction
Sustainable development advocates for an environmentally friendly and resource-saving approach, fostering a new quality of productivity that is green and sustainable, and achieving a sustainable development where the economy and the environment are in harmony.It implies the coordinated development of economic strength and the ecological environment, namely the efficient allocation of resources and sustainable economic growth. The sustainable development of Ordos is characterized by the upgrading of traditional energy industries, the coordinated development of pastoral areas, woodlands, agriculture, and farming, and the creation of new green productivity through the intertwined and coordinated development of the ecological environment and modern economy, tailored to local conditions. This represents a positive interaction process between ecology and the economy.This paper will conduct empirical research on these issues with the aim of promoting sustainable ecological and economic development in the Ordos region.
The study of the relationship between economic growth and the ecological environment has long been a key focus in the academic community. The “Externality Theory” or “Spillover Effect” proposed by British economists Kenneth J. Arrow and Arthur Cecil Pigou serves as the theoretical foundation for analyzing the ecological-economic relationship, which later developed into environmental economics [1].In the 1960s, Cass (Cass, D., 1965) and Koopmans (Koopmans,T.C.,1965) introduced Ramsey’s (Ramsey,F.,1928) optimal consumer analysis into the neoclassical growth model, forming the Ramsey-Cass-Koopmans model.[2,3] Initially, this model was used to analyze the savings rate and has since been widely applied to the study of environmental and economic relationships.In the 1990s, Panayotou borrowed the inverted U-shaped moderating proposed by Kuznets in 1955, which described the relationship between per capita income and income inequality, to introduce the Environmental Kuznets Curve (EKC) for the first time.[4,5] This model calculates the relationship between environmental sustainability and real income per capita level nexus[6], revealing an inverted U-shaped moderating between the environment and income.The EKC established the foundation for research in the eco-economic field. In 2021, the UK Treasury commissioned the release of “The Dasgupta Review”[7], which considers environmental value as an important indicator of societal wealth and proposes a logical connection between the ecological environment and economic development. Scholars Rahman, M.M.,[8] et al. used ARDL models (Autoregressive Distributed Lag Models) to analyze the spatiotemporal evolution of the synergy between traditional economic growth models, primarily based on renewable energy consumption, and the ecological environment in 10 countries, including Bangladesh, Brazil, and China, from 1990 to 2020. Aragóne, L.[9] used a remote sensing ecological model to analyze the eco-economy of the inselberg regions in Colombia. Ni J.L.[10] used a coupling coordination degree model to analyze the coupling coordination degree of Hangzhou’s eco-economic system. Most coupling studies by scholars, start from the environmental and economic systems within a specific region, using methods such as the entropy weight method and the grey relational analysis to examine the current state of development and the evolving trends of their relationship.
Therefore, this article would comprehensive evaluates the economic development of 9 regions in Ordos from 2016-2022 through the entropy method, grey relational comprehensive evaluation. In this article, the study area and datas are introduced in Section 2. The economic development variables of regional economy in Ordos from 2016-2022 are discussed by major-element analysis and correlation analysis in Section 3. And the entropy method is used to calculate the economic indicators in regional economy in Ordos in this section. Then in Section4, the economic development spatial-temporal evolution of comprehensive evaluation of regional Economic in Ordos based on entropy method and grey relational model were presented, and finally, the concluding remarks are given in Section5.
This study uses the Remote Sensing Ecological Index to process and analyze ecological data and employs the entropy method and grey relational analysis to process and analyze qualitative and quantitative economic data indicators. Finally, the evaluation results of the two subsystems are subjected to coupling coordination analysis. This method can effectively handle various types of quantitative and qualitative indicator data, accurately, reasonably, and truly reflecting the coupling coordination degree of the eco-economy from the perspective of sustainable development.
Materials and Methods
2.1. Study area and Research data
2.1.1. Study area
Ordos is located in the southwestern part of Inner Mongolia Autonomous Region, surrounded by the Yellow River on three sides—northwest, north, and east—and adjacent to the provinces of Shanxi, Shaanxi, and Ningxia.With a total area of 87,000 square kilometers, Ordos includes the Dongsheng District, Kangbashi District, and the banners of Jungar, Ejin Horo, Otog, Uxin, Dalad, Otog Front, and Hanggin, totaling 2 districts and 7 banners (Figure 1).Ordos has a favorable environment and climate, with a forest coverage rate of 27.42%. The city’s permanent population is 2.2007 million (as of 2022), and the total annual output value of agriculture, forestry, animal husbandry, fishery, and related services is $42.9935 hundred million.
2.1.2. Data
The data required for the study includes land use data and economic data. The land use data comes from the Resource and Environment Science Data Center of the Chinese Academy of Sciences (http://www.resdc.cn), which provides remote sensing monitoring data for land use for the years 2016, 2018, 2020, and 2022[11,12,13,14]. The resolution is 30m* 30m, with a comprehensive accuracy of over 90% for secondary land categories. Socio-economic data (Table 1) comes from the “Ordos Statistical Yearbook” and statistical bulletins of the corresponding years.
2.1. Establishment of the Index System
At present, most studies on the measurement of ecosystems and economic systems for comprehensive regional ecological-economic synergy evaluations use methods such as the entropy weight method, principal component analysis, analytic hierarchy process, and factor analysis. However, these methods have some limitations. For instance, the entropy weight method, principal component analysis, and analytic hierarchy process can only rely on land use data when evaluating ecological systems, which does not allow for an intuitive, accurate, and comprehensive reflection of the local ecological environment. Some scholars who use remote sensing ecological index models (RSEI models) and fractional vegetation cover models (FVC models) to create intuitive maps and quantitative analyses of the ecological environment lack corresponding economic analyses. They focus solely on environmental response mechanisms without considering the impact of economic systems, thus failing to accurately describe the coordination of different dimensions and subsystems. The sustainable development of a city is a complex system of interconnected and interacting elements. The integrated development and mutual influence of the ecological and economic subsystems promote the formation, evolution, and transformation of the sustainable development system. Therefore, this paper uses the remote sensing ecological index to analyze ecological data, and applies the entropy method and grey relational analysis to qualitatively and quantitatively process economic data. Finally, the evaluation results of the two subsystems are coupled and analyzed for synergy.This method can effectively handle various types of qualitative and quantitative indicator data, accurately, reasonably, and realistically reflecting the coupling and coordination degree of the ecological-economic system from the perspective of sustainable development (as shown in Figure2).
2.1. Comprehensive Evaluation of the Ecological Environment
2.3.1. Remote Sensing Ecological Index model
The Remote Sensing Ecological Index (RSEI) model combines four remote sensing index bands: humidity (WET), greenness (NDVI), dryness (NDSI), and heat (LST), into a new index image for principal component analysis. To ensure that higher values represent better ecological conditions, 1 is subtracted from the PCA to obtain the initial ecological index RSEI0, which is then normalized to construct the Remote Sensing Ecological Index (RSEI). The calculation methods for the four remote sensing indices are as follows:
- Humidity index (WET):
The calculation formulas for Landsat 5 (TM) and Landsat 8 (OLI) are as follows:
In formulas (1) and (2): ρBlue、ρGreen、ρRed、ρNIR、ρSWIR1、ρSWIR2, and ρSWIR2 represent the reflectance of the blue, green, red, near-infrared, shortwave infrared 1, and shortwave infrared 2 bands, respectively.
Greenness Index (NDVI):
In formula (3): ρNIR and ρRed represent the reflectance of the near-infrared and red bands, respectively.
- Dryness index (NDSI):
The dryness index is synthesized from the bare soil index (SI) and the building index (IBI), and is denoted as NDSI.
In formulas (4) to (6):ρBlue、ρGreen、ρRed、ρNIR、ρSWIR1 represent the reflectance of the blue, green, red, near-infrared, and shortwave infrared 1 bands, respectively.
- Heat index (LST):
Surface temperature is used to represent heat. First, the brightness temperature T is obtained, and then it is corrected for emissivity to obtain the land surface temperature (LST).
In formula (7) :λis the central wavelength of the TM\ETM+thermal infrared band (λ= 11.435μm) and the central wavelength of the OLI thermal infrared band (λ= 10.9μm); ρ = 1.438×10⁻² mK. ε is the land surface emissivity, and T is the brightness temperature.
According to the empirical formula for calculating land surface emissivity, when the NDVI value of the surface is 0.157~0.727, the empirical relationship between land surface emissivity ε and NDVI is:
When NDVI < 0, ε is set to 0.995 (water); when 0 < NDVI < 0.157, the vegetation cover is very low, and ε is set to 0.923; when NDVI > 0.727, ε is set to 0.986.
2.3.2. Comprehensive Evaluation of the RSEI Ecological Index in Ordos
Ordos has various types of landscapes, including grasslands, forests, deserts, and Gobi. To better assess changes in ecological conditions, the RSEI values are further divided into five equal intervals, representing five ecological statuses: poor (0-0.2], relatively poor (0.2-0.4], medium (0.4-0.6], good (0.6-0.8], and excellent (0.8-1.0].Comprehensively evaluate the ecological index models for 2016, 2018, 2020, and 2022, and create graded remote sensing ecological index maps (Figure3)
2.3.3. Comprehensive evaluation of ecological environment of Ordos
Based on the data model, normalize the comprehensive evaluation data of the ecological index for each banner and district of Ordos to obtain dimensionless comprehensive evaluation results of the ecosystem (Table 2).
The evaluation of the ecological environment in various banners and districts of Ordos from 2016 to 2022 shows that the banners and districts with relatively good ecological environments are Yijinhuoluo Banner, Jungar Banner, and Kangbashi District(Figure4).
2.1. Comprehensive Evaluation of the Economic Development Levels in Ordos
2.4.1. Entropy Method and Indicator Weights
- Normalization
Using min-max normalization to perform linear transformation on the original data eliminates the differences in dimensions between different indicators and enhances the comparability between them.
- Positive indicators:
- Negative indicators:
In the formula, is the normalized value, which ranges between [0,1],is the value of the indicatorfor region in theyear.、are the minimum and maximum values of the indicator, respectively.
- Entropy weight method for calculating weights
In the formula, is Year ; is regions ; is indicators ; is the weight of index ; is the information entropy of the index ; constant=1/ln(m), is the sample index weight of indicatorin region inyear t. If=0, then define ln()=0。
Calculation of the Economic Development Index
In the formula, S is economic development index is the weight of index is the normalization value of index.
2.4.2. Indicator Weights
2.1. Comprehensive Evaluation of Grey Relational Analysis
2.5.1. Grey Relational model
Grey relational analysis is a computational model that explains the primary and secondary factors driving the development of a system by analyzing the closeness of relationships between different factors within the system. The essence of the grey relational model is to compare the curves formed by several sequences with the curve of the ideal optimal sequence, rank them, list the order of the evaluation objects, and evaluate their merits based on the values of the grey relational degrees.
2.5.2. Calculation Formula for Grey Relational Coefficients
In formula(16), represents the absolute difference between the i evaluation sequence after standardization and the optimal ideal sequence on the j indicator.
The formula of Grey Relational Model is as follow:
In formula(17),is entropy weight, is grey relational coefficient.
2.5.3. Comprehensive evaluation results based on entropy weight and grey relational analysis
According to the calculation formulas (16) and (17) for entropy weight, using the comprehensive evaluation of entropy weight and grey relational analysis, the comprehensive economic development results of Ordos from 2016 to 2022 were calculated based on the data of economic indicators screened from Table 4 (Table 4).
2.5.4. The analysis of comprehensive economic evaluation results
Based on the indicator system and the calculation model, the comprehensive scores of economic development levels in the Ordos region from 2016 to 2022 were obtained, as shown in Table 3. Except for the different degrees of economic decline across all banners and districts in 2018, the overall trend for the nine banners and districts has been upward over the six years from 2016 to 2022 (Figure 5). As seen in Figure 2, Dongsheng District, Zhungeer Banner, and Yijinhuoluo Banner rank among the top three in the city’s economic development levels.
2.1. Eco-Economic Coupling and Coordination Analysis
Based on the geometric mean method and the linear weighting method, the sub-integrated development level evaluation model can be obtained.
Coupling is originally a concept from physics, used to describe the phenomenon where two or more systems influence each other through various interactions. The model for the degree of coupling of multiple interacting systems is as follows:
In the formula, is the coupling degree of n, andare the contributions of the first subsystem to the n subsystem to the overall system. The calculation method is :
In the formula, represents the contribution of the i subsystem to the overall system order; is the normalized value of the j indicator in the i subsystem; is the weight of the j indicator in the i subsystem, with the weights of each subsystem’s indicators calculated using the entropy weight method. Thus, the coupling degree model of the ecological environment system and the economic system is obtained:
The formula is the Coupling Coordination Degree Model. represents the comprehensive evaluation index of the ecological environment system, and represents the comprehensive evaluation index of the economic system. C is the coordination degree, which ranges between 0 and 1 as indicated by formula (21). The smaller the C value, the less coordinated the system is, and the larger the C value, the more coordinated the system is.
4. Discussion
From the comprehensive economic evaluation results, it can be seen that the economic development of the Ordos region mainly relies on traditional mining industries such as coal mining. To better examine the changes in eco-economic coupling coordination, the degree of coupling coordination is divided into 10 levels at equal intervals, representing 10 coordination statuses: extreme disorder (0–0.1), severe disorder [0.1–0.2), moderate disorder [0.2–0.3), mild disorder [0.3–0.4), near disorder [0.4–0.5), barely coordinated [0.5–0.6), primary coordination [0.6–0.7), intermediate coordination [0.7–0.8), good [0.8–0.9), and excellent [0.9–1.0). Based on formulas (10) to (13), the eco-economic coupling coordination degree of the ecological system (Table 2) and the economic system (Table 4) in the Ordos region is calculated, with the results shown in Figure 6(Figure6).
The spatial-temporal Evolution of the Coupling and Coordination of Ecology and Economy in Ordosare as follows: ① The years of coordinated development between the ecological environment and the economy are in the majority, while the uncoordinated years are fewer. ② The level of coordinated development between the ecological environment and the economy in the various regions of Ordos has been increasing year by year, but it still remains at the barely coordinated and primary coordinated levels. ③ The types of coordinated development between the ecological environment and the economy in Ordos exhibit significant spatial differentiation in terms of spatial distribution and clustering.
5. Conclusions
After classifying each banner and district of Ordos according to the coupling coordination degree standards, the spatiotemporal evolution coupling coordination degree model of each banner and district in Ordos from 2016 to 2022 can be obtained (Figure 7).
Based on the Figure 7 (Figure 7), some areas in the Ordos region were in a mildly imbalanced stage before 2018. During these, Ejin Horo Banner in the heart of the Maowusu Desert and Hangjin Banner in the center of the Kubuqi Desert had poor ecological environments, with economies primarily based on traditional agriculture and animal husbandry, resulting in relatively lagging economic development. The areas with better coupling coordination degrees were Dongshen District, Jungar Banner, Ejin Horo Banner, and Kangbashi District. From 2018 to 2020, all banners and districts were in a coordinated stage, with the average coupling coordination degree of the whole city being 0.5. After 2020, the coordination degree of all banners and districts in the city significantly improved, with the coupling coordination degree ranging from 0.6 to 0.7, and some banners reaching a primary coordination state. Therefore, it is necessary to formulate coordinated development policies and measures according to the constraining factors of different regions.
References
- 1. Setioningtyas WP, Illés CB, Dunay A, Hadi A, Wibowo TS. Environmental Economics and the SDGs: A Review of Their Relationships and Barriers. Sustainability, 7513. [CrossRef]
- Xia, ZN. Dynamics of Pseudo Almost Periodic Solution for Impulsive Neoclassical Growth Model. Anziam Journal. [CrossRef]
- Gómez, MA. Economic growth and factor substitution with elastic labor supply. Mathematical Social Sciences, l94. [CrossRef]
- 4. Zheng H, Aishan W. ESG ratings and trade credit:inverted U-shaped moderating role of information transparency and executives with overseas backgrounds. Environmental Science and Pollution Research, 7855. [CrossRef]
- 5. Leal PH, Marques AC. The evolution of the environmental Kuznets curve hypothesis assessment:A literature review under a critical analysis perspective. HELIYON, 1152. [CrossRef]
- 6. Saint Akadiri S, Bekun FV, Sarkodie SA. Contemporaneous interaction between energy consumption, economic growth and environmental sustainability in South Africa: What drives what? Science of the total environment, 468–475. [CrossRef]
- Spash, CL. The economics of Biodiversity: The Dasgupta Review. Biologiccal Conservation, 1093. [Google Scholar] [CrossRef]
- 8. Rahman MM, Khan Z, Khan s, Abbas S. Disaggregated energy consumption, industrialization, total population, and ecological footprint nexus: evidence from the world’s top 10 most populous countries. ENVIRONMENTAL SCIENCE AND POLLUTION RESEARCH, 1190. [CrossRef]
- 9. Aragón L, Messier J, Atuesta-Escobar N, Lasso E. Tropical shrubs living in an extreme environment show convergent ecological strategies but divergent ecophysiological strategies. ANNALS OF BOTANY, 491–502. [CrossRef]
- 10. Ni JL, Zheng XD, Zheng YM, Zhang YH, Li, H. Coupling Coordination Development of the Ecological-Economic System in Hangzhou, China. SUSTAINABILITY, 1657. [CrossRef]
- Ordos Autonomous Region Bureau of Statistics. Inner Mongolia Statistical Yearbook 2016 [M]. C: Beijing, 2016.
- Ordos Autonomous Region Bureau of Statistics. Inner Mongolia Statistical Yearbook 2016 [M]. C: Beijing, 2018.
- Ordos Autonomous Region Bureau of Statistics. Inner Mongolia Statistical Yearbook 2016 [M]. C: Beijing, 2020.
- Ordos Autonomous Region Bureau of Statistics. Inner Mongolia Statistical Yearbook 2016 [M]. C: Beijing, 2022.
Figure 1.
Scope of study area
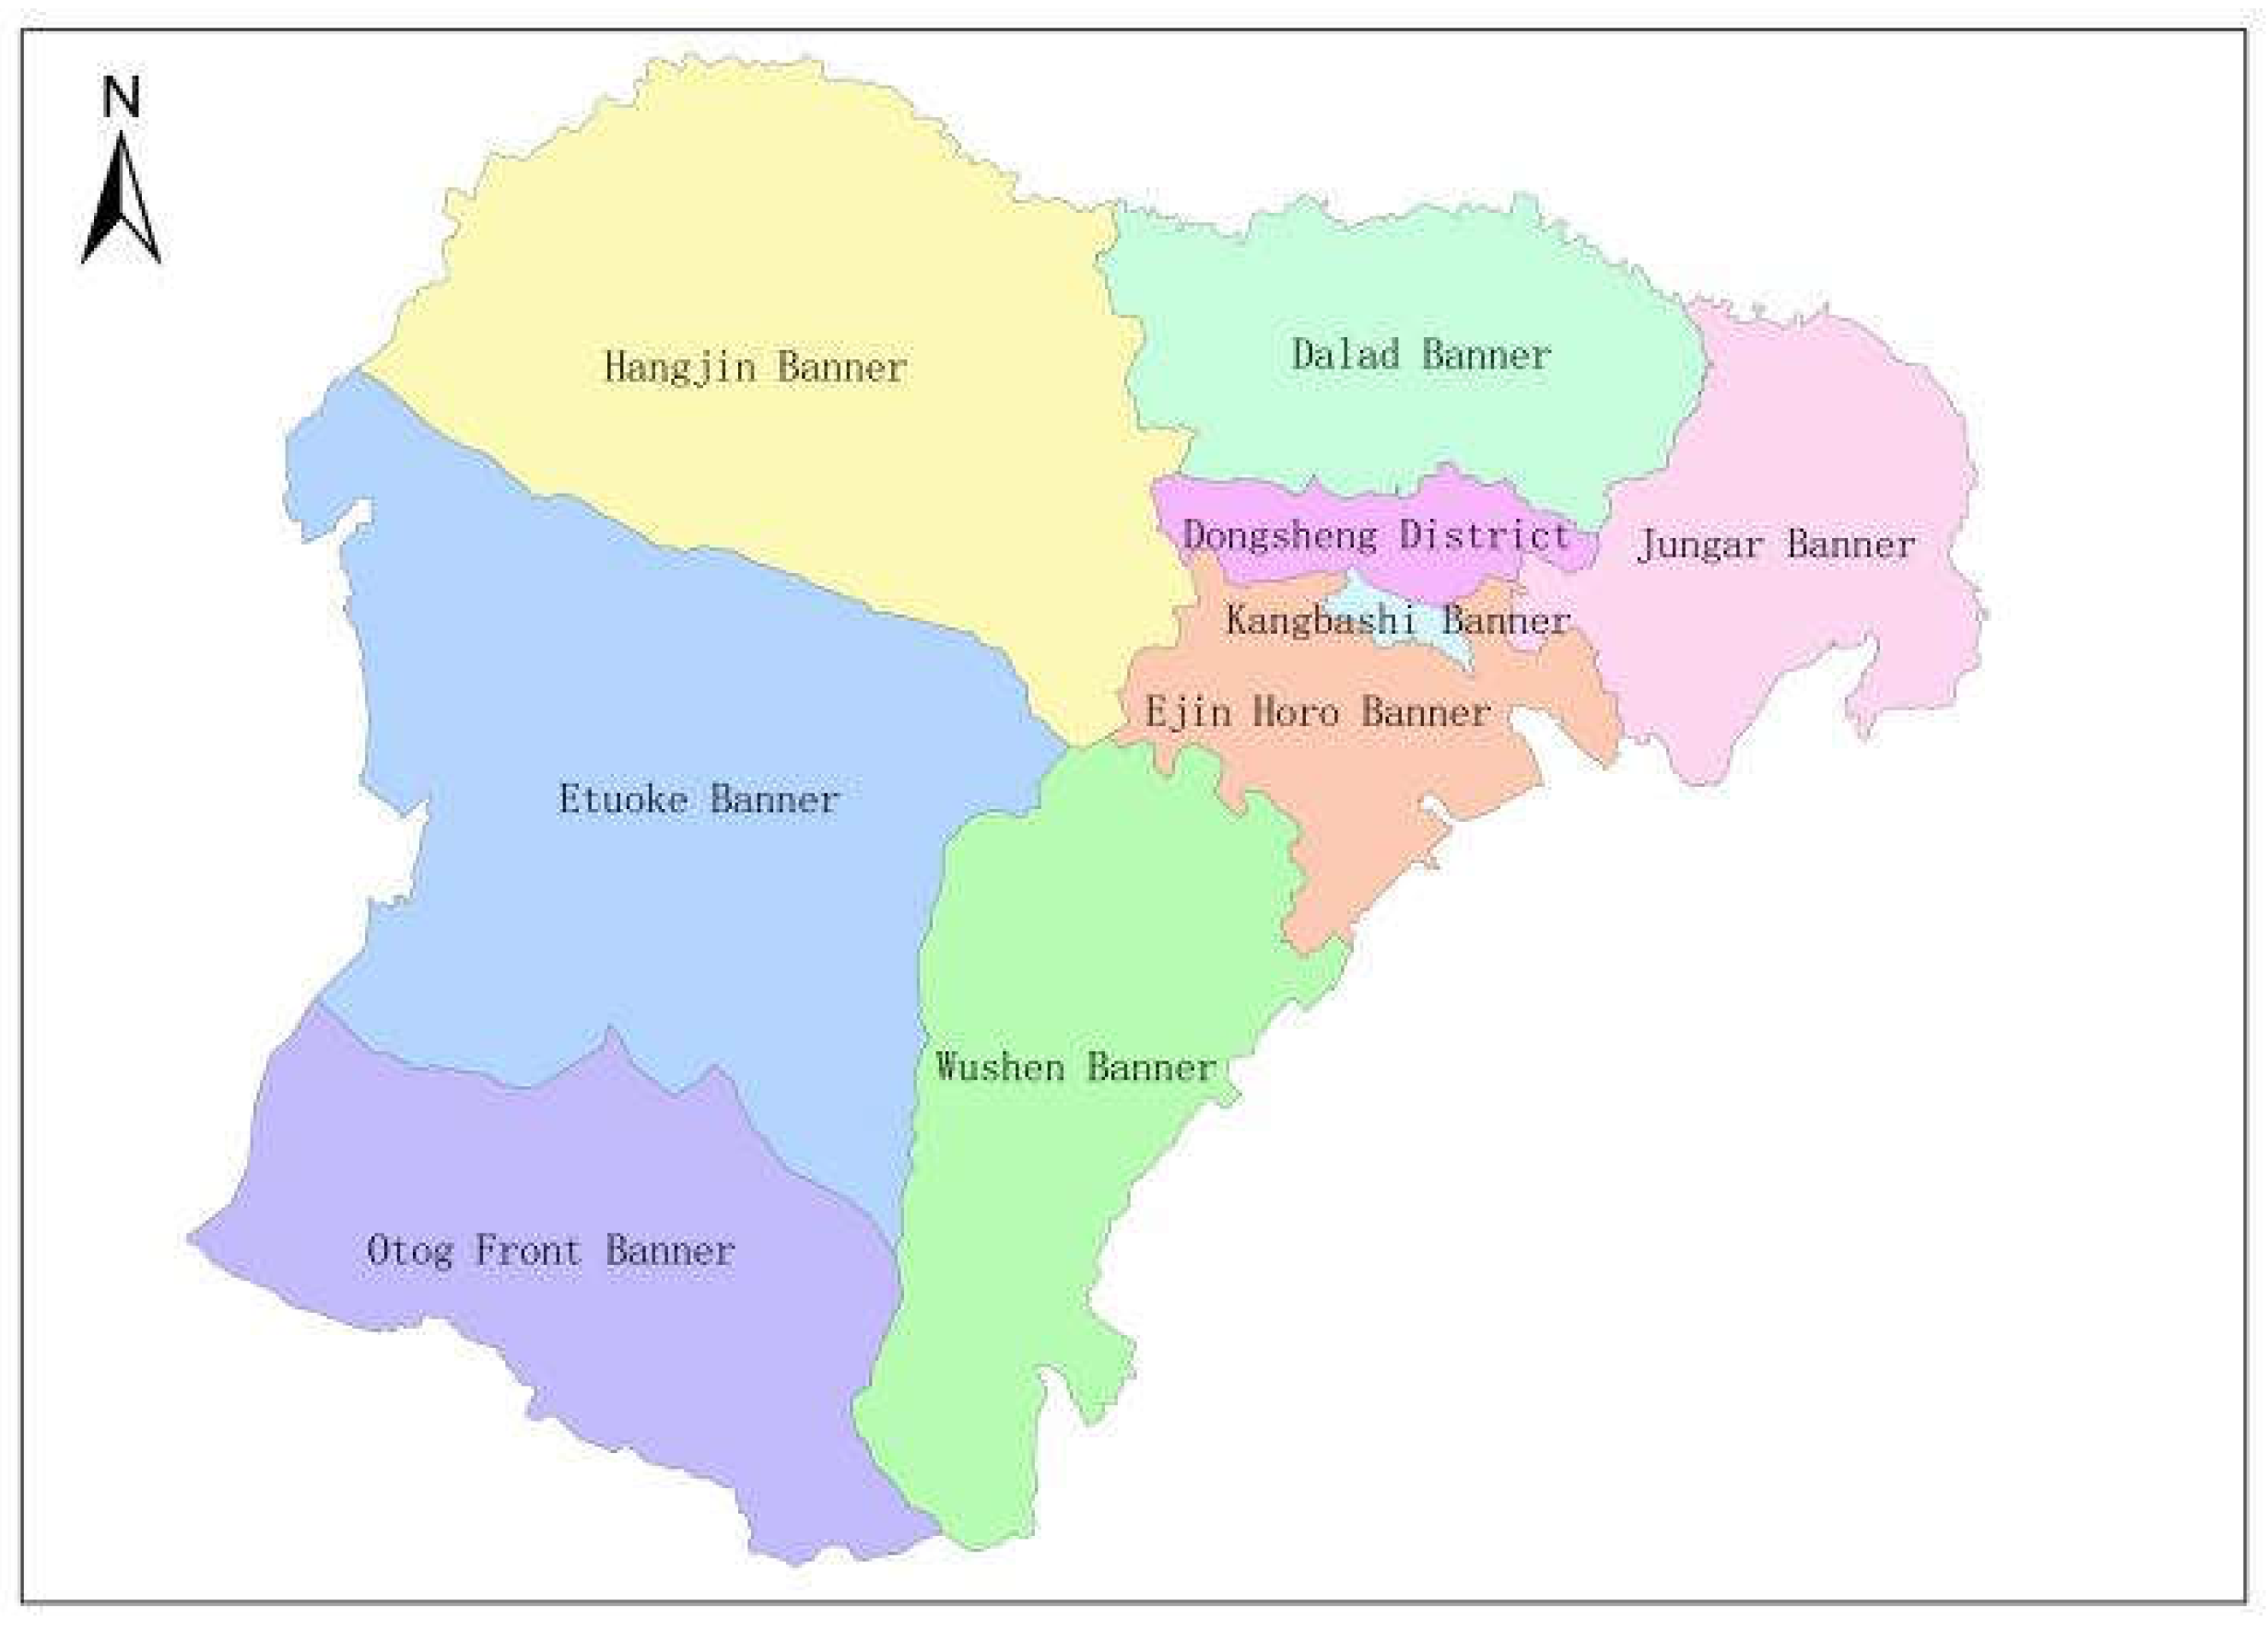
Figure 2.
Economic-Ecological Coupling Evaluation Model from the Perspective of sustainable Development.
Figure 2.
Economic-Ecological Coupling Evaluation Model from the Perspective of sustainable Development.
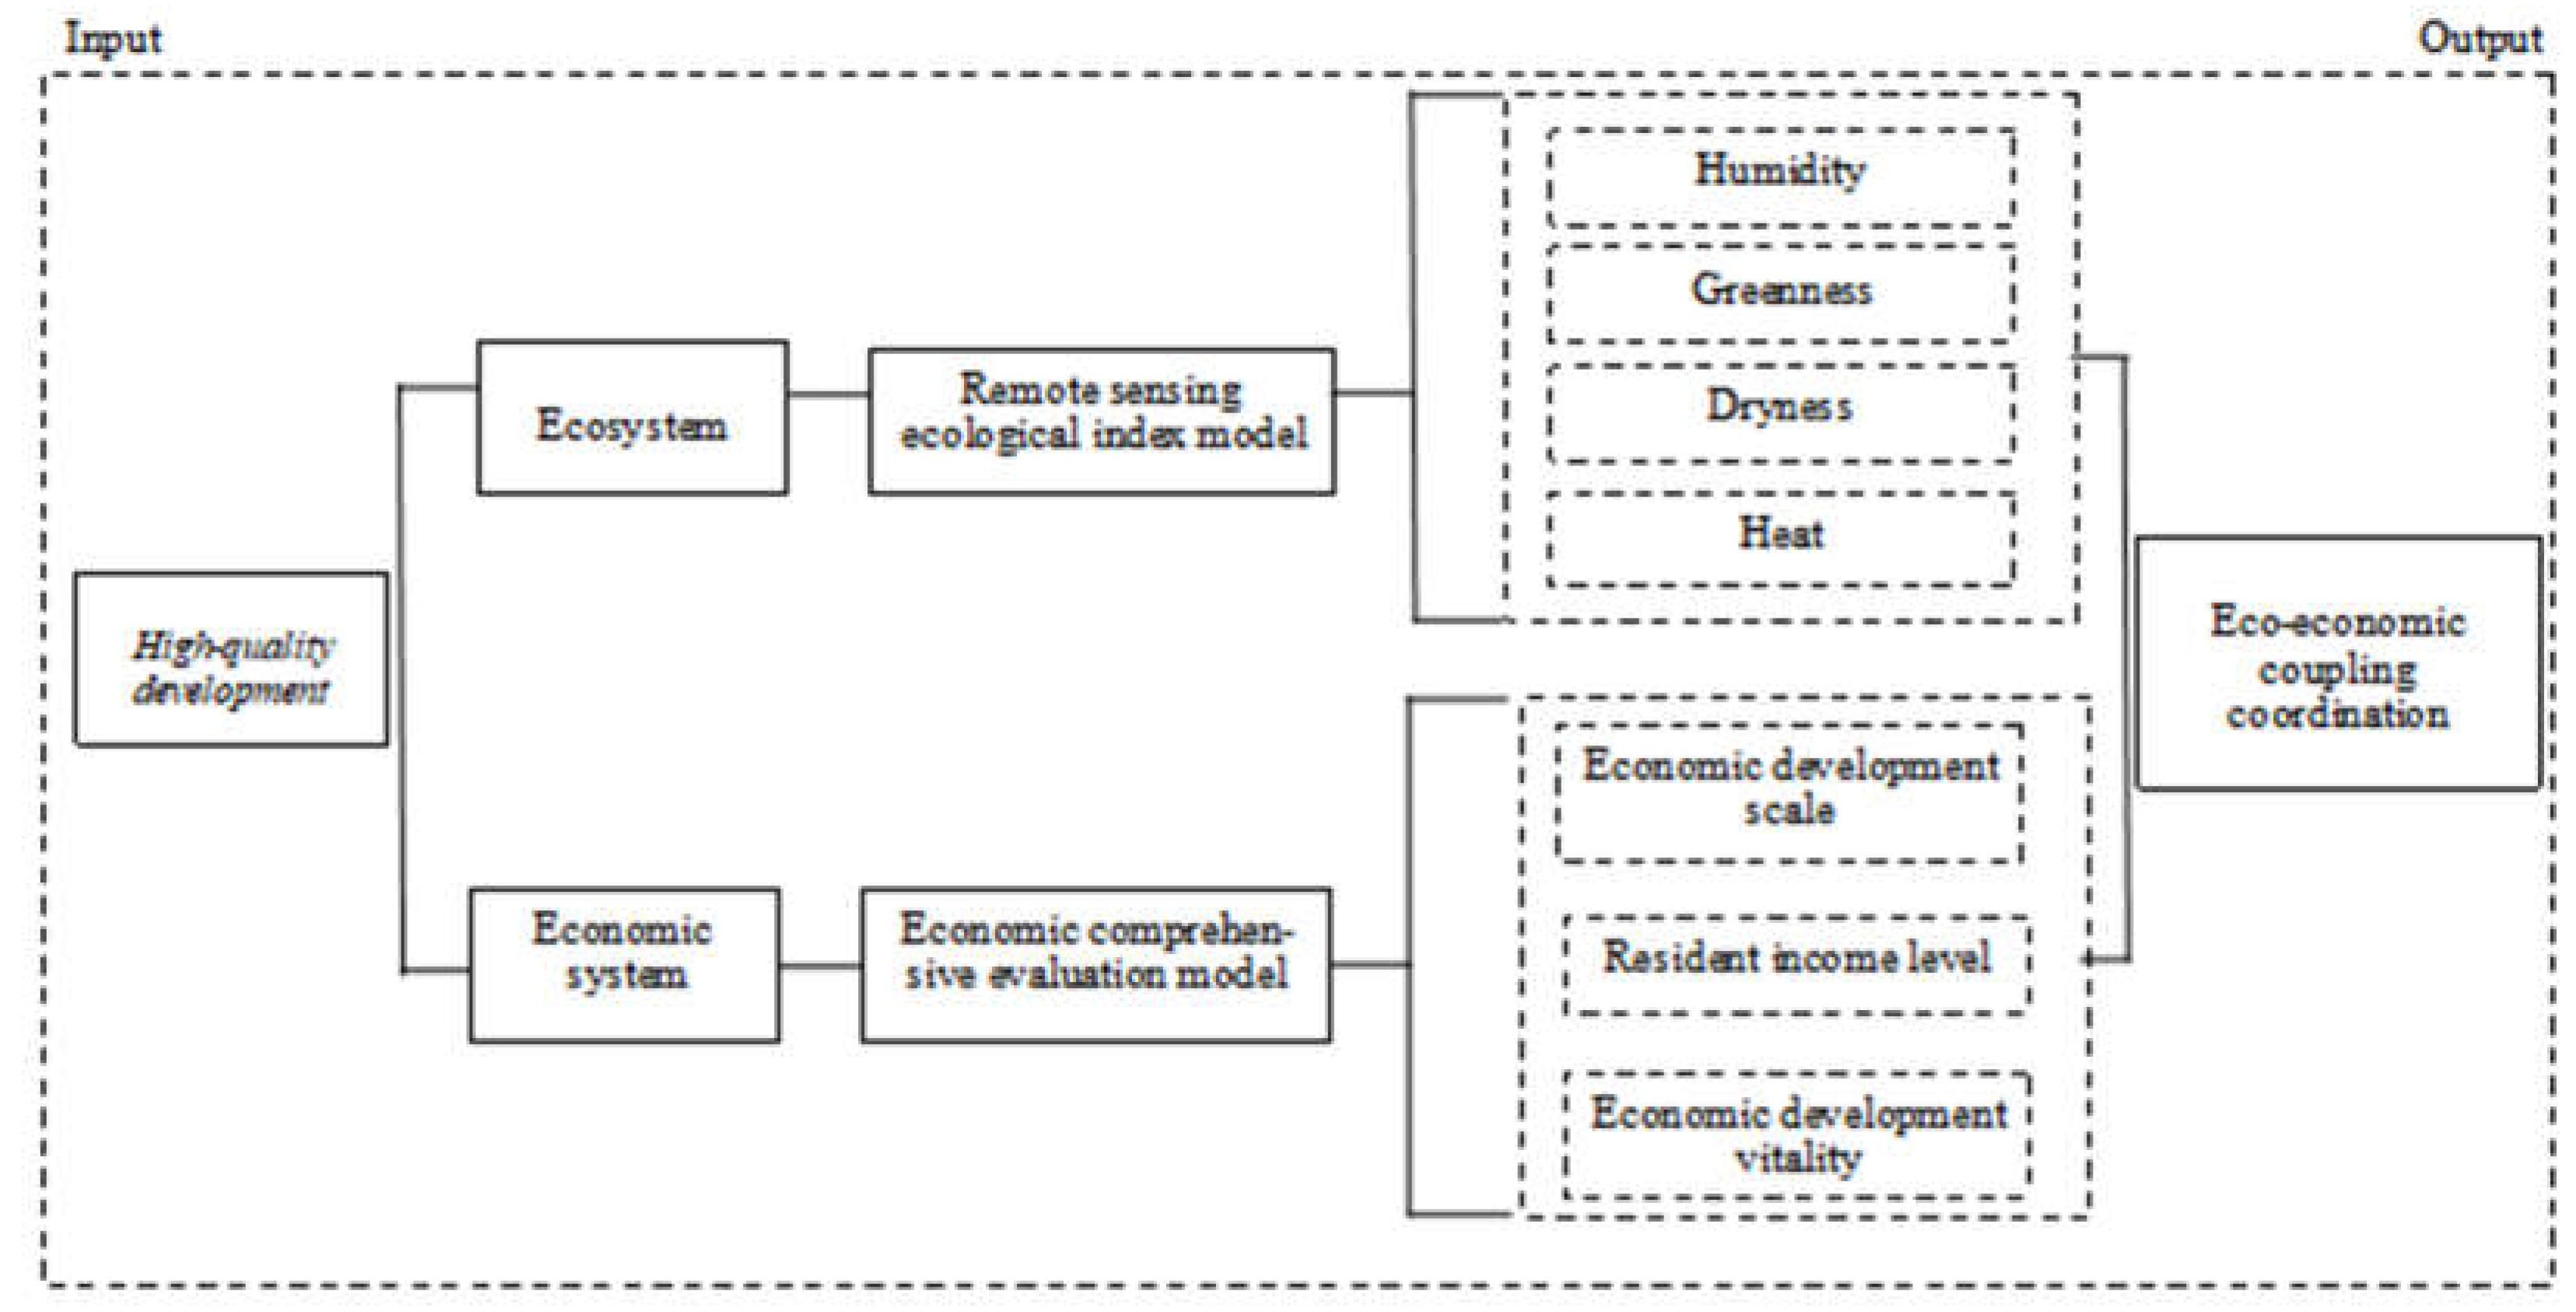
Figure 3.
(a)(b)(c)(d) is the spatial-temporal evolution of RSEI in Ordos.
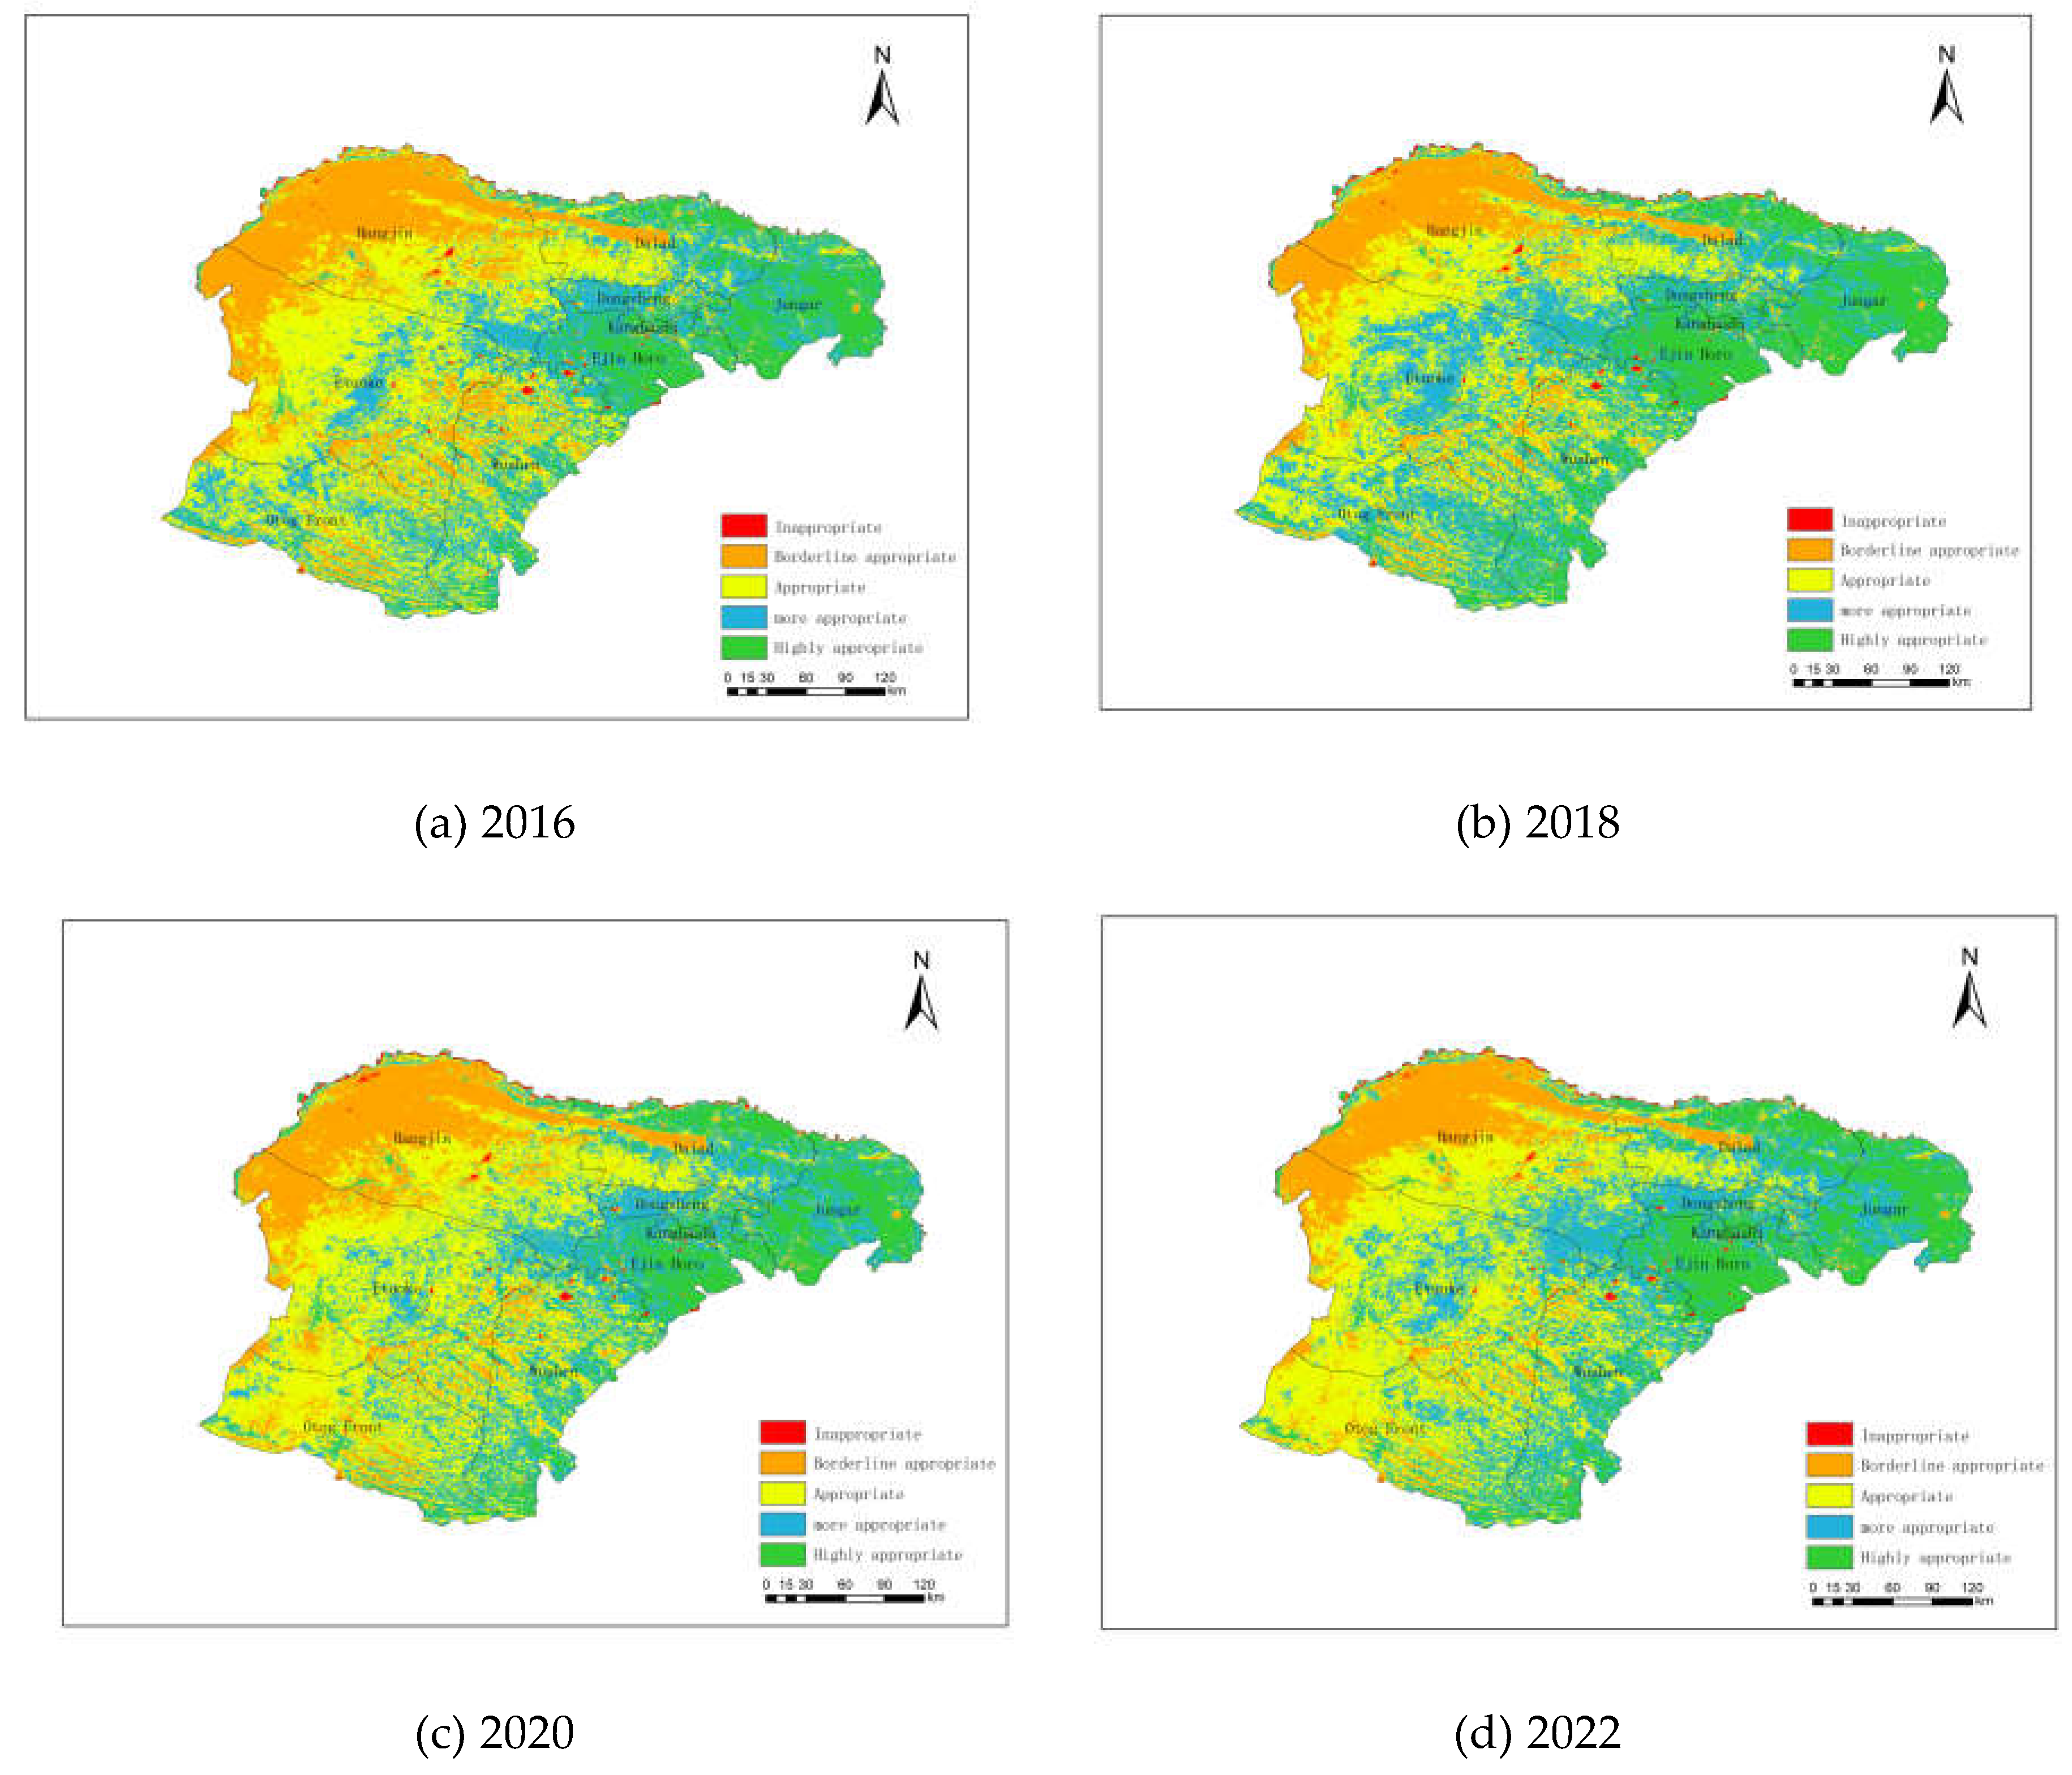
Figure 4.
Comprehensive evaluation of ecological environment of Ordos(2016-2022).
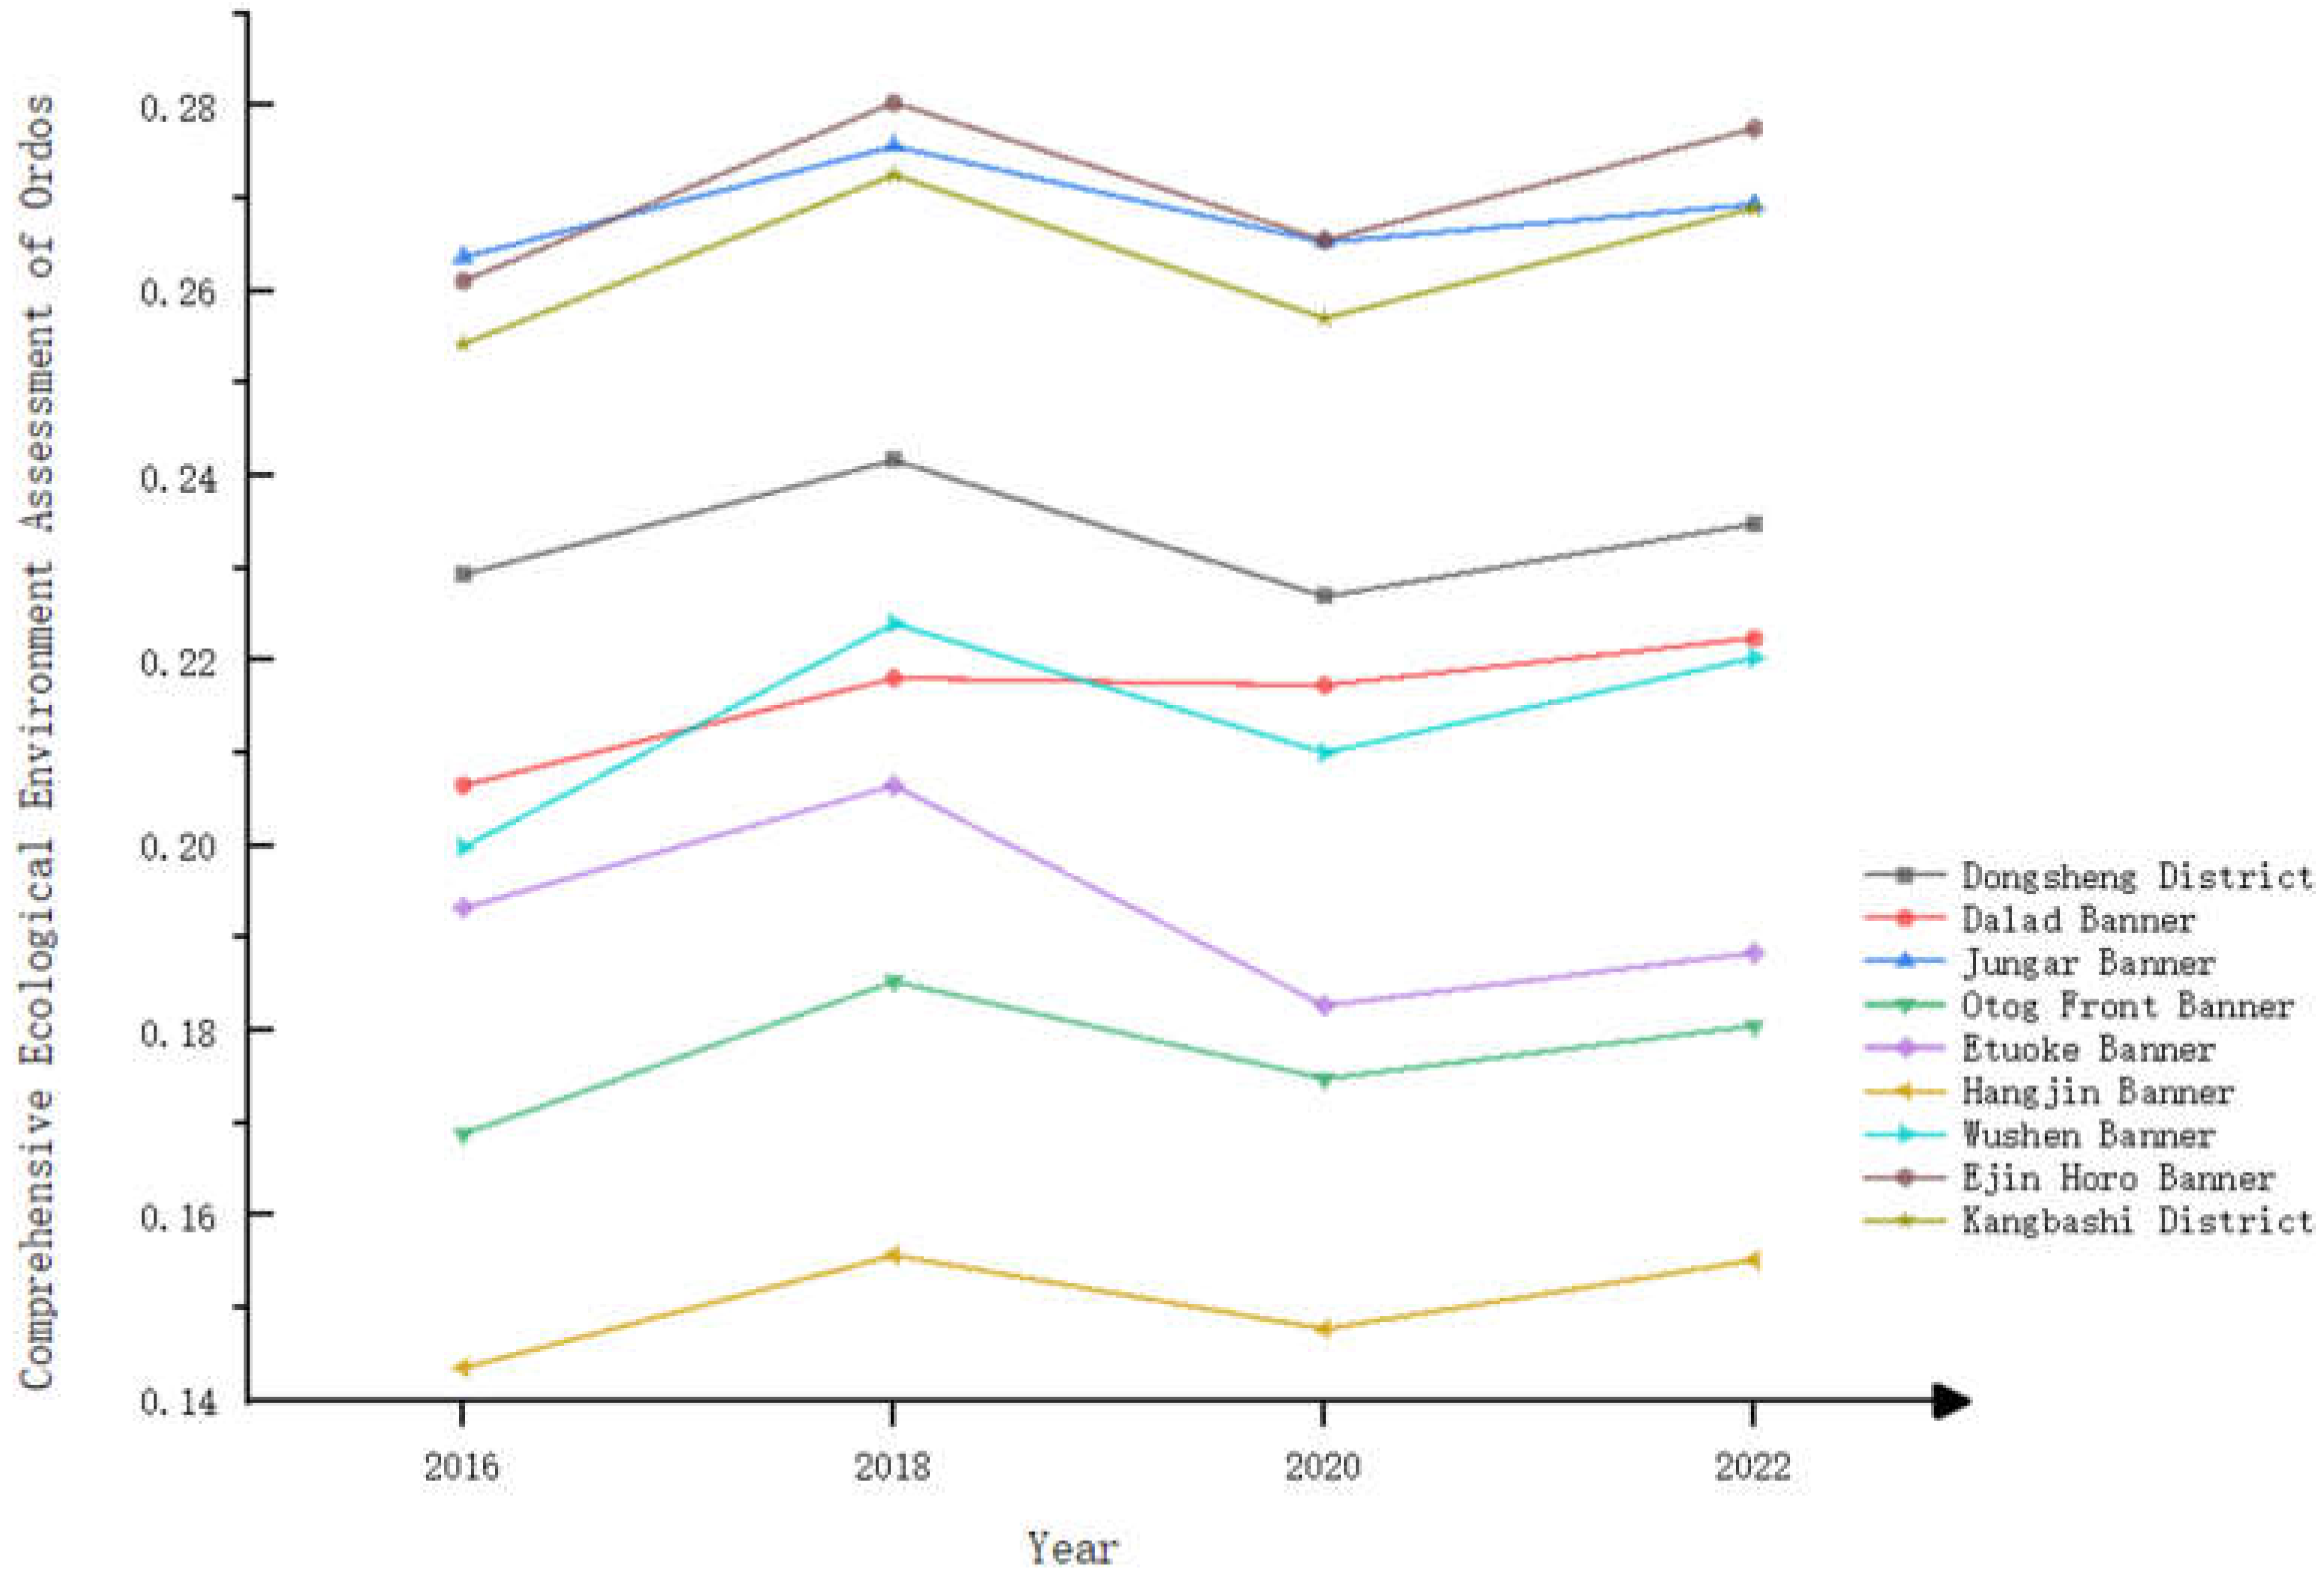
Figure 5.
The spatial-temporal evolution of comprehensive evaluation of regional economic development in Ordos(2016-2022).
Figure 5.
The spatial-temporal evolution of comprehensive evaluation of regional economic development in Ordos(2016-2022).
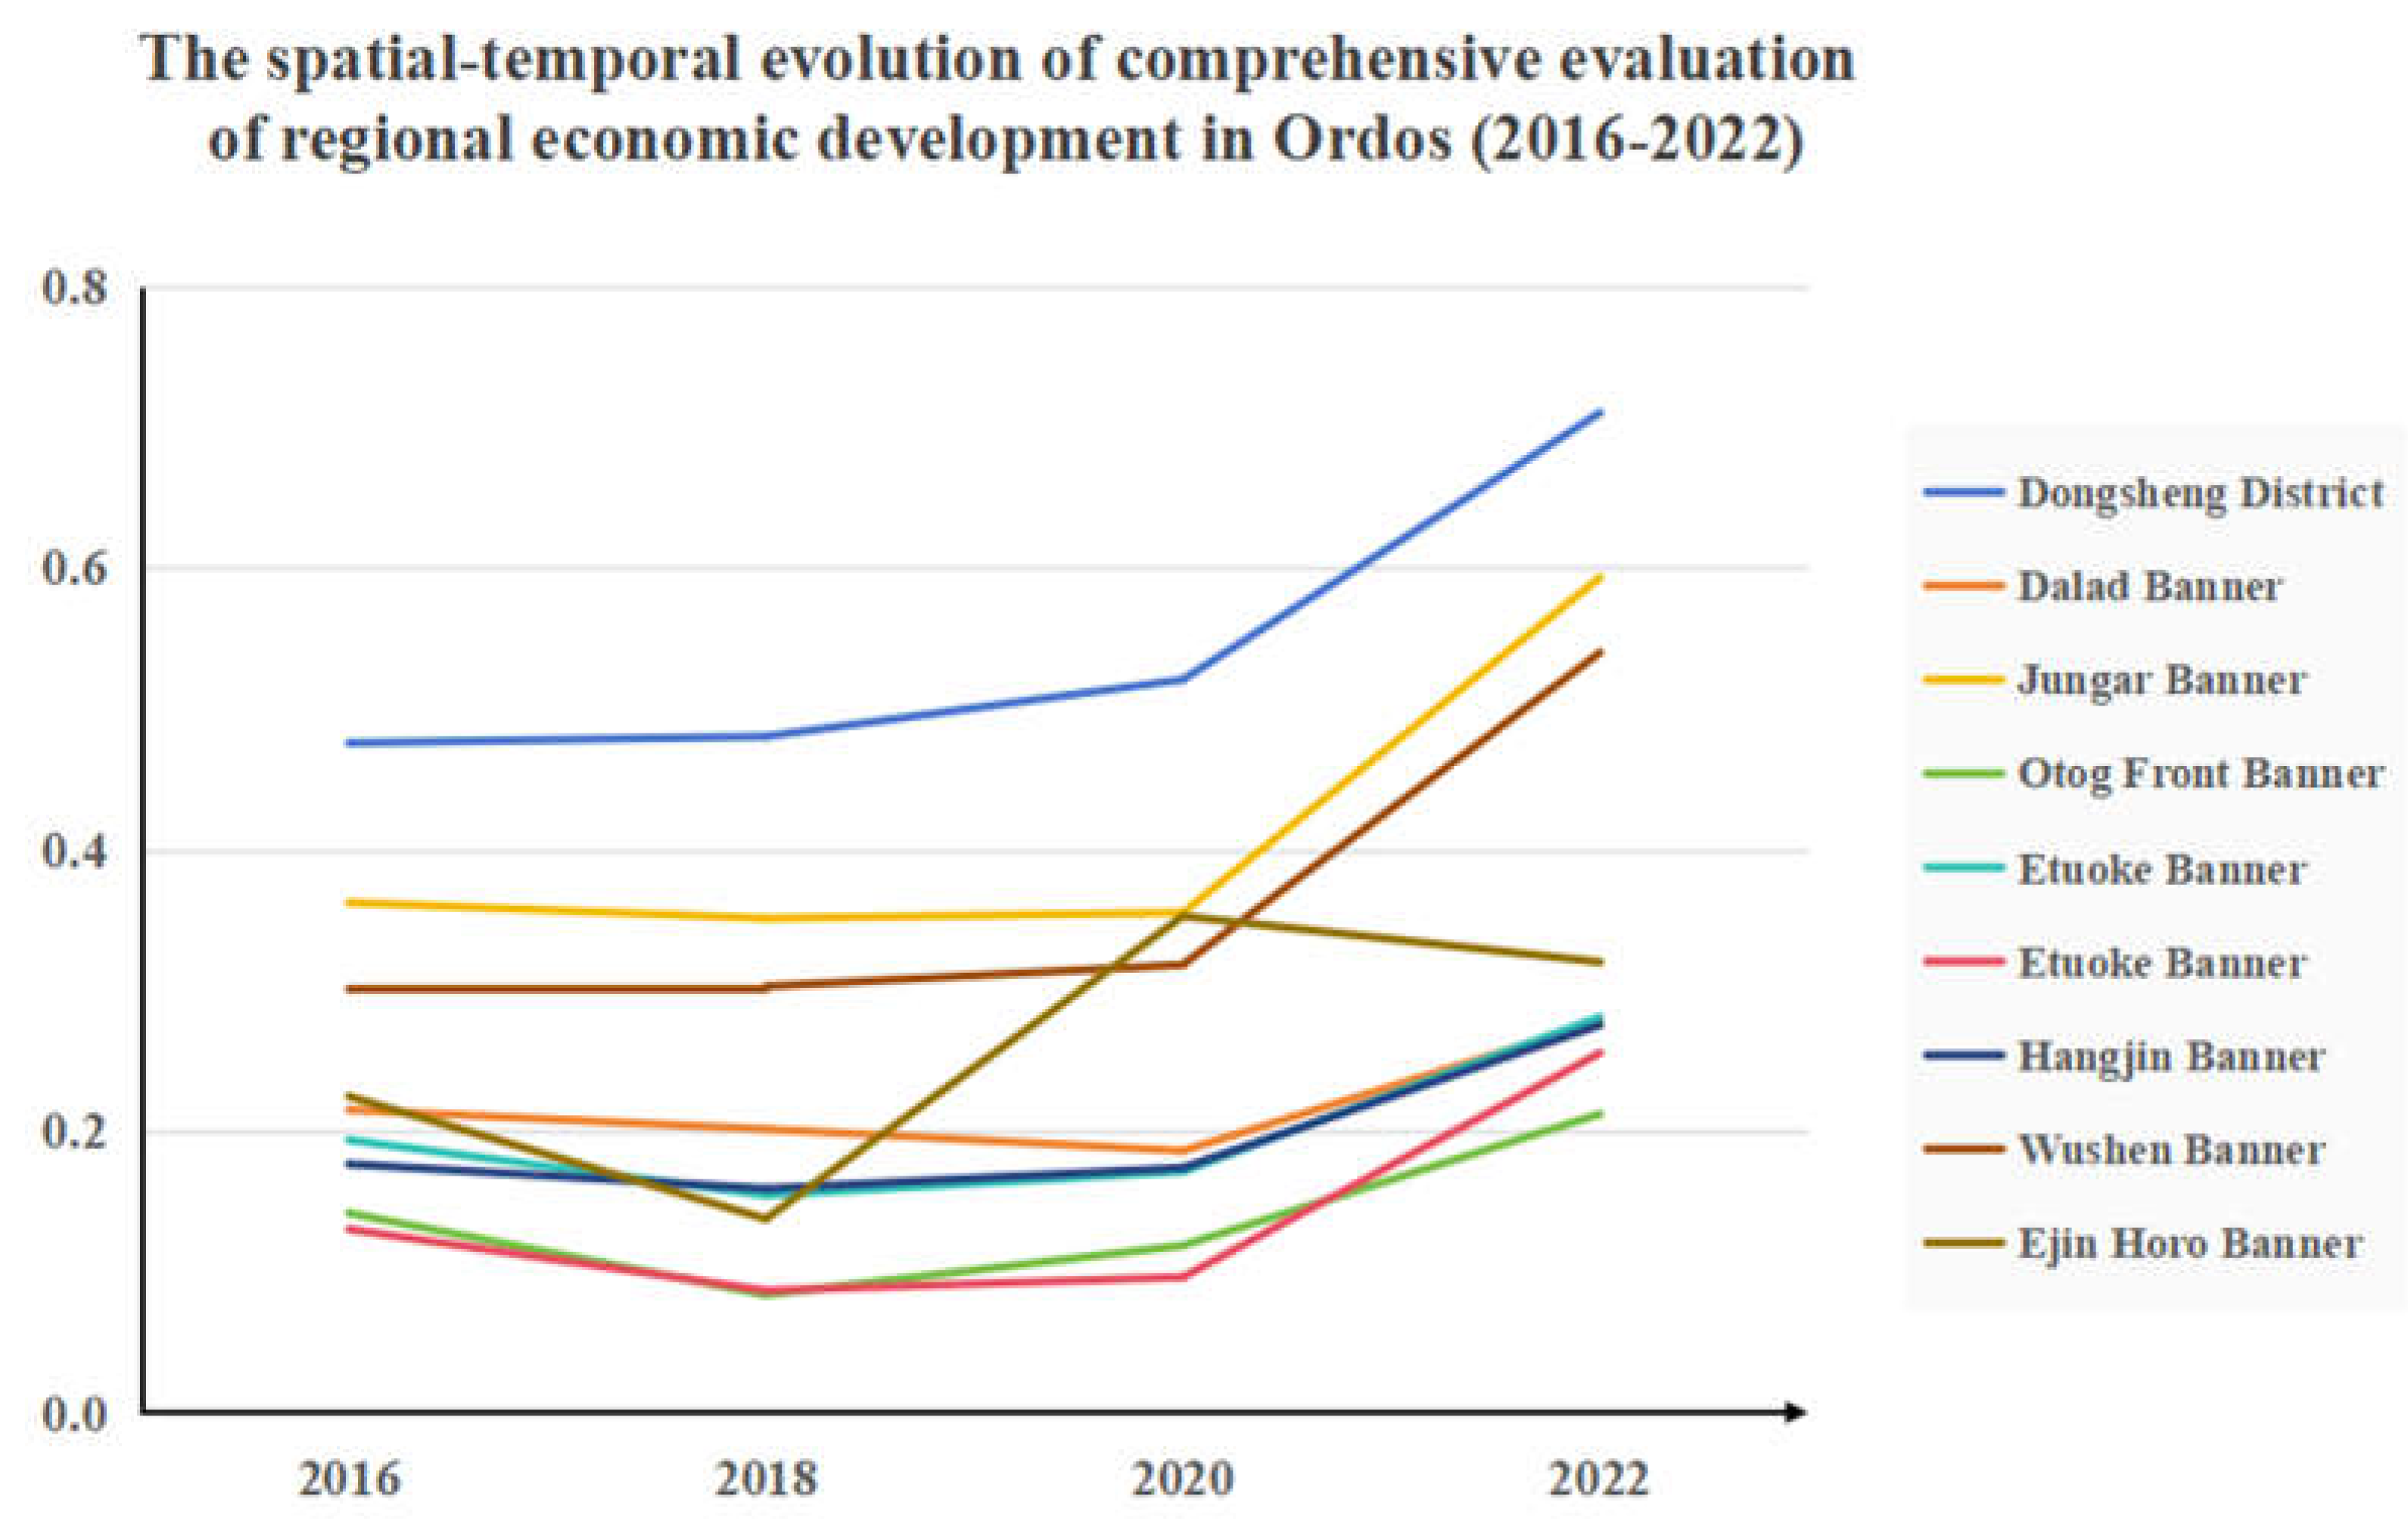
Figure 6.
Analysis of spatial-temporal coordination of Ecological environment and Economic in Ordos (2016-2022).
Figure 6.
Analysis of spatial-temporal coordination of Ecological environment and Economic in Ordos (2016-2022).
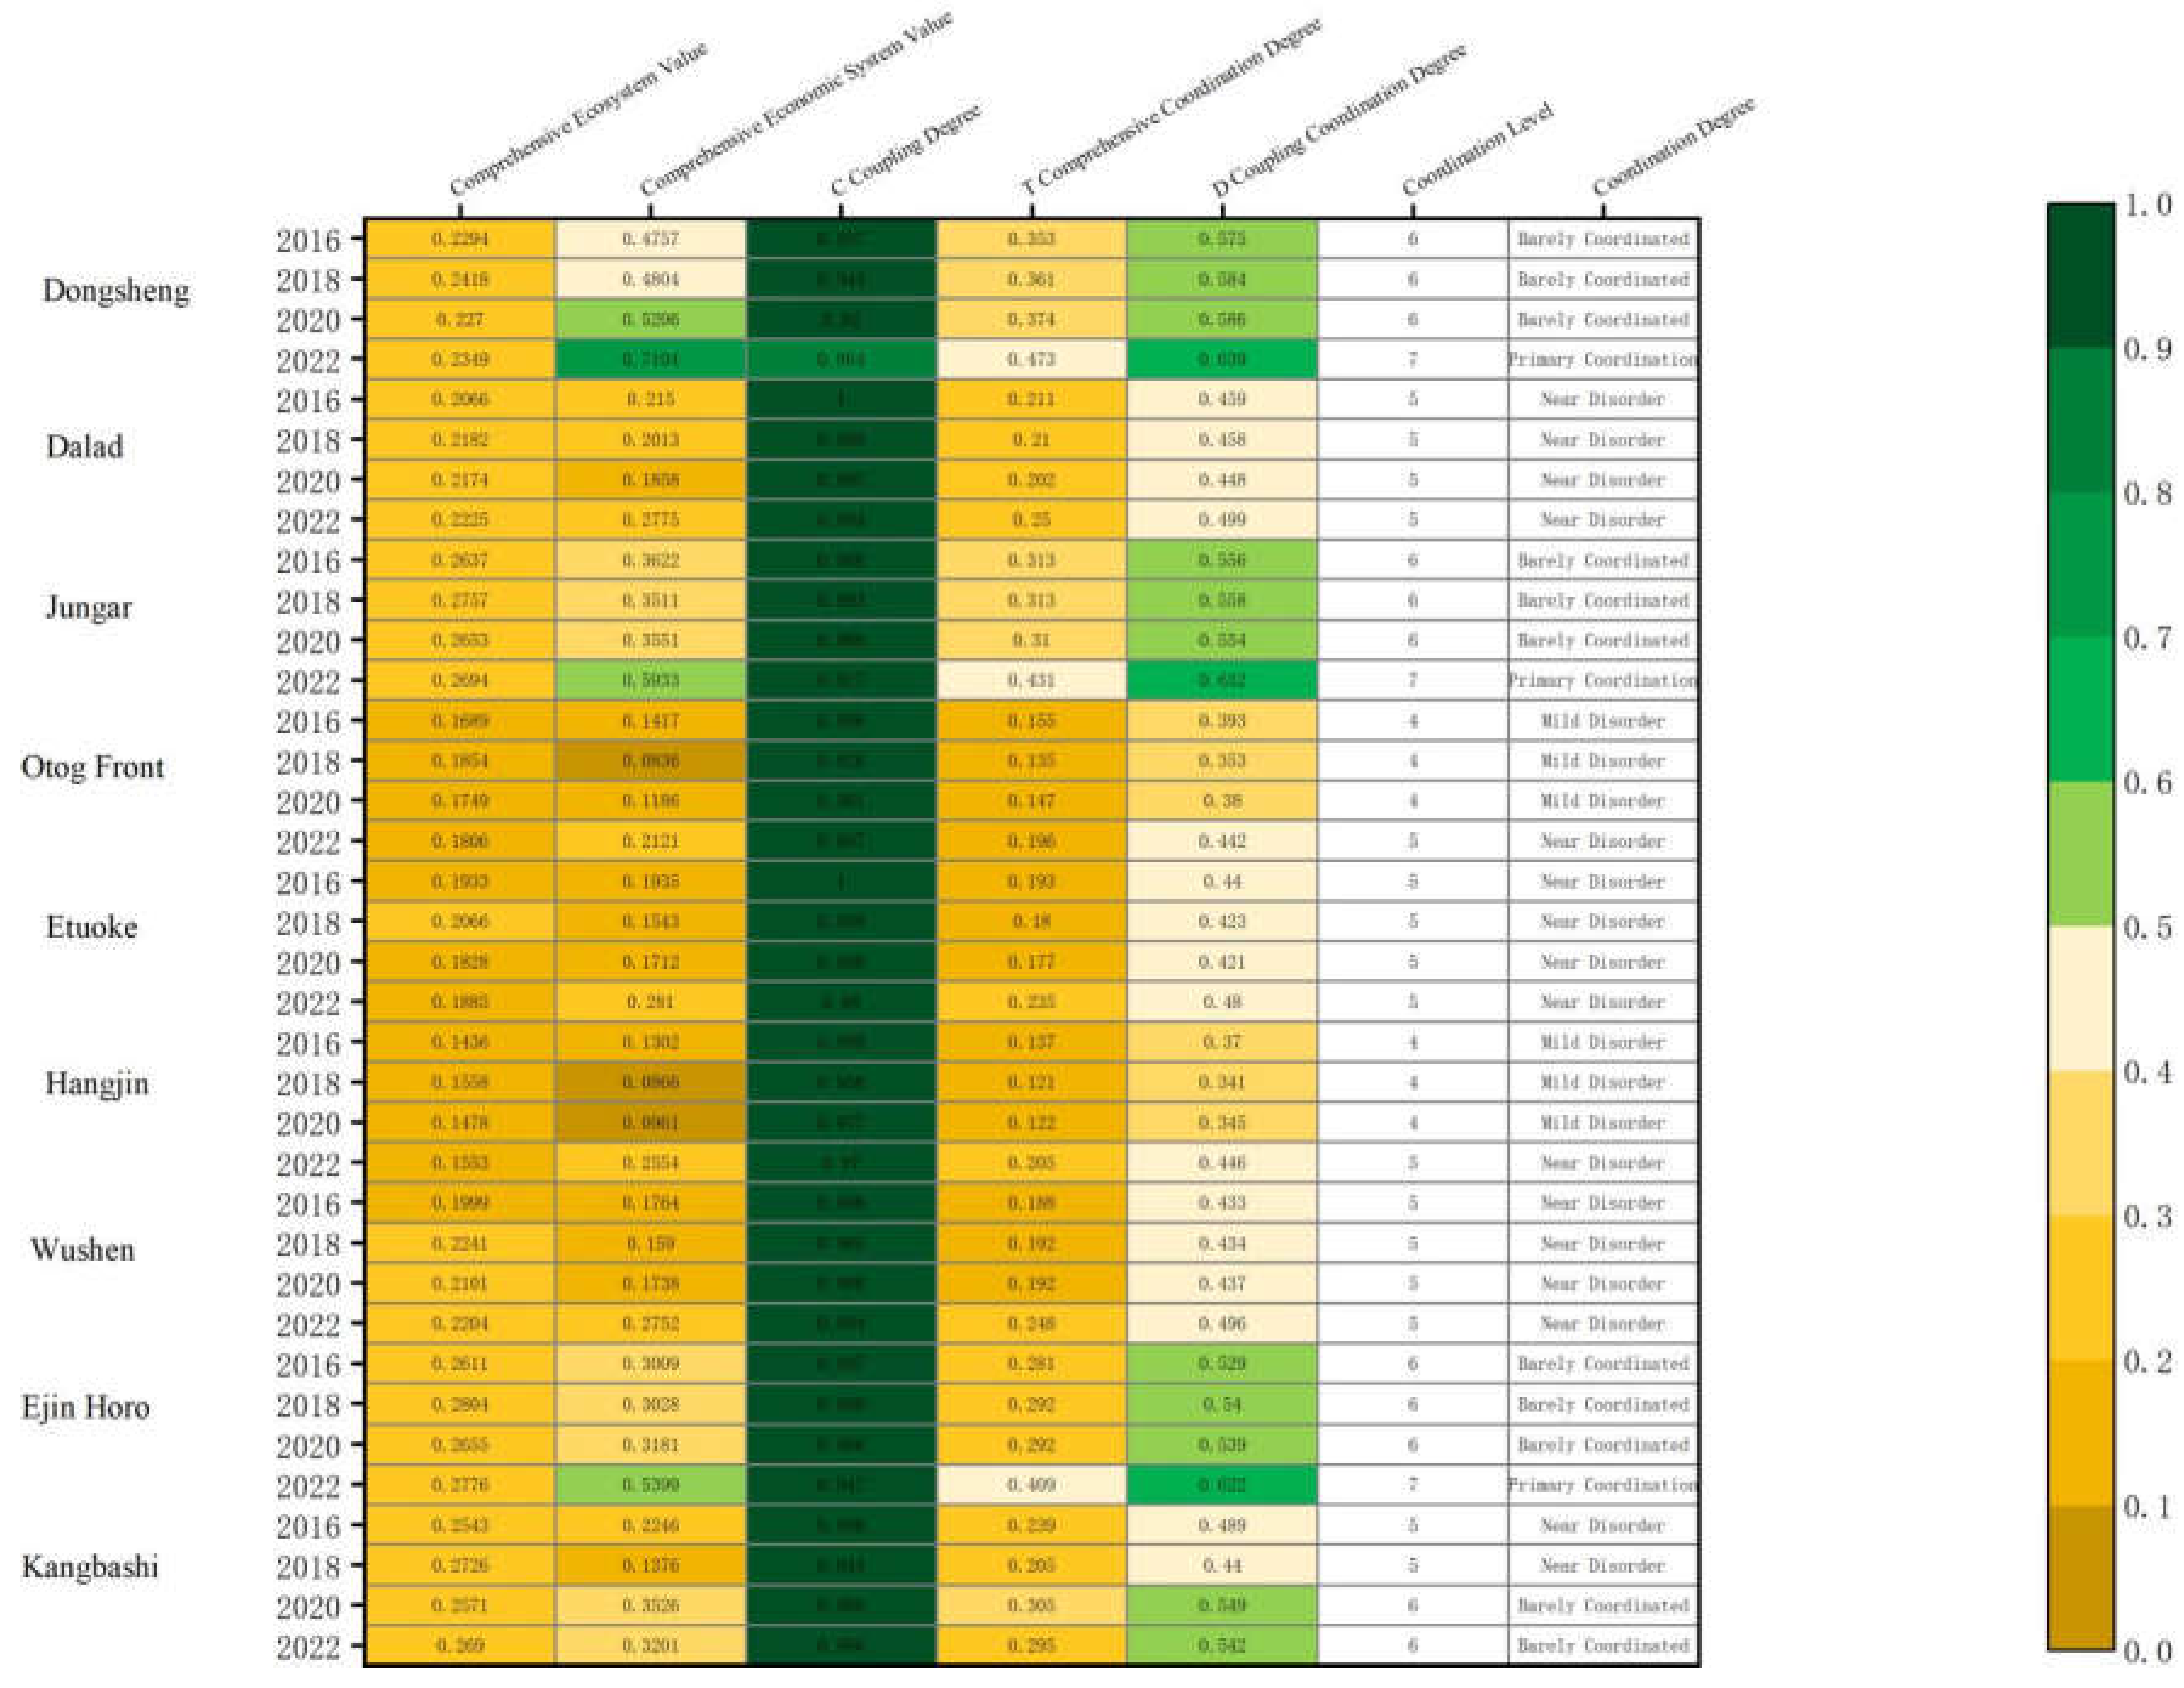
Figure 7.
The spatial-temporal coordination of Ecological environment and Economic in Ordos (2016-2022)
Figure 7.
The spatial-temporal coordination of Ecological environment and Economic in Ordos (2016-2022)
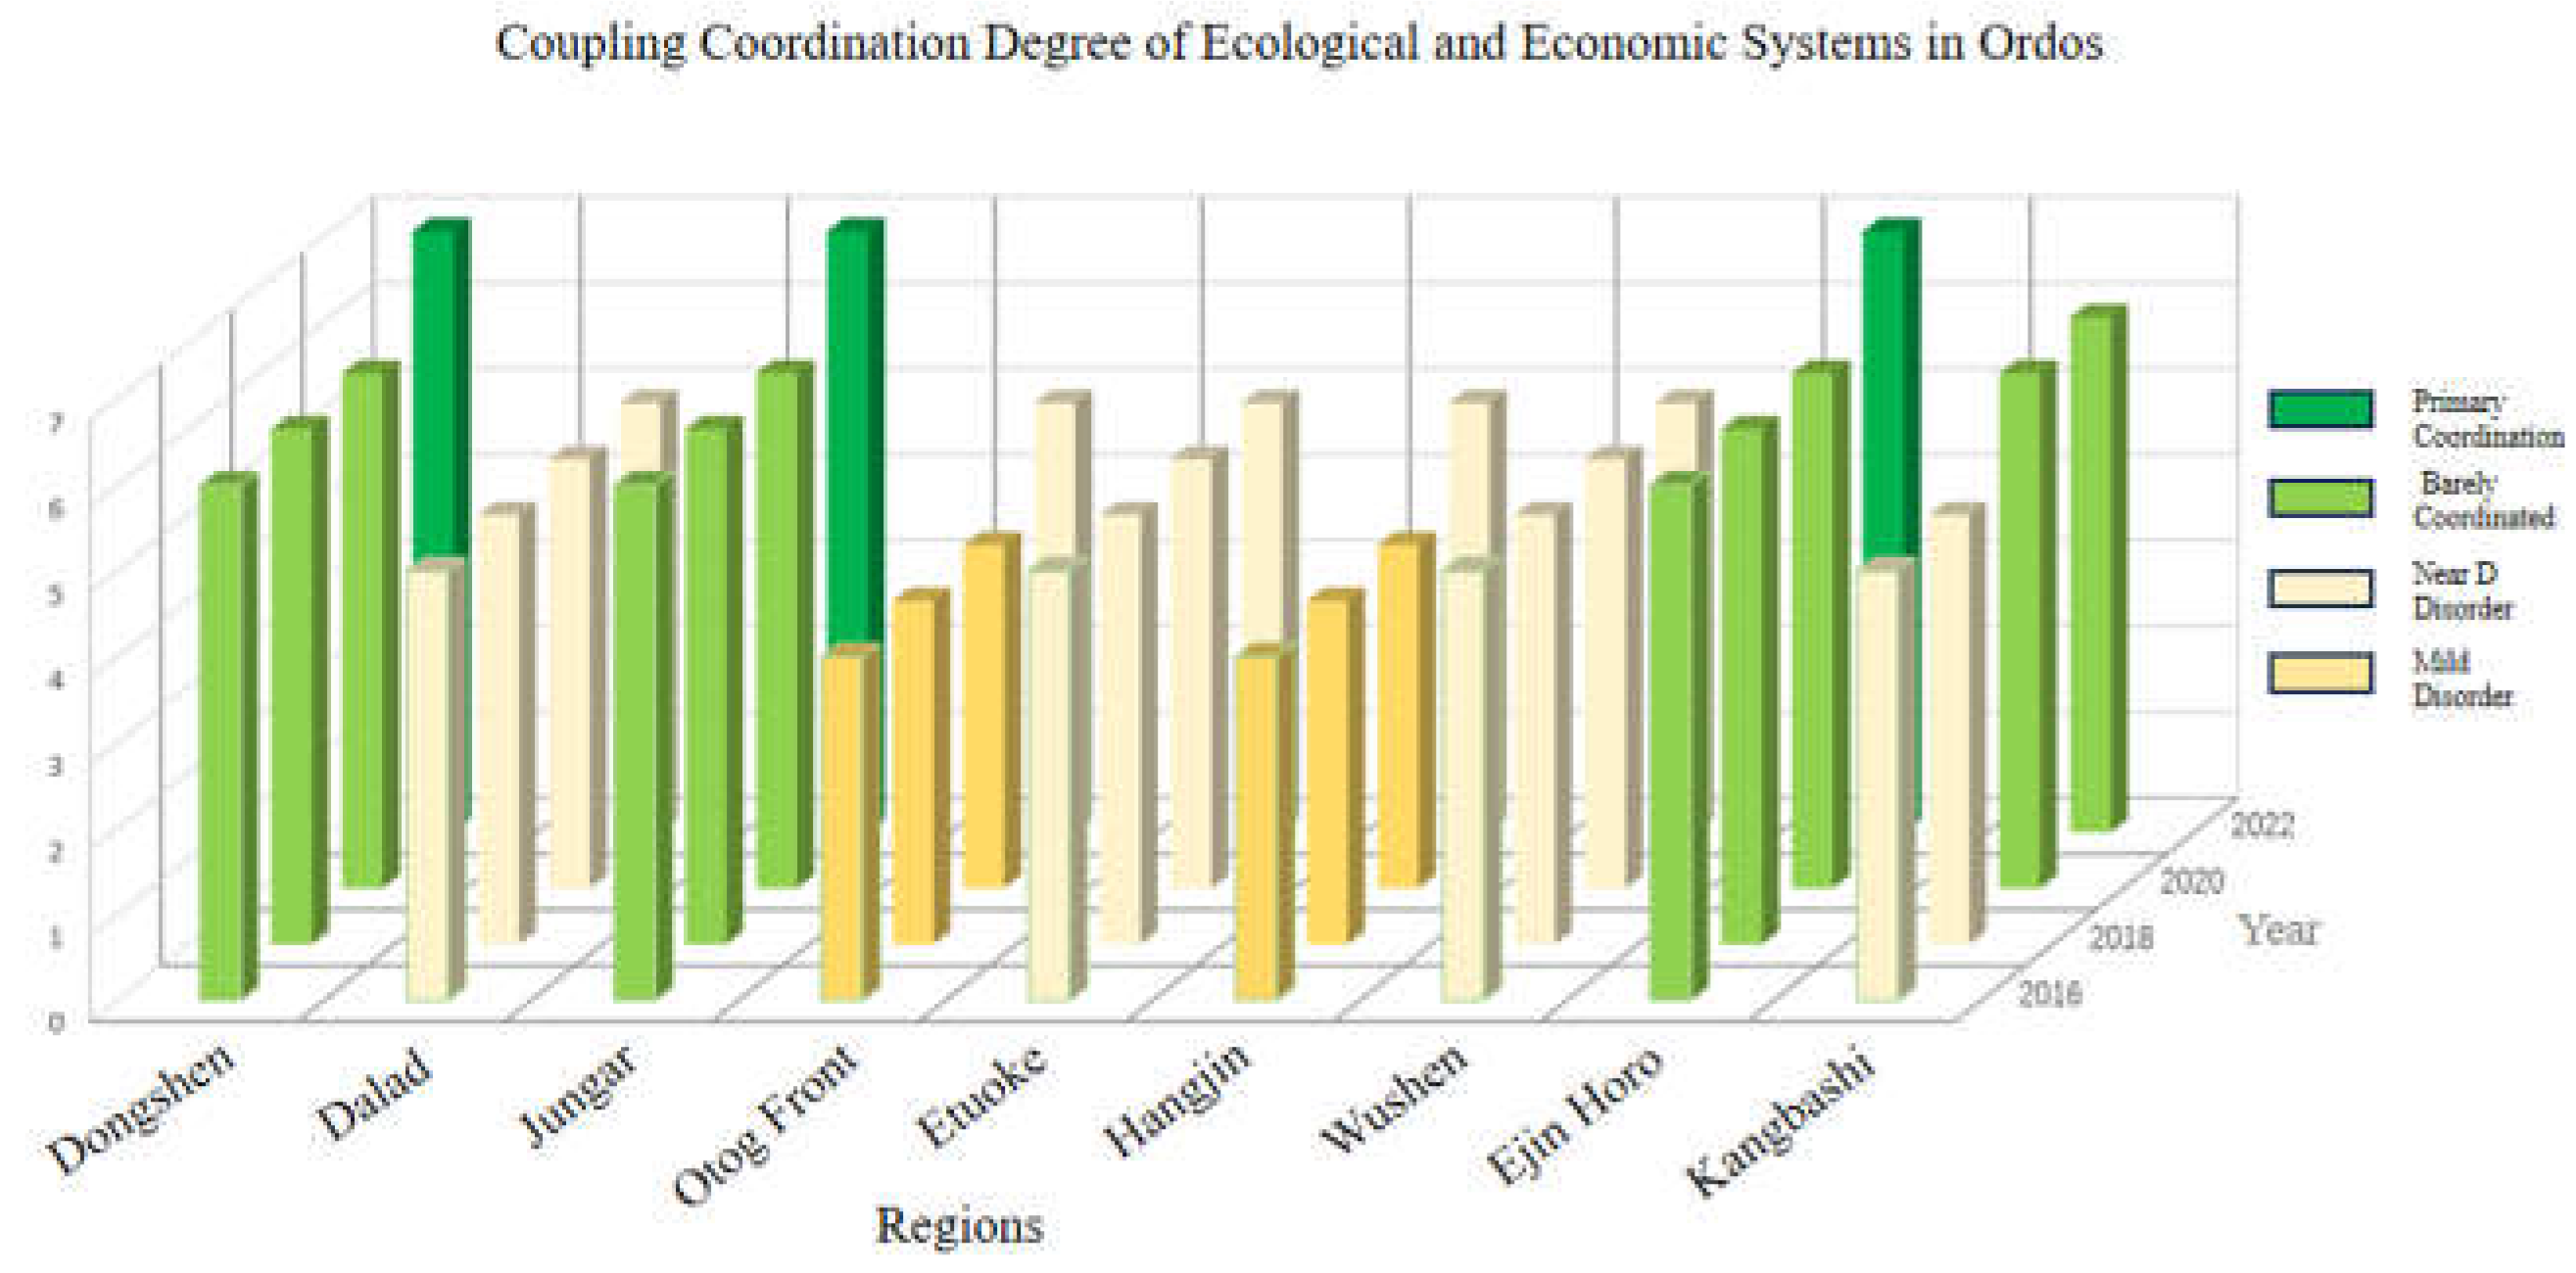

Table 1.
Economic development data in Ordos(2016-2022).
| Economic Development Scale | Resident income level | County-level Economic Development Vitality | ||||||||||
|---|---|---|---|---|---|---|---|---|---|---|---|---|
| Year | GDP | Population | Public Budget | General BudgetExpenditure | Average Salary of Employees | per Capita Disposable Income | per Capita Disposable Income in Rural and Pastoral Areas | Total retail sales of consumer Goods | GDP Growth Rate | Fixed assets InvestmentGrowth Rate | ||
| Regions | (¥:Billion) | (people:ten thousand) | (¥:Billion) | (¥:Billion) | (¥:Yuan) | (¥:Yuan) | (¥:Yuan) | (¥:Billion) | (%) | (%) | ||
| 1 | Dongsheng | 2016 | 561.76 | 57 | 22.3 | 90.3 | 73978 | 39553 | - | 244.0 | 12.2 | 505.7 |
| 2018 | 671.36 | 57.2 | 45.5 | 61.5 | 95557 | 48452 | - | 245.6 | 4.5 | -73.8 | ||
| 2020 | 696.07 | 57.5 | 54.0 | 77.7 | 96520 | 50542 | - | 214.6 | 2 | 5.6 | ||
| 2022 | 949.14 | 58.1 | 76.7 | 129.9 | 57117 | - | 234.6 | - | 23.5 | |||
| 2 | Dalad | 2016 | 262.76 | 32.7 | 22.3 | 41.0 | 64291 | 26449 | 15359 | 64.7 | 12.1 | 240.8 |
| 2018 | 309.54 | 32.8 | 18.8 | 50.2 | 72774 | 30931 | 18147 | 64.0 | 6.1 | 6.2 | ||
| 2020 | 317.62 | 32.9 | 20.1 | 50.0 | 81567 | 34164 | 20968 | 42.5 | 2.4 | 1.8 | ||
| 2022 | 480.83 | 33.4 | 33.4 | 70.2 | 39261 | 24618 | 45.2 | 4.6 | 10 | |||
| 3 | Jungar | 2016 | 677.24 | 35.9 | 81.8 | 96.8 | 85838 | 32469 | 15500 | 109.5 | 13.0 | 574.3 |
| 2018 | 778.81 | 35.9 | 77.7 | 88.3 | 103425 | 37963 | 18247 | 124.2 | 2.0 | -64.9 | ||
| 2020 | 747.78 | 35.9 | 82.7 | 86.8 | 104599 | 41424 | 20944 | 98.8 | 2.1 | 4.2 | ||
| 2022 | 1300.07 | 36.5 | 159.3 | 152.9 | 47443 | 24624 | 106.2 | 5.3 | 28.8 | |||
| 4 | Otog Front | 2016 | 107.31 | 8.4 | 18.1 | 30.0 | 72040 | 28132 | 15603 | 22.8 | 15.1 | 267.3 |
| 2018 | 126.98 | 8.9 | 10.6 | 30.6 | 77841 | 33180 | 18529 | 24.3 | 5.0 | -28.4 | ||
| 2020 | 139.78 | 9.3 | 11.9 | 29.3 | 85328 | 37123 | 22223 | 24.0 | 4.6 | 5 | ||
| 2022 | 262.46 | 9.7 | 17.2 | 43.6 | 42513 | 26076 | 25.6 | 14.1 | 27.6 | |||
| 5 | Etuoke Banner | 2016 | 267.41 | 15.8 | 38.0 | 53.1 | 57430 | 30186 | 15485 | 43.5 | 13.6 | 340.7 |
| 2018 | 326.02 | 16.1 | 26.2 | 41.3 | 66467 | 35356 | 18313 | 45.8 | 7.0 | -5.9 | ||
| 2020 | 370.74 | 16.3 | 28.5 | 44.4 | 78791 | 38984 | 21933 | 30.3 | 3.6 | 5 | ||
| 2022 | 613.95 | 16.8 | 48.9 | 62.5 | 44178 | 25574 | 32.7 | 5.4 | 16.8 | |||
| 6 | Hangjin | 2016 | 99.05 | 10.6 | 12.3 | 28.4 | 74607 | 26003 | 15354 | 39.2 | 12.8 | 175.0 |
| 2018 | 116.83 | 11 | 4.5 | 31.1 | 83025 | 30619 | 18248 | 34.1 | 5.2 | -46.2 | ||
| 2020 | 127.73 | 11.1 | 6.2 | 34.8 | 87695 | 34255 | 21520 | 14.3 | 2.3 | 5.1 | ||
| 2022 | 165.93 | 11.5 | 10.4 | 47.5 | 38952 | 25223 | 15.3 | 3.8 | 58.3 | |||
| 7 | Wushen | 2016 | 236.46 | 14.8 | 33.7 | 41.0 | 67010 | 27872 | 15471 | 42.0 | 13.0 | 430.1 |
| 2018 | 278.07 | 15.3 | 21.0 | 38.1 | 100096 | 32733 | 18263 | 40.4 | 6.8 | -74.4 | ||
| 2020 | 315.02 | 15.9 | 30.1 | 50.4 | 107222 | 36540 | 21836 | 33.5 | 1.2 | 6.5 | ||
| 2022 | 490.71 | 16.3 | 43.0 | 63.6 | 41589 | 25601 | 35.4 | 7.7 | 10 | |||
| 8 | Ejin Horo | 2016 | 595.8 | 24.2 | 78.9 | 84.8 | 80266 | 32958 | 15488 | 53.2 | 11.3 | 437.7 |
| 2018 | 713.23 | 24.6 | 73.6 | 82.7 | 119655 | 38627 | 18300 | 56.3 | 6.5 | -41.9 | ||
| 2020 | 706.69 | 24.8 | 75.7 | 86.2 | 121337 | 42675 | 21605 | 48.0 | 4.2 | 5 | ||
| 2022 | 1219.19 | 25.4 | 134.4 | 162.1 | 48721 | 25086 | 51.6 | 6.6 | 32.8 | |||
| 9 | Kangbashi | 2016 | 66.45 | 10.5 | 10.1 | 10.3 | 95683 | 41523 | - | 107.9 | 15.0 | 46.4 |
| 2018 | 79.42 | 11.2 | 6.3 | 14.7 | 81404 | 44550 | - | 67.8 | 5.0 | -37 | ||
| 2020 | 89.07 | 11.9 | 7.6 | 19.4 | 88750 | 48863 | - | 59.5 | 5 | 95.3 | ||
| 2022 | 131.16 | 12.5 | 12.0 | 38.1 | - | 55975 | - | 69.0 | 4.5 | 57.1 | ||
Table 2.
Comprehensive evaluation of ecological environment of Ordos(2016-2022).
| Regions | Year 2016 | Year 2018 | Year 2020 | Year 2022 |
|---|---|---|---|---|
| Dongsheng | 0.2294 | 0.2418 | 0.2270 | 0.2349 |
| Dalad | 0.2066 | 0.2182 | 0.2174 | 0.2225 |
| Jungar | 0.2637 | 0.2757 | 0.2653 | 0.2694 |
| Otog Front | 0.1689 | 0.1854 | 0.1749 | 0.1806 |
| Etuoke | 0.1933 | 0.2066 | 0.1828 | 0.1885 |
| Hangji | 0.1436 | 0.1558 | 0.1478 | 0.1553 |
| Wushen | 0.1999 | 0.2241 | 0.2101 | 0.2204 |
| Ejin Horo | 0.2611 | 0.2804 | 0.2655 | 0.2776 |
| Kangbashi | 0.2543 | 0.2726 | 0.2571 | 0.2690 |
Table 3.
Economic development index system.
| System Layer | Index Layer | Unit | Weight | System Layer | Index Type |
| Economic Development Scale | 0.411 | GDP | (¥:Billion) | 0.104 | + |
| Population | (people:ten thousand) | 0.122 | + | ||
| Public Budget | (¥:Billion) | 0.121 | + | ||
| General Budget Expenditure | (¥:Billion) | 0.064 | + | ||
| Resident income | 0.192 | Average Salary of Employees | (¥:Yuan) | 0.038 | + |
| per Capita Disposable Income | (¥:Yuan) | 0.057 | + | ||
| per Capita Disposable Income in Rural and Pastoral Areas | (¥:Yuan) | 0.097 | + | ||
| County-level Economic Development Vitality | 0.397 | Total retail sales of consumer Goods | (¥:Billion) | 0.127 | + |
| GDP Growth Rate | (%) | 0.072 | + | ||
| Fixed assets Investment Growth Rate | (%) | 0.198 | + |
Table 4.
Economic development spatial-temporal evolution of comprehensive evaluation in Ordos(2016-2022).
Table 4.
Economic development spatial-temporal evolution of comprehensive evaluation in Ordos(2016-2022).
|
Regions\ Index |
Economic Development Scale | Residents’income | County-level Economic Development Vitality | Grey Relational Comprehensive Evaluation | ||||||||
| Regions | GDP | Population | Public Budget |
General Budget Expenditure |
Average Salary of Employees | per Capita Disposable Income | per Capita Disposable Income in Rural and Pastoral Areas | Total retail sales of consumer Goods | GDP Growth Rate | Fixed assets InvestmentGrowth Rate | ||
| Entropy Weight | 0.104 | 0.122 | 0.121 | 0.064 | 0.038 | 0.057 | 0.097 | 0.127 | 0.072 | 0.198 | ||
| Dongsheng | 2016 | 0.0419 | 0.1192 | 0.0139 | 0.0336 | 0.0098 | 0.0243 | 0.0265 | 0.1265 | 0.0569 | 0.0231 | 0.4757 |
| 2018 | 0.0512 | 0.1197 | 0.0320 | 0.0215 | 0.0225 | 0.0403 | 0.0433 | 0.1274 | 0.0171 | 0.0055 | 0.4804 | |
| 2020 | 0.0533 | 0.1204 | 0.0387 | 0.0283 | 0.0231 | 0.0440 | 0.0891 | 0.1103 | 0.0041 | 0.0093 | 0.5206 | |
| 2022 | 0.0747 | 0.1219 | 0.0565 | 0.0502 | 0.0261 | 0.0558 | 0.0974 | 0.1213 | 0.0595 | 0.0469 | 0.7104 | |
| Dalad | 2016 | 0.0166 | 0.0596 | 0.0139 | 0.0129 | 0.0041 | 0.0008 | 0.0010 | 0.0278 | 0.0564 | 0.0229 | 0.2150 |
| 2018 | 0.0206 | 0.0598 | 0.0112 | 0.0168 | 0.0091 | 0.0088 | 0.0118 | 0.0274 | 0.0254 | 0.0105 | 0.2013 | |
| 2020 | 0.0212 | 0.0601 | 0.0122 | 0.0167 | 0.0143 | 0.0146 | 0.0237 | 0.0155 | 0.0062 | 0.0013 | 0.1858 | |
| 2022 | 0.0351 | 0.0613 | 0.0226 | 0.0252 | 0.0172 | 0.0238 | 0.0392 | 0.0170 | 0.0176 | 0.0185 | 0.2775 | |
| Jungar | 2016 | 0.0517 | 0.0675 | 0.0605 | 0.0363 | 0.0168 | 0.0116 | 0.0006 | 0.0524 | 0.0611 | 0.0038 | 0.3622 |
| 2018 | 0.0603 | 0.0675 | 0.0573 | 0.0328 | 0.0272 | 0.0215 | 0.0122 | 0.0605 | 0.0041 | 0.0078 | 0.3511 | |
| 2020 | 0.0576 | 0.0675 | 0.0612 | 0.0321 | 0.0279 | 0.0277 | 0.0236 | 0.0465 | 0.0047 | 0.0063 | 0.3551 | |
| 2022 | 0.1044 | 0.0689 | 0.1212 | 0.0599 | 0.0314 | 0.0385 | 0.0392 | 0.0506 | 0.0212 | 0.0581 | 0.5933 | |
| Otog Front | 2016 | 0.0035 | 0.0010 | 0.0106 | 0.0083 | 0.0086 | 0.0038 | 0.0011 | 0.0047 | 0.0719 | 0.0292 | 0.1417 |
| 2018 | 0.0051 | 0.0012 | 0.0047 | 0.0085 | 0.0121 | 0.0129 | 0.0134 | 0.0055 | 0.0197 | 0.0004 | 0.0836 | |
| 2020 | 0.0062 | 0.0022 | 0.0058 | 0.0080 | 0.0165 | 0.0199 | 0.0291 | 0.0053 | 0.0176 | 0.0080 | 0.1186 | |
| 2022 | 0.0166 | 0.0032 | 0.0099 | 0.0140 | 0.0197 | 0.0296 | 0.0454 | 0.0062 | 0.0668 | 0.0008 | 0.2121 | |
| Etuoke | 2016 | 0.0170 | 0.0182 | 0.0262 | 0.0180 | 0.0010 | 0.0075 | 0.0006 | 0.0161 | 0.0640 | 0.0261 | 0.1935 |
| 2018 | 0.0220 | 0.0189 | 0.0170 | 0.0130 | 0.0053 | 0.0168 | 0.0125 | 0.0173 | 0.0300 | 0.0015 | 0.1543 | |
| 2020 | 0.0257 | 0.0194 | 0.0187 | 0.0143 | 0.0126 | 0.0233 | 0.0278 | 0.0088 | 0.0124 | 0.0080 | 0.1712 | |
| 2022 | 0.0463 | 0.0206 | 0.0347 | 0.0219 | 0.0169 | 0.0326 | 0.0432 | 0.0101 | 0.0217 | 0.0328 | 0.2810 | |
| Hangjin | 2016 | 0.0028 | 0.0054 | 0.0061 | 0.0076 | 0.0101 | 0.0010 | 0.0010 | 0.0137 | 0.0601 | 0.0244 | 0.1302 |
| 2018 | 0.0043 | 0.0064 | 0.0010 | 0.0087 | 0.0151 | 0.0083 | 0.0122 | 0.0109 | 0.0207 | 0.0010 | 0.0866 | |
| 2020 | 0.0052 | 0.0066 | 0.0013 | 0.0103 | 0.0179 | 0.0148 | 0.0261 | 0.0010 | 0.0057 | 0.0082 | 0.0961 | |
| 2022 | 0.0084 | 0.0076 | 0.0046 | 0.0156 | 0.0201 | 0.0232 | 0.0417 | 0.0005 | 0.0135 | 0.1201 | 0.2554 | |
| Wushen | 2016 | 0.0144 | 0.0157 | 0.0228 | 0.0129 | 0.0057 | 0.0034 | 0.0005 | 0.0152 | 0.0611 | 0.0248 | 0.1764 |
| 2018 | 0.0179 | 0.0169 | 0.0129 | 0.0117 | 0.0252 | 0.0121 | 0.0123 | 0.0144 | 0.0290 | 0.0067 | 0.1590 | |
| 2020 | 0.0210 | 0.0184 | 0.0200 | 0.0169 | 0.0294 | 0.0189 | 0.0274 | 0.0106 | 0.0010 | 0.0111 | 0.1738 | |
| 2022 | 0.0359 | 0.0194 | 0.0301 | 0.0224 | 0.0324 | 0.0280 | 0.0433 | 0.0116 | 0.0336 | 0.0185 | 0.2752 | |
| Ejin Horo | 2016 | 0.0448 | 0.0388 | 0.0582 | 0.0313 | 0.0135 | 0.0125 | 0.0006 | 0.0214 | 0.0522 | 0.0278 | 0.3009 |
| 2018 | 0.0547 | 0.0397 | 0.0541 | 0.0304 | 0.0368 | 0.0226 | 0.0125 | 0.0231 | 0.0274 | 0.0015 | 0.3028 | |
| 2020 | 0.0542 | 0.0402 | 0.0557 | 0.0319 | 0.0377 | 0.0299 | 0.0264 | 0.0186 | 0.0155 | 0.0080 | 0.3181 | |
| 2022 | 0.0975 | 0.0417 | 0.1017 | 0.0638 | 0.0384 | 0.0408 | 0.0412 | 0.0205 | 0.0279 | 0.0665 | 0.5399 | |
| Kangbashi | 2016 | 0.0010 | 0.0052 | 0.0044 | 0.0010 | 0.0226 | 0.0278 | 0.0203 | 0.0515 | 0.0716 | 0.0212 | 0.2246 |
| 2018 | 0.0011 | 0.0069 | 0.0014 | 0.0018 | 0.0142 | 0.0333 | 0.0288 | 0.0295 | 0.0197 | 0.0011 | 0.1376 | |
| 2020 | 0.0019 | 0.0086 | 0.0024 | 0.0038 | 0.0185 | 0.0410 | 0.0339 | 0.0249 | 0.0197 | 0.1980 | 0.3526 | |
| 2022 | 0.0055 | 0.0101 | 0.0058 | 0.0117 | 0.0203 | 0.0538 | 0.0481 | 0.0301 | 0.0171 | 0.1176 | 0.3201 | |
Disclaimer/Publisher’s Note: The statements, opinions and data contained in all publications are solely those of the individual author(s) and contributor(s) and not of MDPI and/or the editor(s). MDPI and/or the editor(s) disclaim responsibility for any injury to people or property resulting from any ideas, methods, instructions or products referred to in the content. |
© 2024 by the authors. Licensee MDPI, Basel, Switzerland. This article is an open access article distributed under the terms and conditions of the Creative Commons Attribution (CC BY) license (https://creativecommons.org/licenses/by/4.0/).
Copyright: This open access article is published under a Creative Commons CC BY 4.0 license, which permit the free download, distribution, and reuse, provided that the author and preprint are cited in any reuse.