Submitted:
31 May 2024
Posted:
31 May 2024
You are already at the latest version
Abstract
Candida albicans is an opportunistic fungus that becomes pathogenic and problematic under certain biological conditions. C.albicans may cause painful and uncomfortable symptoms, as well as deaths in immunocompromised patients. Therefore, early detection of c.albicans is essential. However, conventional detection methods are costly, slow and inaccessible to women in remote or developing areas. To address these concerns, we have developed a wearable and discrete naked-eye detectable, colorimetric platform for c.albicans detection. With some modification, this platform is designed to be directly adhered to existing feminine hygiene pads. Our platform is rapid, inexpensive, user-friendly, disposable and only requires three steps: i) addition of vaginal fluid onto sample pads; ii) addition of gold nanoparticle gel and running buffer, and iii) naked eye detection. Our platform is underpinned by selective thiolated aptamer-based recognition of 1,3-β-D glucan molecules- a hallmark of c.albicans cell walls. In the absence of c.albicans, wearable sample pads turn bright pink. In the presence of c. albicans, the wearable pads turn dark blue due to significant nanoparticle target-induced aggregation. We demonstrate naked eye colorimetric detection of 4.4 ×10⁶ c.albicans cells per ml. We believe that this proof-of-concept platform has the potential to have a significant impact on women’s health, globally.
Keywords:
Women
; gold nanoparticles
; wearable
; candida albicans
; colorimetric
1. Introduction
Candida albicans (C.albicans) is a commensal fungus that colonizes the intestinal microbiota in most of the human population. [1] However, an imbalance of the microbial flora, dysfunction of the immune system or breakage of epithelial barriers favors the transition from commensal fungus, to an invasive pathogen. [2] C.albicans is the most common human pathogenic candida species, and it can cause a range of diseases including mucosal, skin and systemic infections (candidiasis). [2] C. albicans is the leading cause of candida bloodstream infections (candidemia). Candidemia is associated with significant hospital costs and may even cause deaths in immunocompromised patients. [3] Vulvovaginal candidiasis (VVC) is exceptionally common and it impacts 3 in 4 women at least once during their lifetime. [4] 5% of women develop recurrent vulvovaginal candidiasis (RVVC). [5] Vulvovaginal infections (VVI) such as VVC may cause vaginal symptoms such as itching, odor, soreness, dyspareunia and vaginal discharge. [4,5] These symptoms also include larger social and psychological consequences. [4] If left untreated, recurrent VVI may lead to complications such as pre-term birth, infertility, miscarriages and other infectious diseases such as human immunodeficiency virus (HIV). [5] Due to these adverse effects on women’s reproductive health and well-being, vaginal infections are a major health concern globally. VVC risk factors include pregnancy, reproductive age, hormone replacement therapy, immunosuppression, antibiotic use, receptive oral sex, uncontrolled diabetes, oral contraceptive pills and frequent sexual intercourse. [5] Therefore, early and accurate diagnosis of VVC is an essential pathway for improving patient health, quality of life and for reducing deaths. Clinical diagnosis of VVC may be performed by saline and potassium hydroxide microscopy testing, however, the sensitivity of this method is low, even in experienced hands. [6] When VVC is still suspected despite a negative microscopy result, a fungal culture should be obtained. This sample may be cultured on Sabouraud’s media to observe colony growth. This method is still the “gold standard” method for VVC diagnosis, however, it is expensive and may take up to 7 days to generate a result.[7] Polymerase chain reaction (PCR) methods may be used to detect candida genus presence as well as to determine the presence of a specific species.
This testing procedure is provided by commercial companies and it provides reliable results within several days. [6] PCR testing is more sensitive than visible fungal culture analysis, however, PCR is more expensive and has not demonstrated any advantage to the clinician in practice. [6] Additionally, these methods are worthless if the patient fails to consult their general practitioner. As more over-the-counter treatments are becoming available, more women are self-diagnosing and self-treating for VVC. [7] However, misdiagnosis is common due to difficulty in distinguishing between bacterial vaginosis, trichomoniasis and yeast infection from symptoms alone. As many as two-thirds of over-the-counter drugs that are sold to treat VVC were used by women without the disease. [7] Overuse of antifungal medications is problematic due to fungal resistance to these medications. Therefore, it is imperative to create a simple, rapid and user-friendly platform for VVC diagnosis for patients to use at home. This platform would significantly reduce healthcare costs and would lead to better management of VVC overall. [7] Glucans are the most abundant polysaccharides in fungal cell walls, and they offer an alternative detection approach to conventional detection methods [8] β-1,3-d-glucan (BDG) molecules comprise 84% of fungal glucan molecules. [8] Currently, the Fungitell platform (Cape Cod, MA, USA) is the only food and drug administration (FDA) approved BDG detection platform. However, it requires serum and it may be prone to false-positive results. [9] Colorimetric detection platforms offer a simple and practical way to indicate the presence of a target analyte or biomolecule such as BDG. Colorimetric platforms may circumvent the need for complex data generation, instead, offering a naked-eye detectable result. [10] Recent colorimetric fungal detection platforms have included (but are not limited to) loop-mediated isothermal amplification (LAMP) for detecting the presence of amplified target fungal DNA [11,12]; HRP-mediated TMB oxidation (horseradish peroxidase/ Tetramethylbenzidine) assay [13] and surface plasmon resonance-based techniques. [14] However, these techniques suffer from the need for expensive and complex equipment or laboratory facilities. Gold nanoparticles are well-suited for colorimetric sensing due to their surface plasmon resonance-enhanced optical properties. They also include other features such as controllable size, well-established surface chemistry, facile and well-established synthesis and catalytic activity [15]. However, we previously reported on [16] some of the limitations associated with emerging gold nanoparticle colorimetric platforms, which include, but are not limited to the requirement for expensive and specialized equipment. To address these needs, we have developed a rapid, naked-eye-based colorimetric method for c. albicans BDG detection via thiolated (3′ end) aptamer-conjugated gold nanoparticles. For this work, we expanded on our prior method for solution-based c.albicans detection [16] to create a wearable platform for c.albicans detection. Our new platform offers colorimetric detection of c.albicans directly from wearable substrates that are adhered to existing sanitary pads, that are worn by women. Our platform is designed to collect vaginal fluid samples without the need for the patient to insert a cotton swab into or around the vagina. This substrate-based method of vaginal fluid collection is minimally invasive, and it decreases the likelihood that the patient may contaminate the sample or their surroundings.
The tested cell concentration (that could still give a bright distinction between positive and negative tests) was as low as 4.4 ×10⁶ cells per ml from a sample volume of 100 μL. We believe that this detection value is clinically relevant as at any given time, 0.5 to 0.75 grams or 0.5 to 0.75 ml of vaginal fluid is present within a patient sample. [17] Typically, densities of C. albicans in symptomatic vulvovaginal candidiasis samples are within the order of 106 cells per sample of vaginal fluid. [18] We believe that there is still room to further optimize this proof-of-concept detection value to achieve a more sensitive result to further enhance clinical utility. Our method offers a proof-of-concept, easily perceptible “blue” color change for a positive result and a “pink” color for a negative result. To the best of our knowledge, no wearable aptamer-based colorimetric gold nanoparticle-based platform exists for the direct detection of c. albicans from vaginal fluid.
2. Materials and Methods
Vaginal Fluid Simulant
Vaginal fluid is mainly comprised of proteins, salts, fatty acids and carbohydrates. For clinical relevance, our platform was tested within vaginal fluid simulant solution across all experiments. For our work, a vaginal fluid simulant solution was prepared from the recipe used by Owen and Katz (1999). [17] The recipe consisted of NaCl (M.Wt. 58.44), KOH (M.Wt. 56.11), Ca(OH)2 (M.Wt. 74.09), Bovine Serum Albumin, Lactic acid (L+) (M.Wt. 90.08), glacial acetic acid (M.W.t. 60.05), glycerol (M.Wt. 92.09), urea (M.Wt. 60.06) and D-glucose monohydrate (M.Wt. 198.17). The combined reagents were diluted to a total reaction volume of 1L with Milli-Q water. The solution was adjusted to pH 4.2 with HCl and was vacuum filtered and UV sterilized before being aliquoted for later use. This pH adjustment is in concordance with the pH of the average healthy vagina being around 4±0.5. However, this pH value differs across ethnicity and geographical locations [19].
Fungal Culture, Preparation and Fungal Cell Count Estimation
Candida albicans was cultured on yeast extract peptone dextrose (YEPD) plates that were created according to the following recipe: 5 g of yeast was dissolved in 250 ml of MilliQ water. 10 g of peptone (M.Wt 244.33) was added, as well as 10 g of glucose (180.16), followed by 10 g of agar. The solution was heated to combine the reagents, and MilliQ water was added to the 500 mL mark. The solution was autoclaved and stored at 4 °C overnight, ready for plate pouring the following day. C. albicans strains were cultured by adding a portion of lyophilized stock to 400 μl of Miller′s LB broth solution and covering YEPD plates with the fungal solution to ensure colony distribution. Plates were incubated at 28 °C. After five days of growth, fungal colonies were harvested for experiments.
Botrytis Cinerea was cultured on V8 agar plates that were created according to the following recipe: 8 g of bacteriological agar, 1.5 g of CaCO3 (M.Wt 100.09) (previously dissolved in 50mL of MilliQ water) and 90 mL of V8 vegetable juice were combined, and MilliQ water was added to the 400 mL mark. The solution was vacuum filtered, autoclaved and stored overnight (at 4 °C) and was available for heating and plate pouring the following day. Botrytis cinerea was obtained in-house and was cultured by slicing a portion of agar from the stock fungal plate and placing it onto a fresh plate incubated at room temperature. Spores were harvested by scrubbing the plates with pipette tips after five days of growth. Due to the nature of the extensive mycelium of the Botrytis cinerea fungus, these cells were not quantified for our work. Instead, an excess of this fungus was used for assay specificity testing as per our prior method [16].
C.albicans fungal cell counts were estimated via using optical density readings. At OD600 = 0.5, an approximate fungal cell concentration of 1×10⁷ cells/ml is expected. [20] For our serial dilution analysis, candida albicans cells were harvested from cultures and were spiked into a volume of vaginal fluid simulant solution. Optical density was measured by diluting the stock fungal cell solution and it was determined to be 0.35 (average of three readings). It was determined that the stock solution had an abundance of candida albicans cells (700 million cells per 1 mL). From this stock, 1:1 serial dilutions in vaginal fluid simulant solution were performed in preparation for data generation for subsequent testing.
Wearable Substrate Assembly
Various substrates were tested for suitability for the wearable platform. These included: gauze swabs (7.5cm ×7.5cm- 8 ply, BSN Medical GmbH, Hamburg, Germany); chromatography paper (1 CHR 20cm × 20 cm- Whatman Schleicher & Schuell, Minich, Germany); cellulose fiber sample pads (20 cm × 30 cm-EMD Millipore corporation, MA USA), Libra sanitary pads (Melbourne, Australia) and glass fiber diagnostic pad (GFDX203000) (EMD Millipore Corporation, Burlington, MA). After initial substrate testing, all subsequent experiments were performed with the glass fiber pad due to its performance as reported in the discussion section. The glass fiber pad was assembled into a final wearable platform consisting of two parts: The glass fiber diagnostic pad and the polystyrene backing card (FF170HP) (Whatman, GE healthcare life sciences, Buckinghamshire, UK). The polystyrene backing card was incorporated to give rigidity and stability to the glass fiber diagnostic pads so that they could be easily handled for image analysis. Initially, both the glass fiber diagnostic pad and polystyrene backing cards were cut to 1.5 cm × 1.5 cm dimensions each. The glass fiber diagnostic pads were then adhered to the polystyrene backing cards after removing the polystyrene backing card adhesive strips. With some modification, these backing cards can be made to be adhesive (to the sanitary napkins) and compatible with the skin. This requires adding a gluing agent to the back of the cards and a thin layer of gauze or another suitable material to protect the skin from direct contact with the glass fiber pads. Other protective layers will be investigated to ensure that the skin is protected from the glass fiber layer, while allowing samples of vaginal fluid containing fungal cells, to still be deposited on the glass fiber layer. However, this is outside of the scope of this current proof-of-concept work.
Aptamer Design and Preparation
The AD1 aptamer (kd = 79.76 nM ) was selected for conjugation (via thiol linkage) to gold nanoparticles for specific binding to candida albicans β-1,3-D-glucan molecules. AD1 can assist to detect different morphological forms of candida albicans, including yeast cells, germ tubes and hyphae, as well as extracellular matrix material. [8] Our aptamer design is as follows:
5’GCGGAATTCGAACAGTCCGAGCCCACACGTGTGAGAAGGGTGTTATCATGTATTTCGTGTTCCTTTCGTCATTCCTTTGTCTGGGGTCAATGCGTCATAGGATCCCGCAAAAAAAAAA-3’Thiol Modifier C3 S-S.
This lyophilized aptamer was reconstituted with RNAse free water to form a 10μM stock solution and was aliquoted for future use. Prior to nanoparticle synthesis, 2 μL of 10-μM aptamer solution was added to 250 μL of 0.01% Tween-20 solution to form the aptamer solution (for combination with gold nanoparticles) as described in the following section.
Nanoparticle Synthesis
To maintain nanoparticle purity during synthesis, a glass vial was rinsed in aqua regia (HCl, HNO3, 3:1), washed in distilled water and was air dried. Aptamer-conjugated gold nanoparticles were created within this vial according to the following recipe: 440 μL of 0.1% Tween-20, 120 μL of 10 mM HAuCl3, 250 μL of 0.1M sucrose and 250 μL of AD1 aptamer solution were added to a glass vial under magnetic stirring (700 RPM at room temperature) for 5 minutes. Then, 25 μL of 1M NaOH was added to the solution under magnetic stirring. The solution was stirred further for another ten minutes to ensure the complete formation of the gold nanoparticles. Upon nanoparticle formation, the solution turned a deep “red” color. This solution was then centrifuged (room temperature, 12,000 RPM) for 40 minutes and the supernatant was removed and discarded. Nanoparticle pellets were obtained and were added to a 0.5% agarose gel solution (1:2; nanoparticle: gel) via thorough pipette mixing. In general, nanoparticles may continue to grow for 24 hours after synthesis, and those with less stable capping agents may continue to slowly grow after 24 hours. [21] To ensure reproducibility and smaller size, our nanoparticles were combined with the gel within an hour of nanoparticle synthesis.
Running Buffer Preparation
Seven buffers were prepared for analysis according to existing literature: Sodium dodecyl sulfate detergent buffer (0.05%, pH 7) (SDS) [22]; Buffer containing 20 mM sodium borate (pH 8.0), 2% (w/v), sucrose, 0.6 M NaCl, 0.2% (v/v) Tween 20%, and 0.1% (w/v) sodium azide [23]; High salt buffer (HSB: 0.1 M tris-HCl (pH 8.0), 0.01 M MgCl2, and 0.15 M NaCl) containing 30% (v/v) ethanol [24]; Phosphate buffer (0.01M, pH 7.4)- made by dissolving 0.21 g of Na2HPO4 in 150 ml of Milli-Q water, and adjusting to pH 7.4 with NaH2PO4·H2O solution (made by dissolving 0.20 g of NaH2PO4·H2O in 150 ml of Milli-Q) [22]; Tris buffer (pH 7.5, 1M) [22]; HEPES buffer (pH 7.4, 10mM) [22] and finally a buffer comprised of 20 mM sodium borate (pH 8), 0.8 M potassium chloride and 0.2% v/v Tween-20 solution from the recipe from Park and colleagues [23] Due to the performance of the final buffer (as reported within the discussion), this buffer was used for all experiments after initial buffer testing.
Image Processing and Analysis
The images presented in this study were photographed with an iPhone 15 pro. All images were cropped to the same size (220×220 pixels) and were then imported into ImageJ software (Java 1.8.0_345 64-bit, National institutes of health, Madison, Wisconsin, USA) for analysis. Subsequently, the background color of all the images was subtracted (with the light background checkbox selected). Then, each of the images were converted into red, blue and green channel individual images by splitting the color channels. The red channels were subsequently selected and were measured via ImageJ to give a final numerical value for the brightness intensity. Red channel analysis was ideal because as gold nanoparticle aggregation increases, as does the “blue” color and therefore, the brightness intensity of red pixels decreases. Red channel brightness intensity values were then entered into OriginLab graphing software (version: 10.1.0.178) (MA, USA) for graphical representation. Error bars are displayed where appropriate for n=3 sample replicates. Error bars are not displayed when results are a single value representative of an average of the three replicates.
3. Results and Discussion
Assay Principle
The assay principle is schematically presented in Figure 1 depicting the cases of both negative (Figure 1A) and positive tests (Figure 1B), respectively for candida albicans. The assay features three main steps: 1- Addition of vaginal fluid samples to wearable sample pads; 2- addition of the nanoparticle gel to the sample pad, followed by the addition of the running buffer and 3- a colorimetric result based on the aggregation state of the nanoparticles. In the case of a negative test result (the absence of candida albicans), the sample pad turns bright pink, as the red nanoparticles remain free of aggregation. In the case of a positive test result (the presence of candida albicans), the sample pad turns dark blue. This is caused by aptamer-target induced nanoparticle aggregation. I.e. nanoparticle aggregation results in a redshift (or blue color change) on the plasmonic spectrum.[25]
Typical lateral flow assembly (LFA) platforms utilize the glass fiber diagnostic pad as the platform’s conjugate pad. The conjugate pad has three main functions: preserving dried nanoparticles; releasing them upon sample wetting and providing the first interaction between the target and labelled bioreceptor. [22] Typically, conjugate pads of lateral flow assays incorporate buffering agents to maximize nanoparticle stability and to completely release them upon rewetting by the sample. [22] Once the conjugate pad buffer has been chosen, the nanoparticle conjugates are loaded onto the conjugate pad by either immersion or air jet dispensing. Air jet dispensing requires a costly and well-calibrated dispensing apparatus, and the immersion method may have non-uniform coverage, leading to sensor-to-sensor variability. [22] Furthermore, within LFA construction, the conjugate pad requires drying in hot air (which is typically fixed at 37 °C), or vacuum drying. Drying is critical for maintaining the stability of the dried nanoparticle-bioreceptor conjugates. [22] Improper conjugate pad drying can greatly impact the nanoparticle release efficiency from the conjugate pad. Much like the LFA, our method is disposable, cheap, rapid and convenient. However, our method avoids the complexity of precise assembly and chemical/bioreceptor modification required within the conventional LFA. Our method repurposes the LFA conjugate pad as a user-friendly, discrete and wearable substrate (with slight modification) for instant candida albicans detection. Unlike conventional LFAs, our wearable substrate does not require pre-treatment or careful nanoparticle/ bioreceptor functionalization onto conjugate pads. Furthermore, the wearable substrate is not subject to strict storage conditions or shelf-life limitations. To the best of our knowledge, current LFAs do not offer detection of candida albicans from vaginal fluid and they are not yet wearable. We believe that our platform has significant clinical translational potential because our wearable substrate can be adhered directly to existing sanitary napkins for testing with a user-friendly nanoparticle gel-based solution and buffer before sanitary pad disposal.
Initial Concept and Running Buffer Selection
The type and concentration of running buffer can greatly influence the overall pH and ionic strength. Ionic strength and pH can affect the interaction between the receptor and target as well as affecting potential nonspecific binding. This can greatly impact the sensitivity, specificity and reproducibility of a biomolecular detection platform. The performance of various running buffers was assessed within our platform to determine which buffer would show the best distinction between positive and negative samples. Running buffers were selected for our platform based on commonly reported buffers within LFA platforms. LFA buffers were selected due to the performance for enabling the efficient release of the nanoparticles from the conjugate pads.
Some of these buffers include: phosphate buffer (pH range between 5.8 and 8); Tris (pH range between 7.5 and 9) and HEPES (pH range between 6.8 and 8.2). Common detergents such as SDS are typically used within the sample pad portion of LFA platforms. Detergents may assist with minimizing nonspecific binding (disrupting weak ionic and hydrophobic bonds) and with facilitating the flow of the detection labels along the different pads. Consequently, we tested SDS to observe its effect for our platform. Colloidal nanoparticle suspension stability is generally affected by the ionic strength of the solution. As such, buffers containing borate may be used due to their low ionic strength. Figure 2 A shows the prepared gold nanoparticles prior to centrifugation and prior to addition to the gel. Figure 2b shows 5 μL of nanoparticle gel solution that is dispensed onto the substrate containing 100 μL of previously soaked vaginal fluid simulant solution, prior to running buffer addition. Prior to the running buffer, the nanoparticles remain confined to the gel matrix and do not disperse across the substrate. We believe that this greatly improves manual handling, allowing for more uniform distribution of nanoparticles by the user. The results of various buffer testing are displayed in Figure 3. A concentration of 7.0×10⁷ candida albicans cells per ml was tested to ensure the best distinction could be made between positive and negative tests for each tested buffer. Results of buffer testing are described as follows, describing the outer portion, inner portion and nanoparticle gel conditions (in terms of naked-eye clarity) of each of the tests.
SDS buffer i)- the distinction was unclear between positive and negative samples. Positive samples showed a pattern of nanoparticle aggregation in the form of a dark pink outer ring. Whereas, the center of the positive test showed a pink unaggregated portion as well as a pink coloration of the nanoparticle gel. Negative tests showed a bright pink outer ring, a pink inner color as well as a pink coloration of the nanoparticle gel.
Sodium borate/ sucrose/ NaCl/ Tween/ Sodium azide buffer ii)- the distinction was unclear between positive and negative samples. Positive samples showed a slight pattern of nanoparticle aggregation in the form of a thin dark/purple outer ring. The center of the test showed slightly aggregated purple nanoparticles as well as a dark purple color of aggregated nanoparticles within the nanoparticle gel. The negative test showed no definitive nanoparticle ring, however, the inner portion of the test was a pale pink color. The nanoparticle gel of the negative test resembled the same aggregated purple color as seen within the positive test.
Tris-HCl/ MgCl2/ NaCl and ethanol buffer iii)- distinction was unclear between positive and negative tests. Positive samples showed a purple outer ring of aggregated nanoparticles, while the inner portion of the test showed a feint, aggregated dark blue color. The nanoparticle gel of the positive test showed a dark blue to black color of aggregated nanoparticles. The negative test showed a pink outer ring of unaggregated nanoparticles, whereas, the center of the test showed significant non-specific nanoparticle aggregation. The nanoparticle gel of the negative test showed a dark blue to black color of aggregated nanoparticles.
Sodium borate/ KCl/ Tween buffer iv)- a very clear distinction between positive and negative samples was observed. Positive samples showed a dark purple to blue outer ring of aggregated nanoparticles. The inner portion of the test displayed a slightly aggregated, purple nanoparticle color, whereas the nanoparticle gel showed a dark purple to black color of aggregated nanoparticles. The negative test did not show a ring of nanoparticles. However, the inner portion of the test showed a relatively homogeneous portion of pink unaggregated nanoparticles. However, the nanoparticle gel of the negative test displayed a dark purple to blue color, suggesting some nonspecific nanoparticle aggregation.
Phosphate buffer v)- a distinction was evident between the positive and negative tests. Positive samples showed a dark purple to blue outer ring of aggregated nanoparticles. The inner portion of the test showed a bright pink portion of unaggregated nanoparticles, however. The nanoparticle gel remained free of aggregated nanoparticles, showing a bright pink to red color. The negative test showed a dark pink color of nanoparticles of “borderline” aggregation status. The inner portion of the test showed dispersed nanoparticles that remained free of aggregation. As with the positive test, the nanoparticle gel remained free of visible aggregation and was pink to red in color.
Tris-HCL buffer vi)- no clear distinction between positive and negative tests was observed. Positive samples showed a dark blue ring of aggregated nanoparticles, while the middle portion of the test showed slightly aggregated purple nanoparticles. The nanoparticle gel showed an aggregated dark purple color. The negative test did not display an aggregated ring portion of nanoparticles, however, the inner portion of the test showed some non-specific nanoparticle aggregation in the form of a purple to pink color. The nanoparticle gel showed nanoparticle aggregation in the form of a dark purple color.
HEPES buffer vii)- a distinction was observed between positive and negative tests. Positive samples showed a distinct dark blue color of aggregated nanoparticles as an outer ring. Whereas, the inner portion of the test showed zero nanoparticle aggregation in the form of a bright pink color. The nanoparticle gel remained unaggregated in the form of a bright pink to red color. In the case of the negative test, the outer portion of the test displayed a dark pink color, possibly indicating potentially and slightly aggregated nanoparticles. The inner portion of the test remained aggregation free and pink. The nanoparticle gel also remained unaggregated and bright pink to red in color.
Figure 3 b displays the red channel brightness intensity of each buffer for the positive and negative samples after image processing. Notably, all buffers displayed a lower red channel brightness intensity for the positive tests compared to the negative tests. c) shows the difference in brightness intensity (after image processing) between positive and negative samples, for each of the buffers. Notably, buffer iv) (Sodium borate/ KCl/ Tween-20) showed the greatest difference in red channel brightness intensity between positive and negative results. I.e. The positive result was “blue” which was low in red channel brightness intensity and the negative result was “pink” which was high in red channel brightness intensity.
The final buffer chosen for subsequent experiments was the sodium borate/ KCl/ Tween buffer. This buffer provided the clearest distinction between the positive and negative result (at this tested concentration), with minimal nonspecific nanoparticle aggregation within the negative control. I.e. this buffer provided an overall relatively homogeneous purple to blue color for a positive result and an overall homogeneous (ignoring the nanoparticle gel portion) bright pink color for the negative result. Importantly at this proof-of-concept stage, buffer optimization has not yet been performed. We acknowledge that different buffering conditions may be better suited for our platform. However, we note that buffer optimization studies would require testing with a broad range of target concentrations, reaction times, buffer concentrations, reagent ratios, etc. Buffer performance may be assessed based on platform rapidity, sensitivity, specificity and ease of distinction based on naked-eye differentiation between positive and negative samples. Moreover, the “ideal” choice of buffer may be subjective because one buffer may provide a better sensitivity for example, however, it may not yield the optimum distinction (between positive and negative targets) for ease of naked-eye readability. Full optimization of these parameters is beyond the scope of this current proof-of-concept testing stage. Rather, the platform was only optimized in terms of speed and visual distinction between positive and negative samples at this stage. However, we did optimize the buffer volume and we determined that 45 μL was ideal for the 1.5cm × 1.5cm sample pads that had been previously soaked in 100 μL of vaginal fluid simulant solution. This buffer volume was not so large that it diluted the colorimetric results or overflowed the sample pads, and it was not so small that it could not release the nanoparticles from the gel.
Substrate Selection
The choice of substrate was crucial for the success of the platform at this stage of testing (Figure 4). The final substrate was chosen for all future experiments based on its ability to showcase visually distinctive positive results, compared to the negative results. Five substrates were tested including: gauze swabs; cellulose fiber sample pads; sanitary pads; chromatography paper and glass fiber pads. These substrates were selected due to availability, as well as being low-cost, absorbent (for vaginal fluid samples), light weight, cheap, flexible and potentially wearable. A concentration of 7.0×10⁷ candida albicans cells per ml was tested to ensure the best distinction could be made between positive and negative tests for each tested substrate. Results of the substrate testing describing the clarity of the naked-eye distinction between positive and negative samples are as follows:
Gauze i): There was no clear distinction between positive and negative samples. Positive samples turned dark purple upon nanoparticle aggregation, whereas negative samples turned a similar color.
Cellulose fiber ii): There was no distinction between positive and negative samples. Both samples turned purple on this substrate. We believe that this was possibly due to nanoparticles drying out within this substrate.
Sanitary pad iii): There was no distinction between positive and negative samples when testing with sanitary pad substrates. Significant non-specific nanoparticle aggregation was exhibited between both positive and negative samples. We believe that this may be attributed to significant drying of the nanoparticle solutions.
Chromatography paper iv): There was no distinction between positive and negative samples when testing on chromatography paper. Upon this substrate, nanoparticle gel became disrupted possibly due to the buffer solution spreading the nanoparticles across the surface of the substrate rather than within the substrate.
Glass fiber v): There was a very clear distinction between positive and negative results when testing on the glass fiber substrate. Positive samples showed significant nanoparticle aggregation and turned dark blue, whereas negative samples remained a bright pink color and free of visible aggregation.
Image processing for red channel brightness intensity for each of the substrates is shown in Figure 4 b. Gauze i), chromatography paper iv) and glass fiber v) showed an increase in red channel brightness intensity for the negative results in comparison to the positive results. However, cellulose fiber ii) and sanitary pad substrates iii) unexpectedly showed less red channel brightness intensity for negative results when compared to positive results. Image processing showed that the greatest difference in red channel brightness intensity between positive and negative results was achieved with the glass fiber substrate. Consequently, glass fiber was selected for all subsequent experiments due to its performance for differentiating positive “blue” tests from negative “pink” tests. Figure 4c shows the difference in brightness intensity (after image processing) between positive and negative samples, for each of the substrates. Negative values for ii) and iii) indicate decreased red channel brightness intensity for the negative samples.
Semiquantitative Candida Yeast Cell Detection
To demonstrate a proof-of-concept for c. albicans detection, the platform was tested with four different concentrations of c. albicans cells across three replicates (Figure 5a). The sodium borate/ KCl/ Tween-20 buffer combination was chosen for all following experiments due to its superior performance in initial testing. Initially, a stock solution of 7.0×10⁷ c. albicans cells per ml (in vaginal fluid simulant solution) was created via optical density (OD600) analysis.
Then, the stock solution was diluted (1:1) in vaginal fluid simulant solution to an eventual concentration of 4.4×10⁶ c. albicans cells per ml. Each of the concentrations were compared to the blank solution comprised of vaginal fluid simulant solution only. The results are displayed after 20 minutes. 20 minutes was deemed the optimal time to visualize all the colorimetric results at lower concentrations, however, at higher concentrations, a result starts to appear within 5 minutes. Notably, upon optimization of manual buffer addition to the nanoparticle gel, we believe that our results will reflect indistinguishable replicates. Increasing the concentration of c. albicans cells led to increased nanoparticle aggregation and therefore an increase in the intensity of the observed “blue” color. All five concentrations of c. albicans cells differed in color compared to the blank solution that remained pink. The results indicated that the platform was able to detect c. albicans cells within vaginal fluid simulation after 20 minutes.
Image processing was performed for each of the concentrations and replicates (Figure 5 b) and red channel brightness intensity is shown. As the concentration of candida albicans fungal cells decreased, there was an increase in red channel brightness intensity due to decreased nanoparticle aggregation. Figure 5 c shows the difference in red channel brightness intensity for each of the concentrations in comparison to the blank test. The higher the concentration of candida albicans cells, the greater the difference in red channel brightness intensity is from the blank solution. The results of Figure 5c represent an average of each of the individual concentrations from Figure 5b. We note that manual handling effects can impact the results. I.e. if careful handling is not given to adding the running buffer dropwise to the nanoparticle gel, the particles may be unevenly displaced across the sample pad, showing an uneven nanoparticle aggregation pattern for positive tests. Notably, once the result has developed, it is also visible for at least two months after testing. I.e. once the platform has been allowed 20 minutes of development time, the colorimetric result is “locked in” and this does not significantly change in brightness intensity for the tested candida albicans concentrations or the blank sample. For this proof-of-concept testing, we note that colorimetric naked eye detection is subjective. I.e. a result that may appear “positive” to one person may be perceived as “negative” to another person. As such, we chose to ignore reporting on a limit of detection here, instead, opting to show the lowest concentration of tested candida albicans cells that may still be perceived as a “positive” result in reference to the negative blank results. We believe that our results are within the range of clinical feasibility concerning the available number of c.albicans cells that are present within symptomatic vulvovaginal candidiasis cases. [18] However, we will improve upon this proof-of-concept detection limit with further optimization.
Nanoparticle Specificity and Dry Sample Testing
Nanoparticle specificity testing (Figure 6 a) was conducted following our previous work [16] by using other available glucan-containing substances such as dextran ([C6H10O5]n), starch ([C6H10O5]n) and the Botrytis Cinerea fungus. For this purpose, our aptamer-conjugated gold nanoparticles were expected to only aggregate upon specific recognition of candida albicans glucan molecules. A concentration of 7.0×10⁷ candida albicans cells per ml was tested to ensure the best distinction could be made between positive and negative tests for each specificity test. Both Dextran and starch were diluted in vaginal fluid simulant solution to give respective concentrations of 50 mg/mL. This was to ensure a high concentration of glucan molecules for each of the reagents. At concentrations exceeding 50 mg/mL, solubility was an issue that would unfairly challenge our platform due to matrix effects aiding in nanoparticle aggregation, rather than glucan composition alone. As per our prior work [16] an excess of botrytis cinerea mycelium (50 mg) was harvested and was sonicated for addition to samples of vaginal fluid simulant solutions for assay specificity testing. Selecting Botrytis cinerea was useful for testing the specificity of our AD1 aptamer-nanoparticle conjugates for two reasons: Firstly, the fungal mycelium provides a significant biological challenge for nanoparticles in solution as nanoparticles may non-specifically aggregate upon the fungal mass. And secondly, it is crucial to test the AD1 aptamer specificity within other glucan molecules as our aptamer is designed to recognize the specific microenvironment of candida albicans BDG molecules only. 100 μL of each respective solution. (containing starch, dextran or botrytis) was used per test on our sample pads. Three individual replicates (1, 2 and 3) were conducted to show reproducibility of the results. Results are shown after 20 minutes of development time. Each of the non-specific glucan-containing species (dextran, starch and botrytis) showed a similar “pink” result compared to the blank samples. Image processing of red channel brightness intensity is shown in Figure 6b (with error bars) for three individual replicates of each experiment. Figure 6C shows the difference in red channel brightness intensity between each of the tested samples compared to the blank sample. The results represent the average of the three replicates for each experiment from Figure 6b. The positive “blue” tests differ significantly from the blank “pink” negative test in terms of red channel brightness intensity. Botrytis, dextran and starch each show a minimal difference in red channel brightness intensity from the blank samples. Therefore, the nanoparticles did not significantly non-specifically aggregate under these specificity testing conditions. This implies that our platform is highly specific for the detection of c. albicans BDG molecules only.
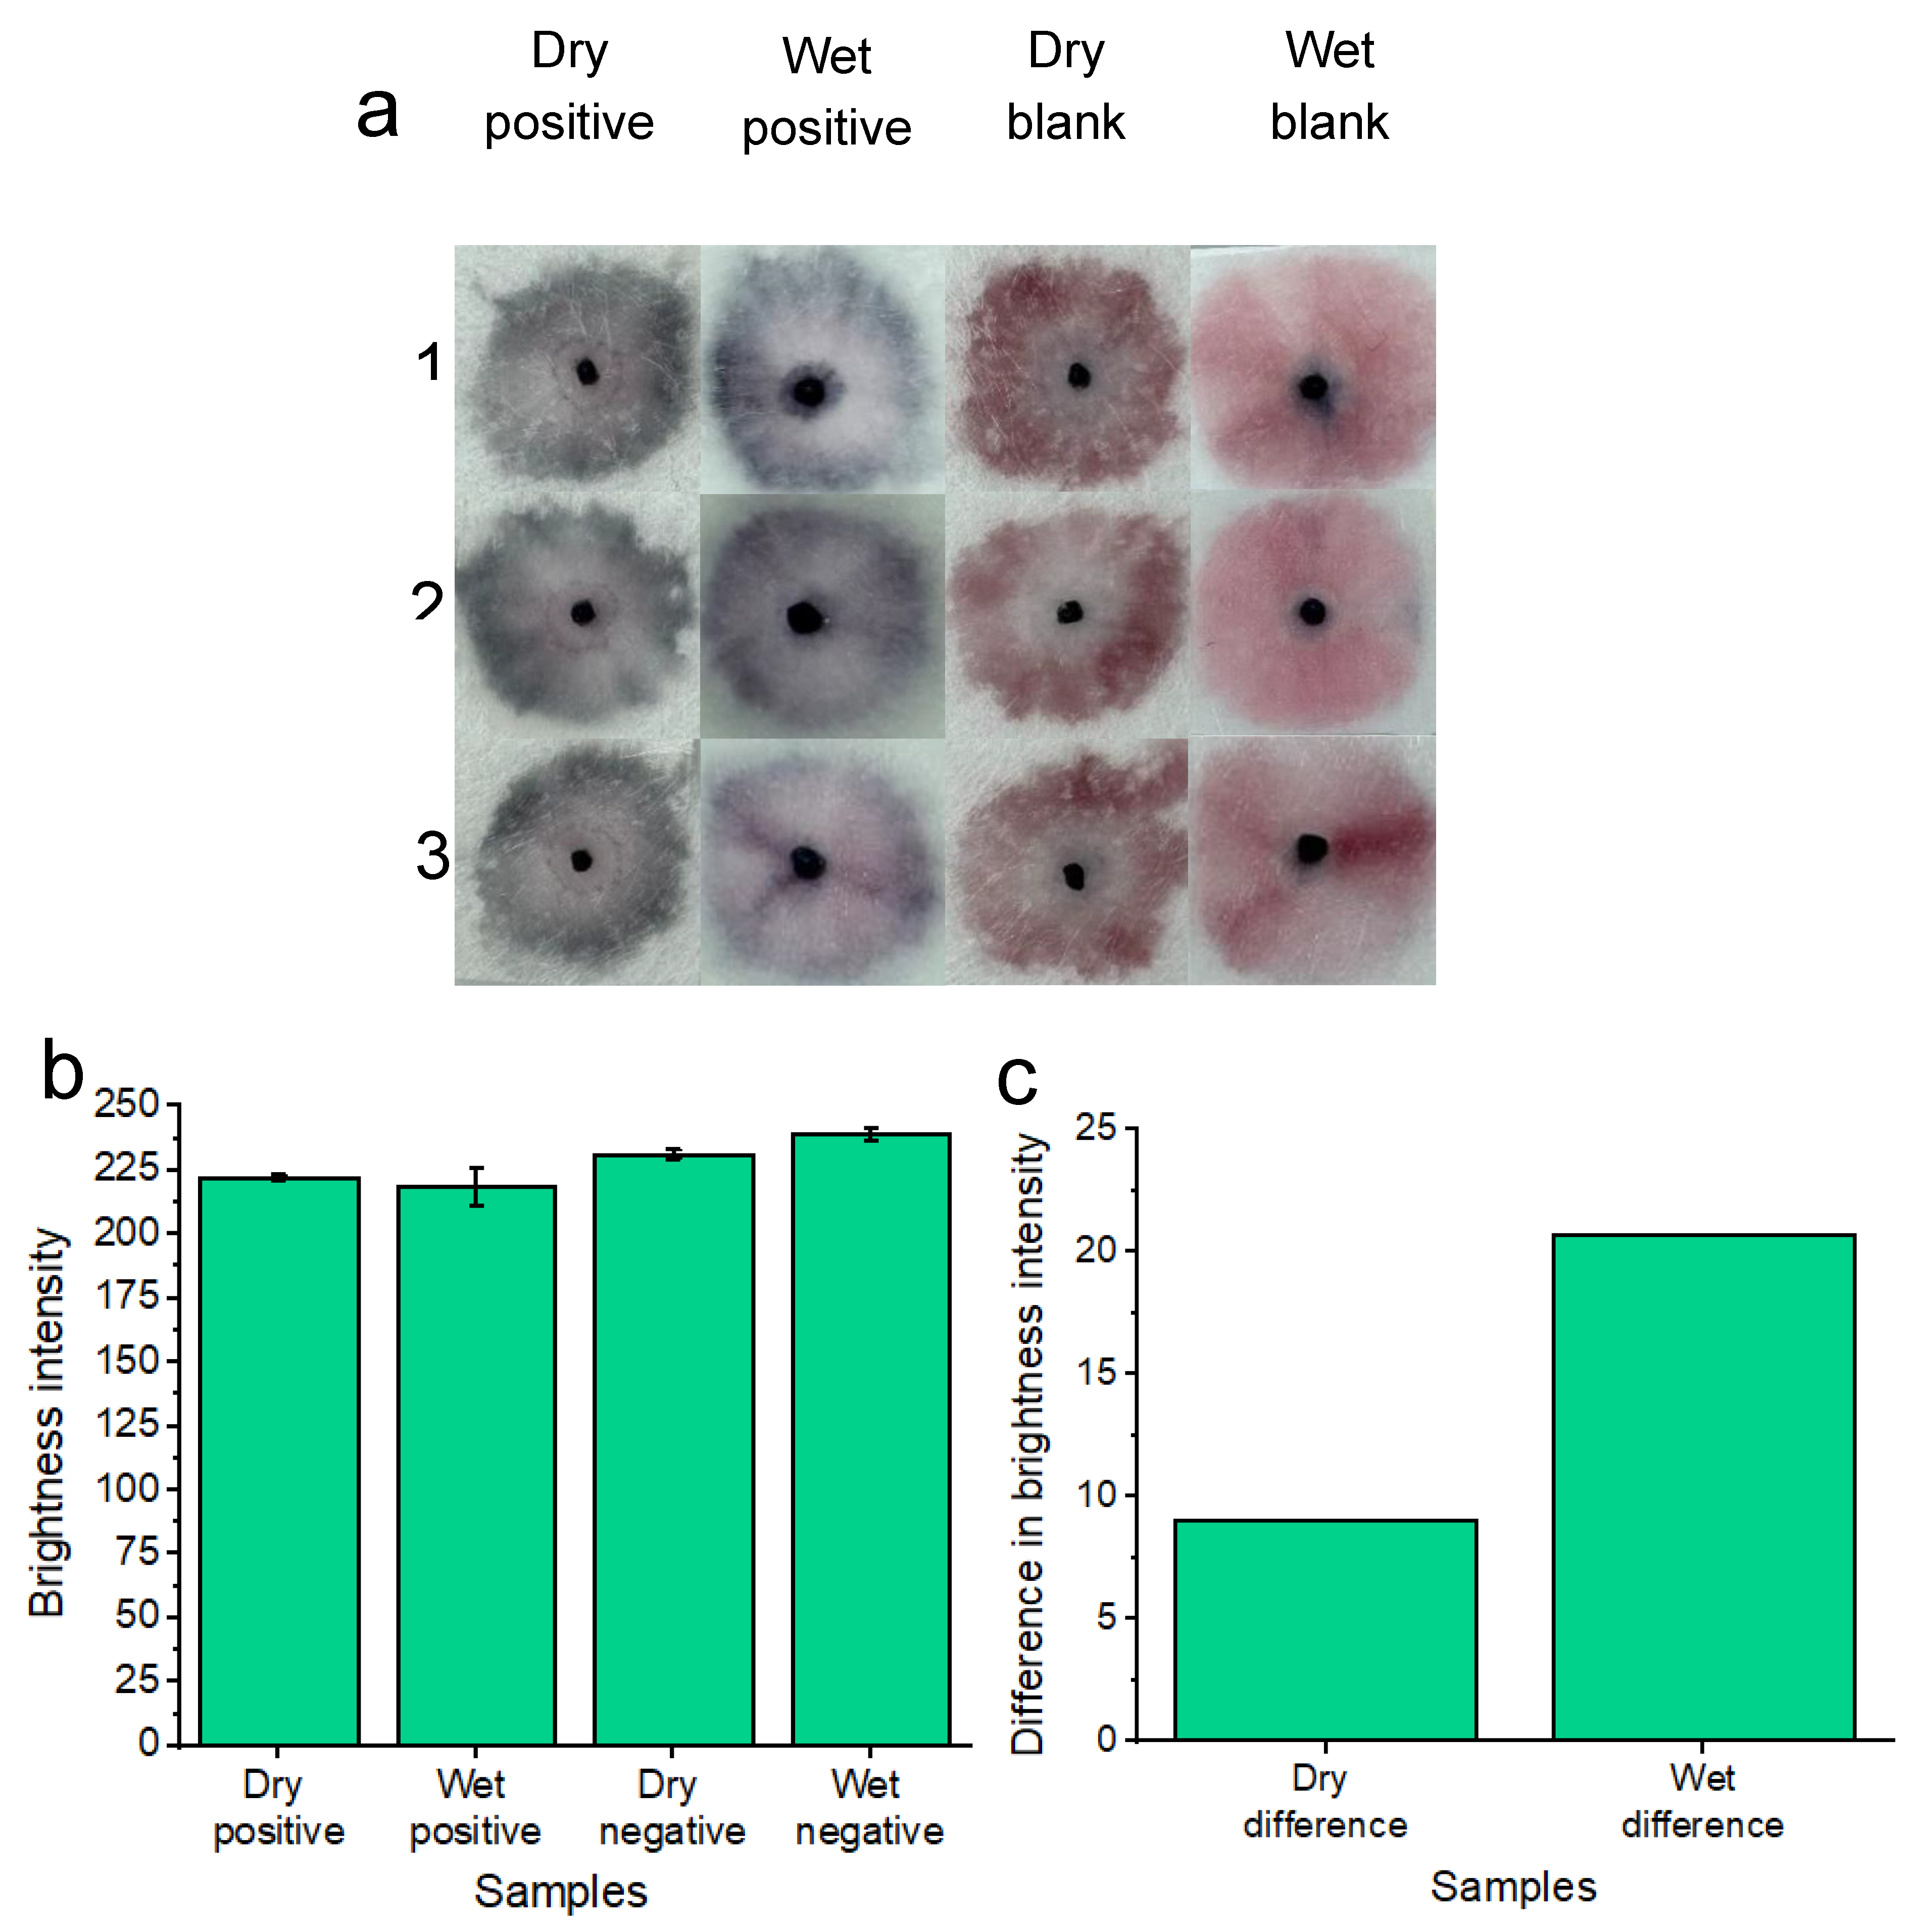
In addition to testing the platform with freshly supplied (wet) candida albicans fungal samples in vaginal fluid simulant solution, dried samples were also tested (Figure 7a). As part of the drying process, samples were added to the pads and were allowed to dry for 1.5 hours at 37°C before nanoparticle gel addition and subsequent running buffer addition. This dry testing was important to assess given that within a commercial platform, patients would not always be testing on fresh and wet samples of vaginal fluid. i.e. patient vaginal fluid secretions may flow onto the substrate, but the patient may not decide to test the wearable for candida albicans until some time has elapsed throughout their day. Three replicates (1,2 and 3) are shown for the concentration of 7.0×10⁷ candida albicans cells per ml in reference to the blank solution. A concentration of 7.0×10⁷ candida albicans cells per ml was tested to ensure the best distinction could be made between positive and negative tests across the dry and wet sample conditions. Results are shown after 20 minutes of development time. The positive samples showed a distinct “blue” color in reference to the “pink” blank tests. Results indicated that the platform is feasible under dry testing conditions for detecting 7.0×10⁷ candida albicans cells per ml. However, for future work. Other lower concentrations of candida albicans cells will be tested across different drying times to simulate times throughout the day that a patient may decide to test after removing the wearable sample pads. For comparison, the previous results of wet sample testing are included. Image processing for measuring red channel brightness intensity was also conducted (Figure 7b). Three individual replicates are shown with error bars. The results of Figure 7c show a comparison between dry and wet sample positive tests compared to their respective blank samples. The results indicate that testing under wet sample conditions gives the best distinction between positive and negative samples, however, a distinction between positive and negative samples can still be made when testing dry samples.
4. Conclusions
Candida albicans is a commensal fungus that exists within the bodies of most healthy people, without causing any symptoms. However, candida albicans is an opportunistic fungus that will become pathogenic, harmful, and potentially deadly if biological conditions permit. This is often the case for immunocompromised patients. Detection of fungal pathogens such as candida albicans currently requires access to trained medical staff and laboratories. This process is slow, inconvenient, costly, and often embarrassing for the patient. This may cause the patient to self-diagnose (often wrongfully) and to self-treat with over-the-counter antifungal treatments, which can cause eventual antifungal resistance. Therefore, there is a special need for a discrete, sensitive, specific, cost-effective, and rapid platform that women can use within the comfort of their homes, for c.albicans detection. To achieve this goal, we created a wearable platform for candida albicans detection based on aptamer recognition of candida albicans β-1,3-D-glucans. Our platform utilizes thiolated aptamer-conjugated gold nanoparticles that are underpinned by surface plasmon resonance properties. In the presence of candida albicans, a redshift in the UV-visible absorbance occurs based on nanoparticle aggregation that is proportional to the amount of candida albicans β-1,3-D-glucans. This reveals a blue color that is detectable by naked eye. In the absence of candida albicans, nanoparticles remain free from aggregation, and they remain pink. Our wearable platform includes three steps: (i) collection of vaginal fluid from wearable glass fiber sample pads; (ii) addition of nanoparticle gel and running buffer and (iii) a colorimetric result based on the presence or absence of candida albicans fungal cells. Combining the nanoparticles with the gel achieved two functions that supported our platform- (i) it provided a way to stabilize the gold nanoparticles, keeping them free from unwanted aggregation and (ii) it provided a way for easy application onto the sample pads, allowing careful control of particle position and dispensed volume. To the best of our knowledge, no other colorimetric, wearable gold nanoparticle aggregation-based platform exists for the detection of candida albicans. Within future works, we will improve upon this platform to reduce the error associated with manual handling steps. I.e. we may incorporate the nanoparticles within the sample collection pads, however extensive analysis will need to be performed to ensure that these tests are safe for patients in case of skin contact. This will be achieved by investigating skin-friendly top layers to protect the skin while allowing vaginal fluid containing candida albicans to still be deposited on the glass fiber pads. We will also thoroughly investigate other buffer combinations and concentrations to improve on platform sensitivity and specificity, without sacrificing the quality of the naked-eye results. In the present proof-of-concept study, we have only optimized for rapidity and color change brightness intensity for the easiest distinction between positive and negative samples. We also acknowledge the need to collaborate with clinicians to tune platform sensitivity to determine a cutoff value for candida albicans cell counts that will differentiate colonization from infection. With some modification, we believe that our platform can be adapted to detect other fungal pathogens from wearable substrates for the elderly and for babies. Furthermore, analysis of red channel brightness intensity shows the potential for incorporating our platform into a camera and software processing-based platform. While this would add to platform costs and required equipment, this would potentially overcome the limitation of colorimetric analysis. Specifically, giving a “yes” or “no” answer based on a predetermined cutoff color corresponding to an exact number of detected candida albicans fungal cells, rather than relying on color interpretation by naked eye. Overall, we believe that this work will contribute to revolutionizing women’s health by giving patients more control over their own health, encouraging them to gain a better understanding of disease rather than relying on clinicians.
Author Contributions
M.S and S.M conceived the core nanoparticle synthetic strategy with slight modification by K.C. M.S was responsible for nanoparticle synthesis troubleshooting and technical advice, C.M conceptualized combining the nanoparticles with the gel, K.C and M.S were responsible for the aptamer design, K.C conceived and manufactured the wearable substrate, K.C designed all experiments, K.C was responsible for data generation and image processing. K.C was responsible for writing, K.C and M.S were responsible for creating the vaginal fluid simulant solution, K.C and M.S contributed equally to fungal culture, K.C was responsible for creating the scheme, N.T.N provided overall supervision and was responsible for editing. .
Funding
This research was funded by a Griffith University Higher Degree Research Scholarship.
Acknowledgments
K.C. thanks the Griffith University School of Environment and Science and Griffith Graduate Research School for their support and for Griffith University Higher Degree Research Scholarship.
Conflicts of Interest
The authors declare no conflicts of interest.
References
- Kumamoto, C.A.; Gresnigt, M.S.; Hube, B. The gut, the bad and the harmless: Candida albicans as a commensal and opportunistic pathogen in the intestine. Current Opinion in Microbiology 2020, 56, 7–15. [Google Scholar] [CrossRef] [PubMed]
- Gow, N.A.R.; Hube, B. Importance of the Candida albicans cell wall during commensalism and infection. Current Opinion in Microbiology 2012, 15, 406–412. [Google Scholar] [CrossRef] [PubMed]
- Moran, C.; Grussemeyer, C.A.; Spalding, J.R.; Benjamin, D.K., Jr.; Reed, S.D. CANDIDA ALBICANS AND NON-ALBICANS BLOODSTREAM INFECTIONS IN ADULT AND PEDIATRIC PATIENTS: COMPARISON OF MORTALITY AND COSTS. The Pediatric Infectious Disease Journal 2009, 28. [Google Scholar] [CrossRef] [PubMed]
- Kalia, N.; Singh, J.; Kaur, M. Microbiota in vaginal health and pathogenesis of recurrent vulvovaginal infections: a critical review. Annals of Clinical Microbiology and Antimicrobials 2020, 19. [Google Scholar] [CrossRef] [PubMed]
- Brown, S.E.; Schwartz, J.A.; Robinson, C.K.; O’Hanlon, D.E.; Bradford, L.L.; He, X.; Mark, K.S.; Bruno, V.M.; Ravel, J.; Brotman, R.M. The Vaginal Microbiota and Behavioral Factors Associated With Genital Candida albicans Detection in Reproductive-Age Women. Sexually Transmitted Diseases 2019, 46. [Google Scholar] [CrossRef] [PubMed]
- Sobel, J.D. Recurrent vulvovaginal candidiasis. American Journal of Obstetrics and Gynecology 2016, 214, 15–21. [Google Scholar] [CrossRef] [PubMed]
- Chatwani, A.J.; Mehta, R.; Hassan, S.; Rahimi, S.; Jeronis, S.; Dandolu, V. Rapid testing for vaginal yeast detection: a prospective study. American Journal of Obstetrics and Gynecology 2007, 196, 309.e301–309.e304. [Google Scholar] [CrossRef] [PubMed]
- Hou, Y.; Yang, M.; Li, J.; Bi, X.; Li, G.; Xu, J.; Xie, S.; Dong, Y.; Li, D.; Du, Y. The enhancing antifungal effect of AD1 aptamer-functionalized amphotericin B-loaded PLGA-PEG nanoparticles with a low-frequency and low-intensity ultrasound exposure on C.albicans biofilm through targeted effect. NanoImpact 2021, 21, 100275. [Google Scholar] [CrossRef] [PubMed]
- Ahmad, S.; Khan, Z. Invasive candidiasis: A review of nonculture-based laboratory diagnostic methods. Indian Journal of Medical Microbiology 2012, 30, 264–269. [Google Scholar] [CrossRef] [PubMed]
- Rao, H.; Xue, X.; Luo, M.; Liu, H.; Xue, Z. Recent advances in the development of colorimetric analysis and testing based on aggregation-induced nanozymes. Chinese Chemical Letters 2021, 32, 25–32. [Google Scholar] [CrossRef]
- Chaumpluk, P.; Plubcharoensook, P.; Prasongsuk, S. Rapid detection of aflatoxigenic Aspergillus sp. in herbal specimens by a simple, bendable, paper-based lab-on-a-chip. Biotechnology Journal 2016, 11, 768–779. [Google Scholar] [CrossRef] [PubMed]
- Roumani, F.; Gómez, S.; Rodrigues, C.; Barros-Velázquez, J.; Garrido-Maestu, A.; Prado, M. Development and evaluation of a real-time fluorescence, and naked-eye colorimetric, loop-mediated isothermal amplification-based method for the rapid detection of spoilage fungi in fruit preparations. Food Control 2022, 135, 108784. [Google Scholar] [CrossRef]
- Lee, S.M.; Lee, S.; Lee, S.H.; Ahn, G.R.; Lee, B.Y.; Kim, S.H.; Song, M.; Chung, W.-J. Engineered M13 bacteriophage-enhanced colorimetric detection of allergenic fungi. Sensors and Actuators B: Chemical 2023, 393, 134244. [Google Scholar] [CrossRef]
- Mendes, R.K.; Carvalhal, R.F.; Stach-Machado, D.R.; Kubota, L.T. Surface plasmon resonance immunosensor for early diagnosis of Asian rust on soybean leaves. Biosensors and Bioelectronics 2009, 24, 2483–2487. [Google Scholar] [CrossRef] [PubMed]
- Lee, J.I.; Jang, S.C.; Chung, J.; Choi, W.-K.; Hong, C.; Ahn, G.R.; Kim, S.H.; Lee, B.Y.; Chung, W.-J. Colorimetric allergenic fungal spore detection using peptide-modified gold nanoparticles. Sensors and Actuators B: Chemical 2021, 327, 128894. [Google Scholar] [CrossRef]
- Clack, K.; Sallam, M.; Muyldermans, S.; Sambasivam, P.T.; Nguyen, C.M.; Nguyen, N.T. Instant Candida albicans Detection Using Ultra-Stable Aptamer Conjugated Gold Nanoparticles. Micromachines 2024. [Google Scholar] [CrossRef] [PubMed]
- Owen, D.H.; Katz, D.F. A vaginal fluid simulant. Contraception 1999, 59, 91–95. [Google Scholar] [CrossRef]
- Moosa Mahomed-Yunus, S.; Sobel Jack, D.; Elhalis, H.; Du, W.; Akins Robert, A. Fungicidal Activity of Fluconazole against Candida albicans in a Synthetic Vagina-Simulative Medium. Antimicrobial Agents and Chemotherapy 2004, 48, 161–167. [Google Scholar] [CrossRef]
- Baldewijns, S.; Sillen, M.; Palmans, I.; Vandecruys, P.; Van Dijck, P.; Demuyser, L. The Role of Fatty Acid Metabolites in Vaginal Health and Disease: Application to Candidiasis. Frontiers in Microbiology 2021, 12, 705779. [Google Scholar] [CrossRef] [PubMed]
- Gulati, M.; Lohse, M.B.; Ennis, C.L.; Gonzalez, R.E.; Perry, A.M.; Bapat, P.; Arevalo, A.V.; Rodriguez, D.L.; Nobile, C.J. In Vitro Culturing and Screening of Candida albicans Biofilms. Current Protocols in Microbiology 2018, 50, e60. [Google Scholar] [CrossRef]
- Ross, A.; Muñoz, M.; Rotstein, B.H.; Suuronen, E.J.; Alarcon, E.I. A low cost and open access system for rapid synthesis of large volumes of gold and silver nanoparticles. Scientific Reports 2021, 11, 5420. [Google Scholar] [CrossRef] [PubMed]
- Parolo, C.; Sena-Torralba, A.; Bergua, J.F.; Calucho, E.; Fuentes-Chust, C.; Hu, L.; Rivas, L.; Álvarez-Diduk, R.; Nguyen, E.P.; Cinti, S.; et al. Tutorial: design and fabrication of nanoparticle-based lateral-flow immunoassays. Nature Protocols 2020, 15, 3788–3816. [Google Scholar] [CrossRef] [PubMed]
- Park, J.S.; Kim, S.; Han, J.; Kim, J.H.; Park, K.S. Equipment-free, salt-mediated immobilization of nucleic acids for nucleic acid lateral flow assays. Sensors and Actuators B: Chemical 2022, 351, 130975. [Google Scholar] [CrossRef] [PubMed]
- Smiley, S.; Derosa, M.; Blais, B. Immobilization of DNA Aptamers on Polyester Cloth for Antigen Detection by Dot Blot Immunoenzymatic Assay (Aptablot). Journal of nucleic acids 2013, 2013, 936542. [Google Scholar] [CrossRef] [PubMed]
- Alizadeh, S.; Nazari, Z. A review on gold nanoparticles aggregation and its applications. J. Chem. Rev 2020, 2, 228–242. [Google Scholar]
Figure 1.
Schematic representation of the three-step wearable platform. a) indicates a negative test for c. albicans. In step 1) 100 μL of vaginal fluid solution is added to the sample pad. 2) 5 μL of nanoparticle gel solution is added, as well as 45 μL of running buffer solution. A negative result is indicated in 3) showing a “pink/red” color due to the non-aggregation of the aptamer-conjugated gold nanoparticles. b) indicates a positive test for c. albicans. In step 1) 100 μL of vaginal fluid solution containing c. albicans fungal cells is added to the sample pad. 2) 5 μL of nanoparticle gel solution is added, as well as 45 μL of running buffer solution. A positive result is indicated in 3) showing a “purple/ dark blue” color due to the specific target-induced aggregation of the aptamer-conjugated gold nanoparticles. The scheme is illustrated and reproduced with permission from BioRender.
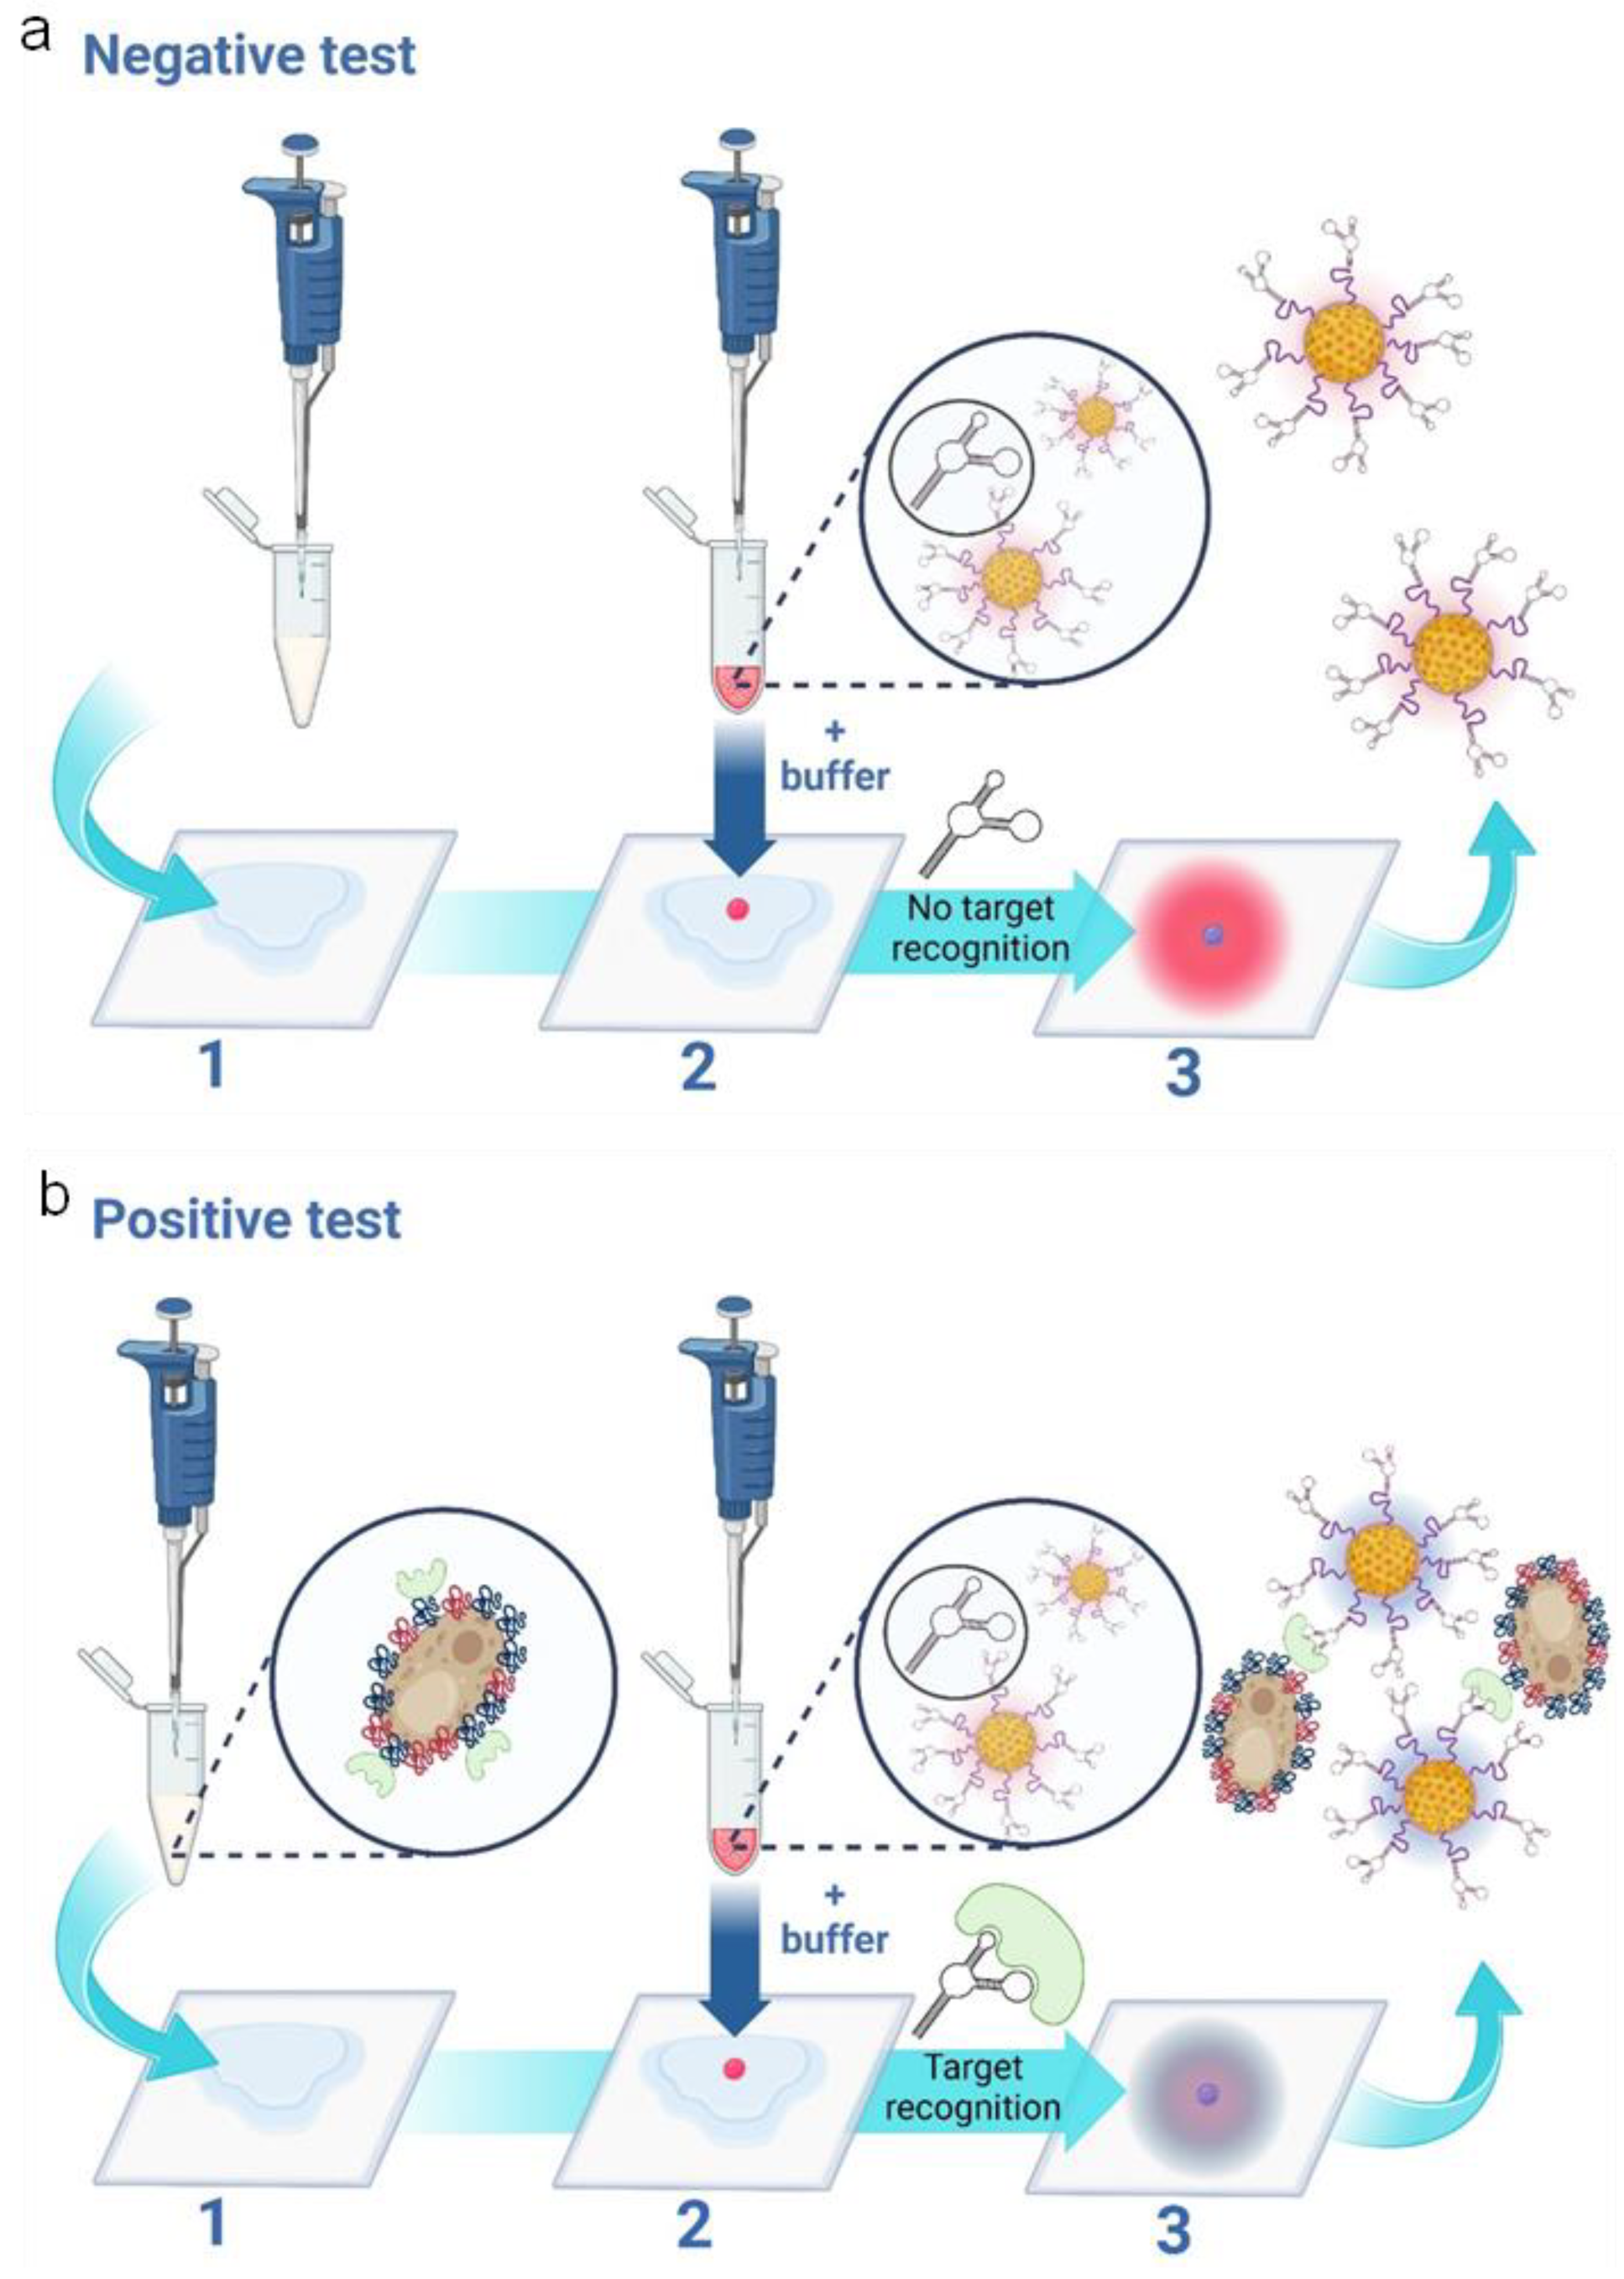
Figure 2.
A solution of gold nanoparticles prior to centrifugation and prior to combination with the agarose gel a) and b) 5 μL of nanoparticle gel solution is dispensed onto the substrate containing 100 μL of previously soaked vaginal fluid simulant solution, prior to running buffer addition. Prior to the running buffer, the nanoparticles remain confined to the gel matrix and do not disperse across the substrate.
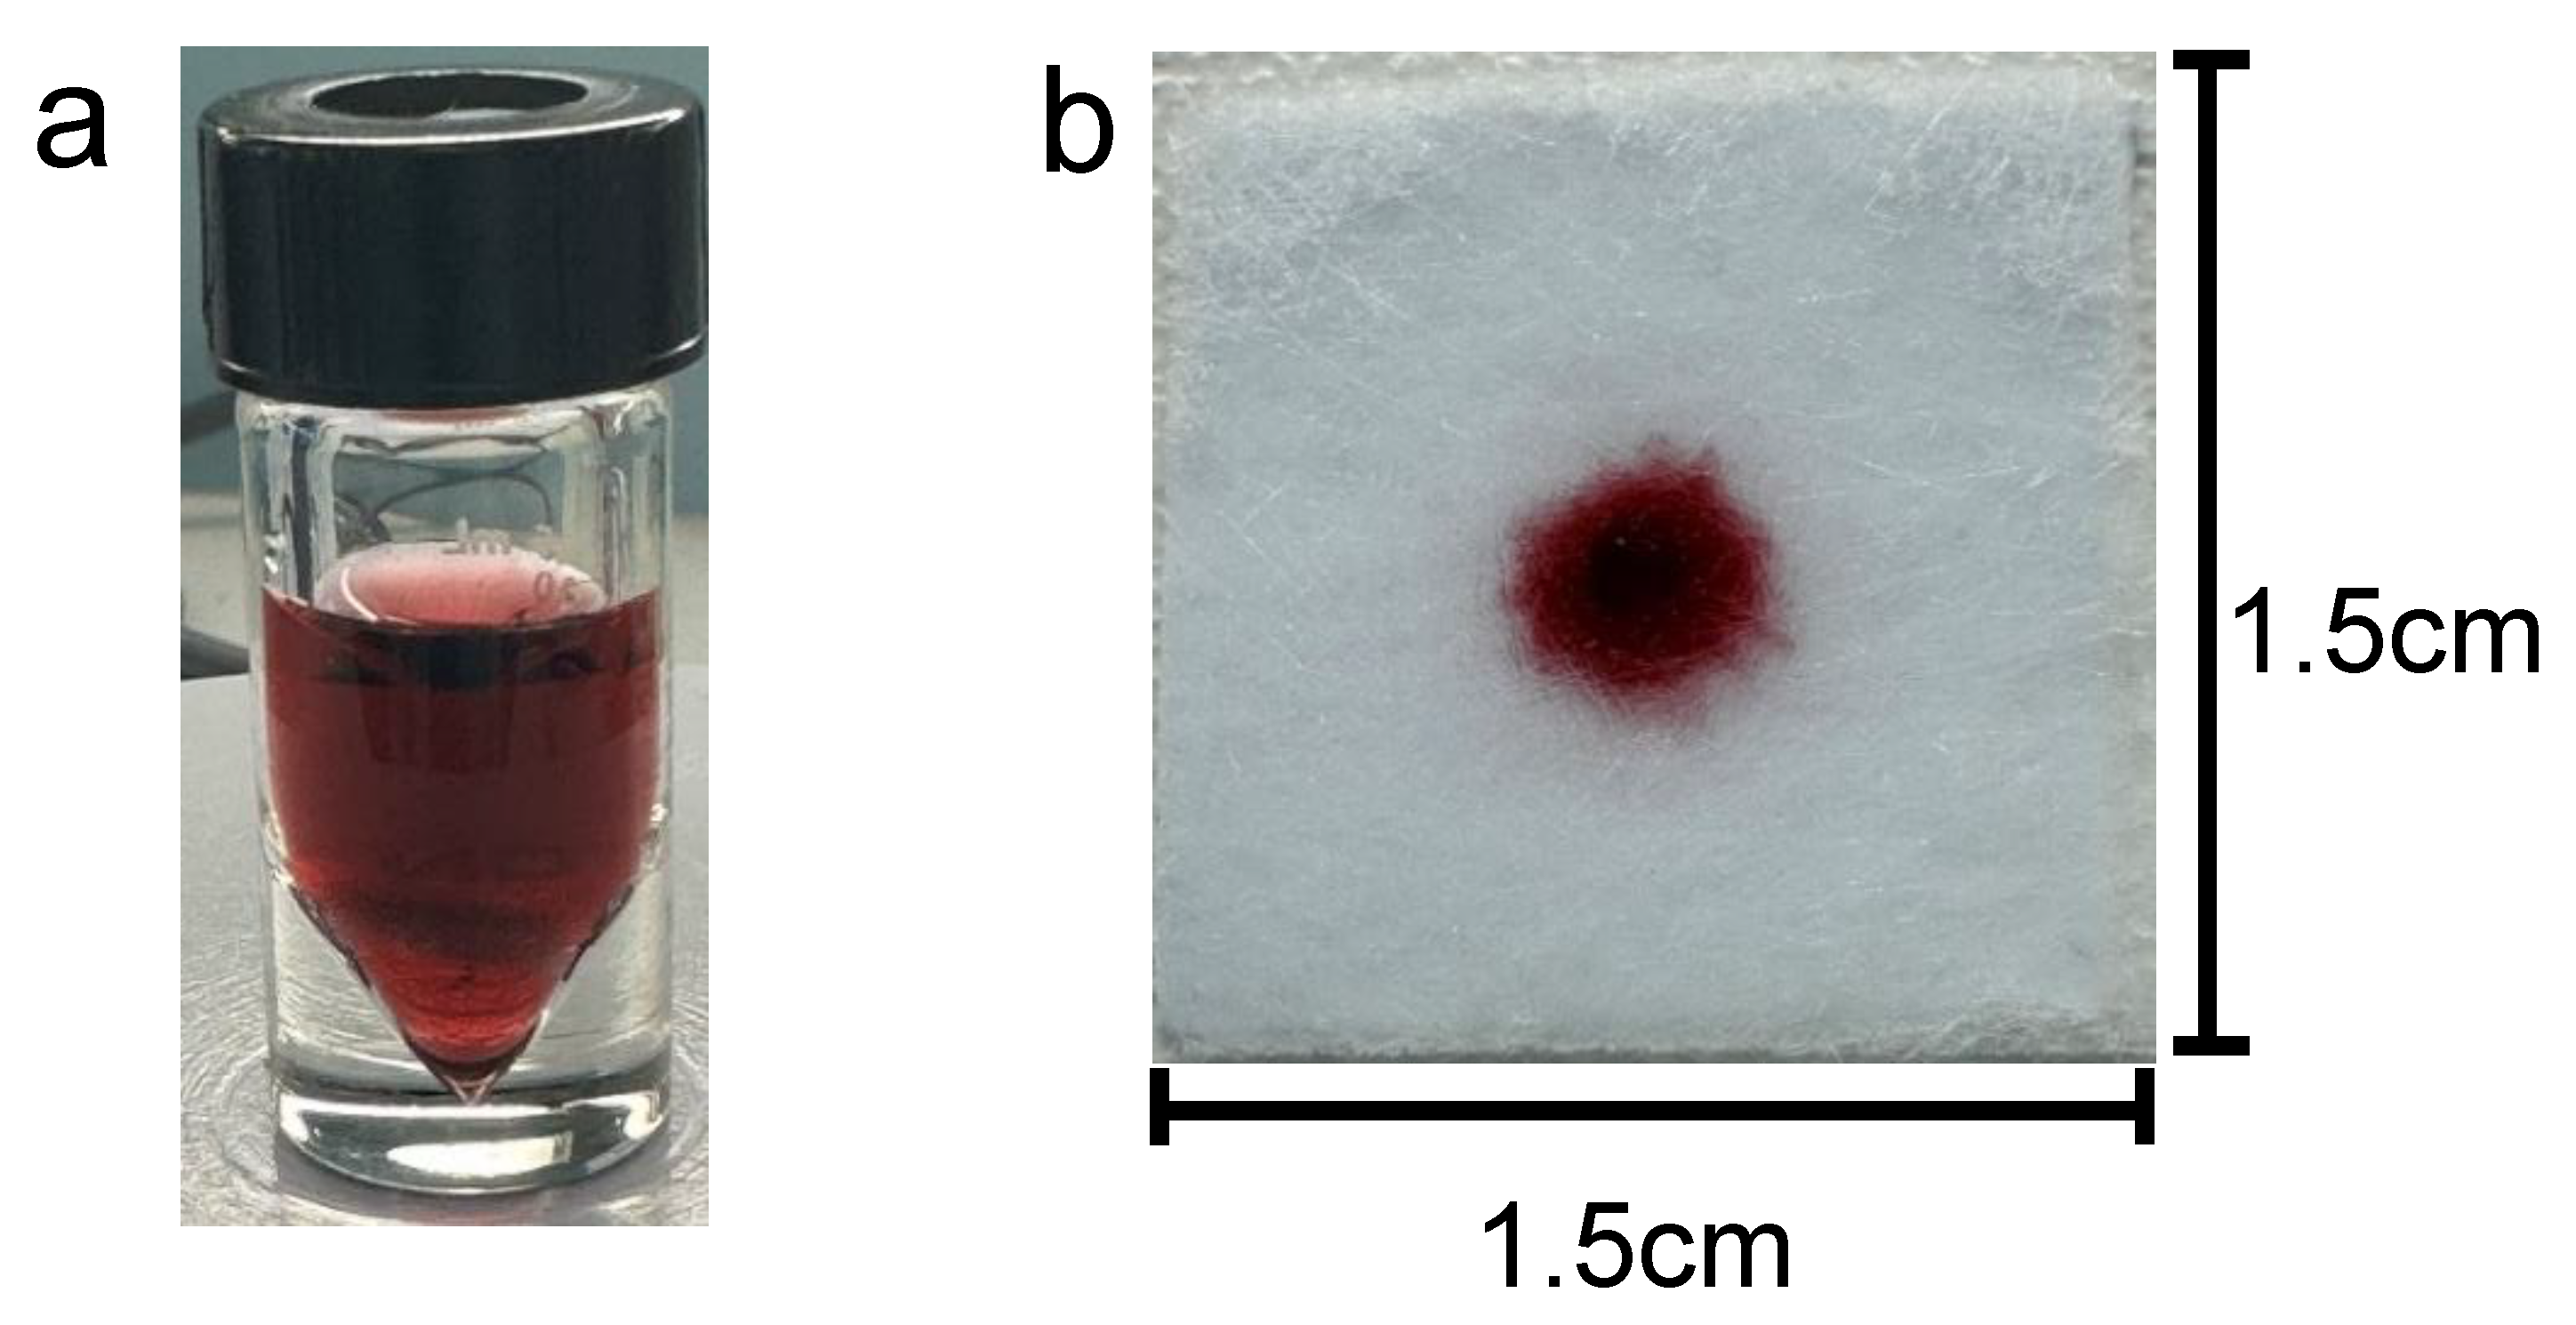
Figure 3.
Colorimetric results of buffer testing a). Positive tests for each buffer are shown on top, and negative tests are shown on the bottom. From left to right, the buffers include: SDS (i); Sodium borate/ sucrose/ NaCl/ Tween/ Sodium azide ii); Tris-HCl/ MgCl2/ NaCl and ethanol iii); Sodium borate/ KCl/ Tween (the buffer chosen for subsequent experimentation) (iv); Phosphate buffer v); Tris-HCL vi) and HEPES vii). Only buffers iv), v) and vii) showed a naked-eye distinction between positive and negative samples. The remaining buffers did not show an easily perceptible distinction between positive and negative results based on subjective naked-eye interpretation. Red channel brightness intensity for positive and negative samples after image processing are shown b). Difference between red channel brightness intensity for positive and negative results, for each of the tested buffers. c) shows that buffer iv gives the best naked-eye detectable distinction between positive and negative samples.
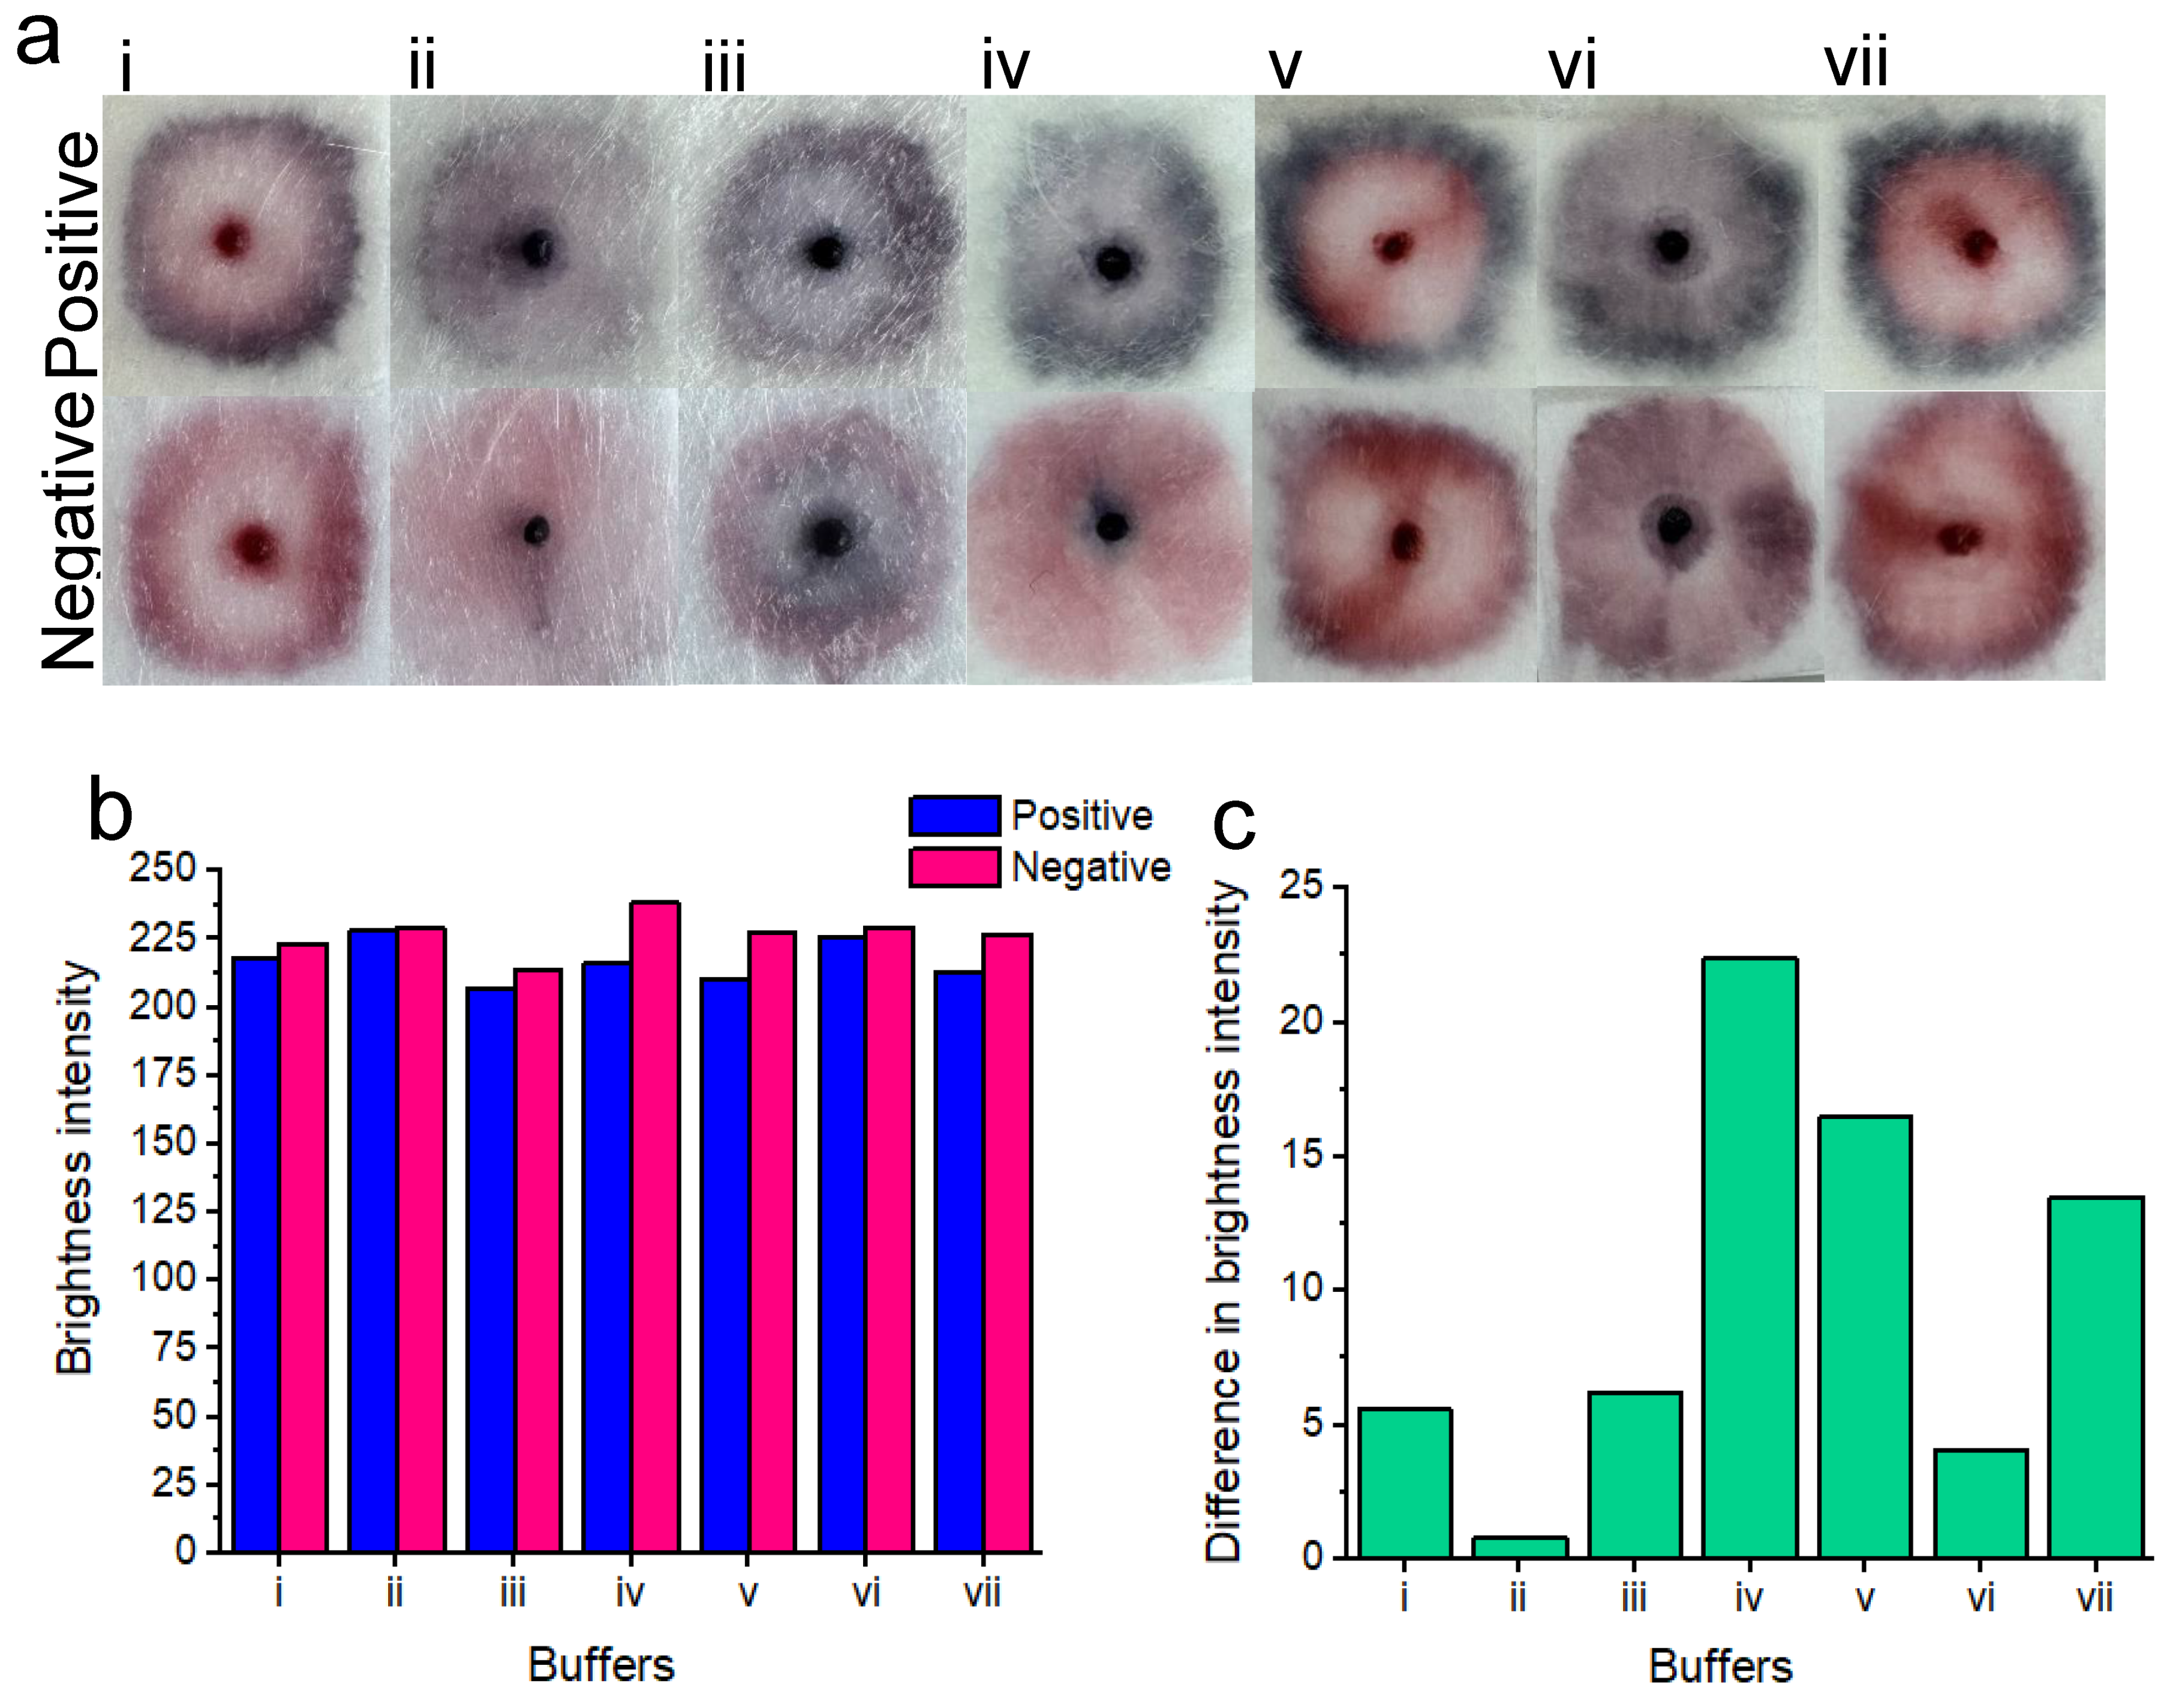
Figure 4.
Results of colorimetric naked-eye substrate testing a). Positive results (top) are compared to negative results (bottom) for each of the substrates. Gauze i) shows no clear distinction between positive and negative samples. Cellulose fiber ii), sanitary pad iii) and chromatography paper iv) positive and negative results are also indistinguishable. Glass fiber v) shows the best distinction between positive (blue) and negative (pink) results. b) Image processing for red channel brightness intensity for positive and negative samples, for each of the substrates is shown. c) The difference in red channel brightness intensity between positive and negative samples, for each of the substrates is shown. Notably, the glass fiber substrate v) showed the best distinction between positive and negative results due to the highest difference in the red channel brightness intensity level.
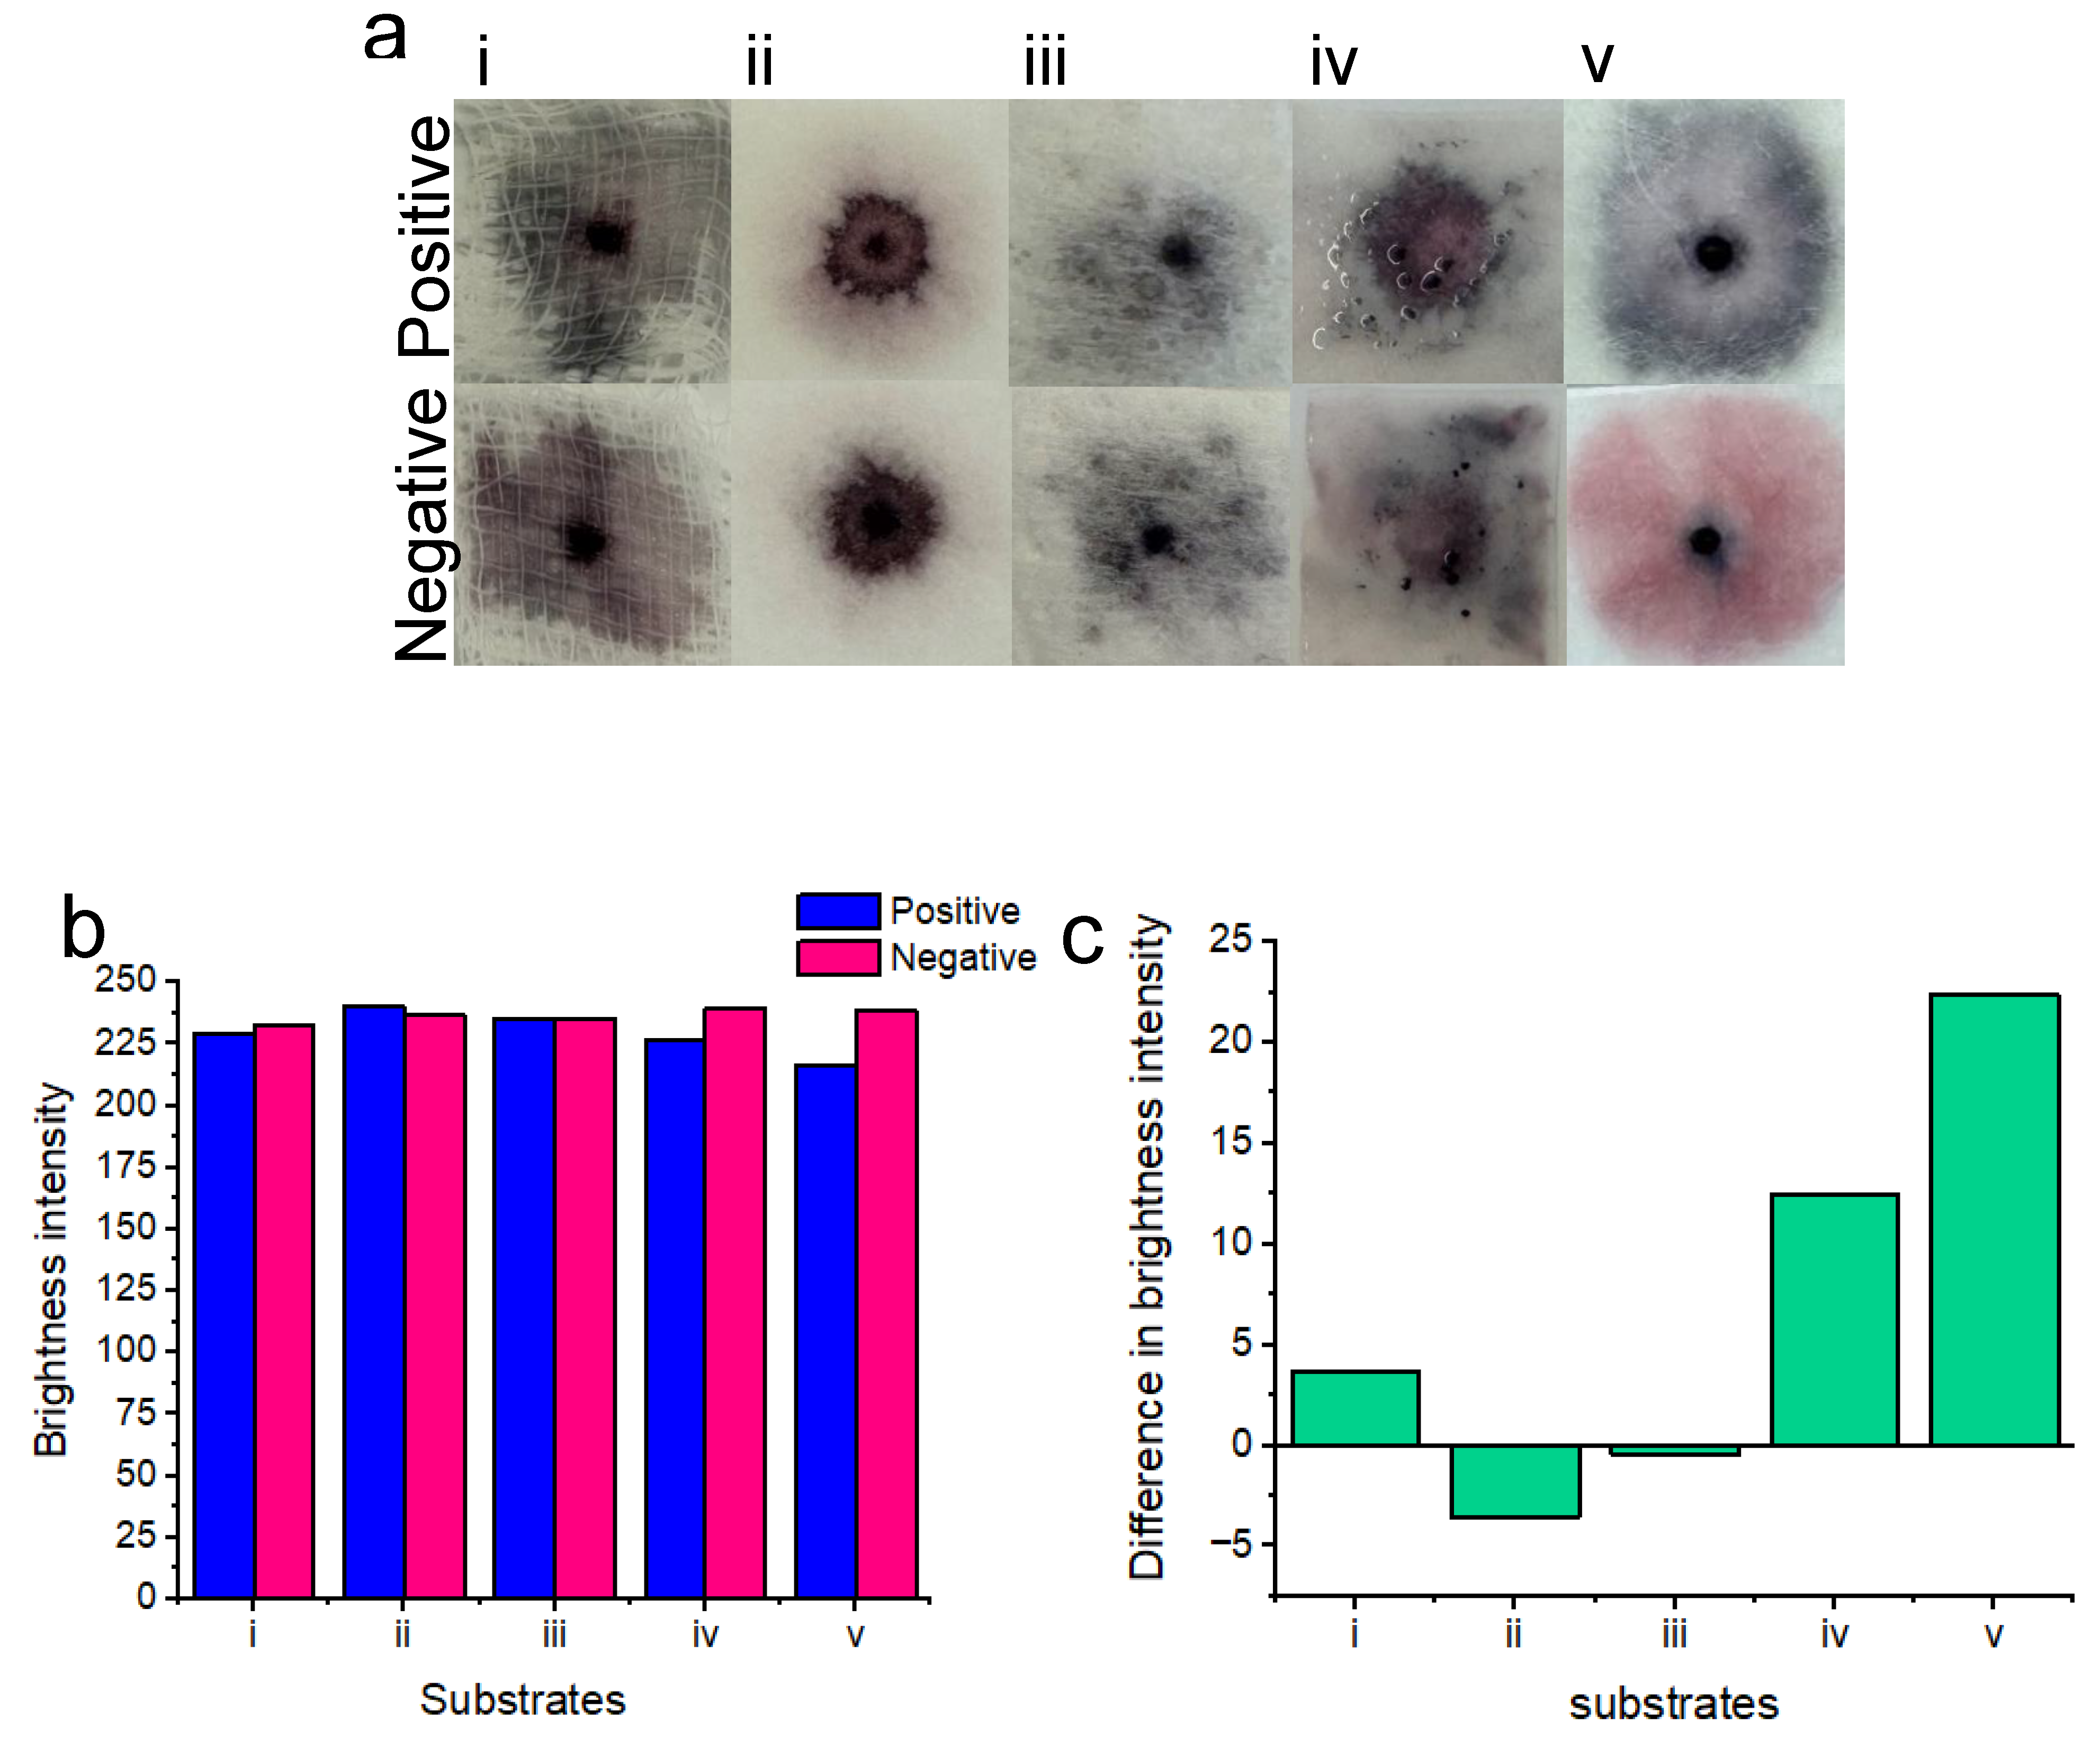
Figure 5.
Colorimetric naked-eye results indicate positive tests for five concentrations (7.0×10⁷ i), 3.5×10⁷ ii), 1.8×10⁷ iii), 8.8×10⁶ iv) and 4.4×10⁶ v) cells per ml) of serially diluted candida albicans cells that are spiked into vaginal fluid simulant solution a). Positive “blue” results are compared to the “pink” blank solution vi). As the concentration of candida albicans cells increases, as does nanoparticle aggregation and therefore, the sample pads turn increasingly “blue”. Three replicates (1, 2 and 3) show similar results across the respective concentrations, indicating assay reproducibility. All tests are shown after 20 minutes of development time after adding the running buffer. b) shows image processing results based on red channel brightness intensity for three individual replicates (with error bars) each containing five tested concentrations of candida albicans cells (from a) in reference to the blank “pink” solution vi). The difference in red channel brightness intensity between each of the tested concentrations compared to the blank sample is shown in c). Notably, the highest concentration of candida albicans cells i) differed the most from the blank solution in terms of red channel brightness intensity. As the concentration of candida albicans cells decreased, so did the difference in red channel brightness intensity for each of the samples compared to the blank sample.
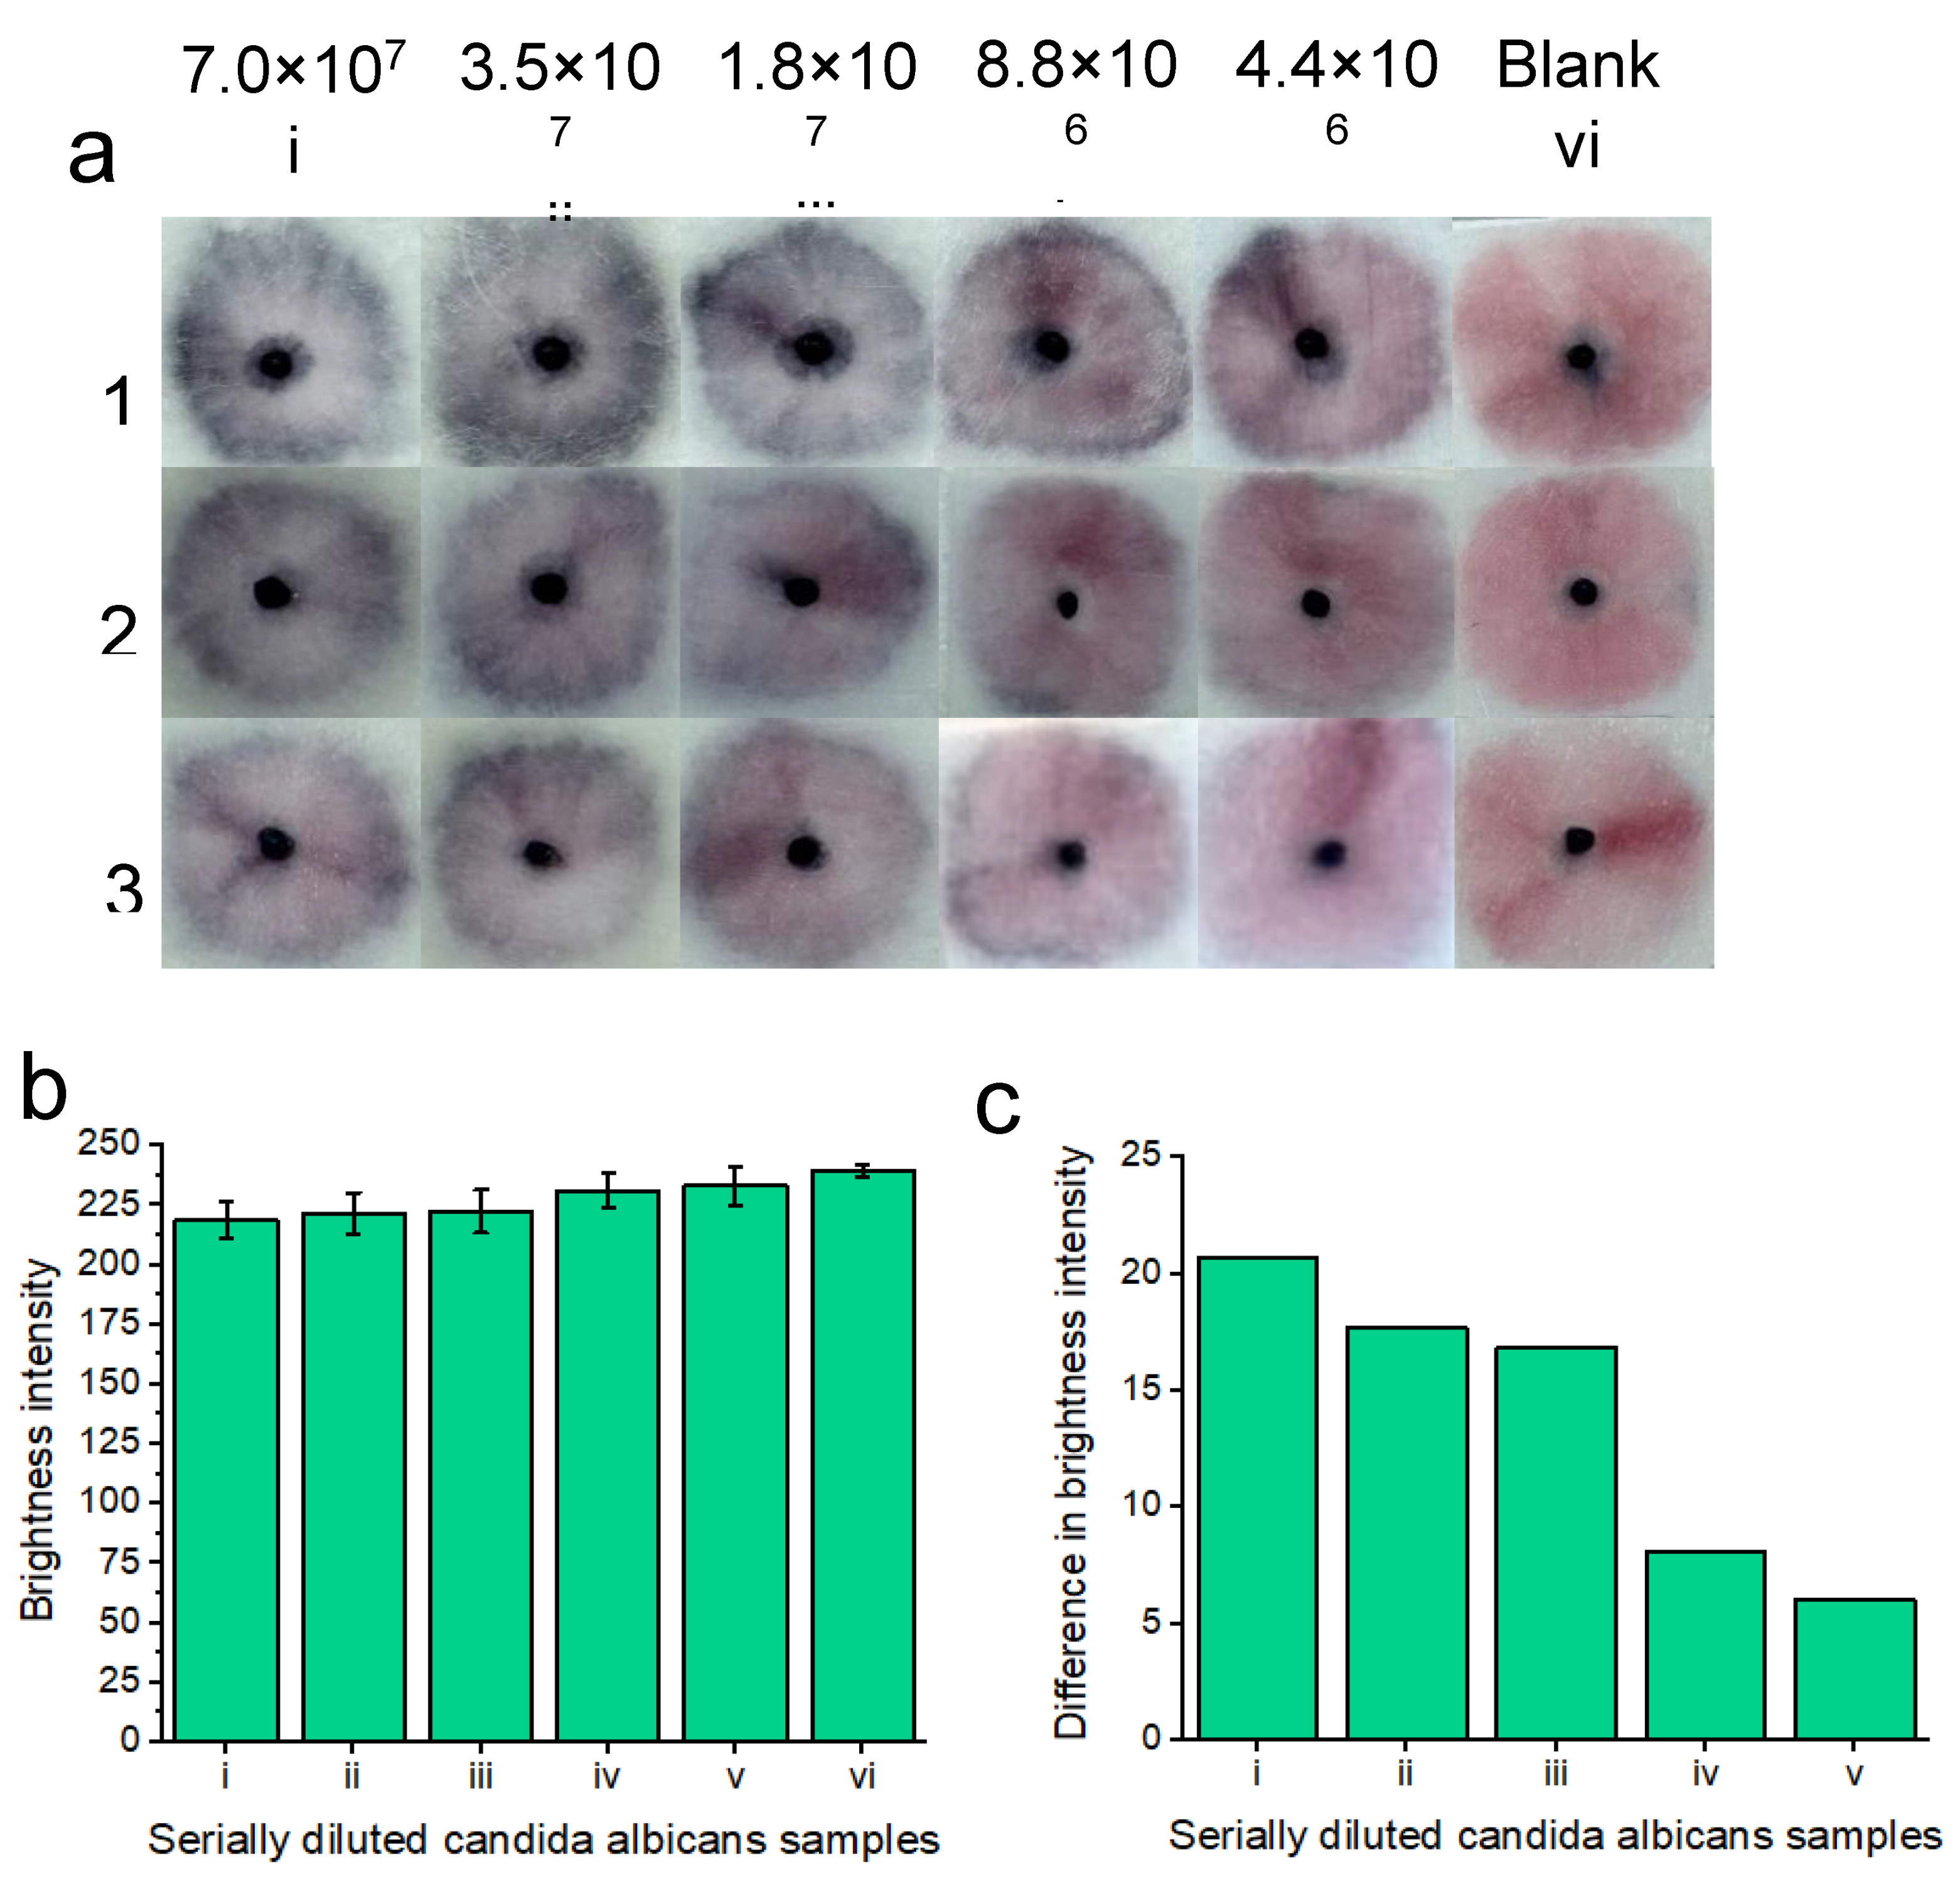
Figure 6.
Colorimetric naked-eye results are shown to demonstrate platform specificity a) Positive “blue” results are compared to negative “pink” results consisting of Botrytis, starch, dextran and blank tests. Three individual replicates (1, 2 and 3) are shown for each test. b) shows image processing results based on red channel brightness intensity for three individual replicates (with error bars) for each of the tested samples. The difference in red channel brightness intensity between each of the tested samples compared to the blank sample is shown in c). Notably, the positive tests show the greatest difference in red channel brightness intensity from the blank solution when compared to botrytis, dextran and starch.
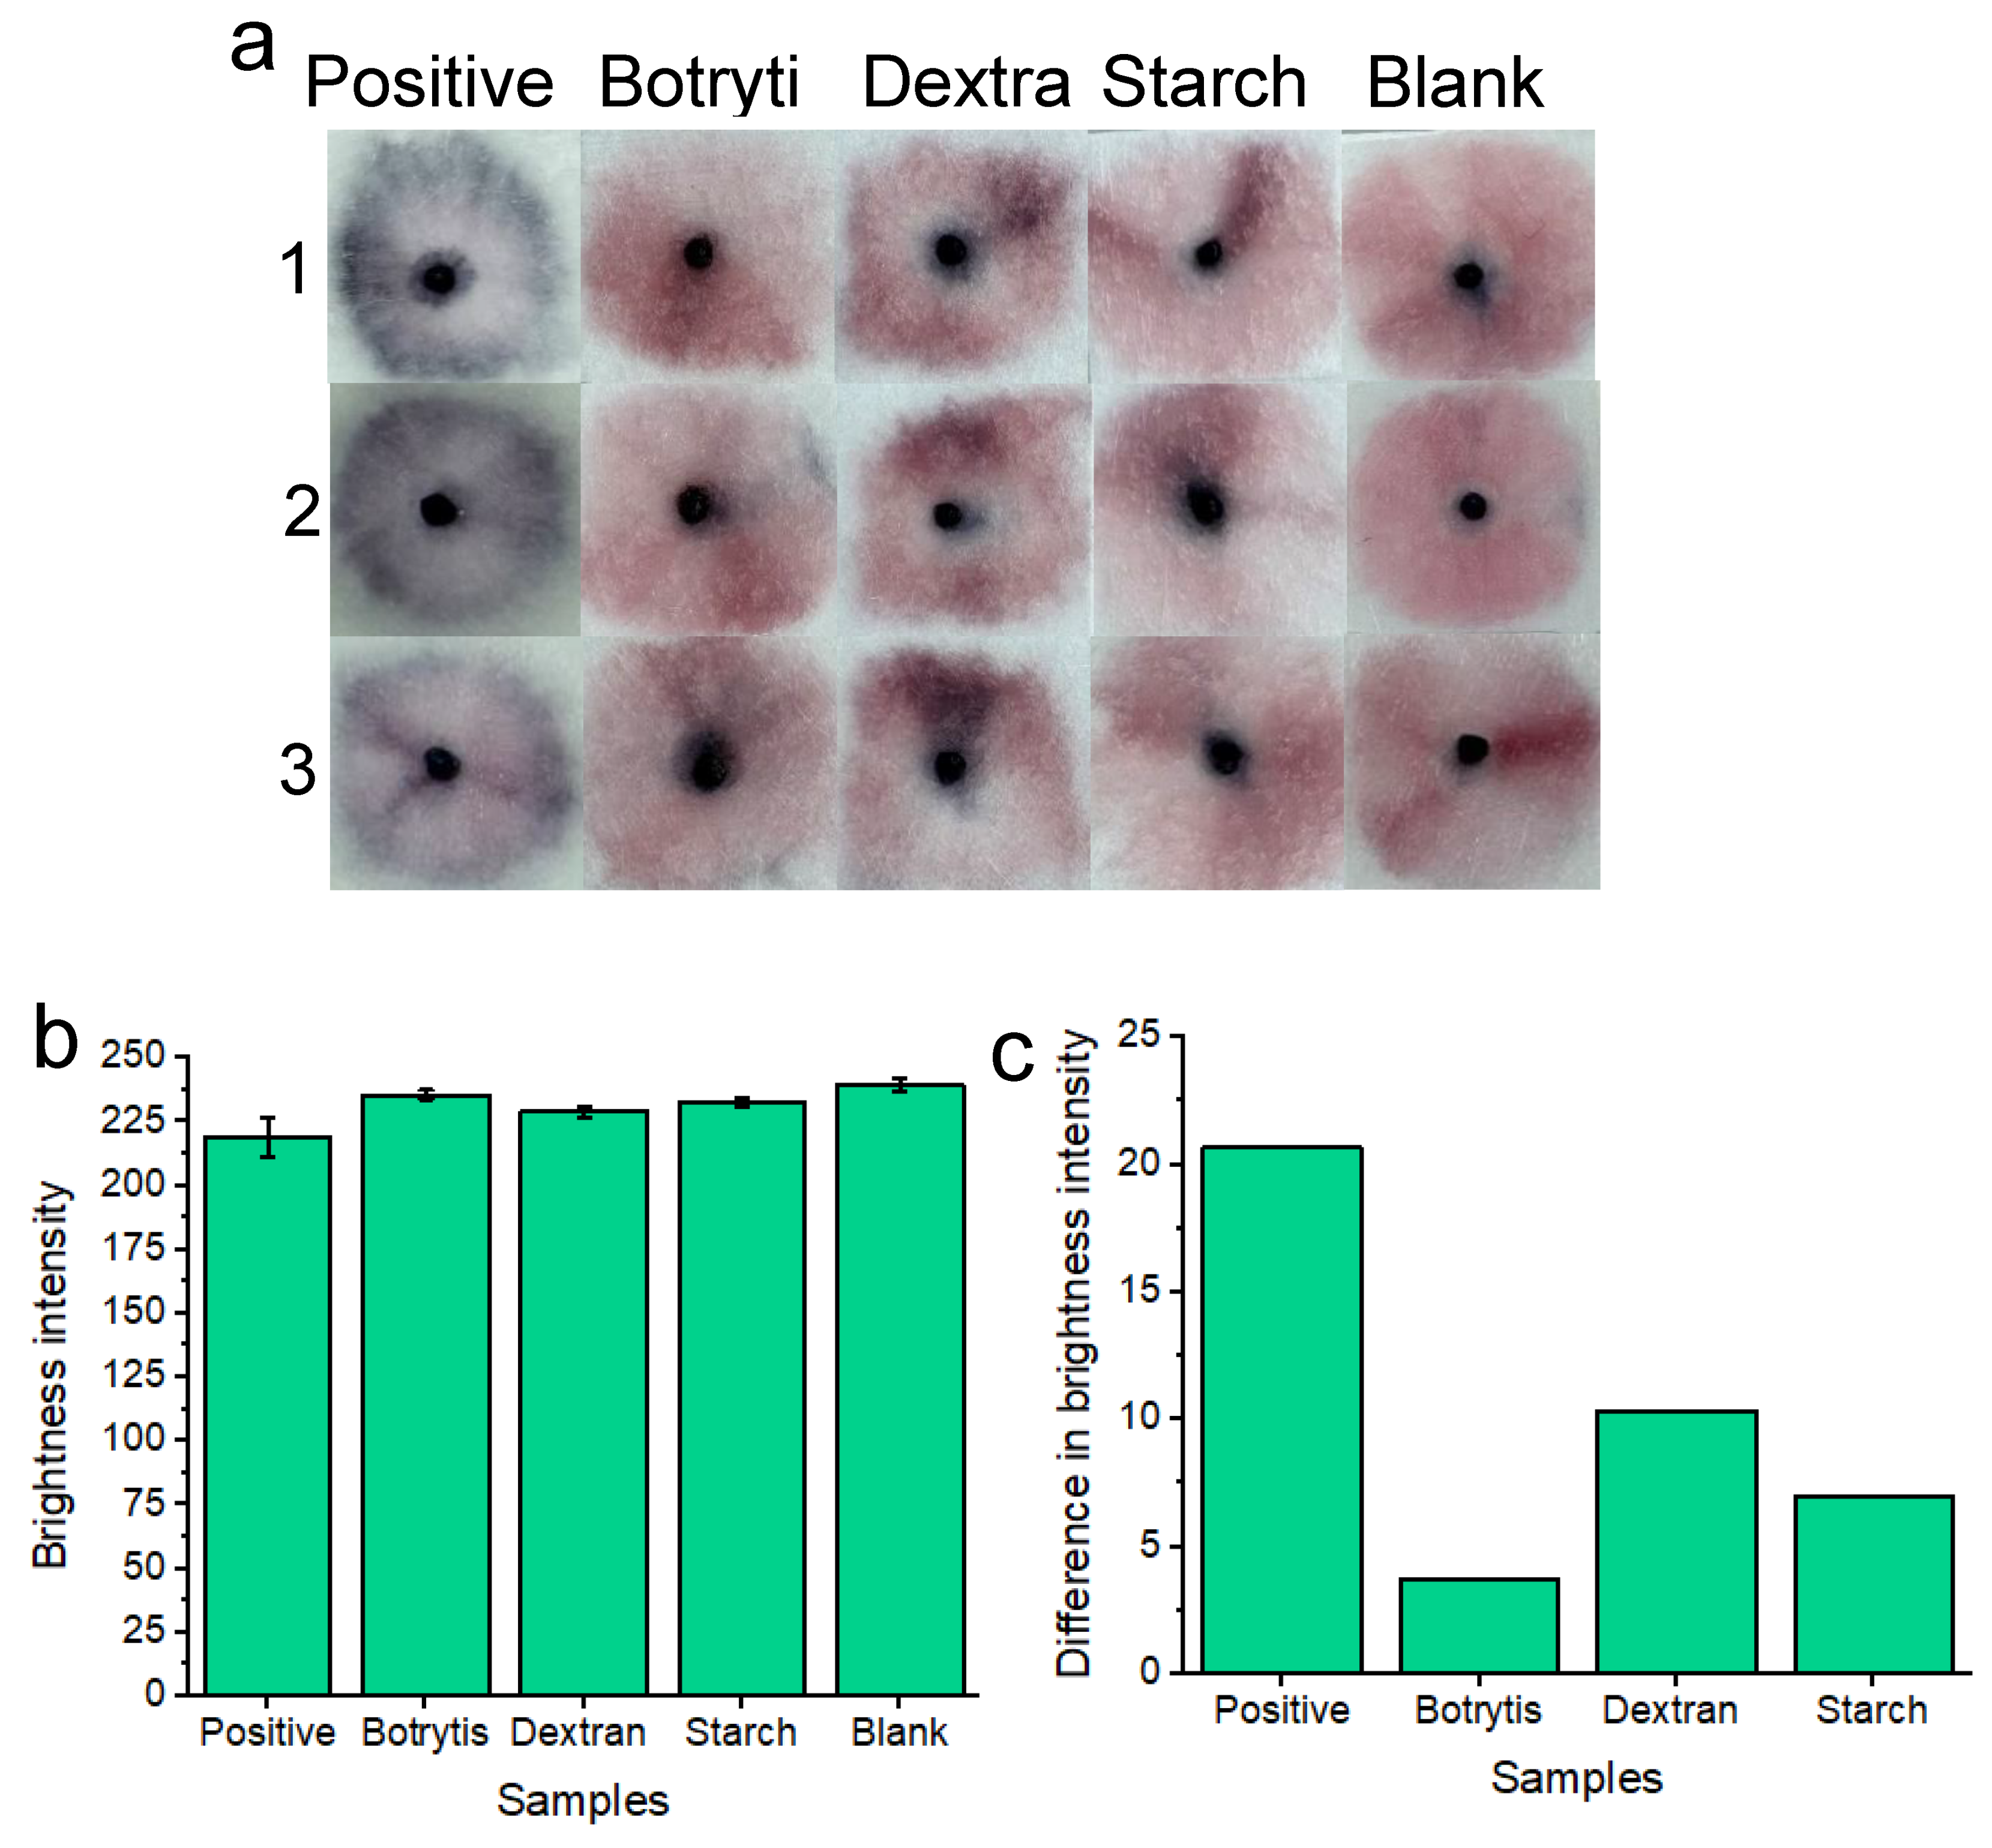
Figure 7.
Colorimetric naked-eye results are shown to demonstrate platform ability to test for candida albicans from both wet and dry samples of vaginal fluid a). Three individual replicates are shown for each test. Dry positive tests are visually distinct from dry blank tests much like the distinction between positive and negative tests of the wet samples. b) shows image processing results based on red channel brightness intensity for three individual replicates (with error bars) for each of the tested samples. The difference in red channel brightness intensity for both the dry and wet positive samples is illustrated compared to the respective blank samples of each testing (wet or dry) condition. Testing under wet sample conditions gives the best distinction between positive and negative samples, however, a distinction between positive and negative samples can still be made when testing dry samples.
Disclaimer/Publisher’s Note: The statements, opinions and data contained in all publications are solely those of the individual author(s) and contributor(s) and not of MDPI and/or the editor(s). MDPI and/or the editor(s) disclaim responsibility for any injury to people or property resulting from any ideas, methods, instructions or products referred to in the content. |
© 2024 by the authors. Licensee MDPI, Basel, Switzerland. This article is an open access article distributed under the terms and conditions of the Creative Commons Attribution (CC BY) license (http://creativecommons.org/licenses/by/4.0/).
Copyright: This open access article is published under a Creative Commons CC BY 4.0 license, which permit the free download, distribution, and reuse, provided that the author and preprint are cited in any reuse.


