Submitted:
29 May 2024
Posted:
30 May 2024
You are already at the latest version
Abstract
Evaluation of drug permeability using cell monolayers is an important in vitro assay in the process of drug development, to identify compounds with favourable pharmacokinetics that may proceed to in vivo studies. When allowed to differentiate on permeable filters for at least 21 days, monolayers of Caco-2 cells develop morphological and functional properties similar to those of the intestinal epithelium. Permeability through Caco-2 monolayers is thus particularly relevant to assess drug absorption after oral administration. The major drawback of this assay is its very low throughput, with the cell monolayers being used in a single permeability assay. We have previously proposed a protocol to allow the re-use of the Caco-2 monolayer on additional permeability assays during the stable period and shown that cell monolayer integrity is maintained. In this work we evaluate the effect of re-use on the permeability of several reference compounds that permeate through passive pathways and show that the cell monolayers can be re-used twice in additional permeability assays. Preliminary results were also obtained regarding active transport pathways, and a new methodology is proposed to quantify the contribution from passive and active transport. This is a major step towards the full validation of the re-use methodology proposed, which at least triplicates the throughput of this important in vitro assay.
Keywords:
Permeability assay
; pharmacokinetics
; Caco-2 monolayers
; re-use
; high throughput
; passive diffusion
; active transport
1. Introduction
The prediction of pharmacokinetics is a major step in drug development as it determines drug availability at the target site. In the assessment of this property, the well-established Caco-2 model is one of the most extensively used in vitro cell based assay, before proceeding to studies using animal models [1,2,3,4]. A major limitation of this model is its low throughput. When following the standard procedure, Caco-2 cells must be maintained in a permeable filter for at least 21 days to attain a confluent and fully differentiated cell monolayer, and are used in a single permeability assay during their stable period, days 21 to 30 [5,6]. Moreover, this assay has a reduced screening capacity (12 wells per plate) and high implementation costs (media renewals, TranswellTM inserts, and human resources) that also contributes to its low throughput [7,8].
To keep up with the growing number of compounds to be analysed (drugs and other bioactive compounds such as natural products), different modifications of the standard assay have been explored over the past two decades. The most common methodologies involve alterations of the culture medium [9,10], filter support and/or coating [11] to reduce the time required for cell monolayer confluence and differentiation; using of 96 and 384 multi-wells plates [12,13]; and testing of multiple compounds simultaneously [14,15]. Although faster, those alternative protocols show several drawbacks, and the standard assay is still the most frequently used (see Pires et al [16] for a detailed literature revision).
An alternative approach to increase the throughput of the standard assay is to re-use the Caco-2 monolayer in additional permeability assays during its stable period. This has been explored by us recently [16], and it was shown that incubation of the cell monolayer in culture medium for two full days after the permeability assay is required and sufficient for the re-establishment of cell monolayer integrity. This would allow the use of the cell monolayers for at least three permeability assays during the period where their morphological and functional characteristics are maintained (21 to 30 days after cell seeding [6,17]). An important advantage of this approach is that the standard protocol is followed for the preparation of the cell monolayer [5], thus allowing a quantitative comparison of the permeability coefficients obtained with the extensive data available in literature. More than just a need to increase throughput, the re-use of Caco-2 monolayers is also an obligation to reduce resources, fully aligned with the 3 R´s principles. However, before this procedure may become an established methodology, it is first necessary to guarantee that the preservation of the cell monolayer integrity is accompanied by the maintenance of other functional properties of the Caco-2 monolayers.
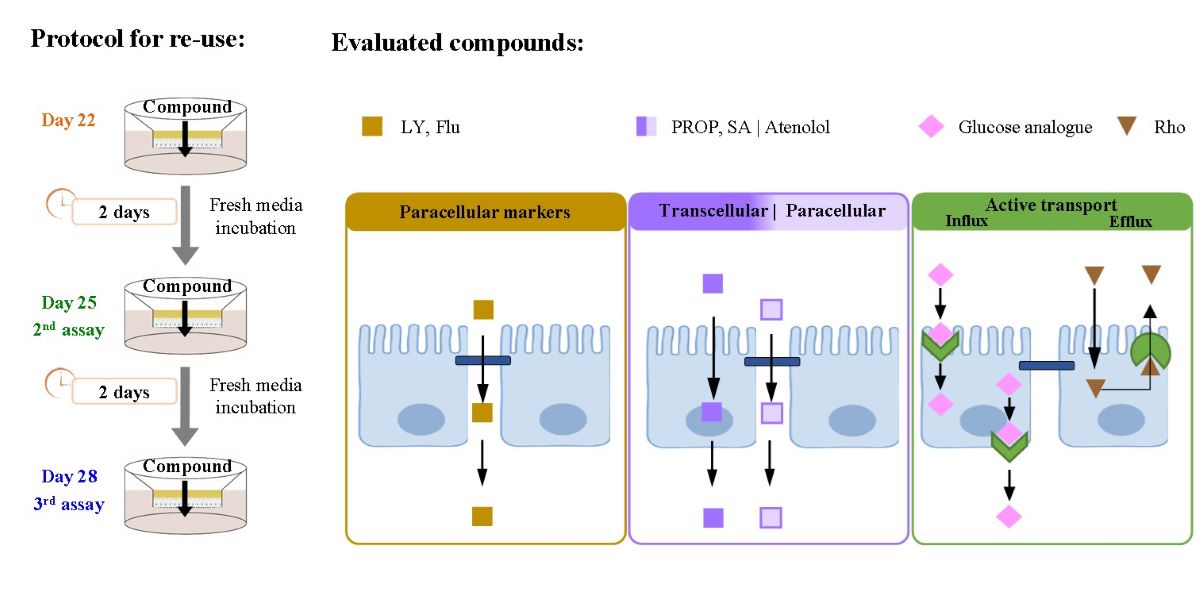
In this work, we complement the previous evaluation regarding cell monolayer integrity [16], with an extensive evaluation of the effects of the re-use protocol on distinct cell properties. The permeability of several compounds that are transported passively through paracellular and transcellular pathways have been characterized, and preliminary results have been obtained for carrier-mediated transport (influx and efflux).
The permeability of the test compounds was characterized on days 22, 25 and 28 post-seeding, both for cell monolayers used in a single permeability assay or re-used following the regeneration protocol proposed. The selected reference compounds for passive permeation pathways include: (1) sodium fluorescein and atenolol, to complement the results previously obtained with the paracellular marker Lucifer Yellow; and (2) the positively and negatively charged drugs propranolol and salicylic acid, to assess the effects on transcellular permeation. Carrier-mediated transport pathways were also evaluated, noting the presence of several transporters in the apical and basolateral membranes of Caco-2 monolayers that may contribute to the influx (uptake) or efflux of solutes [18,19]. Among the influx carriers, we selected the hexoses trans-porters due to the existence of glucose analogues with a fluorescence label that may allow the evaluation of the glucose permeation in a high throughput manner. The analogue of D-glucose 2-[N-(7-nitrobenz-2-oxa-1,3-diazol-4-yl) amino]-2-deoxy-D-glucose (2-NBDG) has been increasingly used in several cell lines to study glucose absorption and to evaluate the effect of bioactive compounds from plant extracts on glucose absorption [20,21]. It has been suggested that the transport of 2-NBDG across the apical membrane of Caco-2 monolayers occurs mainly through the sodium dependent glucose transporter (SGLT1) and the glucose transporters (GLUTs), similarly to D-glucose transport [22,23]. Caco-2 permeability assays are often used to identify the involvement of carrier-mediated efflux, in particular by P-glycoprotein (P-gp) which is a member of the ATP Binding Cassette (ABC) active transporter family [24]. The P-gp mediated efflux of Rhodamine 123 was selected due to its high fluorescence quantum yield, providing high sensitivity in the detection of P-gp transport activity in Caco-2 cells [25]. The analysis of cell monolayers functional properties was performed by measuring the transport of 2-NBDG and Rhodamine 123 in the apical-to-basolateral (A-to-B) and basolateral-to-apical (B-to-A) directions. Additionally, the expression of P-gp in the plasma membrane was also characterized through binding of a FITC-conjugated anti-P-gp antibody and detection by flow cytometry.
The structure and some molecular descriptors of the test compounds used in this initial validation study are shown in Table S1 (Supplementary Material). Over 300 permeability assays were performed through cell monolayers. The results obtained show that the re-use of cell monolayers can be implemented for the compounds following passive permeation route after application of the proposed regeneration protocol. Our study also provides preliminary results regarding the maintenance of the functional properties of transporters when the cell monolayers are re-used during their stable period. This allows to at least triplicate the throughput of the standard Caco-2 permeability assay.
2. Materials and Methods
2.1. Reagents and Materials
The Caco-2 cell line was purchased from the European Collection of Authenticated Cell Cultures (ECACC 09042001, Salisbury, UK). Cell culture medium and supplements were all purchased from Merck S.A (Algés, Portugal), except fetal bovine serum (FBS) that was obtained from Gibco-Life Technologies (Porto, Portugal). Corning® TranswellTM 12-well culture plates and polycarbonate membrane inserts (1.12 cm2 surface area, 0.4 µm pore size) were acquired from VWR (Lisboa, Portugal). Rhodamine123 and 2-NBDG were purchased from Setareh Biotech (Eugene, OR, USA). Ethylenediaminetetraacetic acid (EDTA), Hank’s balanced salt solution (HBSS), 4-2-hydroxyethyl-1-piperazineethanesulfonic acid (HEPES), lucifer yellow di-potassium salt (LY), (±)-propranolol hydrochloride (Prop), atenolol, sodium fluorescein (Flu) and salicylic acid (SA), were acquired from Merck S.A (Algés, Portugal). The FITC-conjugated mouse monoclonal antibody to human P-gp (CD243) was obtained from BD Pharmingen (San Diego, CA, USA). Ammonium formate (≥99%) and methanol HPLC-grade were from Fisher Scientific (Lisboa, Portugal).
2.2. Cell Culture and Seeding
Caco-2 cells, at passages 95–105, were grown in T75 cm2 flasks with Dulbecco’s modified Eagle’s medium (DMEM) high glucose (4.5 g/L glucose with 2 mM L-glutamine) supplemented with 1.5 g/L sodium bicarbonate, 10 %(v/v) heat-inactivated FBS and 1% (v/v) non-essential amino acids, in a humidified atmosphere and 5% CO2 at 37 °C. Once covering 80-90 % of the flask, usually after 3–4 days, the cells were detached using 0.25% (w/v) trypsin-EDTA and subcultured at a split ratio of 1:8. To prepare the Caco-2 monolayers, 2.6 × 10⁵ cells/cm2 were seeded on 12-well TranswellTM inserts and kept in culture with DMEM medium (containing 1% (v/v) penicillin (10,000 units/mL)–streptomycin (10 mg/mL)) for 21 days. Medium was renewed 6h following seeding and then every 2–3 days during culture [5,16].
2.3. Permeability Assays
On the days of the experiments, the culture medium was decanted, and the cell monolayers were washed twice with HBSS (supplemented by 25 mM HEPES, 0.35 g/L sodium bicarbonate, pH 7.4 and pre-warmed at 37 °C), 0.5 mL in the apical and 1.5 mL in the basolateral sides. During the 8 min incubation required for the washing steps, the plate containing the inserts was placed with the lid-covered in an incubator (previously aseptic) without CO2 at 37 °C with a plate orbital shaker (IKA-Schüttler MTS4, JMGS, Lisboa, Portugal) set at 50 rpm. The integrity of the cell monolayers was examined by measuring the transepithelial electrical resistance (TEER) values using a Millicell®ERS-2 voltmeter (Merck S.A, Algés, Portugal). The net TEER values (Ω cm2) were calculated by subtracting the cell-free filter resistance and multiplying by the filter area.
Test compounds solutions were prepared in HBSS and pre-warmed at 37 °C. The transport of LY (20 µM), Flu (20 µM), atenolol (25 µM, with 1 % (v/v) DMSO), Prop (25 µM) and SA (25 µM) was evaluated unidirectionally, in the apical (A) to basolateral (B) direction. Before initiating the experiments, 1.2 mL of HBSS at 37 °C was added to the wells of a 12-well plate (acceptor compartment). Then, the HBSS on the apical side of the monolayers was decanted and the inserts were placed into new wells containing HBSS. The permeability assays were started immediately with the addition of 450 µL of the compound’s solutions to the apical side (3-4 inserts were manipulated at the same time), from which a 50 µL sample was collected for the analysis of concentration at t0. The inserts were successively positioned in the pre-prepared 12-well plate containing HBSS, and the lid-covered plate was placed on the incubator (without CO2, 50 rpm and 37 °C). The permeability assays were performed with either a single sampling at t60 or multiple samplings at t10, t20, t30 and t60 min. At each sampling time, the plate was moved to the laminar flow hood for transfer of the inserts into new wells containing fresh HBSS (transfer sampling). At the end of the assays, the inserts were transferred into empty wells and 50 µL was taken from the apical solution.
To assess the functionality of active transporters in the Caco-2 monolayers, the transport of 2-NBDG (250 µM) and Rho (5 µM) was studied in both A→B and B→A directions. The A→B permeability assays were performed as described above, using sampling at t10, t20, t30 and t60 min for 2-NBDG and t20, t40, t60, t80, t100, and t120 for Rho. A longer sampling period was chosen for Rho to avoid the appearance of experimental lag times in the permeability data resulting from the need of Rho to translocate into the inner leaflet of the plasma membrane before interaction with P-gp [26,27]. Permeability in the B→A direction was evaluated at the same sampling intervals. Briefly, the solutions containing the compounds in HBSS at 37 °C (1250 µL) were added to the wells of a 12 well plate. The inserts were transferred into the plate, and the apical side of the cell monolayers was filled with 400 µL of pre-warmed HBSS. A 50 µL sample was immediately collected from the basolateral side (t0). The permeability assay was performed at 37 °C under agitation at 50 rpm. At the defined time points, aliquots of 200 µL were withdraw from the apical side and replaced with pre-warmed HBSS. At the end of the assays, the inserts were transferred into empty wells and 200 µL and 50 µL were taken from the apical and basolateral solutions, respectively.
After the permeability assay, the remaining solutions were decanted, pre-warmed HBSS (0.5 mL apical and 1.5 mL basolateral) was added to the cell monolayers, and their TEER values were measured.
2.4. Critical Steps and Experimental Procedure for the Re-Use of the Caco-2 Monolayers in Permeability Assays
The manipulations of the cell monolayers during the permeability assays, media renewals and solutions preparation were always carried out under aseptic conditions, in a laminar flow hood. The first permeability assay was performed for cell monolayer on day 22, and two additional assays were conducted using the same cell monolayer on days 25 and 28 post-seeding. At the end of the permeability assay, after washing the cell monolayer with HBSS and measuring their TEER value (see above), HBSS was replaced by DMEM culture medium (0.5 mL apical and 1.5 mL basolateral). The inserts were maintained during two full days in a humidified atmosphere and 5% CO2 at 37 °C, with the culture medium being changed 24 h before the next permeability assay. This incubation with DMEM between assays ensured the full recovery of the cell monolayer integrity as evaluated by TEER and permeation of the paracellular marker LY [16]. Several parameters were used as quality control of the monolayer´s integrity to rule out possible toxicity after incubation with compounds and contaminations before perform the 2nd and 3rd assays: i) the TEER values of the cell monolayers measured at the beginning of the next permeability were similar to those obtained before the first assay, and were always higher than 200 Ω cm2; ii) the TEER value of a cell-free filter (subject to the same treatment of those with cells) was maintained; and iii) the paracellular marker (such as LY) was included in some of the tested solutions to evaluate simultaneously the cell monolayer integrity and the permeability of the compounds of interest.
2.5. Analytical Methods for the Quantification of the Tested Compounds
The samples from the permeability assays were stored at −20 °C until analysis. The quantification of the reference compounds, except for Flu, was performed by reverse phase HPLC. The detailed conditions and method validation parameters are provided in the Supplementary Material (Table S2 and Figure S1). Data acquisition and integration of peak areas was done using the Chemstation software B.03.01 from Agilent (Lisboa, Portugal). The concentration of Flu in the samples was determined from its fluorescence intensity at λex/em 485/530 nm in a black 96-wells plate (Costar®), using the SpectraMax iD5 Multi-Mode Microplate Reader (Molecular Devices Corporation Sunnyvale, CA, USA). Before the measurements, the pH of the samples from the donor and acceptor compartments was adjusted to 8.5-9 for the full ionization of Flu phenolic group, increasing its fluorescence quantum yield [28].
2.6. Confocal Laser Scanning Microscopy and Image Analysis
In our previous evaluation of this re-use protocol, over 50 cell monolayers were visualized by confocal microscopy to evaluate for possible changes in cell monolayer integrity [16]. This included cell monolayers at different days post-seeding, both before and after the permeability assays, with cell monolayers used in a single permeability assay or re-used. In this work we have performed additional confocal characterizations only for the permeability assays using 2-NBDG, to evaluate for the localization of this glucose fluorescent analogue. First, the cell monolayers in the inserts were fixed with 4 % of paraformaldehyde for 10 min at room temperature. After washing 3 times with phosphate-buffered saline solution (PBS), the filter was cut, mounted on a glass slide, covered with Dako mounting medium and stored at 4 °C in the dark until analysis. Images were captured using a Zeiss LSM 710, Axio Observer inverted confocal microscope at 20× magnification. For each condition, an average of 12 z-stacks were acquired with a slice distance of 1 µm. The samples were excited at 458 nm and the emission was collected at 459–551 nm. Images post-processing and analysis was performed using ImageJ software (version 1.8, NIH, Bethesda, MD, USA). Orthogonal projections of the XZ-plane were created from all the z-slices to view in detail the localization of the fluorescence in the cell monolayers.
2.7. Flow Cytometry Analysis of P-gp Expression
Caco-2 monolayers at days 22, 25 and 28 post-seeding were prepared for analysis by flow cytometry, using both cell monolayers not used in permeability assays and re-used. In the later, the permeability assay has been performed with 5 µM Rho in the A→B direction, and the cell monolayers were previously washed and maintained on culture media for 2 full days. Three inserts per condition were used to obtain the number of cells necessary for the assay. Prior to use, the culture media was removed from the inserts and the cells monolayers were washed three times with HBSS (500 µL, 5 min each). The cells were detached with 250 µL of 0.25% (v/v) trypsin-EDTA solution for 5 min at 37 °C. Then, PBS with 5 % (v/v) FBS (250 µL) was added to inactivate the trypsin, the cell suspension was centrifuged (300 g/5 min) and resuspended in ice-cold PBS containing 5 % (v/v) FBS. The cells were passed through a 23-gauge syringe needle (BD Falcon) up to 3 times to disaggregate clumps and divided into two aliquots of 100 µL. The first was kept on ice until analysis by flow cytometry (control cells sample). The second was incubated with 20 µL of P-gp antibody FITC-conjugated for 30 min in the dark on ice. After this incubation period, both aliquots were centrifuged, resuspended in 200 µL of ice-cold PBS containing 5 % (v/v) FBS and measured on a BD Accuri™ C6 flow cytometer (BD Biosciences, San Jose, CA, USA) using λex=488 nm and a 530/30 nm band-pass filter for emission detection. The data collected for 3000 - 10,000 events was gated to include viable cells based on their forward (FSC) and side light scatters (SSC). Gating strategies were the same for all samples measured on the same day. Data was analysed by FlowJo software version 7.6.1 (Ashland, OR, USA) to obtain the median fluorescence intensity (MFI), which was the parameter used for comparison between samples and control cells.
2.8. Data Analysis
The apparent permeability coefficient (Papp) was determined according to Equation (1) and reported in cm/s [5,16]:
where is the amount of solute (mol) that accumulates in the acceptor compartment during the time interval Δt (in seconds), A is the surface area of the filter (1.12 cm2), VD is the volume of the donor compartment (cm3) and is the amount of solute in the donor compartment (mol) at the beginning of the time interval considered. When multiple sampling approach was used, was calculated from that in the beginning of the experiment by subtracting the solute that reached the acceptor compartment in the preceding sampling times. In the B→A permeability assays, was calculated considering the sample replacement at each time sampling, by applying a factor of , where VS and VA are the volumes of the sample taken, and the total volume of the acceptor compartments (cm3), respectively.
The apparent efflux or uptake ratio were calculated from the Papp obtained in both directions (A→B, and B→A) according to the usual procedure, Equation (2):
An alternative approach was followed that allows the quantification of the Papp from passive (), and active () processes. For the case of active efflux (, the observed permeability in both directions is given by Equation (3).
Rearranging Equation (3), and assuming that the values of and are the same in both directions, it is possible to calculate the permeability coefficient through both pathways, Equation (4):
This approach has the advantage that it allows evaluation of the effect of the tested condition on both the passive and active processes, not only on their relative contributions.
Experiments were carried out at least in duplicate (wells per plate for the same cell preparation) and were independently repeated at least two times with different cell preparations. The Papp values were statistically analysed in terms of LogPapp, since it was previously shown that this is the variable that follows a normal distribution [16], as was in fact expected [29]. The average values and the 95% confidence intervals (CI95) for Papp were calculated from the parameters of the statistical distribution of LogPapp, with CI95 calculated from the average () and standard deviation (), and the critical t value for the number of replicates used in the calculations, Equation (5):
3. Results
We have previously shown that cell monolayer integrity is maintained when Caco-2 monolayers are re-used in permeability assays on days 25 and 28 (after being used on day 22) and regenerated by incubation with culture medium between the assays. The maintenance of the monolayer integrity is the first requirement for the re-use of the cell monolayers. However, to validate the proposed protocol it is necessary to perform a systematic assessment regarding the effect of re-use on distinct properties of the Caco-2 monolayers. Towards this goal, in this study we evaluate the permeability of several reference compounds that are known to permeate passively or through active pathways (both influx and efflux). The solutes that permeate passively were divided in two sets, for low (mostly paracellular) and high (mostly transcellular) permeability coefficients. The structure and some molecular descriptors of the tested compounds are shown in Table S1 (Supplementary Material), and the results for their permeability through Caco-2 monolayers are shown in the next sections.
3.1. Effect of Re-Use on the Passive Permeation of Reference Compounds After Single Time and Multiple Time Sampling Permeability Assays
3.1.1. Low Passive Permeability – Lucifer Yellow, Sodium Fluorescein and Atenolol
The results previously obtained with the effect of the sampling time and re-use of the Caco-2 monolayer on the permeability of the paracellular marker Lucifer Yellow (LY) [16] were complemented with new data obtained in this study and are shown in Figure 1. The results are shown in terms of LogPapp, because it has previously shown that this is the variable that follows a Normal distribution [16], as is in fact expected for the case of rate constants [29]. The large variability in Papp at each condition reflects the intrinsic variability of the Caco-2 model, the results corresponding to more than 10 independent cell preparations at passages from 95 to 105, characterized over 4 years by the same operator and assay conditions. As previously reported [16], no significant variation is observed in the LY Papp with the day post-seeding when a single sampling time at 60 min is performed, both for cell monolayers used in a single permeability assay or re-used. However, a small decrease is observed in Papp with the increase in the sampling time. This effect was independent on cell monolayers being used a single time in permeability assays or re-used (dark or light colours, respectively). The effect of the sampling time was dependent on the day post-seeding, being less significant for cell monolayers on day 28 post-seeding (blue).
In spite of the small differences obtained for LY Papp from day 22 to 28 post-seeding and with the different sampling times, all conditions lead to permeability values compatible with a tight cell monolayer [5,16].
The results obtained with LY were complemented with sodium fluorescein (Flu), which is also commonly used to evaluate the cell monolayer integrity [30]. The properties of Flu are similar to those of LY, both being very polar and negatively charged at pH 7.4 [31] (Table S1). The results obtained for a single sampling at 60 min or with multiple time samplings within 60 min are shown in Figure 2A. The values obtained for Papp at days 22 and 25 post-seeding were very similar to those obtained for LY. Significant differences where however obtained on day 28, with Papp for Flu being statistically equivalent to that obtained at day 22 and 25, while it was lower for LY.
The drug Atenolol was used as another polar compound that is considered to permeate mostly through the paracellular pathway. The results obtained are shown in Figure 2B and are very similar to those obtained for Flu, except for a smaller effect of the sampling time interval. The detailed statistical analysis of Flu and Atenolol Papp values are provided in Supplementary Material (Table S3).
3.1.2. High Passive Permeability – Propranolol and Salicylic Acid
To further validate the re-use protocol, two reference compounds commonly used to characterize fast transcellular permeation were characterized [32]. Propranolol (Prop), which is positively charged at pH=7.4 (the most lipophilic member of the class of -blockers which also includes Atenolol); and salicylic acid (SA), which is negatively charged at pH=7.4, Table S1. The results obtained are shown in Figure 3 and the detailed statistical analysis is provided in Supplementary Material (Table S4). The first observation is that the results obtained for the re-used cell monolayers (light colours) are undistinguishable from those of cell monolayers used in a single permeability assay (dark colours). It is also observed that, as expected, the values obtained for Papp are significantly larger than those obtained for the solutes that permeate mostly though paracellular routes (Figure 1 and 2). The effect on Papp of the sampling time interval and day post-seeding is similar to that observed for Flu and Atenolol, and smaller than observed for LY.
3.2. Effect of Re-Use on the permeability of a Fluorescent Glucose Derivative (2-NBDG)
Glucose is a crucial cell nutrient, and Caco-2 cells have glucose transporters in their apical and basolateral membranes oriented to generate an absorptive flux of glucose. Glucose derivatives are commonly used to characterize glucose transport, providing sensitivity in the detection method and allowing an independent control of the glucose levels. The most commonly used glucose derivatives are radio- or fluorophore-labelled glucose [33], 2-NBDG being the most commonly used fluorescent analogue [34,35].
In the present study, we determined the bi-directional transport of 2-NBDG through Caco-2 monolayers that were used for a single permeability assay or re-used for additional assays, to evaluate if the functionality of glucose transporters remained unaltered after the re-use of the Caco-2 monolayers. The permeability assays were carried out in HBSS containing glucose at a concentration of 5.6 mM, which competes with 2-NBDG. In fact, based on the work of Yamada et al in mammalian cells, the up-take of 2-NBDG at a concentration of 600 µM was inhibited in almost 38 % when in the presence of 5.6 mM of D-glucose [34]. Thus, to allow competition with glucose for transport, a relatively high concentration of 2-NBDG (250 µM) was used. The paracellular marker LY was added to the 2-NBDG solution to simultaneously quantify the paracellular permeability. The permeability of 2-NBDG +LY was measured in the A→B and B→A directions, using multi-time sampling (10, 20, 30 and 60 min). The results of the cumulative amount of 2-NBDG that reaches the acceptor compartment in both directions are shown in Figure 4.
In contrast with the expectations, the amount of 2-NBDG that permeates in the A→B direction (absorptive pathways) is not higher than in the B→A direction. Also, the amount of glucose analogue that reaches the acceptor compartment is very small, leading to an average value of Papp ≅ 0.5×10⁻⁶ cm/s in both directions (Table S5 – Supplementary Material). This low permeability shows that 2-NBDG is not efficiently transported by the glucose carriers. Given the very high polarity of 2-NBDG (Table S1), it is anticipated that paracellular permeation is the most significant passive route. In fact, the Papp value of 2-NBDG was essentially the same as that of the paracellular marker LY.
In an attempt to understand the interaction of 2-NBDG with the Caco-2 monolayers, the cell monolayers were visualized by confocal fluorescence microscopy. Representative images obtained for the control (cell monolayers not used in permeability assays) and after the 60 min permeability assays with 2-NBDG in the A→B and B→A directions are displayed in Figure 5. Some autofluorescence diffused throughout the cells surface is observed in the control (panel A). Incubation with 2-NBDG leads to an increase in fluorescence, both for 2-NBDG added to the apical (panel B) and basolateral (panel C) compartments, the increase in fluorescence being mainly localized along the cell plasma membranes. These results show that 2-NBDG associated efficiently with the cell membranes (supposedly due to binding to the glucose transporters), but that it was not internalized. The recoveries obtained with those assays were always higher than 95% when considering only the donor and acceptor aqueous compartments, showing that only a small fraction of 2-NBDG is associated with the cell membrane.
3.3. Effect of Re-Use on the Permeability of Rhodamine 123 and P-Glycoprotein Expression
The effective transport of drug-like molecules through cell monolayers may be influenced by the presence of efflux transporters that actively counteract their accumulation in the cell membrane [36,37]. P-glycoprotein is the most studied efflux transporter [38,39,40], and a significant expression has been observed in the apical membrane of Caco-2 cells [18,23]. The expression level is dependent on the cell passage number, day after seeding on permeable inserts, and on pre-incubation with P-gp substrates [41,42,43]. It is therefore important to evaluate whether the re-use of Caco-2 monolayers influences P-gp expression and/or activity. This was evaluated through the characterization of Papp for the well-known P-gp substrate, rhodamine 123 (Rho) [25,44].
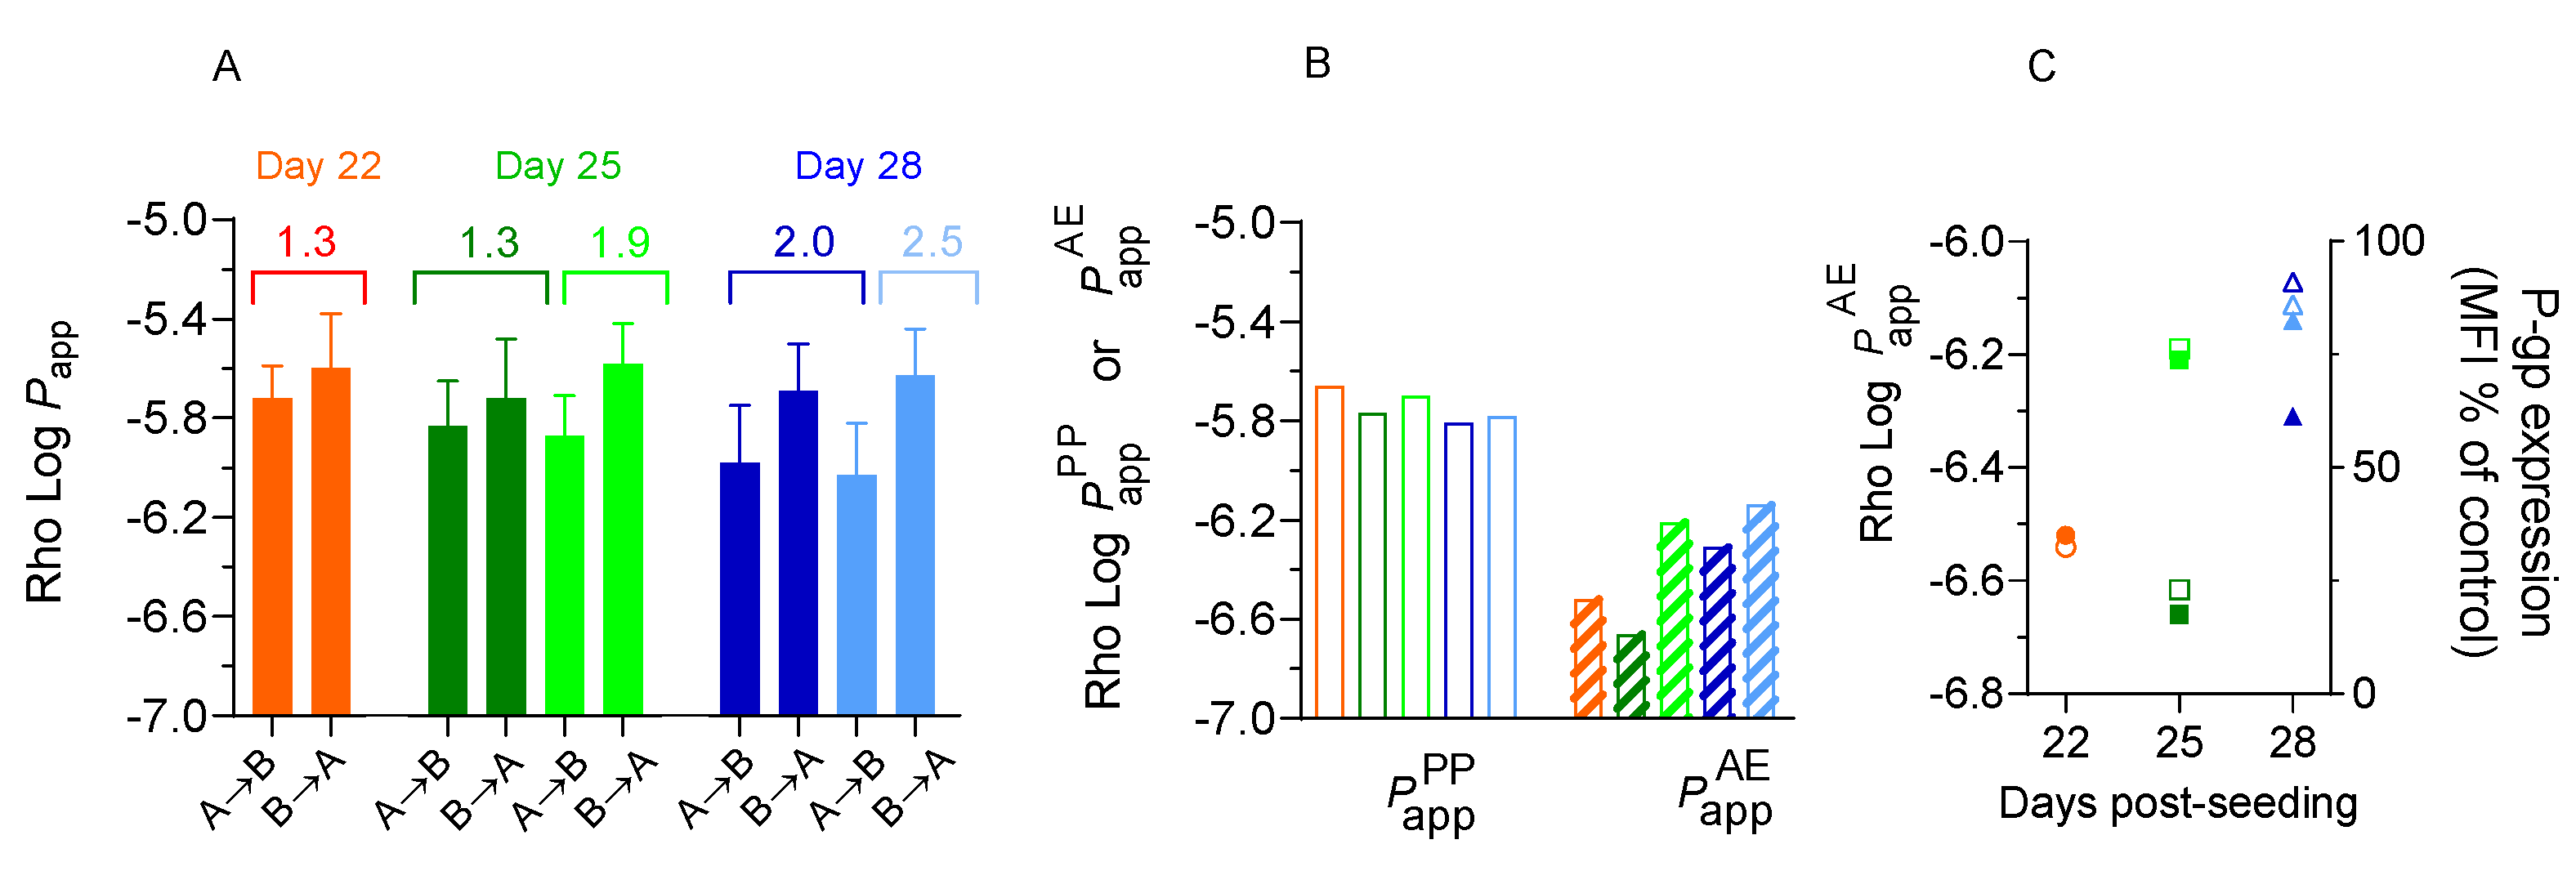
The accumulation of Rho in the acceptor compartment increased linearly with the incubation time, both in the A→B and in the B→A direction (Figure S3 - Supplementary Material). The average value of Papp was calculated from the instantaneous permeability at each time interval and is presented in Figure 6A.
The first observation is that the results are not significantly influenced by the re-use of the Caco-2 monolayers. Some interesting observations for the effect of the day post-seeding are discussed below.
The efflux ratio is very close to 1 for cell monolayers on day 22 post-seeding, and increases to somewhat above 2 for cells on day 28, suggesting an increase in Rho efflux by P-gp. In agreement, a decrease is observed for Papp in the A→B direction. However, this decrease is not accompanied by the expected increase of Papp in the B→A direction. Those apparently conflicting results may be reconciliated if one considers that the observed Papp is the result of both passive permeation () and active efflux (), Equation (3). For permeation in the A→B direction, the active efflux leads to a decrease in the observed Papp, while in the B→A direction both processes sum up. The contribution from passive and active processes may be calculated from Equation (4) and the results obtained are shown in Figure 6B. A small decrease is observed with the day post-seeding for (from 2×10⁻⁶ cm/s on day 22 to 1.6×10⁻⁶ cm/s on day 28). In contrast, it is observed a significant increase on with the day post-seeding, from 1.5×10⁻⁷ cm/s on day 22, to 6×10⁻⁷ cm/s on day 28 (Table S6 – Supplementary Material). The values obtained for the permeability coefficient through both permeation routes are similar and in the B→A direction the opposite variation cancel out, leading to no variation in the overall permeability. The deconvolution of the observed Papp in the contributions from passive process and efflux, thus lead to a better understanding of the observed permeability. This treatment has the additional advantage of increasing the sensitivity on the evaluation of active efflux in the case of low efflux ratios.
To further elucidate on the variations of the rate of Rho efflux, we have quantified the effect of the day post-seeding (and monolayer re-use) on the amount of P-gp on the plasma membrane of Caco-2 cells. The expression level was accessed by flow cytometry after immunostaining P-gp with a FITC-conjugated antibody. The median fluorescence intensity (MFI) is show in figure 6C (raw data in Figure S4 - Supplementary Material). A low level of P-gp expression was observed at all conditions tested, in spite of a small increase with the day post-seeding compatible with the variation observed in .
4. Discussion
The results obtained in this work show that the manipulation of the monolayer required for sampling has some impact on monolayer integrity, and that those effects decrease as the days post-seeding increase from day 22 to 28, both for cell monolayers used in a single permeability assay or re-used following the proposed protocol. The impact is most significant for compounds that permeate paracellularly (Figure 1), and negligible for transcellular permeation (Figure 3). It is also shown that the intrinsic variability of the results obtained with the Caco-2 permeability assay (regarding cell passage number, cell batch, and day post-seeding) is higher for compounds that permeate paracellularly. This shows that when the conditions of the assays are maintained, the major source of variability is the cell monolayer integrity.
Although Flu is commonly used as a paracellular marker, the results obtained (Figure 2) suggests a significant contribution of permeation through a transcellular pathway, which is consistent with its lower polarity when compared with LY (Table S1). This shows that LY is a better reporter of cell monolayer integrity.
At the conditions studied, Papp of the glucose analogue 2-NBDG is low, comparable to that of LY, and independent on the transport direction being A→B or B→A. This shows that 2-NBDG is not a substrate of glucose transporters. Although surprising at first given the extensive use of this glucose analogue to visualize and estimate the glucose accumulation in cells [20,33], our findings agree with recently published studies. Some internalization of 2-NBDG in mammalian cells was observed, but with a kinetics distinct from that of radio-labelled glucose, and not affected by high-affinity GLUT inhibitors [45,46,47]. The confocal results obtained in this work (Figure 5) suggest that although not transported, 2-NBDG binds efficiently to the glucose transporters. This may explain previous results reported in literature where accumulation of 2-NBDG in the cells were observed, with the extent of accumulation being inhibited by the presence of glucose. This fluorescent glucose analogue may therefore be of interest to identify the presence of glucose transporters but cannot be used to monitor glucose transport. Similar results are anticipated for other fluorescent glucose derivatives due to the effect of the fluorescent moiety on glucose properties and transporter activity, invalidating their use in permeability assays. Proper validation of the function of glucose transporters upon re-use of cell monolayers could be carried out with radio-labelled glucose analogues for which glucose transport has been quantitively characterized in Caco-2 monolayers [47].
The low expression level of the efflux transporter P-gp observed in this work agree with the results previously observed by other authors for Caco-2 cell monolayers grown at the same conditions [18,42,43]. This results in a low efflux ratio for Rho transport, which increases slightly with the day post-seeding (Figure 6). An analysis procedure is proposed that allows the calculation of the contribution from passive () and active efflux () transport to the observed permeability. The low value of obtained for Rho agrees with the low level of P-gp expression. A small decrease is observed in with the day post-seeding, both for monolayers used in a single permeability assay or re-used. This could be due to changes in the properties of the cell membranes or reflect the increase in the monolayer tightness. The similar values obtained for Rho and LY Papp suggest a significant contribution of paracellular permeability for Rho, which decreases slightly due to the increase in monolayer tightness. Although similar, the values of obtained for Rho are somewhat higher than those of the paracellular marker LY measured in the same assays, showing a significant contribution of the transcellular route in the case of Rho permeation through the Caco-2 monolayers. This agrees with the lower global charge and higher hydrophobicity of Rho when compared with LY (Table S1, and [48]).
The two active pathways evaluated in this study contribute to the validation of the re-use methodology but do not provide a full validation. This because 2-NBDG was found to be inadequate to evaluate glucose transport, and because P-gp expression is low in Caco-2 cells at the high passage numbers used. For a more robust validation regarding the transporter’s functions, compounds targeting other transporters relevantly expressed in Caco-2 monolayers should also be evaluated. Relevant transporters may include the peptide influx (PepT1) which active transport and expression has been well-characterized in Caco-2 monolayers [23,49]. Its substrates, namely the β-lactams antibiotics (e.g., cephalosporins) are suitable compounds to perform the re-use validation studies since they are effectively transported and the kinetics of transport have already been studied in these cells [49].
The complete validation of the re-use methodology will require an extensive and systematic work. It will only be possible to generate such a quantity of permeability data for distinct molecules with multiple contributions by the scientific community over the coming years. When the Caco-2 model started to demonstrate its potential to predict intestinal permeability, a very low quantity of permeability data was available in the literature. In the present days, the information available is very extensive and new data is continuously being generated and published, further contributing to its validation and reinforcing its utility.
Once fully validated, the re-use methodology can potentially be used to at least triplicate the throughput of this assay in drug permeability assessments. Overall, there are several advantages that we though justify the effort of validating this approach. First, the period of time to have a cell monolayer ready for testing, which was previously 21 days can be reduced to 2 days. Secondly, the re-use approach may bring value by downscaling the culture materials (number of TranswellTM, media quantity) and human resources. Third, it allows a fast evaluation of a higher number of compounds with lower variability. At first sight, the handling of cells during and after the transport experiments under aseptic conditions may be seen as a disadvantage of the application of the re-use methodology relative to the standard conditions. However, it is also a fact that every cell culture laboratory has already implemented these technical norms. The high throughput that will be given by this methodology largely compensates the time, effort, and availability at the flow laminar hood to perform the protocol under aseptic conditions. To capture the intrinsic variability of distinct cell batches, it is recommended that replicates for a given compound are performed with distinct cell preparations, not from distinct inserts with the same cell preparation. In following with this recommendation, the re-use assays should not be used as replicates for a given compound. The increase in the throughput provided by the re-use of the cell monolayers is however of very high value to evaluate distinct compounds or assay conditions, providing permeability coefficients with a lower variability, in a faster and less costly way.
Supplementary Materials
The following supporting information can be downloaded at the website of this paper posted on Preprints.org: S1 - Structure and general properties of the tested compounds (Table S1); S2 - Analytical procedures for the quantification of the tested compounds (Figure S1 and Table S2); S3 - Effect of Caco-2 monolayer re-use on passive permeation (Table S3 and Table S4); S4 - Effect of Caco-2 monolayer re-use on transport of 2-NBDG (Table S5 and Figure S2); S5 - Effect of Caco-2 monolayer re-use on transport of Rho (Figure S3 and Table S6); S6 - Effect of Caco-2 monolayer re-use on P-gp expression (Figure S4).
Author Contributions
Conceptualization, methodology, formal analysis, and writing of the first draft were performed by Cristiana L. Pires and Maria João Moreno. Investigation was performed mainly by Cristiana L. Pires with contributions from Susana Rocha and Ana L. M. Batista de Carvalho. Funding acquisition and resources were secured by Lino Ferreira, Maria Paula M. Marques and Maria João Moreno. All authors commented on previous versions of the manuscript. All authors read and approved the final manuscript.
Funding
This research was supported by the Portuguese Foundation for Science and Technology (FCT) through the COMPETE2020-Operational Program for Competitiveness and Internationalization, and Portuguese funds via FCT, under projects DOI:10.54499/UIDB/00313/2020, DOI:10.54499/UIDP/00313/2020, DOI:10.54499/UIDB/00070/2020, DOI:10.54499/UIDP/00070/2020, DOI: 10.54499/PTDC/BTM-SAL/5174/202 and DOI: 10.54499/PTDC/BTM-SAL/5174/2020 (Portugal).
Institutional Review Board Statement
Not applicable.
Informed Consent Statement
Not applicable
Data Availability Statement
The dataset generated and/or analysed during the current study is included in the Supplementary Information, raw data will be provided upon request.
Acknowledgments
The authors acknowledge Margarida Caldeira from the Microscopy Imaging Center of Coimbra (MICC) of CNC.IBILI for the help with the acquisition of the confocal images. C.L.P. acknowledges support from FCT through fellowship (SFRH/BD/138873/2018) and A.L.M.B.C. acknowledges her employment contract DOI:10.54499/CEECIND/00069/2017/CP1460/CT0029.
Conflicts of Interest
The authors declare no conflicts of interest
References
- Volpe, D.A. Advances in cell-based permeability assays to screen drugs for intestinal absorption. Expert Opinion on Drug Discovery 2020, 15, 539–549. [Google Scholar] [CrossRef]
- Sambuy, Y.; Angelis, I.; Ranaldi, G.; Scarino, M.L.; Stammati, A.; Zucco, F. The Caco-2 cell line as a model of the intestinal barrier: Influence of cell and culture-related factors on Caco-2 cell functional characteristics. Cell Biol. Toxicol. 2005, 21, 1–26. [Google Scholar] [CrossRef] [PubMed]
- Hidalgo, I.J.; Raub, T.J.; Borchardt, R.T. Characterization of the Human-Colon Carcinoma Cell-Line (Caco-2) as a Model System for Intestinal Epithelial Permeability. Gastroenterology 1989, 96, 736–749. [Google Scholar] [CrossRef] [PubMed]
- Wang, Y.; Zhang, X.L.; Zhuang, W.Y.; Yu, Y.L.; Sun, X.R.; Wang, H.; Li, F.Z.; Li, Q.Y. Investigation of the Uptake and Transport of Two Novel Camptothecin Derivatives in Caco-2 Cell Monolayers. Molecules 2022, 27. [Google Scholar] [CrossRef] [PubMed]
- Hubatsch, I.; Ragnarsson, E.G.E.; Artursson, P. Determination of drug permeability and prediction of drug absorption in Caco-2 monolayers. Nat. Protoc. 2007, 2, 2111–2119. [Google Scholar] [CrossRef] [PubMed]
- Briske-Anderson, M.J.; Finley, J.W.; Newman, S.M. The influence of culture time and passage number on the morphological and physiological development of Caco-2 cells. Proceedings of the Society for Experimental Biology and Medicine 1997, 214, 248–257. [Google Scholar] [CrossRef] [PubMed]
- Balimane, P.V.; Chong, S. Cell culture-based models for intestinal permeability: A critique. Drug Discovery Today 2005, 10, 335–343. [Google Scholar] [CrossRef] [PubMed]
- Press, B.; Di Grandi, D. Permeability for Intestinal Absorption: Caco-2 Assay and Related Issues. Current Drug Metabolism 2008, 9, 893–900. [Google Scholar] [CrossRef] [PubMed]
- Sevin, E.; Dehouck, L.; Fabulas-da Costa, A.; Cecchelli, R.; Dehouck, M.P.; Lundquist, S.; Culot, M. Accelerated Caco-2 cell permeability model for drug discovery. Journal of Pharmacological and Toxicological Methods 2013, 68, 334–339. [Google Scholar] [CrossRef] [PubMed]
- Liang, E.; Chessic, K.; Yazdanian, M. Evaluation of an accelerated Caco-2 cell permeability model. Journal of Pharmaceutical Sciences 2000, 89, 336–345. [Google Scholar] [CrossRef]
- Cai, Y.K.; Xu, C.S.; Chen, P.Y.; Hu, J.Q.; Hu, R.; Huang, M.; Bi, H.C. Development, validation, and application of a novel 7-day Caco-2 cell culture system. Journal of Pharmacological and Toxicological Methods 2014, 70, 175–181. [Google Scholar] [CrossRef] [PubMed]
- Marino, A.M.; Yarde, M.; Patel, H.; Chong, S.H.; Balimane, P.V. Validation of the 96 well Caco-2 cell culture model for high throughput permeability assessment of discovery compounds. International Journal of Pharmaceutics 2005, 297, 235–241. [Google Scholar] [CrossRef] [PubMed]
- Sevin, E.; Dehouck, L.; Versele, R.; Culot, M.; Gosselet, F. A Miniaturized Pump Out Method for Characterizing Molecule Interaction with ABC Transporters. International Journal of Molecular Sciences 2019, 20. [Google Scholar] [CrossRef] [PubMed]
- Tannergren, C.; Langguth, P.; Hoffmann, K.J. Compound mixtures in Caco-2 cell permeability screens as a means to increase screening capacity. Pharmazie 2001, 56, 337–342. [Google Scholar] [PubMed]
- Laitinen, L.; Kangas, H.; Kaukonen, A.M.; Hakala, K.; Kotiaho, T.; Kostiainen, R.; Hirvonen, J. N-in-one permeability studies of heterogeneous sets of compounds across Caco-2 cell monolayers. Pharmaceutical Research 2003, 20, 187–197. [Google Scholar] [CrossRef] [PubMed]
- Pires, C.L.; Praça, C.; Martins, P.A.T.; Batista de Carvalho, A.L.M.; Ferreira, L.; Marques, M.P.M.; Moreno, M.J. Re-Use of Caco-2 Monolayers in Permeability Assays—Validation Regarding Cell Monolayer Integrity. Pharmaceutics 2021, 13, 1563. [Google Scholar] [CrossRef] [PubMed]
- Lu, S.; Gough, A.W.; Bobrowski, W.F.; Stewart, B.H. Transport properties are not altered across Caco-2 cells with heightened TEER despite underlying physiological and ultrastructural changes. J. Pharm. Sci. 1996, 85, 270–273. [Google Scholar] [CrossRef]
- Seithel, A.; Karlsson, J.; Hilgendorf, C.; Björquist, A.; Ungell, A.L. Variability in mRNA expression of ABC- and SLC-transporters in human intestinal cells:: Comparison between human segments and Caco-2 cells. European Journal of Pharmaceutical Sciences 2006, 28, 291–299. [Google Scholar] [CrossRef]
- Sun, H.; Chow, E.C.Y.; Liu, S.; Du, Y.; Pang, K.S. The Caco-2 cell monolayer: Usefulness and limitations. Expert Opinion on Drug Metabolism & Toxicology 2008, 4, 395–411. [Google Scholar] [CrossRef]
- Ontawong, A.; Duangjai, A.; Srimaroeng, C. <i>Coffea arabica</i> bean extract inhibits glucose transport and disaccharidase activity in Caco-2 cells. Biomedical Reports 2021, 15. [Google Scholar] [CrossRef]
- Xu, X.Q.; Wang, P.Y.; Wang, B.G.; Wang, M.K.; Wang, S.Y.; Liu, Z.H.; Zhang, Y.; Kang, W.Y. Glucose absorption regulation and mechanism of the compounds in <i>Lilium</i> <i>lancifolium</i> Thunb on Caco-2 cells. Food and Chemical Toxicology 2021, 149. [Google Scholar] [CrossRef]
- Alzaid, F.; Cheung, H.M.; Preedy, V.R.; Sharp, P.A. Regulation of Glucose Transporter Expression in Human Intestinal Caco-2 Cells following Exposure to an Anthocyanin-Rich Berry Extract. PLoS ONE 2013, 8. [Google Scholar] [CrossRef]
- Hayeshi, R.; Hilgendorf, C.; Artursson, P.; Augustijns, P.; Brodin, B.; Dehertogh, P.; Fisher, K.; Fossati, L.; Hovenkamp, E.; Korjamo, T.; et al. Comparison of drug transporter gene expression and functionality in Caco-2 cells from 10 different laboratories. European Journal of Pharmaceutical Sciences 2008, 35, 383–396. [Google Scholar] [CrossRef] [PubMed]
- Ambudkar, S.V.; Dey, S.; Hrycyna, C.A.; Ramachandra, M.; Pastan, I.; Gottesman, M.M. Biochemical, cellular, and pharmacological aspects of the multidrug transporter. Annual Review of Pharmacology and Toxicology 1999, 39, 361–398. [Google Scholar] [CrossRef]
- Yumoto, R.; Murakami, T.; Nakamoto, Y.; Hasegawa, R.; Nagai, J.; Takano, M. Transport of rhodamine 123, a P-glycoprotein substrate, across rat intestine and Caco-2 cell monolayers in the presence of cytochrome P-450 3A-related compounds. J. Pharmacol. Exp. Ther. 1999, 289, 149–155. [Google Scholar]
- Lusvarghi, S.; Robey, R.W.; Gottesman, M.M.; Ambudkar, S.V. Multidrug transporters: Recent insights from cryo-electron microscopy-derived atomic structures and animal models. F1000Research 2020, 9. [Google Scholar] [CrossRef] [PubMed]
- Szewczyk, P.; Tao, H.C.; McGrath, A.P.; Villaluz, M.; Rees, S.D.; Lee, S.C.; Doshi, R.; Urbatsch, I.L.; Zhang, Q.H.; Chang, G. Snapshots of ligand entry, malleable binding and induced helical movement in P-glycoprotein. Acta Crystallogr. Sect. D-Biol. Crystallogr. 2015, 71, 732–741. [Google Scholar] [CrossRef] [PubMed]
- Lavis, L.D.; Rutkoski, T.J.; Raines, R.T. Tuning the pKa of fluorescein: Implications for binding assays. Abstracts of Papers of the American Chemical Society 2007, 233. [Google Scholar] [CrossRef]
- Paketuryte, V.; Petrauskas, V.; Zubriene, A.; Abian, O.; Bastos, M.; Chen, W.Y.; Moreno, M.J.; Krainer, G.; Linkuviene, V.; Sedivy, A.; et al. Uncertainty in protein-ligand binding constants: Asymmetric confidence intervals versus standard errors. Eur. Biophys. J. Biophys. Lett. 2021, 50, 661–670. [Google Scholar] [CrossRef]
- Fu, Q.X.; Wang, H.Z.; Xia, M.X.; Deng, B.; Shen, H.Y.; Ji, G.; Li, G.W.; Xie, Y. The effect of phytic acid on tight junctions in the human intestinal Caco-2 cell line and its mechanism. European Journal of Pharmaceutical Sciences 2015, 80, 1–8. [Google Scholar] [CrossRef]
- Batistela, V.R.; Cedran, J.D.; de Oliveira, H.P.M.; Scarminio, I.S.; Ueno, L.T.; Machado, A.E.H.; Hioka, N. Protolytic fluorescein species evaluated using chemometry and DFT studies. Dyes and Pigments 2010, 86, 15–24. [Google Scholar] [CrossRef]
- Hellinger, É.; Veszelka, S.; Tóth, A.E.; Walter, F.; Kittel, A.; Bakk, M.L.; Tihanyi, K.; Háda, V.; Nakagawa, S.; Thuy, D.H.D.; et al. Comparison of brain capillary endothelial cell-based and epithelial (MDCK-MDR1, Caco-2, and VB-Caco-2) cell-based surrogate blood-brain barrier penetration models. European Journal of Pharmaceutics and Biopharmaceutics 2012, 82, 340–351. [Google Scholar] [CrossRef] [PubMed]
- Yamamoto, N.; Ueda-Wakagi, M.; Sato, T.; Kawasaki, K.; Sawada, K.; Kawabata, K.; Akagawa, M.; Ashida, H. Measurement of Glucose Uptake in Cultured Cells. Current protocols in pharmacology 2015, 71, 12–14. [Google Scholar] [CrossRef] [PubMed]
- Yamada, K.; Nakata, M.; Horimoto, N.; Saito, M.; Matsuoka, H.; Inagaki, N. Measurement of glucose uptake and intracellular calcium concentration in single, living pancreatic <i>β</i>-cells. J. Biol. Chem. 2000, 275, 22278–22283. [Google Scholar] [CrossRef]
- Zou, C.H.; Wang, Y.J.; Shen, Z.F. 2-NBDG as a fluorescent indicator for direct glucose uptake measurement. Journal of Biochemical and Biophysical Methods 2005, 64, 207–215. [Google Scholar] [CrossRef] [PubMed]
- Dahlgren, D.; Lennernas, H. Intestinal Permeability and Drug Absorption: Predictive Experimental, Computational and In Vivo Approaches. Pharmaceutics 2019, 11. [Google Scholar] [CrossRef] [PubMed]
- van Breemen, R.B.; Li, Y. Caco-2 cell permeability assays to measure drug absorption. Expert Opin Drug Metab Toxicol 2005, 1, 175–185. [Google Scholar] [CrossRef] [PubMed]
- del Amo, E.M.; Heikkinen, A.T.; Monkkonen, J. In vitro-in vivo correlation in p-glycoprotein mediated transport in intestinal absorption. European Journal of Pharmaceutical Sciences 2009, 36, 200–211. [Google Scholar] [CrossRef] [PubMed]
- Lin, J.H.; Yamazaki, M. Role of P-glycoprotein in pharmacokinetics - Clinical implications. Clinical Pharmacokinetics 2003, 42, 59–98. [Google Scholar] [CrossRef]
- Moreno, M.J.; Filipe, H.A.L.; Cunha, S.V.P.; Ramos, C.V.; Martins, P.A.T.; Abel, B.; Loura, L.M.S.; Ambudkar, S.V. Interaction of a Homologous Series of Amphiphiles with P-glycoprotein in a Membrane Environment. Contributions of Polar and Non-Polar Interactions. Pharmaceutics 2023, 15, 174. [Google Scholar] [CrossRef]
- Anderle, P.; Niederer, E.; Rubas, W.; Hilgendorf, C.; Spahn-Langguth, H.; Wunderli-Allenspach, H.; Merkle, H.P.; Langguth, P. P-glycoprotein (P-gp) mediated efflux in Caco-2 cell monolayers: The influence of culturing conditions and drug exposure on P-gp expression levels. J. Pharm. Sci. 1998, 87, 757–762. [Google Scholar] [CrossRef]
- Behrens, I.; Kissel, T. Do cell culture conditions influence the carrier-mediated transport of peptides in Caco-2 cell monolayers? European Journal of Pharmaceutical Sciences 2003, 19, 433–442. [Google Scholar] [CrossRef]
- Hosoya, K.; Kim, K.J.; Lee, V.H.L. Age-dependent expression of P-glycoprotein gp170 in Caco-2 cell monolayers. Pharmaceutical Research 1996, 13, 885–890. [Google Scholar] [CrossRef] [PubMed]
- Troutman, M.D.; Thakker, D.R. Rhodamine 123 requires carrier-mediated influx for its activity as a P-glycoprotein substrate in Caco-2 cells. Pharmaceutical Research 2003, 20, 1192–1199. [Google Scholar] [CrossRef]
- D'Souza, L.J.; Wright, S.H.; Bhattacharya, D. Genetic evidence that uptake of the fluorescent analog 2NBDG occurs independently of known glucose transporters. PLoS ONE 2022, 17. [Google Scholar] [CrossRef] [PubMed]
- Hamilton, K.E.; Bouwer, M.F.; Louters, L.L.; Looyenga, B.D. Cellular binding and uptake of fluorescent glucose analogs 2-NBDG and 6-NBDG occurs independent of membrane glucose transporters. Biochimie 2021, 190, 1–11. [Google Scholar] [CrossRef] [PubMed]
- Sinclair, L.V.; Barthelemy, C.; Cantrell, D.A. Single Cell Glucose Uptake Assays: A Cautionary Tale. Immunometabolism 2020, 2, e200029. [Google Scholar] [CrossRef]
- Magalhaes, N.; Simões, G.M.; Ramos, C.; Samelo, J.; Oliveira, A.C.; Filipe, H.A.L.; Ramalho, J.P.P.; Moreno, M.J.; Loura, L.M.S. Interactions between Rhodamine Dyes and Model Membrane Systems—Insights from Molecular Dynamics Simulations. Molecules 2022, 27, 1420. [Google Scholar] [CrossRef]
- Bretschneider, B.; Brandsch, M.; Neubert, R. Intestinal transport of β-lactam antibiotics:: Analysis of the affinity at the H+/peptide symporter (PEPT1), the uptake into Caco-2 cell monolayers and the transepithelial flux. Pharmaceutical Research 1999, 16, 55–61. [Google Scholar] [CrossRef]
Figure 1.
Dependence of LY LogPapp on the sampling interval, day post-seeding and re-use of the cell monolayers in multi-time and single-time sampling permeability assays. For a given data set, each data point corresponds to an independent cell monolayer. The mean and the corresponding CI95 of the Papp values for each data set (n ≥ 6) are also shown.
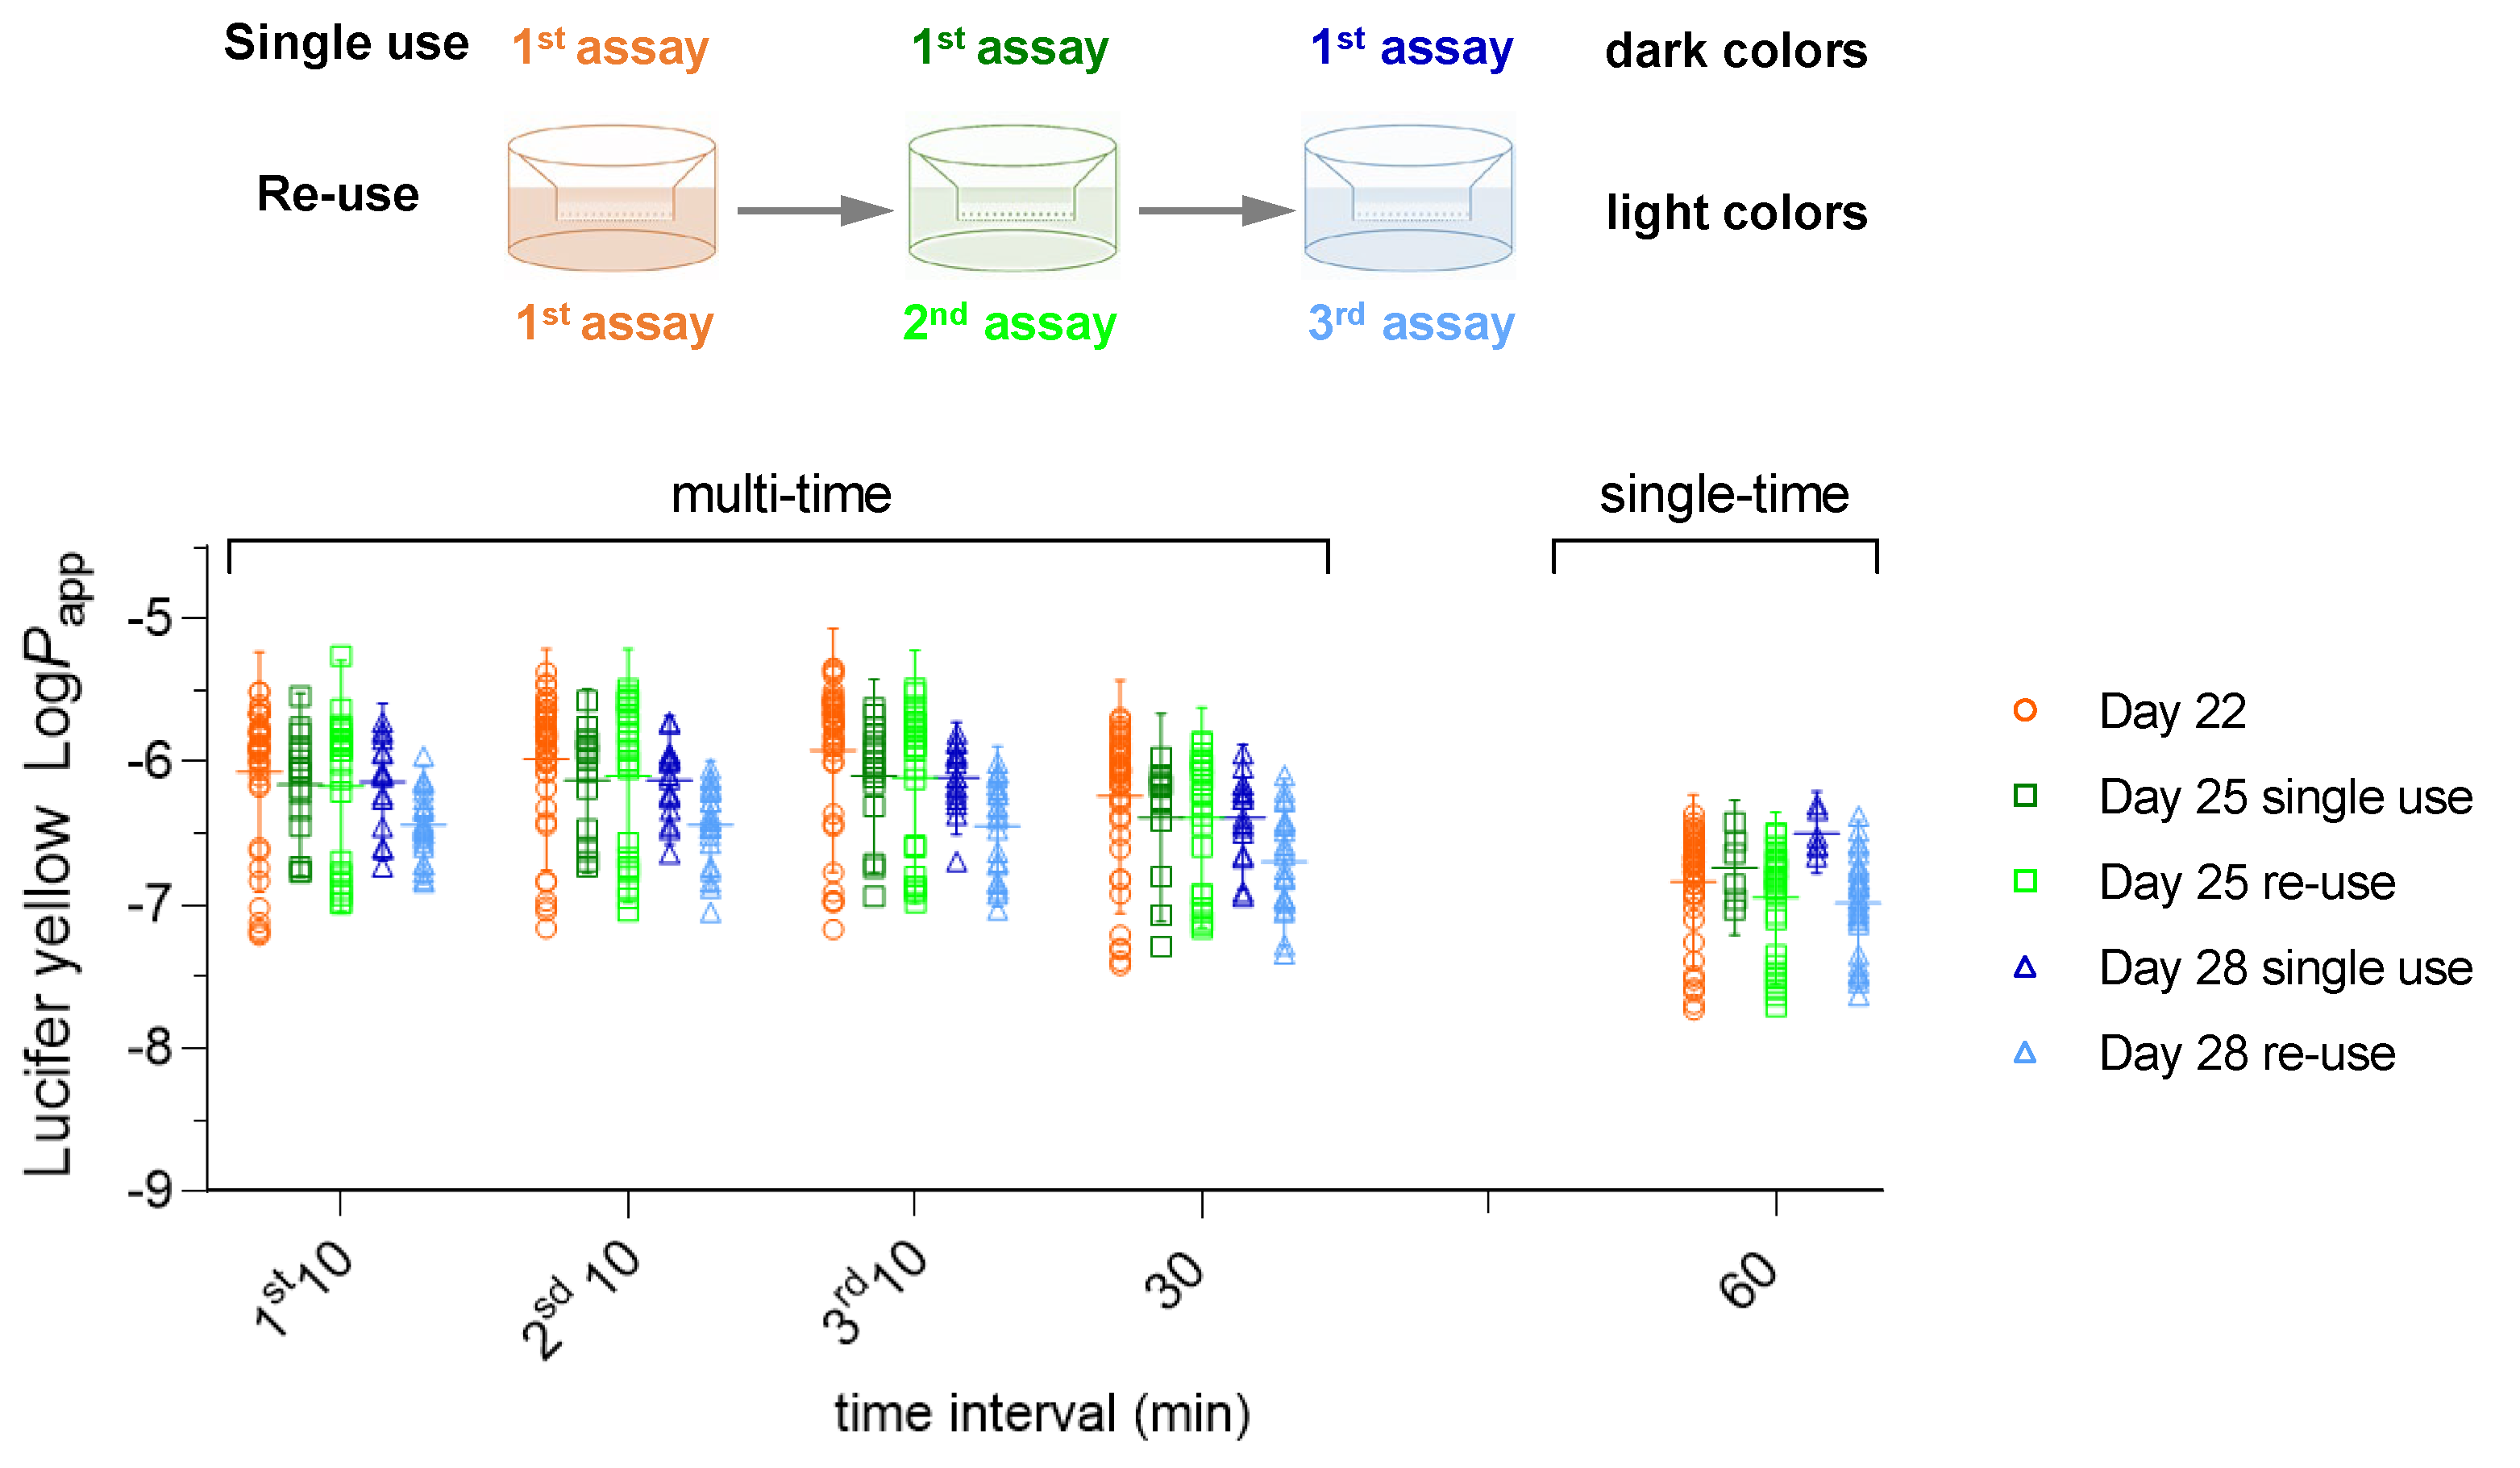
Figure 2.
Effect of re-use and day post-seeding on Flu (plot A) and atenolol (plot B) passive permeability through Caco-2 monolayers after multi-time and single-time sampling assays.
Figure 2.
Effect of re-use and day post-seeding on Flu (plot A) and atenolol (plot B) passive permeability through Caco-2 monolayers after multi-time and single-time sampling assays.
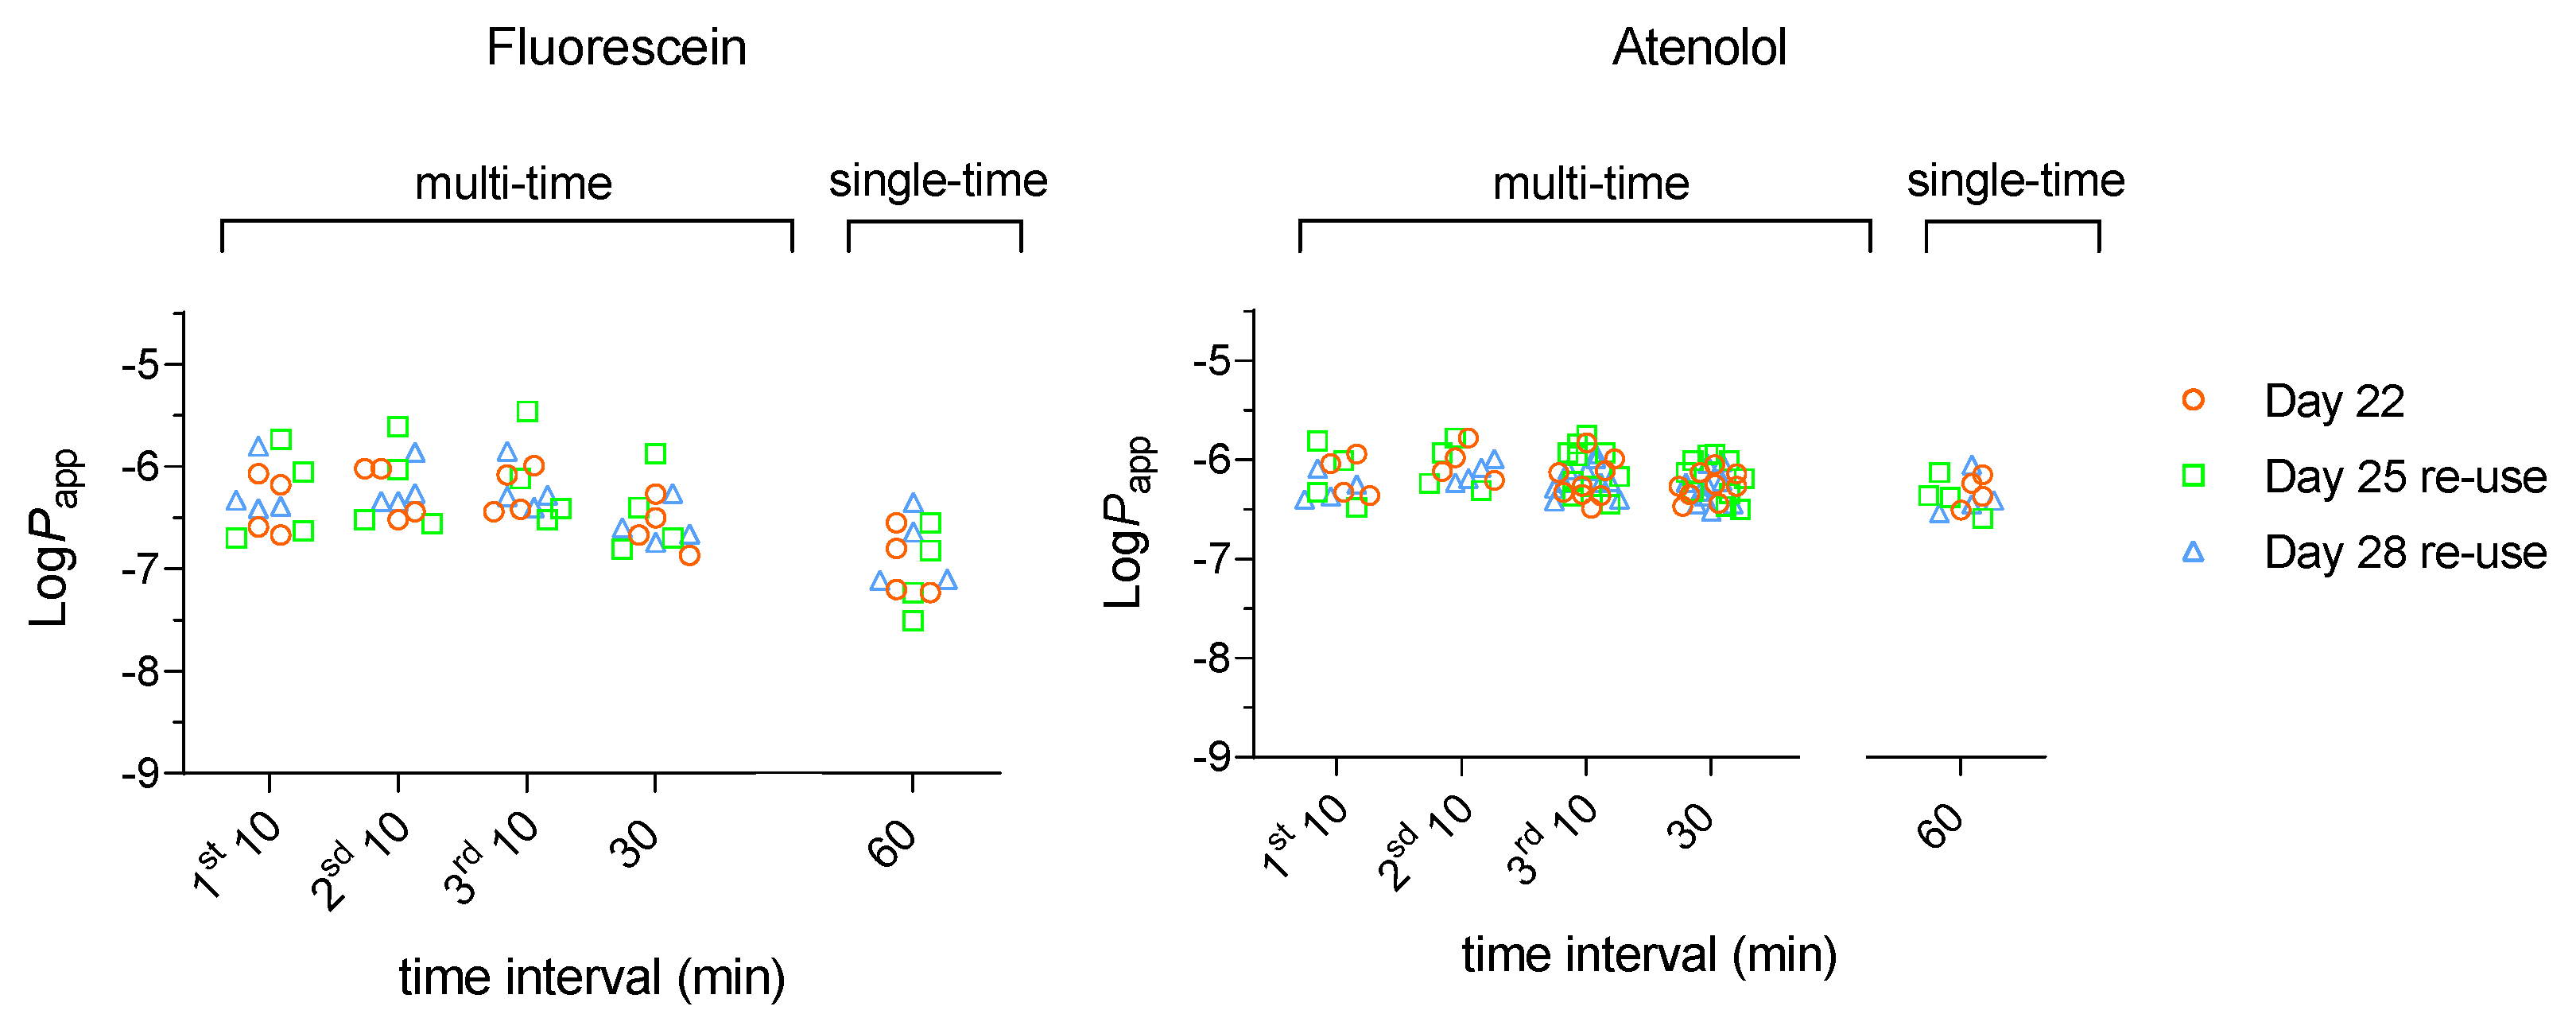
Figure 3.
Effect of re-use and day post-seeding on Prop (plot A) and SA (plot B) passive permeability through Caco-2 monolayers after multi-time and single-time sampling assays.
Figure 3.
Effect of re-use and day post-seeding on Prop (plot A) and SA (plot B) passive permeability through Caco-2 monolayers after multi-time and single-time sampling assays.
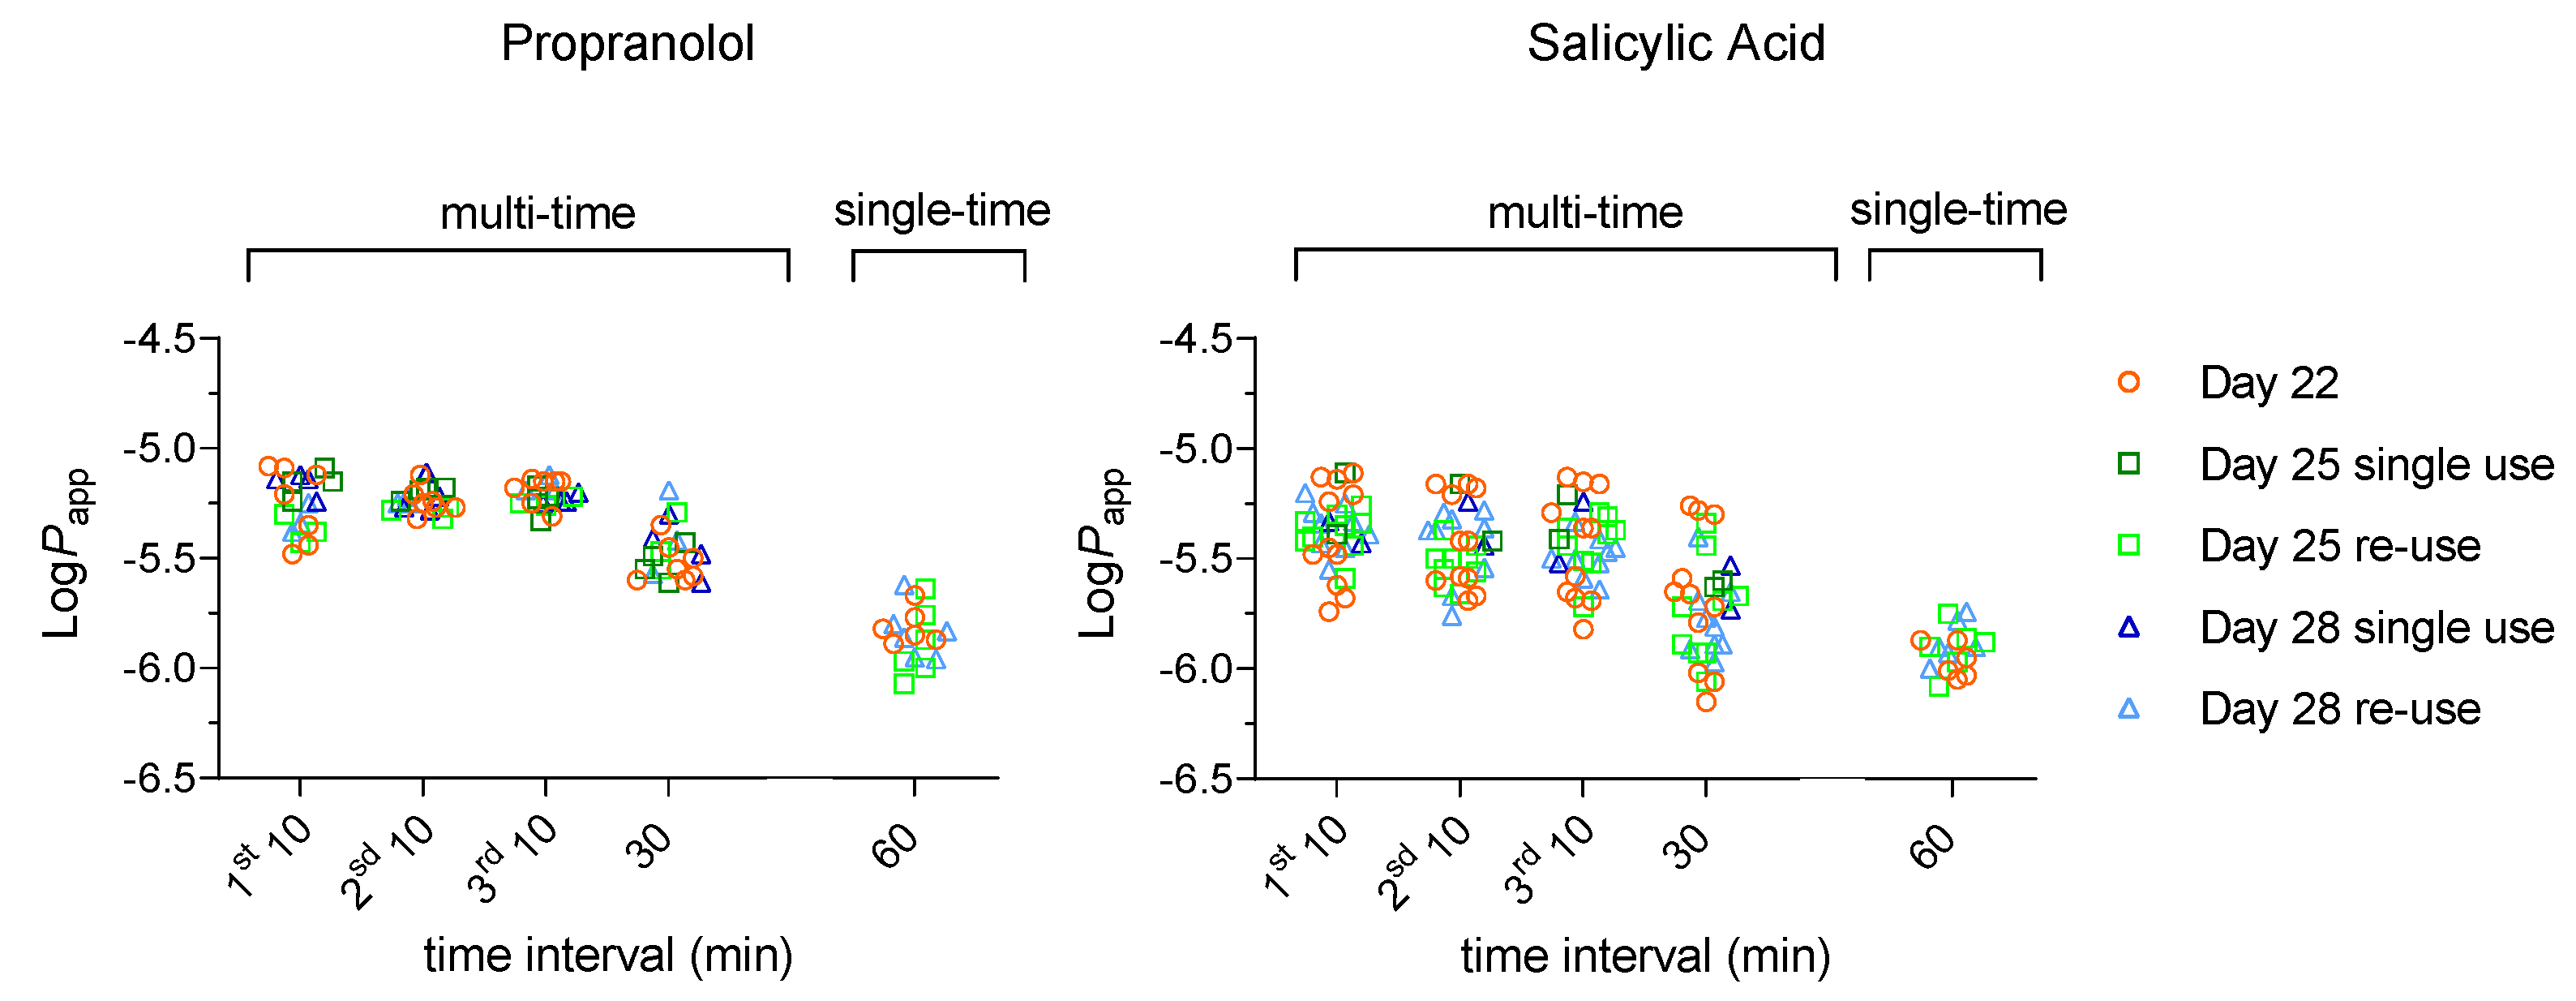
Figure 4.
Effect of re-use and day post-seeding on the cumulative amount of 2-NBDG that reaches the acceptor compartment during multi-time sampling permeability assays.
Figure 4.
Effect of re-use and day post-seeding on the cumulative amount of 2-NBDG that reaches the acceptor compartment during multi-time sampling permeability assays.
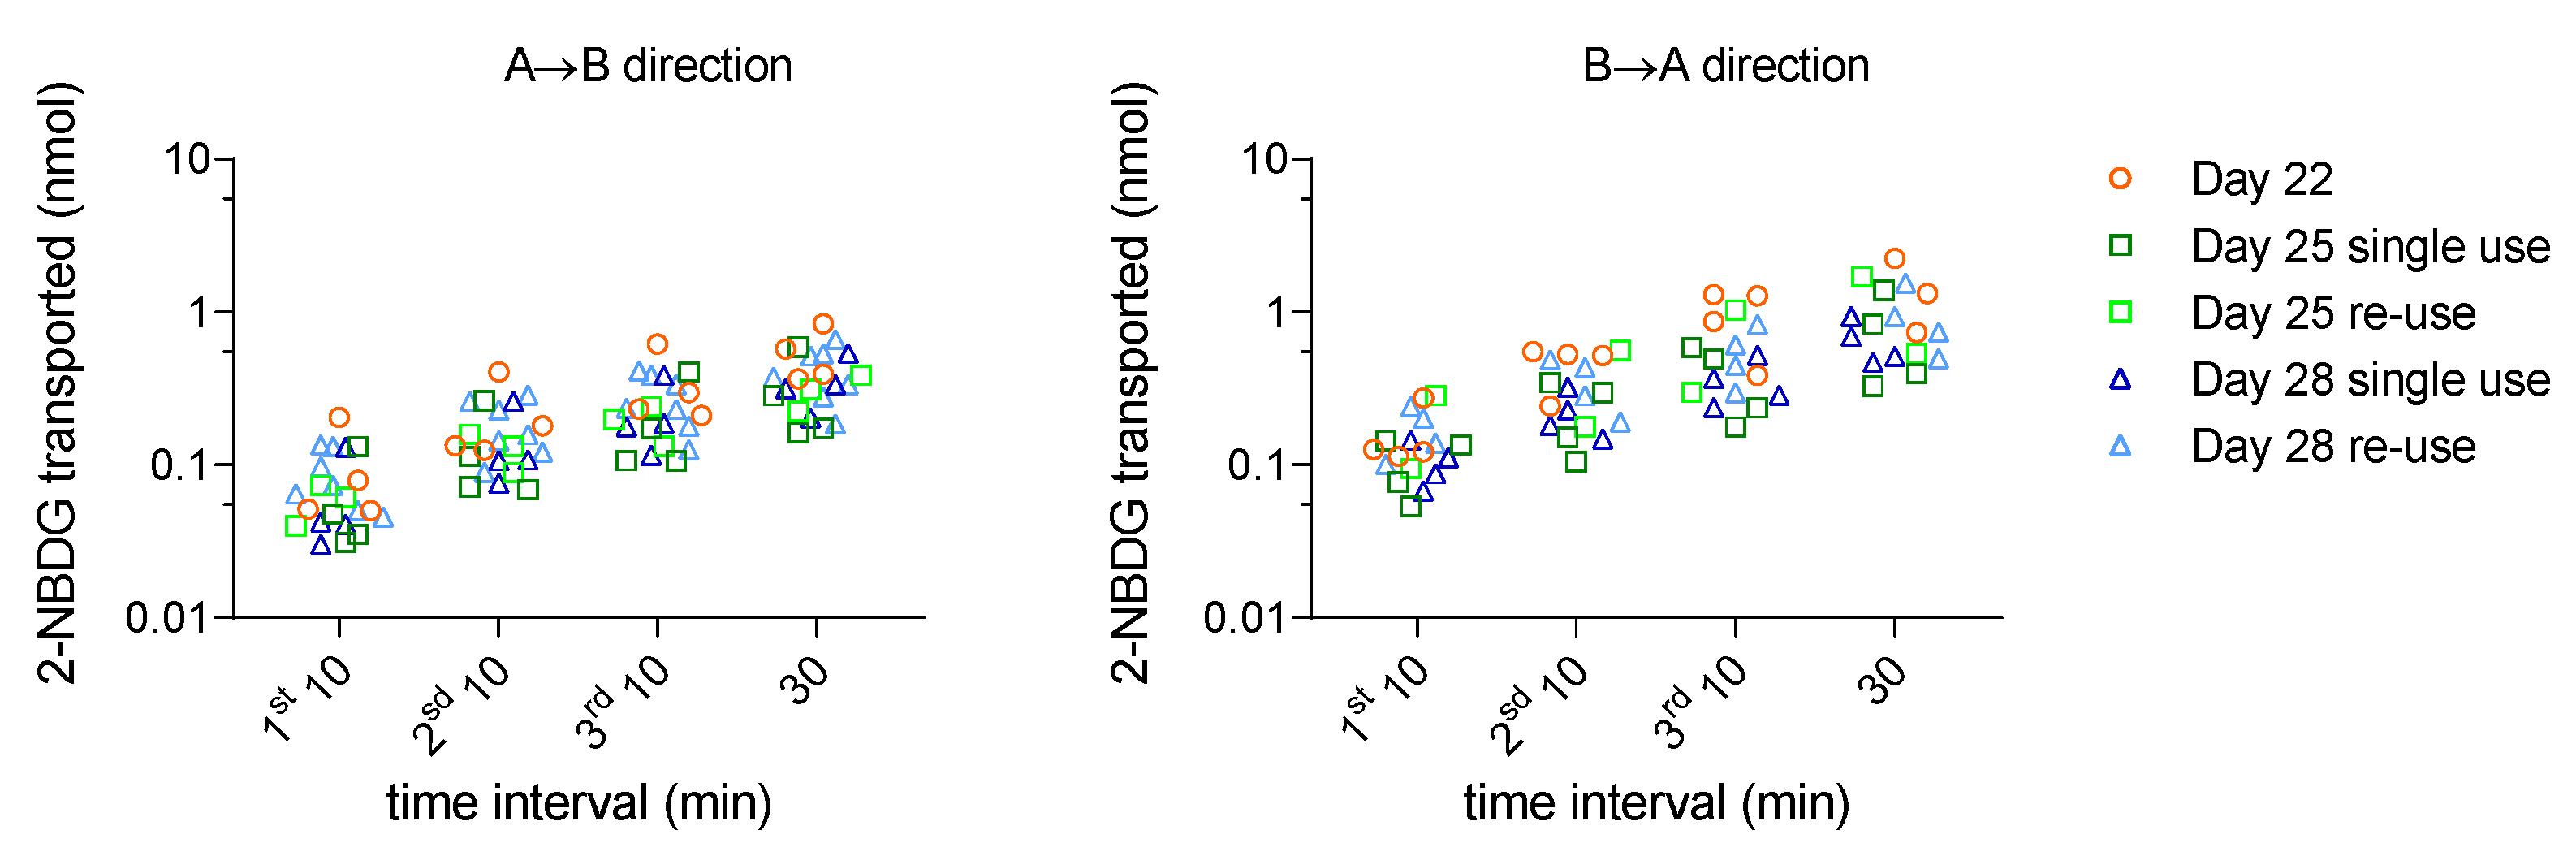
Figure 5.
Confocal microscopy images of Caco-2 monolayers obtained with λex= 458 nm and λem= 459–551 nm. Representative optical section images along the z-axis (1 µm) are shown for (A) cell monolayers not used in permeability assays and for cell monolayers exposed to 250 µM of 2-NBDG for 60 min during permeability assays in the A→B (B) and in the B→A (C) directions. The lower insets show the localization of the fluorescence in the cross section of a z-x plane corresponding to the yellow line. The mean fluorescence intensity in the 160×160 µm2 images shown is 8.8 for (A) 11 (B) and 15 for (C), being respectively 16, 22 and 24 in the full image acquired (Figure S2).
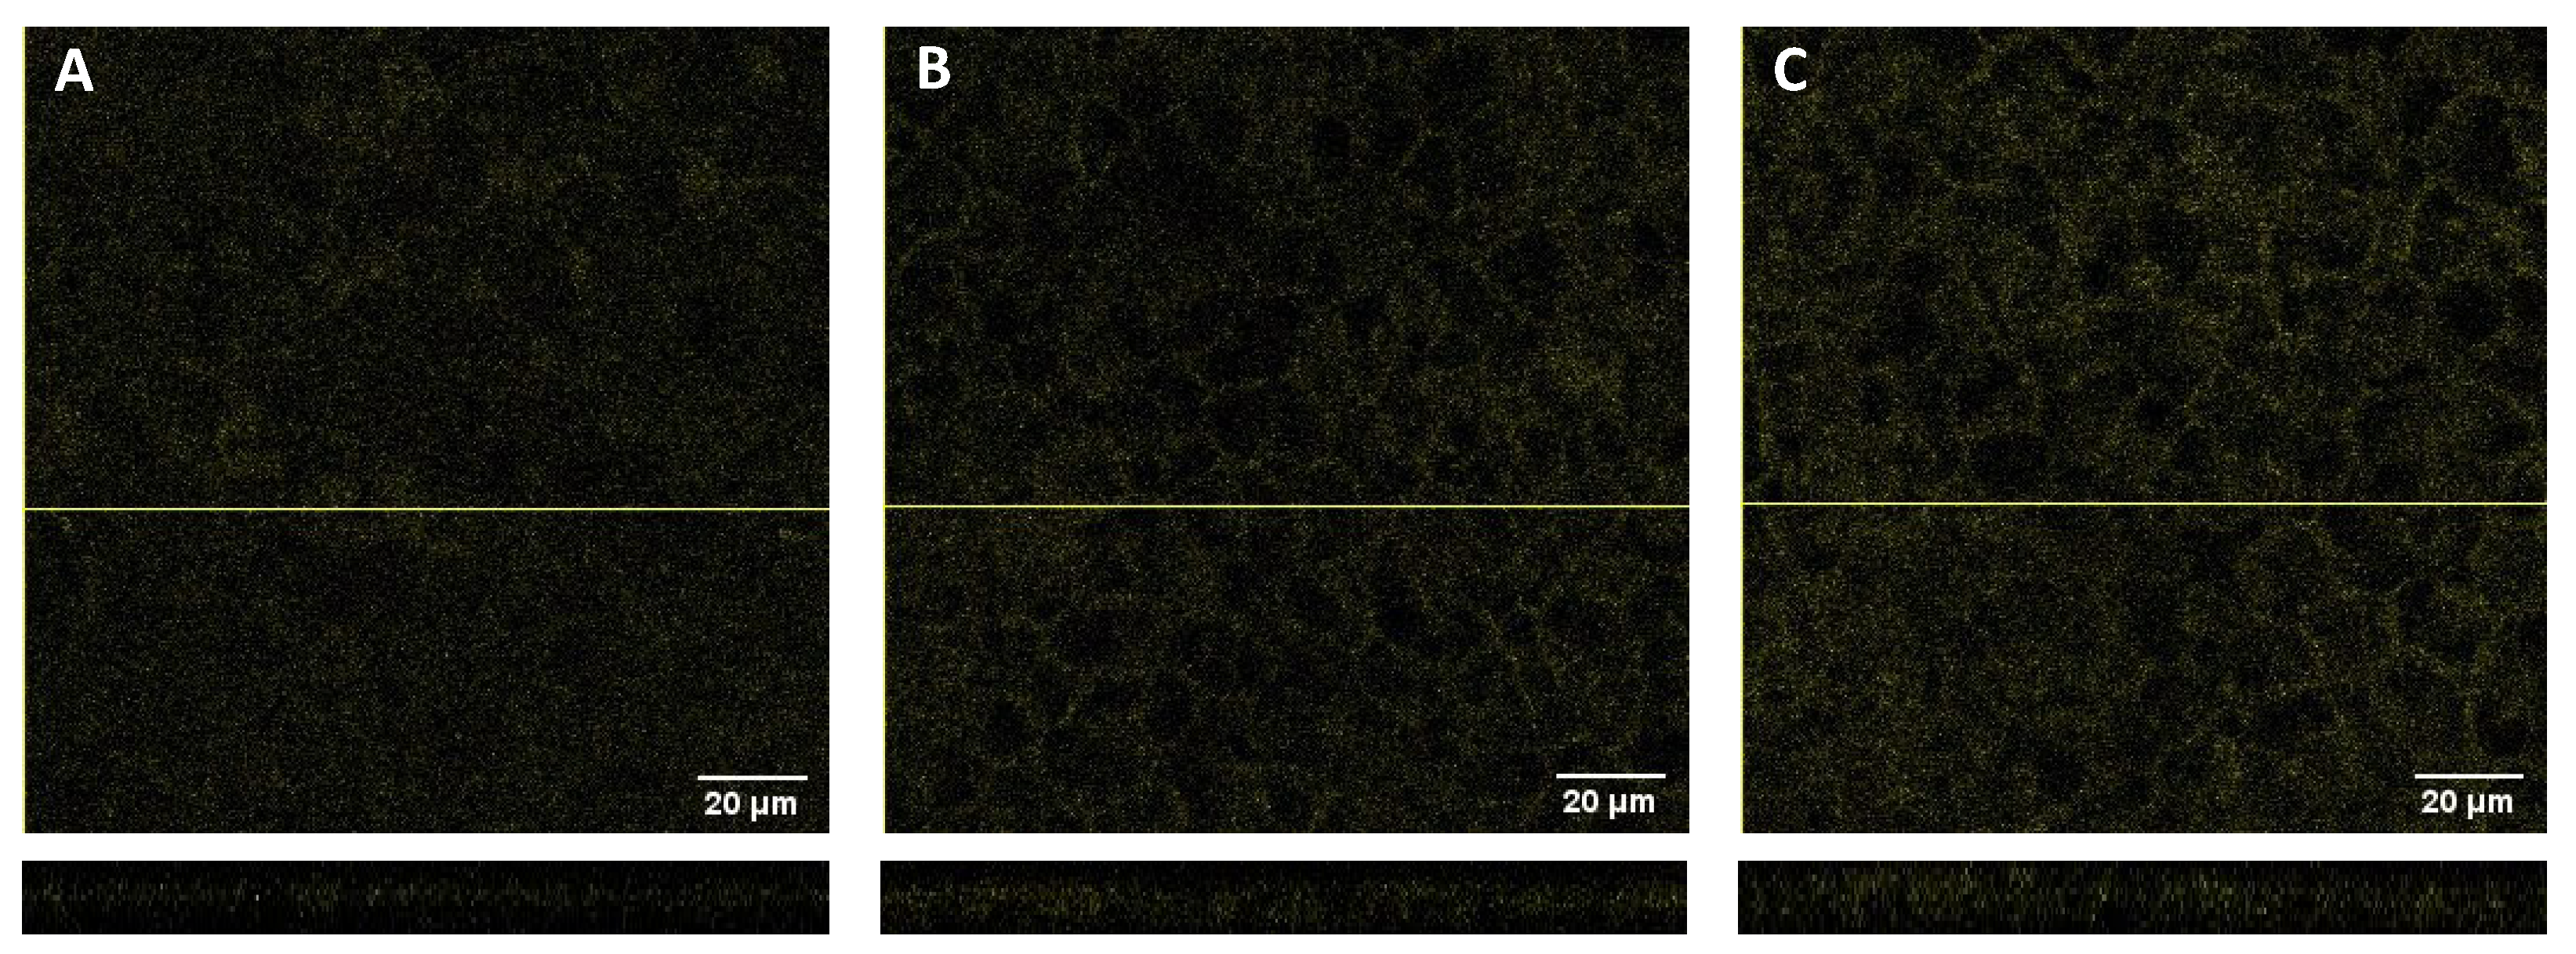
Figure 6.
Effect of re-use and day post-seeding on Rho permeability and P-gp expression across Caco-2 monolayers. Plot A: LogPapp values measured in the A→B and B→A directions (mean and CI95, n ≥ 2), the efflux ratios are presented above the bars. Plot B: contribution of passive permeation () and active efflux () to the measured Rho Papp values, calculated using Equation (4). Plot C: comparison of efflux activity (filled symbols, left axis) and P-gp expression (hollow symbols, right axis). The results obtained for cell monolayers used in a single permeability assay are shown in dark colours, and those obtained for re-used cell monolayers are in light colours.
Disclaimer/Publisher’s Note: The statements, opinions and data contained in all publications are solely those of the individual author(s) and contributor(s) and not of MDPI and/or the editor(s). MDPI and/or the editor(s) disclaim responsibility for any injury to people or property resulting from any ideas, methods, instructions or products referred to in the content. |
© 2024 by the authors. Licensee MDPI, Basel, Switzerland. This article is an open access article distributed under the terms and conditions of the Creative Commons Attribution (CC BY) license (http://creativecommons.org/licenses/by/4.0/).
Copyright: This open access article is published under a Creative Commons CC BY 4.0 license, which permit the free download, distribution, and reuse, provided that the author and preprint are cited in any reuse.


