Submitted:
28 May 2024
Posted:
29 May 2024
You are already at the latest version
Abstract
Expression of the breast cancer resistance protein (BCRP/ ABCG2) transporter is downregulated in placentas from women with preeclampsia (PE) and in an immunological rat model of PE, which closely resembles human PE. While many drugs are substrates of this important efflux transporter, the impact of BCRP downregulation on maternal and fetal drug exposure has not been investigated. Using the PE rat model, we performed a pharmacokinetic study with rosuvastatin (RSV), a BCRP substrate, to investigate this impact. PE was induced in rats during gestational days (GD) 13 to 16 with daily low-dose endotoxin. On GD18, RSV (3 mg/kg) was administrated intravenously, and rats were sacrificed at time intervals between 0.5-6 hours. Placental expression of Bcrp and Oatp2b1 significantly decreased in PE rats. A corresponding increase in RSV levels was seen in fetal tissues and amniotic fluid of the PE group (p<0.05), while maternal plasma concentrations remained unchanged. An increase in Bcrp expression and decreased RSV concentration, was seen in the livers of PE dams. This suggests that PE-mediated transporter dysregulation leads to significant changes in the maternal and fetal RSV disposition. Overall, our findings demonstrate that altered placental expression of transporters in PE can increase fetal accumulation of their substrates.
Keywords:
breast cancer resistance protein
; preeclampsia
; pharmacokinetic
; pregnancy
; transporters
1. Introduction
The use of medications during pregnancy is progressively increasing, with more than half of pregnant women reporting the use of either prescription or over-the-counter drugs during gestation [1]. Due to physiological changes that occur during pregnancy, the pharmacokinetics of commonly used medications can be altered. Some of these modifications include increases in cardiac output, total body water, fat compartment, renal blood flow, and alterations in plasma albumin and CYP450 activity [2]. Pharmacokinetics can be further altered by pathophysiologic states. For instance, preeclampsia (PE) patients have significantly lower levels of albumin, which can lead to decreased plasma protein binding and altered distribution of drugs [3]. As PE affects 3-8% of pregnant women worldwide and is the leading cause of maternal and fetal morbidity [4], it is essential to have a comprehensive understanding of the pharmacokinetic alterations caused by PE and the possible adverse effects on the developing fetus. There is a lack of knowledge regarding the impact of maternal diseases, such as PE, on drug disposition. Insufficient understanding of the factors that may alter maternal and fetal drug exposure can pose significant risks to both mothers and fetuses.
Many drugs can cross the placental barrier, hence increasing the risk of fetal exposure and potential teratogenic outcomes. While transporters have been shown to play an important role in fetal drug exposure, we have found that maternal diseases such as HIV and chorioamnionitis are associated with dysregulation of transporters within the placenta [5,6]. Of note, expression of the breast cancer resistance protein (BCRP/ABCG2) was significantly decreased by 60% in placentas obtained from women diagnosed with PE [7]. The apical expression of BCRP in syncytiotrophoblast cells limits fetal exposure to drugs and xenobiotics by effluxing them back into the maternal circulation. Indeed, studies have shown that Bcrp knockout mice have 5-fold increased fetal exposure to the Bcrp substrate nitrofurantoin as compared to wild type mice, thus demonstrating the protective role of BCRP in limiting fetal exposure to xenobiotics [8]. A decrease in placental BCRP expression can result in the accumulation of BCRP substrates on the fetal side, leading to potential teratogenic effects. In addition to BCRP, P-glycoprotein (ABCB1), and organic anion transporting polypeptide 2B1 (OATP2B1/ SLCO2B1) are also highly expressed in human placentas and play a crucial protective function in fetal development [9]. These transporters have also been observed to be dysregulated in the placentas of patients with PE, although to a lesser extent [7,10,11].
While PE patients generally require drug therapy to manage their disease, many therapeutic agents are substrates of BCRP. For example, nifedipine, commonly used in PE patients to control hypertension, is a substrate for BCRP [12]. As a pronounced decrease in BCRP expression was seen in PE women, our aim was to examine the impact of PE on maternal and fetal exposure to drug substrates. We recently established and characterized an immunological rodent model of PE that demonstrated downregulation of placental Bcrp similar to human PE, along with comparable phenotypic changes such as proteinuria and immune activation [13]. Rosuvastatin (RSV) is a BCRP substrate recommended by FDA for in vivo studies as it undergoes minimal metabolism (<10%) and has limited permeability via passive diffusion [14,15]. Besides BCRP, RSV is also transported by OATP2B1 in the intestine and by the liver-specific OATP1B1, and OATP1B3 transporters [16]. Using this immunological model of PE, we conducted a comprehensive pharmacokinetic and biodistribution study of RSV in PE and control dams after IV administration. As our ability to perform pharmacokinetic studies in pregnant women is limited due to ethical considerations, in vivo studies in preclinical animal models can help us understand how diseases such as PE can alter maternal and fetal drug exposure. This could ultimately assist in the development of therapeutic guidelines for the management of maternal diseases.
2. Materials and Methods
2.1. Animals
All animal studies were approved by the Office of Research Ethics at the University of Toronto and conducted in accordance with the guidelines of the Canadian Council on Animal Care. Timed pregnant Sprague-Dawley rats (Charles River Laboratories) were received on GD11 and housed using a 12-hour light-dark cycle with free access to water and food. The model of PE was previously established and characterized in our laboratory [13]. Briefly, pregnant rats were injected intraperitoneally with 0.01-0.04 mg/kg of endotoxin (lipopolysaccharide, Escherichia coli serotype 0111:B4; Sigma-Aldrich) or saline between GD13 and GD16. Urine was collected on GD13, 16, and 17 immediately before endotoxin injections.
On GD18, RSV (3mg/kg) was administrated intravenously via tail vein in control (CT) and PE rats. After 0.5h, 2.5h, 4h, and 6h, rats were anesthetized and sacrificed. Time points were chosen based on a pilot pharmacokinetic study that examined the plasma concentration of RSV in healthy pregnant rats from 0.25h to 8h. Pilot study results found that the concentration of RSV in maternal plasma was below the detection limit (1 ng/ml) at 8 hours while levels in fetal tissues and amniotic fluid were below the detection limit at 0.25, 6, and 8 hr. Thus, based on this time-concentration data, we chose to examine RSV distribution at 0.5, 2.5, 4, and 6 hr. Cardiac puncture was used to collect maternal blood, followed by centrifugation at 1500g and 4oC to isolate plasma. Maternal plasma, livers, kidneys, placentas, fetuses, and amniotic fluid were collected, snap-frozen in liquid nitrogen, and stored at -80oC for future analysis. Each time point included 3 animals per group.
2.2. Plasma and Urine Analysis
In order to confirm the development of disease in the PE groups, we measured the maternal plasma protein expression of IL-6 and urinary total protein levels. Protein expression of IL-6 in maternal plasma was quantified using the rat IL-6 Quantikine ELISA Kit (#R600B, R&D Systems) following the manufacturer’s protocols. Total protein concentrations were measured in collected urine using a protein assay (Bio-Rad Laboratories) and were normalized against total urinary creatinine concentration using a Creatinine Colorimetric Assay Kit (Cayman Chemical Company).
2.3. Quantitative Real-Time Polymerase Chain Reaction (qPCR) Analysis
Previously reported PE-mediated changes in transporter mRNA expression were confirmed via qPCR. as previously described [13]. Briefly, total RNA was isolated from tissues using TRIzol reagent (Invitrogen) according to the manufacturer’s instructions. RNA concentration and purity were measured by a NanoDrop 1000 spectrometer (Thermo Fisher Scientific). Isolated RNA was treated with DNase I (Thermo Fisher Scientific) and reverse transcribed to cDNA using a High-Capacity cDNA RT Kit (Applied Biosystems). The cDNA was quantified using the Power SYBR Green detection system (ABI 7900HT). Primer sequences have been previously published [13].
2.4. Protein Binding Assay
Protein binding of RSV was determined in plasma samples obtained from PE and control dams at 0.5 hr after administration of RSV (n = 4/group). A previously described ultrafiltration (UF) method was used, with slight modifications [17]. UF units (Ultrafree-MC regenerated cellulose membrane, MWCO 10K) were purchased from Millipore (Bedford, MA). Briefly, UF units were pretreated with 25uL of 5% Tween 80 for 5 mins and were centrifuged for 10 mins at 3000g. 200uL PBS was used to wash the membrane. Plasma samples were then added to the pretreated filter membrane and incubated for 1h at room temperature. Plasma samples were centrifuged at 3000g for 20 mins to collect 200uL of filtrate. The internal standard was added to filtrate samples and subsequently analyzed by LC-MS-MS as described below.
2.5. Sample Preparation
The method of sample preparation has been previously described [18]. Briefly, 100uL of internal standard solution (1000 ng/mL carbamazepine in methanol) was added to 100uL PE and control plasma samples and vortexed. Subsequently, 4mL of ethyl acetate was added for extraction, followed by vortexing at 2000rpm for 5 min. Samples were centrifuged for 5 min at 8000g, and the upper organic phase was transferred to another glass vial, evaporated to dryness under a nitrogen evaporator and the residue reconstituted in 200uL of 0.5% acetic acid in water/methanol (50:50, v/v). Samples were transferred to glass 250 µl autosampler vial inserts and 40 µl of samples were injected into the chromatographic system.
For tissue samples, approximately 200~300mg of fetus, placenta, liver and kidney were homogenized with 1.1 mL of 1M acetic acid/methanol (50:50, v/v). After homogenization, 100uL of 0.5% acetic acid, 600uL of 0.5% tetrabutyl ammonium hydroxide, and 100uL of internal standard solution was added and samples were extracted and prepared similar to that described for plasma. Standard curves for RSV concentrations were prepared using plasma and tissues from non-treated pregnant rats.
2.6. Measurement of RSV Concentrations Using LC-MS-MS
The concentration of RSV in rat plasma, placenta, fetal tissues, amniotic fluid, and maternal tissues were measured using LC-MS-MS as described by Lan et al [18]. A mobile phase for HPLC consisting of methanol and 2% formic acid in water (80:20, v/v) was delivered at a flow rate of 0.55mL/min. A ZORBAX Eclipse XDB-C18 column 5um (4.6x150mm) was maintained at a temperature of 20oC. The injection volume was 40uL. Chromatographic peaks were evaluated using the Agilent ChemStation software. The mass spectrometer (Agilent 1100 HPLC system) was operated in the positive ion mode, and the TurboIonspray heater was set at 450oC. The specific transition m/z 482→258 amu was employed for analyzing RSV, with a dwell time of 200ms. For the internal standard, carbamazepine, the mass transition m/z 237→194 was used with the same dwell time. The ionspray voltage was set to 5000V, the decluster potential was set to 120V and the collision energy to 25V. The collision cell exit potential was 5V. The nebulizer gas pressure and curtain gas pressure were set to 8 and 7 psi, respectively, at 550oC. The retention time was set at 3.38 min and 3.53 for RSV and internal standard separately. The lower limit of quantification of RSV was 1 ng/ml in plasma and amniotic fluid and 0.4 ng/gram in tissues.
2.7. Data Analysis
Pharmacokinetic parameters were estimated by noncompartmental analysis using PKsolver (Yong et al., 2014). All results are presented as mean ± standard deviation (S.D.) Statistical significance between PE and controls was measured by GraphPad Prism8 using a two-tailed Student’s t-test for unpaired experimental values. Significance was set to p < 0.05.
3. Results
3.1. Confirmation of PE and Transporter Downregulation in PE rats
We confirmed PE-associated phenotypic disease characteristics and transporter changes in samples obtained from the dams used for our pharmacokinetic study. There was an elevation in urine protein levels from the PE rats on GD16, 3 days after beginning endotoxin injections on GD13 (Figure S1A). The urinary ratio of total protein to creatinine was significantly higher in the urine of PE rats on GD16 and 18, while no difference was detected on GD13. Relative plasma concentrations of albumin were decreased by approximately 20 % in the PE group (Control: 100±23% versus PE: 77.8±14 %; p <0.05). In addition, significantly elevated levels of IL-6 were detected in the maternal plasma of PE rats on GD18 (Figure S1B).
3.2. RSV Plasma Protein Binding
Maternal plasma samples from CT and PE rats at 0.5h post-injection were used to assess plasma protein binding of RSV as the highest plasma concentrations were detected at this time point. The total plasma concentrations of RSV in CT rats and PE rats at 0.5 h were 640 ±40 ng/mL and 650 ± 40 ng/ml, respectively. We observed 10.6 ±0.6 % unbound RSV in CT dams, and 11 ±1.6 % unbound RSV in PE dams. There was no significant difference between the two groups.
3.3. Pharmacokinetic Parameters of RSV in Maternal and Fetal Compartments
Concentration-time profiles for RSV in the maternal plasma and fetal tissue of PE and control dams are graphically represented in Figure 2.
The concentration at time 0 was extrapolated and estimated by PKsolver using noncompartmental analysis. Although the maternal plasma concentration-time profile was similar in CT rats and PE rats, the RSV concentration-time profile showed significantly higher fetal concentrations of RSV in PE group at 4h. RSV concentrations and calculated AUCs in placenta, maternal liver, maternal kidney, and fetal amniotic fluid are shown in Table 1.
Higher RSV concentrations were seen in the fetal tissue and amniotic fluid of PE dams while RSV concentrations were deceased. As shown in Table 2, the relative ratios of RSV AUC(0-6h) and AUC(0-4h) in PE to CT dams were 1.12 and 0.66 for amniotic fluid and liver, respectively.
3.4. PE Promotes RSV Accumulation in the Fetal Compartment
The concentrations of RSV in the placenta, fetus, and amniotic fluid of individual fetal units were normalized to RSV concentrations of maternal plasma obtained at the same time from the same dam and the tissue:plasma concentration ratios are shown in Figure 3.
PE was associated with a significantly increased accumulation of RSV in both the fetus and the amniotic fluid. As compared to CT, the ratio of RSV concentration in the fetus to plasma was 67% higher in the PE group at 4h and 40% higher at 6h (p<0.05). Likewise, 40% more RSV was found in PE amniotic fluid than in CT at 4h (p<0.05). In the placenta, the ratio of RSV concentration was found to be similar in both PE dams (Figure S2).
3.5. Lower RSV Concentration in the Maternal Liver of PE rats
Tissue: plasma concentration ratios of RSV for maternal liver and kidney, are shown in Figure 4.
In the maternal kidney, the ratio of RSV concentration was comparable in both CT and PE dams. However, in the maternal liver, at 2.5h and 4h, the RSV concentration was around 40-60% lower in PE rats as compared to CT rats, and no significant differences were seen at 0.5h and 6h.
4. Discussion
Overall, our current study demonstrated that PE-mediated changes in Bcrp expression in pregnant rats are associated with the altered maternal and fetal disposition of the Bcrp substrate, RSV. This immunological rat model of PE has been previously characterized and has many phenotypic similarities to human PE [19,20], including PE-associated changes in placental transporters [7,13]. Characterization of phenotypic changes in this current study demonstrated elevated plasma concentrations of IL-6, proteinurea, and decreased placental expression of Bcrp in PE dams which were consistent with previous reports [13,19,20].
HMG-CoA reductase inhibitors, also known as statins, are a class of drugs that are used to treat hypercholesterolemia by lowering the amount of cholesterol in the blood [21]. The HMG-CoA reductase inhibitor, RSV, is recommended by the FDA for use as a BCRP substrate drug in clinical studies [14]. In both humans and rodents, RSV has a relatively low oral bioavailability (0.05-0.2), and is actively transported into the liver and excreted in the bile, mostly in its original form [22]. In humans, almost 70% of its total clearance is attributed to its hepatic elimination, with only minor metabolic clearance [23]. BCRP has been shown to transport RSV both in vitro and in vivo and is primarily responsible for the secretion of RSV into bile [16,24]. Indeed, studies in knockout mice have confirmed that BCRP plays an important role in RSV disposition [21,25]. RSV has limited permeability via passive diffusion and uptake occurs primarily through the organic anion transporters including OATP2B1 and the liver-specific OATP1B1 and OATP1B3 transporters [26]. During the hepato-biliary elimination process, OATP1B1/3 is responsible for the hepatic uptake of RSV from the systemic circulation while BCRP is involved in the active secretion of RSV from hepatocytes into bile [16].
Our study demonstrated that PE was associated with 40-70% increased fetal: maternal plasma concentration ratios of RSV, as well as a 40% higher amniotic fluid:maternal concentration ratio. These findings indicate that PE-mediated changes result in an increased accumulation of RSV in fetal tissues. Likewise, the higher AUCs and lower clearance values observed in the fetus and amniotic fluid of the PE rats indicate increased fetal drug accumulation. The plasma protein binding of RSV is estimated to be 88% and this occurs through binding to albumin [15]. Multiple studies have reported that PE is associated with reduced plasma albumin levels [3,27,28]. Previous characterization of the PE model using proteomic analysis detected both a % 20 decrease in levels of albumin and 200% increase in levels of alpha-one glycoprotein in PE rats [13]. Despite these changes, we found that plasma protein binding of RSV was not significantly different between PE and control dams and therefore unlikely to be responsible for altered tissue disposition. Therefore, we believe that the increased fetal accumulation of RSV occurs through changes in the placental expression of Bcrp and Oatp2b1.
Decreased placental expression of Bcrp is likely to cause increases in the placental and fetal accumulation of its substrates. Located on the apical side of the snycytiotrophoblast, BCRP transports substrates from the fetal to the maternal compartment, limiting the uptake of xenobiotics into the placenta thereby decreasing fetal exposure. Previous research demonstrated that co-administration of the BCRP inhibitor GD120918 resulted in a 2-fold rise in the fetal tissue/maternal plasma concertation ratio of topotecan in pregnant mice as compared to those receiving topotecan alone [29]. Similarly, the AUC ratios of fetal tissue/maternal plasma for nitrofurantoin and glyburide, were respectively found to be approximately four and two times greater, in Abcg2-/- mice as compared to wide-type mice [30,31]. Since RSV is primarily transported by BCRP, the decreased expression of Bcrp in PE placenta is likely to be a major contributor to the increased fetal accumulation of RSV.
Likewise, the observed downregulation of Oatp2b1 seen in PE placenta could also contribute to altered fetal drug exposure. OATP2B1, located on the basal membrane of the syncytiotrophoblast, mediates the uptake of drugs in the fetal-to-maternal direction and therefore plays a role in removing its substrates from the fetal compartment. Thus, decreased expression would decrease fetal clearance and increase fetal accumulation of its substrates. As RSV is a substrate of OATP2B1, the downregulation of Oatp2b1 in PE rat placentas likely contributes to the increased fetal accumulation of RSV. Indeed, it is well recognized that OATP2B1 and BCRP collaborate to facilitate the fetal-to-maternal transfer of their steroid sulfate substances across the placenta [10].
Another key finding in this study was the significantly lower hepatic concentrations and liver:plasma concentration ratio of RSV in PE dams. As RSV is a substrate for the BCRP and OATP transporters, decreased hepatic levels of RSV could stem from PE-mediated changes in hepatic expression of either Bcrp or Oatp1b2. In rats, Oatp1b2 is homologous to human OATP1B1/3 and this isoform has been shown to transport RSV [32]. Thus, the observed decrease in Oatp1b2 expression in PE could result in decreased hepatic uptake of RSV. However, decreased hepatic uptake would also result in increased plasma concentration of RSV, which was not seen. On the other hand, the increased expression of Bcrp in PE dams could account for decreased hepatic drug concentrations and would not be associated with increased plasma drug concentrations. Hence, increased hepatic expression of BCRP in PE rats is likely responsible for the observed decreases in hepatic RSV accumulation.
In conclusion, our study provides evidence of altered maternal and fetal disposition of RSV in a well-characterized rodent model of PE; and changes could be primarily attributed to dysregulation of the Bcrp and Oatp transporters. Individuals diagnosed with PE are commonly prescribed antihypertensives, anticonvulsants, or corticosteroids to manage the progression of PE or other co-existing conditions. As many clinically important drugs are substrates of BCRP or OATPs, it is essential to consider the potential for increased fetal exposure and drug-disease interactions in the therapeutic management of this disease. Further investigations are warranted to establish clinical implications for PE patients.
Supplementary Materials
The following supporting information can be downloaded at the website of this paper posted on Preprints.org.
Author Contributions
Conceptualization, M.M.; methodology, W.D. and M.M.; software, W.D.; validation, W.D. and M.M.; formal analysis, W.D.; investigation, W.D. and M.M.; resources, M.M.; data curation, W.D.; writing—original draft preparation, W.D.; writing—review and editing, M.M.; visualization, M.M.; supervision, M.M.; project administration, M.M.; funding acquisition, M.M. All authors have read and agreed to the published version of the manuscript.
Funding
This research was funded by the Canadian Institutes of Health Research [Grant PJT-169195].
Institutional Review Board Statement
The animal study protocol was approved by the Office of Research Ethics at the University of Toronto (protocol code 20012896; date of approval 16/08/2022).
Informed Consent Statement
Not applicable.
Data Availability Statement
Data available on request from the authors.
Acknowledgments
The authors have nothing to acknowledge.
Conflicts of Interest
The authors declare no conflicts of interest.
References
- Wesley, B.D.; Sewell, C.A.; Chang, C.Y.; Hatfield, K.P.; Nguyen, C.P. Prescription medications for use in pregnancy–perspective from the US Food and Drug Administration. Am J Obstet Gynecol. 2021, 225, 21–32. [Google Scholar] [CrossRef] [PubMed]
- Pariente, G.; Leibson, T.; Carls, A.; Adams-Webber, T.; Ito, S.; Koren, G. Pregnancy-Associated Changes in Pharmacokinetics: A Systematic Review. PLoS Med. 2016, 13, 1–36. [Google Scholar] [CrossRef] [PubMed]
- Al Ghazali, B. ; Ahlam; Al-Taie, A.H.; Raheem; Hameed, J. Study of the Clinical Significance of Serum Albumin Level in Preeclampsia and in the Detection of Its Severity. Vol 2.; 2014.
- Abalos, E.; Cuesta, C.; Grosso, A.L.; Chou, D.; Say, L. Global and regional estimates of preeclampsia and eclampsia: A systematic review. European Journal of Obstetrics and Gynecology and Reproductive Biology. 2013, 170, 1–7. [Google Scholar] [CrossRef] [PubMed]
- Kojovic, D.; Ghoneim, R.H.; Serghides, L.; Piquette-Miller, M. Role of HIV and Antiretroviral Therapy on the Expression of Placental Transporters in Women with HIV. AAPS Journal. 2020, 22. [Google Scholar] [CrossRef] [PubMed]
- Petrovic, V.; Kojovic, D.; Cressman, A.; Piquette-Miller, M. Maternal bacterial infections impact expression of drug transporters in human placenta. Int Immunopharmacol. 2015, 26, 349–356. [Google Scholar] [CrossRef] [PubMed]
- Kojovic, D.V.; Workewych, N.; Piquette-Miller, M. Role of Elevated SFLT-1 on the Regulation of Placental Transporters in Women With Pre-Eclampsia. Clin Transl Sci. 2020, 13, 580–588. [Google Scholar] [CrossRef] [PubMed]
- Zhou, L.; Naraharisetti, S.B.; Wang, H.; Unadkat, J.D.; Hebert, M.F.; Mao, Q. The breast cancer resistance protein (Bcrp1/Abcg2) limits fetal distribution of glyburide in the pregnant mouse: An Obstetric-Fetal Pharmacology Research Unit Network and University of Washington Specialized Center of Research Study. Mol Pharmacol. 2008, 73, 949–959. [Google Scholar] [CrossRef] [PubMed]
- Yamashita, M.; Markert, U.R. Overview of drug transporters in human placenta. Int J Mol Sci. 2021, 22. [Google Scholar] [CrossRef] [PubMed]
- Grube, M.; Reuther, S.; Meyer Zu Schwabedissen, H.; et al. Organic anion transporting polypeptide 2B1 and breast cancer resistance protein interact in the transepithelial transport of steroid sulfates in human placenta. Drug Metabolism and Disposition. 2007, 35, 30–35. [Google Scholar] [CrossRef]
- Mao, Q. BCRP/ABCG2 in the placenta: Expression, function and regulation. Pharm Res. 2008, 25, 1244–1255. [Google Scholar] [CrossRef]
- Aali, B.S.; Nejad, S.S. Nifedipine or hydralazine as a first-line agent to control hypertension in severe preeclampsia. Acta Obstet Gynecol Scand. 2002, 81, 25–30. [Google Scholar] [CrossRef] [PubMed]
- Dai, W.; Pollinzi, A.; Piquette-Miller, M. Use of Traditional and Proteomic Methods in the Assessment of a Preclinical Model of Preeclampsia. Drug Metabolism and Disposition. Published online June 7, 2023:DMD-AR-2022-001080. 7 June. [CrossRef]
- FDA. Drug Development and Drug Interactions | Table of Substrates, Inhibitors and Inducers.
- Luvai, A.; Mbagaya, W.; Hall, A.S.; Barth, J.H. Rosuvastatin: A review of the pharmacology and clinical effectiveness in cardiovascular disease. Clin Med Insights Cardiol. 2012, 6, 17–33. [Google Scholar] [CrossRef] [PubMed]
- Kitamura, S.; Maeda, K.; Wang, Y.; Sugiyama, Y. Involvement of multiple transporters in the hepatobiliary transport of rosuvastatin. Drug Metabolism and Disposition. 2008, 36, 2014–2023. [Google Scholar] [CrossRef] [PubMed]
- Toma, C.M.; Imre, S.; Vari, C.E.; Muntean, D.L.; Tero-Vescan, A. Ultrafiltration Method for Plasma Protein Binding Studies and Its Limitations. Processes. 2021, 9, 382–382. [Google Scholar] [CrossRef]
- Lan, K.; Jiang, X.; Li, Y.; et al. Quantitative determination of rosuvastatin in human plasma by ion pair liquid-liquid extraction using liquid chromatography with electrospray ionization tandem mass spectrometry. J Pharm Biomed Anal. 2007, 44, 540–546. [Google Scholar] [CrossRef] [PubMed]
- Cotechini, T.; Hopman, W.J.; Graham, C.H. Inflammation-induced fetal growth restriction in rats is associated with altered placental morphometrics. Placenta. 2014, 35, 575–581. [Google Scholar] [CrossRef] [PubMed]
- Hu, B.; Yang, J.; Huang, Q.; Bao, J.; Brennecke, S.P.; Liu, H. Cyclosporin A significantly improves preeclampsia signs and suppresses inflammation in a rat model. Cytokine. 2016, 81, 77–81. [Google Scholar] [CrossRef] [PubMed]
- Kitamura, S.; Maeda, K.; Wang, Y.; Sugiyama, Y. Involvement of multiple transporters in the hepatobiliary transport of rosuvastatin. Drug Metabolism and Disposition. 2008, 36, 2014–2023. [Google Scholar] [CrossRef] [PubMed]
- Nezasa, K.; Takao, A.; Kimura, K.; Takaichi, M.; Inazawa, K.; Koike, M. Pharmacokinetics and disposition of rosuvastatin, a new 3-hydroxy-3-methylglutaryl coenzyme A reductase inhibitor, in rat. Xenobiotica. 2002, 32, 715–727. [Google Scholar] [CrossRef]
- Martin, P. Absolute oral bioavailability of rosuvastatin in healthy white adult male volunteers. Clin Ther. 2003, 25, 2553–2563. [Google Scholar] [CrossRef]
- Keskitalo, J.E.; Zolk, O.; Fromm, M.F.; Kurkinen, K.J.; Neuvonen, P.J.; Niemi, M. ABCG2 polymorphism markedly affects the pharmacokinetics of atorvastatin and rosuvastatin. Clin Pharmacol Ther. 2009, 86, 197–203. [Google Scholar] [CrossRef] [PubMed]
- Karibe, T.; Hagihara-Nakagomi, R.; Abe, K.; et al. Evaluation of the Usefulness of Breast Cancer Resistance Protein (BCRP) Knockout Mice and BCRP Inhibitor-Treated Monkeys to Estimate the Clinical Impact of BCRP Modulation on the Pharmacokinetics of BCRP Substrates. Pharm Res. 2015, 32, 1634–1647. [Google Scholar] [CrossRef] [PubMed]
- Williams, P.J.; Mistry, H.D.; Morgan, L. Folate transporter expression decreases in the human placenta throughout pregnancy and in pre-eclampsia. Pregnancy Hypertens. 2012, 2, 123–131. [Google Scholar] [CrossRef] [PubMed]
- Don, B.R.; Kaysen, G. Serum albumin: Relationship to inflammation and nutrition. Semin Dial. 2004, 17, 432–437. [Google Scholar] [CrossRef] [PubMed]
- Murphy, M.M.; Scott, J.M.; McPartlin, J.M.; Fernandez-Ballart, J.D. The pregnancy-related decrease in fasting plasma homocysteine is not explained by folic acid supplementation, hemodilution, or a decrease in albumin in a longitudinal study1-3. American Journal of Clinical Nutrition. 2002, 76, 614–619. [Google Scholar] [CrossRef] [PubMed]
- Jonker, J.W.; Smit, J.W.; Brinkhuis, R.F.; et al. Role of Breast Cancer Resistance Protein in the Bioavailability and Fetal Penetration of Topotecan. J Natl Cancer Inst. 2000, 92, 1651–1656 https://academicoupcom/jnci/article/92/20/1651/2905977. [Google Scholar] [CrossRef] [PubMed]
- Zhang, Y.; Wang, H.; Unadkat, J.D.; Mao, Q. Breast cancer resistance protein 1 limits fetal distribution of nitrofurantoin in the pregnant mouse. Drug Metabolism and Disposition. 2007, 35, 2154–2158. [Google Scholar] [CrossRef]
- Zhou, L.; Naraharisetti, S.B.; Wang, H.; Unadkat, J.D.; Hebert, M.F.; Mao, Q. The Breast Cancer Resistance Protein (Bcrp1/Abcg2) Limits Fetal Distribution of Glyburide in the Pregnant Mouse: An Obstetric-Fetal Pharmacology Research Unit Network and University of Washington Specialized Center of Research Study. Mol Pharmacol. 2007, 73, 949–959. [Google Scholar] [CrossRef]
- Cattori, V.; Hagenbuch, B.; Hagenbuch, N.; et al. Identification of organic anion transporting polypeptide 4 (Oatp4) as a major full-length isoform of the liver-specific transporter-1 (rlst-1) in rat liver. FEBS Lett. 2000, 474, 242–245. [Google Scholar] [CrossRef]
Figure 1.
mRNA expression in CT and PE rats used in the pharmacokinetic study. Relative mRNA levels were measured in placenta (A) and liver (B) from CT and PE dams using qRT-PCR and normalized to GAPDH as described in the methods. Data are presented as mean ± S.D. and shown relative to controls (n=12/group). Significance was determined using Student’s unpaired t-test (*p < 0.05, **p<0.01, ***p<0.001).
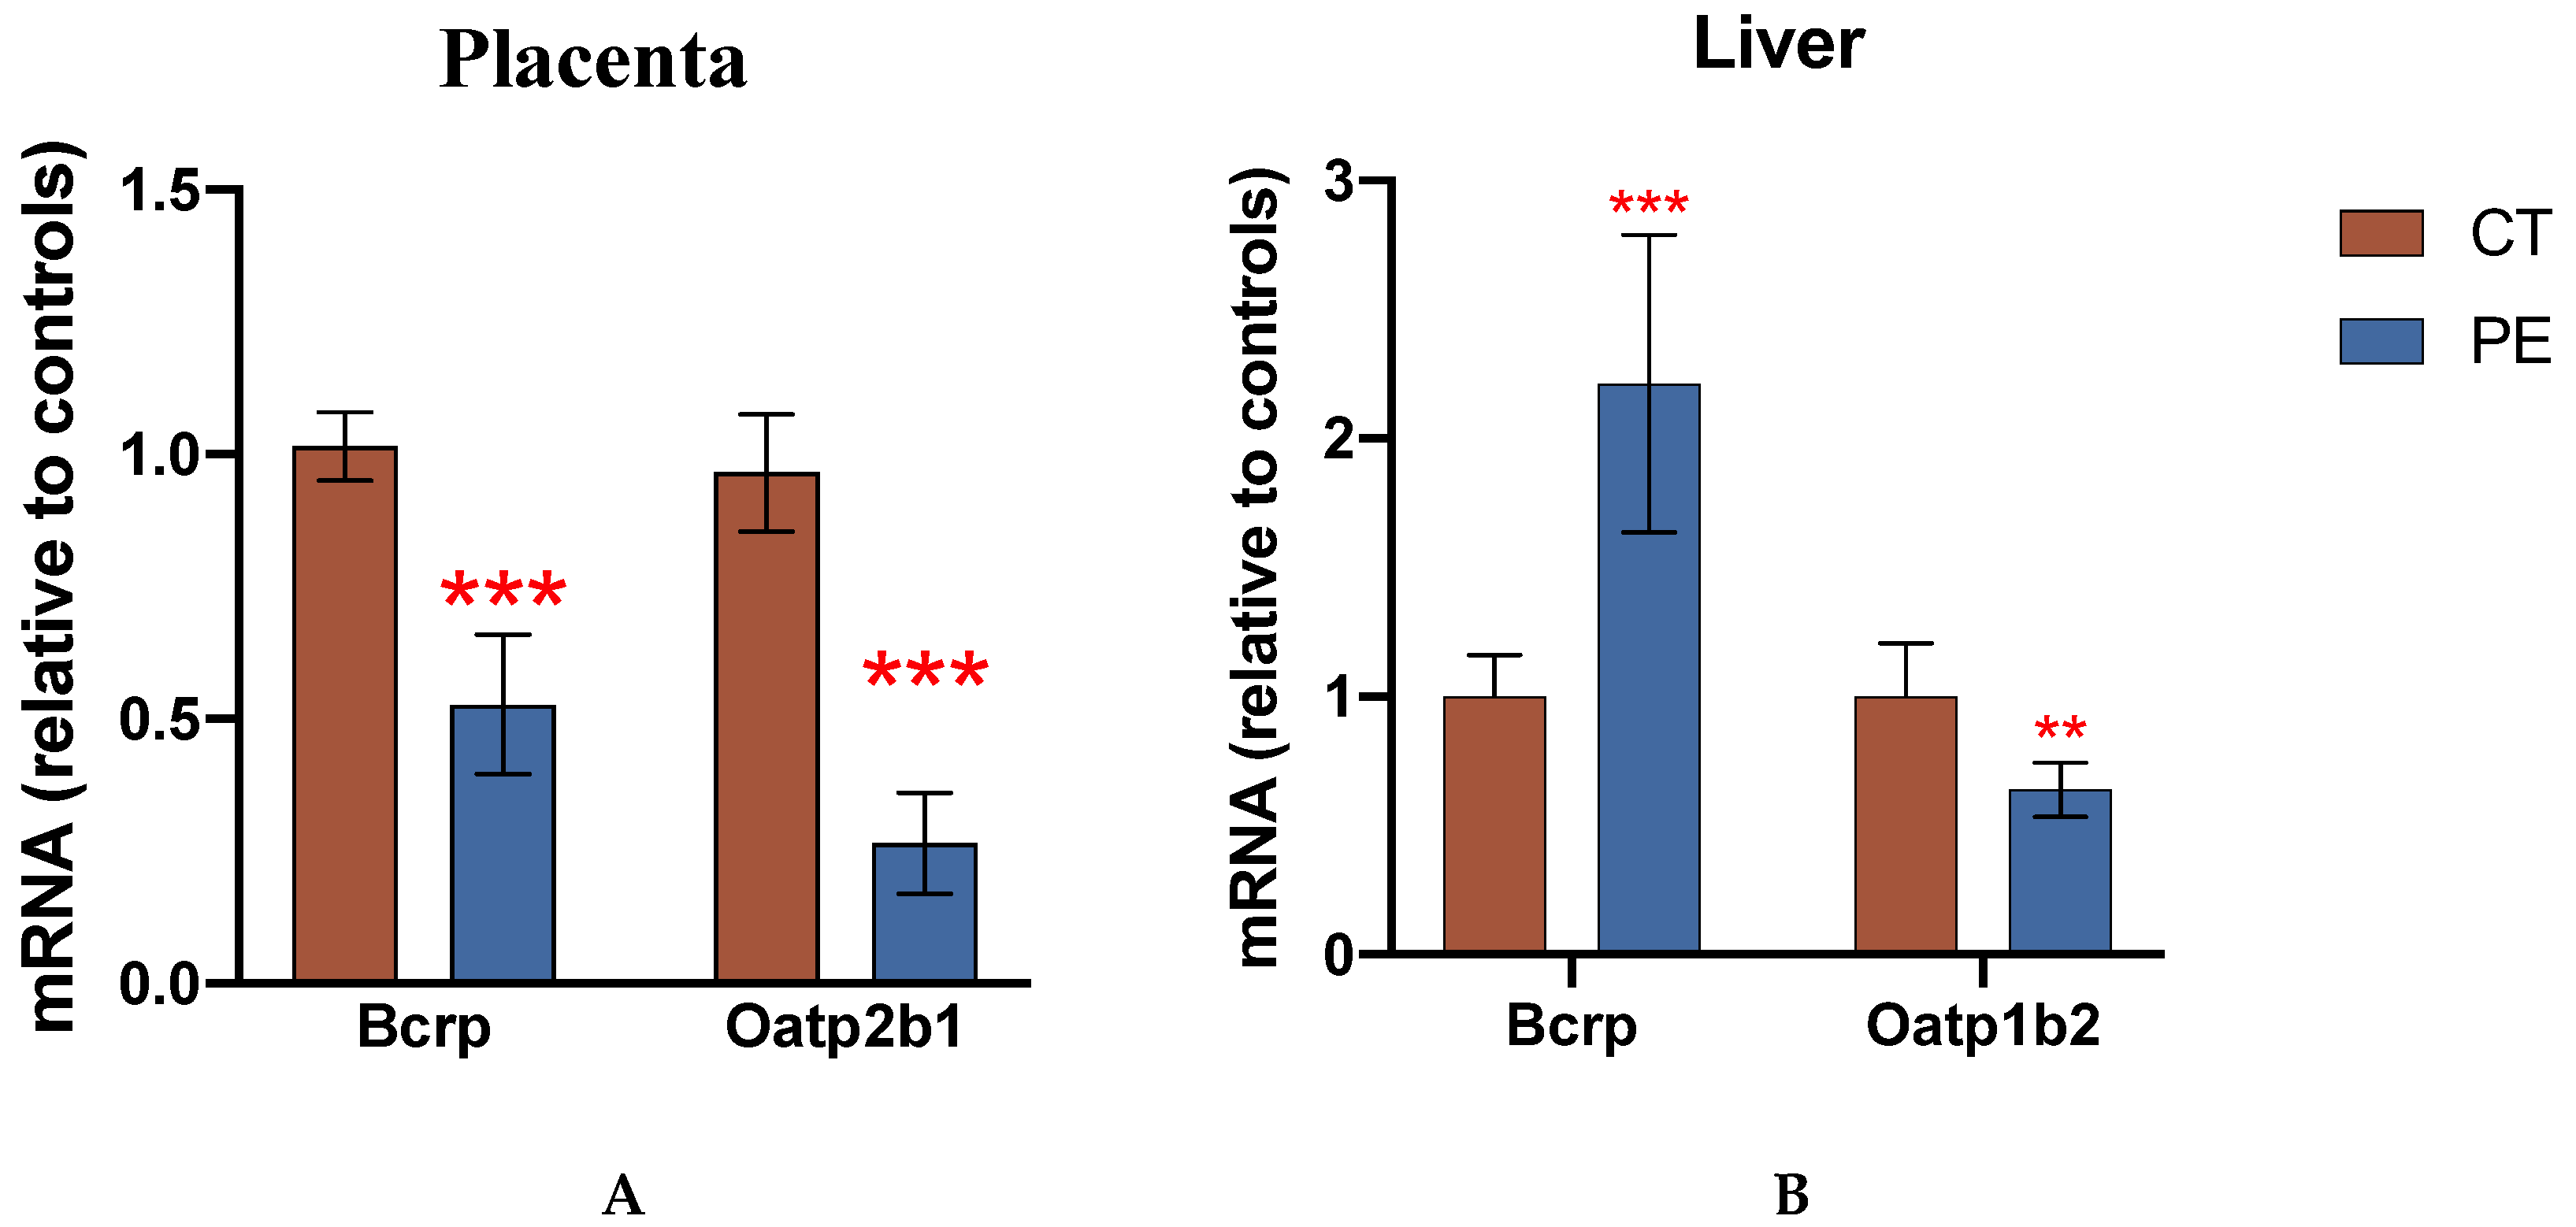
Figure 2.
Concentration-Time Profiles of Rosuvastatin in (A) Maternal Plasma and (B) Fetal Tissue. PE and control dams received a bolus IV dose of RSV (3 mg/kg) and RSV concentrations were determined as described in the methods. Concentrations were extrapolated to time zero using non-compartmental analysis with PKSolver. Values are expressed as the mean ± S.D, (n = 3-4/time point).
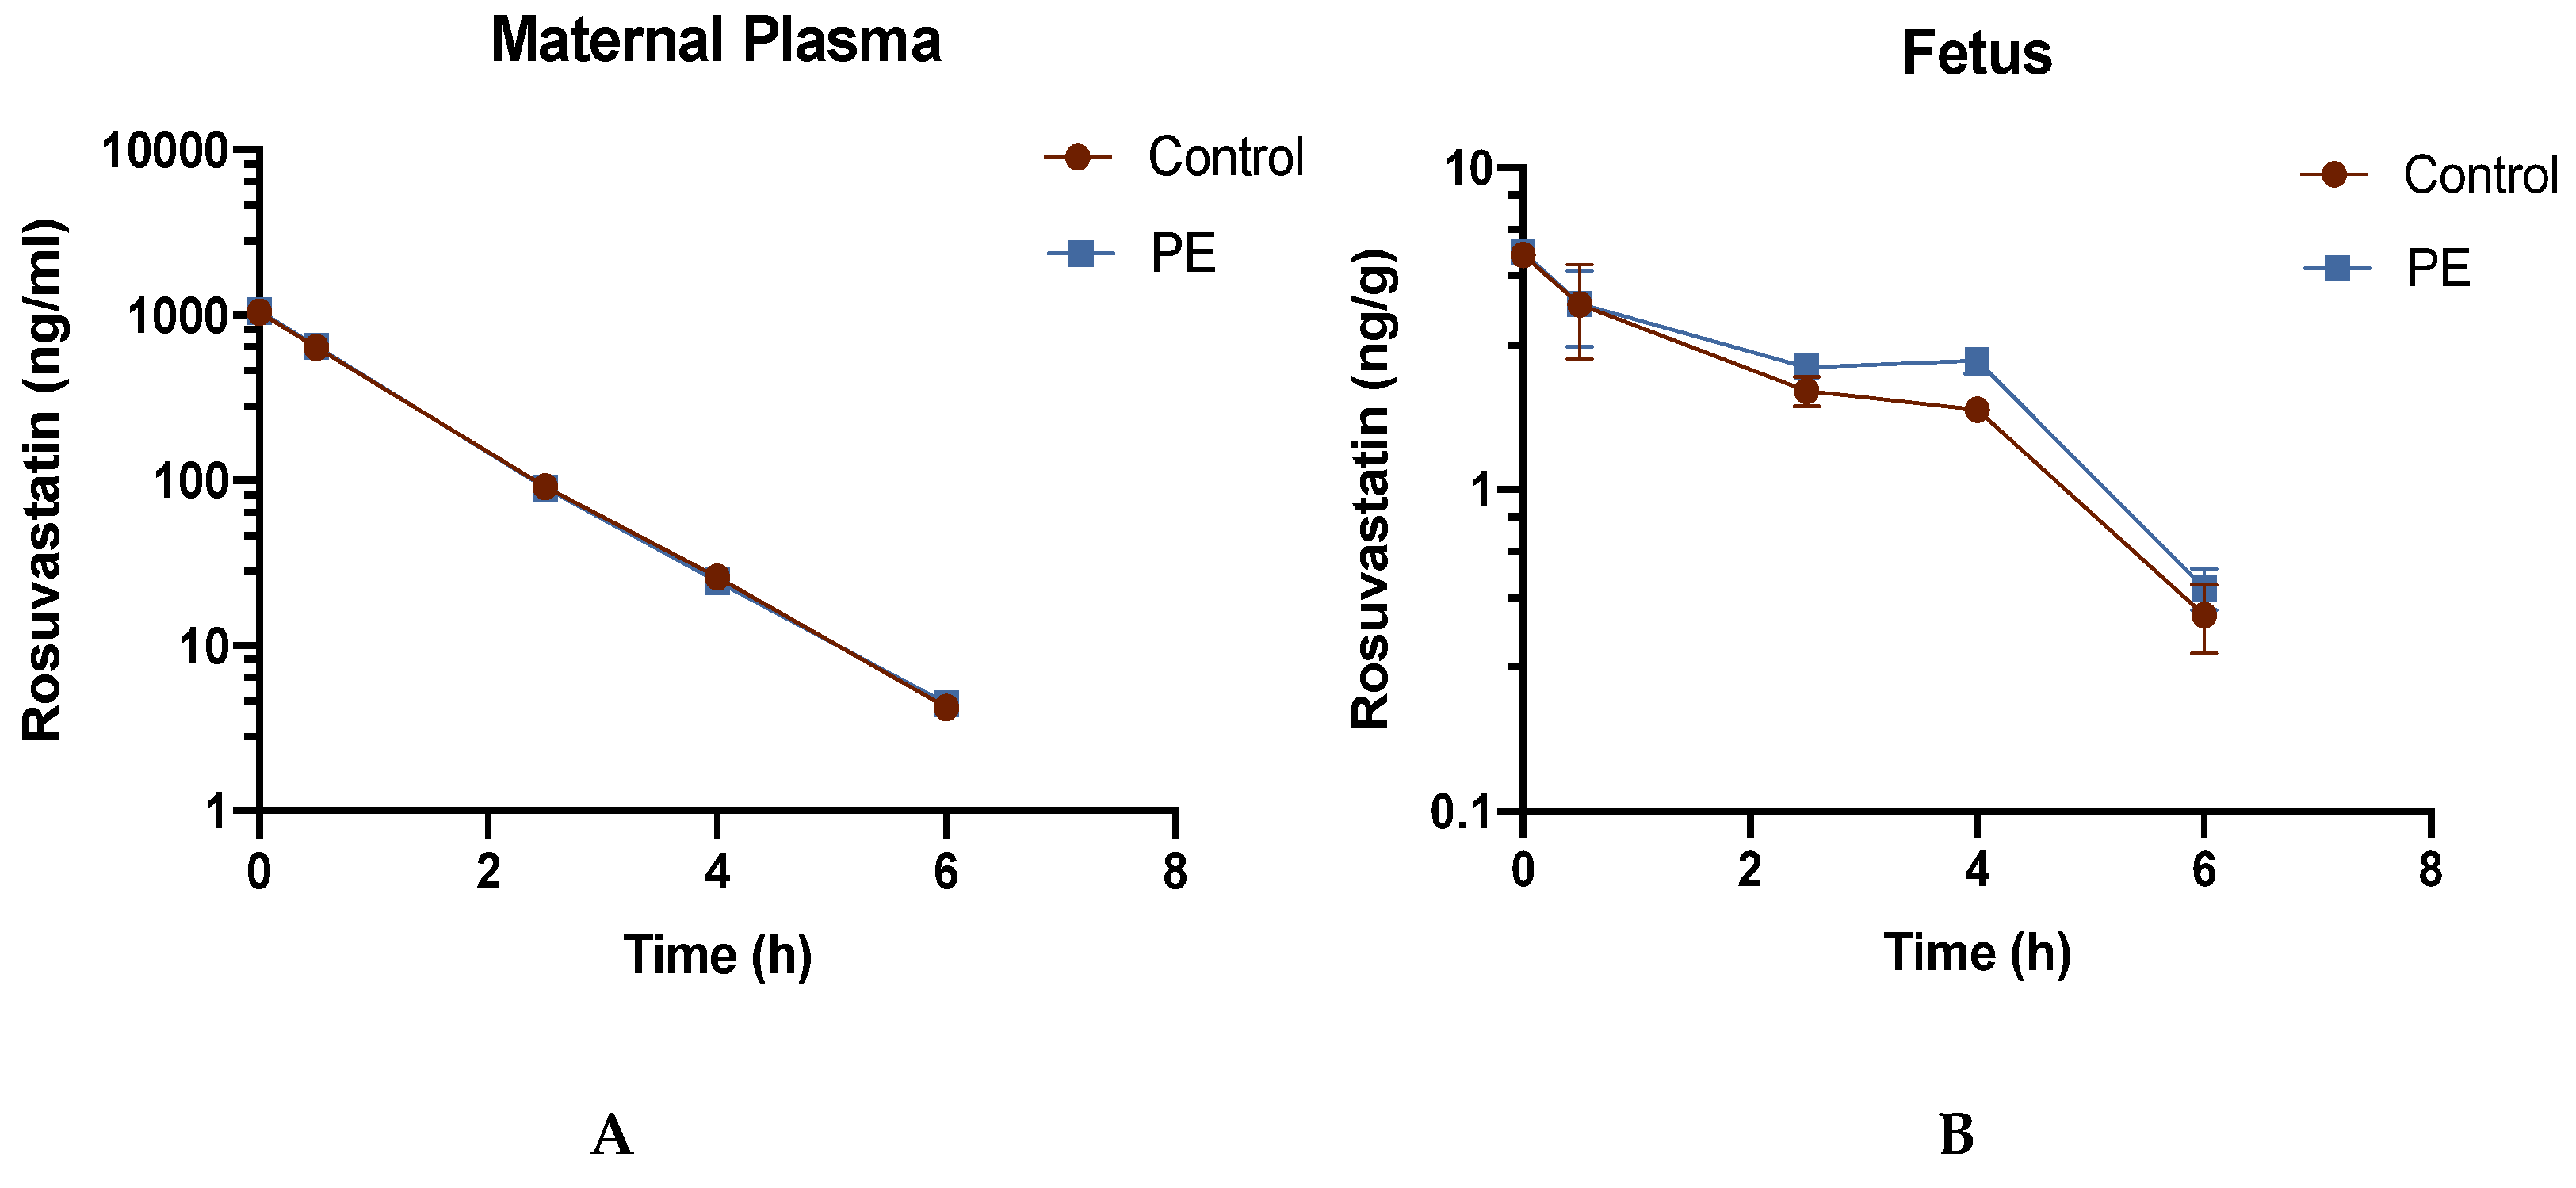
Figure 3.
Rosuvastatin tissue:plasma concentration ratios in (A) fetal tissue and (B) amniotic fluid of control rats and PE rats. The concentrations of RSV in fetal tissues (ng/g) and amniotic fluid (ng/ml) were normalized to the concentration of RSV in maternal plasma (ng/ml) at the same time point and are shown as tissue:plasma concentration ratios (n=3-4/group). RSV concentrations were determined as described in methods and are presented as mean ± S.D. Significance was determined using Student’s unpaired t-test (*p<0.05;**p<0.01).
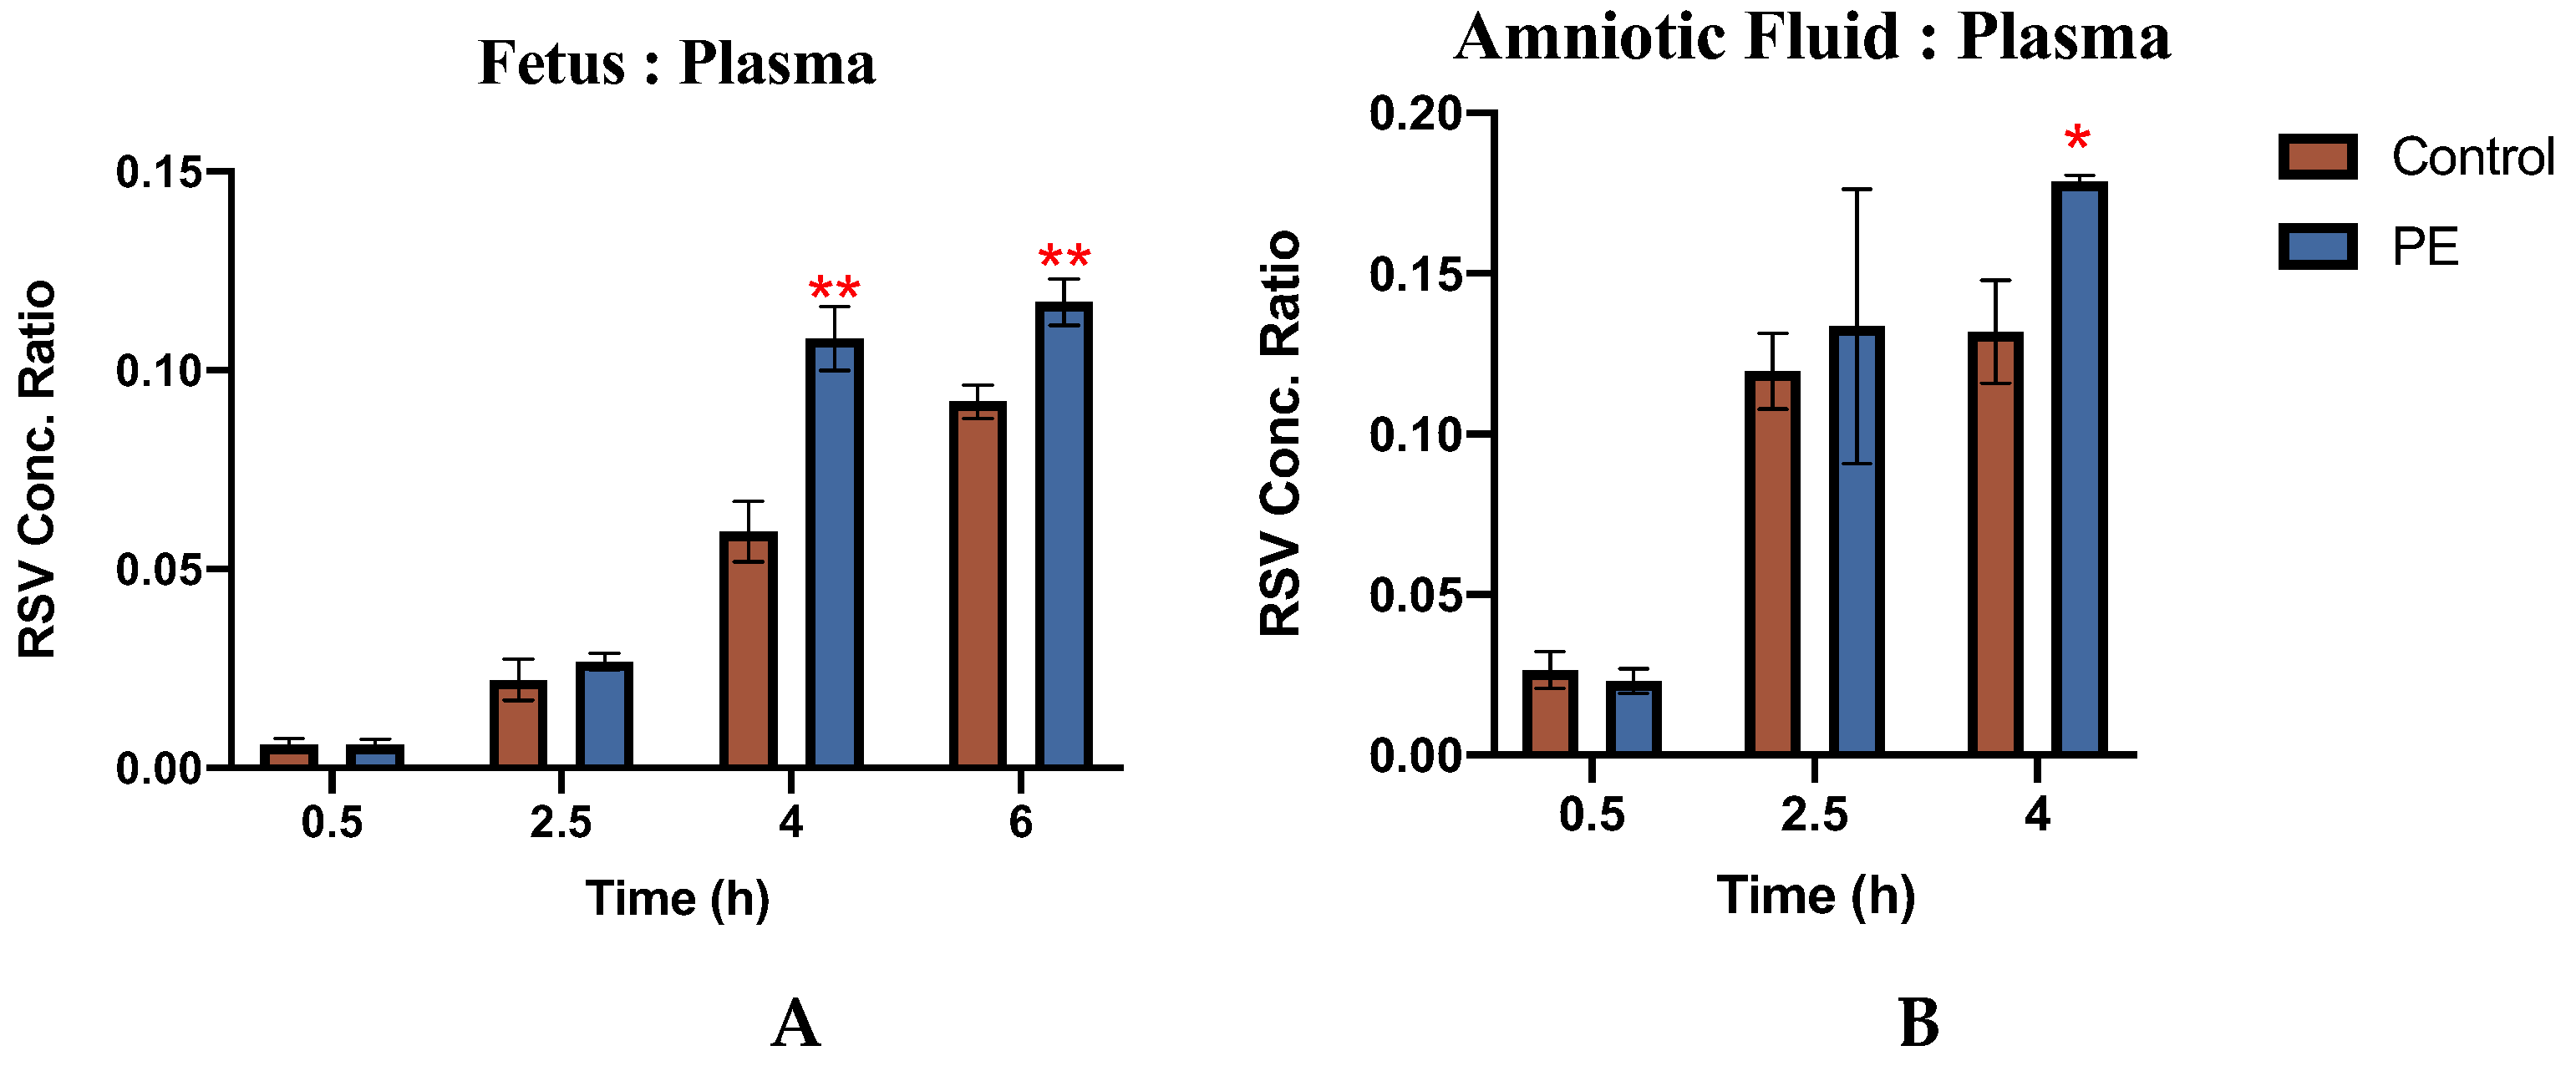
Figure 4.
Rosuvastatin Tissue:Plasma Concentration Ratios in (A) maternal liver and (B) maternal kidney of control rats and PE rats. The concentration of RSV in tissues (ng/g) was normalized to the concentration of RSV in maternal plasma (ng/ml) at the same time point and are shown as tissue:plasma concentration ratios (n=3-4/group). RSV concentrations were determined as described in methods and is presented as mean ± S.D. Significance was determined using Student’s unpaired t-test (*p<0.05, **p<0.01).
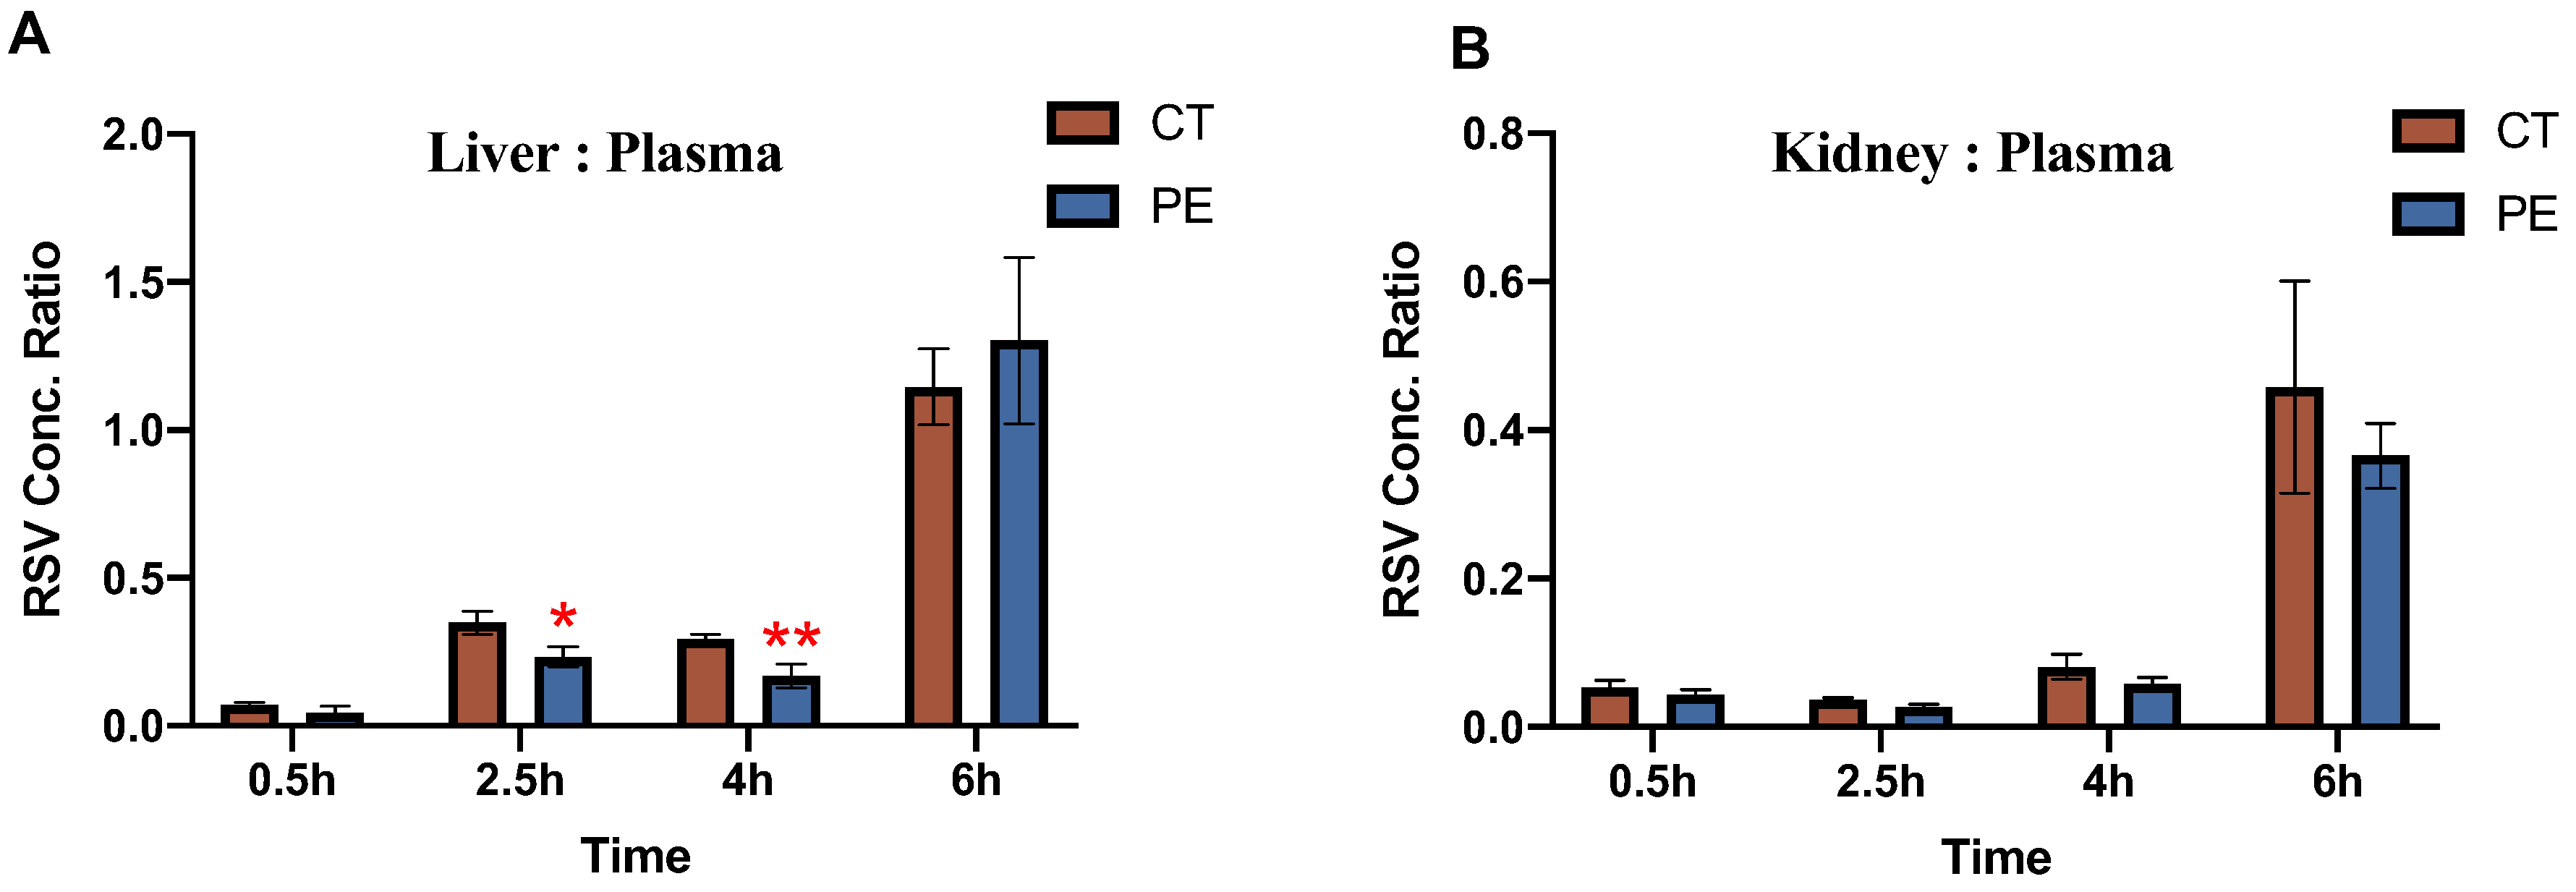

Table 1.
Maternal Pharmacokinetic Parameters in Plasma. Pharmacokinetic parameters of RSV were determined in PE and control dams after bolus IV dose of RSV (3 mg/kg). Concentrations of RSV were determined as described in the methods. The t1/2 (the elimination terminal half-life), AUC (Area under the plasma concentration-time curve), CLtot (total body clearance based on plasma or tissue concentration), and Vdss (apparent volume of disposition at equilibrium) were obtained using non-compartmental analysis with PKSolver. Data are expressed as the mean ± standard deviation, n=3-4/group/time point, *p<0.05 compared to CT.
| Group | t1/2 (h) | AUC(0-6h) (ng*h/mL) | CLtot (mL/min/kg) | Vdss (L/kg) |
|---|---|---|---|---|
| CT | 0.8 (±0.2) |
1270 (±42) |
39 (±3) |
1.9 (±0.1) |
| PE | 0.8 (±0.2) |
1278 (±71) |
39 (±4) |
1.9 (±0.2) |
| PE/CT | 1.02 | 1.00 | 0.99 | 0.98 |
Table 2.
Rosuvastatin Tissue Concentrations. Tissue concentrations of RSV were determined in PE and control dams after a bolus IV dose of RSV (3 mg/kg) and quantitated as described in methods. Data were obtained using non-compartmental analysis with PKSolver. RSV concentration data are expressed as the mean (± SD), n=3-4/group/time point. *p<0.05.
| Time (hr) | Placenta (ng/g) | Amniotic Fluid (ng/ml) | Liver (ng/g) | Kidney (ng/g) | ||||
|---|---|---|---|---|---|---|---|---|
| Control | PE | Control | PE | Control | PE | Control | PE | |
| 0.5 | 70.8 (±9) |
74.6 (±7.3) |
17 (±1) |
17 (±4) |
46.3 (±7.4) |
30.1 (±15) |
33.9 (±11.5) |
27.8 (±6.0) |
| 2.5 | 20.6 (±5.3) |
28.1 (±3.6) |
11 (±0.6) |
14 (±0.8) |
32 (±2.4) |
21* (±4.2) |
3.4 (±0.5) |
2.5 (±0.4) |
| 4 | 19.6 (±6.8) |
15.8 (±4.1) |
3 (±0.8) |
4* (±0.2) |
7.6 (±0.4) |
4.2* (±1.2) |
2.1 (±0.3) |
1.4 (±0.2) |
| 6 | 5.5 (±0.8) |
4.5 (±2.2) |
N/A | N/A | 4.8 (±0.5) |
5.8 (±0.9) |
1.9 (±0.4) |
1.6 (±0.3) |
|
AUC0-6h (ng*h/g) |
188.4 (±8.2) | 198.4 (±11.7) |
48 (±1) |
53* (±2) |
144.7 (±5.5) |
95.8* (±4.8) |
69.0 (±10.7) |
55.9 (±8.9) |
| AUC Ratio | 1.05 | 1.12 | 0.66 | 0.81 | ||||
Disclaimer/Publisher’s Note: The statements, opinions and data contained in all publications are solely those of the individual author(s) and contributor(s) and not of MDPI and/or the editor(s). MDPI and/or the editor(s) disclaim responsibility for any injury to people or property resulting from any ideas, methods, instructions or products referred to in the content. |
© 2024 by the authors. Licensee MDPI, Basel, Switzerland. This article is an open access article distributed under the terms and conditions of the Creative Commons Attribution (CC BY) license (http://creativecommons.org/licenses/by/4.0/).
Copyright: This open access article is published under a Creative Commons CC BY 4.0 license, which permit the free download, distribution, and reuse, provided that the author and preprint are cited in any reuse.


