Submitted:
25 May 2024
Posted:
27 May 2024
You are already at the latest version
Preprints on COVID-19 and SARS-CoV-2
Abstract
Background: Since the onset of widespread COVID-19 vaccination campaigns, there have been concerns about serious cardiovascular adverse events, including myocarditis, myocardial infarction, and venous thromboembolisms, all of which can lead to cardiopulmonary arrest. This study aimed to estimate excess cardiopulmonary arrest mortality in King County, WA, and investigate any association with COVID-19 vaccination rates. Methods: Data was obtained from the annual King County, WA, EMS reports, the U.S. Census Bureau, and The Tennessean COVID-19 Vaccine Tracker. An exploratory data analysis was performed. Excess deaths were calculated using the 2015-2020 cardiopulmonary arrest mortality trend line. The relationship between excess cardiopulmonary arrest mortality and vaccination rates was analyzed using polynomial regression analysis. A quadratic regression model was used to generate expected population growth trends. The excess mortality model for King County was used to calculate yearly estimates for excess cardiopulmonary arrest fatalities in the USA. Results: Approximately 98% of the King County population received at least one dose of a COVID-19 vaccine by 2023. Our analysis revealed a 25.7% increase in total cardiopulmonary arrests and a 25.4% increase in cardiopulmonary arrest mortality from 2020 to 2023 in King County, WA. Excess cardiopulmonary arrest deaths were estimated to have increased by 1,236% from 2020 to 2023, rising from 11 excess deaths (95% CI: -12, 34) in 2020 to 147 excess deaths (95% CI: 123, 170) in 2023. A quadratic increase in excess cardiopulmonary arrest mortality was observed with higher COVID-19 vaccination rates. The general population of King County sharply declined by 0.94% (21,300) in 2021, deviating from the expected population size. Applying our model from these data to the entire United States yielded 49,240 excess fatal cardiopulmonary arrests from 2021-2023. Conclusions: We identified a very strong ecological and temporal association between excess cardiopulmonary arrest mortality and the COVID-19 vaccination campaign, which resulted in high vaccination rates. The biological plausibility of death from acute cardiac and pulmonary causes after COVID-19 vaccination has been previously demonstrated and is concerning given these real-world observations. Urgent further research is needed to determine if similar trends are observed in other regions with attention to risk mitigation for incident events and improved survival with resuscitation.
Keywords:
COVID-19 vaccines
; excess death
; cardiac arrest
; thrombosis
; pulmonary
; adverse event
; mRNA
; Spike protein
; mortality
Introduction
In the United States, COVID-19 vaccination campaigns began in December 2020 after the commencement of Operation Warp Speed. The primary vaccine platform utilized in the US is messenger RNA (mRNA) in lipid nanoparticles (LNPs) used by Pfizer/BioNTech (BNT162b1) and Moderna (mRNA-1273), followed by the viral vector platform used by Johnson & Johnson (Ad26.CoV2.S) [1]. COVID-19 vaccines have since been linked to several cardiovascular adverse events such as myocarditis [2,3,4], myocardial infarction [5,6,7], and venous thromboembolisms [8,9,10]. This has led to concerns of a possible relationship between vaccination rates and increased rates of cardiopulmonary incidents.
In the United States, the incidence of myocardial infarction notably increased in 2021, especially among younger adults aged 25 to 45 years. This age group, which is typically considered at lower risk for cardiac events, experienced a dramatic 29.95% rise in myocardial infarction compared to pre-pandemic predictions [11]. At the time of writing, cardiovascular related deaths continue to rise in the United States ever since the COVID-19 pandemic and the inception of COVID-19 vaccination campaigns [12].
King County, Washington (WA), provides a unique opportunity to study possible associations between COVID-19 vaccines and cardiopulmonary arrest mortality due to its comprehensive emergency medical services (EMS) data and significant vaccination efforts. This ecological study aims to analyze cardiopulmonary arrest data from King County EMS reports to estimate excess cardiopulmonary arrest mortality and explore any potential association with COVID-19 vaccination rates.
Methods
Data Sources and Study Period
Cardiopulmonary arrests and survival rates were obtained from the King County Emergency Medical Services (EMS) annual reports for the years 2016 to 2023 [13]. These reports provided EMS attendance data for the number of cardiopulmonary arrests and the survival rate to hospital discharge for the years 2015 to 2022. The total number of cardiopulmonary arrests includes those that occurred before the arrival of EMS as well as those that occurred after EMS arrived. The population of King County and the United States were obtained from the U.S. Census Bureau [14]. Vaccination rates were sourced from The Tennessean COVID-19 Vaccine Tracker, which collates data from the Centers for Disease Control and Prevention and state/local health departments. The data were extracted from the bar figure showing the percentage of the population that were partially and fully vaccinated [15]. For this analysis, vaccination rates for mid-year (June 30, 2021, and June 29, 2022) were utilized. For the 2023 vaccination rate, the final date with available data was used (December 7, 2022). The study focused on data from 2015 to 2023, with a particular emphasis on the period from 2021 to 2023 to capture the impact of the COVID-19 vaccination campaign.
Exploratory Data Analysis
An exploratory data analysis was performed to understand the trends and patterns in the cardiopulmonary arrest data before conducting the main analysis. This included examining the distribution of cardiopulmonary arrest cases and deaths over time, identifying any anomalies or outliers, and visualizing the data to detect potential correlations between variables. Various graphical representations were created to facilitate the identification of patterns, trends, and outliers, thereby guiding the subsequent analytical approach. Additionally, differences between pre-COVID-19 vaccination and post-COVID-19 vaccination periods were examined, focusing on any significant deviations from historical trends.
Statistical Analysis
Statistical analyses were performed using Microsoft Excel. Since data was not available for 2023, total cardiopulmonary arrests for 2023 were estimated using linear regression. The cardiopulmonary arrest mortality data for 2021 and 2022, which diverged significantly from the 2015-2020 trend line, were used to estimate cardiopulmonary arrest mortality for 2023 based on the difference between extrapolated data and reported deaths. Excess cardiopulmonary arrest deaths were calculated as the difference between reported cardiopulmonary arrest deaths (estimated deaths for 2023) and the 2015-2020 cardiopulmonary arrest mortality trend line. The upper and lower bounds for excess mortality were calculated based on a 95% confidence interval (CI 95%), using the Wilson Score Binomial Interval [16]. Polynomial regression analysis of degree two (quadratic) was used to examine the relationship between vaccination rates and excess cardiopulmonary arrest mortality, which was expressed as the estimated percentage of the population that died from excess cardiopulmonary arrests. Quadratic regression was used to generate an expected population growth trend line for 2015-2023, based on population data from 2015-2020. Yearly estimates for excess cardiopulmonary arrest fatalities in the USA were calculated using the excess mortality model developed for King County, WA, in this study. The estimated percentage of the population that died from excess cardiopulmonary arrests was applied to the US population to obtain national estimates.
Results
Table 1 provides detailed data on cardiopulmonary arrests, survival rates, mortality (deaths), trend lines, excess deaths, and vaccination rates for King County, WA, from 2015 to 2023. Approximately 98% of the King County population received at least one dose of a COVID-19 vaccine by 2023. The number of cardiopulmonary arrests attended by the King County EMS showed an upward trend from 1,114 in 2015 to 1,350 in 2020, representing a 21.2% increase. However, in 2021 and 2022, there was a significant jump in cardiopulmonary arrests, reaching 1,499 and 1,598 cases respectively. Our model forecasts 1,697 cardiopulmonary arrests in 2023, representing a sharp 25.7% increase since in the inception of COVID-19 vaccination campaigns.
Figure 1 displays cardiopulmonary arrest mortality from 2015 to 2023, incorporating the 2015-2020 trend line (y = 45.077x – 89946, R2=0.9871). The high R² value indicates a strong fit of the trend line to the data, explaining approximately 98.71% of the variance in cardiopulmonary arrest mortality during this period. The trend line indicates a steady increase in mortality until 2020, followed by a sharp rise in 2021 and 2022. Specifically, the number of cardiopulmonary arrest deaths increased from 891 in 2015 to 1,110 in 2020, representing a 24.6% increase. In 2021, deaths jumped to 1,229 and continued to rise to 1,310 in 2022. The projection for 2023 suggests 1,392 cardiopulmonary arrest deaths in King County, WA, indicating a sharp 25.4% increase since the onset of COVID-19 vaccination campaigns. Excess cardiopulmonary arrest deaths were estimated to have increased by 1,236% from 2020 to 2023, rising from 11 excess deaths (95% CI: -12, 34) in 2020 to 75 excess deaths (95% CI: 51, 98) in 2021, 111 excess deaths (95% CI: 87, 134) in 2022, and 147 excess deaths (95% CI: 123, 170) in 2023 (Figure 2). The standard deviation for excess deaths from 2015-2019 is ±7.8.
Figure 3 plots excess cardiopulmonary arrest mortality versus COVID-19 vaccination rate. The model demonstrates a quadratic increase in excess mortality as vaccination rates rise, with the equation y = 0.0053x2 + 0.0014x + 4 × 10⁻⁶. The high R² value of 0.9992 indicates an excellent fit of the model to the data, explaining approximately 99.92% of the variance in excess mortality. This suggests that the rate of increase in excess mortality accelerates with higher vaccination rates. The population of King County, WA, sharply decreased by 0.94% (21,300 people) in 2021, deviating from the expected population trend line (y = -0.0026x2 + 0.0468x + 2.0841, R2=0.9987) (Figure 4). The high R² value of 0.9987 indicates an excellent fit of the model to the data, explaining approximately 99.87% of the variance in population trends. From 2021 to 2023, the population size has slowly recovered but remains below the expected number. Table 2 provides yearly estimates for excess cardiopulmonary arrest fatalities in the USA, yielding 49,240 excess cardiopulmonary arrest deaths from 2021-2023.
Discussion
We found that both the total number of cardiopulmonary arrests and fatal events increased more than expected coinciding with the rollout of the COVID-19 mass vaccination program in King County, WA. Our study estimated a 1,236% rise in excess cardiopulmonary arrest deaths following the introduction of COVID-19 vaccines, which have regulatory warnings for myocarditis and thromboembolism [17,18]. Both of these conditions have been proven to likely be fatal in autopsy studies of death after COVID-19 vaccination [19,20]. A very strong correlation between higher vaccination rates and excess cardiopulmonary arrest mortality was observed in the quadratic model. Additionally, the population of King County decreased by 0.94% in 2021, which coincided with the sharp rise in cardiopulmonary arrest fatalities and onset of vaccination campaigns. Applying our model to the entire United States yielded 49,240 excess cardiopulmonary arrest deaths from 2021-2023.
These findings are consistent with existing literature that report an increase in cardiopulmonary arrests and cardiovascular-related deaths since 2020 and 2021 [11,12,21,22,23]. Sun et al found a 25% increase in the number of cardiac arrest and acute coronary syndrome EMS calls among the 16–39 age group during the COVID-19 vaccination campaign in Israel compared with the same time period in prior years, corroborating the 25.7% increase in cardiopulmonary arrests estimated in our study [22]. Moreover, they used Negative Binomial regression models and found the weekly emergency call counts were significantly associated with COVID-19 vaccination rates in the 16-39 age group, and not with COVID-19 infection rates [22]. The authors concluded that surveillance of COVID-19 vaccine adverse events should incorporate EMS data, as we did in our study. Woodruff et al found that from 2020 to 2022, 228,524 excess cardiovascular-related deaths occurred in the United States, which was 9% more deaths than expected based on trends from 2010 to 2019, supporting our national estimate of 49,240 excess cardiopulmonary deaths possibly due to COVID-19 vaccination [23]. The largest COVID-19 vaccine safety study, conducted by the Global Vaccine Data Network (GVDN) and included around 99 million vaccinated individuals across multiple countries, found that the risk of myocarditis was significantly elevated after mRNA COVID-19 vaccinations, with the risk being 510% and 186% higher than baseline rates following the second doses of the mRNA-1273 and BNT162b2 vaccines, respectively [24]. Moreover, the large study found that the risk of pulmonary embolism was 33% higher than baseline rates after the first dose of mRNA-1273 and 29% higher than baseline rates after the first dose of BNT162b2, respectively [24]. Rose et al analyzed the Vaccine Adverse Event Reporting System (VAERS) and found that myocarditis reports following COVID-19 vaccination in 2021 were 223 times higher than the average incidence for all vaccines combined over the past 30 years, with a 2.9% fatality rate. They concluded that COVID-19 vaccines are strongly associated with a significant adverse safety signal for myocarditis, leading to hospitalization and death [4]. Since 98% of the population in King County was vaccinated against COVID-19, it can be inferred that an excess number of individuals may have suffered from COVID-19 vaccine-induced myocarditis or thromboembolism. Our study adds to this body of literature by specifically correlating the increase in cardiopulmonary arrest mortality to vaccination rates, a relationship that has not been extensively explored before.
The biological plausibility of COVID-19 vaccine-induced myocarditis and thromboembolism leading to sudden cardiac death has been previously demonstrated and is concerning given our findings using real-world data. Among all published autopsy reports with COVID-19 vaccines as a previous exposure, 35.9% of deaths were attributed to sudden cardiac death, myocardial infarction, and myocarditis, while 15.3% were linked to pulmonary embolism and vaccine-induced immune thrombotic thrombocytopenia (VITT) [19]. Hulscher et al found that COVID-19 vaccine-induced myocarditis can most likely result in sudden cardiac death using post-mortem analysis in 28 autopsy cases [20]. COVID-19 mRNA vaccines systemically distribute mRNA via LNPs that encodes for the Spike protein, which has been shown to incite deleterious effects in multiple organ systems and cause fibrinolysis-resistant blood clots [25,26]. Baumeier et al found Spike protein and no nucleocapsid in the myocardium of 15 individuals with COVID-19 vaccine-induced myocarditis [27]. Schrekenberg et al found that in isolated cardiomyocytes, both mRNA-1273 and BNT162b2 induce cardiac dysfunctions that are seen in cardiomyopathies [28]. Krauson et al identified the presence of COVID-19 vaccine mRNA in the hearts of individuals who died within 30 days after vaccination, along with histologically confirmed myocardial injury [29]. De Michele et al found isolated Spike protein without SARS-CoV-2 RNA or nucleocapsid in the blood clots of patients with myocardial infarction and acute ischemic stroke [30]. Thus, the likely occurrence of excess cardiopulmonary deaths associated with COVID-19 vaccination among over 2 million vaccinated individuals living in King County, WA, is not surprising. Moreover, COVID-19 infection and pandemic-related emergency care disruptions may have also contributed to the increase in excess cardiopulmonary arrest deaths [11,32]. However, the sharp increase in excess cardiopulmonary arrest deaths began in 2021, which was one year after the COVID-19 pandemic began and coincides with the onset of COVID-19 vaccination campaigns.
Our study has several significant strengths. With approximately 98% of the King County population having received at least one dose of a COVID-19 vaccine, nearly the entire population was exposed to the variable in our model. This widespread exposure enabled us to detect a significant safety signal of excess cardiopulmonary arrest mortality among a large sample size of over 2 million vaccinated residents. Additionally, the use of comprehensive EMS data from King County ensures a high level of accuracy and reliability in the reported data. Our study spans a period both before and after the COVID-19 vaccination rollout, providing a clear temporal framework to observe and analyze changes in cardiopulmonary arrest rates. This temporal context allows for a clear examination of the relationship between vaccination rates and cardiopulmonary arrest mortality. Furthermore, the ecological validity of our study is enhanced by focusing on a large and diverse urban population, making the findings more generalizable to other metropolitan areas. The significant correlation between vaccination rates and cardiopulmonary arrest mortality has implications for public health. It highlights the need for careful monitoring of vaccine side effects and underscores the importance of considering potential adverse events in vaccination campaigns. Our models suggests that similar increases in excess mortality could occur in other regions with high vaccination rates, thus highlighting the importance of conducting further research to validate these trends.
Our study has all the limitations of ecological data where individual case level information is not available. There are multiple potential, unaccounted confounding variables, such as changes in healthcare access, variations in public health interventions, socioeconomic factors, drug use, and COVID-19 infection that could have influenced cardiopulmonary arrest outcomes. The sudden population drop in King County during the pandemic may have been influenced by migration or temporary relocations, which are not fully captured in the data. Our model relies on extrapolating pre-pandemic trends, assuming underlying conditions remained constant. The high R² values observed in our models, such as 0.9992 for the quadratic model relating vaccination rates to excess cardiopulmonary arrest mortality, suggest an excellent fit. However, our models may be unstable due to containing few data points. High R² values in small datasets can sometimes indicate overfitting, and these findings should be validated with larger, independent samples. As an ecological study, our findings apply to population-level trends and may not necessarily reflect individual-level associations.
Conclusion
The data from King County, WA, suggests a very strong ecological and temporal association between excess cardiopulmonary arrest mortality and the COVID-19 vaccination campaign, which resulted in high vaccination rates. This correlation raises important questions about the potential adverse effects of widespread vaccination efforts during the pandemic. The biological plausibility of death from acute cardiac and pulmonary causes after COVID-19 vaccination has been previously demonstrated and is concerning given these real-world observations. The findings of this study underscore the importance of continuous monitoring and analysis of cardiopulmonary arrest data to inform public health interventions and policies, especially in the context of vaccination programs. Urgent further research is needed to determine if similar trends are observed in other regions with attention to risk mitigation for incident events and improved survival with resuscitation. Specifically, the U.S. Centers for Disease Control and Prevention COVID-19 vaccination administration data should be merged with all death cases so that the vaccine type, dose(s), and date of administration can be analyzed as possible determinants.
Funding
No funding was received for conducting this study.
Informed Consent Statement
Not applicable as we use publicly available data.
Data availability Statement
All data extracted and analyzed in this study are publicly available and referenced in the methods section.
Conflicts of Interest
Nothing to declare.
References
- Ho RJY. Warp-Speed Covid-19 Vaccine Development: Beneficiaries of Maturation in Biopharmaceutical Technologies and Public-Private Partnerships. J Pharm Sci. 2021;110(2):615-618. [CrossRef]
- Diaz GA, Parsons GT, Gering SK, et al. Myocarditis and Pericarditis After Vaccination for COVID-19. JAMA. 2021;326(12):1210-1212. [CrossRef]
- Mevorach D, Anis E, Cedar N, et al. Myocarditis after BNT162b2 mRNA Vaccine against Covid-19 in Israel. N Engl J Med. 2021;385(23):2140-2149. [CrossRef]
- Rose J, Hulscher N, McCullough PA. Determinants of COVID-19 vaccine-induced myocarditis. Ther Adv Drug Saf. 2024;15:20420986241226566. Published 2024 Jan 27. [CrossRef]
- Ho JSY, Sia CH, Ngiam JN, et al. A review of COVID-19 vaccination and the reported cardiac manifestations. Singapore Med J. 2023;64(9):543-549. [CrossRef]
- Zafar U, Zafar H, Ahmed MS, Khattak M. Link between COVID-19 vaccines and myocardial infarction. World J Clin Cases. 2022;10(28):10109-10119. [CrossRef]
- Aye YN, Mai AS, Zhang A, et al. Acute myocardial infarction and myocarditis following COVID-19 vaccination. QJM. 2023;116(4):279-283. [CrossRef]
- Bekal S, Husari G, Okura M, Huang CA, Bukari MS. Thrombosis Development After mRNA COVID-19 Vaccine Administration: A Case Series. Cureus. 2023;15(7):e41371. Published 2023 Jul 4. [CrossRef]
- Mani A, Ojha V. Thromboembolism after COVID-19 Vaccination: A Systematic Review of Such Events in 286 Patients. Ann Vasc Surg. 2022;84:12-20.e1. [CrossRef]
- Bernardi, Francesca Futura et al. “Thromboembolic Events after COVID-19 Vaccination: An Italian Retrospective Real-World Safety Study.” Vaccines vol. 11,10 1575. 10 Oct. 2023. [CrossRef]
- Yeo YH, Wang M, He X, et al. Excess risk for acute myocardial infarction mortality during the COVID-19 pandemic. J Med Virol. 2023;95(1):e28187. [CrossRef]
- Martin SS, Aday AW, Almarzooq ZI, et al. 2024 Heart Disease and Stroke Statistics: A Report of US and Global Data From the American Heart Association [published correction appears in Circulation. 2024 May 7;149(19):e1164]. Circulation. 2024;149(8):e347-e913. [CrossRef]
- King County. "Emergency Medical Services: Reports and Publications." King County, https://kingcounty.gov/en/dept/dph/health-safety/health-centers-programs-services/emergency-medical-services/reports-publications. Accessed 23 May 2024.
- U.S. Census Bureau. "Programs and Surveys: Population Estimates Tables." U.S. Census Bureau, U.S. Department of Commerce, https://www2.census.gov/programs-surveys/popest/tables/. Accessed 23 May 2024.
- King County, WA COVID-19 Vaccine Tracker. The Tennessean. https://data.tennessean.com/covid-19-vaccine-tracker/washington/king-county/53033/ (accessed 13 May 2024).
- Real Statistics Using Excel. "Proportion Parameter Confidence Interval." Real Statistics Using Excel, https://www.real-statistics.com/binomial-and-related-distributions/proportion-distribution/proportion-parameter-confidence-interval/. Accessed 23 May 2024.
- Coronavirus (COVID-19) Update: June 25, 2021 [Internet]. U.S. Food and Drug Administration. 2021. Available from: https://www.fda.gov/news-events/press-announcements/coronavirus-covid-19-update-june-25-2021. (accessed 15 May 2024).
- Janssen COVID-19 Vaccine EUA Fact Sheet for Healthcare Providers [Internet]. U.S. Food and Drug Administration; 2023. Available from: https://www.fda.gov/media/146304/download. (accessed 15 May 2024).
- Hulscher N, Alexander PE, Amerling R, et al. A SYSTEMATIC REVIEW OF AUTOPSY FINDINGS IN DEATHS AFTER COVID-19 VACCINATION. Zenodo. 2023. [CrossRef]
- Hulscher N, Hodkinson R, Makis W, McCullough PA. Autopsy findings in cases of fatal COVID-19 vaccine-induced myocarditis. ESC Heart Fail. Published online January 14, 2024. [CrossRef]
- Janus SE, Makhlouf M, Chahine N, Motairek I, Al-Kindi SG. Examining Disparities and Excess Cardiovascular Mortality Before and During the COVID-19 Pandemic. Mayo Clin Proc. 2022;97(12):2206-2214. [CrossRef]
- Sun, Christopher L F et al. “Increased emergency cardiovascular events among under-40 population in Israel during vaccine rollout and third COVID-19 wave.” Scientific reports vol. 12,1 6978. 28 Apr. 2022. [CrossRef]
- Woodruff RC, Tong X, Khan SS, et al. Trends in Cardiovascular Disease Mortality Rates and Excess Deaths, 2010-2022. Am J Prev Med. 2024;66(4):582-589. [CrossRef]
- Faksova K, Walsh D, Jiang Y, et al. COVID-19 vaccines and adverse events of special interest: A multinational Global Vaccine Data Network (GVDN) cohort study of 99 million vaccinated individuals. Vaccine. 2024;42(9):2200-2211. [CrossRef]
- Parry PI, Lefringhausen A, Turni C, et al. 'Spikeopathy': COVID-19 Spike Protein Is Pathogenic, from Both Virus and Vaccine mRNA. Biomedicines. 2023;11(8):2287. Published 2023 Aug 17. [CrossRef]
- Hulscher N, Procter BC, Wynn C, McCullough PA. Clinical Approach to Post-acute Sequelae After COVID-19 Infection and Vaccination. Cureus. 2023;15(11):e49204. Published 2023 Nov 21. [CrossRef]
- Baumeier, Christian et al. “Intramyocardial Inflammation after COVID-19 Vaccination: An Endomyocardial Biopsy-Proven Case Series.” International journal of molecular sciences vol. 23,13 6940. 22 Jun. 2022. [CrossRef]
- Schreckenberg R, Woitasky N, Itani N, Czech L, Ferdinandy P, Schulz R. Cardiac side effects of RNA-based SARS-CoV-2 vaccines: Hidden cardiotoxic effects of mRNA-1273 and BNT162b2 on ventricular myocyte function and structure. Br J Pharmacol. 2024;181(3):345-361. [CrossRef]
- Krauson AJ, Casimero FVC, Siddiquee Z, Stone JR. Duration of SARS-CoV-2 mRNA vaccine persistence and factors associated with cardiac involvement in recently vaccinated patients. NPJ Vaccines. 2023;8(1):141. Published 2023 Sep 27. [CrossRef]
- De Michele M, d'Amati G, Leopizzi M, et al. Evidence of SARS-CoV-2 spike protein on retrieved thrombi from COVID-19 patients. J Hematol Oncol. 2022;15(1):108. Published 2022 Aug 16. [CrossRef]
- Bharmal, Murtaza et al. “Impact of Coronavirus Disease 2019 Pandemic on Cardiac Arrest and Emergency Care.” Heart failure clinics vol. 19,2 (2023): 231-240. [CrossRef]
Figure 1.
Cardiopulmonary Arrest Mortality from 2015 to 2023 in King County, Washington. The blue dotted line shows the expected cardiopulmonary arrest mortality trend line based on data from 2015 to 2020 (solid blue points). The orange dots represent cardiopulmonary arrest mortality deviating from the expected trend line. The data point for 2023 was estimated using linear regression.
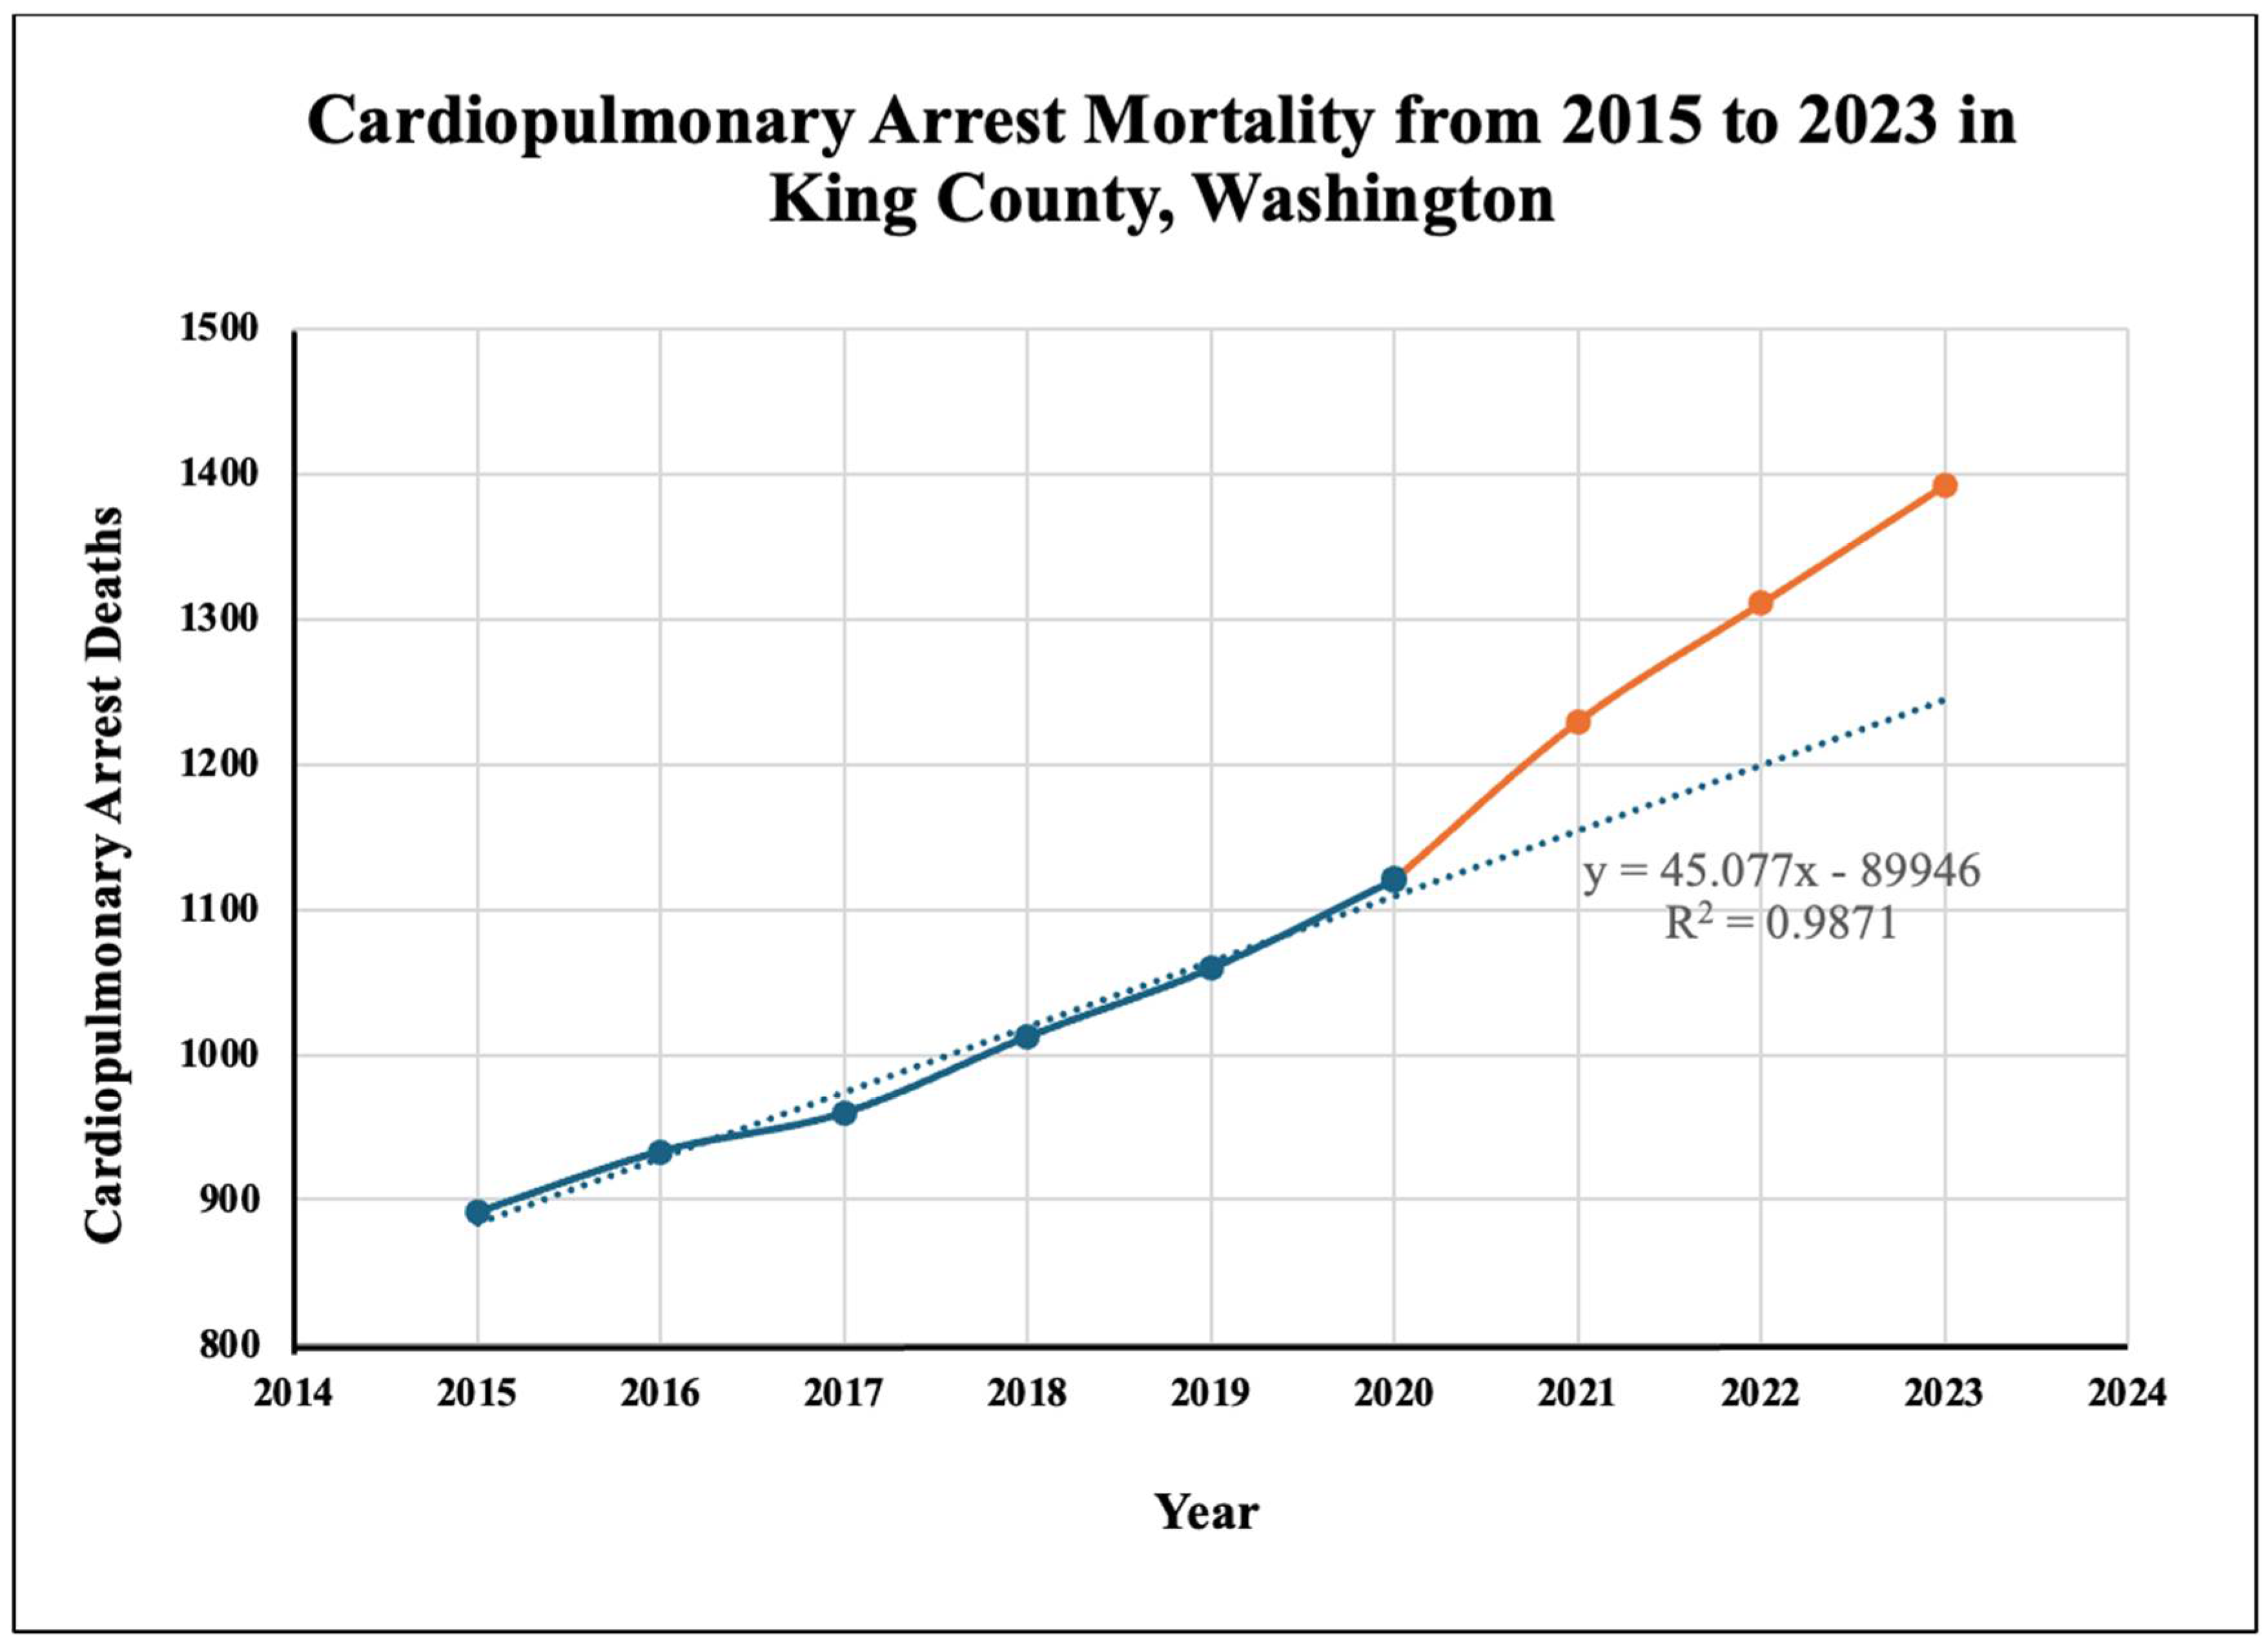
Figure 2.
Excess Cardiopulmonary Arrest Deaths from 2015 to 2023 in King County, Washington. The 2015-2020 cardiopulmonary arrest mortality trend line was used to estimate excess cardiopulmonary arrest deaths.
Figure 2.
Excess Cardiopulmonary Arrest Deaths from 2015 to 2023 in King County, Washington. The 2015-2020 cardiopulmonary arrest mortality trend line was used to estimate excess cardiopulmonary arrest deaths.
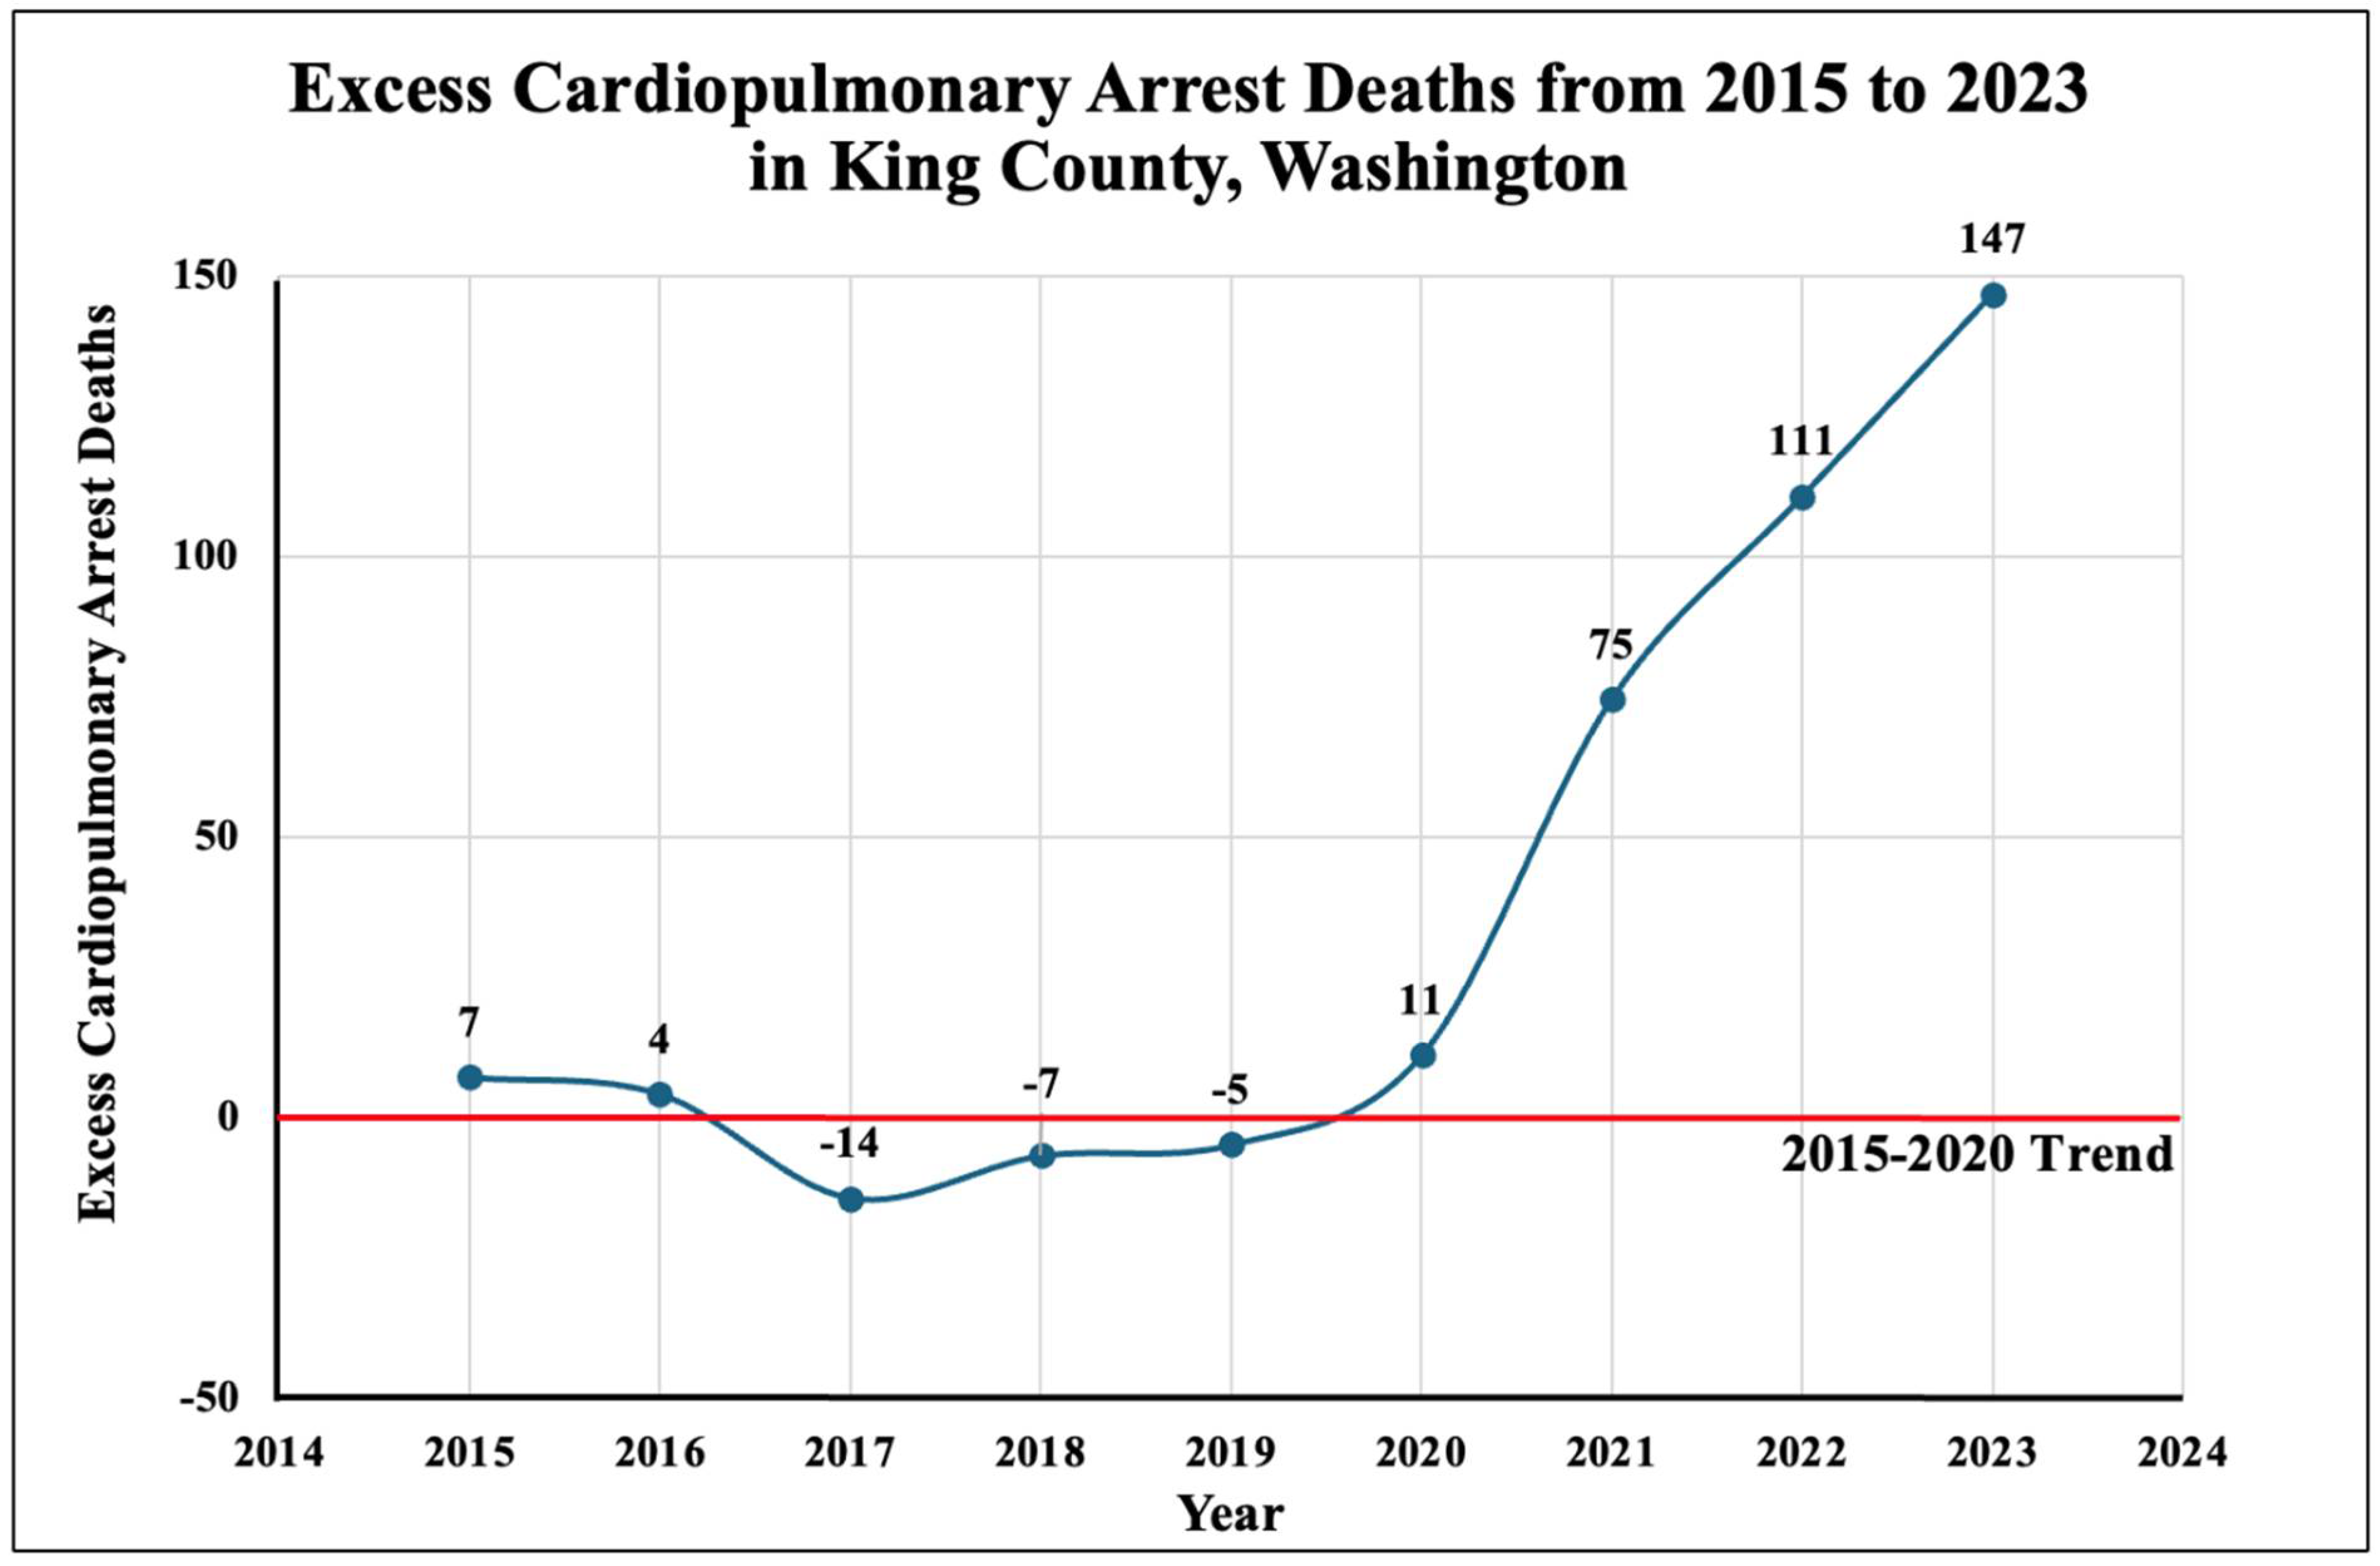
Figure 3.
Excess Cardiopulmonary Arrest Mortality Versus COVID-19 Vaccination Rate in King County, Washington. The dotted line represents the quadratic model created using the COVID-19 vaccination rates and estimated excess cardiopulmonary arrest mortality (expressed the percentage of the population that died from excess cardiopulmonary arrests).
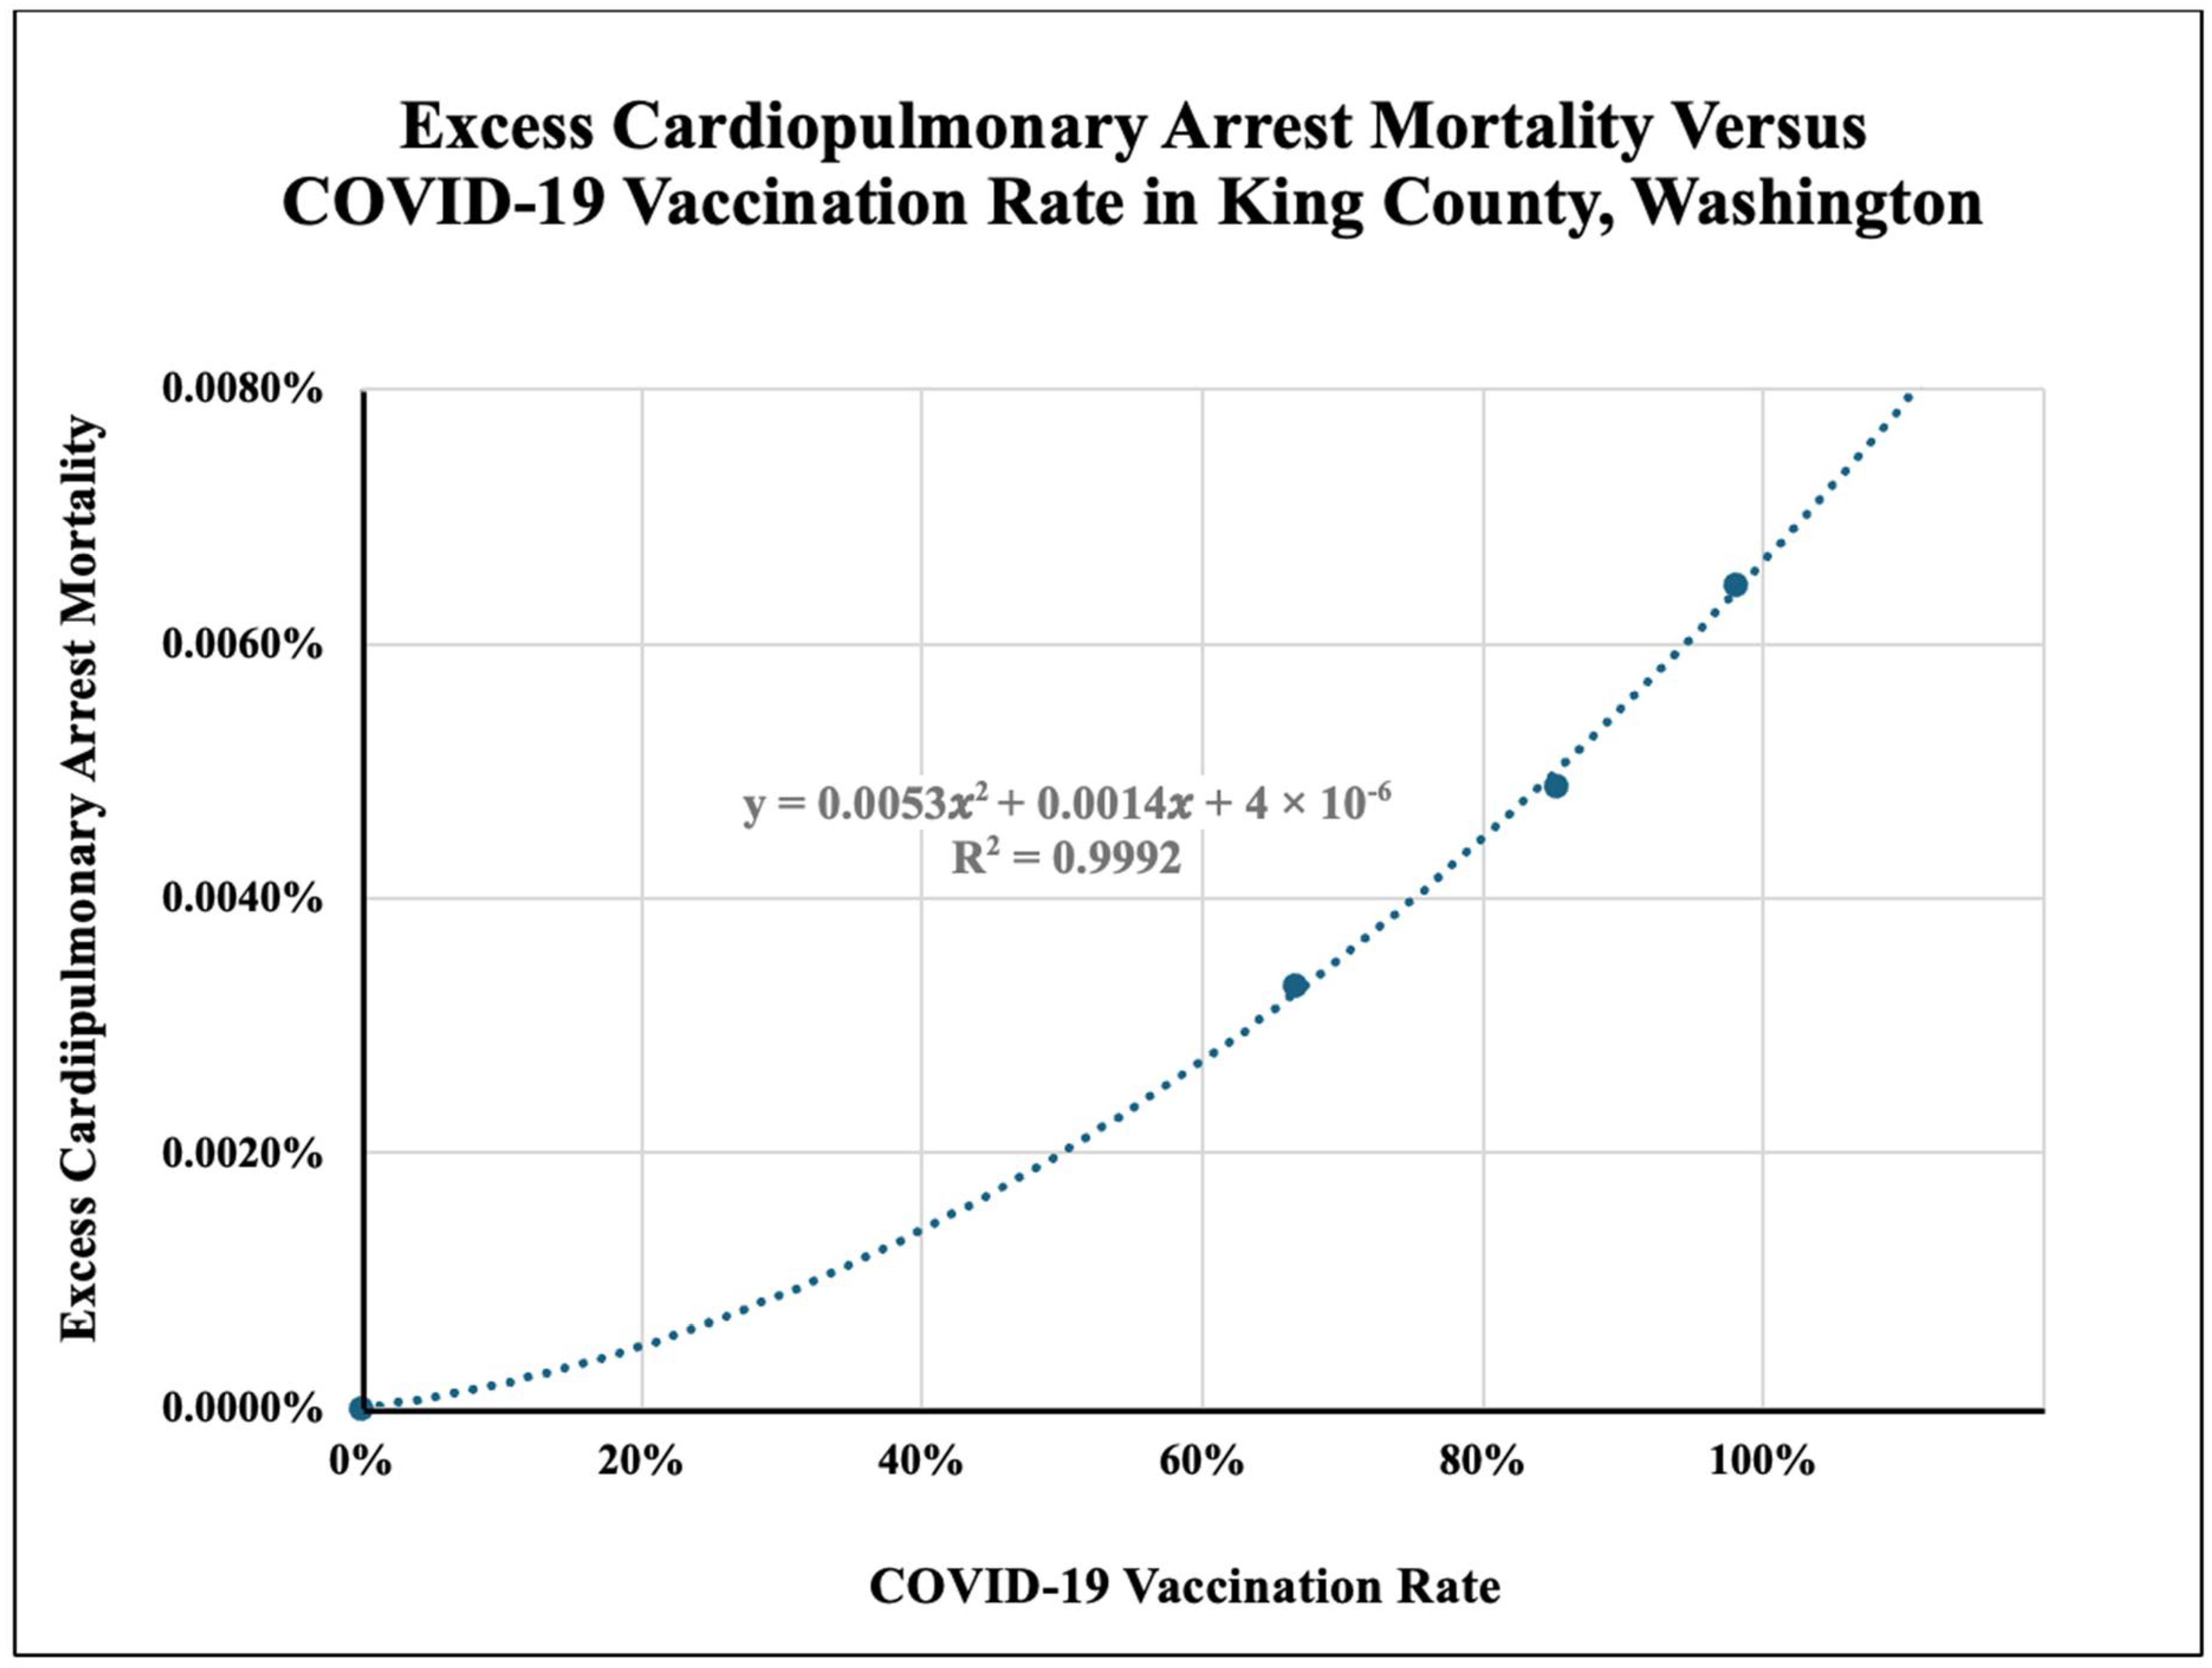
Figure 4.
Population of King County, Washington, from 2015 to 2023. The dotted blue line represents the expected population size based on population data from 2015-2020. The solid orange line represents the drop in population in 2021 that deviated from the expected trend.
Figure 4.
Population of King County, Washington, from 2015 to 2023. The dotted blue line represents the expected population size based on population data from 2015-2020. The solid orange line represents the drop in population in 2021 that deviated from the expected trend.
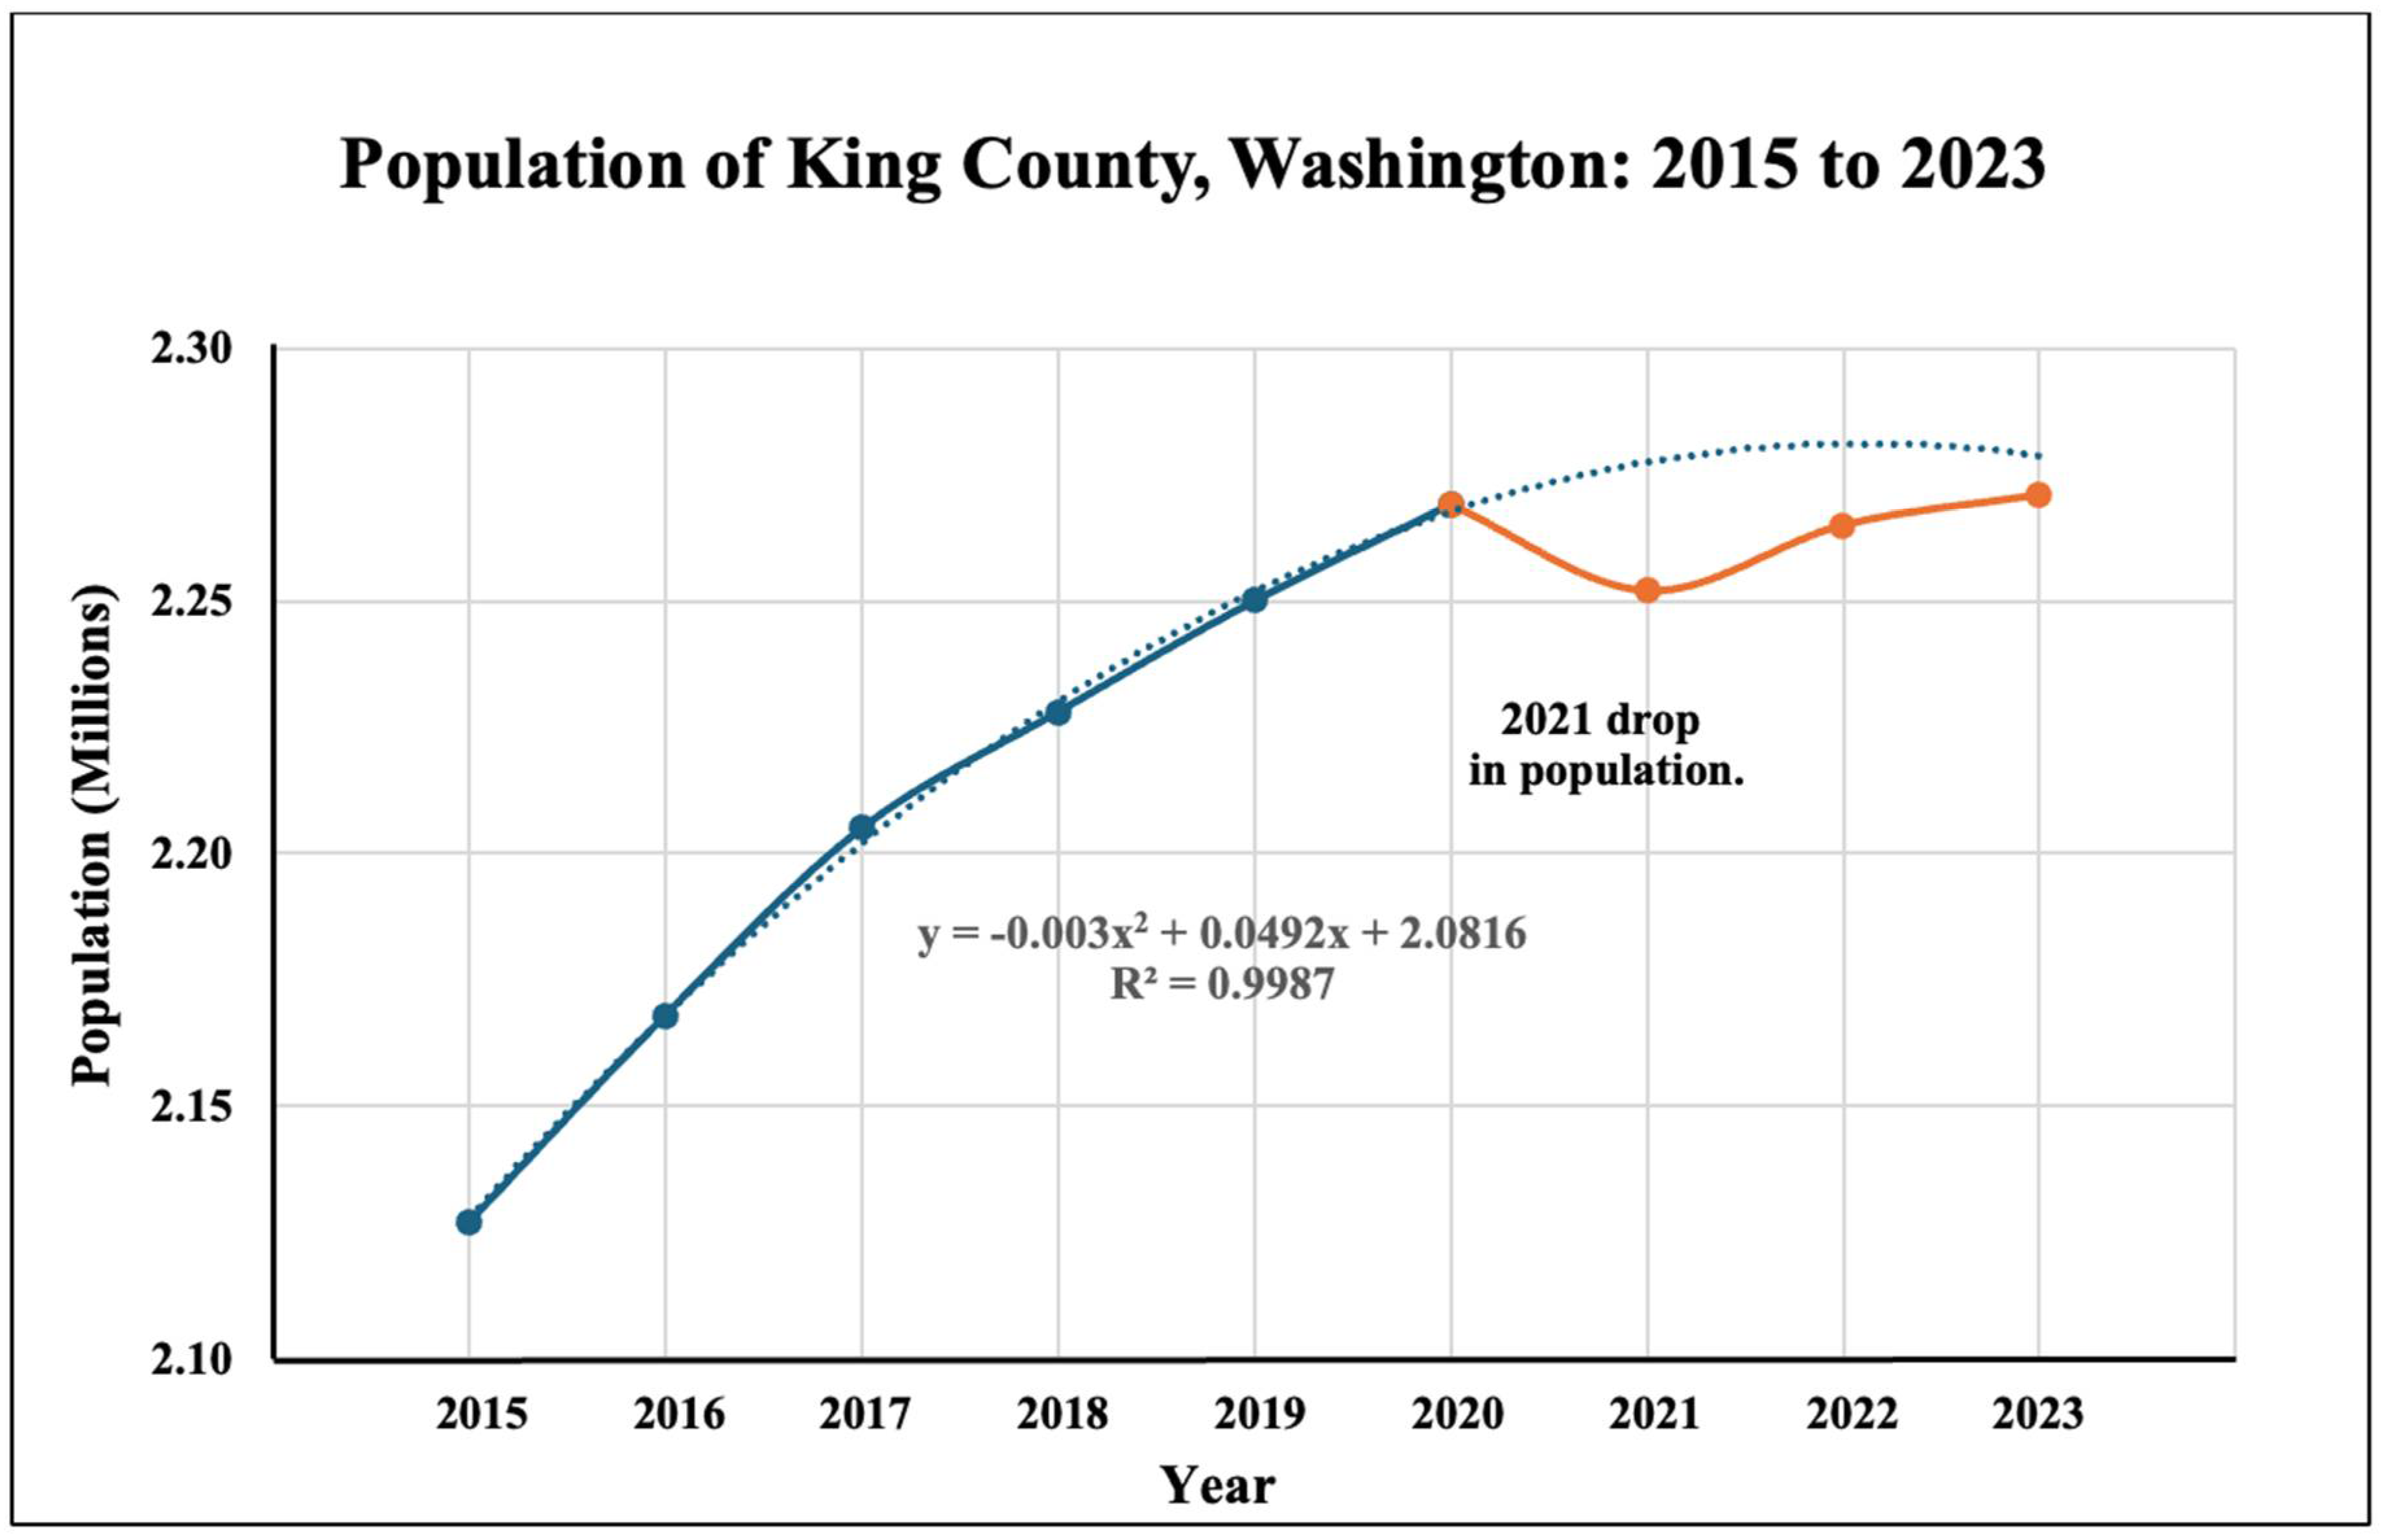

Table 1.
King County, Washington, EMS Reports and Calculated Excess Deaths (2015-2023) Cardiopulmonary arrests and mortality for 2023 are estimated. *Number of deaths from cardiopulmonary arrest. **Standard deviation for excess cardiopulmonary deaths from 2015-2019: ±7.8. ***The percentage of the population that died from excess cardiopulmonary arrests.
| Year | Cardiopulmonary arrests | Survival rate | Mortality* | Trend line | Excess deaths** | Population (mil) | Excess deaths of population (%)*** | COVID-19 Vaccination rate |
|---|---|---|---|---|---|---|---|---|
| 2015 | 1114 | 20% | 891 | 884 | 7 | 2.127 | 0.0003% | - |
| 2016 | 1228 | 24% | 933 | 929 | 4 | 2.168 | 0.0002% | - |
| 2017 | 1215 | 21% | 960 | 974 | -14 | 2.205 | -0.0007% | - |
| 2018 | 1298 | 22% | 1012 | 1019 | -7 | 2.228 | -0.0003% | - |
| 2019 | 1308 | 19% | 1059 | 1064 | -5 | 2.250 | -0.0002% | - |
| 2020 | 1350 | 17% | 1121 | 1110 | 11 ( 95% CI: -12, 34) | 2.274 | 0.0005% | - |
| 2021 | 1499 | 18% | 1229 | 1155 | 75 (95% CI: 51, 98) | 2.252 | 0.0033% | 66.59% |
| 2022 | 1598 | 18% | 1310 | 1200 | 111 (95% CI: 87, 134) | 2.265 | 0.0049% | 85.19% |
| 2023 | 1697 | 18% | 1392 | 1245 | 147 (95% CI: 123, 170) | 2.271 | 0.0065% | 98.0% |
Table 2.
United States Estimates for Excess Cardiopulmonary Arrest Fatalities. *The estimated number of excess cardiopulmonary arrest fatalities based on the model developed in this study.
Table 2.
United States Estimates for Excess Cardiopulmonary Arrest Fatalities. *The estimated number of excess cardiopulmonary arrest fatalities based on the model developed in this study.
| Region | Year | Population (Mil) | Excess Deaths* |
|---|---|---|---|
| King County, WA | 2021 | 2.252 | 75 |
| 2022 | 2.265 | 111 | |
| 2023 | 2.271 | 147 | |
| USA | 2021 | 332.0 | 10,990 |
| 2022 | 333.3 | 16,280 | |
| 2023 | 340.0 | 21,970 |
Disclaimer/Publisher’s Note: The statements, opinions and data contained in all publications are solely those of the individual author(s) and contributor(s) and not of MDPI and/or the editor(s). MDPI and/or the editor(s) disclaim responsibility for any injury to people or property resulting from any ideas, methods, instructions or products referred to in the content. |
© 2024 by the authors. Licensee MDPI, Basel, Switzerland. This article is an open access article distributed under the terms and conditions of the Creative Commons Attribution (CC BY) license (http://creativecommons.org/licenses/by/4.0/).
Copyright: This open access article is published under a Creative Commons CC BY 4.0 license, which permit the free download, distribution, and reuse, provided that the author and preprint are cited in any reuse.


