
Submitted:
19 May 2024
Posted:
20 May 2024
You are already at the latest version
Abstract
Convolutional Neural Networks (CNNs) are often criticized for their lack of transparency, acting as 'black boxes' in decision-making, a challenge compounded by class imbalance in ECG datasets, which limits their clinical application. This study introduces a CNN-based ECG signal classification model that enhances interpretability and addresses class imbalance through the Synthetic Minority Over-sampling Technique (SMOTE). The model also integrates Uniform Manifold Approximation and Projection (UMAP) for dimensionality reduction and SHAP value analysis, facilitating the visualization of decision boundaries and the assessment of feature contributions. Our evaluation using the MIT-BIH Arrhythmia Database highlights the model's high performance, with accuracy and precision nearing 1.00 for Normal ECG (NOR), Left Bundle Branch Block (LBBB), Right Bundle Branch Block (RBBB), and Ventricular Premature Beat (PVC) in the six-class task. In the ten-class task, the model demonstrated robustness, particularly with an accuracy of 0.9846, precision of 0.9783, recall of 0.9736, and F1 score of 0.9760 in Pacemaker Fusion Beat (PFHB), supported by an AUC of 0.9999 and AP of 0.9885. These results underscore the model's efficacy in cardiac rhythm recognition and resilience to class imbalance. Future research will explore sophisticated model architectures and feature extraction methods to enhance the model's generalization and clinical applicability for early heart disease diagnosis and personalized treatment.
Keywords:
ECG signal classification
; convolutional neural network
; model interpretability
; UMAP dimensionality reduction
; SHAP value analysis
1. Introduction
The precise automatic classification of Electrocardiogram (ECG) signals is of paramount importance for the early diagnosis and treatment of cardiac conditions [1]. Despite certain advancements in ECG signal classification achieved by traditional machine learning methods, the complexity of ECG data necessitates the development of more refined models to capture and identify key signals of cardiac abnormalities [2,3]. Against this backdrop, deep learning techniques, particularly Convolutional Neural Networks (CNNs), have gradually become cutting-edge technology in this field due to their outstanding data-driven feature extraction and classification capabilities [4]. However, CNN models are often regarded as "black boxes," lacking transparency in their decision-making processes [5,6], and coupled with the issue of class imbalance in ECG datasets, these factors have limited their application in clinical practice [7]. To overcome these challenges, this study is dedicated to developing a CNN model that can not only handle the task of automatic classification of imbalanced multi-class ECG signals but also possesses a high degree of interpretability to meet the professional needs of the medical diagnostic field.
To enhance the model's transparency and interpretability, this study introduces Uniform Manifold Approximation and Projection (UMAP) dimensionality reduction technology for visualizing the model’s classification boundaries and employs Shapley Additive exPlanations (SHAP) value analysis to quantitatively assess the specific contribution of each ECG signal feature to the model’s prediction outcome [8,9,10,11,12]. UMAP technology provides us with a macro perspective, helping us to observe the structure of the data as a whole [13], while SHAP value analysis reveals the feature contributions behind each prediction from a microscopic perspective [14]. The combination of these two technologies aims to offer a more comprehensible perspective on model decision-making, thereby enhancing the trust of medical professionals in the model and promoting the application of deep learning models in clinical settings.
Compared to the existing research, the innovation of this study is mainly reflected in the following two aspects:
(1). Application of UMAP Technology: This study innovatively applies UMAP technology to the field of ECG signal classification to visualize the high-dimensional semantic features extracted by the middle layer of CNNs. The advantage of UMAP technology lies in its ability to preserve the local neighborhood structure of the data, which is significant for understanding the model’s classification decisions in high-dimensional space. The method of this study not only provides a macro view of the model’s decision boundaries but also, through this novel perspective, allows clinical doctors to more intuitively identify and understand the model’s classification behavior.
(2). Visualization of SHAP Analysis: This study introduces SHAP value analysis to provide a microscopic perspective on the model’s decision-making process. The application of SHAP value analysis in the field of ECG signal classification is innovative as it assigns specific values to each feature, precisely measuring its impact on the model’s prediction. In addition, the visualization technology developed in this study is particularly tailored to the needs of clinical doctors, transforming complex SHAP value data into an intuitive and easily understandable format, which is of great significance for improving the model’s interpretability.
In summary, this study provides a new framework for the analysis and interpretation of the field of ECG signal classification by combining the macro perspective of UMAP and the microscopic perspective of SHAP value analysis. This multi-level analysis method not only enhances the interpretability of the model but also provides a comprehensive set of tools for clinical doctors to better understand and trust the model’s prediction results. Our work demonstrates how advanced data visualization and interpretive analysis techniques can improve the transparency and credibility of deep learning models in the task of ECG signal classification, which is of great importance for advancing the development of this field.
2. Related Work
2.1. ECG Signal Classification Methods
ECG signal classification is a crucial step in the diagnosis of cardiovascular diseases and has garnered extensive research attention in recent years. With the advancement of technology, classification methods and data processing strategies have continuously improved, making the interpretability of models a focal point of research [3,15,16].
Traditionally, ECG signal classification methods have relied on manual feature extraction, which includes time-domain characteristics (such as RR intervals, QRS duration), frequency-domain features (such as power spectral density), and time-frequency domain features (such as wavelet transform coefficients) [3,17]. These methods are effective to some extent but often require prior knowledge from domain experts and substantial computational resources [15]. With the evolution of deep learning techniques, data-driven approaches have begun to demonstrate their advantages in ECG signal classification. Owing to their robust feature learning capabilities, CNNs have been widely studied. CNNs can automatically learn complex features from raw ECG signals, reducing the reliance on manual features and enhancing classification accuracy [2,18].
2.2. Strategies for Handling Imbalanced Datasets
In the research and practice of ECG signal classification, addressing the challenge of imbalanced datasets is an important issue. To enhance the model’s ability to recognize minority classes, this study employs various strategies [19,20,21], including but not limited to:
• Oversampling: Balancing the dataset by increasing the number of samples in minority classes, which can be achieved through simple replication or by interpolating new samples based on existing ones.
• Undersampling: Mitigating class imbalance by reducing the number of samples in majority classes, although this approach carries the risk of information loss.
• Synthetic sample generation: Enhancing the representation of minority classes by generating new samples using algorithms that may rely on statistical properties or machine learning techniques.
• Combination methods: A strategy that integrates both oversampling and undersampling to improve class balance within the dataset.
In this study, the SMOTE was specifically utilized to address the issue of class imbalance in ECG signal classification. The SMOTE technique generates new sample points by considering the distribution characteristics of existing samples, without causing information distortion due to oversampling[22,23,24]. The key steps of the technique include:
• Sample selection: Randomly selecting a sample from the minority class as a reference point, ensuring the randomness and diversity of the oversampling process.
• Neighbor search: Seeking k proximate neighbor instances in the vicinity of the selected reference point to identify a group of instances closely related to the reference, facilitating subsequent estimation.
• Interpolation generation: Generating new sample points using the selected neighbor samples and their weights, which is the core mechanism of SMOTE and effectively increases the number of samples in minority classes.
• Process repetition: Continuing the process iteratively to generate a substantial amount of new samples, thus ensuring the completeness and adequacy of the oversampling technique.
The application of SMOTE provides a fairer platform for model performance evaluation, which is particularly crucial for enhancing the recognition capabilities of critical disease classes in the field of medical signal processing. Future research directions will focus on the fine-tuning and optimization of SMOTE’s parameters and exploring its potential applications in the diagnosis of different heart diseases. Through these efforts, we expect to further improve the classification performance and clinical reliability of the model, providing more accurate tools for the early diagnosis and personalized treatment of heart disease.
2.3. Interpretability Analysis
In the task of ECG signal classification, deep learning models, especially CNNs, have demonstrated their high efficiency [1,2,3,18]. However, the decision-making processes of these models often lack transparency, widely referred to as the “black box” problem [6,25,26]. For the end-users of the models, including physicians and clinical experts, understanding the internal workings and decision logic of the models is crucial [27]. This opacity can lead to a decrease in trust in the model’s predictions by medical professionals, particularly in medical diagnostic situations where a detailed explanation of the model’s behavior is required [7].
To address this issue, this study employs UMAP dimensionality reduction technology and SHAP value analysis, both of which enhance the interpretability of AI models. UMAP technology allows us to intuitively observe the distribution of data points in two or three-dimensional space by mapping high-dimensional ECG data to lower dimensions, thereby revealing the model’s classification boundaries and decision-making processes [8,9]. This approach not only helps us understand how the model learns the characteristics of the data but also shows the distinguishability between samples of different classes [13].
SHAP value analysis further quantifies the contribution of each ECG signal feature to the model’s prediction outcome. SHAP values are based on the Shapley value from game theory, which is used to explain the importance of each feature in the model’s prediction [14]. The SHAP value of each feature represents its average contribution to the model’s output, where positive values indicate a positive correlation, and negative values indicate a negative correlation [12]. By calculating and analyzing SHAP values, researchers and clinical doctors can identify the most critical ECG features for model predictions, which helps in understanding the reasons behind specific predictions and thus enhances the model’s credibility and transparency [12,14].
Integrating the results of UMAP and SHAP value analysis, this study aims to provide a more comprehensible perspective, assisting medical professionals in gaining an in-depth insight into the model’s decision-making mechanisms. This enhanced interpretability not only helps to establish trust in AI models but also meets the strict requirements for transparency and compliance in the medical field, thereby promoting the application of deep learning models in actual clinical settings.
2.4. Comparison with Existing Work
In the research of ECG signal classification, deep learning models such as CNNs have achieved remarkable results [28,29], but the opacity of their decision-making processes can lead to a decrease in trust in clinical applications [7]. In the domain of ECG signal classification, SHAP value analysis has proven to be a powerful tool for identifying and interpreting key features that affect model predictions [7]. Existing studies have shown that SHAP values play a significant role in recognizing crucial frequency features in ECG signals, predicting ST-segment elevations for cardiac events, and offering other diagnostic insights [5,6,25-27]. For instance, Rashed-Al-Mahfu et al [30] successfully demonstrated the effectiveness of SHAP value analysis in identifying key frequency features that impact ECG signal classification. Moreover, Goldschmied et al [31] used SHAP value analysis to reveal ST-segment elevation in ECG as a key predictor of cardiac events, while Mehari et al [32] showed a strong correlation between SHAP values and other feature importance ranking methods, providing new perspectives for heart disease diagnosis. The ECG-iCOVIDNet model proposed by Agrawal et al [33] enhanced the interpretability of ECG changes in COVID-19 convalescent patients using SHAP technology, and Jekova et al [34] assessed the importance of atrioventricular synchrony in atrial fibrillation detection with SHAP value analysis. In this study, we not only calculated the SHAP values for each feature in the ECG signals but also developed an intuitive visualization method that allows clinical doctors to clearly discern the contribution of each feature to the model’s prediction outcomes. This visualization tool not only aids physicians in understanding the model’s decision-making process but also facilitates the integration of their professional knowledge with model predictions for more accurate clinical diagnoses. Furthermore, our research employed the SMOTE method for oversampling minority class samples, expanding the categories of ECG signal classification from the traditional five classes to six and ten classes, effectively addressing the issue of data imbalance.
In summary, by integrating UMAP dimensionality reduction and SHAP value analysis, our study not only enhanced the model’s interpretability but also provided a powerful tool to help clinical physicians better understand and trust the predictions of AI models. This approach offers new perspectives in the field of ECG signal classification and paves new ways for future research and clinical practice. With these innovative methods, we believe that we can significantly improve the acceptance and utility of the model in clinical practice, thereby having a profound impact on the early diagnosis and personalized treatment of heart disease.
3. Materials and Methods
The objective of this study is to develop a CNN-based model for the classification of ECG signals, with a particular focus on addressing the challenges posed by imbalanced datasets and enhancing the interpretability of the model.
3.1. Dataset Description
The MIT-BIH Arrhythmia Database, created by Beth Israel Hospital, is a publicly available dataset that comprises 48 ECG recordings of varying durations. These recordings capture signals of various cardiac rhythm states, including normal sinus rhythm and multiple types of arrhythmias. Each ECG record is accompanied by detailed temporal annotations, independently completed by two cardiac experts, which include the classification of heartbeats and the categorization of significant cardiac events, such as the occurrence of arrhythmias. The recordings cover an extensive range of rhythm states, providing researchers with a comprehensive testing environment. They are typically sampled at a rate of 360 times per second with a precision of 10 or 16 bits. Because of its authority and standardization, the MIT-BIH database is commonly used as a standard test set for evaluating the performance of new algorithms, and researchers often report the performance of their algorithms on this database. In this study, we utilized the wfdb package (version 4.1.2) to extract and classify arrhythmia data, which includes the following categories: Normal ECG (NOR), Pacemaker Beat (PB), Left Bundle Branch Block (LBBB), Right Bundle Branch Block (RBBB), Atrial Premature Beat (PAC), Ventricular Premature Beat (PVC), Pacemaker Fusion Beat (PFHB), Nodal Escape Beat (NEB), Abnormal Atrial Premature Beat (AAPB), and Ventricular Fusion Beat (VFB). In the ECG dataset utilized for this research, there exists a significantly disproportionate allocation of samples among the various classes. Specifically, categories such as PFHB, NEB, AAPB, and VFB have far fewer samples than the NOR. This class imbalance phenomenon may affect the model’s ability to recognize minority classes and is an issue that requires special attention. Figure 1 displays the distribution of the six-class and ten-class data, visually revealing the imbalance problem in the dataset. To prepare the data for model training and testing, we employed the train_test_split function from the scikit-learn library to divide the ECG dataset into training and testing sets, with proportions of 70% and 30%, respectively. The training set will be used to train the model to learn and recognize different cardiac rhythm characteristics. The testing set is then used to evaluate the model’s classification performance, ensuring its accuracy and reliability on unseen data.
3.2. Data Preprocessing
• Noise Reduction: This study utilized wavelet filtering techniques to enhance the quality of ECG signals. In comparison to traditional band-pass filters, wavelet filtering provides a more adaptable signal processing method, enabling customized filtering effects across a range of frequencies [35]. By applying a 9-scale wavelet transform with the Daubechies 5 (db5) wavelet basis, we were able to decompose the signal, identify, and remove noise at specific frequencies, such as from electromyographic interference or power line interference, while retaining the essential ECG information. This process encompasses wavelet decomposition, noise identification and removal, and wavelet reconstruction to ensure that the denoised signal maintains the features required for cardiac condition analysis.
• Normalization: Normalization is a pivotal preprocessing step that improves the performance of machine learning algorithms. In ECG signal analysis, normalization involves scaling the signal to a consistent range, which hastens algorithm convergence, bolsters training stability, averts numerical issues, and enhances the model’s generalization capabilities. This assists the model in learning the patterns within the data more efficiently and minimizes the impact of variances in feature scales.
• Segmentation: The precise detection of R-peaks in ECG signals is essential for calculating heart rate and synchronizing heartbeats. In this study, we segmented the signals into parts that include a complete cardiac cycle, centered around the detected R-peaks, with each segment consisting of 150 data points preceding and following the R-peak. This approach to segmentation ensures that the signal segments are aligned with their annotations, which is crucial for the effectiveness of supervised learning algorithms.
3.3. CNN Architecture Design
In this study, we employed the PyTorch framework (version 2.2.2) to construct a one-dimensional Convolutional Neural Network (1D CNN) model for the classification of Electrocardiogram (ECG) signals. The detailed description of the model construction is as follows:
• Convolutional Layers: We selected small convolutional kernels (kernel size = 3) to focus on capturing local features of the ECG signals.
• Pooling Layers: Following the convolutional layers, we utilized max pooling to reduce the spatial dimensions of the features, which also enhances the model’s adaptability to signal variations and improves its generalization capabilities.
• Fully Connected Layers: After the convolutional and pooling layers, fully connected layers were used to map the extracted features into a decision space, integrating the necessary information for accurate classification.
• Output Layer: The model generates classification predictions by outputting the probability distribution across 6 or 10 categories through the softmax activation function in the output layer.
The network training utilized a cross-entropy loss function and the Adam optimizer to achieve a rapid and stable learning effect. The initial learning rate was set to 0.0005, and a learning rate decay strategy was implemented, reducing the learning rate by 10% every 3 epochs. This decay strategy helps the model to avoid overfitting during training and continuously enhances its generalization ability.
As shown in Figure 2, the input layer of the model accepts data with a dimension of 300x1, representing single-channel ECG signals from 300 time points. The model includes 6 convolutional layers, with batch normalization and ReLU activation functions applied after each layer to introduce nonlinear transformations. Max pooling layers (kernel size of 2, stride of 2) were applied after the 2nd, 4th, and 6th layers, which helps to extract more abstract features and reduce the complexity of the model. Subsequently, the model connects to 4 fully connected layers, and the output layer provides the classification results. With this structural design, our CNN model can not only effectively learn the complex features of ECG signals but also gain an in-depth understanding of the classification decision-making process while maintaining high accuracy.
3.4. Experiments
The core of this study is to enhance the interpretability of the ECG signal classification model through a series of evaluation metrics and to validate the model’s performance. The experimental section provides a detailed description of the computational environment, evaluation metrics, experimental design, and how to improve the model’s interpretability through UMAP dimensionality reduction technology and SHAP value analysis.
3.4.1. Computing Environment
The computational tasks were executed on a Mac Studio with the Apple Silicon M2 chip, featuring 96GB of high-speed memory for efficient handling of large datasets. The 12-core CPU enhances parallel processing, and the 38-core GPU’s robust graphics processing is optimized for deep learning, notably reducing CNN training times. The experimental code was written in python (version 3.8.19), using the PyTorch framework (version 2.2.2) to build and train the CNN model. The wfdb library (version 4.1.2) was used to extract ECG signals from the MIT-BIH database. Scientific computing was assisted by pandas (version 2.0.3) and numpy (version 1.24.3). Plotting was done using Matplotlib (version 3.7.2) and seaborn (version 0.12.2), while UMAP (version 0.5.6) and SHAP (version 0.44.1) were used for model interpretability analysis.
3.4.2. Model Evaluation Indicators
In this study, a series of evaluation indicators were employed to quantify the model’s performance, providing a comprehensive reflection of its effectiveness in the task of ECG signal classification.
Accuracy: Accuracy is the most straightforward performance metric, representing the proportion of correctly predicted samples out of the total number of samples. The formula is:
where TP (true positives) is the number of true positive instances, TN (true negatives) is the number of true negative instances, FP (false positives) is the number of false positive instances, and FN (false negatives) is the number of false negative instances.
Recall: Also known as sensitivity, measures the model’s ability to identify all actual positive class samples. The formula is:
Precision: Precision measures the proportion of true positive predictions among the positive predictions made by the model, reflecting the model’s accuracy. The formula is:
F1 Score: The F1 score is the harmonic mean of recall and precision, balancing the two and providing a comprehensive measure of performance. The formula is:
ROC Curve: The Receiver Operating Characteristic (ROC) curve assesses model performance by plotting the true positive rate (recall) against the false positive rate (1-specificity) at various threshold settings. The AUC value (Area Under the ROC Curve) is a probability measure of the model’s ability to rank random positive instances ahead of random negative instances, with an area closer to 1.0 indicating better model performance.
Average Precision Score (AP): The AP score is the average of precision scores at different classification thresholds, particularly useful for imbalanced datasets.
Confusion Matrix: A confusion matrix is a table that allows a detailed observation of the model’s performance on each category, including TP, FP, TN, and FN. It is especially important for understanding the model’s ability to identify samples from minority classes.
3.4.3. UMAP Dimensionality Reduction Visualization
Through UMAP dimensionality reduction technology, we enable the transformation of high-dimensional ECG signal features within the CNN model into a lower-dimensional space, which clearly exposes the sample distribution and classification decision boundaries [8]. This process not only facilitates an intuitive comprehension of the model’s classification behavior but also maintains the original neighborhood structure of the data [9]. UMAP is particularly effective for analyzing the activation vectors from the intermediate layers of the CNN model [36]; these advanced feature representations assist us in recognizing how the model grasps the abstract characteristics of the data. The visualization results from UMAP dimensionality reduction enable us to evaluate the model’s performance. Clearly separated sample clusters indicate that the model has good generalization capabilities, while the mixing of sample points suggests challenges the model faces in classifying certain categories. This intuitive visualization tool is crucial for optimizing the model structure and enhancing classification accuracy [13].
The Intuitive visualization delivered by UMAP helps clinical doctors understand the model’s behavior, allowing them to more confidently integrate the model’s predictive results into clinical decision-making. The feature representations and sample distribution information revealed by UMAP dimensionality reduction can guide the adjustment and optimization of the model structure[36]. If samples from certain categories overlap in the feature space, it may be necessary to further engineer features or improve the model architecture. Through UMAP dimensionality reduction technology, we can gain a deeper understanding of how the CNN model operates in the task of ECG signal classification, which is significant for enhancing the model’s interpretability and clinical application value.
The Implementation of UMAP Is based on the following key steps [10,37]: Finding nearest neighbors: In the high-dimensional space (X), the Euclidean distance between pairs of data points is calculated to determine the nearest neighbor set Nr(i) for each data point xi. Local density estimation: The local density ρi of each data point is estimated through the nearest neighbor distances, which can be achieved by summing Gaussian weights, where σi is the bandwidth parameter associated with point i. Constructing a low-dimensional space: A low-dimensional space (Y) is created, where each point yi represents the point xi mapped from the high-dimensional space. Optimizing the mapping: The positions of points in the low-dimensional space are adjusted to minimize the UMAP objective function, preserving the local structure of the high-dimensional space in the low-dimensional representation.
The mathematical expression of the UMAP objective function Is based on the cross-entropy difference between the high-dimensional and low-dimensional spaces and can be represented as:
where pij is the similarity between points xi and xj in the high-dimensional space, typically calculated using a Gaussian kernel:
where dij is the Euclidean distance between xi and xj. 𝑞𝑖𝑗 is the similarity between points yi and yj in the low-dimensional space, defined similarly but based on distances in the low-dimensional space. UMAP employs stochastic gradient descent (SGD) or other optimization algorithms to adjust the positions of points in the low-dimensional space to minimize the objective function L(Y).
3.4.4. SHAP Value Analysis
SHAP values, by quantifying the contribution of each feature to the model’s prediction outcome, provide a tool for doctors and researchers to identify the most critical features in ECG signals for model predictions and to gain a deep understanding of the model’s decision-making logic [32,34,38,39]. The SHAP values, based on the Shapley values from cooperative game theory which are used for fair resource allocation, are applied in machine learning to measure the marginal contribution of each feature to the model’s prediction [11,40]. The SHAP value for each feature represents its average contribution across all possible combinations of features, with the sign indicating the direction of the feature’s impact on the prediction outcome: positive correlation or negative correlation [39,41].
Despite the computational intensity required to calculate SHAP values, considering all possible feature combinations, the algorithms provided by the SHAP library can efficiently compute these values, especially suitable for decision tree and deep learning models [11,14]. SHAP values not only help to reveal the internal workings of the model but also visually display each feature’s contribution to the prediction outcome through visualization, which is particularly useful for non-technical users to understand model predictions [32,38]. Furthermore, SHAP value analysis helps to confirm the consistency and stability of model predictions; if multiple samples show similar SHAP value patterns, it indicates that the model has good generalization capabilities [34].
SHAP value analysis also facilitates effective communication between doctors and machine learning experts, allowing both parties to understand and improve the model by discussing SHAP values [32,42]. In the medical field, regulatory agencies require transparency in the decision-making processes of medical devices and software, and SHAP value analysis provides a method to meet these requirements, promoting the application of the model in clinical practice [41,43]. Overall, by using SHAP value analysis, we can provide an interpretable framework for the ECG signal classification model, which is crucial for enhancing the model’s clinical application value and gaining the trust of medical professionals [30,34].
The core Idea Is to consider all possible combinations of features and calculate the average contribution of each feature across these combinations [38,39]. The mathematical expression for the SHAP value for a given sample I and feature j, Sij can be computed as:
where M is the set of all features in the model, S is any subset of M excluding feature j, mi(S) is the model's prediction for sample i when the set of features is S.
The expected SHAP value, which represents the average contribution of feature j to the model's prediction across the entire dataset, can be calculated as:
By employing these methods, we aim to enhance the interpretability of deep learning models in the classification of ECG signals, making it easier for medical professionals to understand the decision-making process of the models [30,34]. This not only helps to build trust in the models but also meets regulatory requirements in the medical field, ultimately promoting the application of deep learning models in actual clinical settings.
4. Results and Discussion
4.1. Model Training Process
In this study, we employed a standardized ECG signal dataset, categorizing it into six and ten classes based on varying cardiac conditions or signal features. To enhance training efficiency and align with computational resources, we opted for a batch size of 1,280 ECG signal samples for the training process. The model underwent training for 30 epochs, which signifies that the dataset was processed in full 30 times. We set the initial learning rate at 0.0005 to ensure substantial updates to the network weights during the early training phase without causing abrupt changes. To bolster the model's generalization capabilities, we implemented a learning rate decay strategy that reduced the learning rate by 10% every three epochs. This approach facilitated rapid convergence during the initial training phase and subsequently fine-tuned the model weights, reducing the risk of overfitting. At the conclusion of each epoch, the model's performance was evaluated using a distinct test set. The model variant that exhibited the most favorable performance across all evaluation metrics on the test set was selected as the final model for this study, ensuring its robust generalization to new, unseen data. Figure 3(a), 3(b), 3(c), and 3(d) illustrate the performance metric curves of the model on the training and test sets for both classification tasks. These visual representations not only chronicle the model's learning trajectory throughout the training process but also serve as graphical aids in model selection.
4.2. Model Evaluation Indicators
In this study, the CNN-based ECG signal classification model achieved outstanding performance on both the six-class and ten-class datasets, as detailed in Table 1 and Table 2. The model excelled across various evaluation metrics, with macro and weighted averages exceeding 0.97 and 0.91, respectively, for the six-class and ten-class datasets. These scores underscore the model’s effectiveness in recognizing cardiac rhythms and its robustness against class imbalances.
In the six-class classification task, the CNN model demonstrated exceptional performance in identifying various cardiac rhythm categories, particularly in distinguishing between normal and abnormal patterns with high accuracy and precision. Specifically, for the categories of NOR, LBBB, RBBB, and PVC, the model achieved accuracy and precision rates nearing 1.00, with F1 scores also close to the perfect score. These results reflect the model’s high efficiency and reliability in differentiating these cardiac rhythm classes. The AUC and AP values, which were either perfect or nearly so, further substantiate the model’s excellent discriminative power for these specific classes. Collectively, these findings underscore the potential utility of the CNN model in the automated classification of ECG signals, especially for common and critical arrhythmia types. Furthermore, the CNN model exhibited extremely high accuracy and precision in recognizing PB and PAC. Despite a slight decrease in the recall rate for PB, which might suggest minor omissions in identifying all instances of this condition, the AUC and AP values for PB were perfect, indicating that the model can accurately identify PB in virtually all instances where it occurs. For PAC, while the accuracy was relatively lower—potentially due to the limited number of PAC instances in the dataset, affecting the model’s generalization capability—the model still showed a very high recall rate and F1 score, with precision being exceptionally high and AUC and AP values indicating good performance. These outcomes indicate that the CNN model maintains robust classification performance, even when faced with challenges in certain categories, particularly in distinguishing between the critical arrhythmic events of PB and PAC. In summary, the CNN model’s performance across the six-class classification task is highly commendable, with a strong potential for application in the clinical setting for the automatic classification and analysis of ECG signals. The model’s ability to accurately classify both common and critical cardiac rhythm disturbances, as well as its robustness against class imbalances, positions it as a valuable tool for enhancing the accuracy and efficiency of ECG signal analysis.
In the ten-class classification task, the CNN model exhibited exceptional performance, effectively handling the increased complexity of the challenge. The model maintained high standards of accuracy and efficiency in identifying arrhythmias such as NOR, PB, LBBB, PAC, and PVC, with performance metrics that were on par with those from the six-class classification task. Particularly noteworthy is the model’s performance in the PFHB category, where it achieved high marks across all metrics: accuracy (0.9846), precision (0.9783), recall (0.9736), and F1 score (0.9760). The AUC (0.9999) and AP (0.9885) scores were nearly perfect, underscoring the model’s superior discriminative capacity for this arrhythmia. The model’s robustness was also evident in the VFB (Ventricular Flutter and Ventricular Fibrillation) category, with high accuracy (0.8048), precision (0.8261), recall (0.8261), and F1 score (0.8261). The AUC (0.9929) and AP (0.8802) scores substantiated the model’s reliability in detecting this critical condition. In the AAPB (Atrial Premature Beat with Intraventricular Conduction Abnormality) category, the model displayed remarkably high precision (0.9275) and recall (0.9846), despite a lower accuracy (0.6923). The F1 score (0.9552) pointed to a high degree of correctness in the model’s identification of this arrhythmia. The AUC (0.9734) and AP (0.7525) further indicated the model’s formidable predictive capabilities for AAPB. Conversely, the model’s performance in the NEB (Nonspecific Intraventricular Block) category was less remarkable compared to the other categories, with lower accuracy (0.8261) and recall (0.6923). However, the precision (0.8571) and F1 score (0.7660) remained commendable, and the AUC (0.9855) and AP (0.8398) suggested that the model still provided a satisfactory level of performance for NEB, albeit with opportunities for enhancement. To encapsulate, the CNN model has proven its prowess in the automated classification and analysis of ECG signals, sustaining high levels of performance and reliability even in the face of severely imbalanced classes. The model’s effectiveness is particularly pronounced in categories such as PFHB, VFB, and AAPB, while for categories like NEB, it shows promise and efficacy despite some decline in performance.
4.3. Confusion Matrix
The confusion matrix is particularly useful as it not only highlights the correct classifications made by the model but also illuminates any misclassifications [44]. By examining the off-diagonal elements of the matrix, one can identify the types of arrhythmias that the model commonly confuses. This is crucial for understanding the limitations of the model and guiding future improvements. For instance, if the model consistently mistakes one type of arrhythmia for another, it suggests a need for additional training data or potentially a more sophisticated feature representation for those specific classes.
During the evaluation of our ECG signal classification model, the confusion matrix emerged as an indispensable tool for assessing the accuracy of our classification tasks. It provided a comprehensive overview of the model’s predictive performance when classifying ECG signals into distinct categories. The confusion matrix not only confirmed the model’s classification accuracy, evident from the high values along the matrix’s main diagonal, but also revealed areas where the model’s predictive capabilities could be enhanced.
As depicted in Figure 4(a) and 4(b), the confusion matrix graphically represents the model’s accuracy in categorizing each type of ECG signal. Entries along the main diagonal indicate correct classifications, while off-diagonal elements reveal instances of misclassification. This detailed breakdown allows for a nuanced understanding of the model’s strengths and weaknesses, pinpointing the arrhythmia classes that the model struggles with the most. Such insights are invaluable, as they direct our efforts towards enhancing the model’s performance through targeted data acquisition strategies and algorithmic refinements. In summary, the confusion matrix is a pivotal component in the model evaluation process, offering a granular view of the model’s classification accuracy and guiding targeted enhancements to improve its predictive performance across different ECG signal categories.
4.4. ROC Curve and AUC Value
In evaluating the performance of the ECG signal classification model, we utilized the ROC curve analysis, a widely recognized method in academia for assessing the diagnostic capabilities of classification models. In our study, both the six-class dataset's ROC curve (Figure 5(a)) and the ten-class dataset's ROC curve (Figure 5(b)) demonstrated the model's outstanding performance across different classification tasks. Specifically, under the six-class classification, the AUC values for all categories were close to 1.00, indicating near-perfect discrimination. For the ten-class classification, the AUC values for all categories exceeded 0.97, suggesting a very high level of model performance. These high AUC values indicate that the model maintains a high true positive rate while effectively controlling the false positive rate across different decision thresholds, which is highly desirable for clinical applications. The ROC curve analysis is a valuable tool in the evaluation process as it provides a visual representation of the trade-off between sensitivity (TPR) and specificity (1 - FPR) for different threshold settings. A model with an AUC value close to 1.00 indicates that it has an excellent ability to distinguish between positive and negative classes, which is crucial for the clinical utility of the model. The ROC curve also allows for the comparison of performance across different classes within the same model, offering insights into where the model may require further refinement. In summary, the high AUC values observed in our study for both the six-class and ten-class classification tasks underscore the model's strong predictive power and its potential as a valuable tool for the automatic classification and analysis of ECG signals in clinical settings.
4.5. Precision-Recall Curve
In this study, to thoroughly evaluate the performance of the ECG signal classification model on imbalanced datasets, we utilized the PR (Precision-Recall) curve and the AP (Average Precision) value as our primary assessment metrics. The PR curve delineates the model's performance across various thresholds by depicting the interplay between precision and recall, while the AP value quantifies the model's overall predictive performance. The PR curves for both the six-class and ten-class datasets are depicted in Figure 6(a) and 6(b), respectively, offering a granular view of the model's classification efficacy for each ECG signal category. Our experimental findings indicate that the CNN-based ECG signal classification model we developed has delivered exceptional predictive performance across both classification tasks. Specifically, for the six-class dataset, AP values for all categories surpassed the high benchmark of 0.93, signifying the model's high predictive accuracy. Similarly, in the more granular ten-class dataset, the AP values for nearly all categories also exceeded 0.90, further corroborating the model's robust performance. However, for certain minority categories such as NEB, AAPB, and VFB, the AP values were 0.8398, 0.7525, and 0.8802, respectively, indicating a degree of performance variance in these classifications. Potential factors contributing to this phenomenon include limited sample size, the intricacy of signal features, and the necessity for enhanced model complexity.
To enhance the model's ability to identify specific categories, future research will focus on several key areas. First, we will tackle the issue of class imbalance in the dataset by employing oversampling or data augmentation techniques to bolster the sample size of less frequently occurring categories, thus improving the model's recognition capabilities for these groups [23,24]. Following this, we will refine feature engineering approaches and develop more sophisticated model architectures, possibly incorporating attention mechanisms, to enhance the model's ability to extract features from ECG signals. In addition, we will conduct a meticulous tuning of the parameters for the SMOTE oversampling method and other hyperparameters to determine the most effective model configuration. We will also explore the use of a multitask learning framework to simultaneously train the model on classification and related tasks, such as anomaly detection, which could improve the model's identification of less common categories. Moreover, we will engage in close collaboration with clinicians to harness their expertise in refining the model's feature representation and classification strategies. These efforts collectively aim to significantly boost the model's classification performance for minority class samples, increasing its practicality and reliability in clinical applications.
We are optimistic that these strategic research initiatives will lead to a substantial improvement in the model's classification performance for minority class samples, including NEB, AAPB, and VFB, thereby enhancing its clinical utility and reliability. While the current model has demonstrated significant success in classifying ECG signals, we recognize that there is room for improvement. Future research will be dedicated to refining the model's architecture, optimizing its feature extraction techniques, and testing its generalization across a wider range of clinical datasets. This will ensure that the model maintains high accuracy and reliability in various clinical contexts, ultimately providing more effective tools for the early diagnosis and personalized treatment of heart conditions.
4.6. UMAP Analysis
In this study, we delved into the intricacies of our CNN-based ECG signal classification model by employing UMAP, a powerful nonlinear dimensionality reduction technique [10,37]. We subjected the output from the final fully connected layer of our CNN model to UMAP, reducing the data to two dimensions and presenting it in Figure 7(a) and 7(b) for the six-class and ten-class datasets, respectively. This visualization provided a clear depiction of how different ECG signal classes are distributed and the decision boundaries that segregate them, offering critical insights into the model's classification accuracy and areas for potential enhancement.
The UMAP visualization revealed that our model achieved high accuracy in distinguishing among nearly all the categories, underscoring its robust predictive capabilities and the interpretability of its decision-making process. However, it also exposed areas where the model faces challenges, particularly in instances where ECG signals from various classes overlap in the reduced two-dimensional space, which could lead to misclassification. Notably, there were instances where abnormal ECG signals were incorrectly categorized as normal and vice versa, with fewer cases of misclassification among different types of abnormal ECG signals, corroborating the findings from the confusion matrix analysis. UMAP analysis provided an intuitive lens through which to identify the model's vulnerabilities with specific categories, suggesting that improvements are needed in recognizing samples from minority categories. This could be attributed to factors such as insufficient sample sizes or the complexity of feature representation. Future research directions include leveraging oversampling techniques and exploring innovative approaches to data preprocessing and feature extraction to bolster the model's ability to discern these challenging categories.
In summary, the application of UMAP for dimensionality reduction and visualization has been instrumental in elucidating the feature space of our CNN model and deciphering its classification behavior. The distinct clustering and well-defined decision boundaries observed in the UMAP plots for both the six-class and ten-class datasets are indicative of the model's promising clinical applicability in ECG signal analysis. Moving forward, our focus will be on refining the model's architecture, optimizing feature extraction methodologies, and assessing the model's generalizability across a broader spectrum of clinical datasets. These efforts aim to augment the model's utility and reliability in clinical settings, with a particular emphasis on enhancing the classification performance for minority class samples.
4.7. SHAP Interpretability Analysis
In this study, to enhance the interpretability of the ECG signal classification model, we employed SHAP value analysis. SHAP values, rooted in the principles of cooperative game theory's Shapley values, offer a means to quantify the contribution of each feature to the predictive outcomes of the model [30,34]. By calculating the SHAP values for samples within the test set, we were able to identify the critical ECG signal features that are pivotal to the model's decision-making process [32]. During the analysis phase, we initially selected the first 20,000 samples from the test set to serve as background data. Subsequently, based on the confidence levels of the predictions for each category, we selected representative samples from the remaining test set. The SHAP values for each feature of the ECG signals were computed and then presented using visualization techniques. Figure 8(a) and 8(b) illustrate the SHAP value visualization results for the six-class and ten-class datasets, respectively. In these visualizations, the original ECG signal is displayed in the first column, while columns two through eleven detail the SHAP values for the predictions of that category. The SHAP values graphically represent the impact of each feature on the model's classification decisions. ECG signals located on the main diagonal represent instances that were correctly predicted, with the color intensity indicating the magnitude of the marginal effect on the prediction, where red signifies a positive marginal effect, and blue indicates a negative marginal effect. This provides a clear and intuitive understanding of the most influential factors in the model's decision-making process. Such an in-depth analysis not only highlights features that are consistently important across many instances but also those that may have a particularly significant impact under certain conditions or specific contexts.
In this study, we conducted an in-depth analysis of the performance of the ECG signal classification model through SHAP value visualization techniques. The model demonstrated robustness in identifying various categories of abnormal ECG signals, effectively distinguishing between different cardiac anomalies. Despite this, the model faced challenges in differentiating normal from abnormal ECGs, which may be attributed to subtle differences between them or limitations in the model's ability to capture these nuanced features. The visualization of SHAP values revealed the effectiveness of the model in utilizing ECG signal features for classification. Red features are concentrated on the main diagonal, indicating that the model can effectively use these features to differentiate between various categories of anomalies. However, when abnormal ECG signals were incorrectly predicted as normal, prominent red features also appeared, highlighting the model's difficulty in distinguishing between normal and abnormal ECGs. This challenge may stem from the greater variability in normal ECGs or the model's limitations in recognizing specific patterns.
The model identified certain features that align with medical knowledge, such as the Wide and Notched QRS Complexes observed in the identification of PVC, along with deeply inverted T waves. Pacing pulse signals and blunted S waves were recognized in the identification of PB. For AAPB, the model focused on the relationship between the P wave and the R wave. The model's high reliance on the QRS complex during predictions is due to its significance in diagnosing heart diseases, as it represents the ventricular depolarization process, the morphology of which is crucial for cardiac diagnosis.
The advancement of Artificial Intelligence (AI) diagnostic technology in the realm of ECG analysis is progressively transforming the diagnostic and therapeutic paradigms for heart diseases. By employing state-of-the-art algorithms and machine learning techniques, AI has demonstrated its prowess in handling and analyzing vast datasets of ECG information, uncovering cardiac dysfunctions that may elude traditional detection methods, particularly in the identification of heart failure and other cardiac dysfunctions. The capability of AI algorithms to precisely detect cardiac dysfunctions from 12-lead ECGs was validated by research conducted at the Mayo Clinic in 2019[28]. By 2022, there has been a notable advancement in AI technology for ECG analysis. AI algorithms have begun to utilize single-lead ECG data collected from wearable devices like smartwatches, identifying patients with a low ejection fraction (EF) with high accuracy by analyzing average predictions over extended time frames or the most relevant ECG records in relation to key medical examinations[29].
However, despite the significant achievements of AI algorithms in enhancing diagnostic accuracy, the opacity of their decision-making processes has remained a challenge. The SHAP value analysis method offers a solution to this issue by quantifying the specific contribution of each feature to the model's predictive outcome, thereby making the model's decision-making process more transparent. With SHAP value analysis, physicians can intuitively identify the key ECG features that significantly impact the diagnosis of heart failure, enabling more precise diagnostic procedures. Once these critical ECG features are identified, doctors can diagnose potential heart diseases at an earlier stage and provide personalized treatment plans tailored to the specific conditions of individual patients. The evolution of AI diagnostic technology, coupled with the application of SHAP value analysis, may even lead to a redefinition of ECG diagnostic criteria, improving the diagnosis of heart diseases based on these newly identified key features.
In summary, the development of AI diagnostic technology in ECG analysis has not only improved the precision of heart disease diagnosis but also bolstered the transparency and credibility of models through tools like SHAP value analysis. These technological advancements foretell an increasingly pivotal role for AI in the future diagnosis and treatment of heart diseases, offering robust support for early detection and personalized therapy.
4.8. Summary
I In this study, the deep learning model we proposed has demonstrated exceptional performance across various evaluation metrics, including accuracy, recall, precision, F1 score, AUC, and AP values. These comprehensive results not only confirm the model's effectiveness in managing imbalanced datasets but also underscore its potential application value in clinical diagnosis. Our model has achieved satisfactory performance in identifying minority class samples, primarily due to the application of the SMOTE technique, which significantly enhances the model's ability to recognize these samples through interpolation in the spatial and temporal dimensions of the minority class samples.
The use of UMAP dimensionality reduction and SHAP value analysis was an innovative aspect of our study. UMAP technology, by visualizing the distribution of different classes of ECG signals in a two-dimensional space, provided a macroscopic perspective that aids in understanding the model's classification behavior. On the other hand, SHAP value analysis offered a microscopic perspective by quantifying the contribution of each ECG signal feature to the predictive results, revealing the intrinsic mechanisms behind the model's decisions. By combining the results of UMAP and SHAP analysis, we were able to evaluate the model's performance comprehensively and gain an in-depth understanding of the decision-making process. UMAP, by preserving the local neighborhood structure of high-dimensional data in a low-dimensional space, assists us in visualizing the complex features of ECG signals. In a clinical setting, physicians can intuitively see how different classes of ECG signals are separated in the reduced-dimensional space, which increases trust in the model's predictions. Moreover, the clustering and boundary information revealed by UMAP can help physicians identify potential challenges the model faces in distinguishing between normal and abnormal ECG signals, such as signal overlap or ambiguous decision boundaries. SHAP value analysis, by quantifying the contribution of each ECG signal feature to the predictive results, provides a detailed explanation for each prediction. In clinical practice, physicians can identify features that significantly affect the prediction of specific heart disease types. By understanding how these features influence the model's predictions, physicians can better integrate their clinical experience with the model's output for more accurate diagnoses. The visualization of SHAP values also enables medical professionals without a technical background to understand the model's behavior, as it provides an intuitive interface to display the impact of each feature on the predictive outcome.
Future work will focus on improving the model architecture, optimizing feature extraction techniques, and testing the model's generalization capabilities on a broader range of clinical datasets. We plan to collaborate with hospital HIS (Hospital Information System) systems to collect a wider array of ECG information and employ cross-validation methods to ensure the model's applicability and generalization across different patient groups and clinical settings. At the same time, we are exploring the use of deeper convolutional neural network architectures and considering the introduction of attention mechanisms to enhance the model's automatic feature extraction capabilities from ECG signals. The selection and parameter adjustment of SMOTE techniques will be based on a detailed analysis of their impact on model performance, and we will further investigate different oversampling strategies and assess their specific effects on model performance. Additionally, we will continue to utilize UMAP and SHAP value analysis by providing more visualization tools and case studies to help clinical doctors gain a deeper understanding of the model's predictive process. In future work, we plan to further explore the application of these tools in clinical decision-making and demonstrate through actual clinical cases how they can assist doctors in understanding and trusting the model's predictions. We believe that through these efforts, we can significantly improve the model's acceptance and utility in clinical practice. Through these efforts, we expect to further enhance the model's performance.
Despite the significant achievements of the model in this study for ECG signal classification tasks, we recognize that there is room for improvement. Future research may explore more complex model structures and advanced feature extraction techniques to enhance the model's classification performance. In summary, our study has not only enhanced the performance of ECG signal classification by applying interpretability analysis techniques to deep learning models but also provided new tools and a theoretical foundation for the automated analysis of ECG signal classification. We believe that these achievements will have a profound impact on the early diagnosis and personalized treatment of heart diseases.
5. Conclusions
In this study, we have successfully developed and evaluated a CNN-based ECG signal classification model that specifically addresses the issue of class imbalance and significantly improves the model's interpretability. By employing the SMOTE technique, we have enhanced the model's capacity to recognize samples from minority classes. Utilizing UMAP dimensionality reduction technology and SHAP value analysis, we have not only revealed the model's classification decision boundaries but also quantified the contribution of each ECG signal feature to the predictive results.
The experimental outcomes have demonstrated our model's exceptional performance across various evaluation metrics, including accuracy, recall, precision, F1 score, AUC, and AP. These results substantiate the model's efficiency in managing imbalanced datasets and highlight its potential applicability in clinical diagnosis. Notably, SHAP value analysis has unveiled key features of ECG signals associated with heart diseases, providing clinical physicians with new tools to better understand and trust the model's decision-making process.
While our model has achieved significant accomplishments in ECG signal classification tasks, we recognize that there is potential for further improvement. Future research may explore more complex model structures and advanced feature extraction techniques to enhance the model's classification performance. In summary, by applying interpretability analysis techniques to deep learning models, our study has not only enhanced the performance of ECG signal classification but also provided new tools and a theoretical foundation for the automated analysis of ECG signal classification. We believe that these achievements will have a profound impact on the early diagnosis and personalized treatment of heart diseases.
Author Contributions
Conceptualization, J.H.; methodology, G.W.; software, G.W.; formal analysis, X.Y. and G.W.; resources, J.H.; data curation, G.W; writing—original draft preparation, G.W.; writing—review and editing, Y.S and J.H.; visualization, G.W.; supervision, J.H.; project administration, J.H. All authors have read and agreed to the published version of the manuscript.
Funding
This research was funded by the Guided Science and Technology Project of Shiyan City Science and Technology Bureau, China, grant number 21Y43.
Institutional Review Board Statement
Not applicable.
Informed Consent Statement
Not applicable.
Data Availability Statement
Publicly available datasets were analyzed in this study. These data can be found here: https://www.physionet.org/content/mitdb/1.0.0/.
Acknowledgments
The authors would like to thank the MIT-BIH Public Data Collection for their continued support.
Conflicts of Interest
The authors declare no conflicts of interest.
References
- Chen, X.; Si, Y.; Zhang, Z.; Yang, W.; Feng, J. Improving Adversarial Robustness of ECG Classification Based on Lipschitz Constraints and Channel Activation Suppression. Sensors (Basel) 2024, 24. [Google Scholar] [CrossRef] [PubMed]
- Din, S.; Qaraqe, M.; Mourad, O.; Qaraqe, K.; Serpedin, E. ECG-based cardiac arrhythmias detection through ensemble learning and fusion of deep spatial-temporal and long-range dependency features. Artif Intell Med 2024, 150, 102818. [Google Scholar] [CrossRef] [PubMed]
- Zhou, F.; Li, J. ECG data enhancement method using generate adversarial networks based on Bi-LSTM and CBAM. Physiol Meas 2024, 45. [Google Scholar] [CrossRef] [PubMed]
- Healthcare Engineering, J.O. Retracted: Online Automatic Diagnosis System of Cardiac Arrhythmias Based on MIT-BIH ECG Database. J Healthc Eng 2023, 2023, 9873656. [Google Scholar] [CrossRef]
- Sengupta, S.; Anastasio, M.A. A Test Statistic Estimation-Based Approach for Establishing Self-Interpretable CNN-Based Binary Classifiers. IEEE Trans Med Imaging 2024, 43, 1753–1765. [Google Scholar] [CrossRef]
- Choukali, M.A.; Amirani, M.C.; Valizadeh, M.; Abbasi, A.; Komeili, M. Pseudo-class part prototype networks for interpretable breast cancer classification. Sci Rep 2024, 14, 10341. [Google Scholar] [CrossRef] [PubMed]
- Sanjana, K.; Sowmya, V.; Gopalakrishnan, E.A.; Soman, K.P. Explainable artificial intelligence for heart rate variability in ECG signal. Healthc Technol Lett 2020, 7, 146–154. [Google Scholar] [CrossRef] [PubMed]
- Armstrong, G.; Martino, C.; Rahman, G.; Gonzalez, A.; Vazquez-Baeza, Y.; Mishne, G.; Knight, R. Uniform Manifold Approximation and Projection (UMAP) Reveals Composite Patterns and Resolves Visualization Artifacts in Microbiome Data. mSystems 2021, 6, e0069121. [Google Scholar] [CrossRef] [PubMed]
- Weijler, L.; Kowarsch, F.; Wodlinger, M.; Reiter, M.; Maurer-Granofszky, M.; Schumich, A.; Dworzak, M.N. UMAP Based Anomaly Detection for Minimal Residual Disease Quantification within Acute Myeloid Leukemia. Cancers (Basel) 2022, 14. [Google Scholar] [CrossRef]
- Du, Y.; Sui, J.; Wang, S.; Fu, R.; Jia, C. Motor intent recognition of multi-feature fusion EEG signals by UMAP algorithm. Med Biol Eng Comput 2023, 61, 2665–2676. [Google Scholar] [CrossRef]
- Wang, X.; Wang, W.; Ren, H.; Li, X.; Wen, Y. Prediction and analysis of risk factors for diabetic retinopathy based on machine learning and interpretable models. Heliyon 2024, 10, e29497. [Google Scholar] [CrossRef] [PubMed]
- Uddin, M.J.; Fan, J. Interpretable Machine Learning Framework to Predict the Glass Transition Temperature of Polymers. Polymers (Basel) 2024, 16. [Google Scholar] [CrossRef] [PubMed]
- Ehiro, T. Feature importance-based interpretation of UMAP-visualized polymer space. Mol Inform 2023, 42, e2300061. [Google Scholar] [CrossRef] [PubMed]
- Ma, K. Integrated hybrid modeling and SHAP (SHapley Additive exPlanations) to predict and explain the adsorption properties of thermoplastic polyurethane (TPU) porous materials. RSC Adv 2024, 14, 10348–10357. [Google Scholar] [CrossRef] [PubMed]
- Mantravadi, A.; Saini, S.; Mittal, S.; Shah, S.; Devi, S.; Singhal, R. CLINet: A novel deep learning network for ECG signal classification. J Electrocardiol 2024, 83, 41–48. [Google Scholar] [CrossRef] [PubMed]
- Mallikarjunamallu, K.; Syed, K. Arrhythmia classification for non-experts using infinite impulse response (IIR)-filter-based machine learning and deep learning models of the electrocardiogram. PeerJ Comput Sci 2024, 10, e1774. [Google Scholar] [CrossRef] [PubMed]
- Lin, M.; Hong, Y.; Hong, S.; Zhang, S. Discrete Wavelet Transform based ECG classification using gcForest: A deep ensemble method. Technol Health Care 2024. [Google Scholar] [CrossRef] [PubMed]
- Mandala, S.; Rizal, A.; Adiwijaya; Nurmaini, S. ; Suci Amini, S.; Almayda Sudarisman, G.; Wen Hau, Y.; Hanan Abdullah, A. An improved method to detect arrhythmia using ensemble learning-based model in multi lead electrocardiogram (ECG). PLoS One 2024, 19, e0297551. [Google Scholar] [CrossRef] [PubMed]
- Lin, L.S.; Kao, C.H.; Li, Y.J.; Chen, H.H.; Chen, H.Y. Improved support vector machine classification for imbalanced medical datasets by novel hybrid sampling combining modified mega-trend-diffusion and bagging extreme learning machine model. Math Biosci Eng 2023, 20, 17672–17701. [Google Scholar] [CrossRef]
- Look, C.S.; Teixayavong, S.; Djarv, T.; Ho, A.F.; Tan, K.B.; Ong, M.E. Improved interpretable machine learning emergency department triage tool addressing class imbalance. Digit Health 2024, 10, 20552076241240910. [Google Scholar] [CrossRef]
- Millarch, A.S.; Bonde, A.; Bonde, M.; Klein, K.V.; Folke, F.; Rudolph, S.S.; Sillesen, M. Assessing optimal methods for transferring machine learning models to low-volume and imbalanced clinical datasets: experiences from predicting outcomes of Danish trauma patients. Front Digit Health 2023, 5, 1249258. [Google Scholar] [CrossRef] [PubMed]
- Wang, L.Z.; Chi, J.F.; Ding, Y.Q.; Yao, H.Y.; Guo, Q.; Yang, H.Q. Transformer fault diagnosis method based on SMOTE and NGO-GBDT. Sci Rep 2024, 14, 7179. [Google Scholar] [CrossRef] [PubMed]
- Ma, F.; Li, H. Online painting image clustering for the mental health of college art students based on improved CNN and SMOTE. PeerJ Comput Sci 2023, 9, e1462. [Google Scholar] [CrossRef]
- Kumari, M.; Subbarao, N. A hybrid resampling algorithms SMOTE and ENN based deep learning models for identification of Marburg virus inhibitors. Future Med Chem 2022, 14, 701–715. [Google Scholar] [CrossRef] [PubMed]
- Wang, W.; Dai, J.; Li, J.; Du, X. Predicting postoperative rehemorrhage in hypertensive intracerebral hemorrhage using noncontrast CT radiomics and clinical data with an interpretable machine learning approach. Sci Rep 2024, 14, 9717. [Google Scholar] [CrossRef] [PubMed]
- El Badisy, I.; BenBrahim, Z.; Khalis, M.; Elansari, S.; ElHitmi, Y.; Abbass, F.; Mellas, N.; El Rhazi, K. Author Correction: Risk factors affecting patients survival with colorectal cancer in Morocco: survival analysis using an interpretable machine learning approach. Sci Rep 2024, 14, 9985. [Google Scholar] [CrossRef] [PubMed]
- Sun, T.; Yue, X.; Zhang, G.; Lin, Q.; Chen, X.; Huang, T.; Li, X.; Liu, W.; Tao, Z. AKIML(pred): An interpretable machine learning model for predicting acute kidney injury within seven days in critically ill patients based on a prospective cohort study. Clin Chim Acta 2024, 559, 119705. [Google Scholar] [CrossRef]
- Attia, Z.I.; Kapa, S.; Lopez-Jimenez, F.; McKie, P.M.; Ladewig, D.J.; Satam, G.; Pellikka, P.A.; Enriquez-Sarano, M.; Noseworthy, P.A.; Munger, T.M.; et al. Screening for cardiac contractile dysfunction using an artificial intelligence-enabled electrocardiogram. Nat Med 2019, 25, 70–74. [Google Scholar] [CrossRef] [PubMed]
- Attia, Z.I.; Harmon, D.M.; Dugan, J.; Manka, L.; Lopez-Jimenez, F.; Lerman, A.; Siontis, K.C.; Noseworthy, P.A.; Yao, X.; Klavetter, E.W.; et al. Prospective evaluation of smartwatch-enabled detection of left ventricular dysfunction. Nat Med 2022, 28, 2497–2503. [Google Scholar] [CrossRef] [PubMed]
- Rashed-Al-Mahfuz, M.; Moni, M.A.; Lio, P.; Islam, S.M.S.; Berkovsky, S.; Khushi, M.; Quinn, J.M.W. Deep convolutional neural networks based ECG beats classification to diagnose cardiovascular conditions. Biomed Eng Lett 2021, 11, 147–162. [Google Scholar] [CrossRef]
- Goldschmied, A.; Sigle, M.; Faller, W.; Heurich, D.; Gawaz, M.; Muller, K.A.L. Preclinical identification of acute coronary syndrome without high sensitivity troponin assays using machine learning algorithms. Sci Rep 2024, 14, 9796. [Google Scholar] [CrossRef]
- Mehari, T.; Sundar, A.; Bosnjakovic, A.; Harris, P.; Williams, S.E.; Loewe, A.; Doessel, O.; Nagel, C.; Strodthoff, N.; Aston, P.J. ECG Feature Importance Rankings: Cardiologists vs. Algorithms. IEEE J Biomed Health Inform 2024, PP. [Google Scholar] [CrossRef] [PubMed]
- Agrawal, A.; Chauhan, A.; Shetty, M.K.; Gupta, M.D.; Gupta, A. ECG-iCOVIDNet: Interpretable AI model to identify changes in the ECG signals of post-COVID subjects. Comput Biol Med 2022, 146, 105540. [Google Scholar] [CrossRef]
- Jekova, I.; Christov, I.; Krasteva, V. Atrioventricular Synchronization for Detection of Atrial Fibrillation and Flutter in One to Twelve ECG Leads Using a Dense Neural Network Classifier. Sensors (Basel) 2022, 22. [Google Scholar] [CrossRef] [PubMed]
- Laskar, M.R.; Pratiher, S.; Dutta, A.K.; Ghosh, N.; Patra, A. A complexity efficient penta-diagonal quantum smoothing filter for bio-medical signal denoising: a study on ECG. Sci Rep 2024, 14, 10580. [Google Scholar] [CrossRef]
- Valente, C.; Wodzinski, M.; Guglielmini, C.; Poser, H.; Chiavegato, D.; Zotti, A.; Venturini, R.; Banzato, T. Development of an artificial intelligence-based method for the diagnosis of the severity of myxomatous mitral valve disease from canine chest radiographs. Front Vet Sci 2023, 10, 1227009. [Google Scholar] [CrossRef] [PubMed]
- Lim, H.S.; Qiu, P. Quantifying Cell-Type-Specific Differences of Single-Cell Datasets Using Uniform Manifold Approximation and Projection for Dimension Reduction and Shapley Additive exPlanations. J Comput Biol 2023, 30, 738–750. [Google Scholar] [CrossRef]
- Nordin, N.; Zainol, Z.; Mohd Noor, M.H.; Chan, L.F. An explainable predictive model for suicide attempt risk using an ensemble learning and Shapley Additive Explanations (SHAP) approach. Asian J Psychiatr 2023, 79, 103316. [Google Scholar] [CrossRef]
- Alkadhim, H.A.; Amin, M.N.; Ahmad, W.; Khan, K.; Nazar, S.; Faraz, M.I.; Imran, M. Evaluating the Strength and Impact of Raw Ingredients of Cement Mortar Incorporating Waste Glass Powder Using Machine Learning and SHapley Additive ExPlanations (SHAP) Methods. Materials (Basel) 2022, 15. [Google Scholar] [CrossRef]
- Adapa, K.; Pillai, M.; Foster, M.; Charguia, N.; Mazur, L. Using Explainable Supervised Machine Learning to Predict Burnout in Healthcare Professionals. Stud Health Technol Inform 2022, 294, 58–62. [Google Scholar] [CrossRef]
- Ntakolia, C.; Priftis, D.; Charakopoulou-Travlou, M.; Rannou, I.; Magklara, K.; Giannopoulou, I.; Kotsis, K.; Serdari, A.; Tsalamanios, E.; Grigoriadou, A.; et al. Correction: Ntakolia et al. An Explainable Machine Learning Approach for COVID-19's Impact on Mood States of Children and Adolescents during the First Lockdown in Greece. Healthcare 2022, 10, 149. Healthcare (Basel) 2022, 10. [Google Scholar] [CrossRef] [PubMed]
- Mohanty, S.D.; Lekan, D.; McCoy, T.P.; Jenkins, M.; Manda, P. Machine learning for predicting readmission risk among the frail: Explainable AI for healthcare. Patterns (N Y) 2022, 3, 100395. [Google Scholar] [CrossRef] [PubMed]
- Rasheed, K.; Qayyum, A.; Ghaly, M.; Al-Fuqaha, A.; Razi, A.; Qadir, J. Explainable, trustworthy, and ethical machine learning for healthcare: A survey. Comput Biol Med 2022, 149, 106043. [Google Scholar] [CrossRef] [PubMed]
- Phillips, G.; Teixeira, H.; Kelly, M.G.; Salas Herrero, F.; Varbiro, G.; Lyche Solheim, A.; Kolada, A.; Free, G.; Poikane, S. Setting nutrient boundaries to protect aquatic communities: The importance of comparing observed and predicted classifications using measures derived from a confusion matrix. Sci Total Environ 2024, 912, 168872. [Google Scholar] [CrossRef] [PubMed]
Figure 1.
Distribution of ECG categories across classification tasks. (a) six-class classification task; (b) ten-class classification task.
Figure 1.
Distribution of ECG categories across classification tasks. (a) six-class classification task; (b) ten-class classification task.
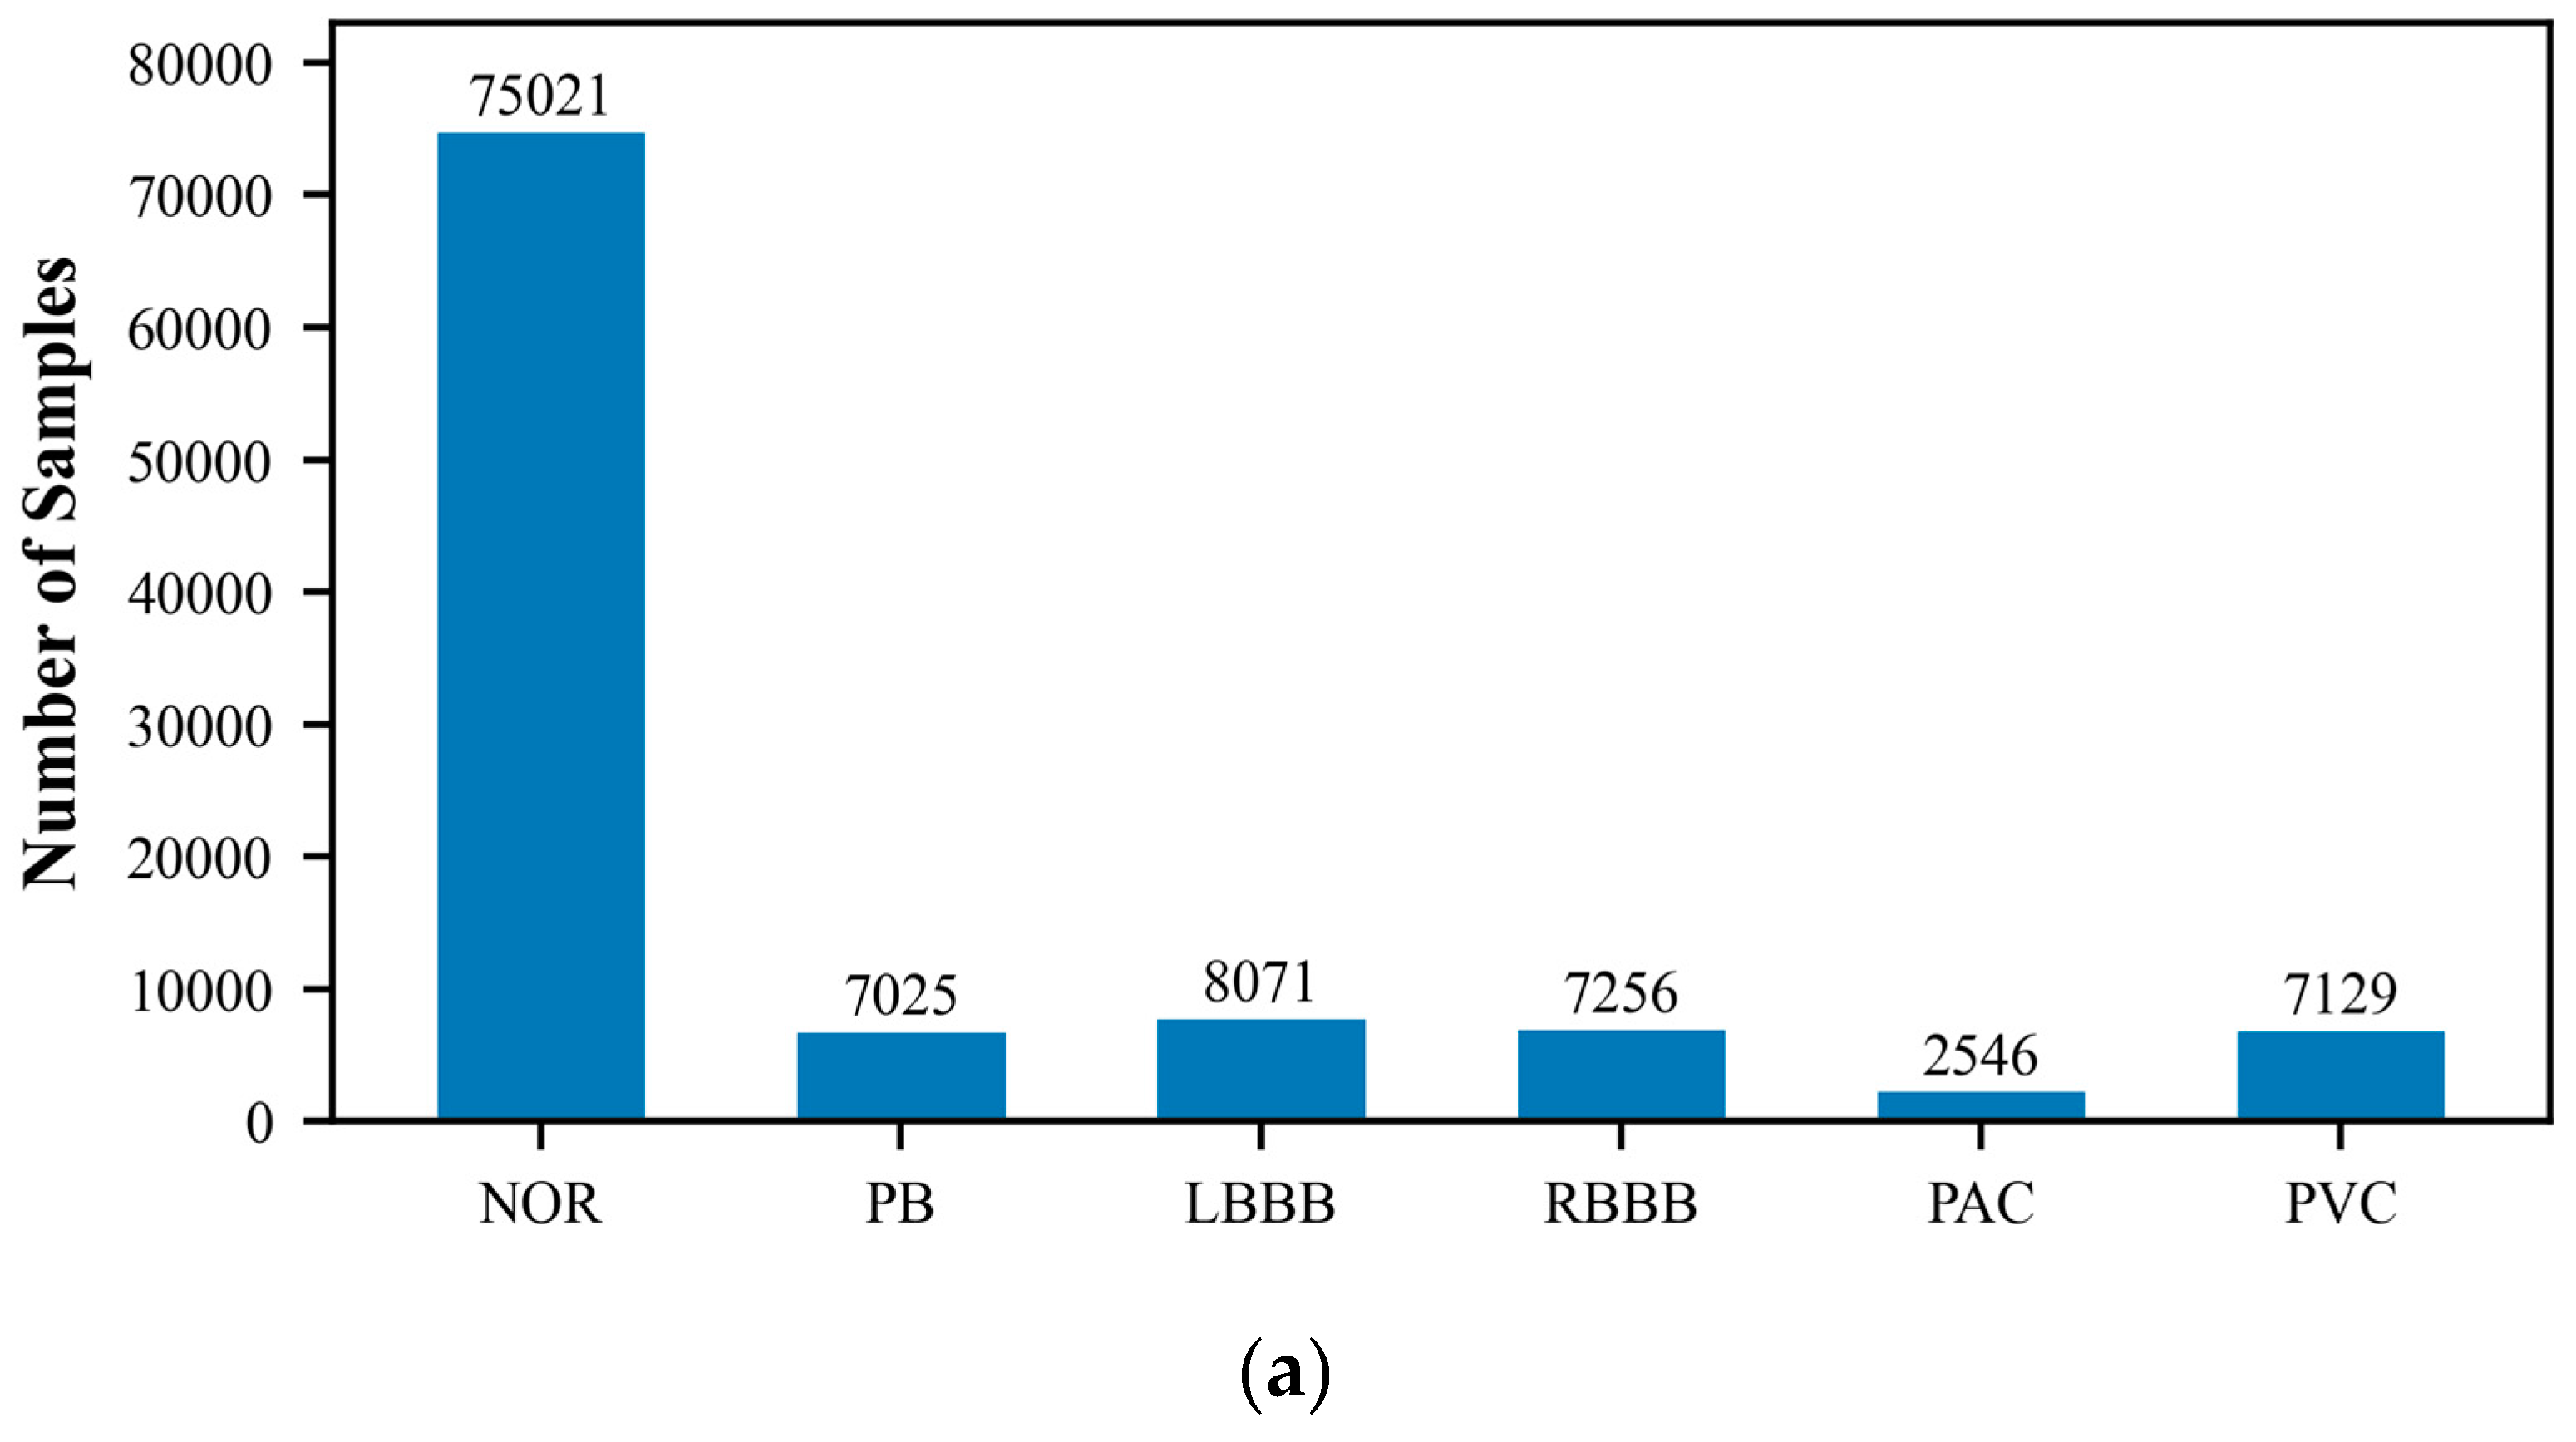
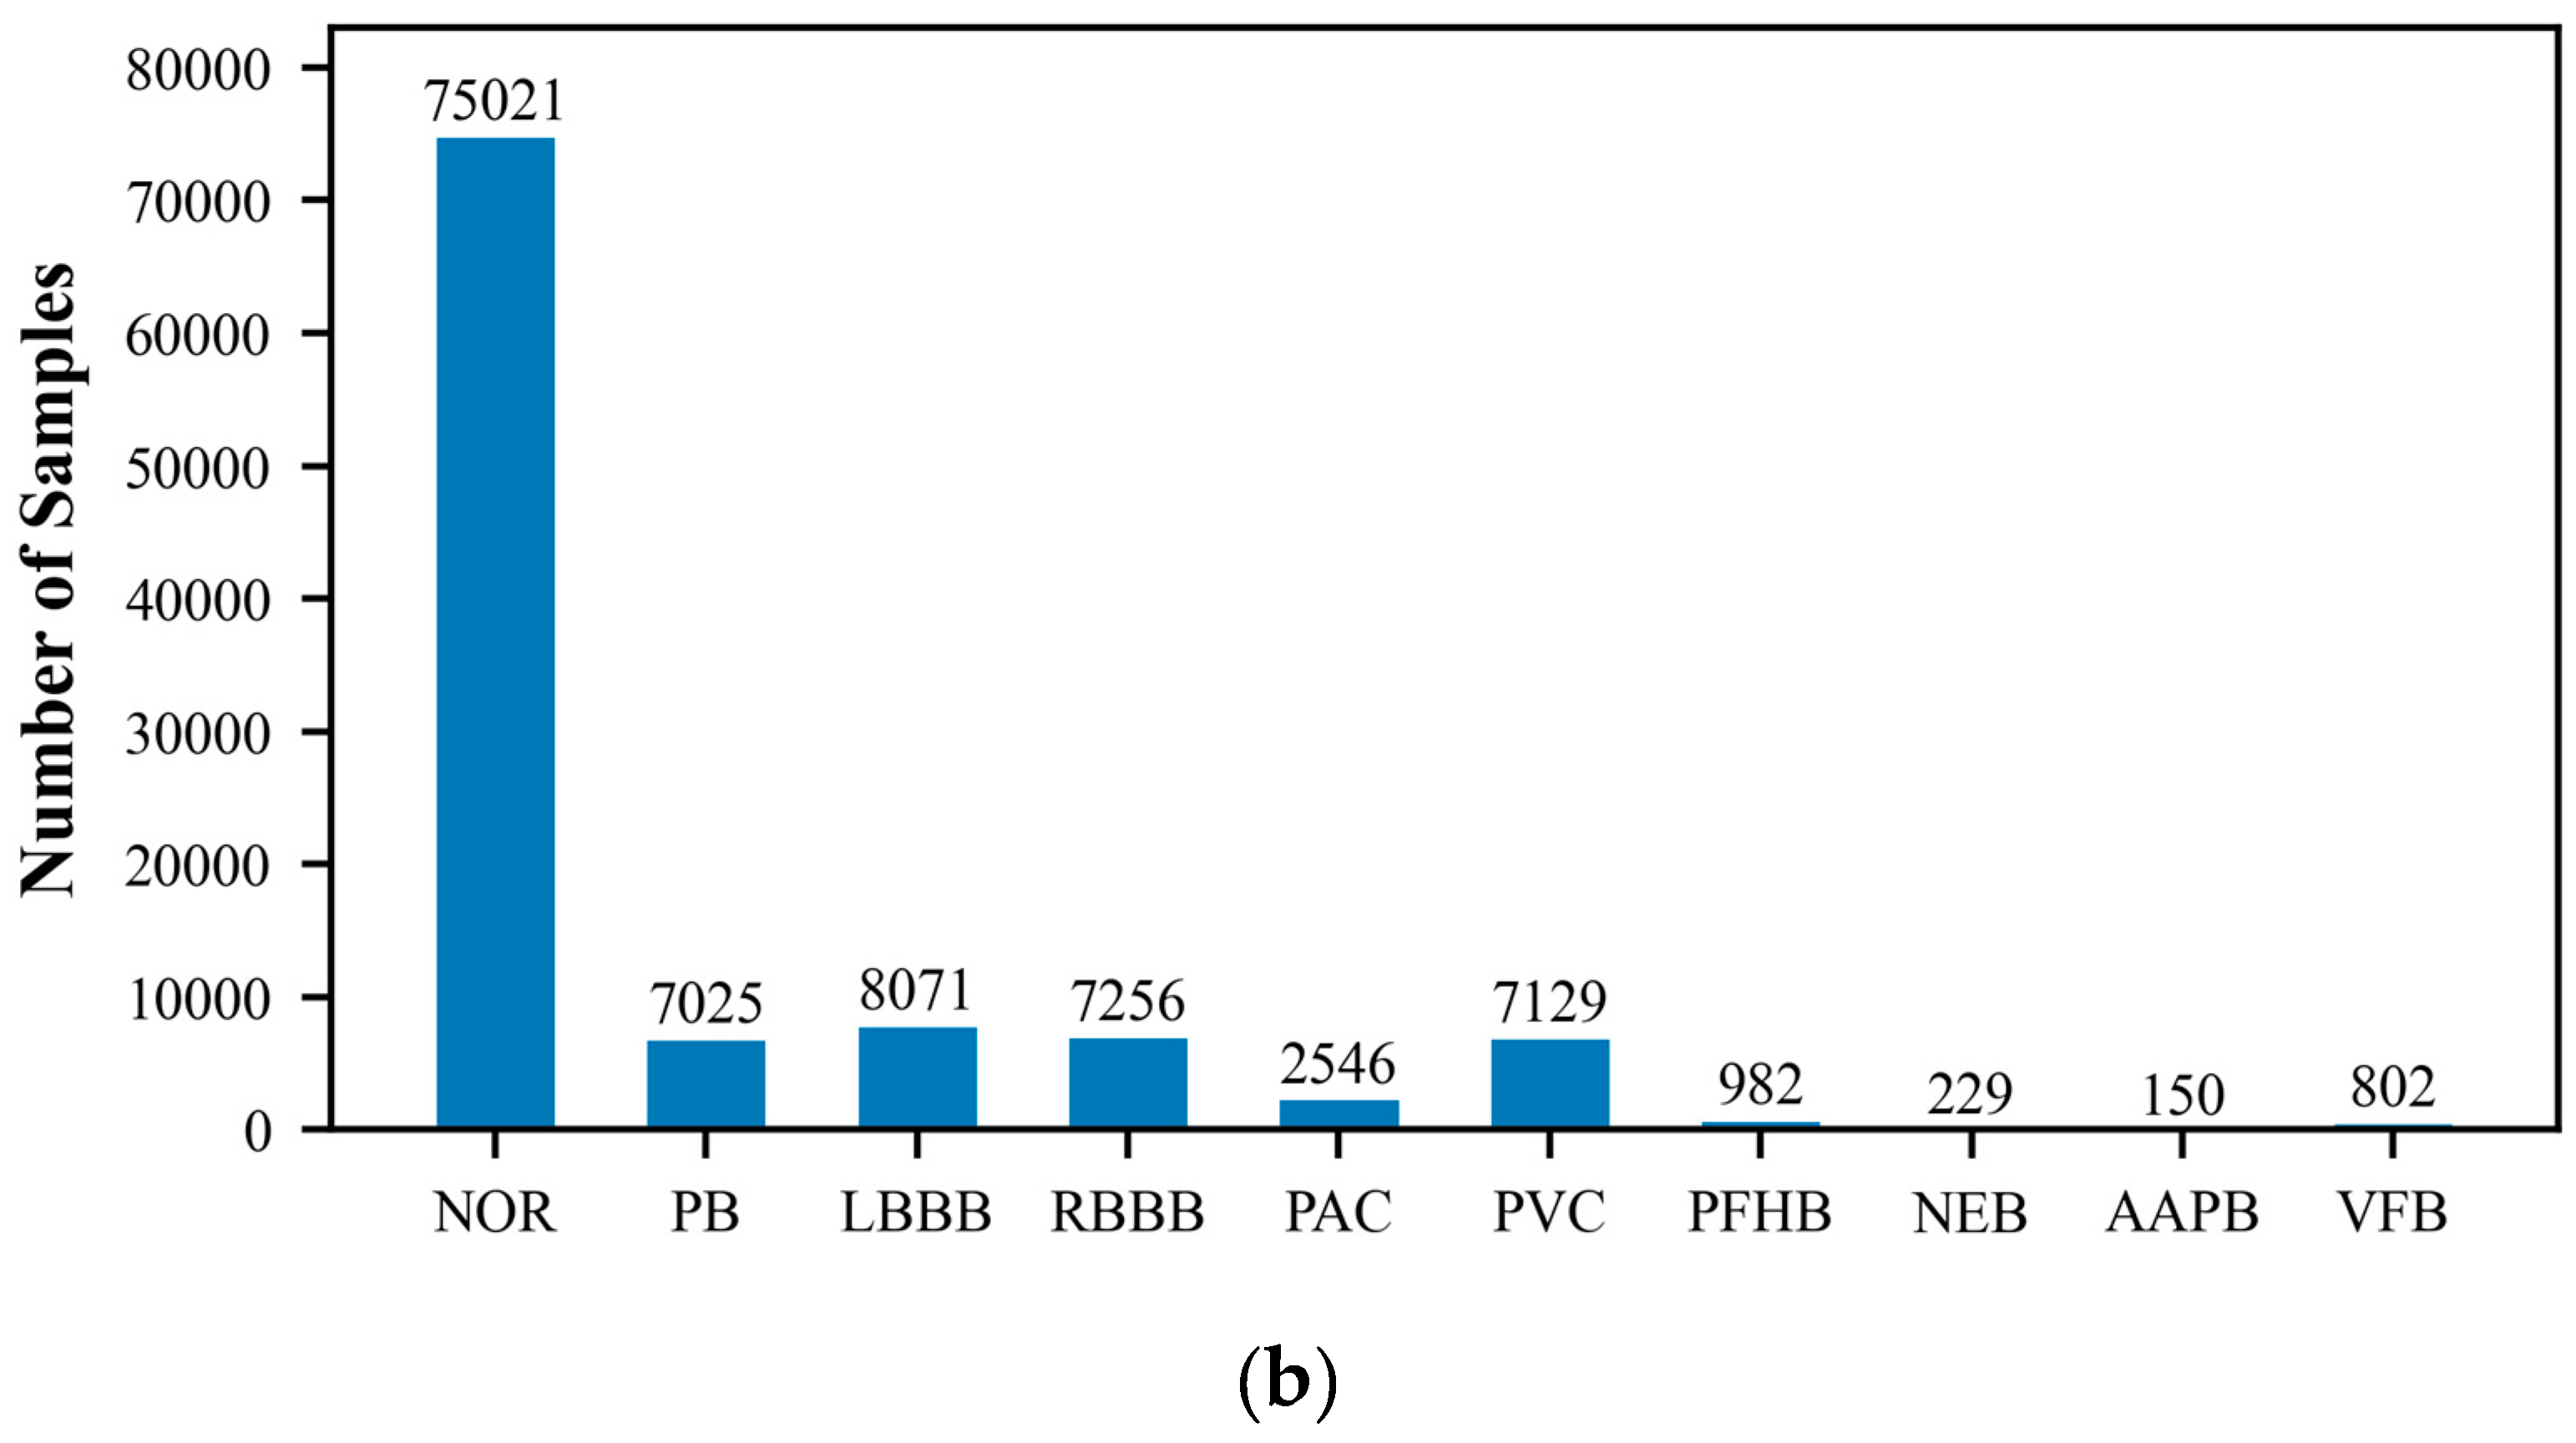
Figure 2.
Schematic representation of the Convolutional Neural Network (CNN) model architecture.
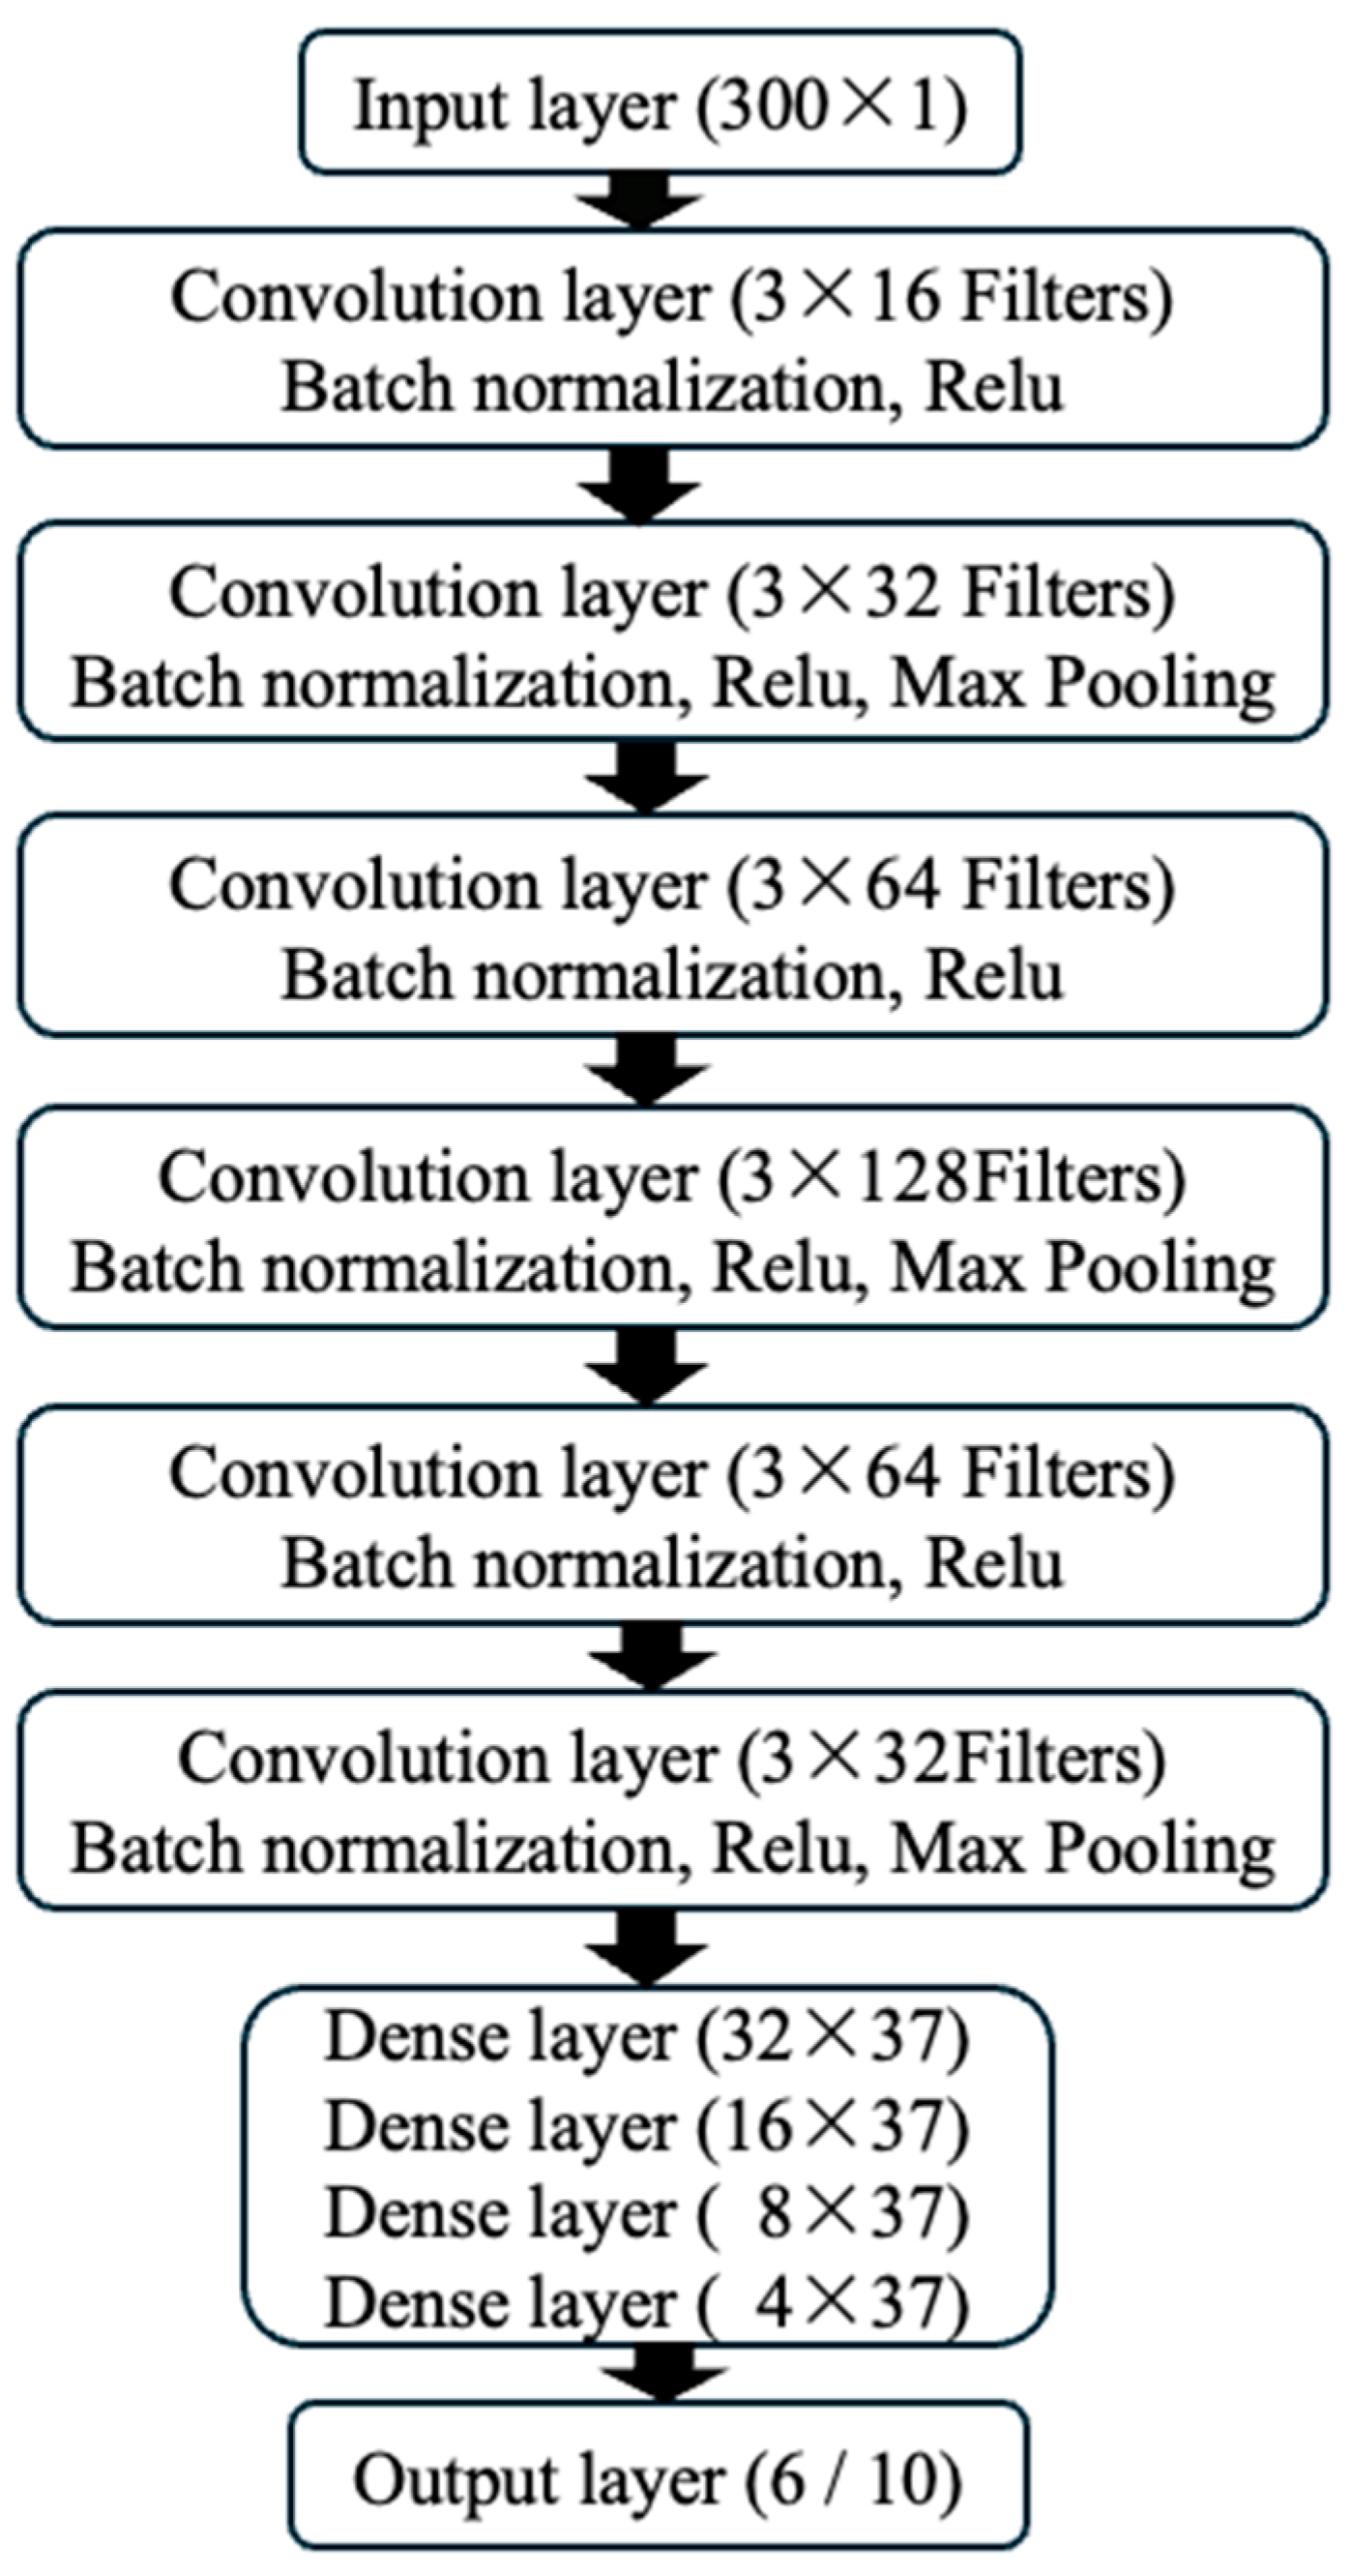
Figure 3.
Performance analysis of the CNN Model on training and test sets (a) performance on the six-class training set; (b)performance on the six-class test set(c) performance on the ten-class training set; (d)performance on the ten-class test set.
Figure 3.
Performance analysis of the CNN Model on training and test sets (a) performance on the six-class training set; (b)performance on the six-class test set(c) performance on the ten-class training set; (d)performance on the ten-class test set.
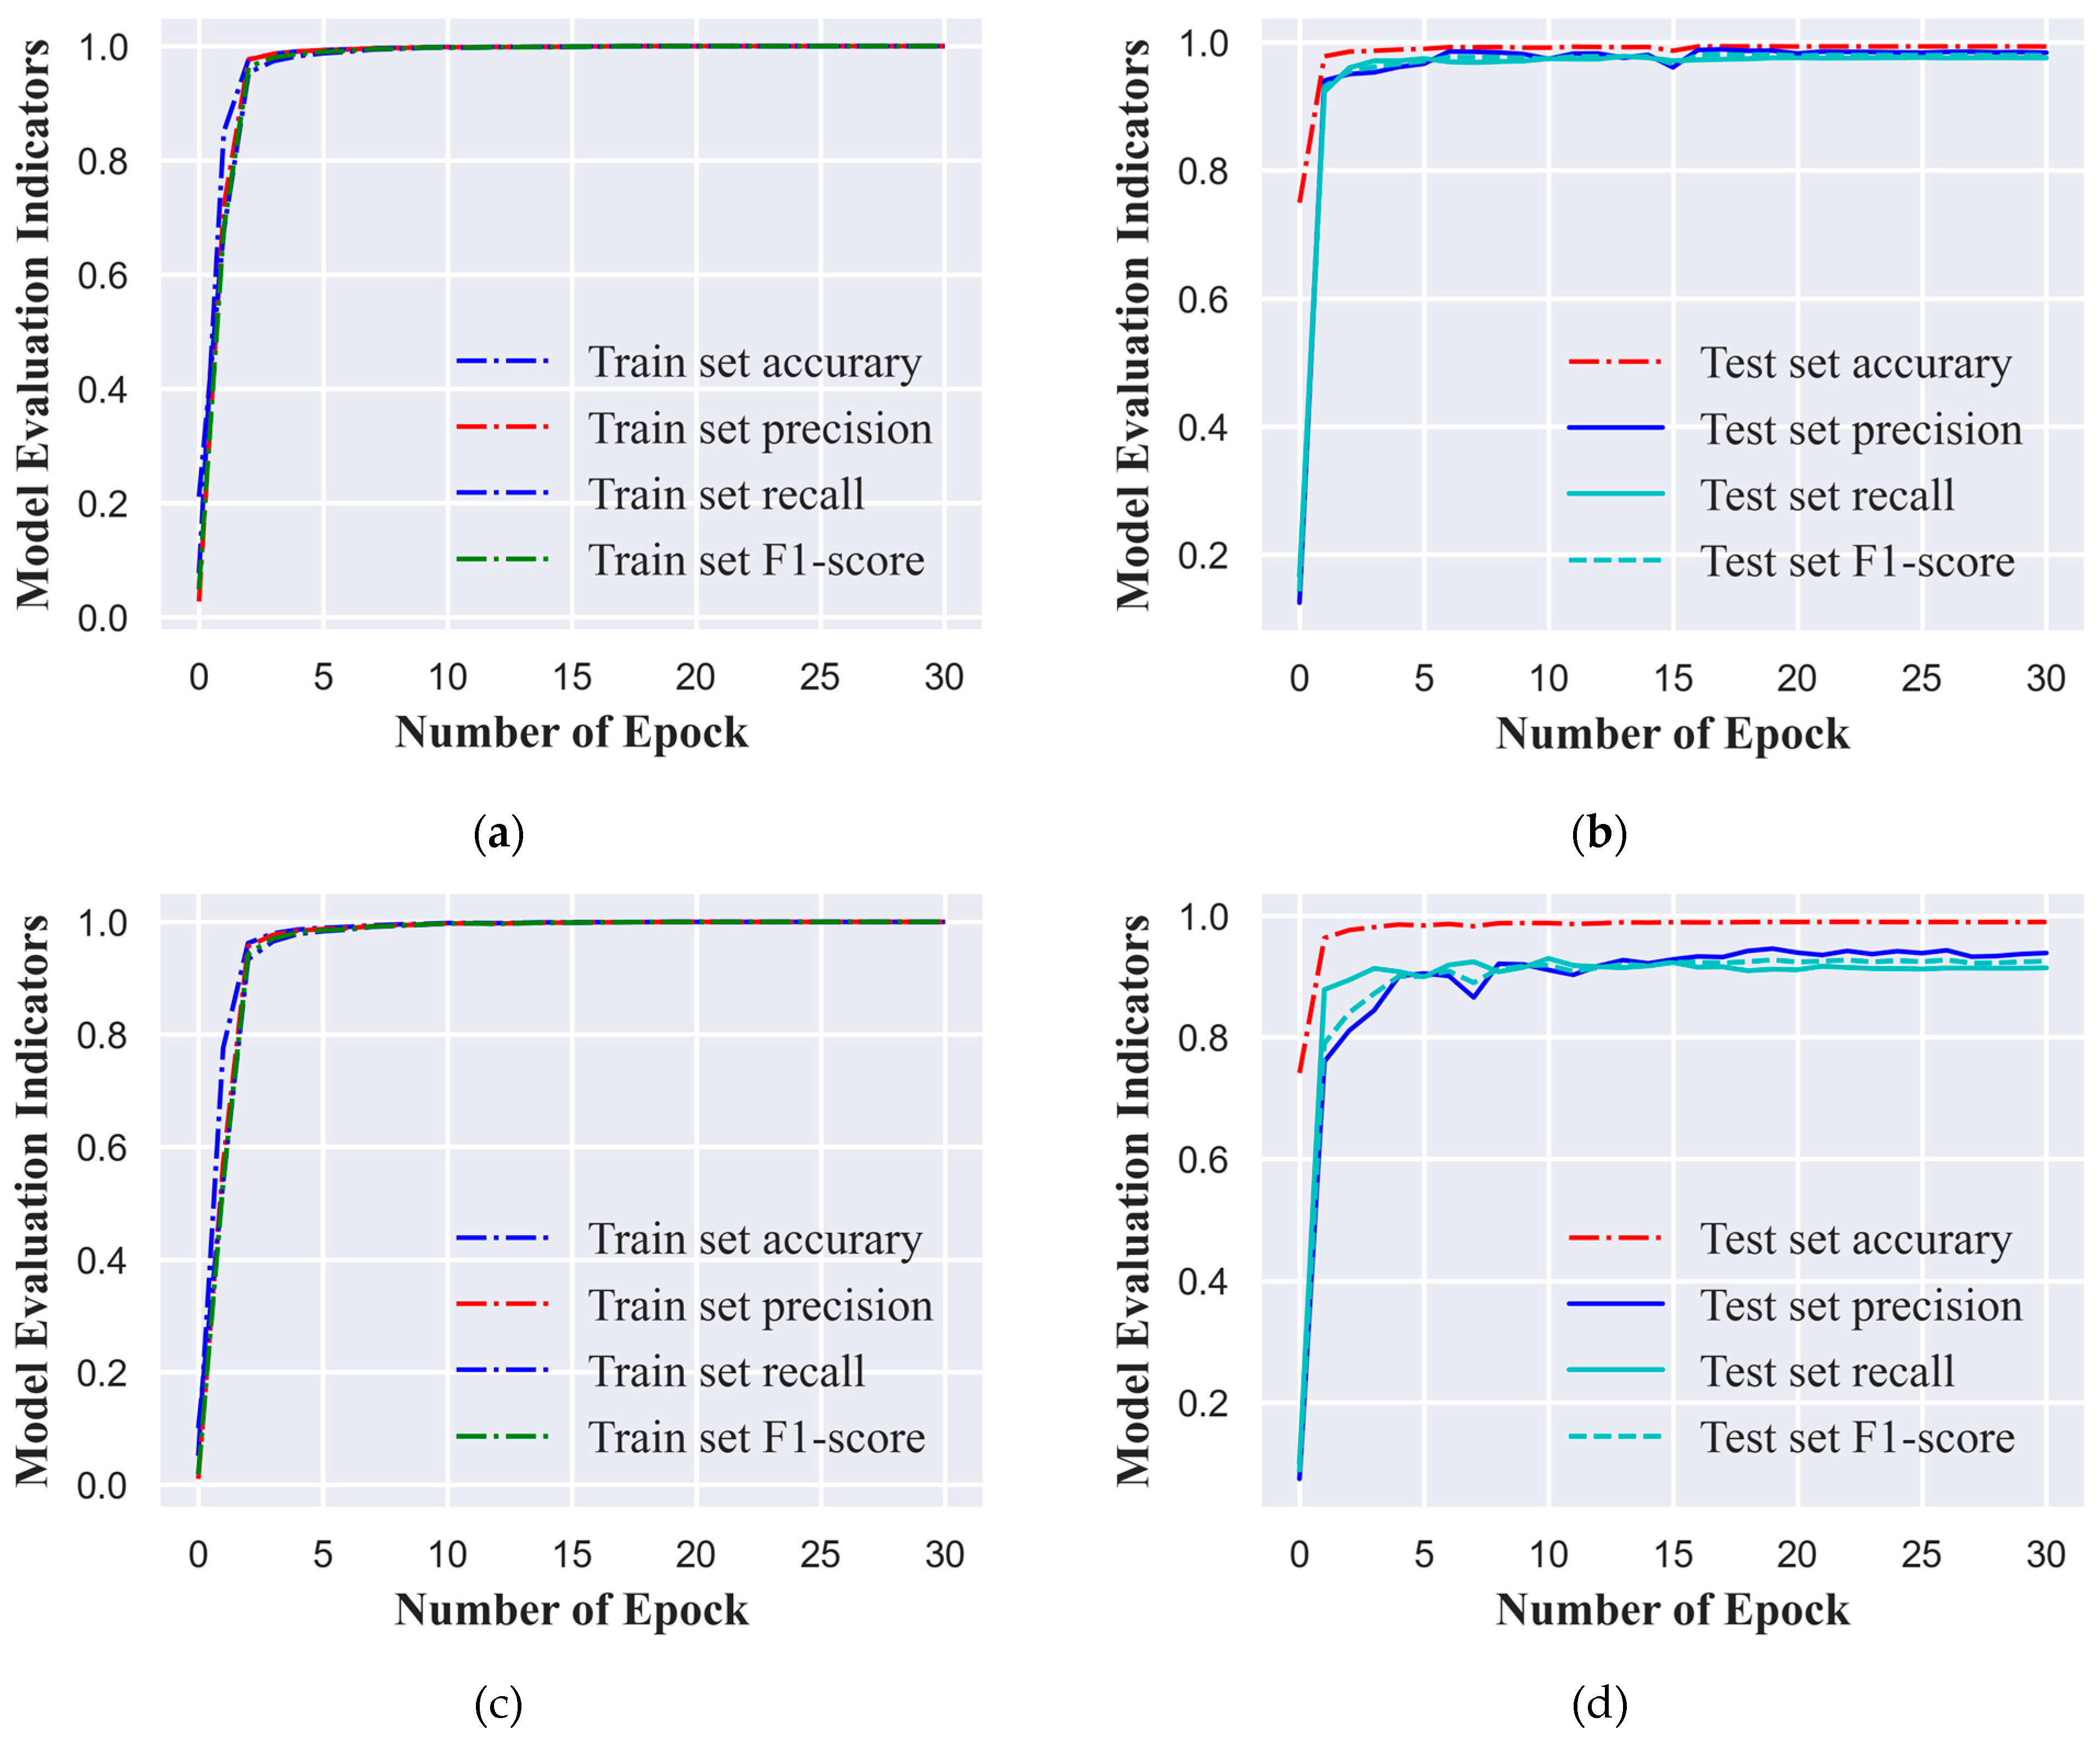
Figure 4.
Confusion matrix analysis for CNN model classification tasks. (a) six-class classification task; (b) ten-class classification task.
Figure 4.
Confusion matrix analysis for CNN model classification tasks. (a) six-class classification task; (b) ten-class classification task.
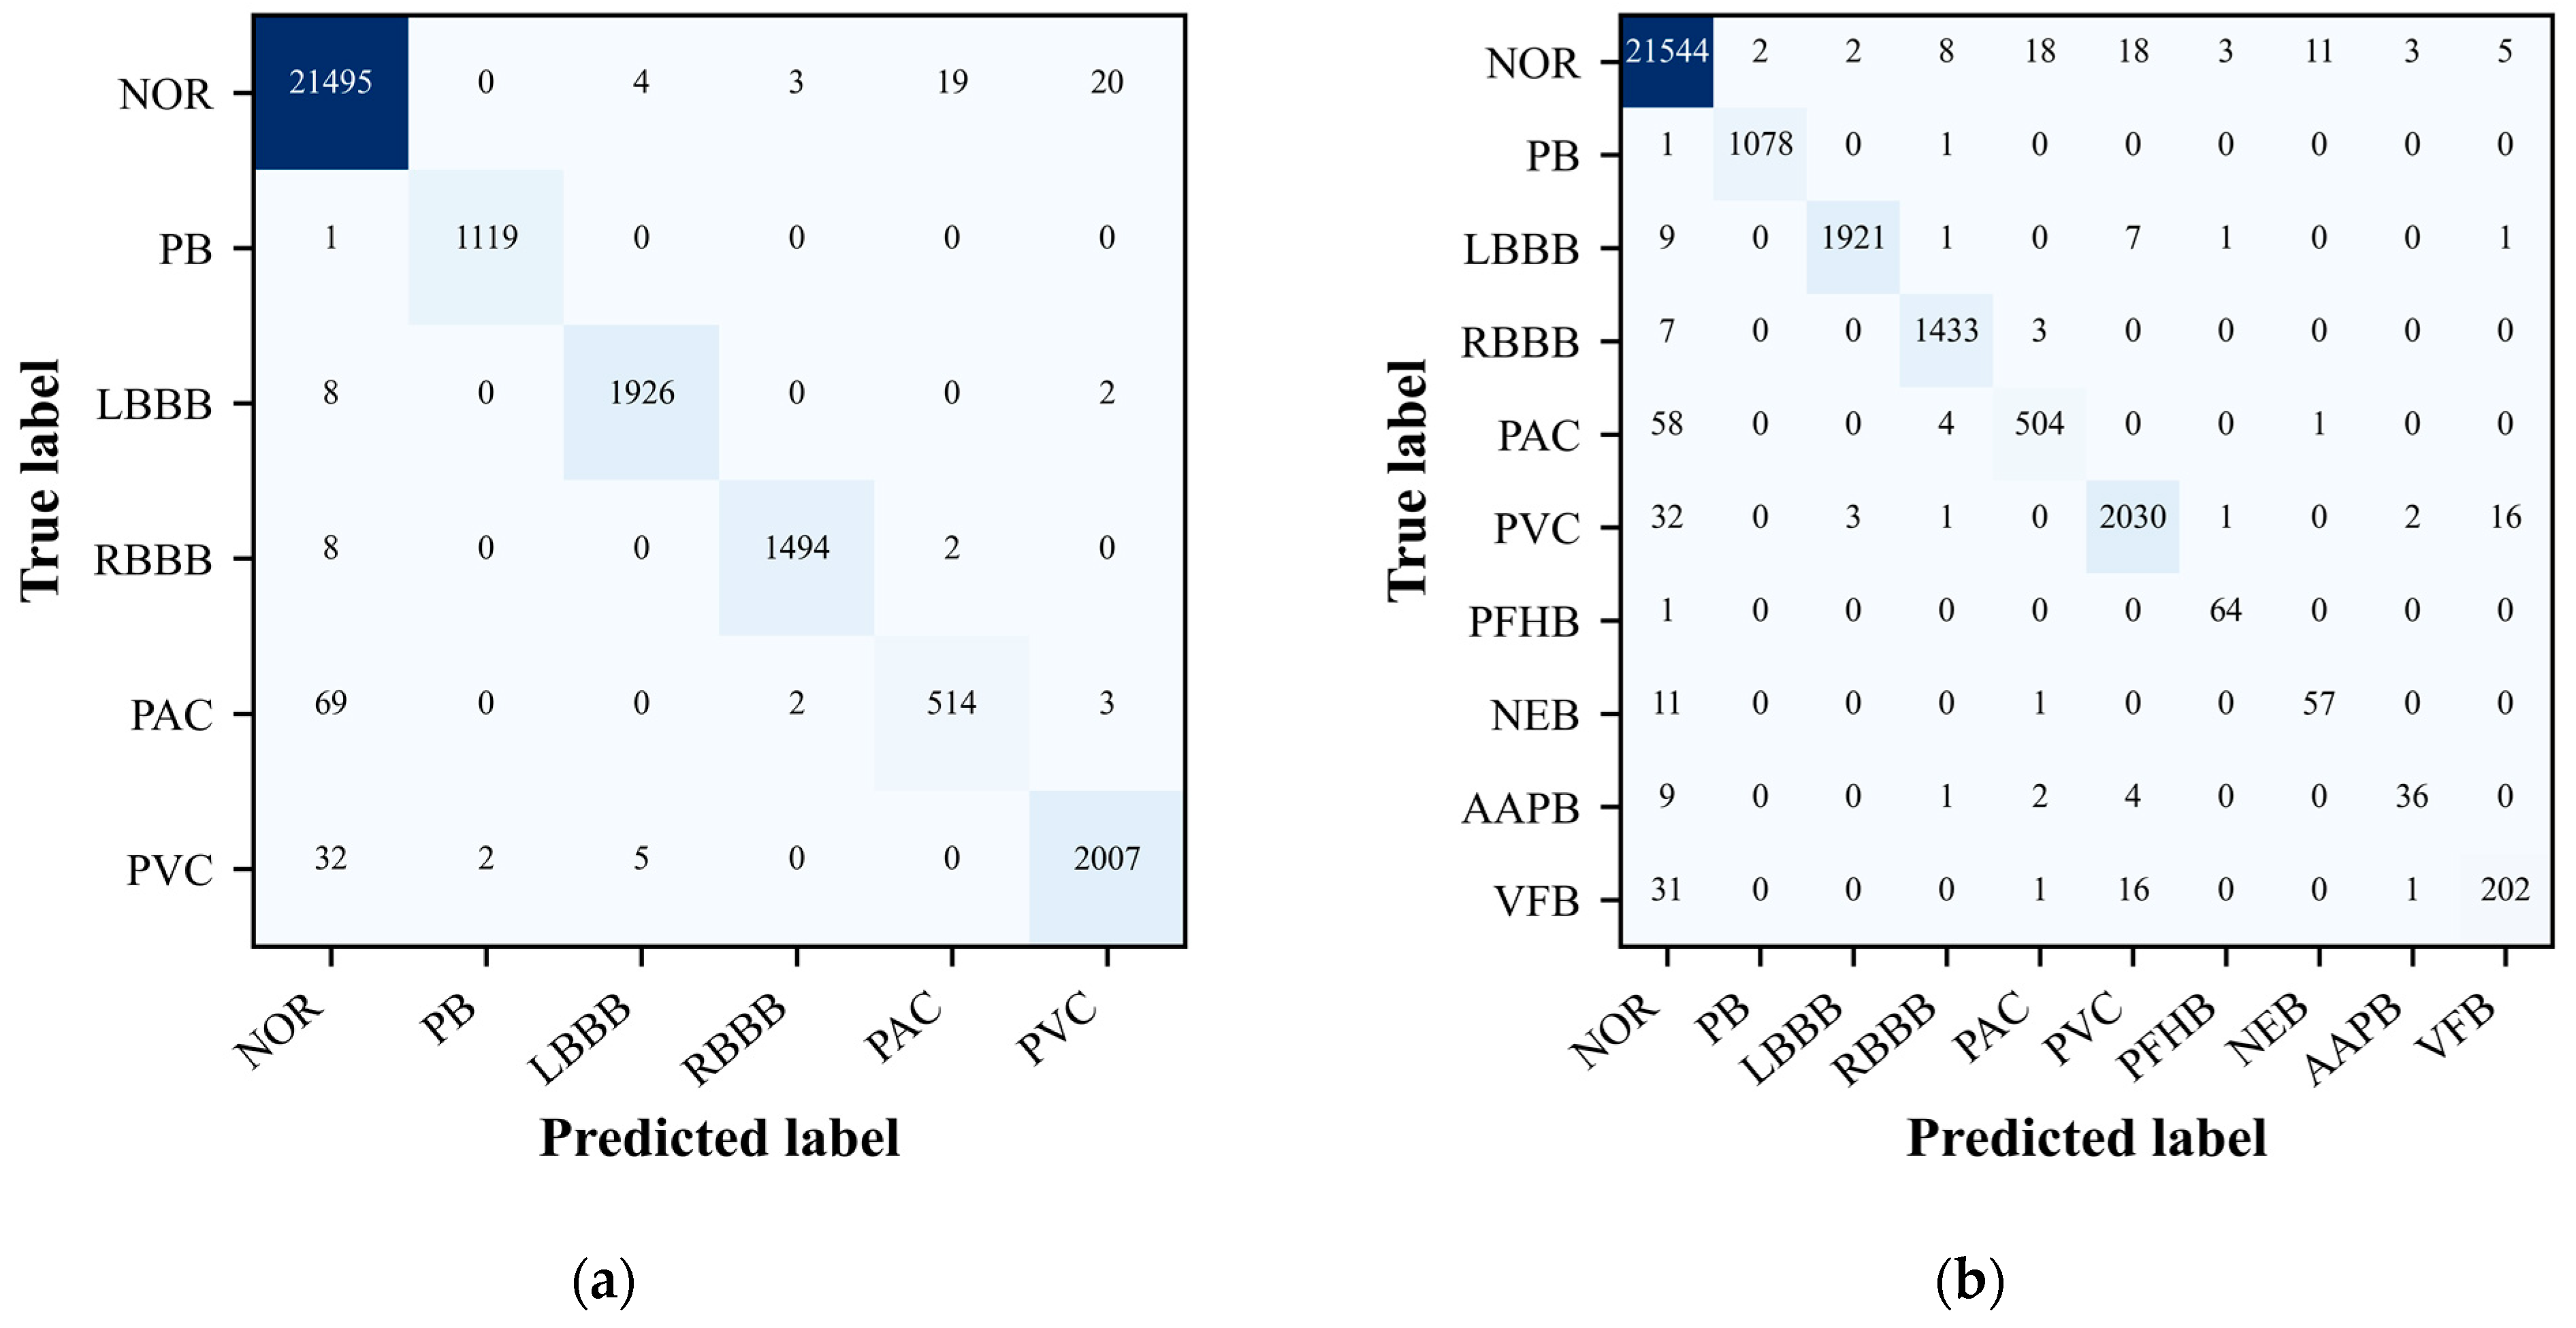
Figure 5.
ROC curve analysis of the CNN model performance on test set. (a) six-class classification task; (b) ten-class classification task.
Figure 5.
ROC curve analysis of the CNN model performance on test set. (a) six-class classification task; (b) ten-class classification task.
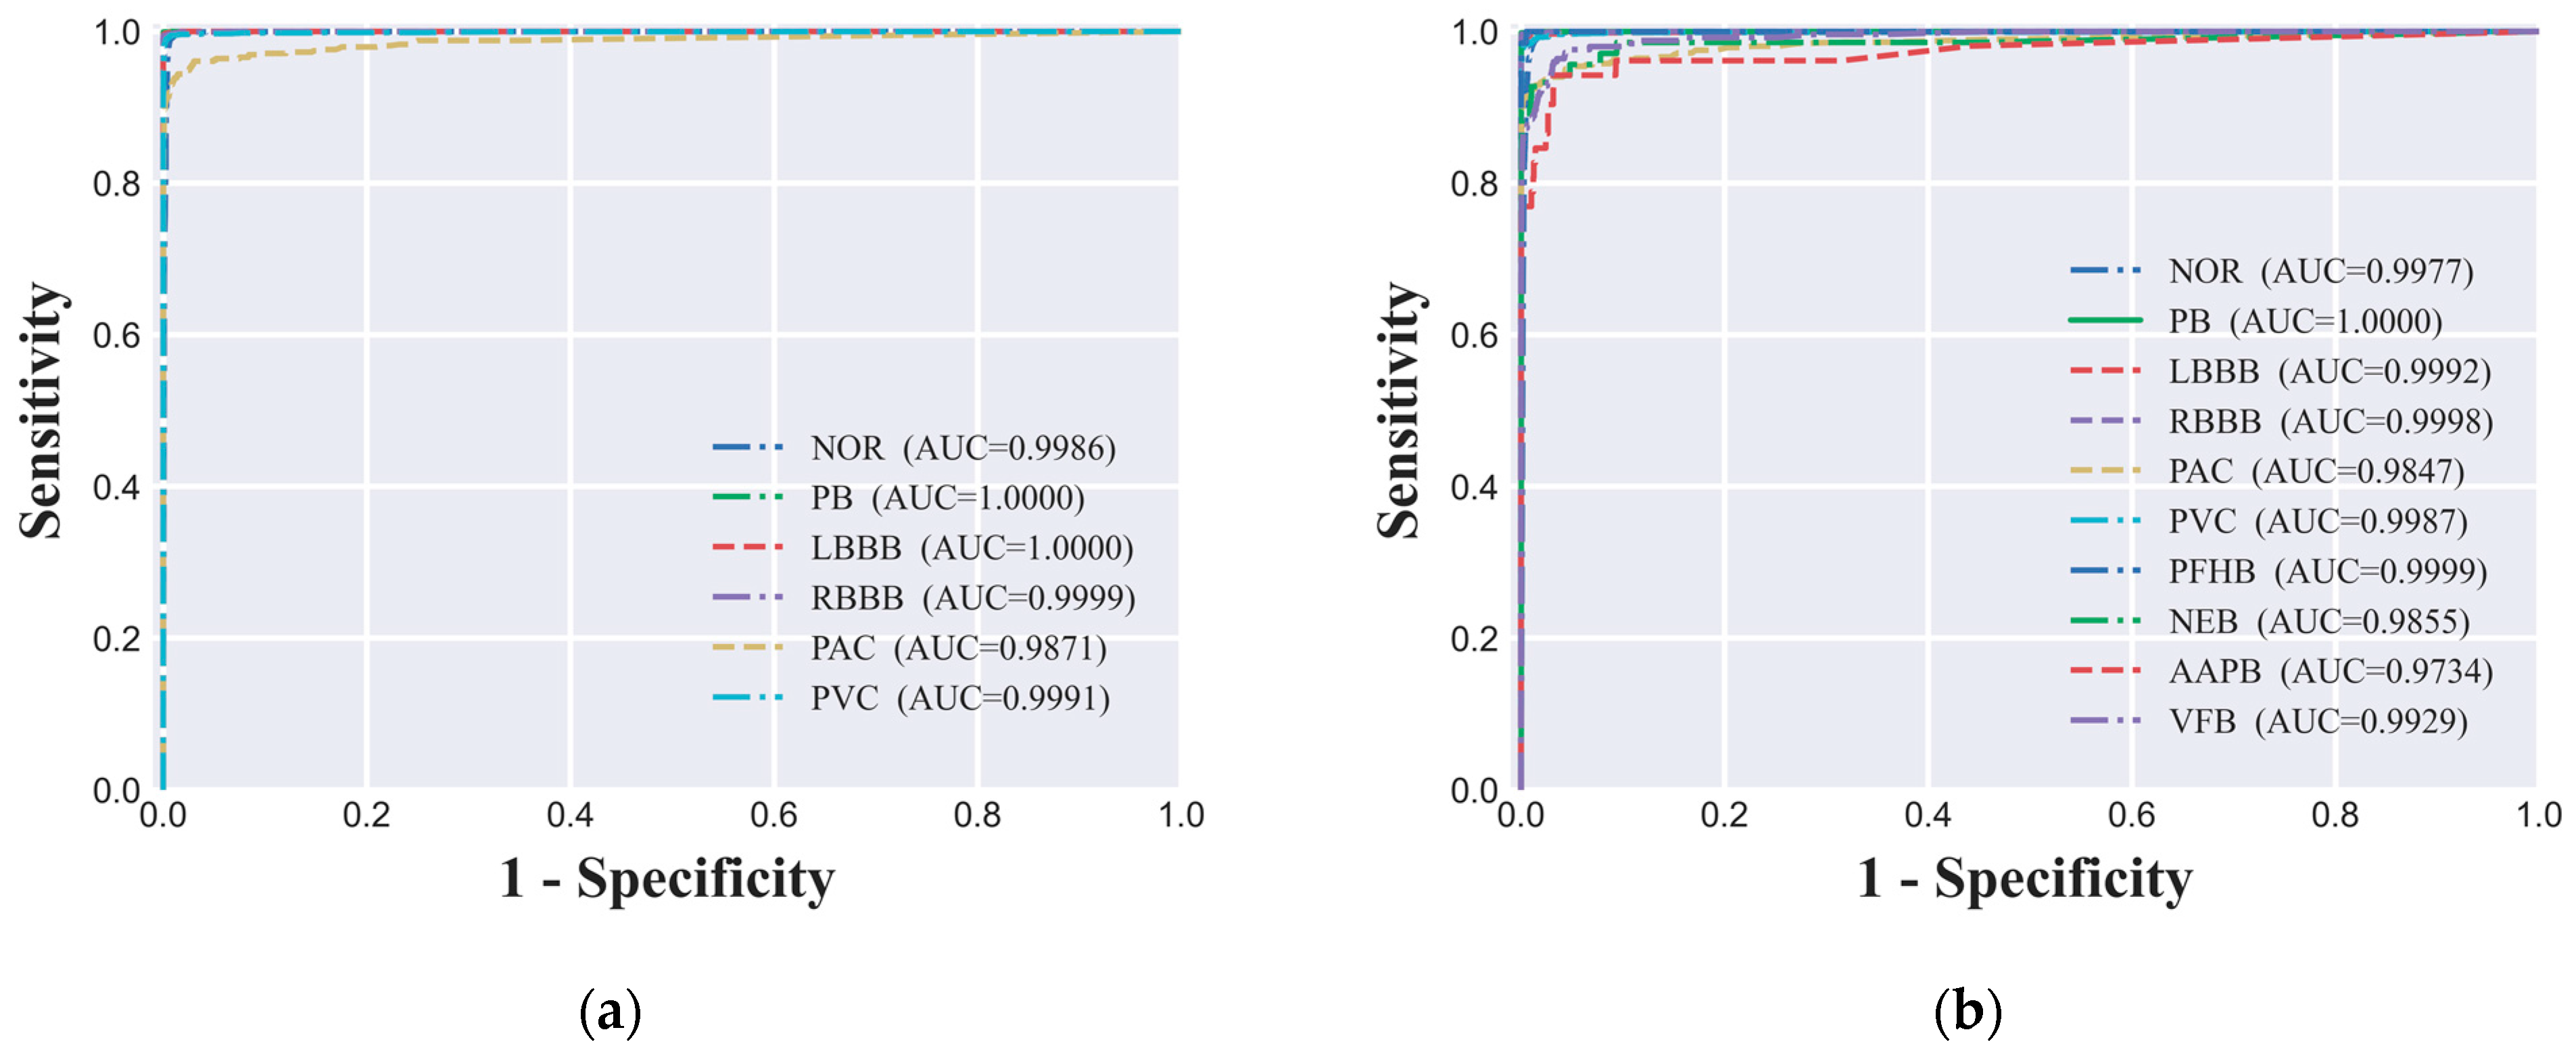
Figure 6.
PR curve analysis of the CNN model on test set. (a) six-class classification task; (b) ten-class classification task.
Figure 6.
PR curve analysis of the CNN model on test set. (a) six-class classification task; (b) ten-class classification task.
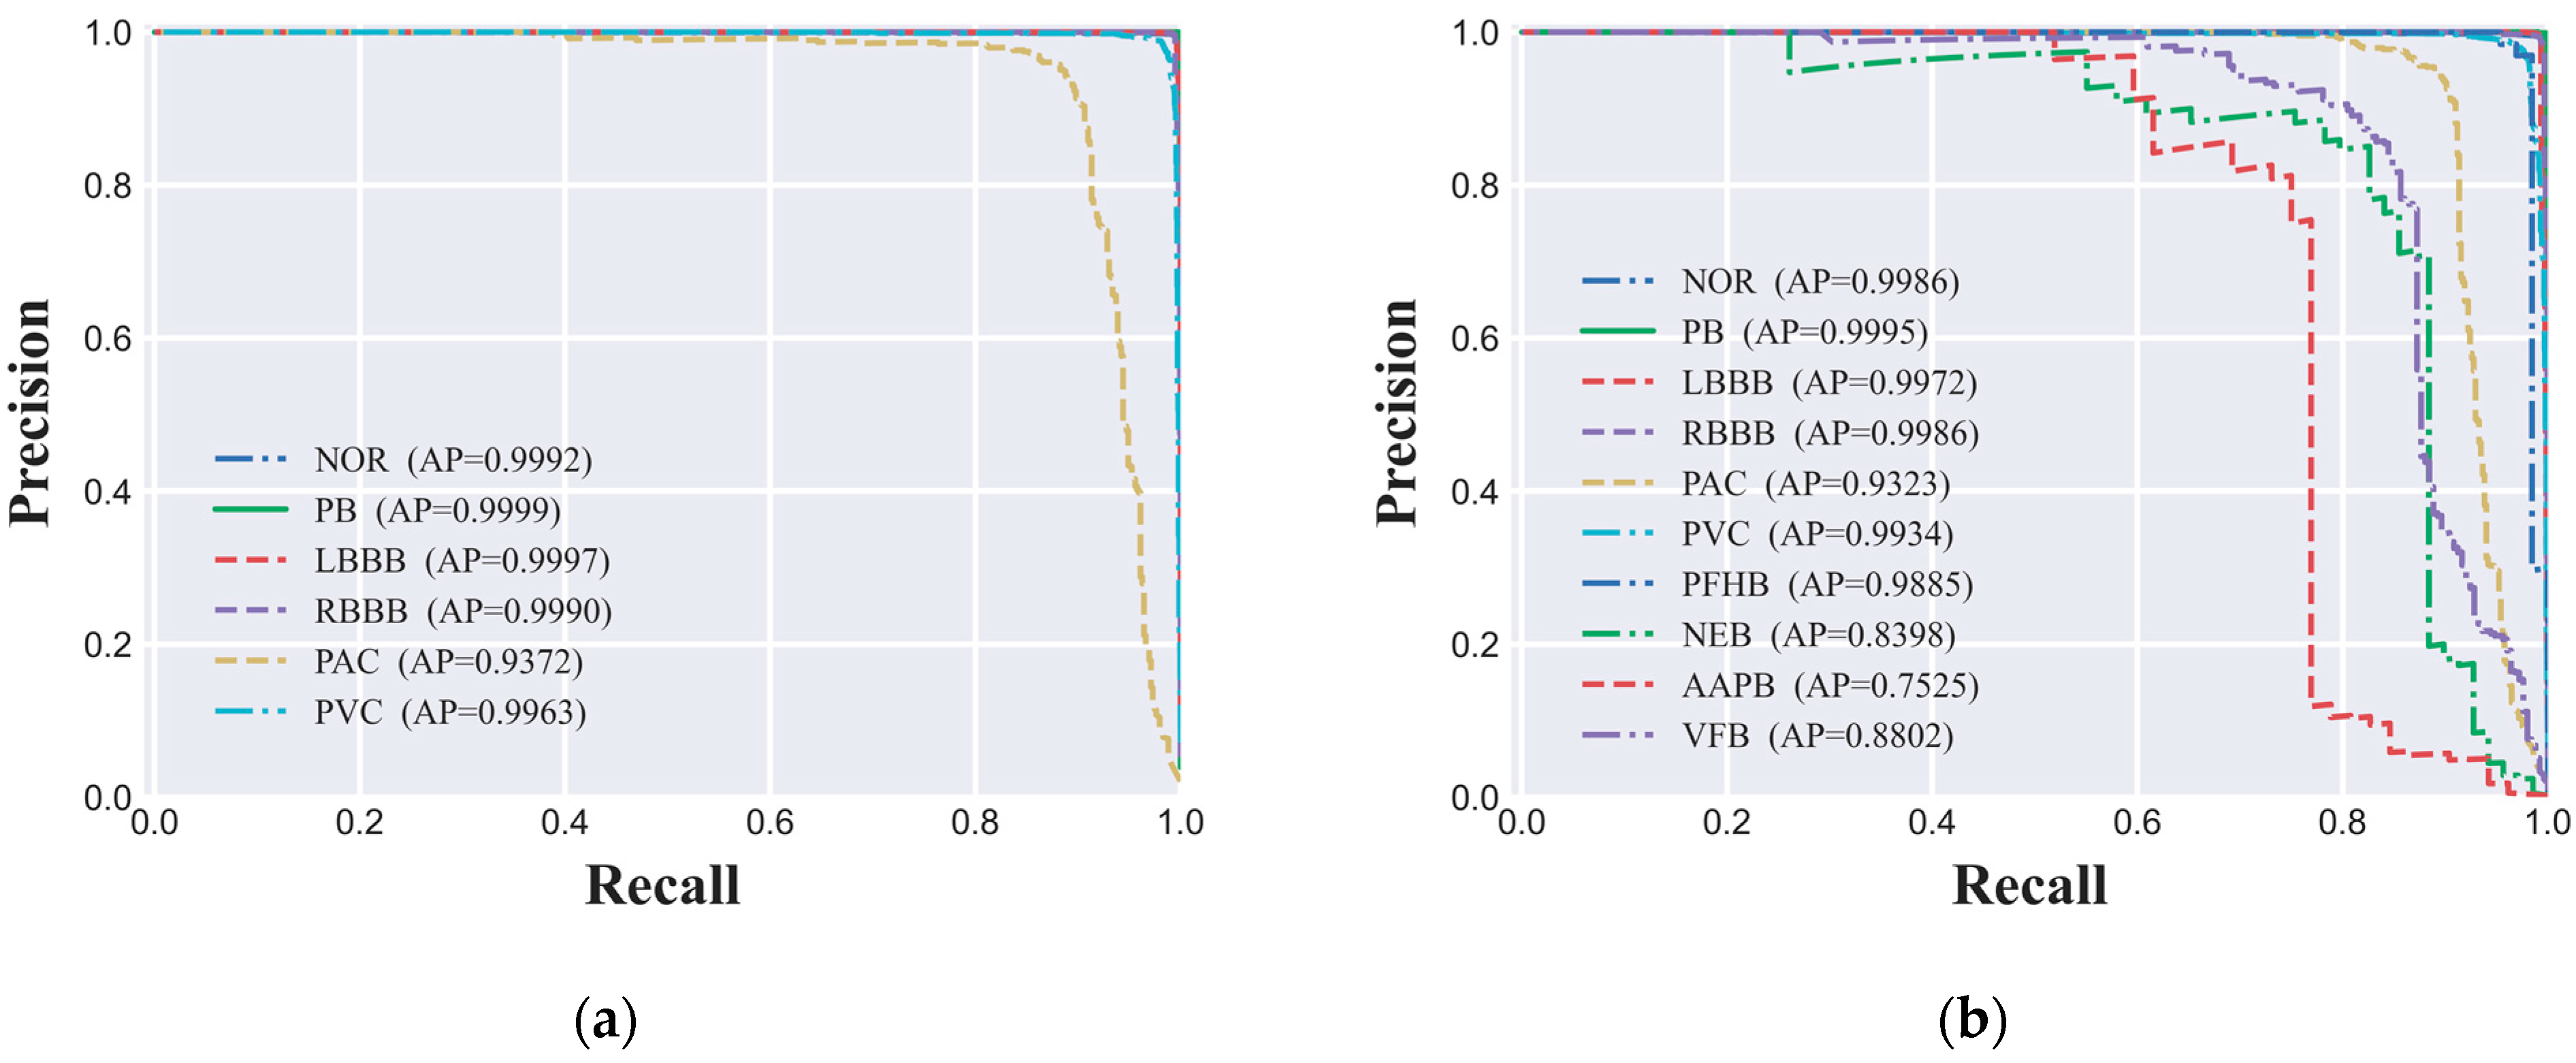
Figure 7.
UMAP visualization of CNN model's intermediate-layer semantic features for ECG datasets. (a) six-class ECG classification; (b) ten-class ECG classification.
Figure 7.
UMAP visualization of CNN model's intermediate-layer semantic features for ECG datasets. (a) six-class ECG classification; (b) ten-class ECG classification.
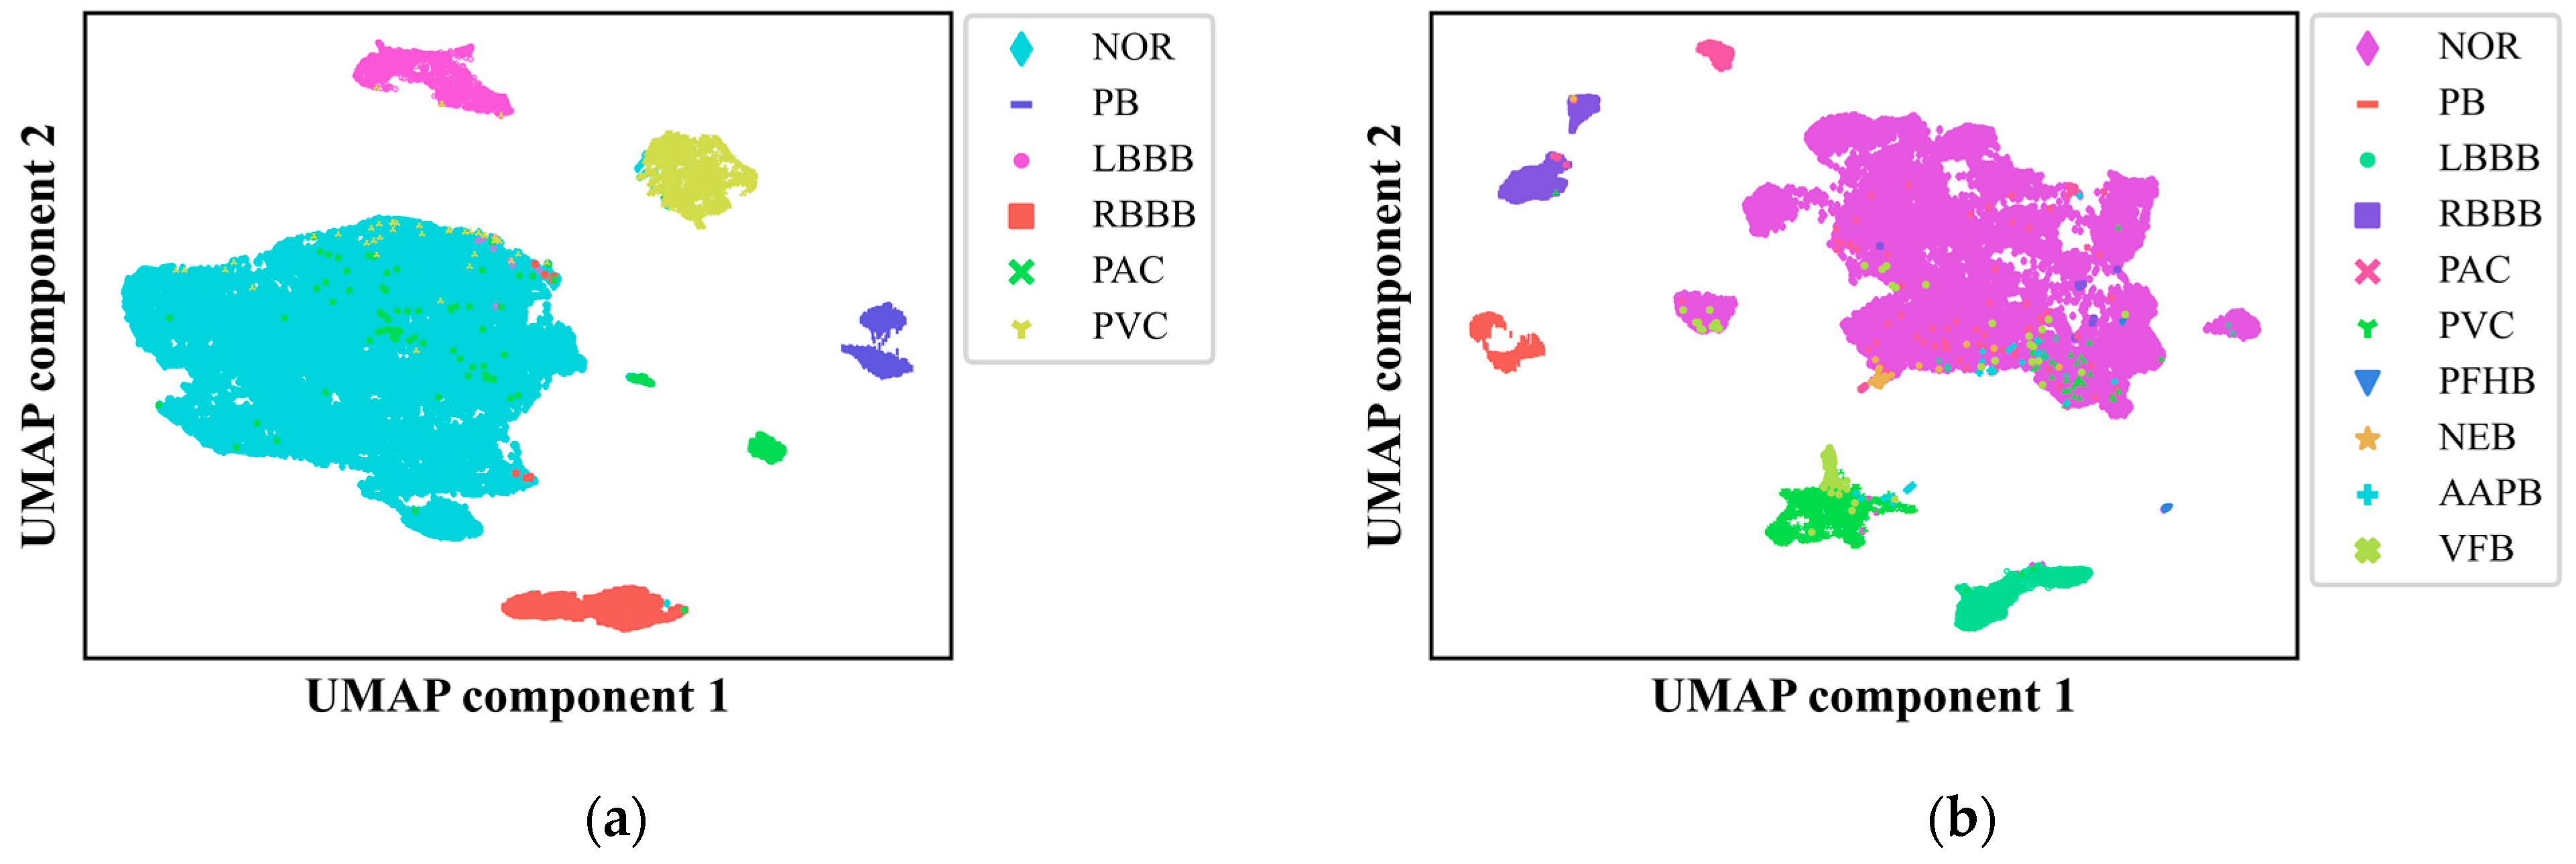
Figure 8.
Enhanced SHAP value visualization for ECG classification interpretation. (a) six-class ECG classification; (b) ten-class ECG classification.
Figure 8.
Enhanced SHAP value visualization for ECG classification interpretation. (a) six-class ECG classification; (b) ten-class ECG classification.
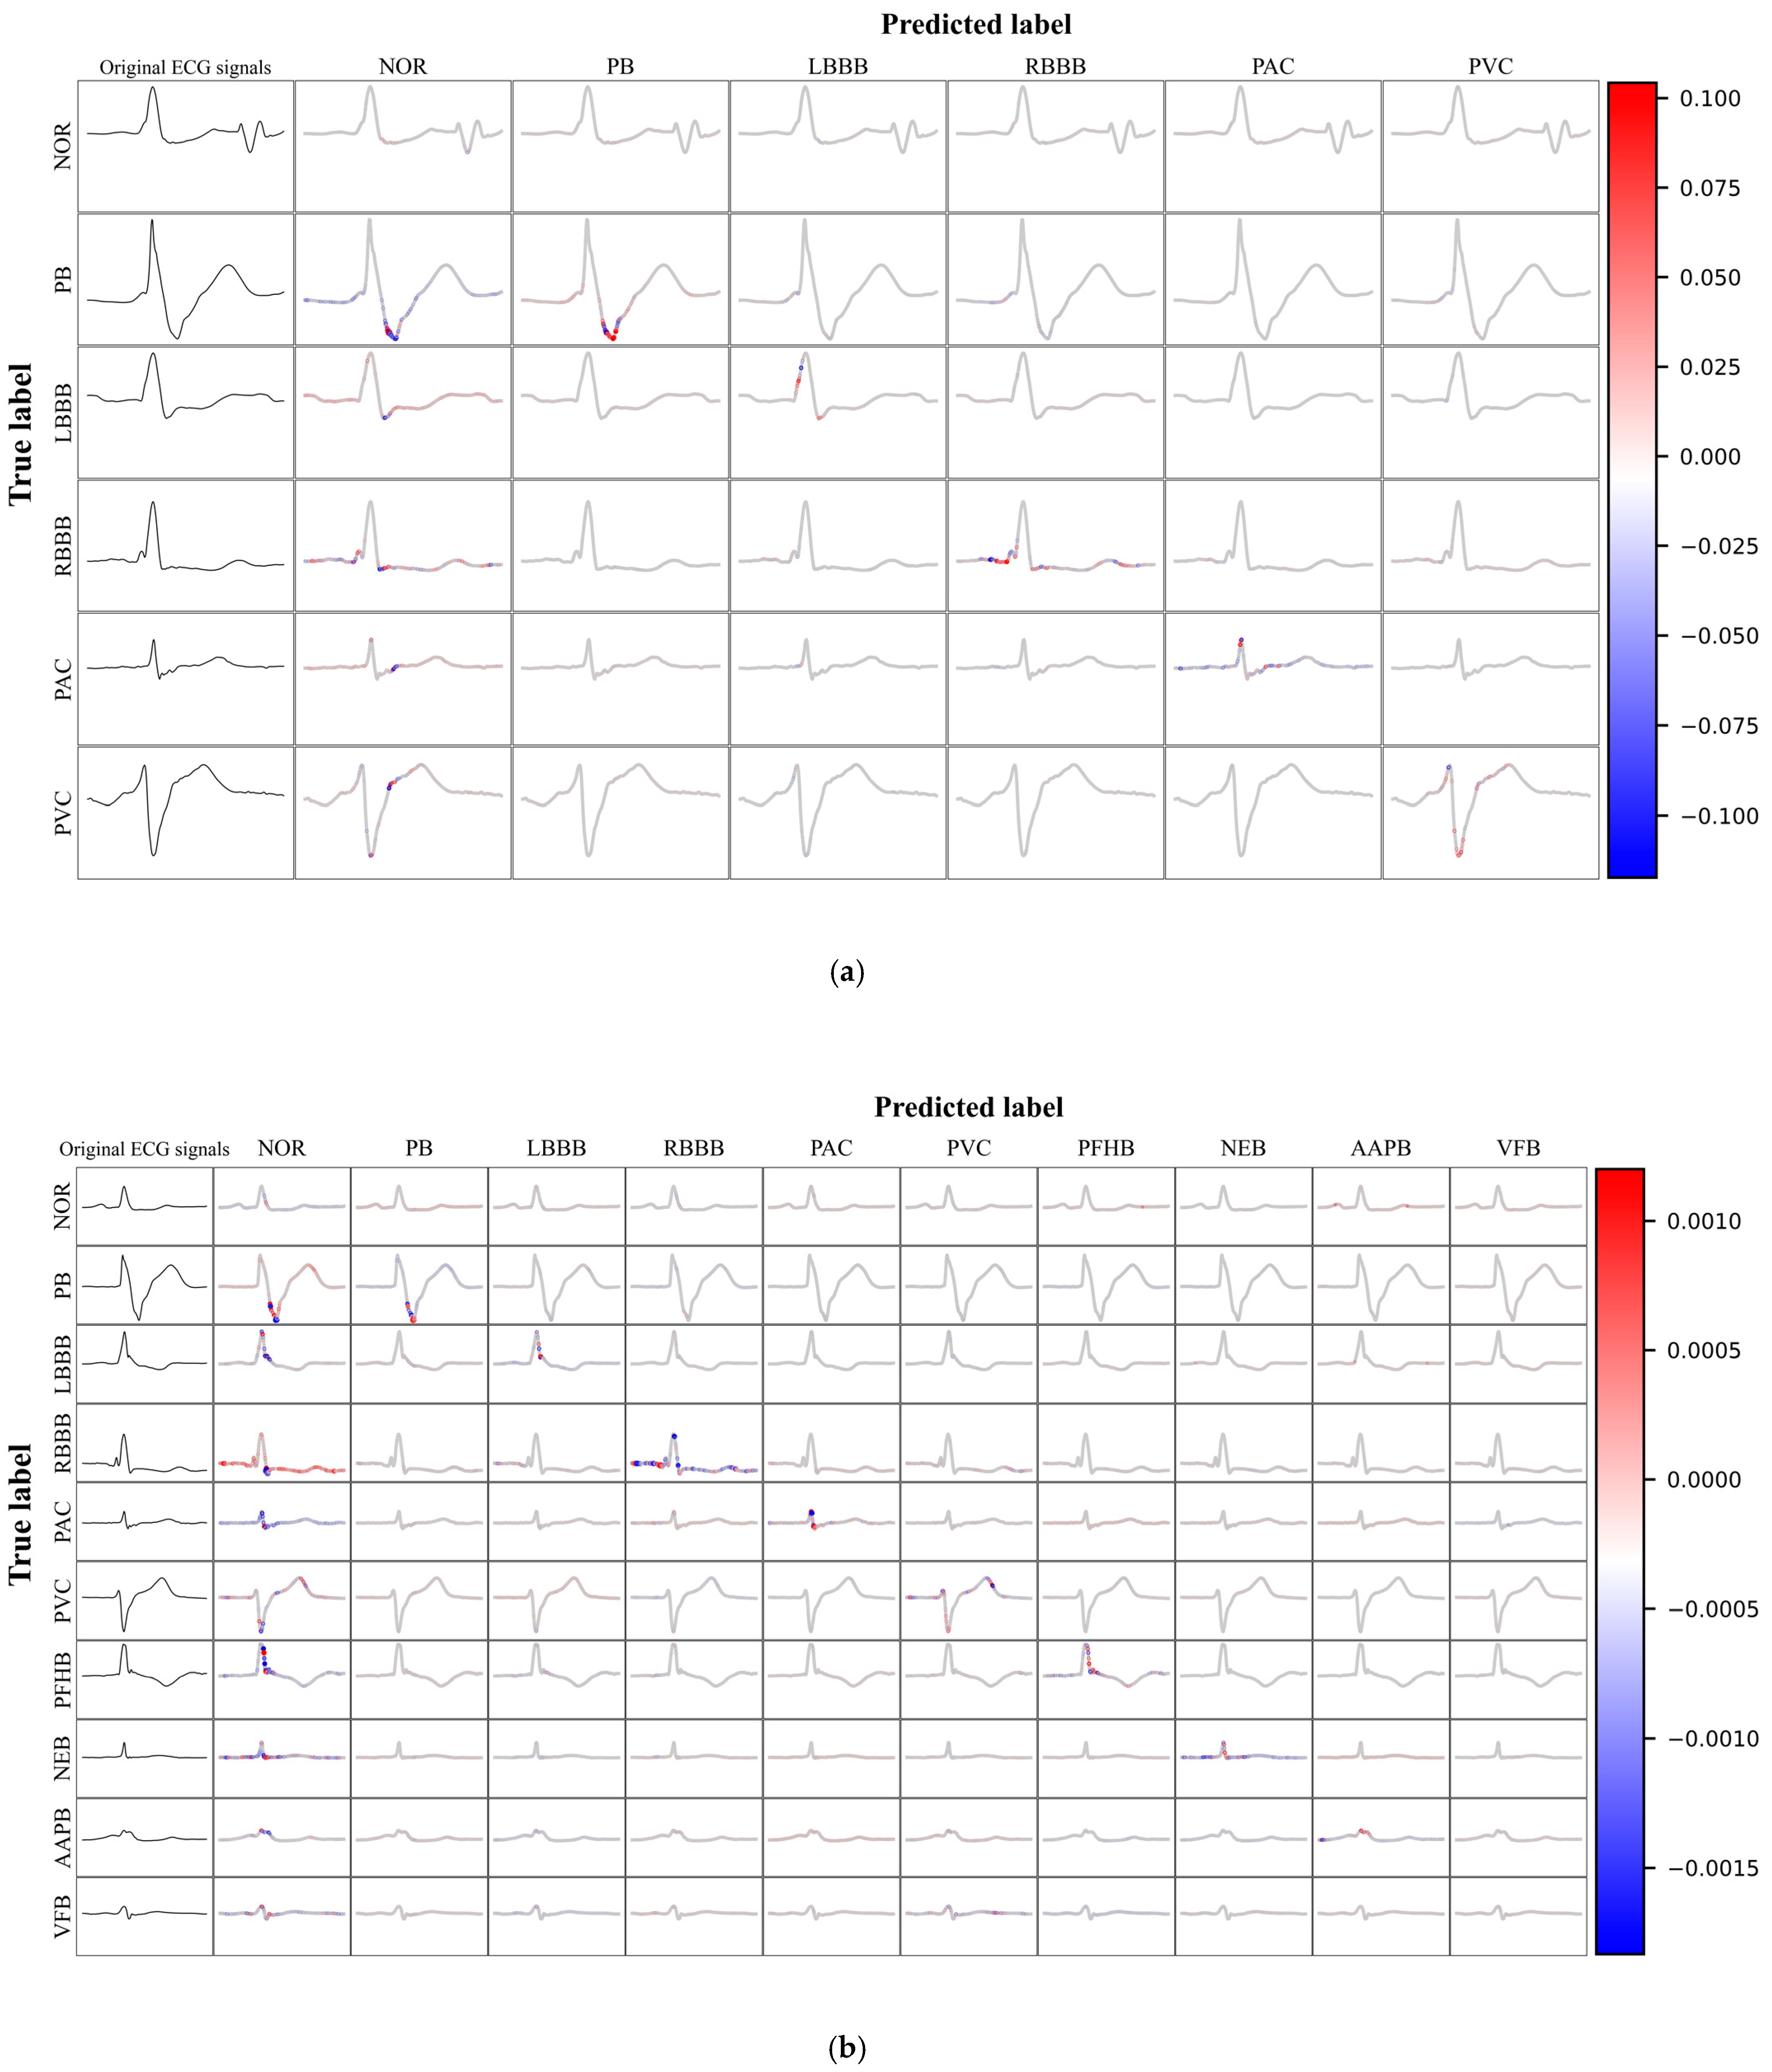

Table 1.
CNN model performance on the six-class classification task.
| Classification | Accuracy | Precision | Recall | F1-score | AUC | AP |
|---|---|---|---|---|---|---|
| NOR | 0.9979 | 0.9982 | 0.9991 | 0.9987 | 0.9986 | 0.9992 |
| PB | 0.9991 | 0.9607 | 0.8741 | 0.9154 | 1.0000 | 0.9999 |
| LBBB | 0.9948 | 0.9953 | 0.9948 | 0.9951 | 1.0000 | 0.9997 |
| RBBB | 0.9934 | 0.9945 | 0.9979 | 0.9962 | 0.9999 | 0.9990 |
| PAC | 0.8741 | 0.9967 | 0.9934 | 0.9950 | 0.9871 | 0.9372 |
| PVC | 0.9809 | 0.9877 | 0.9809 | 0.9843 | 0.9991 | 0.9963 |
| Macro average | 0.9734 | 0.9889 | 0.9734 | 0.9808 | 0.9974 | 0.9885 |
| Weighted average | 0.9866 | 0.9937 | 0.9937 | 0.9937 | 0.9991 | 0.9956 |
Annotation: F1-score: The harmonic mean of Precision and Recall; AUC: Area Under the Curve; AP: Average Precision, the mean of precision scores at each threshold, useful for imbalanced datasets; Macro average: This metric calculates the average of a performance score; Weighted average: the average of the performance scores by weighting each class.
Table 2.
CNN model performance on the ten-class classification task.
| Classification | Accuracy | Precision | Recall | F1-score | AUC | AP |
|---|---|---|---|---|---|---|
| NOR | 0.9968 | 0.9981 | 0.9981 | 0.9981 | 0.9977 | 0.9986 |
| PB | 0.9981 | 0.9527 | 0.8889 | 0.9197 | 1.0000 | 0.9995 |
| LBBB | 0.9902 | 0.9018 | 0.8048 | 0.8505 | 0.9992 | 0.9972 |
| RBBB | 0.9931 | 0.9974 | 0.9902 | 0.9938 | 0.9998 | 0.9986 |
| PAC | 0.8889 | 0.9927 | 0.9968 | 0.9947 | 0.9847 | 0.9323 |
| PVC | 0.9736 | 0.9890 | 0.9931 | 0.9910 | 0.9987 | 0.9934 |
| PFHB | 0.9846 | 0.9783 | 0.9736 | 0.9760 | 0.9999 | 0.9885 |
| NEB | 0.8261 | 0.8571 | 0.6923 | 0.7660 | 0.9855 | 0.8398 |
| AAPB | 0.6923 | 0.9275 | 0.9846 | 0.9552 | 0.9734 | 0.7525 |
| VFB | 0.8048 | 0.8261 | 0.8261 | 0.8261 | 0.9929 | 0.8802 |
| Macro average | 0.9148 | 0.9421 | 0.9148 | 0.9271 | 0.9932 | 0.9381 |
| Weighted average | 0.9131 | 0.9896 | 0.9898 | 0.9897 | 0.9884 | 0.9474 |
Disclaimer/Publisher’s Note: The statements, opinions and data contained in all publications are solely those of the individual author(s) and contributor(s) and not of MDPI and/or the editor(s). MDPI and/or the editor(s) disclaim responsibility for any injury to people or property resulting from any ideas, methods, instructions or products referred to in the content. |
© 2024 by the authors. Licensee MDPI, Basel, Switzerland. This article is an open access article distributed under the terms and conditions of the Creative Commons Attribution (CC BY) license (http://creativecommons.org/licenses/by/4.0/).
Copyright: This open access article is published under a Creative Commons CC BY 4.0 license, which permit the free download, distribution, and reuse, provided that the author and preprint are cited in any reuse.