Submitted:
18 May 2024
Posted:
20 May 2024
You are already at the latest version
Preprints on COVID-19 and SARS-CoV-2
Abstract
The relentless challenges posed by the COVID-19 pandemic have placed immense pressure on densely populated regions, such as Hong Kong, particularly in the context of an aging population. The burgeoning demand for healthcare services has necessitated the optimization of resource al-location within healthcare systems. This research presents an innovative analytical queueing model specifically tailored to address the intricate gridlock dynamics prevalent in healthcare systems, with a focused application in the challenging landscape of COVID-19 management. Hong Kong, like numerous other regions, has experienced a demo-graphic transition leading to heightened healthcare demands. Traditional methodologies for scrutinizing gridlock issues in healthcare settings, including simulation models, often prove suboptimal within the context of sophisticated optimization frameworks. This study, however, delves into analytical queueing models, offering a more efficient and effective approach. These models have been underexplored, primarily due to the intricacies involved in modeling gridlock propagation within restricted capacity, a critical concern magnified by the COVID-19 pandemic. The novel Queueing Model introduced in this research incorporates the maintenance of queue capacities and topological aspects as exogenous parameters, rendering it exceptionally adaptable for diverse gridlock-related applications. This adaptability is especially pertinent to healthcare management during the COVID-19 crisis. The model meticulously integrates the concept of gridlock, furnishing a comprehensive comprehension of its origins and repercussions. Validation of this model involves rigorous comparison with established methodologies, exact results, and simulation data, consistently high-lighting its versatility and precision. By applying the model to healthcare management, we scrutinize the dynamics of patient flow within a Hong Kong hospital, placing specific emphasis on the critical issue of bed blockage, further exacerbated by the COVID-19 pandemic. The model's gridlock decomposition unearths the nuanced impact of bed blockage on distinct hospital units, addressing the imperative requirement for quantifying in-patient bed blockage within healthcare systems during a pandemic.
Keywords:
COVID-19 Pandemic
; Healthcare Systems
; Coxian Phase-Type Distribution (CPTD)
; Survival Distributions (SUDs)
; Queueing Model (QMs)
; Restricted Capacity Queueing Model (RCQMs)
; Queue Capacities (QCs)
; Mortality Rate
1. Introduction
Hong Kong, a densely populated city with a population exceeding 7 million, resides within the larger context of China, a thriving and influential nation. Over the past decade, statistics provided by the Hong Kong Government reveal a significant shift in the demographic landscape, with median age of Hong Kong’s population increased from 5.75 million in 1991 to 7.41 million in 2021 . It revealed that more elderly requires cares and the demand for healthcare services are growing, which deteriorates hospitals’ service quality and increases financial burden of government. With reference to the report from the Health Department of HKSAR in 2021 , the Hong Kong government has spent more than US$22.7 billion during the year of 2020 on healthcare expenditure which accounts over 6.2% of the total GDP. The public expenditure on health accounts for half of the total expenditure. The number of inpatients discharges has reached 1.8 million in 2020 , in 2021 there were a total of 36,126 hospital beds spread across 42 hospitals, along with 47 specialist outpatient clinics, 73 general outpatient clinics, 18 Chinese Medicine outpatient clinics, and community outreach teams. In order to cater for aging population, the government can either put more money to build healthcare facilities or improve the efficiency of the existing healthcare system. The former approach entails a substantial investment of time and financial resources, spanning from the planning stage to actual implementation. An additional challenge lies in the shortage of healthcare professionals within the sector. Many doctors opt not to work in public hospitals due to extended working hours and comparatively lower compensation compared to private clinics or hospitals. To address this issue, the government has endeavored to increase the salaries of doctors and nurses, while simultaneously transferring some of the costs to patients. Consequently, governments are now adopting the latter method, which is deemed more practical and conducive to long-term development. Enhancing resource allocation efficiency is imperative to accommodate a larger number of patients within the existing healthcare facilities.
Understanding and managing gridlock within hospitals is of paramount importance for optimizing their performance. While simulation models have traditionally been the go-to approach for analyzing hospital gridlock, they can be unwieldy when integrated into optimization frameworks. Conversely, analytical models, which naturally lend themselves to optimization, and the scarcity of their development is attributed to the difficulties in modeling gridlock spread while preserving a versatile framework. In this study, we explore the domain of analytical models, with a particular emphasis on analytical QMs.
When employing queueing theory to model hospitals, is essential to accurately capture the complex interactions among the queues. Take, for example, a chain comprising various hospital units, each represented as a queue, where the flow of patients takes center stage. Understanding the correlations between the occupancy levels of these diverse units can prevent bed blockage and enhance patient recovery procedures. Furthermore, understanding these correlations between queues aids in clarifying the propagation of gridlock and its resulting consequences, such as spillback situations. This is especially important in chain with loops, where spillbacks become particularly noteworthy since they have the potential to result in deadlocks, also referred to as gridlocks .
The chain model developed by Jackson [5,6] is one of the most extensively studied QNMs, assuming infinite queue capacity. However, this assumption, which is often retained due to the complexity of modeling between-queue correlations in RCs, does not capture the full complexity of real-world scenarios. To address this, we turn our attention to RCQMS models.
A RCQMS comprises queues via an finite buffer capacities interconnected in a chain. RCQMS models find applications in diverse fields such as healthcare patient flow analysis , manufacturing chains , SCAs, , prison networks (PNs) , and chain distribution (CHDs) (e.g., corridors) [7,8,9,10,11,12]. Within RCQMs, gridlock is modeled through blockage, where a job, such as a patient or prisoner, is obstructed from moving to the next queue upon service completion because the subsequent queue is full. Accurately describing this blockage phenomenon, including its occurrence, duration, and location, analytically presents a substantial challenge, we must consider the added intricacy of developing a model that is computationally efficient.
This study use a crafted model which will be incorporated into optimization frameworks to derive gridlock mitigation strategies, underscoring the importance of proposing a tractable model. Because it is challenging to formulate manageable analytical expressions for transient distributions, our primary emphasis is on analyzing stationary distributions.
Specific methods for evaluating stationary distributions in RCQMs exist for chains involving only 2-3 queues with defined topologies. Nonetheless, when dealing with more complex chains, it becomes essential to employ approximation methods. Existing analytic models for RCQMS employing approximation methods often modify QCs or chain topologies (CHTs), making QCs endogenous parameters. Moreover, approximations are used to ensure integrality, with positivity checked afterward. In contrast, our proposed RCQMS model maintains these parameters as exogenous and accommodates chains with arbitrary topologies.
Additionally, our model directly incorporates gridlock as a fundamental aspect rather than treating it as an underlying phenomenon. We introduce an innovative method for configuring the state space for queues, taking into explicit consideration the blockage phase. Despite growing recognition of its importance, only a limited number of analytical models have incorporated blockage thus far . Our model provides performance metrics that offer insights into both the origins and outcomes of gridlock.
The structure of this research can be outlined as follows: we begin by presenting an overview of the RCQMS framework and conducting a review of existing models. Following that, we provide a comprehensive description of our proposed model, which is then subjected to validation against established methods, exact results, and simulation findings.
This research makes a significant contribution by preserving a general formulation for the analytical model, making it applicable to various gridlock-related applications. Specifically, we apply this model to evaluate gridlock in healthcare management. We address the problem of bed blockage by simulating the flow of patients through a chain that includes both operative and PACU within a hospital in Hong Kong. By conducting a thorough analysis of gridlock, our model enables us to identify three primary factors contributing to bed blockage and evaluate their impact on different hospital departments. Additionally, our performance metrics unveil that while bed blockage occurrences might be infrequent, their repercussions can substantially impact the efficiency of hospital units.
Our approach extends beyond existing analytical queueing methods the healthcare section, our approach can handle chains with diverse topologies and varying quantities of RCQMs. Moreover, the all-encompassing performance metrics respond to the urgent demand for approaches that accurately quantify the problem of bed blokage for in-patients.
Although various signal control methods have been documented in the literature, there remains a demand for solutions that can efficiently function during congested situations. In such scenarios, the effectiveness of signal control strategies is closely tied to the development and spread of queues. Therefore, the objectives of this study are as follows;
- −
- To create a novel RCQMS framework that explicitly incorporates gridlock and maintains QCs and CHTs as exogenous parameters.
- −
- To validate the proposed RCQMS model against existing methods, exact results, and simulation outcomes to demonstrate its versatility and accuracy.
- −
- To apply the RCQMS model to healthcare management, with a specific focus on the movement of patients within a chain of operative and PACU located in Hong Kong, with a particular emphasis on analyzing and quantifying the impact of bed blockage.
- −
- To pinpoint and measure the origins and effects of gridlock within the healthcare chains, addressing the crucial requirement for approaches that quantify the obstruction of in-patient beds in healthcare systems.
- −
- To broaden the application of current analytical queuing techniques within the healthcare industry, by adapting them to handle chains with diverse structures and varying quantities of RCQMs.
- −
- To provide comprehensive performance metrics that offer valuable insights into gridlock within chains, particularly in healthcare management scenarios.
- −
- To contribute a flexible and comprehensive analytical model applicable to gridlock-related scenarios in various fields, with a focus on healthcare management, ultimately aiming to improve resource allocation and optimize the existing healthcare system.
2. Literature Review
2.1. COVID-19 Pandemic and Patient Flow
Odegaard et al., (2007) shows the patient flow efficiency of a Canadian hospital resembling the one under investigation was examined . Vancouver General Hospital (VGH) faced challenges with a centralized dispatch system handling approximately 300,000 cases annually, specifically related to a shortage of porters. To address this issue, the hospital allocated decentralised porters to handle specialised cases. Instead of employing a queuing model, as seen in the research conducted by , which assessed the impact of porter services on patient waiting times, the research team opted for a simulation approach to address the problem. They identified porter unavailability as a key factor contributing to the inefficiency of patient flow, resulting in delays in transporting patients to CT rooms and transferring them between wards. In our terminology, this can be described as an extended searching time for porters within the hospital. The research team also conducted qualitative research through direct observation of porters and the dispatch system, which they referred to as “shadowing.” They recognized that the collected data might not accurately reflect crucial factors such as pickup time, clear call time, and instances of bottleneck situations .
Individuals diagnosed with COVID-191 are at an elevated risk of developing thromboembolic complications [16,17], which may be triggered by the activation of the body’s coagulation system due to COVID-19 or by local or systemic inflammation [18,19]. Notably, those who do experience thromboembolic complications face a more than fivefold increased risk of mortality from all causes . However, current data does not provide sufficient support to either endorse or discourage the routine utilization of prophylactic thrombolytic therapy or increased anticoagulant dosages for hospitalized COVID-19 patients . The occurrence of pulmonary embolism (PE) in SARS-CoV-2 patients who have undergone CT pulmonary angiography has been reported to vary, with reported rates ranging from 17% to 35% [16,21,22,23,24,25]. This prevalence is particularly heightened in severely ill patients , but even individuals with milder forms of the disease can develop acute PE [22,26,27].
The precise contribution of pulmonary embolism (PE) to mortality in patients with SARS-CoV-2 remains uncertain due to the fact that not all patients routinely undergo CT pulmonary angiography and because there’s a limited number of autopsy studies available . However, in cases of patients suspected of having SARS-CoV-2 and exhibiting a strong clinical suspicion for PE, which can be determined based on symptoms like hemoptysis, unexplained rapid heart rate, or signs and symptoms of deep venous thrombosis alongside acute deterioration upon patient mobilization, it is advisable to consider performing CT pulmonary angiography (Figure 1) .
As of now, there are no established age-adjusted d-dimer cutoff levels to definitively rule out venous thromboembolism in COVID-19 patients. Notably, individuals with severe SARS-CoV-2 pneumonia display significantly elevated d-dimer levels [29,30]. However, it’s worth mentioning that d-dimer levels have been found to be associated with both the presence of PE and the degree of obstruction in the pulmonary arteries in patients with SARS-CoV-2 . Hence, d-dimer levels may serve as a valuable tool in stratifying the risk of PE in patients [25,31].
Individuals with SARS-CoV-2 are particularly vulnerable to the development of superimposed pneumonia, a condition that affects approximately 10% of hospitalized patients [32,33]. In cases involving COVID-19 patients with ARDS, the cause of death can often be attributed to secondary bacterial or fungal infections [34,35,36,37]. Therefore, if individuals undergoing COVID-19 treatment experience secondary respiratory deterioration, healthcare providers should consider the possibility of superimposed pneumonia. It’s advisable to conduct lower respiratory tract cultures and employ chest imaging techniques. The presence of lobar consolidation in chest imaging may indicate the existence of superimposed bacterial pneumonia (Figure 2, Figure 3 and Figure 4) .
Essential sources were pinpointed by utilizing data statistics2, in addition to open dataset repositories from Google Dataset Search, Microsoft Open Research Database, as well as datasets from Stanford and MIT. It’s worth noting that during the data search process, particular emphasis was placed on maintaining uniform data resolutions across all selected sources.
As stated in the document sourced from QMH , the hospital encountered challenges concerning prolonged porter service times. The hospital administration identified various factors contributing to this issue. Specifically, they acknowledged that geographic constraints, such as elevator capacity and inefficiencies in the hospital’s structural design, played a significant role in delayed service provision. The previous part considers the review of practical work; the work of modelling will be discussed in the following.
From the article written by Marshall et al., , they described different probabilistic modelling methods. Markov models can be used to formalize the problem with certain state, find a suitable distribution for the length of stay of patients in hospital and show how one variable influence another parameter. Another probabilistic model will be conditional PTDs, which is a new approach to use CPTD based on a Bayesian Network (BNs). In the compartmental modelling, they referred the method by Godfrey it characterized Compartmental Systems and Advanced Stochastic Models (CSASM) as those comprising a finite quantity of homogeneous, well-mixed, and aggregated subsystems known as compartments. Finally, they briefly introduced the simulation that we intend to use. They stated the whole simulation part should include three basic components: entities, activities and the state of the system. The advantages and disadvantages were taken into account in this paper such as more flexibility and adaptability than stochastic models and long execution, which serves as alert for our future work. They also mentioned the work of adding external compartments and adapting the foundational model to explore a potential hypothesis .
Given the scale of our dataset, consisting of 600,000 records, it becomes necessary tilize efficient data management methods, including data warehousing and OLAP. Vasilakis [43,44,45] offers valuable insights into automating methods and protocols for estimating a wide range of simulation parameters. By leveraging such automation, the computational complexity associated with analysis and interpretation can be significantly reduced, enabling more efficient data analysis (Appendix A)3.
2.2. Exploring the Inpatient LOS Stays in GCUs
The proportion of elderly individuals in Asian countries is steadily increasing, making them the fastest-growing segment of society and contributing to a significant rise in hospital admissions . This demographic shift necessitates the development of dedicated healthcare services for individuals who aged older than 65, leading to increased healthcare expenditure. The increased admission rates among geriatric patients with multiple coexisting medical conditions lead to prolonged hospital stays, often referred to as LOS. Regrettably, elderly patients face a greater likelihood of developing acquired disabilities, cognitive decline, or needing admission to residential care, which can be linked to their illnesses or unintended side effects of treatment . For instance, in Italy, nearly 37% of hospital admissions in 2012 were among the elderly population, accounting for nearly half (49%) of the total length of stay days.
In recent years, healthcare professionals and organizations have increasingly prioritized the assessment and characterization of healthcare quality within hospital settings. The evaluation and enhancement of hospital quality, particularly with regard to patient outcomes, represent a paramount concern for both healthcare practitioners and policymakers. Conforming to the Institute of Medicine’s 1990 definition of healthcare quality, the assessment of healthcare quality revolves around the degree to which healthcare services enhance the likelihood of attaining favorable health results for both individuals and broader populations. This definition aligns seamlessly with the most contemporary insights and knowledge within the healthcare field . Health outcomes refer to the long-term impact on a patient’s well-being resulting from the delivery of healthcare services . In order to acquire an accurate assessment of the fundamental components of quality, numerous authors have undertaken the task (e.g., [50,51]) argue that multiple indices should be considered. These measures can be examined in relation to each other, or some may be included while others are excluded. Risk adjustment mechanisms are frequently employed to assess and compare the quality of healthcare across various institutions, shedding light on practices and cultures prevalent in highly effective hospitals. When assessing clinical results, the LOS, can function as a measure of resource usage and hospitalization costs, while in-hospital mortality serves as a critical indicator of the quality of care delivered.
While the duration of hospitalization may not encompass the entirety of cost-related considerations, it serves as a crude indicator of efficiency and resource allocation. A noteworthy decrease in risk-adjusted length of stay over time frequently signifies persistent financial constraints faced by hospitals in their efforts to reduce expenses. Moreover, it could indicate enhanced proficiency in promptly stabilizing patients or a shift towards earlier discharge and the utilization of alternative care options like outpatient or home-based care. According to Kroch et al. (2007), a decline in length of stay and improved mortality rates were linked to the release of more critically ill patients, consequently leading to higher readmission rates . Conversely, hospital mortality, being the ultimate result of treatment, is regarded as a pivotal indicator of the quality of healthcare delivered. Length of stay not only reflects advancements in medical practices and changes in care approaches but also encompasses health policies pertaining to hospitalization, particularly in periods of fiscal limitations and a progressively aging population.
The interrelationship between in-hospital mortality rates and length of stay has been extensively explored in terms of bivariate analysis . Nevertheless, the objective of this section is to present a multi-tiered model that integrates a distinctive methodology for modeling length of stay utilizing the CPTD. This innovative approach has not been previously employed in modeling survival durations within multi-tiered datasets. The viability of this approach in modeling length of stay across various levels of care provision will be evaluated by analyzing hospital stays in elderly wards throughout Hong Kong. The analysis will not only account for disparities in length of stay but will also investigate rates of in-hospital mortality.
Accurately modelling the duration of hospitalisation length of stay and its associated costs can potentially enhance the standard of healthcare provided for geriatric patients in hospitals. The management of elderly patient care within hospital settings could be significantly improved through the implementation of a predictive length of stay model. For instance, if hospital managers had the ability to estimate the length of stay upon patient admission, more effective ward management could be achieved, leading to optimized allocation of beds and sources . In the context of elderly individuals receiving medical treatment within a hospital, the distribution of their LOS often exhibits a highly skewed pattern. Typically, there is a prominent peak at the beginning of the distribution, followed by a gradual decline as the duration of stay increases. Previous studies focusing on modelling length of stay in elderly wards have revealed that a two-step MEMs effectively captures the survival patterns of patients, providing a reliable representation . Subsequent investigations have yielded additional findings supporting the improvement of MEMs through the integration of more intricate CSASM, including the CPTD.
CPTDs, which belong to the widely utilized PTDs, constitute a distinct subset that was originally introduced by Neuts in 1975 . One advantage of CPTDs is their ability to address the issue of generality in PTDs by necessitating only a limited number of parameters used to explain a distribution through n phases, however the general PTD needs n2 + n parameters [57,58].
CPTDs have found application in diverse contexts, encompassing areas such as examining data related to component failure times, identifying the LOT for individuals at risk of suicide, assessing the duration of prisoner remand periods, and evaluating the lifespan of male rats.These distributions have demonstrated their versatility and suitability for various fields of study . Marshall et al. (2004), the CPTD was employed to model the trajectory of students’ career progression within a university setting. The conceptualization of this process involved envisioning a series of progressions through underlying phases, ultimately leading to the occurrence of departing from the university upon graduation. The CPTD was utilized as a suitable framework for capturing and analyzing this dynamic process [58,60]. The majority of applications involving the CPTD have focused on modelling the duration of hospital stays. Specifically, a study conducted by Faddy and McClean (2005) demonstrated that the CPTD was a suitable choice for accurately explaining the LOT that elderly patients in the United Kingdom spent in care. This research provided evidence supporting the efficacy of using the CPTD for characterizing the hospitalisation periods of elderly patients . Furthermore, the CPTD has been utilized to depict the successive phases of patient advancement, commencing from their initial admission to the hospital and concluding with their departure following recovery or unfortunate outcomes. The progression through the orderly arrangement of transitory states can correspond to various stages of patient care, including diagnosis, evaluation, long-term care, and rehabilitation. Ultimately, patients reach an absorbing state within the CPTD, which signifies their exit from the hospital, be it through discharge, transfer to another facility, or unfortunate mortality. This utilization of the CPTD allows for a comprehensive representation of the patient journey within the hospital setting .
In terms of methodology, the CPTD relates to the duration it takes for a FLMC in continuous time to reach a state of absorption. The stochastic process initiates from a temporary state and proceeds accordingly. Within this distribution, there exists a single absorbing state, and it provides a framework for modelling the time to absorption. The authors clarify the probability denoted as P(t), which represents the ongoing activity of the process at time t. These models possess a unique characteristic in comparison to general PTDs, as the transient states or phases within the model are systematically arranged or ordered. The CPTD illustrates a process that begins in the initial phase and then advances in a sequential manner, progressing through the phases, ultimately leading to either reaching the absorbing state or termination. In simpler terms, this distribution emerges when there is a predefined sequence among the transient states, allowing only forward transitions among them. These phases effectively capture the stages of a process until its completion, with the estimation of the latent count of phases and transition rates.
In this model, it is feasible to assign practical significance to the transient states. For instance, within a hospital context, each stage can be associated with the progress of recovery. The initial state may symbolize a patient’s admission, followed by successive states like rehabilitation or diagnosis or treatment. At each state/level, the individual might go from the hospital through discharge, transfer to another facility, or, unfortunately, due to mortality. By incorporating these real-world interpretations, the model can capture the sequential progression and outcomes within a hospital environment.
Where in a HMC in ;
The T function is as follows:
W denotes the matrix that encompasses transition rates among the states,
In this Eq., e represents a vector composed of 1’s. The count of parameters in a CPTD can be expressed as 2n-1. The Coxian family encompasses a wide range of distributions within the category, covering all conceivable distributions on. It is considered suitable for estimating the parameter of LTD. We explain T aswith aggregate of IEVs,with risk rate andis a set of independent variables ofwith MND andSeta hybrid version of SUDs, whereis the SUDs of.
Scholars developed the Eq. to express the length of stay in different phases (k). Consider as the percentage of people exiting the system extracted from the ith phase, which can be quantified as;
Subsequently, patients can be categorized into groups based on the length of patient’s hospital stay (LOS) where the ratio is. Generally, the kth group length of hospital stay Ok can be recognized via the following Eq:
The arranged LOS data for each patient, denoted as t(1), ..., t(z), where z denotes the count of patients in the dataset, enables an analysis of shared attributes among patients within each LOS category.
2.3. Examine the Mortality Rate Within the Confines of Healthcare Facilities
Several authors have put forward the suggestion of utilizing in-hospital mortality rates as a means of comparing and analysing the standard care provided (for more information see ). Various statistical methodologies have been suggested in the past to adjust for the risk associated with different healthcare providers when assessing outcomes, considering variations in case-mix among them. This adjustment is crucial to facilitate valid comparisons among providers, taking into account variations in risk factors, one of the simple methods for risk adjustment involves calculating an anticipated value for the outcome of each provider, while considering the linkage among the outcome and the pertinent risk factors. To evaluate the connection among outcomes and variables relevant to this context, the utilization of multi-tiered models, also known as REM or HLM, was proposed [65,66,67]. The aim of utilizing multi-tiered models is to accommodate the possibility of intra-ward correlation, where patients within the same hospital may exhibit greater similarity in terms of outcomes compared to patients from different hospitals, assuming all other factors are equal. Additionally, considering the autonomy of regional healthcare services, the model must also consider the potential impact of the policies at the regional level on the elderly wards quality . The justification for employing multi-tiered modeling stems from acknowledging that regional health systems hold regulatory authority over health-related affairs within the national context. Each care unit has the authority to set its own performance standards within a well-defined framework. Conversely, central health authorities determine the criteria for hospitalization. Examining risk adjustment factors at each level allows for the attribution of outcome disparities to their respective levels, making the analysis more comprehensive. Multi-tiered models offer notable advantages in terms of interpretation, enabling a deeper understanding of the data and yielding more insightful results [69,70].
The multi-tiered model contains three stages: the individual patient, indicated as the (1) stage P, the ward as the (2) stage, and the region as the (3) stage:
The possibility of patient i’s death in unit j in region k, given the variables Y, is expressed as ;the latent or un-observable random variation specific to each hospital, acting as an intercept effect within different hospital wards, withthe stochastic variability in the intercept across regions, with
Within the framework of multi-tiered modeling, the assumption is made that random elements at various levels are uncorrelated, except for patients within the same ward or region, where non-zero correlations are taken into account. The observed random impact between wards can be viewed as a measure of the relative efficiency or performance of hospitals, all while taking into account fixed coefficients connected to patient, ward, and regional attributes. This approach enables the examination of the impact of various factors while considering the unique contributions of different levels in the analysis. The estimates u0jk, along with their corresponding 95% confidence intervals, depict the distinct managerial influence of the jth wards on the mortality risk. These estimates enable the identification of hospitals whose confidence intervals fall below or above verage or expected value of the risk of mortality.
To illustrate the approach, we present an example from the healthcare domain, focusing on modelling in-hospital patient mortality in elderly wards within Hong Kong. The utilization of a multi-tiered model provides valuable control over potential correlations within wards and hospitals, thereby improving the analysis of the data. Moreover, incorporating the CPTD as a covariate within the multi-tiered model enables the capturing of various stages of patient length of stay. This incorporation of the covariate stage significantly enhances the model’s representation of the data, surpassing the standalone multi-tiered model. Consequently, the refined model facilitates improved assessments of various hospital wards and regions, enabling evaluations of the care provided and the corresponding costs associated with elderly patients during their hospitalisation.
This study highlights the value of incorporating the CPTD into the multi-tiered model. Future studies aims to mathematically integrate these two techniques and assess the efficacy of the new methodology through a comparative analysis with existing methods employed by and . In these previous methods, a CPTD model via covariates was utilized to predict class membership. The proposed research seeks to advance the current understanding and enhance predictive capabilities by combining these approaches and evaluating their performance.
Patients with multiple co-morbidities demonstrate a reduced mortality risk when compared to those with a lower number of documented coexisting medical conditions. Patients undergoing surgery or those admitted with traumatic injuries face an increased risk of mortality, unlike individuals who have received a diagnosis with a particular medical ailment or those patients admitted without any traumatic injuries. In this particular situation, it is appropriate to incorporate the stage covariate because individuals who experience mortality in the initial stages demonstrate a higher risk of death when contrasted with those who pass away in the third stage. On the flip side, patients who exit during the second stage show a reduced risk of mortality in comparison to those who leave during the third stage. Furthermore, individuals with chronic diseases have a lower mortality risk than those with non-chronic conditions. The presence of circulatory and respiratory diseases increases the risk of mortality relative to other diseases. An analysis of ward characteristics reveals that public hospitals carry a heightened the mortality risk when compared to other hospital types, whereas the quantity of beds does not appear to have a substantial influence on the risk of death.
3. Method
Now we represent a novel model designed to assess the chains consisting of RCQMs. This model is capable of handling multiple server queues with diverse topologies and employs a blockage-after-service approach. This approach is a method of approximation that entails breaking down the chain into separate queues. We aim to ensure that the stationary distribution denoted as accurately approximates the MSDs of each isolated queue i. Our primary objective with this method is to ensure that serves as a robust approximation for the MSDs of queue i.
To maintain computational feasibility, we utilize traditional distributional assumptions and approximations. In particular, we make the assumption that, for every queue, the intervals between arrivals, the durations between successive unblockage events adhere to independent and identically distributed through exponential distributions, and service times. stands for queue i stationary distribution; is the arrival rate; service rate based on a server; represents the chance or probability that an item, person, or entity currently in queue “i” will move to queue “j” at a specific point in the process, we can also show it as a ; denotes the parallel servers number; and finally, denotes the queue capacity which contains buffer size and the number of the servers.
We use our model to analyze the movement of patients through a system that includes hospital operating rooms and the PACU. Bed blockage, a common issue in healthcare settings, occurs when a patient, such as one recovering in ICU, and inability to progress to the next suitable unit is attributed to a shortage of available beds.
This patient is considered “blocked” until a suitable bed becomes accessible. Studies have highlighted that bed unavailability can hinder the adaptability and promptness in the procedures for admitting emergency and surgical cases. By addressing bed blockage through modeling and estimating its consequences, it is possible to enhance both budget management and patient care . This underscores the significance of incorporating the bed blockage phase into a patient’s recovery journey . While a small number of analytic models have considered blockage in healthcare, there is a growing recognition of their necessity. Analytical models in healthcare have traditionally concentrated on feed-forward chains, usually limited to at most three Restricted Capacity Queueing Models (RCQMs) when addressing blockages [10,73,74].
In the hospital chain under consideration, the units and their corresponding queue indices are as follows: the EMOT (indexed as queue 1), ELOT (2), ENT OT (3), surgical ICU/CCU (4), medical ICU (5), medical IMCU (6), neuro-surgical IMCU (7), elective REC (8), and ENT REC. We will subsequently refer to these units either by their complete names or their respective queue indices.4
3.1. Triangular Topology
We initiate our analysis by comparing our approach to the methodologies introduced by [75,76]. The latter research focused on a chain with only one server characterized by a triangulation topology. This chain was configured with specific parameters: and γ1 = 1. Takahashi et al. explored two distinct scenarios based on the queue buffer sizes, specifically, a zero-buffer scenario and one with a buffer size of two. Within each scenario, they investigated various service rate increments for queues two and three, as delineated in Table 1. Their chosen performance metric revolved around the blockage possibility of queue one, denoted as .
To assess the accuracy of their findings, Takahashi et al. They assessed their predictions by comparing them to either simulation outcomes or exact results obtained through covering the entire chain. Figure 5 illustrates the graphical representation of the relative errors obtained from various estimation methods. The graph on the left represents the situation where there are no buffers, in contrast, the graph on the right pertains to a scenario with a buffer size of two. In both instances, all approaches provided accurate estimates, with relative errors staying under 7% for the former and 4% for the latter. It is noteworthy that our estimates closely align with those presented by . In the context of the zero-buffer scenario, Altiok and Perros demonstrated the highest degree of accuracy in their estimates.
3.2. Featuring Two Queues A Single Triangulation Topology
Bell established a theoretical limit for the mean data transfer rate in sequential systems using the Erlang-C model. He conducted an analysis involving a tandem arrangement of two queues across various scenarios, each characterized by different QCs. His investigation revealed that several models employing decomposition techniques exceeded this upper limit. To evaluate the precision of our approach, we carried out a comparison with throughput predictions derived from methodologies proposed by [76,78,79,80,81].
The chain configuration under consideration is defined as follows: Detailed of each scenario can be found in (Table 2), and the mean throughput predictions that correspond from various methods. In our approach, we estimate the mean throughput Utilizing the effective departure rate at the second queue, denoted as .
Figure 10 demonstrates that our average throughput prediction closely aligns with the upper limit and bears a strong resemblance to the results obtained from the Expansion Method introduced by reference [78,81]. In the last three scenarios, our method surpasses the upper limit by 0.3%, 2.2%, and 3.8%, respectively. As a result, our approach consistently delivers throughputs that align with the upper limit, setting it apart from the techniques introduced by reference [76,79,80].
3.3. Validation versus Exact Results
Our examination pertains to chains comprising queues without buffers, each equipped with configuration of two servers. We set two distinct CHTs: a triangular configuration (illustrated with) and a tandem arrangement.
3.4. Scenarios Involving Varied Gridlock Levels
In each of these chain topologies, we have definedscenarios, as detailed in Table 3. For each of these service rate scenarios, we additionally evaluate , as provided in Table 4.
Within each of the scenarios, we conduct a comparative assessment of the QLD for each individual queue. We quantify the disparities between the estimated QLP derived from our proposed method and their precise counterparts. These disparities are denoted as “errors” in the distributional estimates.
In total, there are 288 error values. Notably, 50% of these absolute errors fall below the threshold of 0.009, while 70% are less than 0.02, and 90% are smaller than 0.042. This figure serves as compelling evidence that our proposed approximation method consistently maintains high accuracy across scenarios characterized by varying degrees of gridlock and diverse bottleneck locations.
3.5. Scenarios With Significant Gridlock
To further assess the performance of our proposed method, we turn our attention to highly congested scenarios. We maintain the sameas outlined in Table 3, while introducingas a demand scenarios as presented in Table 4.
We once more examine the disparities between the QLP calculated using our proposed approach and their precise equivalents across all scenarios and both chain setups. The histogram illustrating these discrepancies can be found in Figure 7(b). Out of the 288 error values assessed, half of them demonstrate an absolute value that falls below 0.019, while 70% are less than 0.032, and 90% register at or below 0.055.
For a more detailed investigation, we delve into the scenarios characterized by the highest levels of gridlock, specifically those corresponding to (Table 3) paired with all four (Table 4).
Each set of these diagrams in a row represent a specific queue, where the top row illustrates the first queue (upstream), the middle row represents the second queue, and the bottom row portrays the third queue. Within each row, the initial column of plots displays the probabilities of the queue being empty the second column showsand the third column presents. Each plot exhibits four probabilities, corresponding to (Table 4), with lighter colors indicating higher gridlock levels.
Figure 6.
(a-right) Tandem Topology: QLP in Highly Congested Scenarios; (b-left) Triangular Topology: QLP in Highly Congested Scenarios.
Figure 6.
(a-right) Tandem Topology: QLP in Highly Congested Scenarios; (b-left) Triangular Topology: QLP in Highly Congested Scenarios.
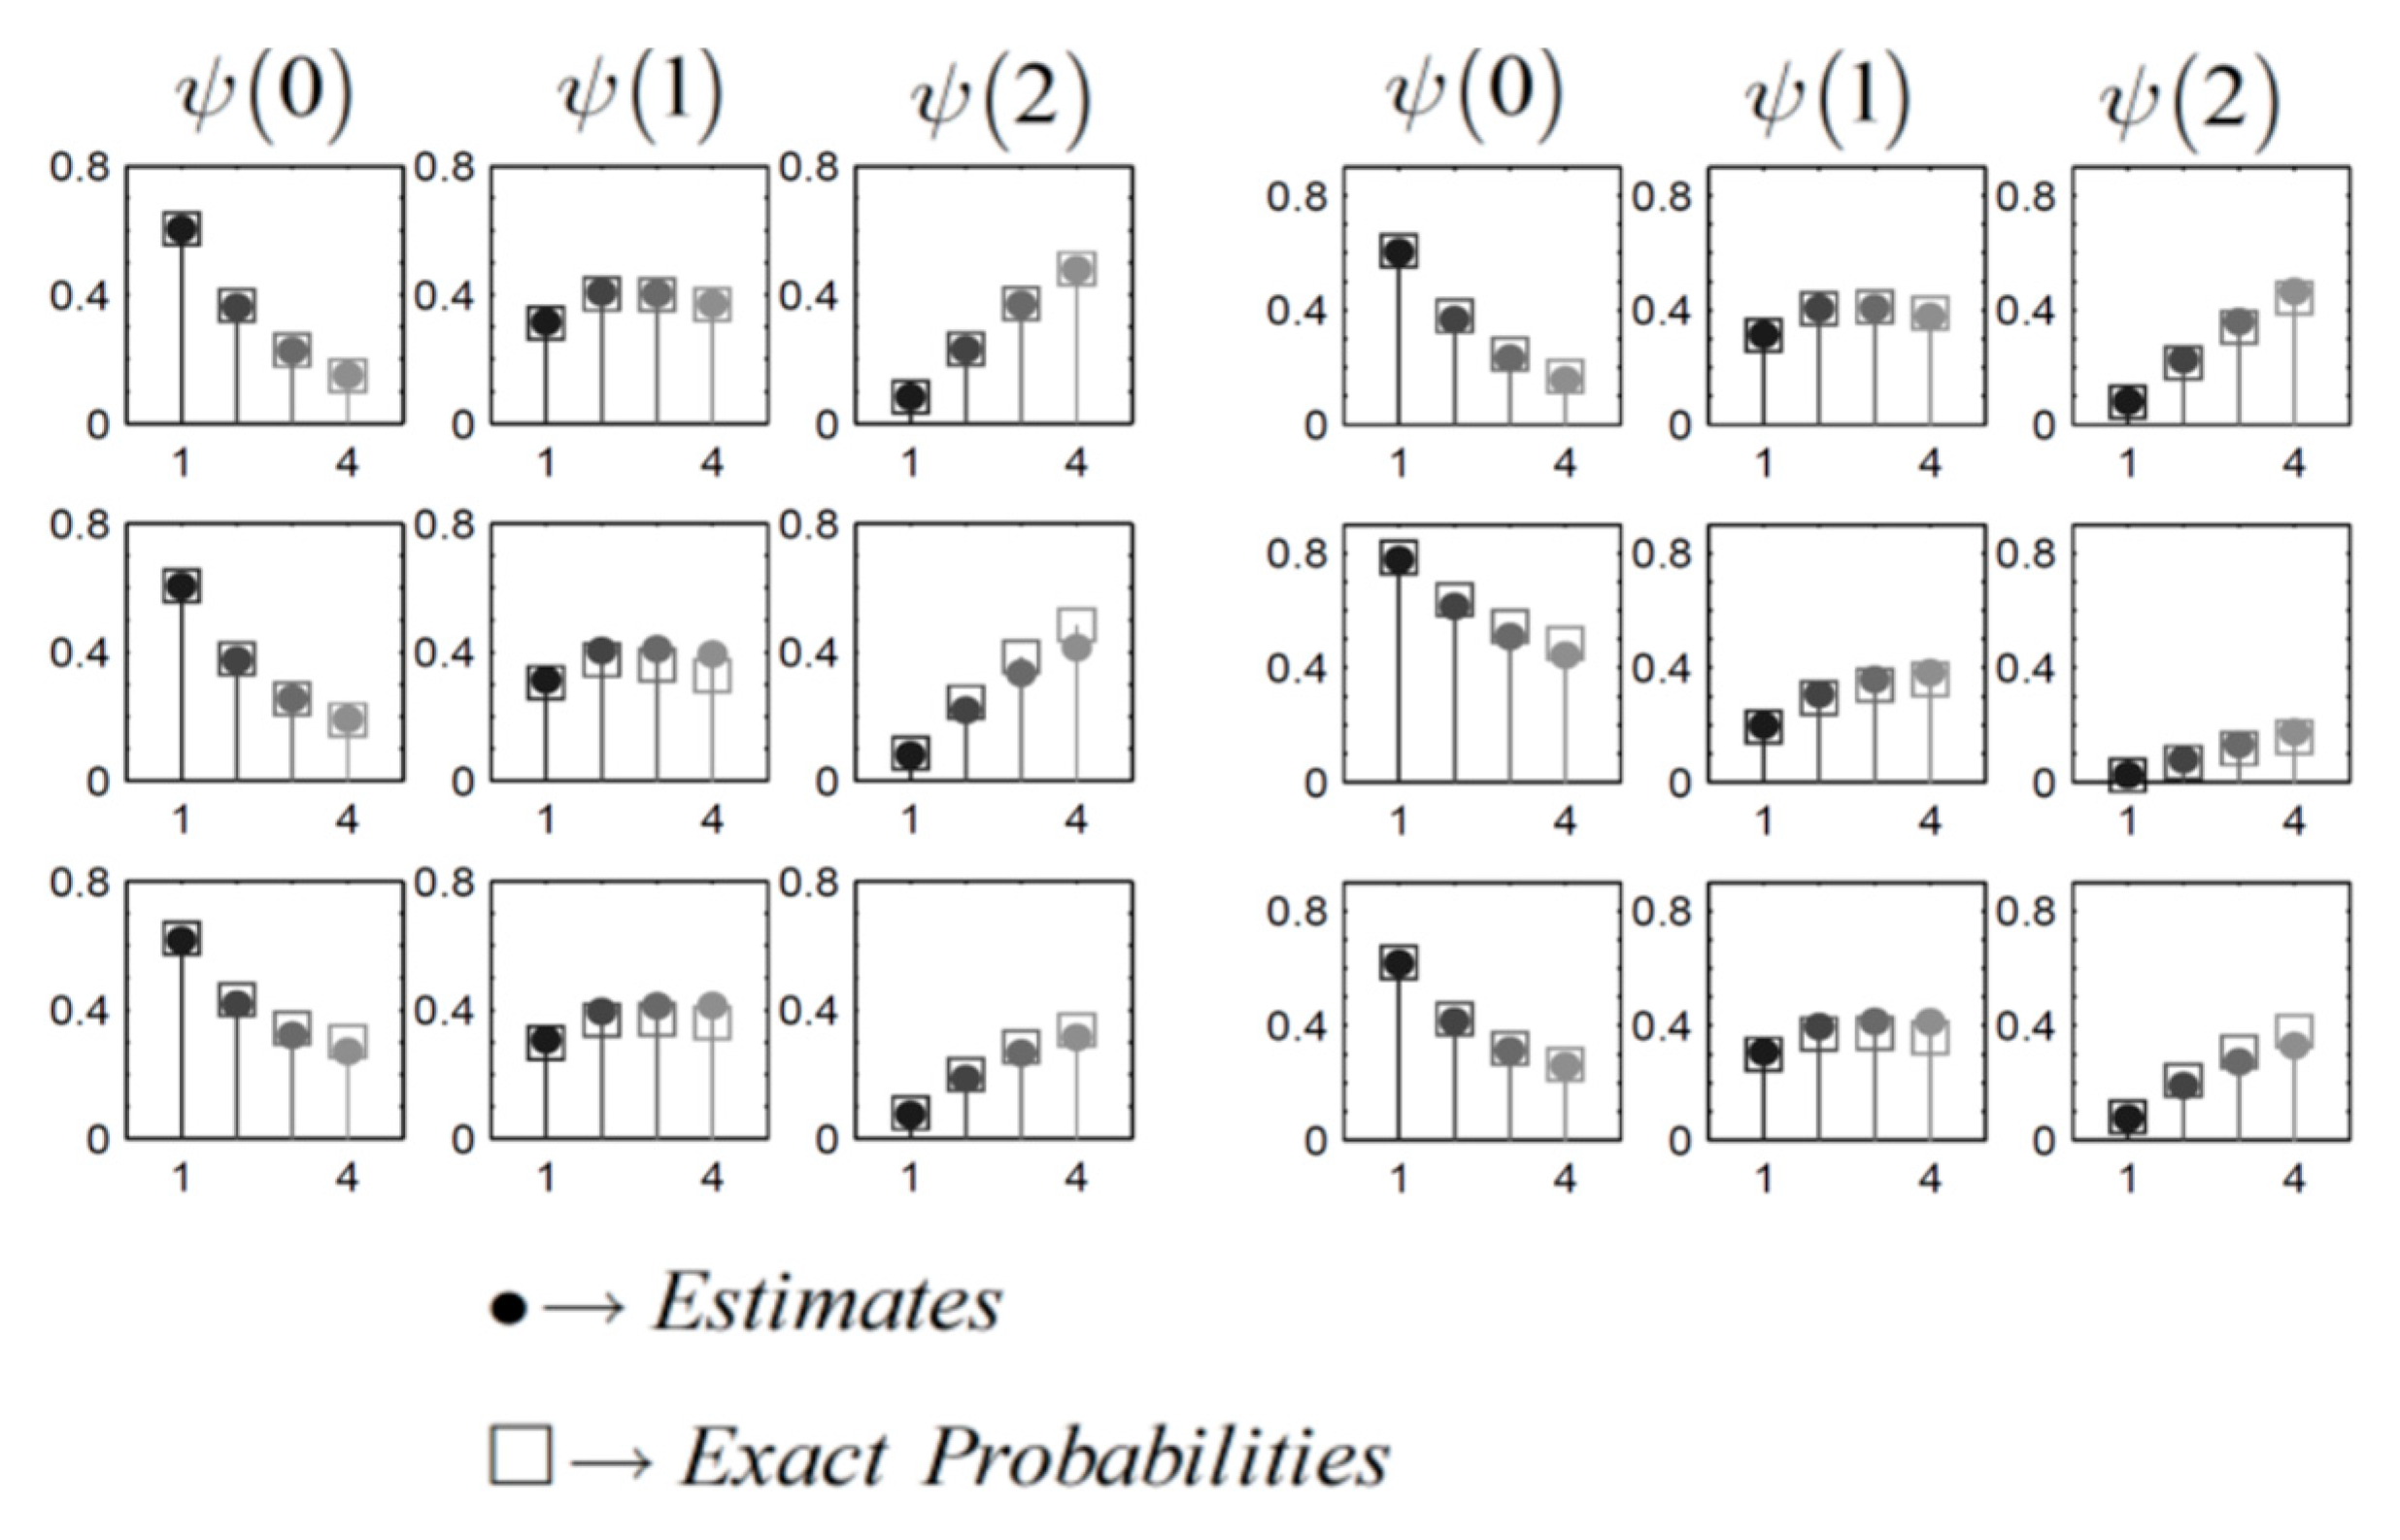
To clarify, each diagram visualizes theprobability of a particular queue being in a specific state as thearrival rate intensify. Similarly, the QLP for the TIC under the same scenarios are illustrated in Figure 6(b). Both Figure 6(a,b) emphasize that in highly congested scenarios, our proposed method accurately tracks the trends observed in the exact distributions as gridlock increases. Overall, our method consistently provides precise estimates for QLD across a range of supply & demand scenarios.
3.6. Analyzing Agreement Between Validation and Simulation Outcomes
Our method primarily focuses on marginal distributional estimates, which are essential for deriving performance measures that describe gridlock. Given the unique state space definition in our method, we lack a comparable benchmark from existing methods. To validate our approach across a broader spectrum of scenarios and CHTs, we turn to simulation results.
We consider three distinct CHTs, each consisting of nine bufferless queues, in each of these chains, there are three servers available. We delve into a series of scenarios within these chains, gradually ramping up the external arrival rates.
A is sharing the same topology and transition probabilities. Meanwhile, the topologies for B and C. In B, the transition probabilities for a given queue are evenly distributed between potential queues, whereas in C.
The time unit for transition rates (e.g., minutes or hours) is referred to as T. Each simulation run comprises 20 replications, with an initial warm-up period of (104T) and an additional runtime of (4*104T).
It’s worth noting that 70% of the absolute errors are below 0.0065, 80% are less than 0.0129, and 90% register at values under 0.0245. These findings provide strong confirmation of the precision in our distributional estimates
To visually depict the blockage information obtained through our approach, we concentrate on the scenarios in chain C. Figure 7 showcases the distribution estimations for queue five, as created utilizing our methodology and compared with the results from simulation. Each section represent a specific state and illustrates plotsfor all of the scenarios. Different shades distinguish the scenarios, which correspond to increasing external for queue one.
Figure 7.
The distribution of queue in C for all scenarios.
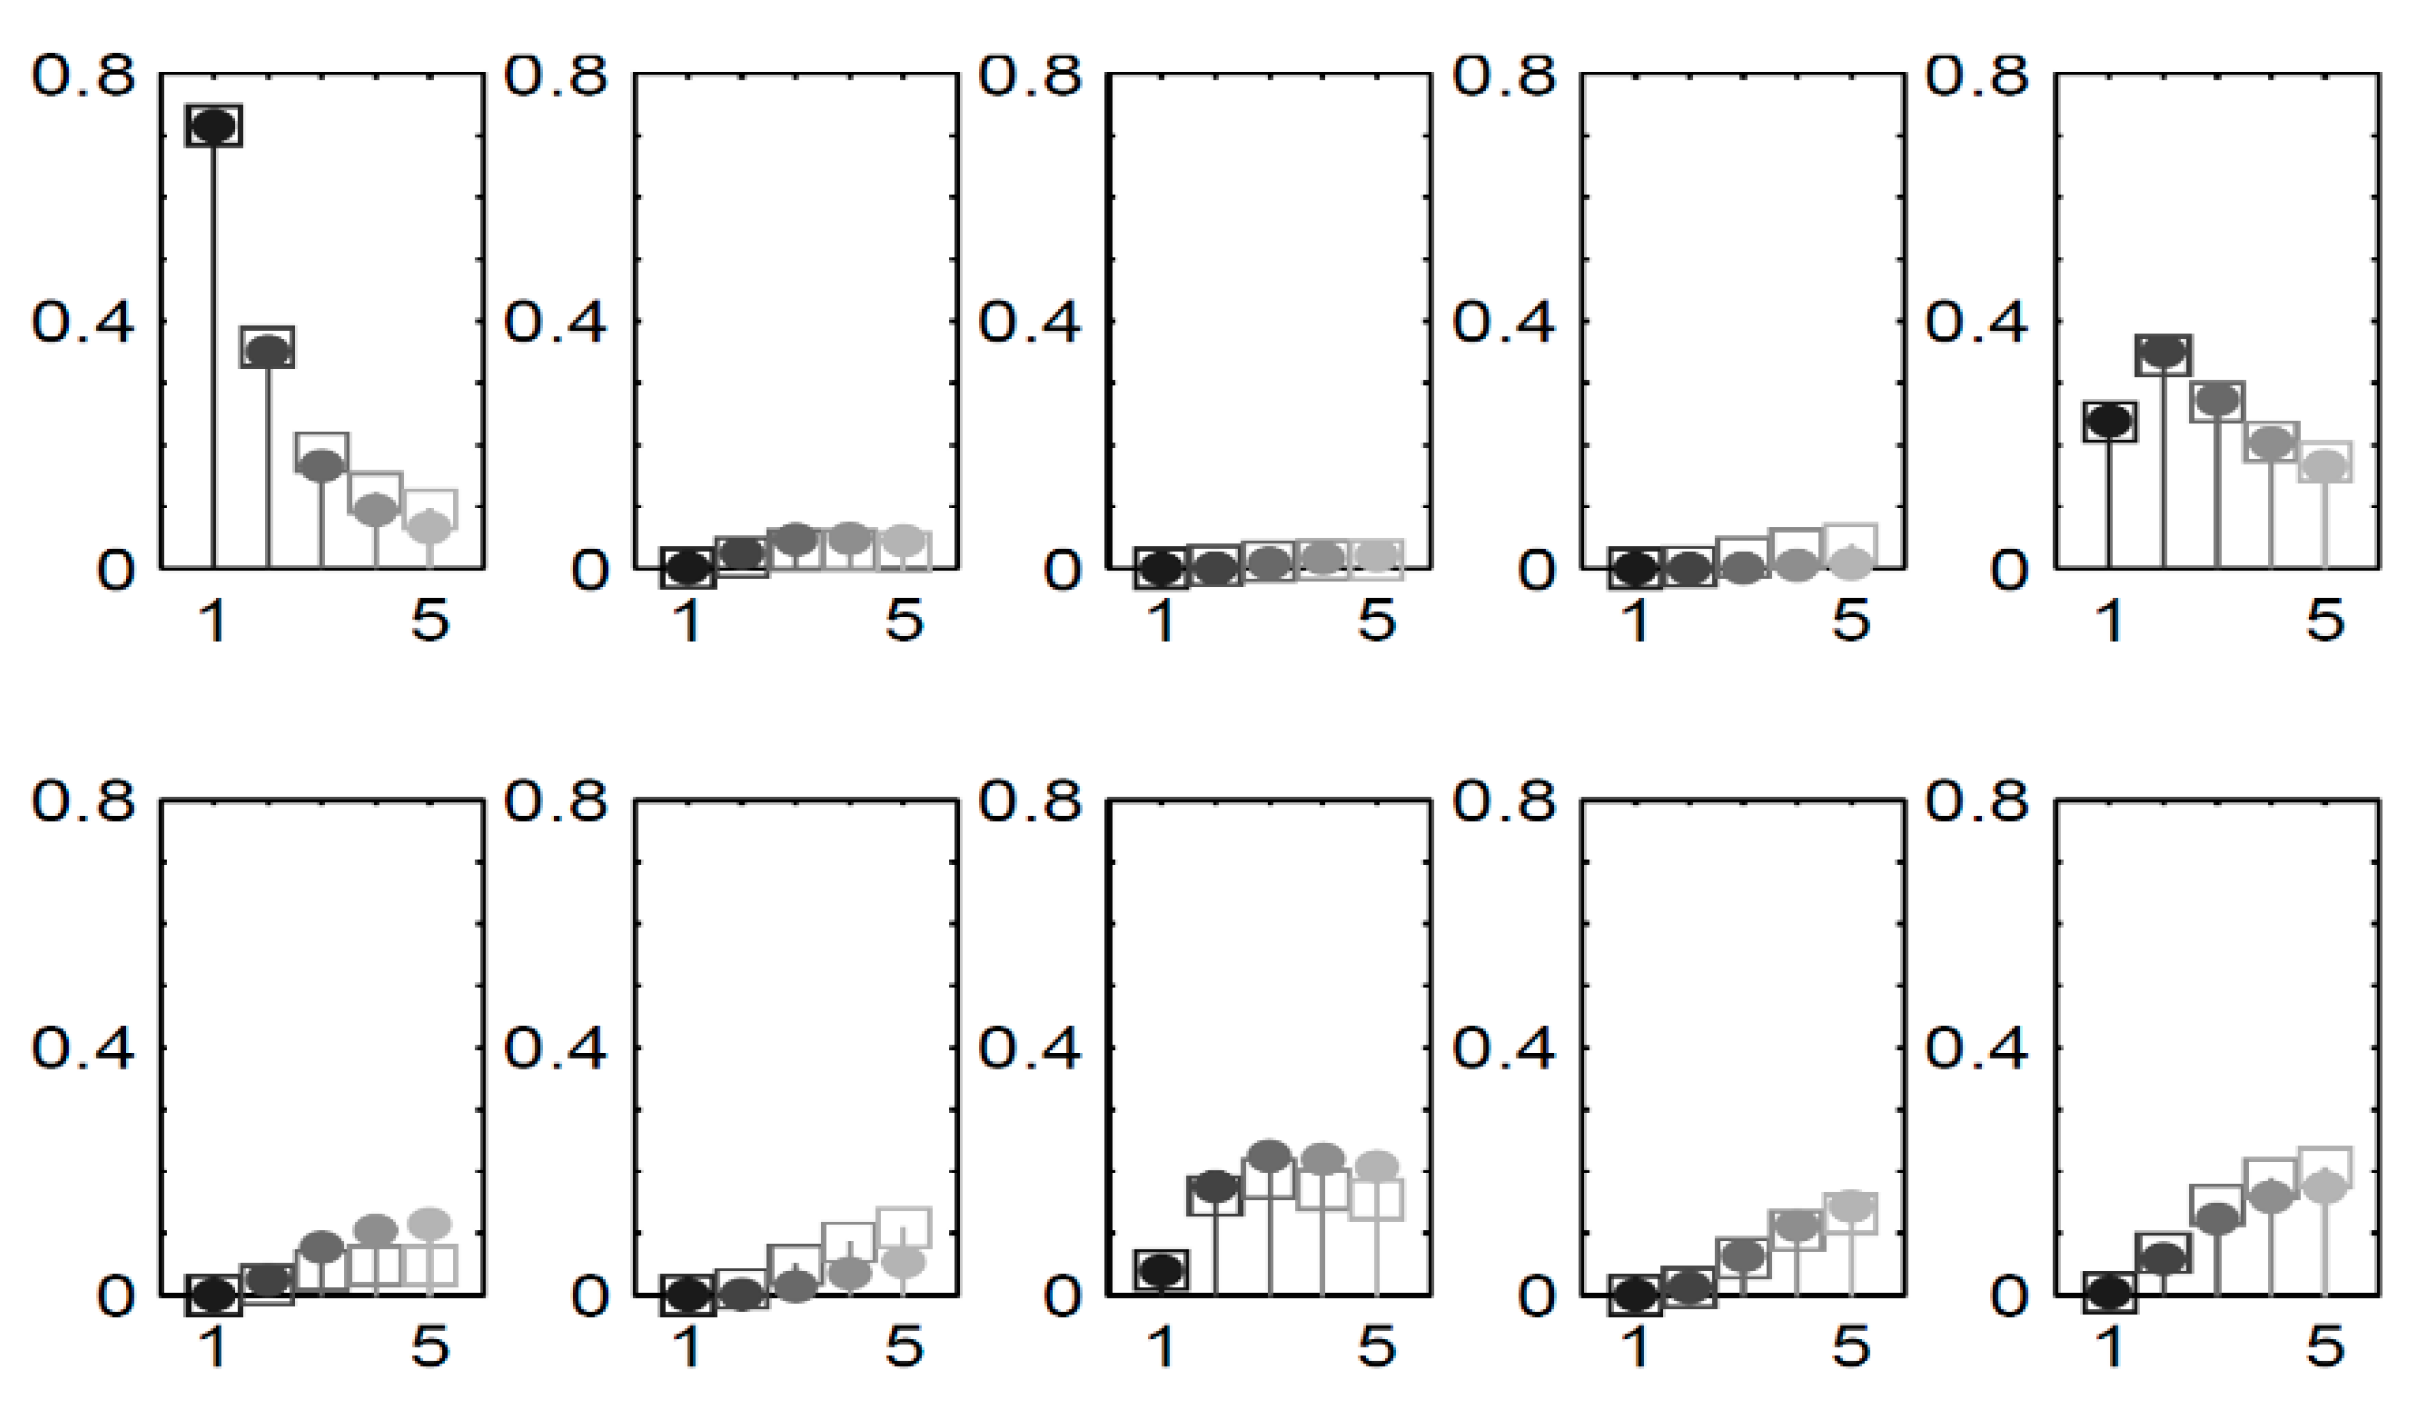
Note.
To further gauge the computational efficiency of our approach, we expanded our assessment to encompass larger scenarios. We utilized C as a building block and constructed complete chains by arranging multiple instances of chain C in a sequential configuration. Only the first queue received external arrivals, withset to 0.3. It’s important to highlight that in practice, prior knowledge and information would typically be utilized for initializing the distribution , although for our testing purposes, we initialized it with a uniform distribution.
4. Results
We have studied the patient flow in a hospital implementing a novel model that encompasses both the operative (operating rooms) and PACU areas. From a clinical perspective, a situation of bed blockage may arise, for example, when a patient who has recovered in the ICU cannot be transferred to the IMCU due to a shortage of accessible beds. Throughout this duration, the patient is classified as “blocked” until an appropriate placement becomes possible. Studies have recognized that the unavailability of beds has negative effects, diminishing the adaptability and promptness of emergency and surgical admission protocols .
The modeling of bed blockage and the estimation of its impact hold the potential for enhancing both patient care and budget management, as highlighted by studies . This underscores the significance of incorporating the bed unavailability factor into the overall patient recovery process. Despite the existence of a few analytical models that consider blockage, there is a growing recognition of the need for such models . Significantly, prevailing analytical models focused on addressing the healthcare sector has primarily focused its efforts on addressing blockage issues in feed-forward chains, typically encompassing a maximum of three RCQMs [10,73,74].
The units under consideration, along with their respective queue indices in parentheses, are as follows: EMOT (indexed as queue 1), ELOT (2), ENT OT (3), surgical ICU/CCU (4), medical ICU (5), medical IMCU (6), neuro-surgical IMCU (7), elective REC (8), and ENT REC. We will subsequently refer to these units either by their complete names or their respective queue indices.
In our model, we depict patients as tasks, and the beds in the units act as service providers. As there isn’t a designated waiting area, each unit essentially queue functions. The blockage after service feature in the model validity emulates the real-world phenomenon of inpatient bed blockage. The capacities of each ward were established based on evaluations conducted by the hospital’s staff. Maximum likelihood estimation was employed for estimating and , while transition probabilities were derived from transition frequencies.
Table 5 displays the transition matrix, with empty probabilities represented by dashes. The residual probability accounts for the likelihood of leaving the unit, assuming the job is located in queue i, which is expressed as.
Our model’s results enable us to quantify and investigate the causes of patient blockage. Table 6 displays transition probabilities, represented as under the condition of a patient being blocked. These probabilities aid in identifying the origins of blockage. To enhance readability, probabilities have been rounded to two decimal places, with values < 0.005 represented as dashes.
Table 6 facilitates the identification of three primary sources of blockage. Firstly, the medical intensive care and IMCU exhibit mutual blockage of each other’s patients as do the surgical ICU/CCU and neuro-surgical IMCU . Fist, this initial type of blockage, characterized by mutual interference, may have limited practical implications since patient swaps could be simply realized and executed.
Second source of blockage, potentially more challenging to address, occurs at the OT due to the surgical ICU/CCU . Additionally, the productivity of the EMOT is robustly influenced by its responsivity, which is compromised by blockage.
Third resource of blockage manifests in the REC and is attributed to the neuro-surgical IMCU .
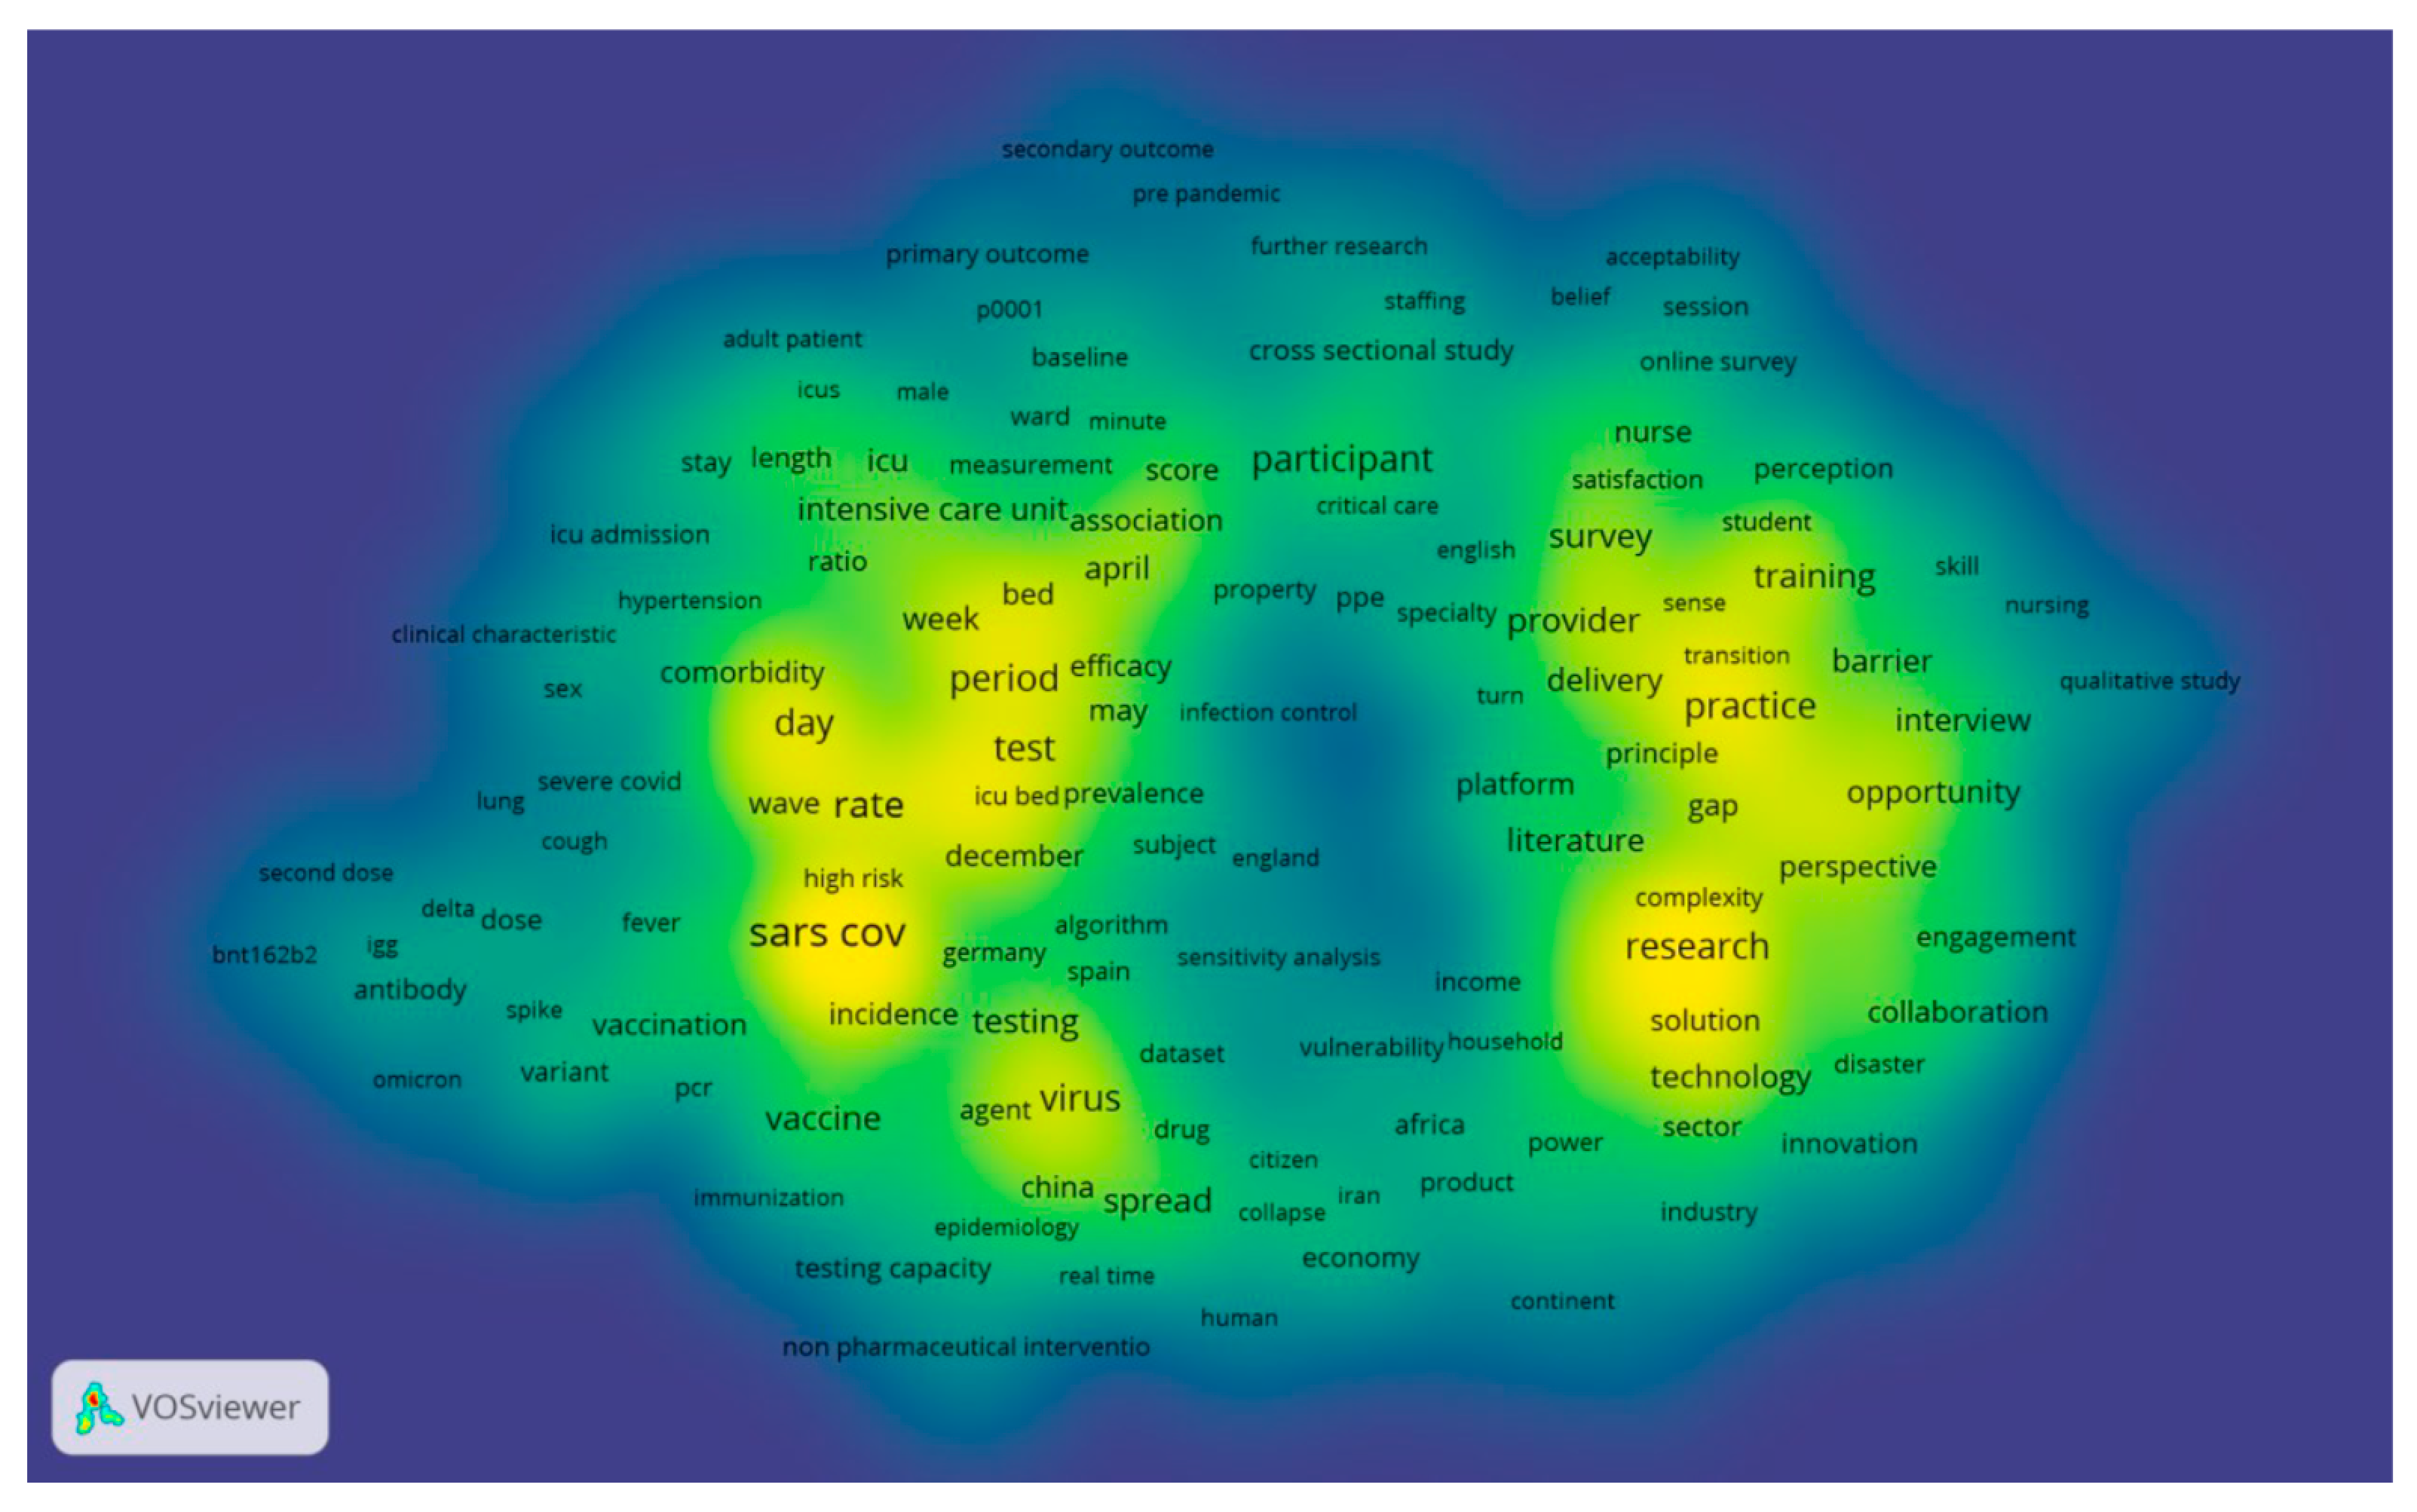
We have presented the top keywords and their frequencies in Figure 9 and Figure 10. In the Web of Science [all databases], we identified 2,413 papers up to 2023 using three keywords, ‘Healthcare’, ‘COVID-19’ and ‘Capacity.’ It was observed that the total number of keywords, when combined with their frequencies, significantly exceeded the number of author keywords. Keywords Plus, in fact, encompassed more than 60% of the author keywords. The results from VOS viewer indicate a network comprising 887 terms, and based on the 60% co-occurrence connections (representing the most relevant terms), 532 were selected, as illustrated in Figure 9.
We utilized density visualization, as depicted in Figure 10, to gain deeper insights into these keywords. Density visualization enables the rapid identification of densely concentrated areas where multiple nodes cluster closely together. The colors on the visualization denote the density of the keywords, ranging from yellow (highest density) to blue (lowest density). Points appear closer to yellow when they are associated with a higher frequency of neighboring keywords. The density visualization map highlights the primary keywords and the simulated network within the research field of appointment scheduling. Keywords in the yellow cluster are scarce, while the majority of other keywords fall into the green cluster. This observation suggests that there are limited areas of substantive investigation, as many areas do not exhibit significant development.
Figure 10.
A density visualization map that depicts the dispersion and concentration of keywords associated with the three specified terms in the field of healthcare research.
Figure 10.
A density visualization map that depicts the dispersion and concentration of keywords associated with the three specified terms in the field of healthcare research.
5. Discussion
In conclusion, our research has introduced a sophisticated QNMs tailored to investigate and address the issue of bed blockage within the chanin of operative and PACU at a hospital in Hong Kong. Through rigorous validation against simulation results, we have demonstrated the model’s prowess in delivering not only precise distributional estimates but also significant computational efficiency, markedly outperforming conventional simulation approaches.
Our analysis has delved deep into the realm of gridlock, shedding light on how our model’s performance metrics can provide a nuanced understanding of this complex phenomenon. More precisely, we have pinpointed three main causes of bed blockage and thoroughly evaluated their influance on various hospital divisions.
What sets our approach apart from existing methods in healthcare queueing analysis is its flexibility to handle chains with diverse topologies and an arbitrary number of finite-capacity queues. Moreover, our model fulfills a pressing need in quantifying in-patient bed blockage, offering detailed performance measures that encapsulate the occurrence, duration, and repercussions of blockage incidents. This not only facilitates the assessment of healthcare service quality but also aids in optimizing resource allocation and identifying the demand for expanded capacity.
The foundation of our model rests upon its ability to authentically replicate the blockage-after-service mechanism observed in real-world scenarios, providing a realistic depiction of bed blockage. The inventive state space formulation effectively captures the complexities of the blockage phase, resulting in comprehensive steady-state distributions. Furthermore, the model’s endogenous parameters offer valuable insights into the origins, frequency, and consequences of gridlock.
While our research has yielded promising results, further validation studies are warranted to explore the model’s sensitivity to distributional assumptions and robustness in scenarios where these assumptions may not hold. Specifically, we recommend conducting additional sensitivity tests to assess the reliability of our methodology, particularly in cases where distributional assumptions deviate. For such applications, methods employing phase-type distributions may offer a suitable alternative, given their density within the class of continuous distributions.
In summary, our analytic QNMs, designed to preserve RCQMs properties while accommodating chain complexities, represents a valuable tool for healthcare professionals and administrators seeking to enhance the efficiency and quality of patient care, resource allocation, and capacity planning within hospital chains.
Funding
This research received no specific grant/fund from any funding agency in the public, commercial, or not-for-profit sectors.
Appendix A
A.1. Case Studies
In wrapping up this paper, we showcase six case studies centered around clinical simulations. All these case studies leverage the AnyLogic software, and you can access the simulation results for each case through the provided links. Owing to the dynamic presentation of the simulation results in the form of animations, moving plots, or Monte Carlo simulations (MCS), we have opted not to include them in the primary sections of the paper.
- A) Influenza
This constitutes an agent-based model simulating an influenza outbreak in a simplified environment that encompasses homes and workplaces. The model features families ranging from 2 to 5 members, residing in individual houses. Each person commutes to work and returns home daily unless symptomatic. Infection transmission occurs with a defined probability during contacts, encompassing both work colleagues and family members. Every individual is susceptible to infection, progressing through states of Exposed, Infectious, Symptoms, and Immune. The model, inherently stochastic, produces varied outputs in each run. Exploration is encouraged to understand how model parameters, such as infection probability and contact rate, influence influenza dynamics.
- B) Epidemic and Clinic with Accumulating Concern
This represents a variant of the Epidemic and Clinic model, where patients, modeled as agents exhibiting Susceptible->Infectious->Recovered behavior, seek treatment in a clinic once their “Concern” surpasses a specific threshold. The “Concern” is conceptualized as a System Dynamics stock embedded within an agent. The clinic, positioned as a straightforward Discrete Event model at the top level, may or may not experience subsequent waves of the epidemic based on its capacity.
In the realm of discrete-event5 simulations, it’s crucial to recognize that the application of probability is not an all-or-nothing decision. Instead, the modeler has the flexibility to determine the extent to which deterministic modeling is applied and to leverage probability for complementary aspects. Generally, the emphasis is on incorporating system details that do not align well with a probability distribution. For example, the time needed to secure a seat on an airplane is significantly influenced by whether a seated passenger obstructs the way. In such instances, it is advisable to employ probabilities tailored to the specific situation rather than relying on a uniform rule.
This blending of determinism and non-determinism enhances the value of discrete-event simulations. Thoughtful integration of probabilistic elements allows for meaningful analyses without undue complexity in the model.
- C) Generic Agent-Based Population Model
This model is a versatile agent-based population simulation encompassing birth and death dynamics. Females, during their reproductive age, give birth to a baby at a specific fertility rate, where the time to the next pregnancy follows an exponentially distributed pattern independent of the number of children in the family. The boundaries of reproductive age, along with the fertility rate, are designated as top-level parameters.
Males and females exhibit distinct life expectancy distributions, configured using the Custom distribution object. The function “life Expectancy” in the Person agent employs a simple covariate distribution, wherein life expectancy is contingent on gender. Individuals are represented as animated dots within a rectangular area, with the dot’s diameter proportionate to the person’s age. Children are positioned near their mothers, but the location of a person does not influence their behavior. Mother-child relationships are illustrated using Link objects.
The agent type “Person” is structured as a reusable base type, facilitating extension by creating subtypes or subclasses. Additionally, the model incorporates a population pyramid chart implemented as a separate agent, offering reusability across different models. Users can interact with the pyramid chart by selecting age intervals, observing the number of males and females within the chosen range. The size of intervals in the pyramid can be dynamically adjusted for exploration and analysis.
- D) Patient Care Process Swimming Pool Metaphor
This model serves as an expansion of the chronic treatment indication dynamic model, incorporating stages of awareness and misdiagnosis. Furthermore, it introduces distinctions among three groups: fast switchers, lapsed users, and individuals misdiagnosed and seeking a second opinion. Developed for a project involving a new migraine headache drug, this model earned the moniker “swimming pool model.”
It is the art of blending determinism and non-determinism that renders discrete-event simulations invaluable. The judicious placement of probabilistic terms allows for meaningful analyses without unnecessarily complicating the model.
In this metaphorical representation, individuals actively undergoing treatment are depicted as “swimming” in the pool. Fast switchers are characterized by their readiness to change their “swimming costume” and swiftly adopt a new style or drug when one becomes available. Lapsed users choose to sit by the pool and await what they perceive as a safe moment to re-enter the water. Misdiagnosed patients, on the other hand, are likened to swimming in the wrong pool.
The model employs a straightforward System Dynamics approach with standard features. Users can manipulate the simulation using sliders, allowing them to dynamically alter several parameter values during the model run for interactive exploration and analysis.
- E) Hospital Admission Emergency Elective Interaction
This uncomplicated System Dynamics model illustrates the interplay between emergency and elective admissions, contending for available ward beds within a hospital. The representation of Bed Capacity is simplified as a fixed parameter in this context. However, in practical terms, it can exhibit greater flexibility, being conceptualized as a bed capacity stock that is adaptable through flexible staffing. This dynamic adjustment can extend up to a maximum bed capacity, which is constrained by the physical size of the hospital’s infrastructure.
- F) Clinical Process Concepts
This represents a system dynamics depiction of the fundamental concepts within the Clinical Process. The model visualizes the sequential flow of a patient group through the Clinical Process, encompassing Assessment, Investigation, and Treatment – constituting the Technical Component of Clinical Care. The emphasis here lies in understanding the overall pattern of patient movement through the Clinical Process rather than the specific actions performed by individuals.
In executing the model, careful consideration is given to the time spent in each state, often dictated by factors such as service completion rates or the time allocated to waiting and performing services. Additionally, the model accounts for the proportion of individuals opting for each pathway, and it permits the recurrence of Input Health States after the completion of a Care Episode.
For interactive exploration, users are encouraged to modify sliders controlling various parameters while the model is running. Clicking on stocks or flows facilitates the observation of dynamic outputs, providing insights into the behavior of the Clinical Process under different conditions.
A.2. Lexicons
A list of abbreviations used in this research is as follows:
| COVID-19 | Coronavirus Disease 2019 |
| SARS-CoV-2 | Severe Acute Respiratory Syndrome Coronavirus 2 |
| QNMs | Queueing Models |
| QLD | Queue Length Distributions |
| QLP | Queue Length Probabilities |
| TIC | Triangulated Irregular Chain |
| RCs | Restricted Capacity |
| RCQMs | Restricted Capacity Queueing Models |
| SCAs | Software for Chain Architecture |
| SEIR model | Susceptible-Exposed-Infectious-Recovered |
| BNs | Bayesian Network |
| QCs | Queue Capacities |
| CHTs | Chain Topologies |
| CSASM | Compartmental Systems and Advanced Stochastic Models |
| CHDs | Chain Distribution |
| PNs | Prison Networks |
| QMH | Queen Mary Hospital |
| CPTD | Coxian Phase-Type Distribution |
| SUDs | Survival Distributions |
| HKSAR | Hong Kong Special Administrative Region |
| GGO | Ground-glass opacity |
| PE | Pulmonary Embolism |
| MEMs | Mixed Exponential Models |
| PACU | Post-Anesthesia Care Unit |
| CT Rooms | Computed Tomography rooms |
| LOS | Length of Stay |
| OLAP | On-Line Analytical Processing |
| GCUs | Geriatric Care Units |
| LOT | Length of Treatment |
| PTDs | Phase-Type Distributions |
| LOT | Length of Time |
| HMC | Latent (Hidden) Markov Chain |
| IEVs | Independent Exponential Variables |
| FLMC | Finite Latent Marcov Chain |
| LTD | Long-Tailed Distributions |
| MSDs | Marginal Stationary Distribution |
| MND | Multinomial Distribution |
| REM | Random-Effects Models |
| HLM | Hierarchical Linear Models |
| OT | Operating Theater |
| EMOT | Emergency Operating Theater |
| ELOT | Elective Operating Theater |
| ENT OT | Otorhinolaryngology Operating Theater |
| ICU | Incentive Care Unit |
| CCU | Critical Care Unit |
| IMCU | Intermediate Care Unit |
| REC | Recovery |
| SPA | Segmental Pulmonary Artery |
| ARDS | Acute Respiratory Distress Syndrome |
| COPD | Chronic Obstructive Pulmonary Disease |
| PJP | Pneumocystis jirovecii pneumonia |
| RT-PCR | Reverse Transcription Polymerase Chain Reaction |
| CTA | Computed Tomography Angiography |
| MCS | Monte Carlo simulation |
Declarations
Availability of data and materials
No primary data were collected or produced in this study. All sources and references cited in this article are publicly available and can be found within the text. The demographic data referenced in both Section 2.1, pertaining to chest CT scans in the manuscript, can be accessed from the following sources:
- [Source 1]: https://github.com/UCSD-AI4H/COVID-CT
- [Source 2]: https://www.eurorad.org/case/16689
- [Source 3]: https://aimi.stanford.edu/shared-datasets
It’s important to note that the dataset in question does not contain any sensitive or confidential information.
The figures related to chest CT scans in the annex have been extracted from the following papers:
- [Source 4]: Duzgun SA, Durhan G, Demirkazik FB, Akpinar MG, Ariyurek OM. COVID-19 pneumonia: the great radiological mimicker. Insights into imaging. 2020 Dec;11(1):1-5. https://doi.org/10.1186/s13244-020-00933-z
- [Source 5]: Hani C, Trieu NH, Saab I, Dangeard S, Bennani S, Chassagnon G, Revel MP. COVID-19 pneumonia: a review of typical CT findings and differential diagnosis. Diagnostic and interventional imaging. 2020 May 1;101(5):263-8. https://doi.org/10.1186/s13244-020-00933-z
This paper is duly referenced in this article. Since it is published under the terms of the Creative Commons Attribution 4.0 International License, it allows for various uses, sharing, adaptation, distribution, and reproduction in any medium or format. This is permitted, provided that appropriate credit is given to the original author(s) and the source, a link to the Creative Commons license is provided, and any modifications made are indicated.
All simulation models and case studies (A-F) featured in this paper were generated using the AnyLogic simulation software, which is available in open access at the following link:
- [Source 6]: AnyLogic simulation software / Test Models
The software is open source, allowing users free access for modeling. References to these models are provided for data availability.
Approval from an ethics committee and participants’ consent
N/A. The research made use of data obtained from open-access databases, and no additional approval or authorization is required.
Consent for publication
N/A
| 1 | A has been constructed using the terminology of the 'SEIR model,' with the inspiration for both terminology and the overall framework drawn from the 'Compartmental models in epidemiology.' However in this model we have added another stage as ‘Dead’. You can view the representation at the following link: https://cloud.anylogic.com/assets/embed?modelId=a6dbd223-dda7-4fb7-b0b4-9519bebfeaa5
|
| 2 | (a) A total of 216 patients and a total of 349 CT scans are available at: https://github.com/UCSD-AI4H/COVID-CT [The utility of the dataset has been confirmed by a senior radiologist at Tongji Hospital in Wuhan, China, who possesses extensive experience in diagnosing and treating a substantial number of COVID-19 patients during the outbreak of the disease from January to April 2021]; (b) Additional images are available on https://www.eurorad.org/case/16689; (c) There are more than 5,000 sample CT scans of patients on the (https://aimi.stanford.edu/shared-datasets) website. |
| 3 | Please review Appendix A for the simulation case studies. |
| 4 | A simple queuing theory based on AnyLogic simulation is represented at the following link: https://cloud.anylogic.com/assets/embed?modelId=9b03da7a-bb58-4fa3-8ee8-2f0f5e23e607
|
| 5 | Now, when it comes to employing probability in discrete-event simulations, it's no longer a binary decision. You have the flexibility to determine the extent to which you model deterministically and use probability to complement the remaining aspects. Generally, the emphasis should be on incorporating system details that don't neatly align with a probability distribution. Consider, for instance, the time it takes to secure a seat on a plane, a process heavily influenced by whether a seated passenger is obstructing the way. If that individual needs to vacate the seat to make room, the duration of the seating process experiences a notable increase. In such cases, it is advisable to apply probabilities tailored to the specific situation rather than relying on a uniform rule. |
References
- Region, T.G.o.t.H.K.S.A. Demographic Trends in Hong Kong 1991-2021. 2022 [cited 2022.12.29 2022.12.29]; Available from: https://www.info.gov.hk/gia/general/202212/29/P2022122900259.htm#:~:text=The%20population%20of%20Hong%20Kong,showed%20a%20continuing%20ageing%20trend.
- The International Trade Administration, U.S.D.o.C. Healthcare. 2023 [cited 2023 2023.01.30]; Available from: https://www.trade.gov/country-commercial-guides/hong-kong-healthcare.
- Statista. Number of inpatient discharges and deaths from hospitals in Hong Kong in 2021, by hospital type. 2023 [cited 2023 2023.03.06]; Available from: https://www.statista.com/statistics/1191345/hong-kong-number-of-discharges-and-deaths-from-by-hospital-type/.
- Daganzo, C.F. The nature of freeway gridlock and how to prevent it. Transportation and traffic theory, 1996: p. 629-646.
- Jackson, J.R. Networks of Waiting Lines. Oper. Res. 1957, 5, 518–521. [Google Scholar] [CrossRef]
- Jackson, J.R. Jobshop-Like Queueing Systems. Manag. Sci. 1963, 10, 131–142. [Google Scholar] [CrossRef]
- Cheah, J.Y.; Smith, J.M. Generalized M/G/C/C state dependent queueing models and pedestrian traffic flows. Queueing Syst. 1994, 15, 365–386. [Google Scholar] [CrossRef]
- Balsamo, S.; Donatiello, L. On the Cycle Time Distribution in a Two-Stage Cyclic Network with Blocking. IEEE Trans. Softw. Eng. 1989, 15, 1206–1216. [Google Scholar] [CrossRef]
- Cochran, J.K.; Bharti, A. Stochastic bed balancing of an obstetrics hospital. Heal. Care Manag. Sci. 2006, 9, 31–45. [Google Scholar] [CrossRef]
- Koizumi, N.; Kuno, E.; Smith, T.E. Modeling Patient Flows Using a Queuing Network with Blocking. Heal. Care Manag. Sci. 2005, 8, 49–60. [Google Scholar] [CrossRef]
- Korporaal, R., et al., An analytic model for capacity planning of prisons in the Netherlands. Journal of the Operational Research Society, 2000. 51(11): p. 1228-1237.
- Papadopoulos, H.; Heavey, C. Queueing theory in manufacturing systems analysis and design: A classification of models for production and transfer lines. Eur. J. Oper. Res. 1996, 92, 1–27. [Google Scholar] [CrossRef]
- Odegaard, F.; Chen, L.; Quee, R.; Puterman, M.L. Improving the Efficiency of Hospital Porter Services, Part 1: Study Objectives and Results. J. Heal. Qual. 2007, 29, 4–11. [Google Scholar] [CrossRef] [PubMed]
- Dershin, H.; Schaik, M.S. Quality improvement for a hospital patient transportation system. J. Healthc. Manag. 1993, 38, 111–119. [Google Scholar]
- Parikh, V.N.; Ioannidis, A.G.; Jimenez-Morales, D.; Gorzynski, J.E.; De Jong, H.N.; Liu, X.; Roque, J.; Cepeda-Espinoza, V.P.; Osoegawa, K.; Hughes, C.; et al. Deconvoluting complex correlates of COVID-19 severity with a multi-omic pandemic tracking strategy. Nat. Commun. 2022, 13, 5107. [Google Scholar] [CrossRef]
- Klok, F.A.; Kruip, M.J.H.A.; van der Meer, N.J.M.; Arbous, M.S.; Gommers, D.A.M.P.J.; Kant, K.M.; Kaptein, F.H.J.; van Paassen, J.; Stals, M.A.M.; Huisman, M.V.; et al. Incidence of thrombotic complications in critically ill ICU patients with COVID-19. Thromb. Res. 2020, 191, 145–147. [Google Scholar] [CrossRef] [PubMed]
- Deshpande, C. Thromboembolic findings in COVID-19 autopsies: pulmonary thrombosis or embolism? Annals of internal medicine, 2020. 173(5): p. 394-395.
- Oudkerk, M.; Buller, H.R.; Kuijpers, D.; van Es, N.; Oudkerk, S.F.; McLoud, T.; Gommers, D.; van Dissel, J.; Cate, H.T.; van Beek, E.J.R. Diagnosis, Prevention, and Treatment of Thromboembolic Complications in COVID-19: Report of the National Institute for Public Health of the Netherlands. Radiology 2020, 297, E216–E222. [Google Scholar] [CrossRef] [PubMed]
- Kwee, T.C.; Kwee, R.M. Chest CT in COVID-19: What the Radiologist Needs to Know. RadioGraphics 2020, 40, 1848–1865. [Google Scholar] [CrossRef] [PubMed]
- Health, N.I.o., National Institutes of Health COVID-19 treatment guidelines. Therapeutic Management of Nonhospitalized Adults With COVID, 2021. 19.
- Helms, J., et al., High risk of thrombosis in patients with severe SARS-CoV-2 infection: a multicenter prospective cohort study. Intensive care medicine, 2020. 46(6): p. 1089-1098.
- Poyiadji, N.; Cormier, P.; Patel, P.Y.; Hadied, M.O.; Bhargava, P.; Khanna, K.; Nadig, J.; Keimig, T.; Spizarny, D.; Reeser, N.; et al. Acute Pulmonary Embolism and COVID-19. Radiology 2020, 297, E335–E338. [Google Scholar] [CrossRef] [PubMed]
- Bompard, F.; Monnier, H.; Saab, I.; Tordjman, M.; Abdoul, H.; Fournier, L.; Sanchez, O.; Lorut, C.; Chassagnon, G.; Revel, M.-P. Pulmonary embolism in patients with COVID-19 pneumonia. Eur. Respir. J. 2020, 56, 2001365. [Google Scholar] [CrossRef] [PubMed]
- Grillet, F.; Behr, J.; Calame, P.; Aubry, S.; Delabrousse, E. Acute Pulmonary Embolism Associated with COVID-19 Pneumonia Detected with Pulmonary CT Angiography. Radiology 2020, 296, E186–E188. [Google Scholar] [CrossRef]
- Kaminetzky, M.; Moore, W.; Fansiwala, K.; Babb, J.S.; Kaminetzky, D.; Horwitz, L.I.; McGuinness, G.; Knoll, A.; Ko, J.P. Pulmonary Embolism at CT Pulmonary Angiography in Patients with COVID-19. Radiol. Cardiothorac. Imaging 2020, 2, e200308. [Google Scholar] [CrossRef] [PubMed]
- Hani, C.; Trieu, N.H.; Saab, I.; Dangeard, S.; Bennani, S.; Chassagnon, G.; Revel, M.-P. COVID-19 pneumonia: A review of typical CT findings and differential diagnosis. Diagn. Interv. Imaging 2020, 101, 263–268. [Google Scholar] [CrossRef]
- Shufelt, C.; Dzubur, E.; Joung, S.; Fuller, G.; Mouapi, K.N.; Broek, I.V.D.; Lopez, M.; Dhawan, S.; Arnold, C.W.; Speier, W.; et al. A protocol integrating remote patient monitoring patient reported outcomes and cardiovascular biomarkers. npj Digit. Med. 2019, 2, 84. [Google Scholar] [CrossRef]
- Roncon, L.; Zuin, M.; Zonzin, P. Age-adjusted D-dimer cut-off levels to rule out venous thromboembolism in COVID-19 patients. Thromb. Res. 2020, 190, 102. [Google Scholar] [CrossRef]
- Lippi, G.; Favaloro, E.J. D-dimer is Associated with Severity of Coronavirus Disease 2019: A Pooled Analysis. Arthritis Res. Ther. 2020, 120, 876–878. [Google Scholar] [CrossRef] [PubMed]
- Tang, N.; Li, D.; Wang, X.; Sun, Z. Abnormal Coagulation parameters are associated with poor prognosis in patients with novel coronavirus pneumonia. J. Thromb. Haemost. 2020, 18, 844–847. [Google Scholar] [CrossRef] [PubMed]
- Duzgun, S.A.; Durhan, G.; Demirkazik, F.B.; Akpinar, M.G.; Ariyurek, O.M. COVID-19 pneumonia: the great radiological mimicker. Insights into Imaging 2020, 11, 1–15. [Google Scholar] [CrossRef] [PubMed]
- Huang, C., et al., Clinical features of patients infected with 2019 novel coronavirus in Wuhan, China. The lancet, 2020. 395(10223): p. 497-506.
- Huttner, B., et al., COVID-19: don’t neglect antimicrobial stewardship principles! Clinical Microbiology and Infection, 2020. 26(7): p. 808-810.
- Menter, T.; Haslbauer, J.D.; Nienhold, R.; Savic, S.; Hopfer, H.; Deigendesch, N.; Frank, S.; Turek, D.; Willi, N.; Pargger, H.; et al. Post-mortem examination of COVID19 patients reveals diffuse alveolar damage with severe capillary congestion and variegated findings of lungs and other organs suggesting vascular dysfunction. Histopathology 2020, 77, 198–209. [Google Scholar] [CrossRef] [PubMed]
- Tay, M.Z.; Poh, C.M.; Rénia, L.; MacAry, P.A.; Ng, L.F.P. The trinity of COVID-19: immunity, inflammation and intervention. Nat. Rev. Immunol. 2020, 20, 363–374. [Google Scholar] [CrossRef] [PubMed]
- Tian, S., et al., Pathological Study of the 2019 Novel Coronavirus Disease (COVID-19) through Post-Mortem Core Biopsies (preprint). 2020.
- Wu, J.H.; Li, X.; Huang, B.; Su, H.; Li, Y.; Luo, D.J.; Chen, S.; Ma, L.; Wang, S.H.; Nie, X.; et al. [Pathological changes of fatal coronavirus disease 2019 (COVID-19) in the lungs: report of 10 cases by postmortem needle autopsy]. Zhonghua Bing Li Xue Za Zhi 2020, 49, 568–575. [Google Scholar] [PubMed]
- Simpson, S., et al., Radiological Society of North America expert consensus statement on reporting chest CT findings related to COVID-19. Endorsed by the Society of Thoracic Radiology, the American College of Radiology, and RSNA. Journal of thoracic imaging, 2020.
- Marshall, A.; Vasilakis, C.; El-Darzi, E. Length of Stay-Based Patient Flow Models: Recent Developments and Future Directions. Heal. Care Manag. Sci. 2005, 8, 213–220. [Google Scholar] [CrossRef] [PubMed]
- Godfrey, K., Compartmental models and their application. 1983: Academic Press.
- El-Darzi, E.; Vasilakis, C.; Chaussalet, T.; Millard, P. A simulation modelling approach to evaluating length of stay, occupancy, emptiness and bed blocking in a hospital geriatric department. Heal. Care Manag. Sci. 1998, 1, 143–149. [Google Scholar] [CrossRef] [PubMed]
- Vasilakis, C.; El-Darzi, E. A simulation study of the winter bed crisis. Heal. Care Manag. Sci. 2001, 4, 31–36. [Google Scholar] [CrossRef]
- Vasilakis, C., Simulating the flow of patients: an OLAP-enabled decision support framework. 2003, University of Westminster.
- Vasilakis, C., E. El-Darzi, and P. Chountas. Data cube modelling and OLAP algebra for hospital length of stay analysis. in Craiova Medicala Journal: Proceedings of The 1st MEDINF International Conference on Medical Informatics & Engineering. 2003.
- Vasilakis, C.; El-Darzi, E.; Chountas, P. An OLAP-Enabled Software Environment for Modeling Patient Flow. 2006 3rd International IEEE Conference Intelligent Systems. pp. 261–266.
- Health, O., Ageing societies and the looming pension crisis. 2004.
- EllisG, W., Comprehensivegeriatric assessmentforolderadultsadmittedtohospital: metaranalysisof randomisedcontrolledtrials. BMJ, 2011. 343: p. d6553.
- Lohr, K., for the Committee to Design a Strategy for Quality Review and Assurance in Medicare, the Division of Health Care Services, and the Institute of Medicine. Medicare: A Strategy for Quality Assurance. 1990, Washington, DC: National Academy Press.
- Spiegelhalter, D.J. Bayesian Graphical Modelling: A Case-Study in Monitoring Health Outcomes. J. R. Stat. Soc. Ser. C (Applied Stat. 1998, 47, 115–133. [Google Scholar] [CrossRef]
- Donabedian, A. Evaluating the quality of medical care. Milbank Meml. Fund Q. 1966, 44, 166–206. [Google Scholar] [CrossRef]
- DesHarnais, S.; McMahon, L.F.; Wroblewski, R. Measuring outcomes of hospital care using multiple risk-adjusted indexes. 1991, 26, 425–445. [Google Scholar] [PubMed]
- Kroch, E.A., et al., Hospital performance improvement: Trends in quality and efficiency. A quantitative analysis of performance improvement in US hospitals, 2007(1008).
- Librero, J.; Peiró, S.; Ordiñana, R. Chronic Comorbidity and Outcomes of Hospital Care: Length of Stay, Mortality, and Readmission at 30 and 365 Days. J. Clin. Epidemiology 1999, 52, 171–179. [Google Scholar] [CrossRef]
- Marshall, A.H.; McClean, S.I. Conditional phase-type distributions for modelling patient length of stay in hospital. Int. Trans. Oper. Res. 2003, 10, 565–576. [Google Scholar] [CrossRef]
- Millard, P. Throughput in a department of geriatric medicine: a problem of time, space, and behaviour. . 1992, 24, 20–24. [Google Scholar]
- Neuts, M.F. Computational uses of the method of phases in the theory of queues. Comput. Math. Appl. 1975, 1, 151–166. [Google Scholar] [CrossRef]
- Heyde, C.C.; Neuts, M.F. Matrix-Geometric Solutions in Stochastic Models. An Algorithmic Approach; Johns Hopkins University Press: Baltimore, MD, USA, 1981. [Google Scholar]
- Zenga, M.; Marshall, A.H.; Crippa, F.; Mitchell, H. The coxian phase-type distribution as a contribution to the multilevel model of in-hospital mortality. Commun. Stat. - Theory Methods 2015, 45, 1819–1830. [Google Scholar] [CrossRef]
- Faddy, M.J. Examples of fitting structured phase–type distributions. Appl. Stoch. Model. Data Anal. 1994, 10, 247–255. [Google Scholar] [CrossRef]
- Marshall, A.H.; McClean, S.I. Using Coxian Phase-Type Distributions to Identify Patient Characteristics for Duration of Stay in Hospital. Heal. Care Manag. Sci. 2004, 7, 285–289. [Google Scholar] [CrossRef]
- Faddy, M.J.; McClean, S.I. Markov Chain Modelling for Geriatric Patient Care. Methods Inf. Med. 2005, 44, 369–373. [Google Scholar] [CrossRef]
- Faddy, M. and S. McClean, Analysing data on lengths of stay of hospital patients using phase-type distributions. Applied Stochastic Models in Business and Industry, 1999. 15(4): p. 311-317.
- Marshall, A.H.; Shaw, B.; McClean, S.I. Estimating the costs for a group of geriatric patients using the Coxian phase-type distribution. Stat. Med. 2006, 26, 2716–2729. [Google Scholar] [CrossRef] [PubMed]
- Berta, P.; Seghieri, C.; Vittadini, G. Comparing health outcomes among hospitals: the experience of the Lombardy Region. Heal. Care Manag. Sci. 2013, 16, 245–257. [Google Scholar] [CrossRef] [PubMed]
- Goldstein, H. Multilevel Statistical Models; Wiley Series in Probability and Statistics; John Wiley & Sons Ltd.: Chichester, UK, 2010. [Google Scholar] [CrossRef]
- Hox, J.J., Applied multilevel analysis. 1995: TT-publikaties.
- Rice, N.; Leyland, A. Multilevel Models: Applications to Health Data. J. Heal. Serv. Res. Policy 1996, 1, 154–164. [Google Scholar] [CrossRef]
- Mahmoodpor, A., et al., 1-year survival rate of SARS-CoV-2 infected patients with acute respiratory distress syndrome based on ventilator types: a multi-center study. Scientific Reports, 2023. 13(1): p. 12644.
- Jones, K.; Subramanian, V. Subramanian, Developing multilevel models for analysing contextuality, heterogeneity and change using MLwiN 3 volume. 2019, Centre for Multilevel Modelling, University of Bristol.
- Heydari, M.; Lai, K.K. Post-COVID-19 Pandemic Era and Sustainable Healthcare: Organization and Delivery of Health Economics Research (Principles and Clinical Practice). Mathematics 2023, 11, 3520. [Google Scholar] [CrossRef]
- Faddy, M.; Graves, N.; Pettitt, A. Modeling Length of Stay in Hospital and Other Right Skewed Data: Comparison of Phase-Type, Gamma and Log-Normal Distributions. Value Heal. 2009, 12, 309–314. [Google Scholar] [CrossRef] [PubMed]
- McGrory, C.; Pettitt, A.; Faddy, M. A fully Bayesian approach to inference for Coxian phase-type distributions with covariate dependent mean. Comput. Stat. Data Anal. 2009, 53, 4311–4321. [Google Scholar] [CrossRef]
- Weiss, E.N.; McClain, J.O. Administrative Days in Acute Care Facilities: A Queueing-Analytic Approach. Oper. Res. 1987, 35, 35–44. [Google Scholar] [CrossRef] [PubMed]
- Hershey, J.C.; Weiss, E.N.; Cohen, M.A. A Stochastic Service Network Model with Application to Hospital Facilities. Oper. Res. 1981, 29, 1–22. [Google Scholar] [CrossRef] [PubMed]
- Altiok, T.; Perros, H.G. Approximate analysis of arbitrary configurations of open queueing networks with blocking. Ann. Oper. Res. 1987, 9, 481–509. [Google Scholar] [CrossRef]
- Takahashi, Y.; Miyahara, H.; Hasegawa, T. An Approximation Method for Open Restricted Queueing Networks. Oper. Res. 1980, 28, 594–602. [Google Scholar] [CrossRef]
- Bell, P.C. The use of decomposition techniques for the analysis of open restricted queuing networks. Oper. Res. Lett. 1982, 1, 230–235. [Google Scholar] [CrossRef]
- Singh, A.; Smitth, J. Buffer allocation for an integer nonlinear network design problem. Comput. Oper. Res. 1997, 24, 453–472. [Google Scholar] [CrossRef]
- Boxma, O.J.; Konheim, A.G. Approximate analysis of exponential queueing systems with blocking. Acta Inform. 1980, 15, 19–66. [Google Scholar] [CrossRef]
- Hillier, F.S.; Boling, R.W. Finite Queues in Series with Exponential or Erlang Service Times—A Numerical Approach. Oper. Res. 1967, 15, 286–303. [Google Scholar] [CrossRef]
- Kerbache, L.; Smith, J.M. Asymptotic behavior of the expansion method for open finite queueing networks. Comput. Oper. Res. 1988, 15, 157–169. [Google Scholar] [CrossRef]
- Mackay, M. Practical experience with bed occupancy management and planning systems: an Australian view. Heal. Care Manag. Sci. 2001, 4, 47–56. [Google Scholar] [CrossRef]
Figure 1.
CT results for COVID-19-related lung inflammation. a On the fourth day of illness, the initial CT scan showed scattered ground-glass opacities in both lungs. b By day 8, the GGOs had become more numerous and larger. c On day 14, the primary CT observation was the presence of consolidations. Sorce.
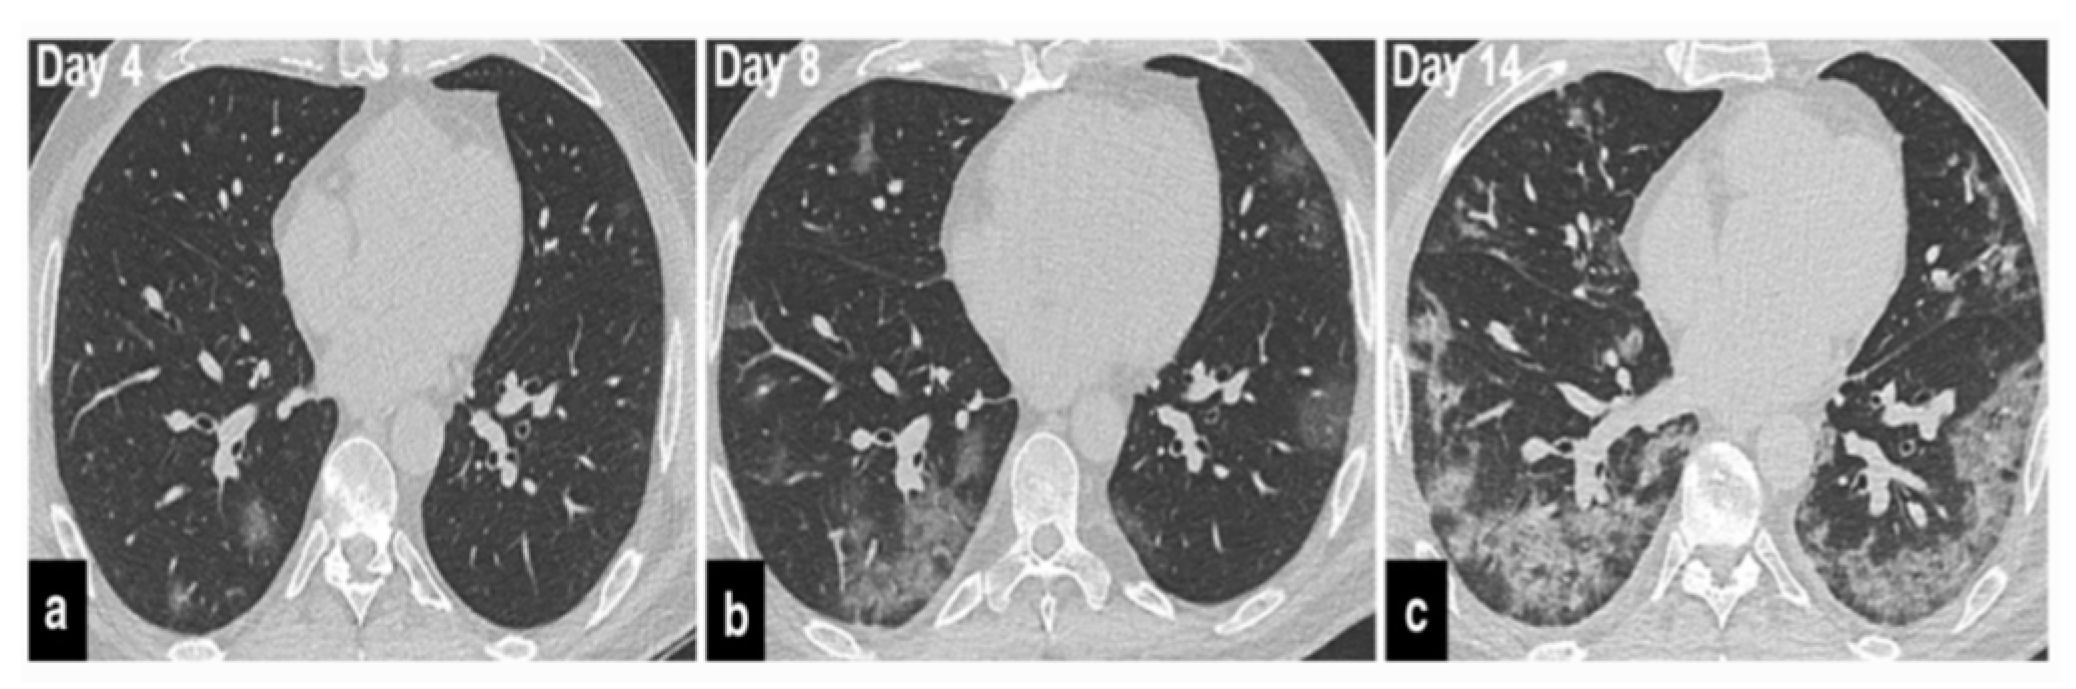
Figure 2.
Other infectious diseases that SARS-CoV-2 pneumonia can resemble: a) An axial CT scan displays a rounded consolidation in the right lower lobe, with Hemophilus influenza detected in the respiratory panel. b) A similar round consolidation is observed in the right upper lobe, but the patient tested positive for SARS-CoV-2 pneumonia via RT-PCR, with no other causes found in the respiratory panel. c) An axial CT image shows ground-glass opacities (GGOs) alongside consolidations in a patient with Hemophilus influenza pneumonia. d) In a patient diagnosed with SARS-CoV-2 pneumonia, axial CT images reveal bilateral GGOs with consolidations, resembling the presentation in (c). e) An axial CT image shows GGOs in the bilateral upper lobes in an immunosuppressed patient, suggestive of PJP infection. f) In a patient with SARS-CoV-2 pneumonia, bilateral upper lobe GGOs are observed. GGOs present on emphysematous tissue can make it challenging to differentiate from PJP, but the presence of subpleural sparing favors PJP. g) An axial CT image displays bilateral consolidative opacities in the lower lobes in a patient diagnosed with influenza A pneumonia. h) In a patient with SARS-CoV-2 pneumonia, bilateral opacities are seen in the lower lobes, resembling the presentation in (g). Sorce.
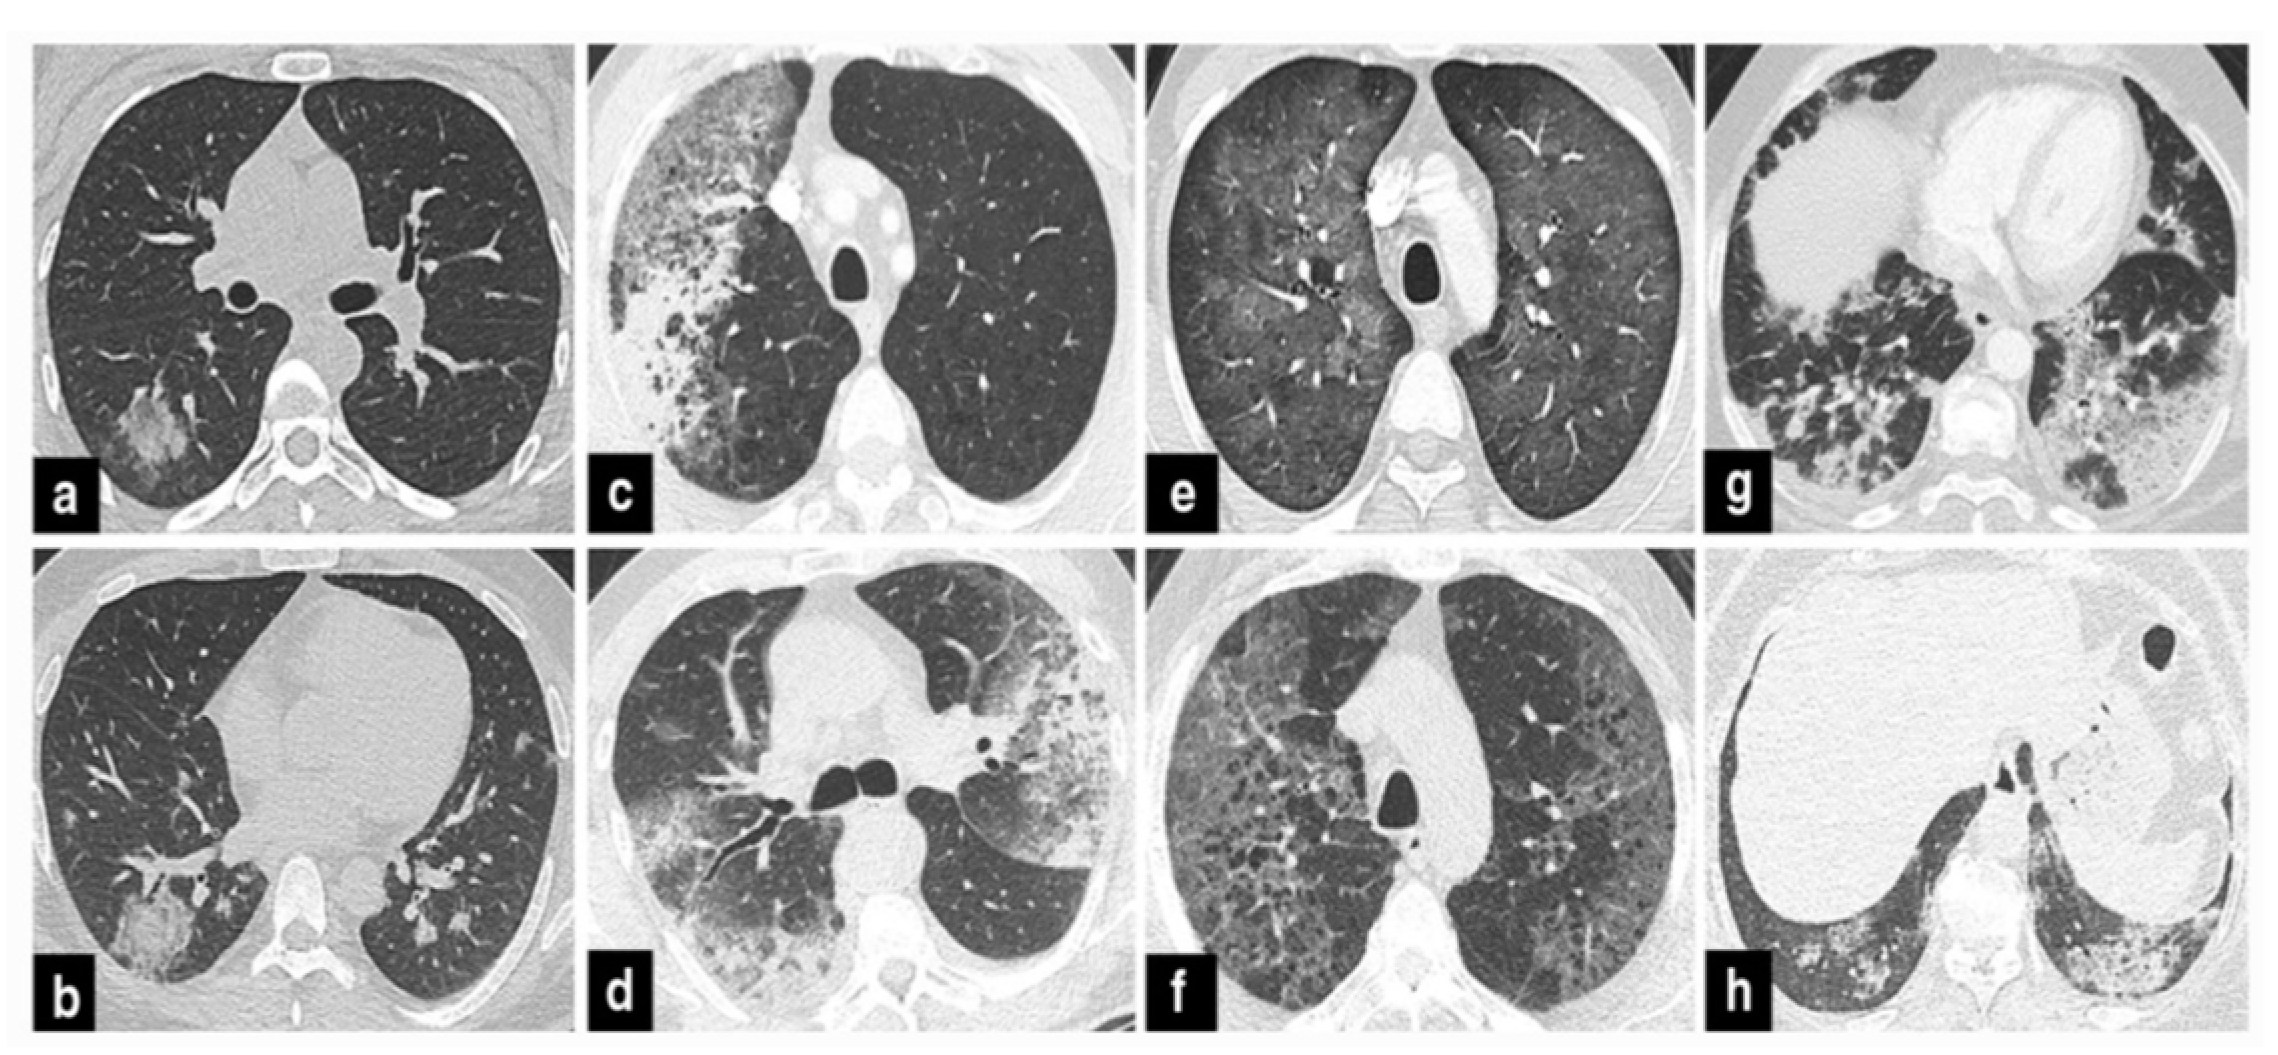
Figure 3.
The presence of the reverse halo sign in cases of sarcoidosis and SARS-CoV-2 pneumonia. a In sarcoidosis, there is an appearance resembling organizing pneumonia with peripheral ground-glass opacities and noticeable reverse halo signs (indicated by arrows). b In SARS-CoV-2 pneumonia, opacities with a reverse halo sign are observed in the right lower lobe (marked by an arrow). Additionally, multiple opacities distributed throughout the lungs can be seen. Sorce.
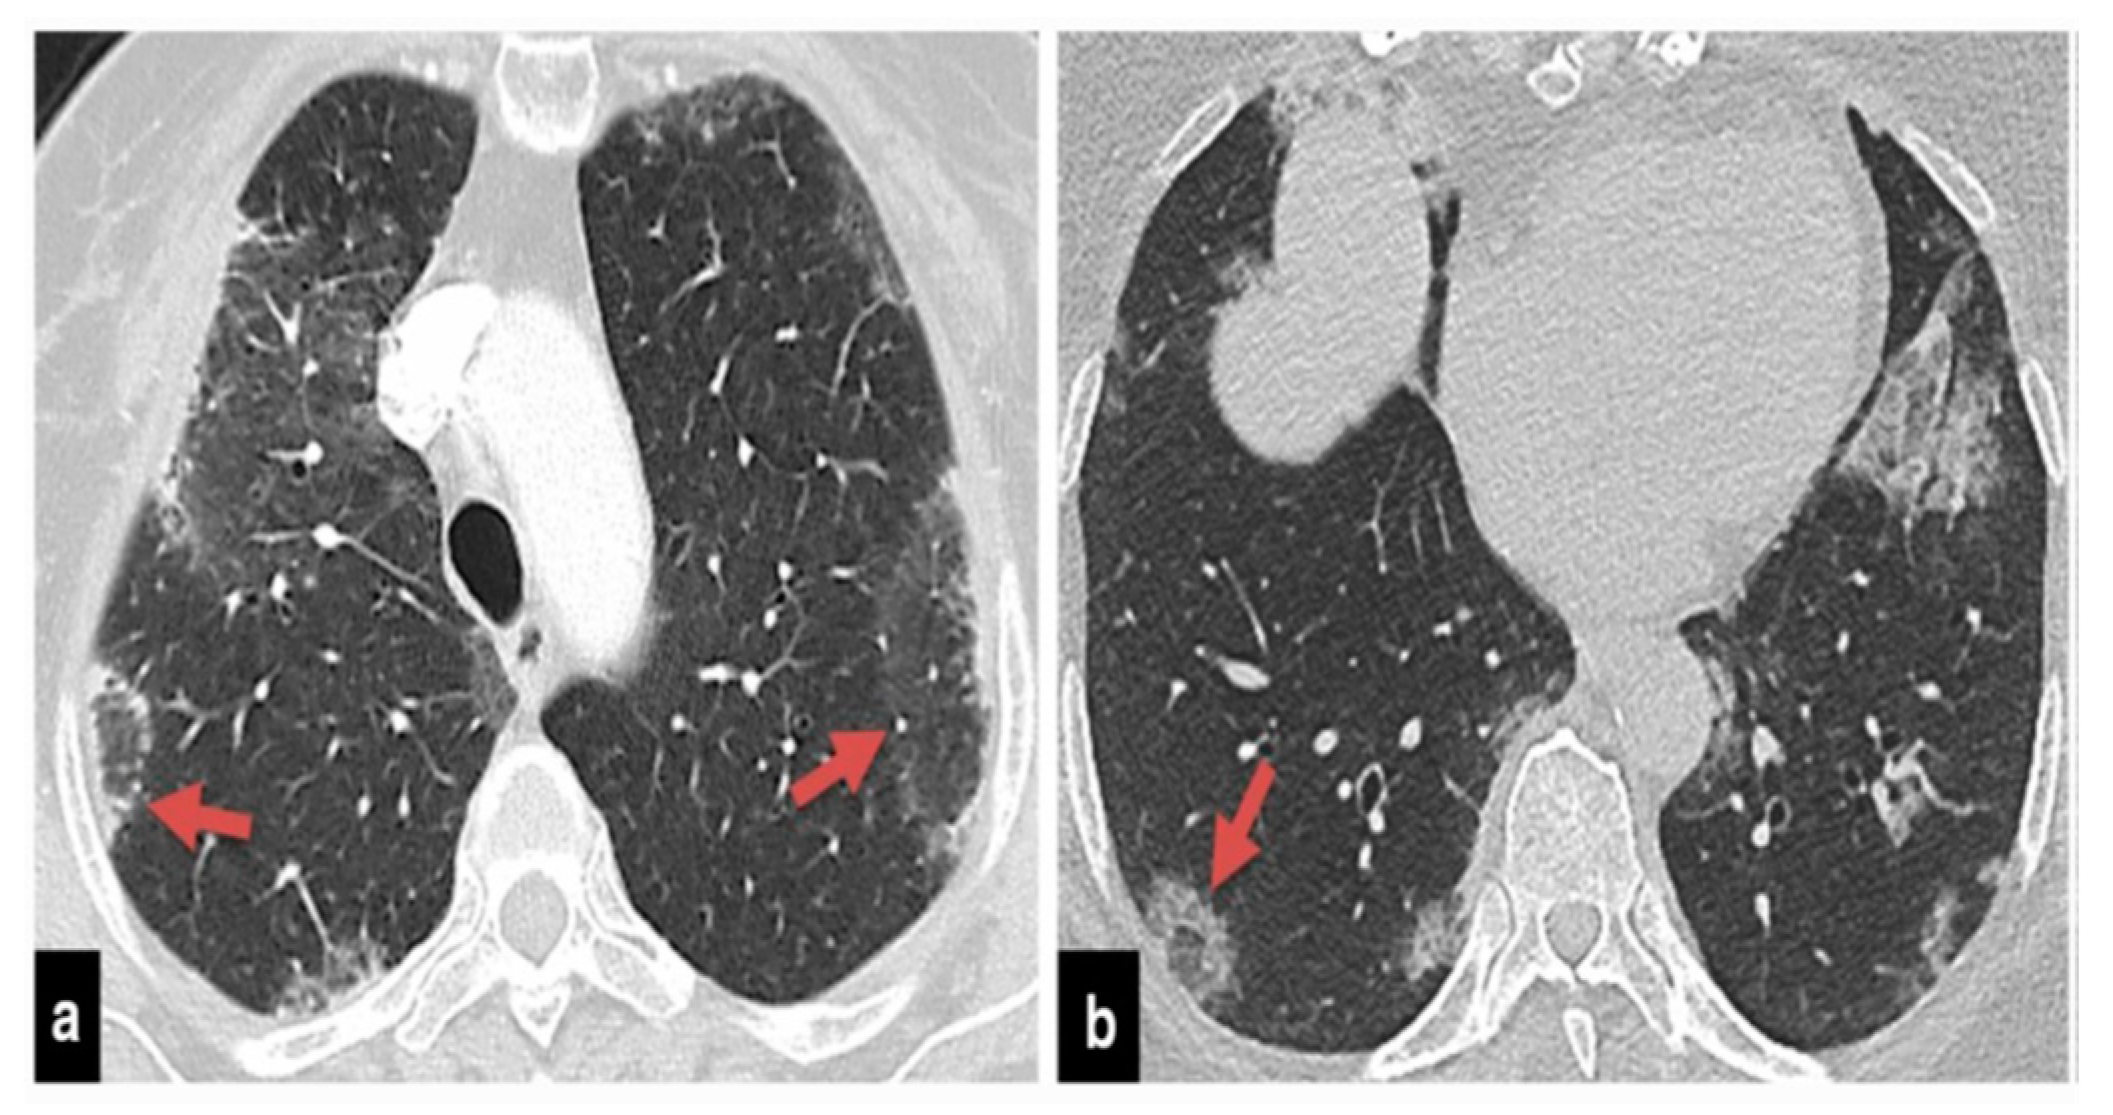
Figure 4.
The Relationship Between Pulmonary Infarction and SARS-CoV-2 Pneumonia: a) A mediastinal window axial CTA image displays the presence of blood clots in branches of the pulmonary artery (indicated by white arrows). b) In the same patient, a pulmonary infarction is evident as a wedge-shaped opacity situated beneath the lung’s outer surface in the right lung (marked by an arrow). c) A patient who sought care in the emergency department due to shortness of breath underwent pulmonary CT angiography. The scan revealed subpleural opacities, but no blood clot was found in the related pulmonary artery branch (pointed out by an arrow). Notably, the patient’s SARS-CoV-2 RT-PCR test came back positive. Sorce.
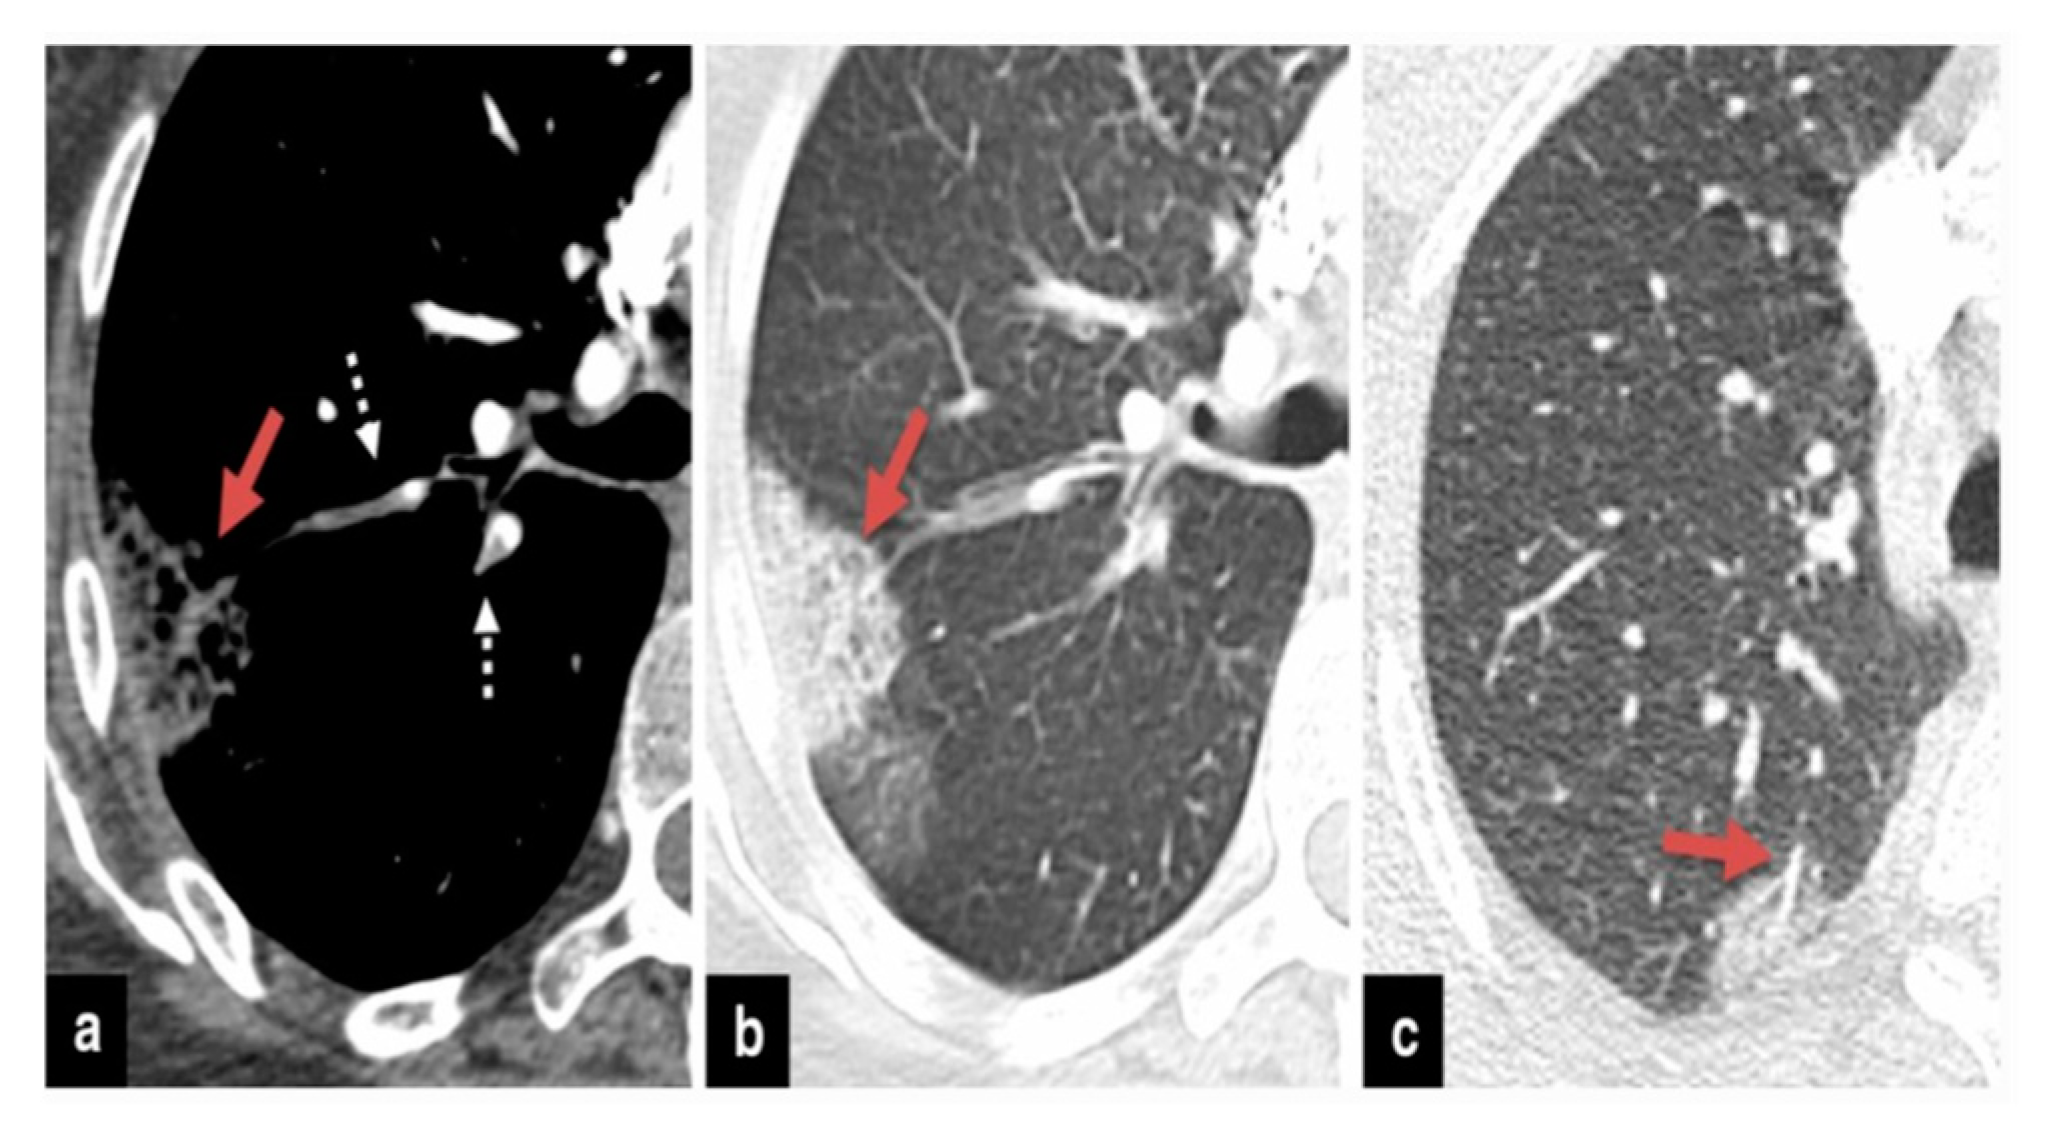
Figure 5.
Assessing the methodologies of [75,76] involves a comparison across two distinct capacity configurations.
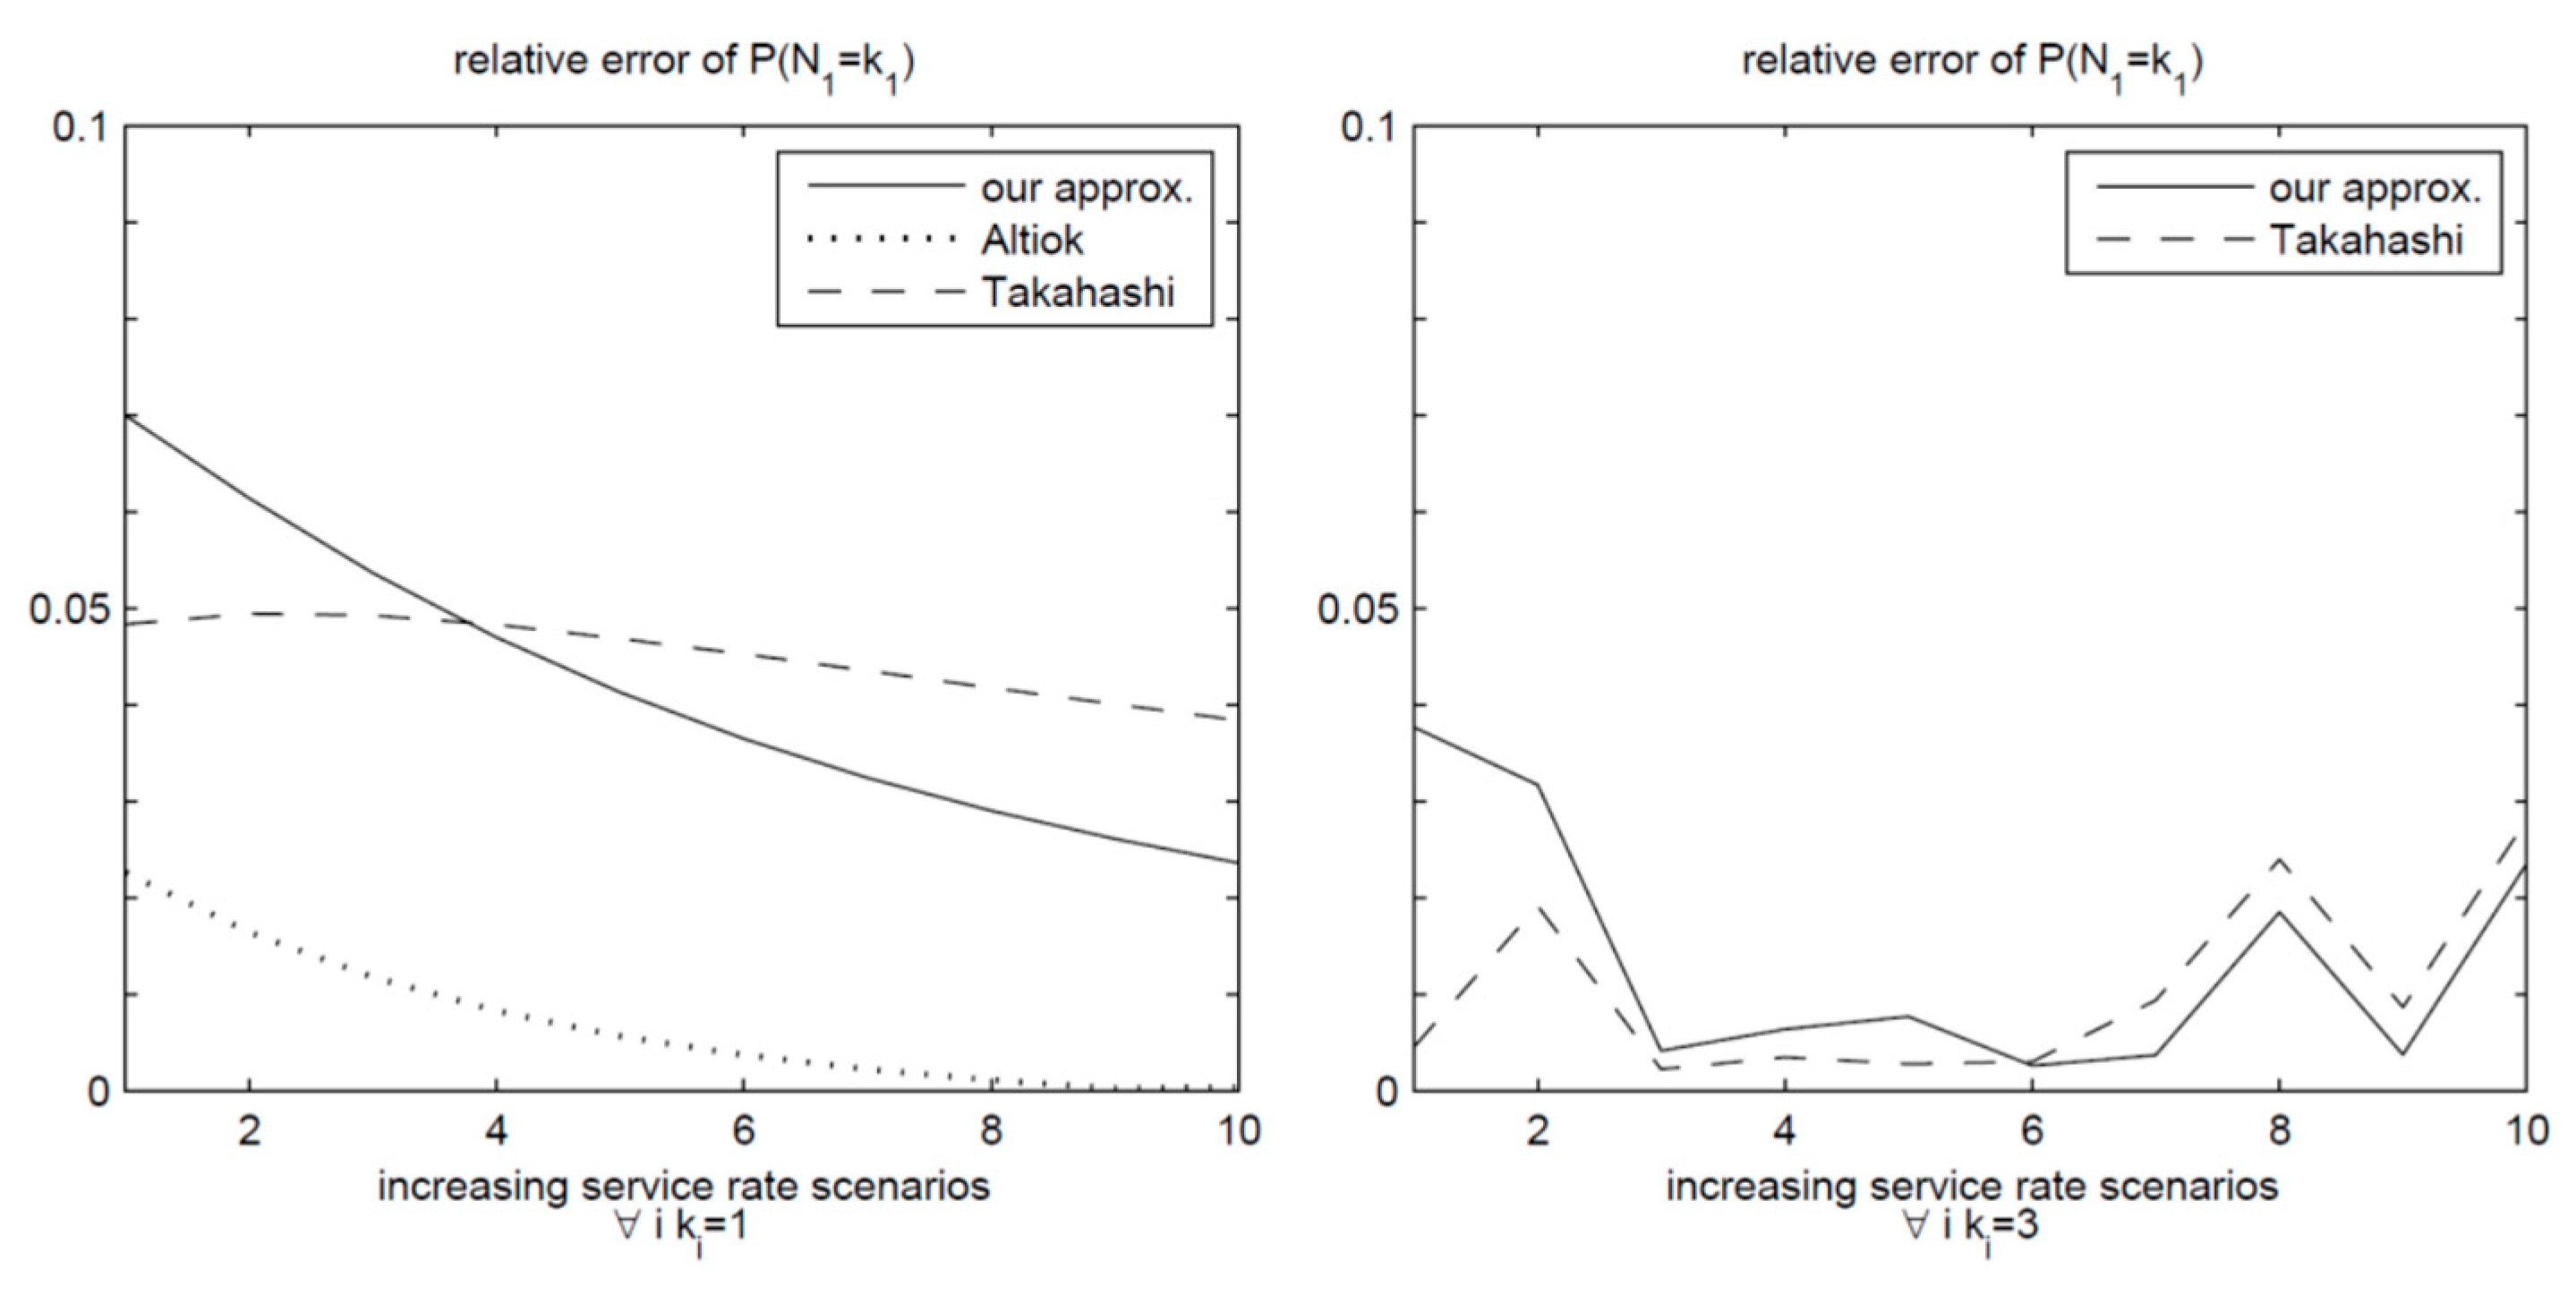
Figure 9.
A network structure map illustrating the connections among keywords linked to the three specified terms within the realm of healthcare research.
Figure 9.
A network structure map illustrating the connections among keywords linked to the three specified terms within the realm of healthcare research.
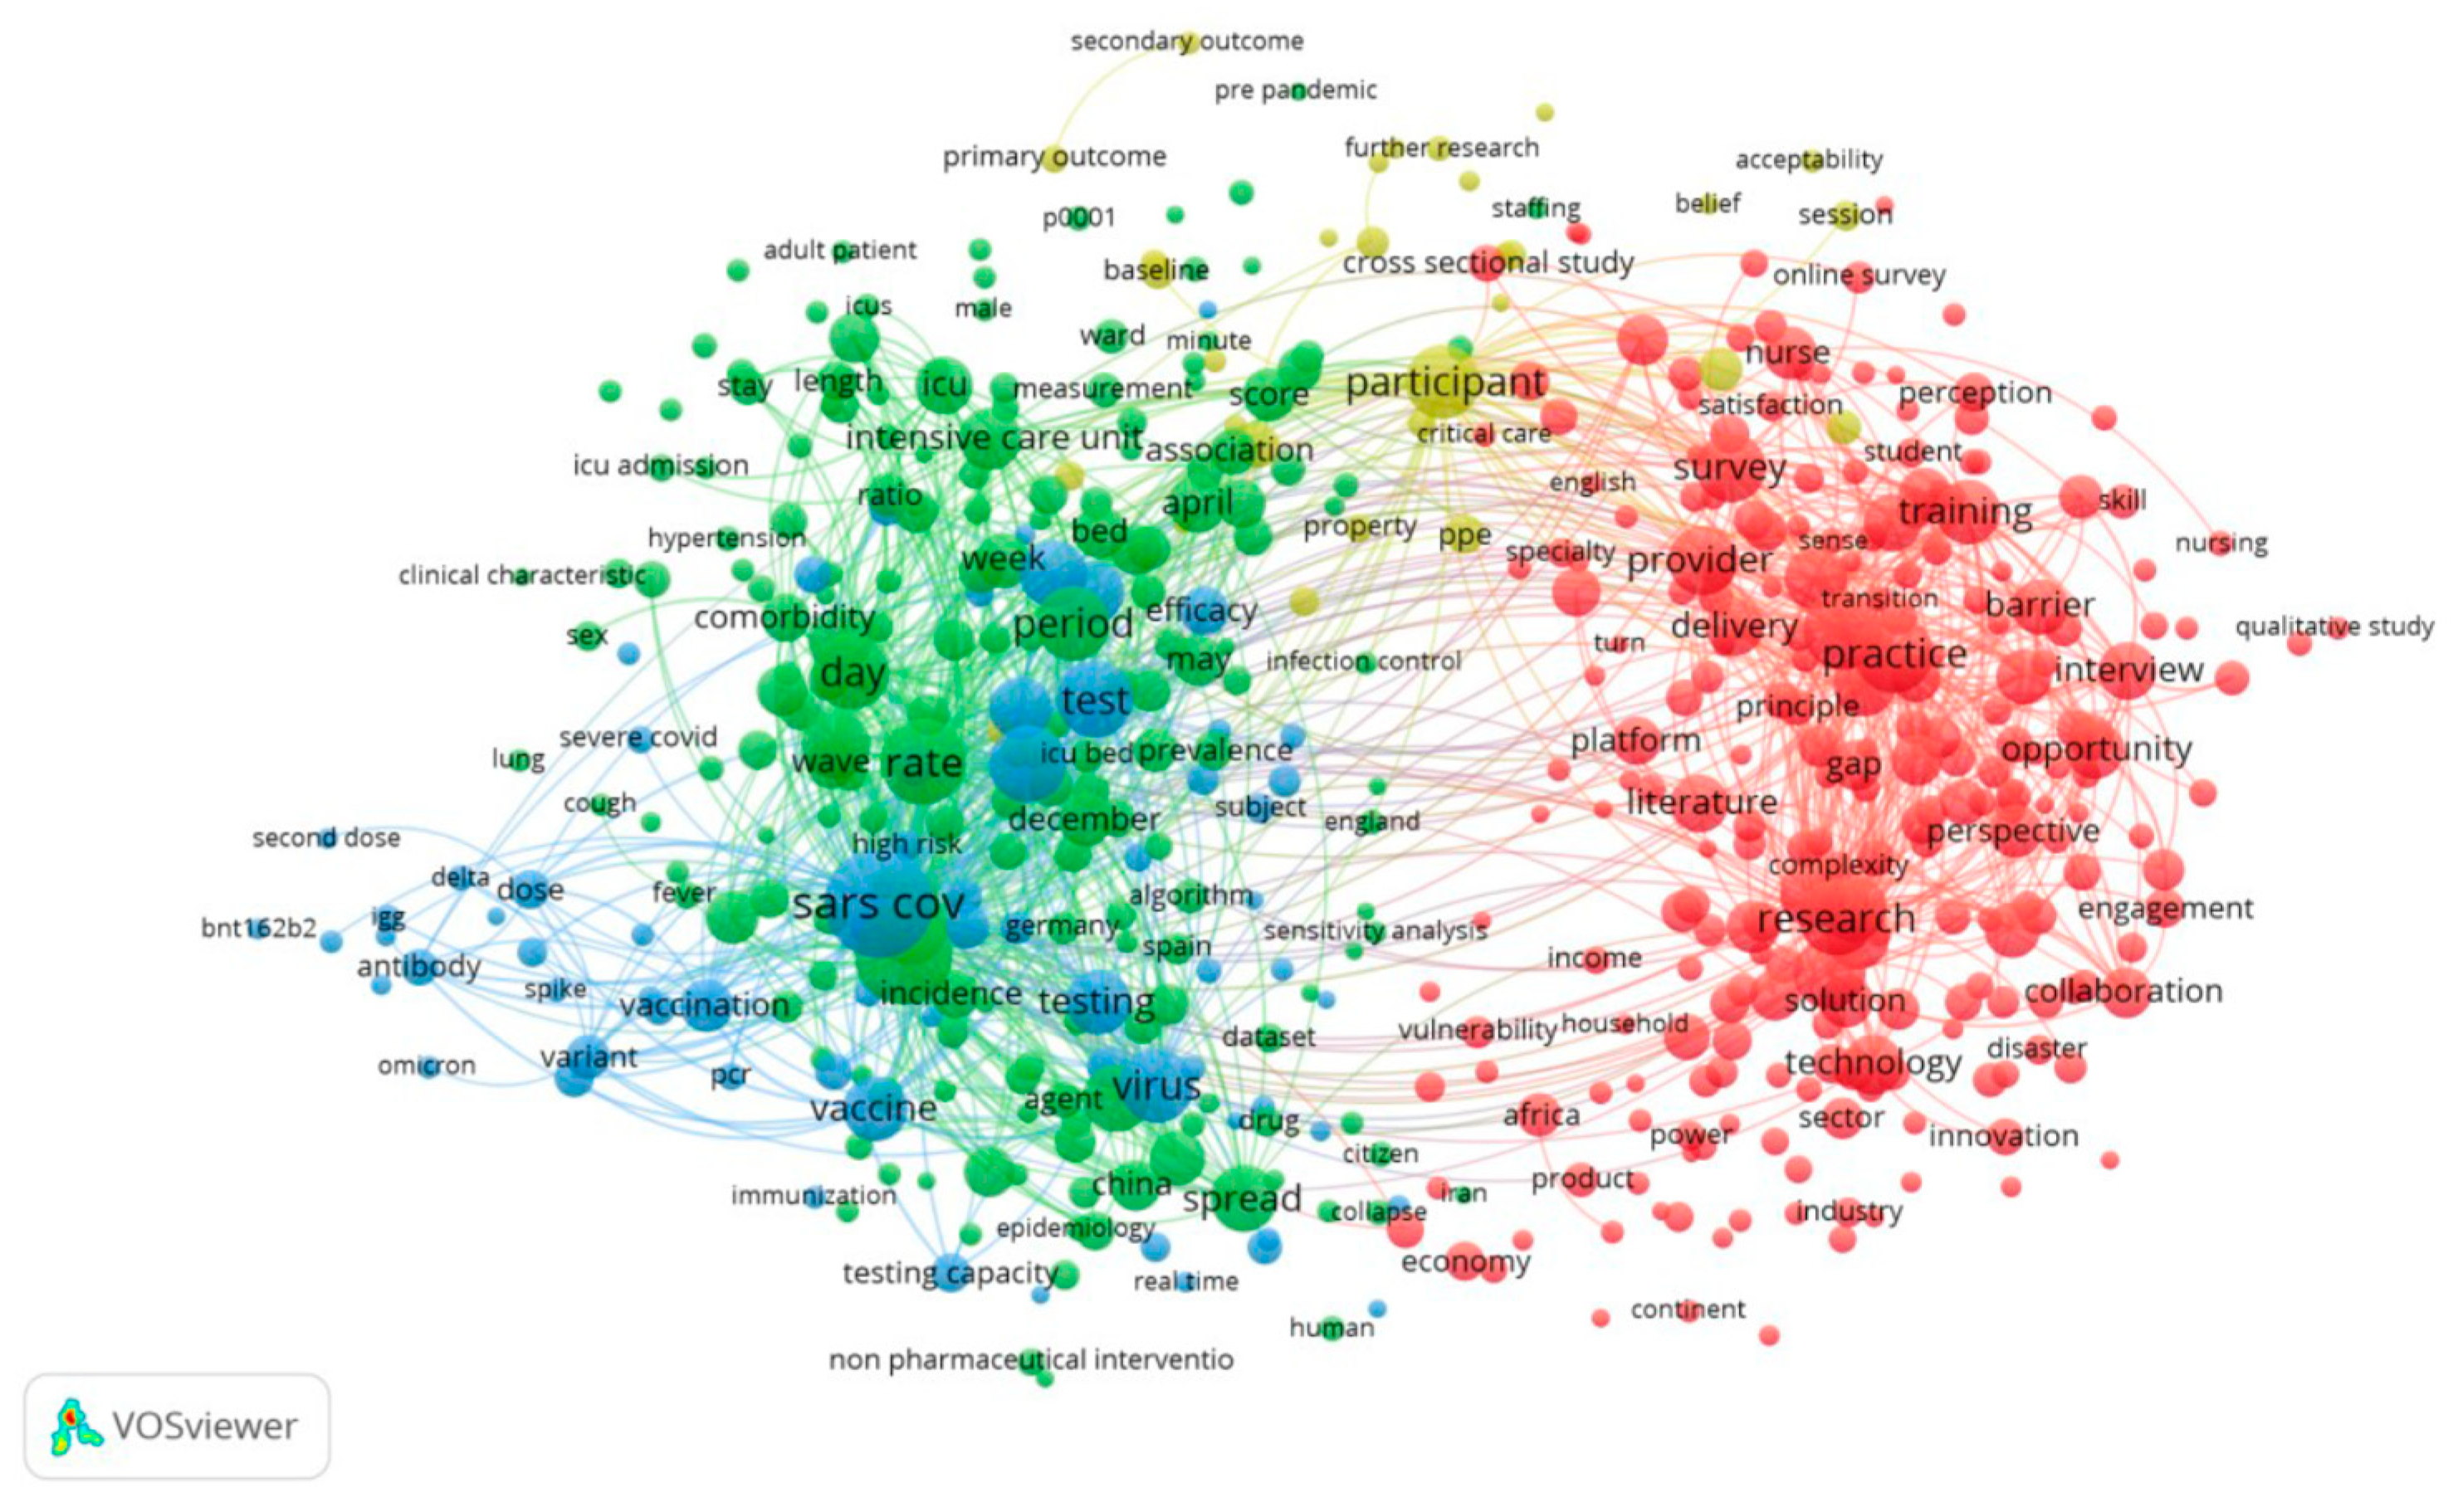

Table 1.
Scenarios involving an increase in the service rate.
| Scenarios | 1 | 2 | 3 | 4 | 5 | 6 | 7 | 8 | 9 | 10 |
|---|---|---|---|---|---|---|---|---|---|---|
| 1 | 1 | 1 | 1 | 1 | 1 | 1 | 1 | 1 | 1 | |
| 1.1 | 1.2 | 1.3 | 1.4 | 1.5 | 1.6 | 1.7 | 1.8 | 1.9 | 2 | |
| 1.2 | 1.4 | 1.6 | 1.8 | 2 | 2.2 | 2.4 | 2.6 | 2.8 | 3 |
Table 2.
Scenarios involving an increase in buffer size.
| Scenarios | 1 | 2 | 3 | 4 | 5 | 6 | 7 | 8 | 9 |
|---|---|---|---|---|---|---|---|---|---|
| 1 | 1 | 2 | 2 | 2 | 3 | 4 | 5 | 10 | |
| 1 | 2 | 1 | 2 | 3 | 3 | 4 | 5 | 10 |
Table 3.
Service rate scenarios.
| Scenarios | 1 | 2 | 3 | 4 |
|---|---|---|---|---|
| 1 | 1.2 | 1 | 1 | |
| 1 | 1 | 1.2 | 1 | |
| 1 | 1 | 1 | 1.2 |
Table 4.
External arrival rate scenarios characterized by a progressive escalation in gridlock levels.
Table 4.
External arrival rate scenarios characterized by a progressive escalation in gridlock levels.
| Scenarios | 1 | 2 | 3 | 4 |
|---|---|---|---|---|
| 0.5 | 1 | 1.5 | 2 |
Table 5.
Transition matrix.
| 1 | 2 | 3 | 4 | 5 | 6 | 7 | 8 | 9 | |
| 1 | - | - | - | 0.16 | 0.02 | - | - | 0.71 | - |
| 2 | - | - | - | 0.07 | - | - | - | 0.84 | - |
| 3 | - | - | - | 0.03 | 0.01 | - | - | - | 0.95 |
| 4 | 0.18 | 0.01 | 0.03 | - | 0.03 | 0.01 | 0.11 | 0.03 | - |
| 5 | 0.05 | 0.01 | 0.01 | 0.01 | - | 0.07 | - | - | - |
| 6 | 0.02 | - | - | 0.01 | 0.1 | - | - | - | - |
| 7 | 0.05 | - | 0.05 | 0.04 | - | - | - | 0.01 | - |
| 8 | - | - | - | - | - | - | 0.01 | - | - |
| 9 | - | - | - | 0.05 | - | - | 0.05 | 0.02 | - |
Table 6.
Probabilities of a Blocked Patient.
| 1 | 2 | 3 | 4 | 5 | 6 | 7 | 8 | 9 | ||
| EMOT | 1 | - | - | - | 0.76 | 0.04 | - | - | 0.19 | - |
| ELOT | 2 | - | - | - | 0.59 | - | - | - | 0.41 | - |
| ENT OT | 3 | - | - | - | 0.87 | 0.13 | - | - | - | 0.01 |
| Surgical ICU/CCU | 4 | 0.12 | - | - | - | 0.02 | 0.04 | 0.82 | - | - |
| Medical ICU/CCU | 5 | 0.11 | - | - | 0.05 | - | 0.83 | - | - | - |
| Medical IMCU | 6 | 0.13 | - | - | 0.16 | 0.71 | - | - | - | - |
| Neuro-Surgical IMCU | 7 | 0.34 | - | 0.01 | 0.65 | - | - | - | 0.01 | - |
| Elective REC | 8 | - | - | - | - | - | - | 1 | - | - |
| ENT REC | 9 | - | - | - | 0.18 | - | - | 0.82 | - | - |
Disclaimer/Publisher’s Note: The statements, opinions and data contained in all publications are solely those of the individual author(s) and contributor(s) and not of MDPI and/or the editor(s). MDPI and/or the editor(s) disclaim responsibility for any injury to people or property resulting from any ideas, methods, instructions or products referred to in the content. |
© 2024 by the authors. Licensee MDPI, Basel, Switzerland. This article is an open access article distributed under the terms and conditions of the Creative Commons Attribution (CC BY) license (http://creativecommons.org/licenses/by/4.0/).
Copyright: This open access article is published under a Creative Commons CC BY 4.0 license, which permit the free download, distribution, and reuse, provided that the author and preprint are cited in any reuse.


