Submitted:
19 May 2024
Posted:
20 May 2024
You are already at the latest version
Abstract
This study challenges the prevailing belief in the necessity of complex models for accurate forecasting by demonstrating the effectiveness of parsimonious econometric models, namely ARCH(1) and GARCH(1,1), over deep learning robust approaches, such as LSTM and 1D-CNN neural networks, in modeling historical volatility within pre-emerging stock markets, specifically the Moroccan and Bahraini stock markets. The findings suggest reevaluating the balance between model complexity and predictive accuracy. Future research directions include investigating the potential existence of threshold effects in market capitalization for optimal model performance. This research contributes to a deeper understanding of volatility dynamics and enhances forecasting models’ effectiveness in diverse market conditions.
Keywords:
Historical Volatility
; Pre-emerging Markets
; ARCH-GARCH Models
; Deep Learning Approaches
; LSTM Network
; 1D-CNN Network
1. Introduction
In the field of financial markets, accurate forecasting of market data is crucial for market participants to make well-informed decisions and avoid potential losses. This observation becomes even more pronounced when considering market volatility. Market volatility refers to the degree of variation in trading prices over time (Narula 2022). Therefore, historical volatility serves as a gauge of the magnitude of past movements in a financial market and provides valuable insights into the market’s behavior over time. Understanding market volatility, allows investors to predict patterns and future market movements and potentially earn profits (Burtniak and Suduk 2022; Li 2021).
Accurately modeling and forecasting market volatility is therefore essential for investors, policymakers and market participants to implement effective strategies to manage risk and optimize their investment portfolios. While traditional econometric models have historically been the go-to tools for volatility analysis and forecasting (Bhowmik and Wang 2020), the emergence of advanced machine learning and deep learning techniques has sparked a growing interest in evaluating their effectiveness within this domain (Thakkar and Chaudhari 2021).
In our effort to contribute to the understanding of the implications of deep learning models in volatility modeling and forecasting, and to juxtapose them with the predictive capabilities of econometric models, our paper delves into the examination of historical volatility in the Moroccan and Bahraini stock markets. Through a comparative analysis of these methodologies, we seek to offer valuable insights into their respective efficacy in capturing the intricate dynamics of market volatility within these emerging economies. The inclusion of both markets facilitates a comparative assessment, considering potential differences in market structures, regulatory landscapes, and investor behaviors.
As far as we are aware, this study represents the first attempt to model and forecast historical volatility within the context of pre-emerging markets in the MENA region, leveraging both econometric and connectionist approaches.
In this paper, we first provide a comprehensive review of the literature on volatility modeling, drawing attention to the key econometric models and machine learning techniques commonly employed in financial forecasting. We then present an overview of the two markets, highlighting their unique characteristics, regulatory frameworks, and microstructure.
Subsequently, we detail our methodology, elucidating the data sources, model specifications, and evaluation criteria employed for performance assessment. Through empirical analysis, we examine historical volatility patterns in the Moroccan and Bahraini stock markets, evaluating the forecasting precision of ARCH and GARCH models, as well as LSTM and CNN architectures. By conducting a comprehensive comparative analysis, we aim to identify the strengths and limitations of each approach, offering actionable insights for market practitioners and policymakers.
The findings of this study contribute to the existing literature on volatility forecasting by offering empirical evidence on the performance of econometric and deep learning models in the context of pre-emerging markets. Furthermore, our research has implications for portfolio management, risk assessment, and financial decision-making in both academic and practical domains.
2. Literature Review
Studying the volatility of an asset or a financial market stands as one of the central pillars of modern financial research (Bhowmik and Wang 2020). This emphasis has only intensified since the market crash of 1987, which underscored the critical importance of understanding and effectively managing market volatility (Schwert 1990). As investors and policymakers grappled with the aftermath of this significant event, there was a heightened awareness of the profound impact that fluctuations in asset prices can have on financial stability, economic growth, and investor confidence. Consequently, researchers have increasingly focused on developing sophisticated models and analytical tools to better comprehend and predict market volatility, aiming to provide insights that can inform more robust risk management strategies and investment decisions.
Since the publication of the seminal paper of Engle (1982), introducing a new class of stochastic processes called autoregressive conditional heteroscedastic (ARCH) processes to estimate the variance of United Kingdom inflation, various studies have explored the effectiveness of different ARCH and GARCH family models in estimating volatility within stock markets. These models have demonstrated their efficacy in capturing the dynamics of assets volatility and also aggregate stock market volatility, due to their ability to capture the time-varying nature and clustering of volatility in financial time series data (Engle et al. 2013). Additionally, researchers have proposed distributed models to better characterize the thick tail of daily return rates. Engle (1982) initially introduced the autoregressive conditional heteroscedasticity model (ARCH model) to account for possible correlations in the conditional variance of prediction errors, later extended by Bollerslev (1986) into the generalized autoregressive conditional heteroskedastic model (GARCH model). Subsequently, the GARCH model evolved into a family of models, including both linear (symmetric) and nonlinear (asymmetric) variants (such as, EGARCH, TGARCH or APARCH) to accommodate various characteristics of volatility.
Moreover, the GARCH framework accommodates the phenomenon of volatility persistence, where past volatility levels influence future volatility, making it particularly suitable for modeling the dynamics of financial market data (Alqaralleh et al. 2020). Additionally, the flexibility of the GARCH model in capturing both short-term and long-term volatility patterns makes it a versatile tool for researchers seeking to understand and predict market dynamics (Bhowmik and Wang 2020). Overall, the GARCH model’s ability to capture the complex dynamics of volatility, including its time variation and persistence, makes it a preferred choice for many researchers in financial econometrics.
In the realm of modeling and forecasting stock market volatility, particularly in emerging and pre-emerging countries, empirical investigations into different GARCH models have yielded contradicting outcomes. On one hand, a plethora of studies have shown that non-linear models, especially the EGARCH model, outperformed the linear counterparts in capturing and predicting the conditional variance across short- and long-term horizons (Lin 2018; Abdalla and Winker 2012; Liu and Hung 2010; Alberg et al. 2008; Selçuk 2005; Chong et al. 1999). On the contrary, limited evidence in the literature supports the efficacy of linear or symmetric volatility models, especially within the context of emerging markets (Srinivasan and Ibrahim 2020; Li and Wang 2013; Tabajara et al. 2014). However, the literature has prominently highlighted the effectiveness of the parsimonious linear GARCH (1,1) model with a generalized distribution of residual, particularly in capturing the intricate dynamics of volatility within financial markets. Numerous empirical studies have underscored the model’s robustness and predictive power, emphasizing its ability to effectively model the volatility clustering and the conditional variance of asset returns and time series data across various time horizons (Zabiulla 2015; Abdalla and Suliman 2012; Joshi 2010; Gokcan 2000).
More recently, numerous studies have delved into the realm of modeling and forecasting market volatility through the lens of deep learning models. Comparative research has pitted deep learning-based forecasters, including Multi-Layer Perceptrons, Recurrent Neural Networks, Temporal Convolutional Networks, and the Temporal Fusion Transformer, against traditional econometric models like GARCH ones (Ge et al. 2023). These investigations have frequently revealed the superior predictive performance of deep learning architectures in capturing intricate long-range dependencies, often surpassing the performance of classical approaches in volatility forecasting in financial markets (Sahiner et al. 2023). Moreover, the integration of deep learning algorithms such as LSTM and GRU with sentiment data has yielded remarkable advancements, showcasing substantial improvements over GARCH models (Yu et al. 2023). Furthermore, the amalgamation of optimized variational mode decomposition with deep learning frameworks like DBN, LSTM, and GRU has unveiled enhanced predictive capabilities applicable across both emerging and developed markets (Cai et al. 2023). These collective findings underscore the efficacy of deep learning models in adeptly modeling and forecasting market volatility, illuminating their pivotal role in this domain.
3. Overview of the Moroccan and Bahraini Stock Markets
3.1. Casablanca Stock Exchange (CSE)
Established in 1929, the Casablanca Stock Exchange (CSE) is the third oldest market place in Africa, playing a central role in the regional economy. Over the years, the exchange has undergone significant transformations to modernize its operations and align with international standards. In 1995, a management company was established, entrusted with overseeing the stock exchange, operating under specifications approved by the Ministry of Finance. This move marked a pivotal moment in the evolution of the CSE, setting the stage for enhanced governance and strategic management. The regulatory environment is overseen by the Moroccan Capital Market Authority (AMMC), which ensures compliance with market regulations and investor protection, further bolstering the exchange’s credibility and stability. Despite these advancements, the CSE continues to face challenges in terms of liquidity, market depth and market activity, necessitating ongoing efforts to strengthen market infrastructure and improve investor confidence.
With 77 listed companies as of the end of 2023, the Casablanca Stock Exchange (CSE) operates as a continuous market, characterized by the continuous matching of buy and sell orders throughout the trading day. Additionally, the CSE features an opening and closing fixing, which serve as reference points for the market at the beginning and end of each trading session. Driven by orders and facilitated by an intricate order book system, the market ensures that buy and sell orders are executed efficiently, contributing to market transparency and fair pricing.
3.2. Bahrain Bourse (BHB)
Transitioning to the Arabian Peninsula and venturing into the Asian continent, we explore the Bahrain Bourse, a younger financial institution established in 1987, characterized by its unique blend of traditional Islamic finance principles and modern investment practices. Despite its relatively recent inception, the Bahrain Stock Exchange has rapidly emerged as a significant player in the region’s financial landscape, with 42 listed companies as the end of 2023.
In the Bahraini equity market, the order-driven mechanism, married to continuous auctions, serves as the backbone of trading activities, fostering efficient price discovery. Market participants, including individual investors, institutional traders, and foreign entities, have direct access to the trading platform, enabling them to place orders according to their investment strategies and market outlook. This decentralized approach promotes market depth and liquidity, as the continuous matching of orders facilitates swift execution and minimal price impact.
While the Bahraini market primarily operates as an order-driven system, it also incorporates elements of a quote-driven market, especially in the presence of market makers. These entities provide liquidity by quoting bid and ask prices for certain securities, helping to narrow spreads and improve market efficiency. However, the order-driven nature remains predominant, emphasizing the importance of investor orders in driving market dynamics and price formation.
However, the Bahraini equity market faces certain difficulties. One challenge is the limited number of listed companies, which can restrict investment choices and diversification opportunities for investors. Furthermore, market liquidity can vary across different securities, impacting trade execution and price stability, especially for less liquid stocks.
In fine, both the Moroccan and Bahraini markets are classified as pre-emerging markets by MSCI (Morgan Stanley Capital International), indicating their status as evolving financial hubs with potential for growth and development. Despite facing challenges, they offer promising investment opportunities for those seeking exposure to emerging economies. As they continue to implement reforms and enhance infrastructure, these markets are positioned to attract greater investment inflows in the future.
4. Materials and Methods
In this study, we embark on a comparative analysis of volatility modeling and forecasting techniques, drawing insights from both econometric and deep learning methodologies. To achieve this goal, our methodology consists on employing a combination of traditional econometric methods, including Autoregressive Conditional Heteroscedasticity (ARCH) and Generalized Autoregressive Conditional Heteroscedasticity (GARCH) models, alongside cutting-edge deep learning architectures such as Long Short-Term Memory (LSTM) and Convolutional Neural Network (CNN) models. The following paragraphs present and elaborate on the various approaches utilized in this study for volatility modeling and forecasting in the two markets:
4.1. Econometric Approach
4.1.1. The Autoregressive Conditional Heteroscedastic (ARCH) model
ARCH models involve time series characterized by changing volatility over time (heteroscedasticity), which is conditional on the autocorrelation of previous lags (autoregressive conditional). Referring to the seminal paper by Engle (1982), a variable follows an ARCH (p) process if:
where, is the information set available at time t-1, is the conditional variance function, p is the order of ARCH process and is a vector of unknown parameters.
To guarantee positive variance, the parameters must satisfy some conditions, such that, . Furthermore, recent past have to had more influence than older lags, so: .
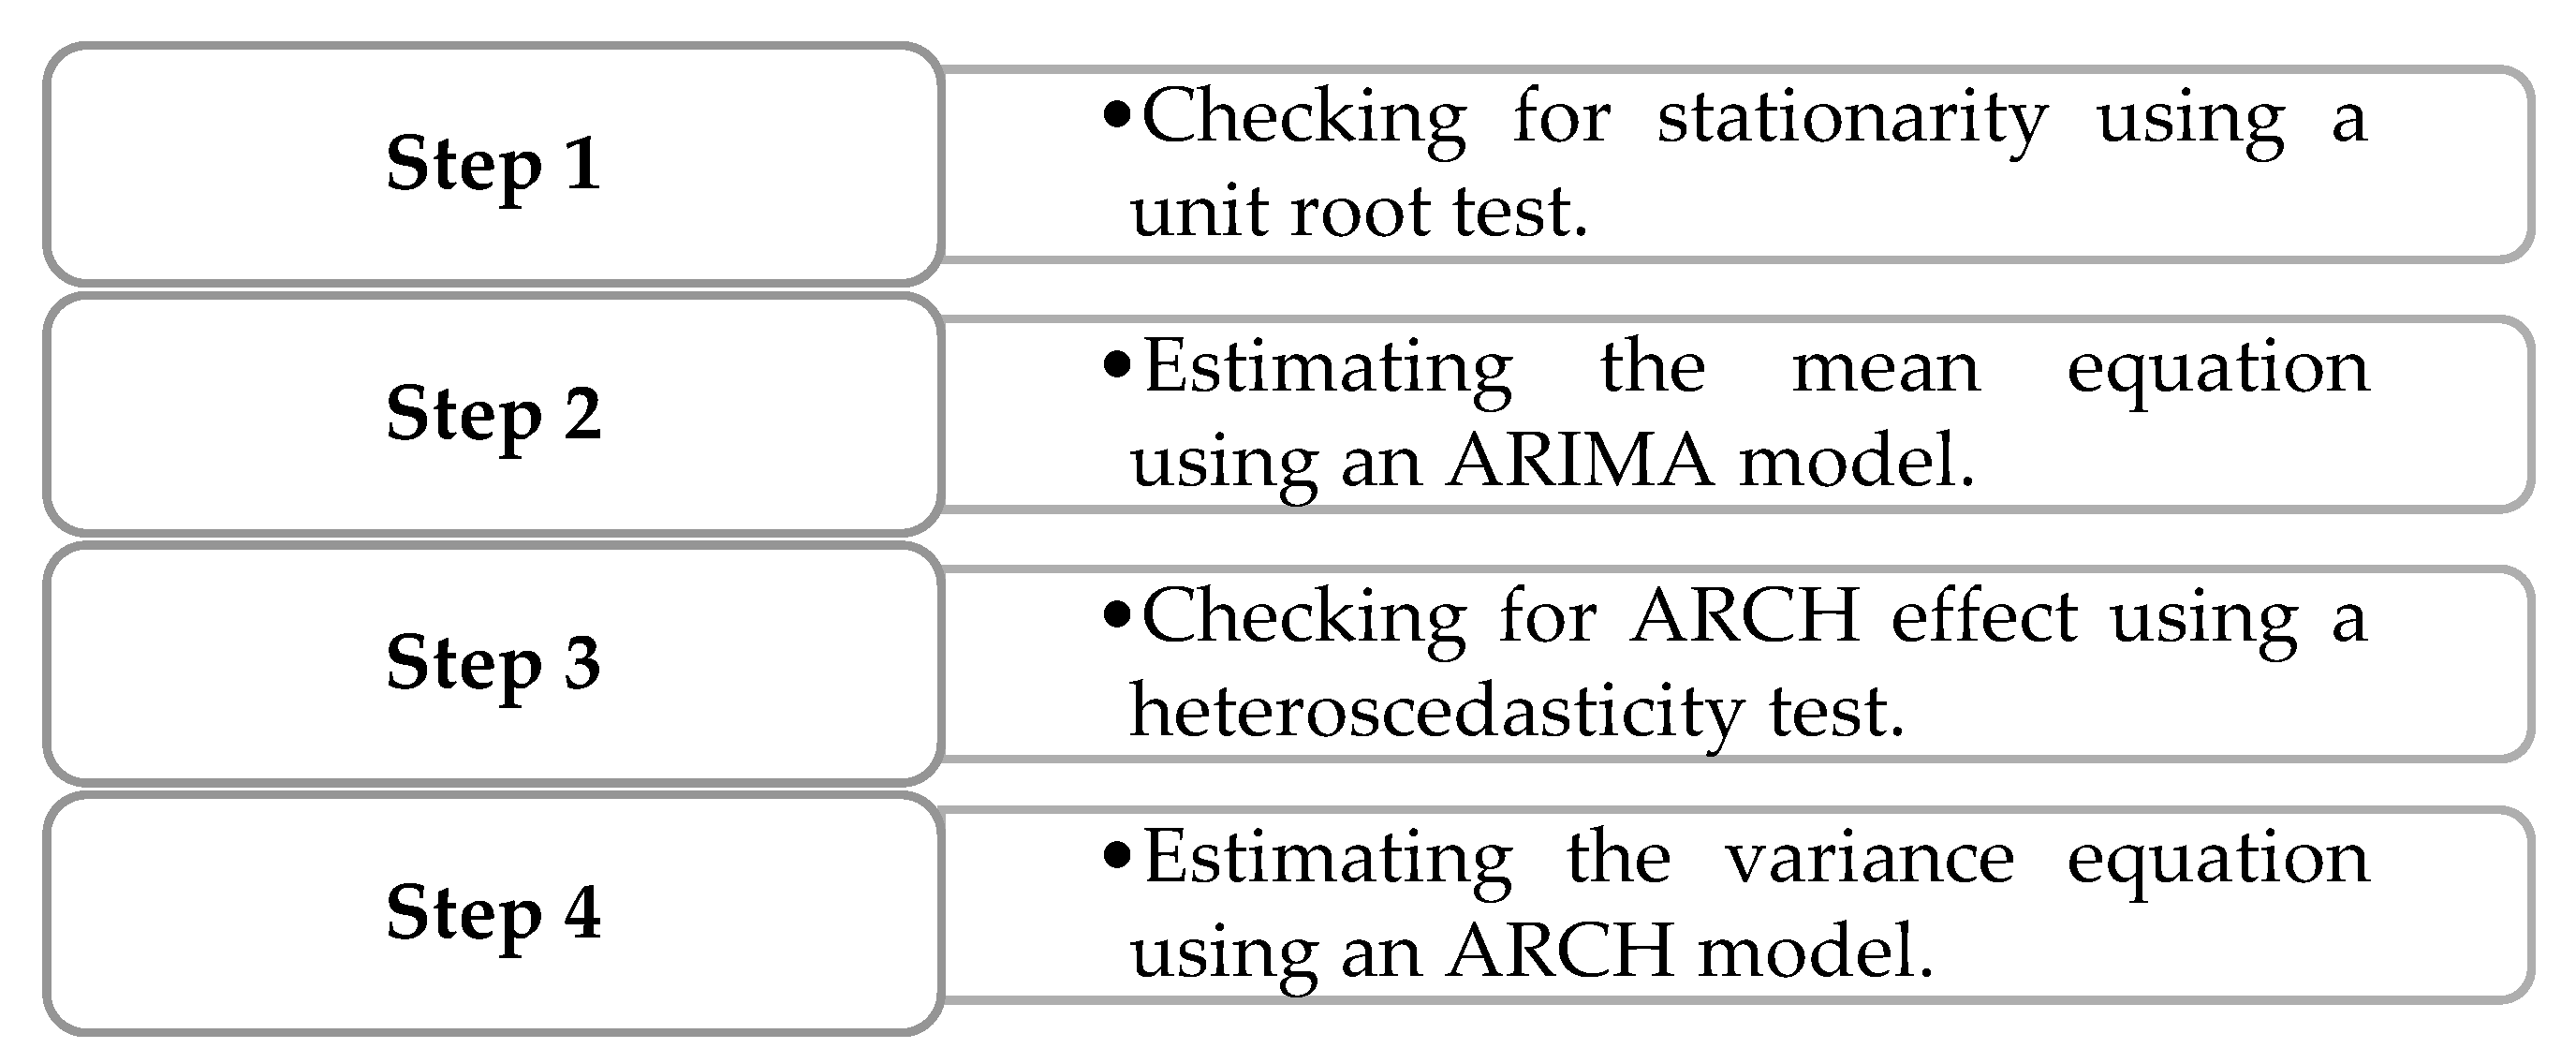
To estimate our ARCH model, we will follow the steps below:
Figure 1.
Illustration of ARCH model estimation steps.
4.1.2. The Generalized Autoregressive Conditional Heteroscedastic (GARCH) Model
GARCH models were introduced in 1986 by Bollerslev as an extension of ARCH models. They incorporate both autoregressive and moving average terms in the volatility equation. In addition to past squared residuals, GARCH models also include lagged conditional variances in the model specification. This allows them to capture both short-term volatility clustering and long-term persistence in volatility, making them more flexible and capable of modeling various volatility patterns observed in financial time series (Francq and Zakoian 2019).
Moreover, GARCH models provide a parsimonious alternative to high order ARCH models, which can become problematic when estimating many ARCH effects ((Bhowmik and Wang 2020).
The formalities of GARCH models involve both terms p and q, where in ARCH you only have the p term. So, a variable follows a GARCH (p,q) process if:
where .
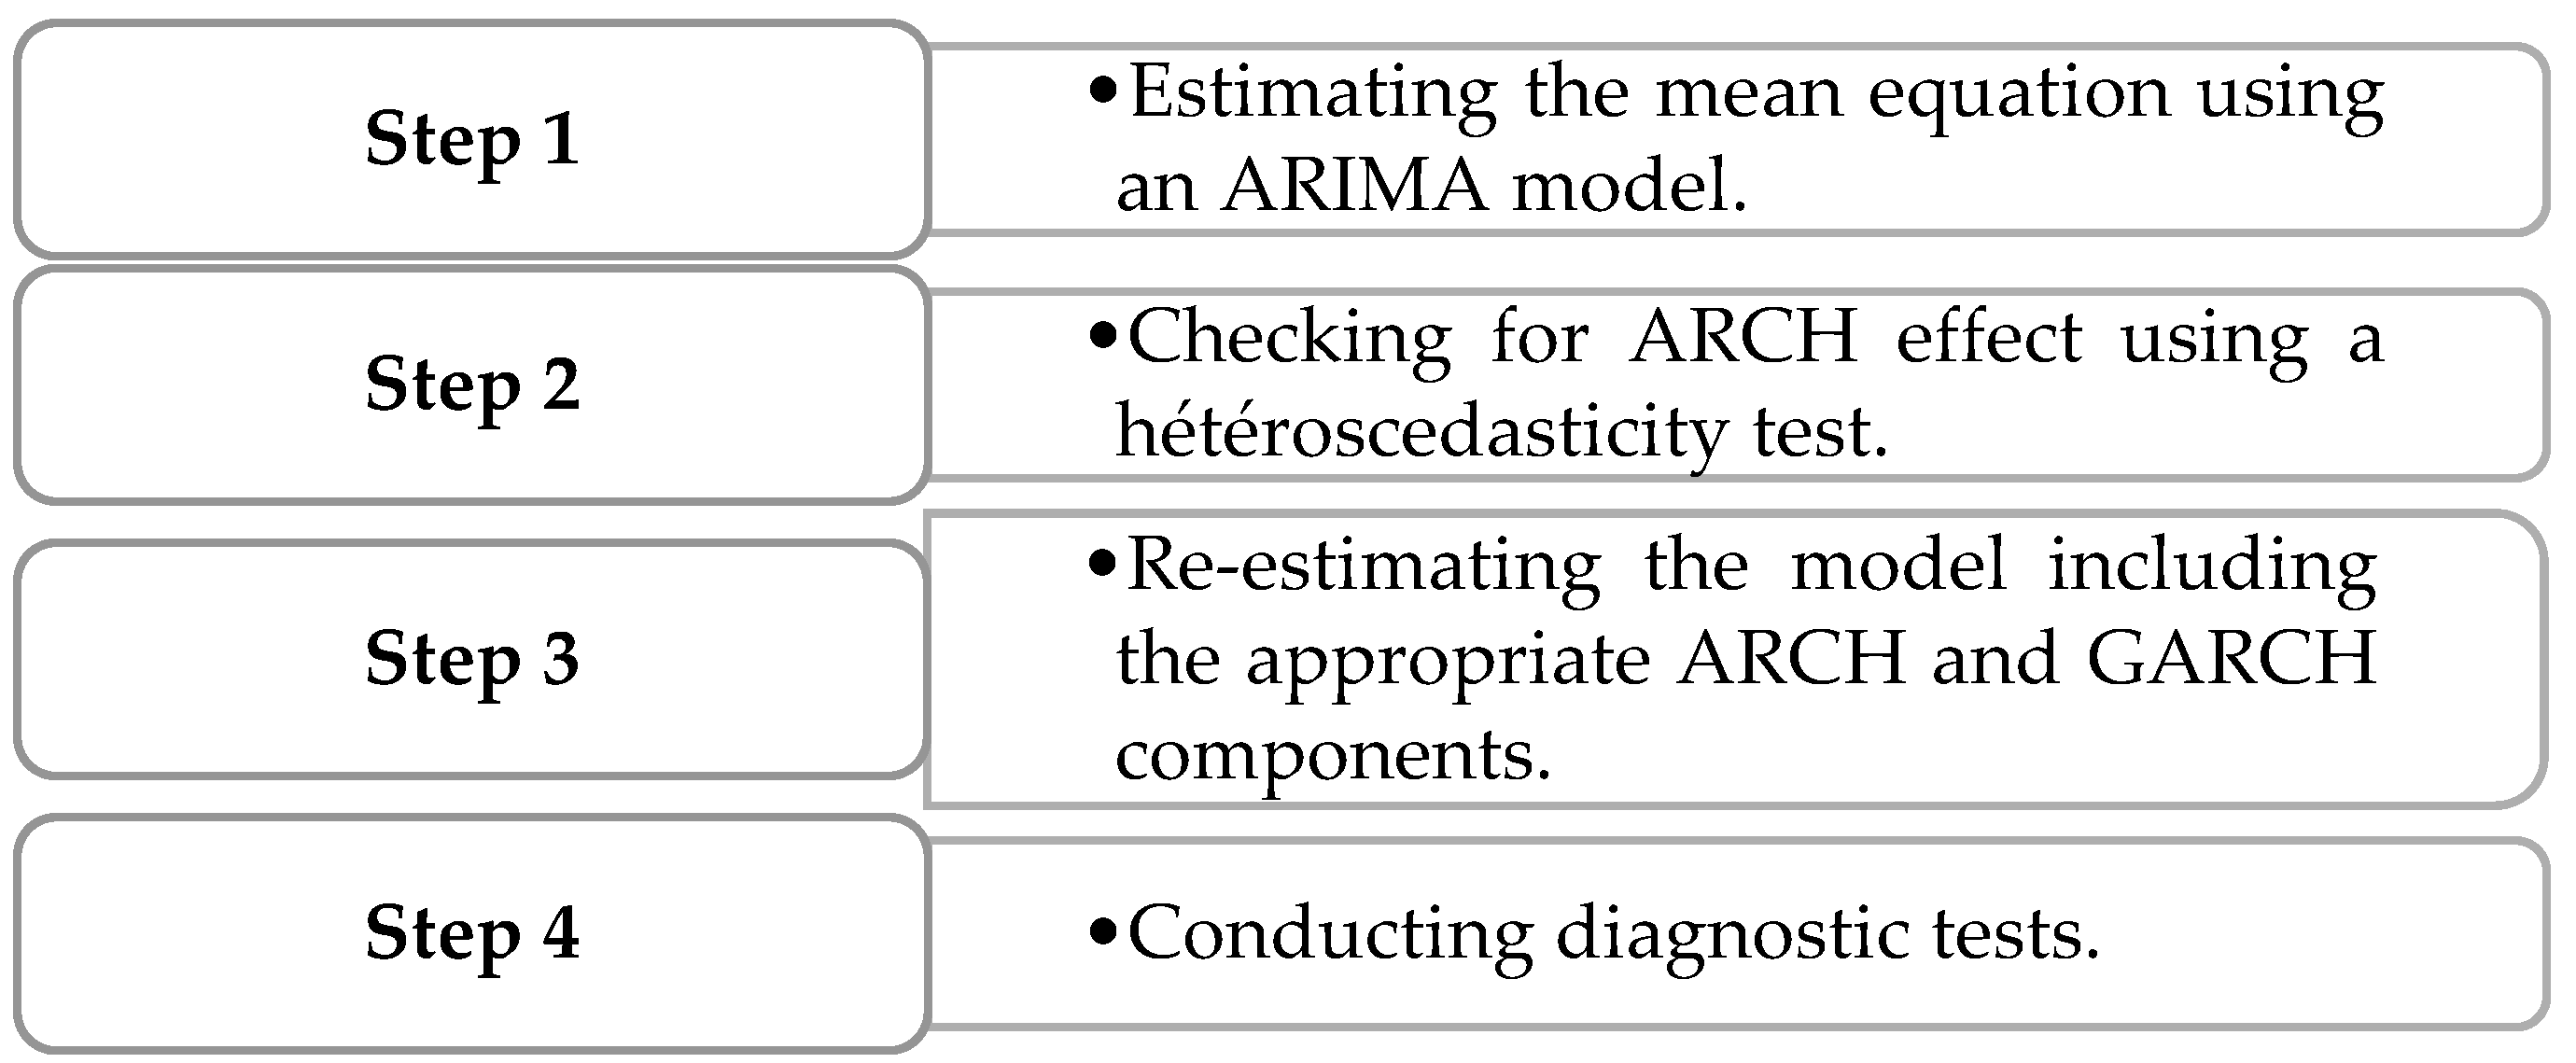
To estimate our GARCH model, we will follow the steps below:
Figure 2.
Illustration of GARCH model estimation steps.
In summary, the conditional variance equation in ARCH and GARCH models serves to capture the time-varying nature of volatility in financial market data. This specification is essential in financial contexts, where analysts seek to predict future volatility based on past observations and information. In these models, the conditional variance at each time point is estimated as a weighted average of several components (Abdalla and Winker 2012). Firstly, a long-term average (represented by the constant term) provides a baseline estimate of volatility. Secondly, the GARCH term incorporates information from the previous period’s forecast variance, contributing to the persistence of volatility over time. Finally, the ARCH term captures the impact of unexpected asset returns on volatility, adjusting the estimate of variance based on the magnitude and direction of these returns. This dynamic interplay between past volatility, current information, and unexpected returns allows ARCH and GARCH models to effectively capture the complex dynamics of financial market volatility.
4.2. Deep Learning Approach
4.2.1. LSTM Network
Modeling and predicting future values of time series using artificial neural networks presents a challenge in retaining past information for accurate forecasting. Recurrent Neural Networks (RNNs) address this challenge by incorporating memory mechanisms in their hidden layers, allowing them to store and recall past states. However, simple RNNs are prone to gradient explosion, where gradients grow uncontrollably during training, affecting model stability (Kanai et al. 2017). To overcome this limitation, Long Short-Term Memory (LSTM) networks were developed. LSTM networks feature gated mechanisms that regulate the flow of information, preventing gradient explosion and enabling effective long-term memory retention. These networks learn to prioritize relevant information for prediction, enhancing forecasting accuracy. LSTM networks have proven effective for financial time series forecasting due to their ability to handle sequential data and long-term dependencies (Yu et al. 2019). However, training an LSTM network requires careful parameter selection to optimize performance (Sako et al. 2022).
In our study, we’ve developed and trained a neural network with a range of parameters, as depicted in the Table 1 below:
4.2.2.1. D-CNN Network
A Convolutional Neural Network (CNN) is a versatile machine learning algorithm applied extensively in diverse fields, such as image processing, speech recognition, and time series analysis. Originally tailored for image data, CNNs necessitate two-dimensional input. However, given that time series data typically unfolds in one dimension, a specialized adaptation known as a one-dimensional CNN has emerged (Markova 2022). This model operates on a single sequence, potentially incorporating multiple convolutional layers and a pooling layer to distill key features. Subsequently, a fully connected dense layer interprets these features, facilitated by a flattening layer to reduce dimensionality. To enhance performance, we meticulously curated and refined parameters using our comprehensive training dataset, with the objective of minimizing prediction errors, as illustrated in the following table:

Table 2.
CNN Network parameters.
| Network Parameters | Values |
|---|---|
| Data standardization formula | |
| Optimization Algorithm | Adam |
| Activation function | ReLU |
| Number of Iterations (Epochs) | 1000 |
| Gradient Threshold | ReLU |
| Number of filter units | 64 |
| Number of kernels | 2 |
| Batch size | 32 |
| Dense units | 1 |
| Training Rate | 0,9 |
| Testing Rate | 0,1 |
4.2. Forecast Performance Metrics
The performance of all employed models was evaluated using various metrics, which assessed the disparities between predicted and actual values. The performance metrics are defined by:
- Root Mean Square Error (RMSE):
- Mean Absolute Error (MAE):
- Mean Absolute Percentage Error (MAPE):
where is the difference between the predicted value and the observed value at time , i.e., with being the observed value and being the predicted value.
These metrics will serve as crucial benchmarks for comparing the effectiveness of each model in forecasting volatility, enabling us to identify the optimal approach for predictive accuracy in the Moroccan and Bahraini stock markets.
5. Data and Descriptive Statistics
For the implementation of our study and the deployment of the selected models, we constructed two series of daily returns related to the performance of the Moroccan All Shares Index (MASI) and the Bahrain All Shares Index (BAX) over a 5-year period from January 2019 to December 2023. The data pertaining to the closing values of both indices were obtained from the Investing.com platform, ensuring reliable and comprehensive data coverage for our analysis.
From these data, the daily logarithmic returns were computed using the formula:
where is the closing price of the index i at time t.
Understanding the data through graphical representation and descriptive statistics serves as a crucial foundation before proceeding to modeling and forecasting, providing valuable insights into the underlying patterns and characteristics of the datasets.
Figure 3.
(a) Volatility clustering for BAX index; (b) Volatility clustering for MASI index.
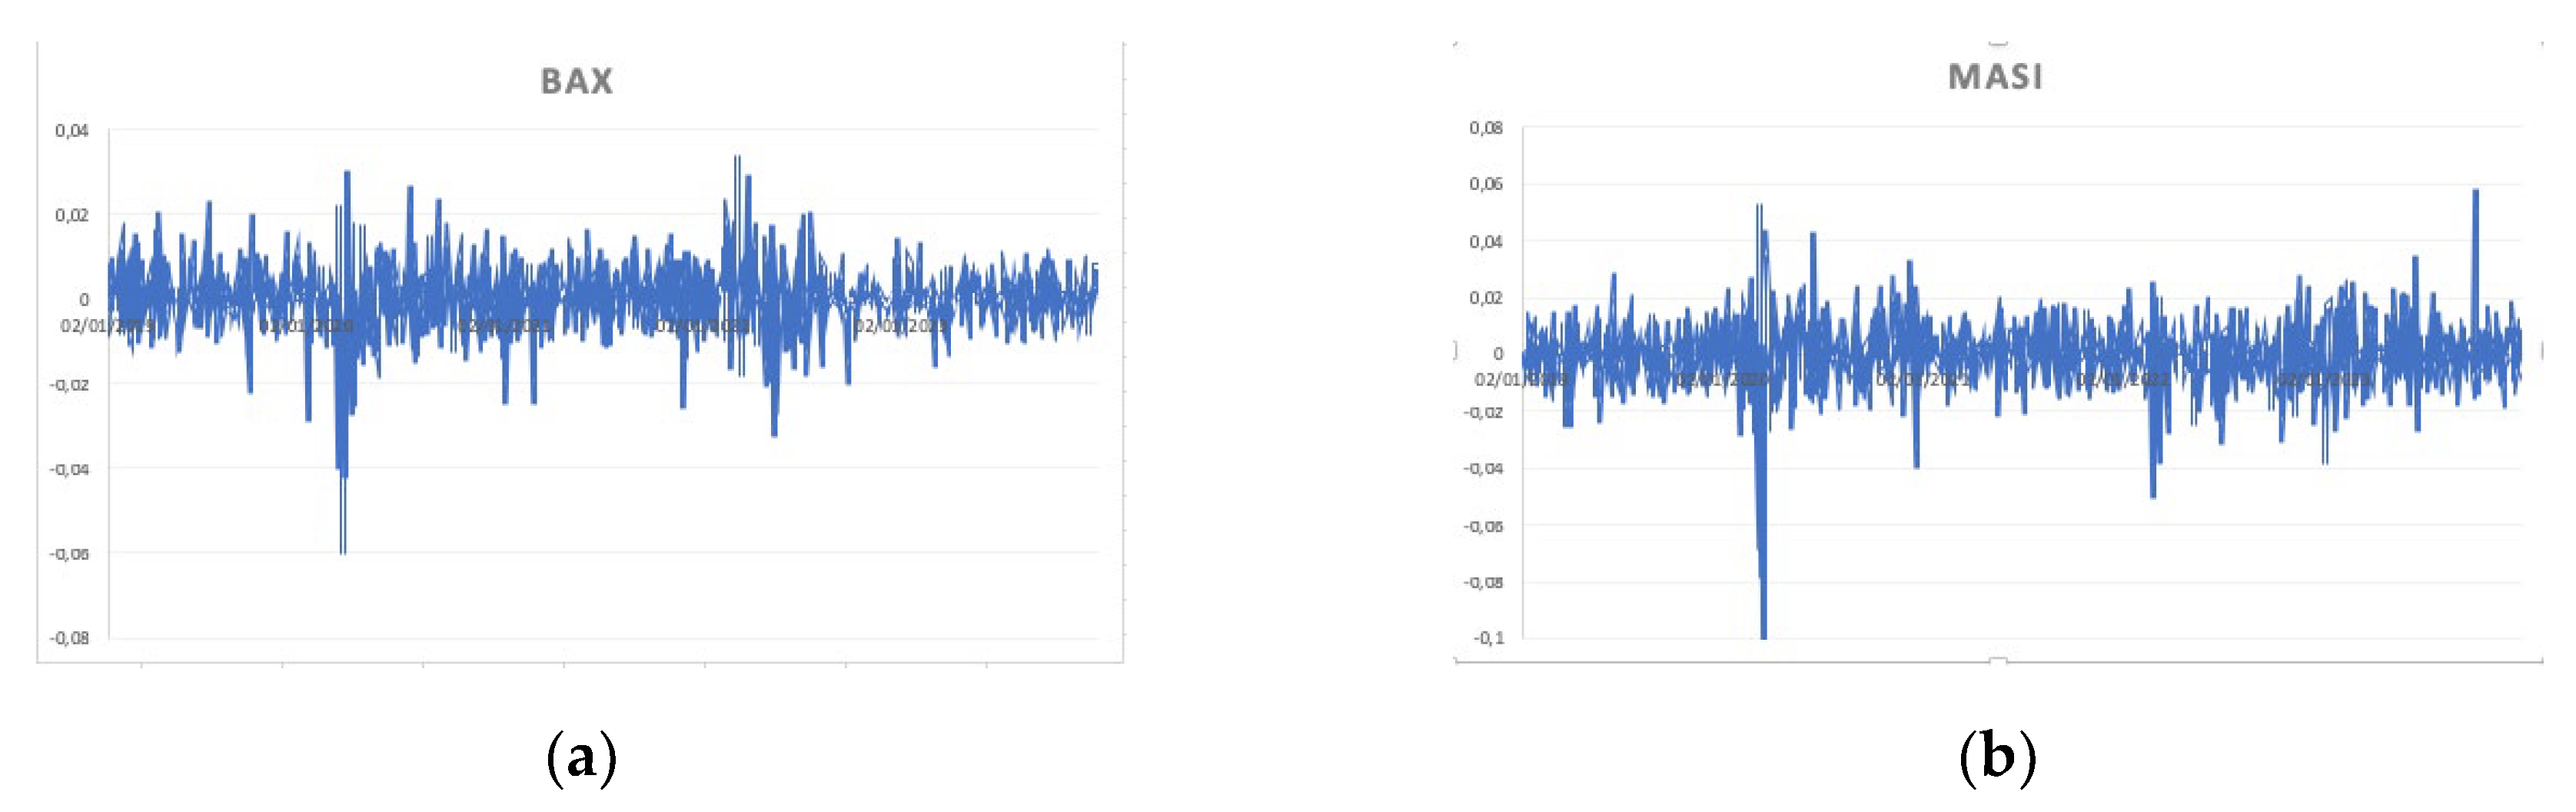
Table 3.
Descriptive statistics of the BAX and MASI return series.
| Statistics | Variables | |
|---|---|---|
| BAX | MASI | |
| Number of observations | 1 226 | 1 247 |
| Mean | 0,000321 | 5,39E-05 |
| Median | 0,000391 | 0,000211 |
| Maximum | 0,034233 | 0,053054 |
| Minimum | -0,060013 | -0,092317 |
| Std. Dev. | 0,005505 | 0,008083 |
| Skewness | -1,636707 | -1,892897 |
| Kurtosis | 21,89118 | 28,00946 |
| Jarque-Bera | 18777,81 | 33243,21 |
| Probability | 0,000000 | 0,000000 |
| Normality hypothesis | Rejected | Rejected |
The descriptive statistics reveal insightful characteristics of the daily returns for the BAX and MASI indices. Notably, while the average daily return for BAX stands at 0.000321, MASI exhibits a slightly lower average return of 5.39E-05. Both distributions display negative skewness, implying a left-skewed distribution with longer tails on the left side. Additionally, the high kurtosis values suggest heavier tails and more peaked distributions compared to a normal distribution, indicating greater volatility and potential for extreme returns. Furthermore, the Jarque-Bera test results decisively reject the hypothesis of normality for both indices, emphasizing the non-normal nature of their return distributions. Overall, it is noteworthy that there are no significant differences between the statistical characteristics of the two series, a point further reinforced by observing the graphical representations of the two datasets.
6. Empirical Results and Discussion
6.1. Empirical Results
6.1.1. Testing for Stationarity
To test the stationarity of our two-return series, we employed the Augmented Dickey-Fuller (ADF) unit root test. This test is commonly used to determine whether a time series is stationary or non-stationary by assessing the null hypothesis regarding the presence of a unit root in the data. The results of the test are summarized in the table below, providing insights into the stationarity properties of the BAX and MASI return series:
Table 4.
Stationarity test results for the BAX and MASI return series.
| Variables | ADF Test | T-Statistics | P-Values | Hypothesis |
|---|---|---|---|---|
| BAX | Intercept | -15,88660* | 0,0000 | Null hypothesis rejected |
| Trend and intercept | -15,88105* | 0,0000 | Null hypothesis rejected | |
| None | -15,81436* | 0,0000 | Null hypothesis rejected | |
| MASI | Intercept | -21,16787* | 0,0000 | Null hypothesis rejected |
| Trend and intercept | -21,15932* | 0,0000 | Null hypothesis rejected | |
| None | -21,17456* | 0,0000 | Null hypothesis rejected |
Notes: * indicates significance at the 5% level.
The Augmented Dickey-Fuller (ADF) test results indicate that the null hypothesis for both the BAX and MASI return series is rejected across all specifications. This suggests that the return series for both indices are stationary in level, indicating that they exhibit stable mean and variance over time.
After analyzing the correlogram and evaluating various specifications, we have concluded that the most suitable model for representing the mean equation of both series is ARMA (1,1).
6.1.2. Testing for Heteroscedasticity
We conducted the heteroscedasticity test using the ARCH effect specification, under the null hypothesis of no existing ARCH effect in the residual of ARMA (1,1) equation up to 1 lag. The results for both series are summarized in the table below:
Table 5.
Heteroscedasticity test results for the BAX and MASI residual return series.
| F-Statistics | Prob. | Chi Square-Statistics | Prob. | Hypothesis | |
|---|---|---|---|---|---|
| BAX | 182,6009* | 0,0000 | 159,1391* | 0,0000 | Null hypothesis rejected |
| MASI | 37,99301* | 0,0000 | 36,92633* | 0,0000 | Null hypothesis rejected |
The results of the ARCH test, as indicated by the F-Statistics and Chi Square-Statistics, reveal that the null hypothesis of no ARCH effect is rejected for both the BAX and MASI residual series. This suggests a pattern of volatility clustering, where significant changes are often succeeded by further significant changes, regardless of their direction, while minor changes tend to be followed by additional minor changes (Joshi 2010). Such findings have significant implications for modeling and forecasting, as ignoring heteroscedasticity can lead to biased parameter estimates and inaccurate predictions.
6.1.3. Estimation Results
The following Table 6 summarizes the predictive performance of the various models employed in our analysis. The selection of the ARCH (1) and GARCH (1,1) models was based on their ability to capture time-varying volatility in our financial return series. In our analysis, we extended the lag length beyond the first lag, observing that additional lags did not contribute significantly to the ARCH effect. This observation was validated by conducting the ARCH-LM test statistics at various lag lengths. The statistically insignificant p-values obtained for lag lengths beyond the first lag suggest that there is no ARCH effect remaining in the models. This implies that the chosen ARCH (1) and GARCH (1,1) specifications adequately capture the dynamics of volatility in the BAX and MASI return series.
Table 6.
Historical volatility prediction: comparative analysis for different models.
| ARCH (1) | GARCH (1,1) | LSTM | 1D CNN | |||||
|---|---|---|---|---|---|---|---|---|
| BAX | MASI | BAX | MASI | BAX | MASI | BAX | MASI | |
| RMSE | 0,0055 | 0,0081 | 0,0055 | 0,0081 | 0,0447 | 0,0810 | 0,0447 | 0,0812 |
| MAE | 0,0033 | 0,0049 | 0,0034 | 0,0049 | 0,0346 | 0,0453 | 0,0346 | 0,0455 |
| MAPE (%) | 154,913 | 166,035 | 161,52 | 157,854 | 86,638 | 88,013 | 86,145 | 89,399 |
Observing the results, we can see that the ARCH (1) and GARCH (1,1) models consistently outperform the LSTM and 1D CNN models across all metrics and for both indices. This is evident from the lower RMSE, MAE, and MAPE values achieved by the ARCH and GARCH models compared to the LSTM and CNN models.
These findings suggest that the parsimonious ARCH and GARCH models are more effective in capturing the volatility dynamics of the BAX and MASI indices compared to the more complex LSTM and CNN models. Despite their computational complexity, the deep learning models do not exhibit superior predictive performance in this context.
6.1. Discussion
At first glance, our results may appear striking. The outperformance of parsimonious econometric models over robust deep learning models may seem counterintuitive, especially given the complexity and computational power associated with deep learning algorithms.
These results deviate from findings in several studies, such as Petrozziello et al. (2022), which demonstrated the superiority of LSTM networks over various traditional GARCH models in predicting volatility for the NASDAQ 100 index. Similarly, in line with this perspective, Liu (2019) demonstrated that LSTM networks can provide superior predictions for longer time intervals compared to GARCH models.
Our findings, however, contradict these studies, demonstrating the effectiveness of simplistic models in volatility modeling and prediction. Thus, we align with researchers who emphasize the particular performance of the linear GARCH (1,1) model in capturing financial market volatility dynamics. In addition, we highlight the remarkable performance of the parsimonious ARCH (1) model, which further strengthens our argument for the efficacy of simplistic models in volatility analysis.
However, we emphasize that our results hold true within the specific context of pre-emerging markets, which are already characterized by a lack of dynamism and liquidity. Additionally, it is important to note that we did not encounter similar studies within this particular context to facilitate comparison.
In conclusion, our findings underscore the crucial balance between model complexity and predictive accuracy in volatility forecasting within financial time series analysis. While many researchers advocate for the unconditional superiority of artificial neural network models in financial time series modeling and prediction, there is a growing recognition of the need for a deeper understanding of data characteristics. Aminimehr et al. (2022) label this realization as “inconsistency” and argue that the success of neural networks over econometric methods often stems from improper model implementation. In fine, despite significant advancements in this field, it is essential to acknowledge the continued effectiveness of less complex traditional methods.
7. Conclusion and Perspective
In conclusion, we recall that our study sheds light on the nuanced relationship between model complexity and predictive accuracy in historical volatility forecasting within the context of pre-emerging markets. Our results advocate reevaluating the need for complex models, suggesting that simpler models may offer more precise results, challenging the prevailing assumption that increased complexity is always necessary for accurate forecasts.
Looking ahead, an intriguing avenue for future research involves investigating the potential existence of a threshold effect. Specifically, exploring whether there is an optimal market capitalization threshold beyond which neural network models might demonstrate superior forecasting quality. Given the established superiority of neural networks in predicting volatility, returns, and prices in more developed markets, as documented in the literature, exploring this threshold effect could provide valuable insights into the applicability of deep learning approaches in different market conditions.
In summary, our findings underscore the ongoing debate surrounding the choice of model complexity in financial time series analysis in general and historical volatility in particular, and highlight the need for further exploration into the interplay between market characteristics and predictive modeling techniques. By addressing these gaps, future research can contribute to a more comprehensive understanding of volatility dynamics and enhance the effectiveness of forecasting models in diverse market environments and conditions.
Author Contributions
Both authors contributed equally to the work, including conceptualization, methodology, data analysis, and writing of the manuscript. Each author reviewed and approved the final version of the article.
Funding
This research received no external funding.
Data Availability Statement
The data used in this study are publicly available and accessible through the website https://www.investing.com/.
Conflicts of Interest
The authors declare no conflicts of interest.
References
- Abdalla, S.Z.S. , Winker, P. Modelling Stock Market Volatility Using Univariate GARCH Models: Evidence from Sudan and Egypt. IJEF 2012, 4, p161. [Google Scholar] [CrossRef]
- Alberg, D. , Shalit, H. , Yosef, R. Estimating stock market volatility using asymmetric GARCH models. Applied Financial Economics 2008, 18, 1201–1208. [Google Scholar] [CrossRef]
- Aminimehr, Amin, Raoofi, A., Aminimehr, Akbar, Aminimehr, Amirhossein, 2022. A Comprehensive Study of Market Prediction from Efficient Market Hypothesis up to Late Intelligent Market Prediction Approaches. Comput Econ 60, 781–815. [CrossRef]
- Bhowmik, R. , Wang, S. Stock Market Volatility and Return Analysis: A Systematic Literature Review. Entropy 2020, 22, 522. [Google Scholar] [CrossRef]
- Bollerslev, T. Generalized autoregressive conditional heteroskedasticity. Journal of Econometrics 1986, 31, 307–327. [Google Scholar] [CrossRef]
- BURTNIAK, I. , Suduk, N. MОDEL OF DETERMINING STOCK MARKET VOTALITY. Herald of Khmelnytskyi National University 2022, 302, 316–320. [Google Scholar] [CrossRef]
- Cai, W. , Liu, K. , Lu, K. Forecasting Daily Stock Volatility: A Comparison between GARCH and Recurrent Neuro-networks. BCP Business & Management 2023, 38, 427–436. [Google Scholar] [CrossRef]
- Calamanti, A. The Stock Exchange and the Securities Market in Morocco / La Bourse Et Le Marche Mobilier Au Maroc. Savings and Development 1980, 4, 266–302. [Google Scholar]
- Engle, R. The Use of ARCH/GARCH Models in Applied Econometrics. The Journal of Economic Perspectives 2001, 15, 157–168. [Google Scholar] [CrossRef]
- Engle, R.F. Autoregressive Conditional Heteroscedasticity with Estimates of the Variance of United Kingdom Inflation. Econometrica 1982, 50, 987–1007. [Google Scholar] [CrossRef]
- Engle, R.F. , Ghysels, E. , Sohn, B. Stock Market Volatility and Macroeconomic Fundamentals. The Review of Economics and Statistics 2013, 95, 776–797. [Google Scholar] [CrossRef]
- Francq, C. , Zakoian, J.-M., 2019. GARCH Models: Structure, Statistical Inference and Financial Applications. John Wiley & Sons.
- Ge, W. , Lalbakhsh, P., Isai, L., Lensky, A., Suominen, H., 2023. Comparing Deep Learning Models for the Task of Volatility Prediction Using Multivariate Data. [CrossRef]
- Joshi, P. MODELING VOLATILITY IN EMERGING STOCK MARKETS OF INDIA AND CHINA. Journal of Quantitative Economics 2010, 8. [Google Scholar]
- Kanai, S. , Fujiwara, Y., Iwamura, S., 2017. Preventing Gradient Explosions in Gated Recurrent Units, in: Advances in Neural Information Processing Systems. Curran Associates, Inc.
- Li, Z. Financial market volatility based on complex network and fuzzy logic theory. Journal of Intelligent & Fuzzy Systems 2021, 1–10. [CrossRef]
- Lin, Z. Modelling and forecasting the stock market volatility of SSE Composite Index using GARCH models. Future Generation Computer Systems 2018, 79, 960–972. [Google Scholar] [CrossRef]
- Liu, Y. Novel volatility forecasting using deep learning–Long Short Term Memory Recurrent Neural Networks. Expert Systems with Applications 2019, 132, 99–109. [Google Scholar] [CrossRef]
- Livieris, I.E. , Pintelas, E. , Pintelas, P. A CNN–LSTM model for gold price time-series forecasting. Neural Comput & Applic 2020, 32, 17351–17360. [Google Scholar] [CrossRef]
- Markova, M. Convolutional neural networks for forex time series forecasting. AIP Conference Proceedings 2022, 2459, 030024. [Google Scholar] [CrossRef]
- Narula, I. Dynamics of Indian stock market volatility. International Journal of Innovation and Sustainable Development 2022, 16, 155–171. [Google Scholar] [CrossRef]
- Petrozziello, A. , Troiano, L. , Serra, A., Jordanov, I., Storti, G., Tagliaferri, R., La Rocca, M. Deep learning for volatility forecasting in asset management. Soft Comput 2022, 26, 8553–8574. [Google Scholar] [CrossRef]
- Sahiner, M. , McMillan, D. G., Kambouroudis, D. Do artificial neural networks provide improved volatility forecasts: Evidence from Asian markets. J Econ Finan 2023, 47, 723–762. [Google Scholar] [CrossRef]
- Schwert, G.W. Stock Market Volatility. Financial Analysts Journal 1990, 46, 23–34. [Google Scholar] [CrossRef]
- Thakkar, A. , Chaudhari, K. A comprehensive survey on deep neural networks for stock market: The need, challenges, and future directions. Expert Systems with Applications 2021, 177, 114800. [Google Scholar] [CrossRef]
- Yu, Y. , Lin, Y. , Hou, X., Zhang, X. Novel optimization approach for realized volatility forecast of stock price index based on deep reinforcement learning model. Expert Systems with Applications 2023, 233, 120880. [Google Scholar] [CrossRef]
- Yu, Y. , Si, X. , Hu, C., Zhang, J. A Review of Recurrent Neural Networks: LSTM Cells and Network Architectures. Neural Computation 2019, 31, 1235–1270. [Google Scholar] [CrossRef] [PubMed]
Table 1.
LSTM Network parameters.
| Network Parameters | Values |
|---|---|
| Data standardization formula | |
| Optimization Algorithm | Adam |
| Number of Iterations (Epochs) | 250 |
| Gradient Threshold | 1 |
| Initial Learning Rate | 0.005 |
| Learning Rate Drop Period | 125 |
| Learning Rate Drop Factor | 0.2 |
| Number of Hidden Layers | 100 |
| Training Rate | 0,9 |
| Testing Rate | 0,1 |
Disclaimer/Publisher’s Note: The statements, opinions and data contained in all publications are solely those of the individual author(s) and contributor(s) and not of MDPI and/or the editor(s). MDPI and/or the editor(s) disclaim responsibility for any injury to people or property resulting from any ideas, methods, instructions or products referred to in the content. |
© 2024 by the authors. Licensee MDPI, Basel, Switzerland. This article is an open access article distributed under the terms and conditions of the Creative Commons Attribution (CC BY) license (https://creativecommons.org/licenses/by/4.0/).
Copyright: This open access article is published under a Creative Commons CC BY 4.0 license, which permit the free download, distribution, and reuse, provided that the author and preprint are cited in any reuse.


