Submitted:
08 May 2024
Posted:
09 May 2024
You are already at the latest version
Abstract
Oil-Gan, also known as emblica, is the fruit of the genus Phyllanthus emblica L. The fruits of these trees are high in nutrients and have excellent effects on health care and development values. There are many methods for the management of diabetic nephropathy (DN). However, there is a lack of effective drugs for treating DN from throughout the disease course. The primary aim of this study was to examine the protective effects (including urine analyses, the measurement of inflammatory cytokine levels, and histological examination) and mechanisms of action of an ethyl acetate extract of P. emblica (EPE) on db/db mice, an animal model of diabetic nephropathy, as well as a secondary aim of examining the expression levels of protein kinase Cα (PKCα) in the kidney and its downregulation of vascular endothelial growth factor (VEGF) and fibrosis gene transforming growth factor-β1 (TGF-β1) by Western blot analyses. Eight db/m C57BLKS/J mice were used as the control group. Forty db/db mice were randomly divided into five groups. Treatments included vehicle, EPE1, EPE2, EPE3 (at doses of 100, 200, or 400 mg/kg EPE), or the comparative drug aminoguanidine for 8 weeks. After 8 weeks of treatment, blood samples were collected for analyses of blood glucose, insulin, and HbA1c levels, and pancreatic and kidney tissues were dissected for histological analyses. The present study indicated that the administration of EPE to db/db mice effectively controlled hyperglycemia and hyperinsulinemia by markedly lowering blood glucose, insulin, and glycosylated HbA1c levels. Administration of EPE to db/db mice decreased the levels of BUN and creatinine both in blood and urine and reduced urinary albumin excretion and the albumin creatine ratio (UACR) in urine. Moreover, EPE treatment decreased the blood levels of inflammatory cytokines, including kidney injury molecule-1 (KIM-1), C-reactive protein (CRP), and NLR family pyrin domain containing (NLRP3). Our findings showed that EPE not only had antihyperglycemic effects but also improved renal function in db/db mice. Histological examination of the kidney by immunohistochemistry indicated that EPE can improve kidney function by ameliorating glomerular morphological damage following glomerular injury; alleviating proteinuria by upregulating the expression of nephrin, a biomarker of early glomerular damage; and inhibiting glomerular expansion and tubular fibrosis. Moreover, the administration of EPE to db/db mice increased the expression levels of p- PKCα/t-PKCα but decreased the expression levels of VEGF and renal fibrosis biomarkers (TGF-β1, collagen IV, p-Smad2, p-Smad3, and Smad4), as shown by Western blot analyses. These results implied that EPE as a supplement has a protective effect against renal dysfunction through the amelioration of insulin resistance as well as the suppression of nephritis and fibrosis in a DN model.
Keywords:
Phyllanthus emblica L.
; db/db mice
; diabetic nephropathy
Introduction
Diabetic nephropathy (DN) is a serious and common complication of diabetes mellitus. Diabetic nephropathy is a morbid microvascular complication associated with diabetes [1]. Diabetic nephropathy is the leading cause of end-stage kidney disease worldwide [2] and is an independent risk factor for all-cause and cardiovascular mortality in diabetic patients [3]. Approximately 30-40% of patients with type 2 diabetes develop diabetic nephropathy [4]. Diabetic nephropathy is the main complication of type 2 diabetes and leads to glomerular membrane thickening, mesangial expansion, glomerular hypertrophy, and overt renal disease [5,6,7]. Persistent albuminuria is a hallmark of DN.
The markers of renal function include urinary albumin excretion, plasma creatinine, urine creatinine, the urine albumin creatine ratio (UACR; the urine P/C ratio), and histological changes within the kidney structures. Blood urea nitrogen (BUN) is a protein metabolite product. Creatinine is a muscle metabolite product. High BUN and creatinine levels indicate renal dysfunction. Urinary albumin excretion indicates impaired renal function [8,9].
Previous evidence has emphasized the critical role of inflammation in the pathogenesis of DN [10]. Renal inflammation and subsequent fibrosis are critical processes leading to end-stage DN [11,12].
In DN, the accumulation of extracellular matrix (ECM) components in the glomerular mesangium and tubulointerstitium causes early glomerular hypertrophy and eventually glomerulosclerosis and tubulointerstitial fibrosis [13]. Collagen IV accumulation is a crucial phenomenon underlying mesangial expansion [14].
Transforming growth factor-β (TGF-β) is a key regulator of fibrosis that promotes the accumulation of ECM. TGF-β induces phosphorylation and activation of Smad signaling pathway components [15]. TGF-β1 is another important factor in the pathogenesis of DN and mediates the inflammatory response, which exacerbates ECM secretion involving fibronectin and collagen accumulation and accelerates glomerulosclerosis in diabetes [16].
Protein kinase C (PKC) activation can directly increase the permeability of albumin and other macromolecules through barriers formed by endothelial cells [17,18]. Vascular endothelial growth factor (VEGF) participates in the regulation of glomerular permeability, glomerular endothelial cell growth, and urinary albumin excretion [19,20,21]. The Postulated functional role of the classical PKC isoforms and in the development of diabetic nephropathy was described in Figure 1A.
db/db mice serve as an animal model of obesity-related diabetes and can be used to study kidney changes due to diabetes [22]. db/db mice are overweight, hyperglycemic and hyperinsulinemic and exhibit increased kidney weight, glomerular mesangial matrix and albumin excretion [23]. The concentration of collagen IV increases with DN progression in patients and db/db mice [24].
Phyllanthus emblica L. (Figure 1B) is a plant that is widely distributed in tropical and subtropical regions such as Taiwan. The fruit of P. emblica possesses various pharmacological activities. Recently, our findings have shown that Phyllanthus emblica extract displays an antihyperglycemic activity both in in NOD with spontaneous and cyclophosphamide-accelerated Type 1 diabetic mice [25] and in streptozotocin-induced Type 1 diabetic mice [26]. Moreover, it remains unknown EPE’s effects on Type 2 diabetes and DN in an animal model of db/db mouse.
The pathogenesis mechanisms of diabetic nephropathy are very complicated and remain unclear. In diabetes mellitus, hyperglycemia induces the activation of various signaling pathways involved in diabetic vascular complications through the production of inflammatory cytokines. Renal inflammation and subsequent fibrosis are critical processes leading to end-stage DN [11,12]. At present, the major clinical treatment method for diabetic nephropathy is to control glycemia and hypertension (such as the clinic drug: angiotensin II converting enzyme inhibitor; ACEI) and restriction of food protein intake and this method could not control disease progress from the beginning to the end; nevertheless, the therapeutic effectiveness of this method is limited, and the only way to slow the progression of diabetic nephropathy is to improve renal function and reduce both the incidence of the end-stage of DN and the proteinuria to provide patients with good control.
The present study was designed to evaluate whether EPE could improve insulin resistance as well as ameliorate diabetic nephropathy by the improvement of renal dysfunction (such as albumin excretion) and ameliorative glomerular morphological damage by immunohistochemistry or not, and to examine the expression levels of targeted genes (including the expression levels of protein kinase Cα (PKCα) and vascular endothelial growth factor (VEGF), and renal fibrosis biomarkers including transforming growth factor-β1 (TGF-β1), collagen IV, p-Sma and mad protein (Smad)2, p-Smad3, and Smad4)) by Western blotting. Finally, this study examined the effects of seven refractions of EPE on the target expression levels of Collagen IV, TGF-β1, VEGF, and kidney injury molecule (KIM)-1 in Human Renal Mesangial (HRM) cells to clarify the main ingredients responsible for the protective effects of EPE against diabetic nephropathy from the early stage to the end stage including inflammation, fibrosis, and angiogenesis.
Results
2.Effects of EPE on TGF-β1 and Collagen IV In Vitro
To clarify the protective activity of EPE against diabetic nephropathy, we first aimed to determine the anti-fibrotic activity of EPE within the kidney by high-glucose (HG)-induced diabetic status in human renal mesangial cells experimental approach. As shown in Figure 1B−1D, in human renal mesangial cells, HG induced higher expression levels of TGF-β1 and collagen IV than that of the control group (p<0.001, p<0.001, respectively). In HG-induced condition, treatment with 5 μg/mL EPE and 10 μg/mL EPE significantly decreased the expression levels of TGF-β1 compared with the HG group (p<0.05, p<0.001, respectively) (Figure 1B,C). In HG-induced condition, treatment with 5 μg/mL EPE and 10 μg/mL EPE significantly reduced the expression levels of collagen IV compared with the HG group (p<0.001, p<0.001, respectively) (Figure 1B,D). The results of the experiment showed EPE treatment decreased fibrosis by regulation of TGF-β1 and collagen IV expressions in human renal mesangial cells.
2.Animal Treatments
2.2.Body Weights and Relative Organ Weights
As shown in Figure 2A, the db/db mice (vehicle-treated db/db) had greater initial body weights than did the db/m mice (p<0.001).
Following treatment, the db/db mice (vehicle-treated db/db) had greater final body weights than did the db/m mice (p<0.001). The results of the experiment showed the EPE2- and EPE3-treated db/db groups had lower final body weights than did the db/db group (p < 0.05, p < 0.01, respectively) (Figure 2A). As shown in Table 1, the relative weights of liver tissue, kidney tissue, and skeletal muscle in the db/db group were lower than those in the db/m group (p < 0.001, p < 0.001, p < 0.001, respectively).
As shown in Table 1, AG-treated db/db mice had reduced relative weights of liver and pancreas tissue compared with those of the db/db group (p < 0.05, p < 0.05, respectively). The results of the experiment showed there was no difference in the relative weights of the liver tissue, kidney tissue, pancreas, and skeletal muscle between the EPE1-, EPE2-, and EPE3-treated db/db mice and the db/db group (Table 1).
2.2.Blood Glucose, HbA1C, and Insulin Levels
To clarify the effect of EPE on the Type 2 diabetes mellitus, blood levels of glucose, glycated hemoglobin (HbA1c), and insulin were examined. At the end of the experiment, the db/db mice displayed increased blood levels of glucose, HbA1C, and insulin compared with those in the db/m group (p < 0.001, p < 0.001, p < 0.001, respectively) (Figure 2B-D). EPE1-, EPE2-, and EPE3-treated db/db mice displayed a decrease in the blood levels of glucose (at 7 and 8 weeks of treatment) (Figure 2B), HbA1C, and insulin compared with those in the db/db group (Figure 2C,D). These data indicate that EPE treatment lower hyperglycemia and hyperinsulinemia, and reduced HbA1c, implying that EPE treatment could improve insulin resistance.
2.2.Renal Function
At the end of the experiment, the db/db mice displayed increased blood levels of BUN and creatinine compared with the db/m group (p < 0.001, p < 0.001, respectively). EPE1-, EPE2-, EPE3-, and aminoguanidine (AG)-treated db/db mice showed lower blood levels of BUN and creatinine than the db/db group (Figure 2E,F). At the end of the experiment, the db/db mice showed an increased urine volume, urine albumin, urine creatinine, and urine albumin creatinine ratio (UACR) compared with the db/m group (p < 0.001, p < 0.001, p < 0.001, p < 0.001, respectively) (Figure 2G−J). EPE1-, EPE2-, EPE3-, and AG-treated db/db mice showed lower levels of urine albumin and urine creatinine than the db/db group (Figure 2H,I). EPE2-, EPE3-, and AG-treated db/db mice exhibited a decrease in the levels of urine volume and UACR compared with levels in the db/db group (Figure 2G,J). At the end of the experiment, the db/db mice displayed increased urine levels of sodium ions, potassium ions, and chloride iron compared with those of the db/m group (p < 0.001, p < 0.001, p < 0.001, respectively) (Figure 2K−M). EPE3- and AG-treated db/db mice had decreased urine sodium ion and chloride ion levels compared with those in the db/db group (Figure 2K,M). EPE1-, EPE2-, EPE3-, and AG-treated db/db mice had significantly lower urine potassium ion levels than the db/db group (p < 0.001, p < 0.001, p < 0.001, p < 0.001, respectively) (Figure 2L).
2.2.Blood Levels of Inflammatory Cytokines
To clarify the effect of EPE on the inflammation induced nephritis, the various inflammatory cytokines kits were used. The db/db mice displayed increased blood levels of KIM-1, C-reactive protein (CRP), NLR family pyrin domain containing (NLRP3), interleukin (IL)-18, and TNF-α compared with those of the db/m group (p < 0.001, p < 0.001, p < 0.001, p < 0.001, and p < 0.001, respectively) (Figure 2N-R). EPE1-, EPE2-, EPE3-, and AG-treated db/db mice showed reduced blood levels of KIM-1, CRP, and NLRP3 compared with the levels in the db/db group (Figure 2N-P). EPE2-, EPE3-, and AG-treated db/db mice showed decreased blood levels of IL-18 and TNF-α compared with the levels in the db/db group (Figure 2Q,R). These data indicate that EPE treatment reduced kidney injury and inflammation.
2.2.Morphological and Immunohistochemical Analyses of the Kidney
To clarify the effect of EPE on the kidney glomerulus, the glomeruli were stained with periodic acid Schiff (PAS) stain. Histological PAS staining of the glomerular basement membrane revealed glomerular basement membrane thickening and mesangial expansion, as well as increased accumulation of ECM, in the db/db group compared with those in the db/m group. EPE1-, EPE2-, EPE3-, and AG-treated db/db mice showed not only reduced thickness of the glomerular basement membrane but also less mesangial matrix expansion compared with the db/m group (Figure 3A and B).
IHC staining revealed that EPE1-, EPE2-, EPE3-, and AG-treated db/db mice had increased nephrin expression levels compared with those of the db/db group (Figure 3C).
2.2.Target Gene Expression Levels by Western Blotting Analysis
As shown in Figure 4A and B, db/db mice showed decreased expression levels of p-PKCα/t-PKCα and nephrin, but increased expression levels of VEGF in the kidney compared with those of the db/m group (p < 0.001, p < 0.001, p < 0.001, respectively). EPE2-, EPE3-, and AG-treated db/db mice showed increased expression levels of p-PKCα/t-PKCα but reduced expression levels of VEGF in the kidney compared with the levels in the db/db group.
EPE1-, EPE2-, EPE3-, and AG-treated db/db mice had increased expression levels of nephrin in the kidney compared with those in the db/db group (p < 0.001, p < 0.001, p < 0.001, p < 0.001, respectively) (Figure 4A,B). The db/db mice showed increased expression levels of TGF-β1, collagen IV, and fibronectin in the kidney compared with those of the db/m group (p < 0.001, p < 0.001, p < 0.001, respectively) (Figure 4C,D). EPE2-, EPE3-, and AG-treated db/db mice had decreased expression levels of TGF-β1, collagen IV, and fibronectin in the kidney compared with the levels in the db/db group (Figure 4C,D). The db/db mice showed increased expression levels of p-Smad2/ t-Smad2, and p-Smad3/ t-Smad3 in the kidney compared with those of the db/m group (p < 0.001, p < 0.001, p < 0.001, respectively) (Figure 4E,F). EPE2-, EPE3-, and AG-treated db/db mice had decreased expression levels of p-Smad2/t-Smad2 and p-Smad3/t-Smad3 in the kidney compared with those in the db/db group (Figure 4E,F). The db/db mice showed increased expression levels of p-NLRP3/ t-NLRP3, intercellular adhesion molecule-1 (ICAM-1), and capalape-1 in the kidney compared with those of the db/m group (p < 0.001, p < 0.001, p < 0.001, respectively) (Figure 4G,H). EPE2-, EPE3-, and AG-treated db/db mice had decreased expression levels of p-NLRP3/t-NLRP3 and ICAM-1, and EPE3-treated db/db mice had reduced expression levels of capalase-1 in the kidney compared with those in the db/db group (Figure 4G,H).
2.Effects of the Seven Fractions of EPE on Targeted Gene Expression In Vitro
Following the animal study, we explored the main active ingredient of EPE and the expression levels of collagen IV, TGF-β1, VEGF, and KIM in Human Renal Mesangial (HRM) cells, which are responsible for its fibrogenesis, angiogenesis, and inflammatory effects, respectively. The preparation of seven fractions of EPE was described in a previous paper [25]. The fruits of Phyllanthus emblica (126.3 g) were extracted with methanol at 25ºC (3 × 7 d). The methanol extract was dried under vacuum, and the remaining sample (31.4 g) was obtained. The remaining sample was suspended in H2O and partitioned with EtOAc. The EtOAc-soluble fraction (5.6 g) was subjected to column chromatography on silica gel with a gradient of n-hexane and EtOAc as the mobile phase, and seven fractions were obtained [25]. The seven fractions of EPE (EA) are described as follows: 2%~10%, EA fraction 1 (EA-1); 10%~20%, EA fraction 2 (EA-2); 20%~30%, EA fraction 3 (EA-3); 30%~50%, EA fraction 4 (EA-4); 50%~70%, EA fraction 5 (EA-5); 70%~100%, EA fraction 6 (EA-6); and 100%, EA fraction 7 (EA-7). Figure 5A−E
shows that the glucose-treated groups had increased expression levels of Collagen IV, TGF-β1, VEGF, and KIM in comparison to the control group (p < 0.001, p < 0.001, p < 0.001, p < 0.001, respectively). EA-1, EA-4, EA-5, EA-6, and EA-7 significantly decreased the expression levels of collagen IV (Figure 5A,B). EA-3, EA-4, EA-5, EA-6, and EA-7 reduced the expression levels of TGF-β1 (Figure 5A,C). EA-4, EA-6, and EA-7 decreased the expression levels of KIM (Figure 5A,D).
2.Analysis of the EA-4 Fraction of EPE
Polyphenolic compounds were found in the EPE fraction in our recent publication [25,26]. Our previous study showed that the phenolic compounds found in EPE were gallic acid (3.28%), chebulagic acid (6.44%), and ellagic acid (2.23%) [26].
In this study, the polyphenolic compounds in the EA-4 sample were evaluated. The retention time for chebulagic acid, which was used as a reference compound to qualitatively and quantitatively analyze the EA-4 sample, was 14.447 min, as shown in Figure 5F−G. The major absorption peaks of phenolic acids were consistent with the photodiode array (PDA) spectra of the reference compound.
As shown in Supplementary Figure A−C, the main ingredient in EA-4 is the phenolic compound is chebulagic acid (54.4%).
Discussion
The fruit of the genus P. emblica L. have excellent effects on health care. Although, there are many methods for the treatment of DN. However, there is a lack of effective drugs for treating DN from throughout the disease course. The present study was designed to evaluate the protective effects of EPE on DN, to determine whether EPE can ameliorate renal dysfunction (including urine analyses, the measurement of inflammatory cytokine levels, and histological examination) and ameliorate fibrosis within the kidney and to clarify the underlying molecular mechanisms of action of EPE such as a secondary aim of examining the expression levels of PKCα in the kidney and its downregulation of VEGF and fibrosis genes TGF-β1 and Smads by Western blot analyses. The present study demonstrated that EPE treatment not only regulated urine volume but also lowered blood glucose, HbA1c, and insulin levels, suggesting that EPE could improve insulin resistance by modulating blood glucose and insulin levels in individuals with type 2 diabetes. Our findings showed that in db/db mice, overweight, hyperglycemia and hyperinsulinemia were induced, and plasma creatinine, urine creatinine, and the urine albumin creatine ratio (urine P/C ratio) and histological changes in the glomerular mesangial matrix were consistent with the findings of a previous study [23]. Moreover, the present study showed that db/db mice displayed higher plasma creatinine levels, urine creatinine levels, and urine albumin creatine ratios (urine P/C ratios) than db/m mice. Urinary albumin excretion may be a predictive factor for the prognosis of DN, and urinary albumin indicates impaired renal function [8,9], and the results of these studies demonstrated that EPE treatment decreased urinary albumin is associated with a kidney-protective effect in type 2 diabetes mellitus.
Activation of the diacylglycerol (DAG)-protein kinase C (PKC) pathway, enhancement of the polyol pathway, and overproduction of advanced glycation end products have all been proposed as potential cellular mechanisms by which hyperglycemia induces diabetic vascular complications [27]. PKC activation is also known to mediate several biological actions of VEGF, including its ability to increase capillary permeability [28]. Our findings showed that administration of EPE2 and EPE3 to db/db mice increased the expression levels of p-PKCα/t-PKCα but decreased the expression levels of VEGF in the kidney, thus contributing to a decrease in urinary albumin excretion.
DN is characterized by glomerular alterations in renal tissue, including glomerular basement membrane thickening and mesangial matrix expansion, leading to the development of glomerulosclerosis [29]. Increased mesangial cell proliferation and the accumulation of ECM components such as collagen in the glomeruli are characteristic pathologic features of early-stage DN [30]. These histological characteristics were detected in the PAS-positive mesangial matrix area of db/db mice. According to previous studies [27−30], our histological results showed that the administration of EPE to db/db mice decreased kidney glomerulus mesangial matrix expansion, and moreover, EPE reduced the expression levels of VEGF, TGF-β1, and collagen IV, suggesting that EPE could ameliorate kidney dysfunction and decrease urinary albumin in a mouse model.
Persistent albuminuria is a hallmark of DN that occurs with damage to glomerular podocytes. Podocytes make up the slit diaphragms that function as the final barrier against the flow of macromolecules into the urine [31]. It has been suggested that the initial stages of the loss of the permeability barrier in DN are associated with nephrin [6]. Nephrin, a 180 kDa transmembrane protein in podocytes, was the first molecule identified in the slit between podocyte foot processes and is a major component of the slit diaphragm [32]. Reduced nephrin levels may also lead to the development of proteinuria. Nevertheless, nephrin should be expressed in most glomeruli, and some previous studies have shown no noticeable manifestations within glomeruli [33,34]. The depletion of nephrin and podocin proteins in podocytes following glomerular injury causes severe proteinuria [35]. In the present study, histological analysis revealed that the administration of EPE to db/db mice increased the expression of nephrin and reversed the increase in the expression of nephrin in glomerular injury. This finding implies that EPE could effectively ameliorate renal dysfunction damage and albuminuria and that EPE may be a therapeutic option for preserving nephrin to slow nephropathy progression. Our findings showed that EPE could ameliorate the incidence of diabetic nephropathy, decrease renal inflammatory cytokines, and reverse the expression of nephrin within the kidney following kidney damage-induced proteinuria in db/db mice.
Inflammatory cytokines play a core role in the development and progression of DN [10]. NLR family pyrin domain containing 3 (NLRP3) undergoes oligomerization in the presence of the adaptor protein apoptosis-associated speck-like protein (ASC) and protease caspase-1 to form a protein complex termed the inflammasome. Inflammasome formation is important for the autoprocessing of caspase-1 and the activation of the cytokines pro-IL-1b and pro-IL-18 [36]. Mononuclear cell invasion and abnormal expression of inflammatory mediators, including intercellular adhesion molecule-1 (ICAM-1) and TGF-β1, are observed in renal tissues at early stages of DN [35]. Administration of EPE to db/db mice decreased blood levels of proinflammatory cytokines (including KIM-1, CRP, NLRP3, IL-1, and IL-18) and reduced the expression levels of p-NLRP3/t-NLRP3, ICAM-1, caspase-1, and TGF-β1 in the kidney. Renal inflammation and subsequent fibrosis are critical processes leading to end-stage DN [11,12]. Thus, EPE ameliorates renal inflammation through the inhibition of inflammatory cytokines in diabetic db/db mice, suggesting that EPE protects against DN-induced fibrosis and inflammation in type 2 diabetic db/db mice.
DN is a morbid microvascular complication associated with diabetes and is the most common cause of end-stage renal disease [1]. In DN, the accumulation of ECM components in the glomerular mesangium and tubulointerstitium causes early glomerular hypertrophy and eventually glomerulosclerosis and tubulointerstitial fibrosis [13]. TGF-β1 is another important factor in the pathogenesis of DN and mediates the inflammatory response, which exacerbates ECM secretion involving fibronectin and collagen accumulation and accelerates glomerulosclerosis in diabetes [16]. A previous study suggested that TGF-β1 mediates ECM accumulation in mesangial and tubular cells and that the suppression of TGF-β1 signaling significantly reduces renal fibrosis and decreases the mRNA levels of major mediators of ECM deposition in db/db mice [38]. TGF-β functions as a key regulator of fibrosis by promoting the accumulation of ECM. TGF-β induces the phosphorylation and activation of Smad signaling pathway components [15]. In the present study, the administration of EPE to db/db mice decreased the expression levels of VEGF and TGF-β1 in the kidney, as determined by Western blotting. The concentration of collagen IV increases with DN progression in patients and db/db mice [24]. Collagen IV accumulation is a crucial phenomenon underlying mesangial expansion [14]. The mesangial expansion and glomerular fibrosis observed in db/db mice may result from molecular changes within the renal tissue, including the activation of various proinflammatory cytokines and growth factors [39]. In the present study, we used aminoguanidine (AG) as a comparative drug since aminoguanidine (AG) is an investigational drug for the management of diabetic nephropathy, although it has side effects [40]. In the present study, histological PAS staining of the glomerular basement membrane revealed glomerular basement membrane thickening and mesangial expansion, as well as increased ECM accumulation, in the db/db group compared with the db/m group. Compared with those in the db/m group, the glomerular basement membrane thickness in the EPE- and AG-treated db/db groups was reduced, and mesangial matrix expansion was ameliorated. Moreover, EPE treatment decreased the renal expression levels of p-Smad-2 and p-Smad-3, reduced the expression levels of fibronectin and collagen IV, and decreased TGF-β1/Smad activation, which were associated with the inhibition of ECM accumulation and tubulointerstitial fibrosis, thus contributing to the suppression of severe renal fibrosis and a decrease in the cumulative incidence of diabetic nephropathy in 20-week-old db/db mice.
Following the animal study, we attempted to identify the main constituent of EPE by fractioning EPE into seven fractions, and our previous in vitro findings showed that EA-6 has the greatest effect on Akt phosphorylation and membrane GLUT4 expression, which play a core role in diabetic target gene pathogenesis [25]. In this previous HPLC analysis study showed that the EA-6 fraction of EPE yielded >33.4% of the total polyphenol gallic acid extracted and that this fraction represented the main component responsible for the antidiabetic activity of EPE in NOD with spontaneous and cyclophosphamide-accelerated Type 1 diabetic mice [25]. The phenolic compounds found in EPE were gallic acid (3.28%), chebulagic acid (6.44%), and ellagic acid (2.23%) in streptozotocin-induced Type 1 diabetic mice [26].
To clarify the main components responsible for the amelioration of DN status of EPE, we analysis the expression levels of collagen IV, TGF-β1, VEGF, and KIM in HRM cells, which are responsible for its fibrotic, angiogenic, and inflammatory effects within the kidney, respectively. Our previous studies [25,26] showed that the main ingredient of EA-6 was gallic acid. Recently, our submitted report (submitted Ecam manuscript ID:7802863) showed the main ingredient of EA-4 was chebulagic acid (Supplementary Figure A−C). Chebulagic acid accounted for >54.4% of the total polyphenolic compounds extracted. Chebulagic acid has an antiangiogenic effect that is associated with VEGFR2 signaling pathway inhibition [41]. In the present study, our findings showed that EA-4 and EA-6 displayed the greatest decreases in expression levels of collagen IV and TGF-β1 for anti-fibrotic activity in vitro, and EA-4 and EA-6 displayed the greatest decreases in expression levels of VEGF for anti-angiogenic activity, and EA-4 and EA-6 displayed the greatest decreases in expression levels of KIM for renal anti-inflammatory activity. An explanation for EPE’s protective activity from diabetic nephropathy is that the major constituents of fruit extract contains total polyphenol component’s gallic acid and chebulagic acid display the majority of anti-inflammatory, anti-fibrotic, and anti-angiogenic activity, and the indirect modulation of inflammatory cytokines and mutual restraint and suppression of nephritis and fibrosis, and proteinuria, thus contributing to the preventive effects of EPE on DN status for the early stage to the end stage.
Materials and Methods
4.Chemicals
Antibodies against Smad-2 (no. GTX111075), Smad-3 (no. GTX34208), Smad-4 (no. GTX112980), phospho-Smad2 (Ser250) [GT1291] (no. GTX03203), and phospho-Smad3 (Ser423/425) (no. GTX129841) were obtained from GeneTex International Corporation (East Dist., Hsinchu City, Taiwan). Mouse VEGF164 antibody (AF-493-NA) (antigen affinity-purified polyclonal goat IgG) was obtained from R&D Systems Biotechnology (Minneapolis, MN, USA). Antibodies against nephrin (sc-32530), ICAM-1/CD54 (sc-8439), MCP-1 (sc-32771), ASC (sc-271054), and caspase-1 (sc-56036) were obtained from Santa Cruz Biotechnology, Inc. (Dalla, TX, USA). Mouse VEGF164 antibody (AF-493-NA) (antigen affinity-purified polyclonal goat IgG) was obtained from R&D Systems Biotechnology (Minneapolis, MN5541, USA). An antibody against TGF-β1 (MA5-15065) was obtained from Invitrogen, Inc. (Carlsbad, CA, USA). A mouse NLRP3/NALP3 monoclonal antibody (MBS6002814) and an NLRP3 polyclonal antibody (phospho-Ser295) (MBS9430199) were purchased from MyBioSource, Inc. (San Diego, CA, USA). Antibodies against β-actin (8H10D10) (no. 3700), phospho-PKCα/β II (Thr638/641) (no. 9375), and PKCα (no. 2056) were obtained from Cell Signaling Technology Inc. (Beverly, MA, USA). horseradish peroxidase (HRP)-conjugated goat anti-mouse IgG (H+L)-AP (TAAB01) was obtained from BIOTnA (Kaohsiung, Taiwan). 3,3’-diaminobenzidine tetrahydrochloride (D7304-1SET, DAB) was obtained from Millipore (Bedford, USA).
4.Preparation of the Ethyl Acetate Extract of Phyllanthus emblica L. (EPE)
Fruits of Phyllanthus emblica L. (Figure 1A) were purchased from Taiwan Miaoli County, Ogan marketing cooperation. These fruits were identified by China Medical University, Taiwan, and the voucher specimen (CMPF385) was replaced. Fruits of P. emblica L. (Figure 1) were purchased from Taiwan Miaoli County, Ogan Marketing Cooperation. A total of 7.3 kg of fruits of Phyllanthus emblica L. (Figure 1) was dried and pulverized into 1.34 kg of fine powder. This procedure was performed as described in our previous study [25,26]. The fine powder was extracted with methanol three times and concentrated, and then the crude methanolic extract was subjected to suspension in H2O and partitioning with EtOAc, and then the H2O fraction and the EtOAc fraction were obtained. The EtOAc fraction was used for the animal study [25,26].
4.Cell Culture and Assessment of the Expression Levels of TGF-β1 and Collagen IV in Human Renal Mesangial (HRM) Cells
Human renal mesangial Cells (HRMC) (no. 4200; ScienCell, USA) lysates were treated with 1 μg/mL, 5 μg/mL, or 10 μg/mL EPE for 24 h, and then the cells were collected to examine the expression levels of TGF-β1 and collagen IV. The culture procedure consisted of culturing HRM cell lysates in DMEM containing 25 mmol/L glucose and 10% FBS, which resembles the diabetic hyperglycemic environmental state. Human renal mesangial cells treated with EPE in high-glucose conditions were subjected to Western blot analyses with primary antibodies against TGF-β1 and collagen IV. The protein concentration was analyzed via the BCA assay (Pierce), and equal amounts of protein were then diluted with 4× diluted SDS sample buffer and subjected to SDS‒PAGE. Density blotting was performed as described in previous reports [42,43].
4.Animal Treatment
Forty male db/db mice (BKS. Cg-m+/+LeprdbNJU) and eight male age-matched nondiabetic db/m (C57BL/6J Lepr) mice were purchased from the National Laboratory Animal Breeding Center at 11 weeks of age. All mice were handled under the guidepost of the school and according to the guidelines of the Animal Ethics Committee (approval no. 110-CTUST-014) and the welfare-related assessments were ensued and a particular small sample size in each group was determined. All mice were randomly divided into 6 groups (n=8 per group; total number=48) as follows. Group I: db/m mice were treated with vehicle. After one week of acclimation, forty db/db mice were randomly divided into the following 5 groups: group II, the db/db control group, in which diabetic mice were given the same volume of distilled water orally; groups III, IV, V, and VI, in which diabetic mice were orally given 100, 200, or 400 mg/kg EPE (which are referred to as EPE1, EPE2, and EPE3, respectively); and group VI, in which diabetic mice were orally given aminoguanidine (AG) (20 mg/kg). Treatments were given orally once daily in the morning for 8 weeks. After 10 h of fasting, blood was obtained from the retro-orbital sinuses of the mice for the assessment of glucose concentrations. All procedures (such as the collection of peripheral organs and analysis of biochemical parameters and cytokines) were performed as described in previous studies [42−45]. Twenty-four hours before the end of the experiment, urine samples were collected, and the urine volume was recorded.
4.4.Collection of Plasma, Urine, and Kidney Samples
After 8 weeks of treatment, blood and kidney samples were collected. The kidneys and adipose and liver tissues were dissected according to defined anatomical landmarks. The weights of kidney, adipose and liver tissues were measured. Visceral fat was defined as the sum of epididymal white adipose tissue and retroperitoneal white adipose tissue, and then all tissue including kidney tissues were immediately stored at -80 °C until use. Then, the plasma was obtained from the coagulated blood by centrifugation at 1600 × g for 15 min at 4 °C and immediately frozen at -80 °C until use.
4.4.Measurements of Blood Glucose, Insulin, and HbA1C Levels
Blood samples were obtained from the retro-orbital sinus of 12-h fasted mice. Blood glucose levels were measured by the glucose oxidase method by Glucose membrane kit (YSI2365-1, GlaxoSmithKline Pharmaceuticals Ltd., Middlesex, UK), and insulin levels by mouse Insulin ELISA kit (no. 10-1113-01, Mercodia, Uppsala, Sweden) were measured by commercial enzyme-linked immunosorbent assay (ELISA) kits according to the manufacturer’s instructions as previous procedures [25,26]. Blood percent HbA1c was measured with a Hemoglobin A1C kit (BioSystems S.A., Barcelona, Spain).
4.4.Analysis of Blood Inflammatory Cytokine Levels
Blood samples were obtained from the retro-orbital sinus of 12-h fasted mice. Blood inflammatory cytokine levels were measured by a commercial mouse C-reactive protein (CRP) ELISA kit (LS-F4264, LSBIO, Ltd., Seattle, WA, USA), a commercial mouse KIM-1 ELISA kit (LS-F24859, LSBIO, Ltd., Seattle, WA, USA), and a mouse NALP3/NLRP3 ELISA kit (no. LS-F32087, LSBIO, Ltd.) according to the manufacturer’s instructions.
4.4.Determination of Renal Function
Mice were maintained in separate metabolic cages for two days at the end of the experiment for the collection of urine samples for 24 hours (from 2:00 P.M.to 2:00 A.M.) for the determination of urine volume, water and food intake, and ion concentrations. Urine samples were adapted to examine the levels of ions (including sodium ions, potassium ions, and chloride ions). A portion of the blood and urine samples was used to assess the BUN concentrations and plasma levels of creatinine (no. 99-0013052) both in urine and blood using a Catalyst One chemistry analyzer (IDEXX Laboratories, Westbrook, ME, USA) and commercial kits according to the manufacturer’s instructions. Urinary albumin excretion was determined by a mouse urinary albumin ELISA kit (No. MBS3806806) from MyBioSource, Inc. (San Diego, CA, USA), and creatinine levels were examined with a mouse creatinine assay kit (MBS763433) from MyBioSource, Inc. (San Diego, CA, USA); then, the urine albumin creatine ratio (UACR; urine P/C ratio) was calculated.
4.4.Morphological and Immunohistochemical Staining
For the evaluation of the glomerular basement membrane and mesangial expansion in the kidney, kidney slices were stained with a periodic acid Schiff (PAS) stain kit (TASS01-250; BIOTnA, Kaohsiung, Taiwan) followed by counterstaining with hematoxylin (TA01NB; BIOTnA, Kaohsiung, Taiwan) according to the manufacturer’s instructions.
For immunohistochemical staining, kidney sections were stained with an anti-nephrin antibody (1:500 dilution) [28] at 4 °C overnight. This procedure was performed as described in a previous study [25]. Afterward, the sections were stained with a horseradish peroxidase-conjugated goat anti-mouse IgG (H+L)-AP secondary antibody (1:1000 dilution) at room temperature for 2 h. Immunoreactive areas were detected by 3,3’-diaminobenzidine tetrahydrochloride followed by counterstaining with hematoxylin (TASS17; BIOTnA, Kaohsiung, Taiwan). Digital images were taken with a microscope (OLYMPUS model: BX53 microscope), OLYMPUS model: D28 camera, and OLYMPUS cellScens Image Software at 10 (ocular) × 20 (object lens) magnification.
4.4.Western Blotting Assay
Kidney tissues were immediately removed and quickly homogenized with RIPA buffer (Sigma, St. Louis, MO, USA) prior to Western blotting. Kidney samples were separated on 4-12% Bis Tris gradient gels (Life Technologies, Carlsbad, USA) and then transferred to a membrane, followed by the addition of the following primary antibodies at 4 °C overnight: an anti-nephrin antibody (1:500 dilution); antibodies against Smad-2, Smad-3, Smad-4, phospho-Smad2 (Ser250), phospho-Smad3, collagen IV, VEGF164, TGF-β1, MCP-1, ASC, caspase-1, NLRP3/NALP3 monoclonal antibody, NLRP3 (phospho-Ser295) polyclonal antibody, CASP1 antibody, and antibodies against β-actin, phospho-PKCα/β II (Thr638/641), and PKCα. Then, the sections were incubated with the following secondary antibody at room temperature for 2 h: HRP-conjugated goat anti-mouse IgG (H+L)-AP (1:1000 dilution; TAAB01, BIOTnA, Kaohsiung, Taiwan). Immunospecific proteins were detected by Enhanced Chemiluminescent (ECL) (EMD Millipore, Garmmy) HRP Substrate, and then the PVDF membrane was transferred into the Chemiluminescent electrical gel analysis system (MultiGel-21; TOPBIO) and the images were taken as described in previous studies [42,43,44,45].
4.Analysis of the Effects of the Seven Fractions of EPE on Targeted Gene Expression In Vitro
Following the animal study, we aimed to explore the main component of EPE responsible for its functional activities. Since collagen IV, TGF-β1, KIM, and VEGF play a critical role in the molecular mechanisms of diabetic nephropathy from the early stage inflammation to fibrogenesis, and angiogenesis, and thus cell culture analysis of the expression of KIM (no. ab47635; Abcam (Cambridge, CB2 0AX, UK)), collagen IV (no. 75087s; Cell Signaling Technology (Beverly, USA)), TGF-β1 (no. 3709ss; Cell Signaling Technology), and VEGF (no. 2463s; Cell Signaling Technology) was performed using Western blotting with antibodies specific for these proteins to clarify the anti-fibrotic, anti-inflammatory, and anti-angiogenic activity in diabetic nephropathy. Human Renal Mesangial Cells (HRMC) (no. 4200, ScienCell, USA) were cultured in Mesangial Cell Medium (MsCM) (no. 4201, ScienCell, USA) containing 25 mmol/L glucose and 10% FBS. Under the normal culture condition or the containing 25 mmol/L glucose FBS MsCM cell lysates or the individual fractions of 20 μmol /L of ethyl acetate from P. emblica (including EA-1~EA-7), and followed by 24 hours after the stimulating HRM cell, and the cells were collected to analysis the expression levels of collagen IV, TGF-β1, KIM, and VEGF by Western blotting. The seven fractions were prepared as previously described [25]. The fruits of Phyllanthus emblica (126.3 g) were extracted with methanol at 25 °C (3 × 7 d).
4.Chemical and HPLC analyses
4.6.Fingerprint Analysis by HPLC
The analysis was performed on a HITACHI high-performance liquid chromatographic (HPLC) L-5000 system equipped with a degasser, pumps, and a photodiode array detector linked to a PC computer running the software program HPLC LACHROM as described in our previous paper [25].
4.6.Determination of Phenolic Compound Contents
The method was performed according to a previous report [25]. The mobile phase contained acetonitrile (solvent A) and acidified water with trifluoroacetic acid (0.05%, solvent B) as described in a previous paper [25]. This analysis was designed to examine whether polyphenolic compounds (including gallic acid, chebulagic acid, and ellagic acid) were found in the EPE fraction.
4.Statistical Analysis
The results were analyzed by SPSS software (SPSS Inc., Chicago, IL, USA), and nonparametric analysis was performed via the Kruskal‒Wallis H test, followed by the Mann‒WhitneyU test. The results are presented as the means and standard errors. Ap value less than 0.05 was considered to indicate statistical significance.
Conclusions
In conclusion (Figure 6), the present study demonstrated that EPE treatment not only regulated urine volume but also lowered blood glucose, HbA1c, and insulin levels, suggesting that EPE could improve insulin resistance by modulating blood glucose and insulin levels in individuals with type 2 diabetes.
EPE treatment could improve renal dysfunction and reduce proteinuria by reversal of Nephrin expressions and regulating PKCα activation and VEGF expression and suppressing glomerular basement membrane thickening and mesangial matrix expansion, but also reduce inflammatory cytokines, thus contributing to a decrease in ECM accumulation. The present study clearly demonstrated the protective effects and molecular mechanisms of EPE in a mouse model of DN (db/db mice), and the findings further suggested that chebulagic acid is the main component of EPE responsible for its antiangiogenic effect of VEGF suppression, which contributes to its ability to ameliorate DN. Therefore, chebulagic acid may be a DN treatment candidate throughout the disease course in humans. These results suggest that EPE could improve kidney function. In conclusion, EPE treatment ameliorated diabetic nephropathy in db/db mice.
Supplementary Materials
The following supporting information can be downloaded at the website of this paper posted on Preprints.org.
Author Contributions
C.-C.S. designed and performed the experiments including of animal study, Western blotting, and wrote the manuscript; C.-H.L. performed the morphology and immunohistochemistry, and biological analyses. All authors approved the final manuscript.
Funding
Financial support for this study was provided by MOST 111-2320-B-166-001- form Ministry of Science and Technology (now: National Science and Technology Council), Taipei, Taiwan, ROC. The funders had no role in the design of the study; in the collection, analyses, or interpretation of data; in writing of the manuscript, or in the decision to publish the results.
Conflicts of Interest
The authors declare no conflicts of interest.
Abbreviations
AG, Aminoguanidine; ASC, adaptor protein apoptosis-associated speck-like protein; BUN, blood urea nitrogen; CRP, C-reactive protein; DN, diabetic nephropathy; ELISA, enzyme-linked immunosorbent assay; ESI, electrospray ionization; EPE, ethyl acetate extract of Phyllanthus emblica L.; EWAT, epididymal white adipose tissue; HbA1c, glycated hemoglobin; HPLC, high-performance liquid chromatographic; HRP, horseradish peroxidase; ICAM-1, intercellular adhesion molecule-1; IL, interleukin; KIM-1, kidney injury molecule-1; MCP-1, monocyte chemoattractant protein; NLRP3, NLR family pyrin domain containing 3; PAS, periodic acid Schiff; PDA, photodiode-array; PKCα, protein kinase Cα; RWAT, retroperitoneal white adipose tissue; TGF-β1, transforming growth factor-β1; UACR, urine albumin creatine ratio; SMAD, Sma and mad protein; TGF-β1, transforming growth factor-β1; VEGF, vascular endothelial growth factor; WAT, white adipose tissue.
References
- Gilbert, R.E.; Cox, A.; Dziadek, M.; Cooper, M.E.; Jerums, G. Extracellular matrix and its interactions in the diabetic kidney: A molecular biological approach. J. Diabetes Complicat. 1995, 9, 252−254. [CrossRef]
- Collins, A.J.; Kasiske, B.; Herzog, C.; Chavers, B.; Foley, R.; Gilbertson, D.; et al. United States Renal System 2006 Annual Data Report. Am J Kidney Dis 2007, 49, S1−S234.
- Sarnak, M.J.; Levey, A.S.; Schoolwerth, A.C.; Coresh, J.; Culleton, B.; Hamm, L.L.; et al. Kidney disease as a risk factor development of cardiovascular disease: A statement from the American Heart Association Councils on kidney in cardiovascular disease, high blood pressure research, clinical cardiology, and epidemiology and prevention. Circulation. 2003, 108, 2154−2169.
- Ismail, N.; Becker, B.; Strzelczyk, P.; Ritz, E. Renal disease and hypertension in non-insulin-dependent diabetes mellitus. Kidney Int. 1999, 55, 1−28. [CrossRef]
- Bailey, R.A.; Wang, Y.; Zhu, V.; Rupnow, M.F.T. Chronic kidney disease in US adults with type 2 diabetes: An updated national estimate of prevalence based on kidney disease: Improving global outcomes (KDIGO) staging. BMC Res Notes 2014, 7, 415. [CrossRef]
- Aaltonen, P.; Luimula, P.; Astrӧm, E.; Palmen, T.; Grӧnholm, T.; Palojoki, E.; et al. Changes in the expression of nephrin gene and protein in experimental diabetic nephropathy. Lab Invest. 2001, 81, 1185−1190. [CrossRef]
- Cheng, Y.H.; Park, H.; Jung, I.H.; Chae, Y.N.; Kim, T.H.; Lww, B.R.; Kim, M.K. A dipeptidyl peptidase inhibitor, evogliptin, directly prevents nephrin loss and podocyte damage via post-transcriptional regulation. Diabetes Updates 2020, 6, 1−11.
- Chao, C.Y.; Mong, M.C.; Yin, M.C. Anti-glycative and anti-inflammatory effects of caffeic acid and ellagic acid in kidney of diabetic mice. Mol. Nutri. Food Res. 2010, 54, 388−395. [CrossRef]
- Chen, H.; Charlat, O.; Tartaglia, L.A.; Woolf, E.A.; Weng, X.; Ellis, S.J.; Lakey, N.D. Evidence that the diabetes gene encodes the leptin receptor: Identification of a mutation in the leptin receptor gene in db/ db mice. Cell 1996, 84, 491−495. [CrossRef]
- Duran-Salgado, M.B.; Rubio-Guerra, A.F. Diabetic nephropathy and inflammation. World J Diabetes. 2014, 5(3), 393−398.
- Nagai, C.L.; Arai, H.; Yanagita, M.; Matsubara, T.; Kanamori, H.; Nakano, T.; Iehara, N.; Fukatsu, A.; Kita, T.; Doi, T..; Growth arrest-specific gene 6 is involved in glomerular hypertrophy in the early stage of diabetic nephropathy. J. Biol. Chem. 2003, 278, 18229−18234. [CrossRef]
- Lin, C.L.; Hsu, Y.C.; Lee, P.H.; Lei, C.C.; Wang, J.Y.; Huang, Y.T.; Wang, S.Y.; Wang, F.S. Cannabinoid receptor 1 disturbance of PPAR2 augments hyperglycemia induction of mesangial inflammation and fibrosis in renal glomeruli. J. Mol. Med. 2014, 92, 779−792.
- Glibert, R.E.; Cox, A.; Wu, L.L.; Allen, T.J.; Hulthen, U.L.; Jerums, G.; Cooper, M.E. Expression of transforming growth factor-beta1 and type IV collagen in the renal tubulointerstitium in experimental diabetes: Effects of ACE inhibition. Diabetes 1998, 47, 414−422. [CrossRef]
- Collagen-Twigg, S.M.; Joly, A.H.; Chen, M.M.; Tsubaki, J.; Kim, H.S.; Hwa, V.; Oh, Y.; Rosenfeld, R.G. Connective tissue through factor/ IGF-binding protein-related protein-2 is a mediator in the induction of fibronectin by advanced glycosylation end-products in human dermal fibroblasts. Endocrinology 2002, 143, 1260−1269. [CrossRef]
- Leask, A.; Abraham, D.A. TGF-beta signaling and the fibrotic response. FASEB J. 2004, 18, 816−817.
- Dong, F.Q.; Li, H.; Cai, W.M.; Tao, J.; Li, Q.; Ruan, Y.; Zheng, F.P.; Zhang, Z. Effects of pioglitazone on pressions of matrix metalloproteinases 2 and 9 in kidneys of diabetic rats. Clin. Med. J. 2004, 117, 1040−1044.
- Oliver J.A. Adenylate cyclase and protein kinase C mediate opposite actions on endothelial junctions. J Cell Physiol. 1990, 145(3), 536−542. [CrossRef]
- Lynch, J.J.; Ferro, T.J.; Blumenstock, F.A.; Brockenauer, A.M.; Malik, A.B. Increased endothelial albumin permeability mediated by protein kinase C activation. J Clin Invest. 1990, 85(6), 1991−1998. [CrossRef]
- De Vriese, A.S.; Tilton, R.G.; Elger, M.; Stephan, C.C.; Kriz, W.; Lameire, N.H. Antibodies against vascular endothelial growth factor improve early renal dysfunction in experimental diabetes. J Am Soc Nephrol 2001, 12, 993−1000. [CrossRef]
- Flyvbjerg, A.; Dagnaes-Hansen, F.; De Vriese, A.S.; Schrijvers, B.F.; Tilton, R.G.; Rasch, R. Amelioration of long-term renal changes in obese type 2 diabetic mice by a neutralizing vascular endothelial growth factor antibody. Diabetes 2002, 51, 3090–3094. [CrossRef]
- Schrijvers, B.F.; Flyvbjerg, A.; De Vriese, A.S. The role of vascular endothelial growth factor (VEGF) in renal pathophysiology. Kidney Int. 2004, 65, 2003−2017. [CrossRef]
- Adams, L.A.; Angulo, P. Role of liver biopsy and serum markers of liver fibrosis in non-alcoholic fatty liver disease. Clin. Liver Dis. 2007, 11, 25−35. [CrossRef]
- Adler, S. Structure-function relationships associated with extracellular matrix alternations in diabetic glomerulopathy. J. Am. Soc. Nephrol. 1994, 5, 1165−1172.
- Hattori, T.; Fujitsuka, N.; Kurogi, A.; Shindo, S. Sairei-to may inhibit the synthesis of endothelin-1 in nephritic glomeruli. Nippon Jinzo Gakkai Shi 1997, 39, 121−128.
- Lin, C.H.; Kuo, Y.H.; Shih, C.C. Antidiabetic and immunoregulatory activities of extract of Phyllanthus emblica L. in NOD with spontaneous and cyclophosphamide-accelerated diabetic mice. Int. J. Mol. Sci. 2023, 24, 9922. [CrossRef]
- Huang, S.M.; Lin, C.H.; WF Chang, W.F.; Shih, C.C. Antidiabetic and antihyperlipidemic activities of Phyllanthus emblica L. extract in vitro and the regulation of Akt phosphorylation, gluconeogenesis, and peroxisome proliferator-activated receptor α in streptozotocin-induced diabetic mice. Food Funct Res 2023, 67, 9854.
- Noh, H.; King, G.L. The role of protein kinase C activation in diabetic nephropathy. Kidney Int Supple. 2007, 106, S49−53. [CrossRef]
- Aiello, L.P.; Bursell, S.-E.; Clermont, A.; Duh, W.; Ishii, H.; Takagi, C.; et al. Vascular endothelial growth factor-induced retinal permeability is mediated by protein kinase C in vivo and suppressed by an orally effective b-isoform-selective inhibitor. Diabetes. 1997, 46(9), 1473−1480. [CrossRef]
- Sohn, E.; Kim, J.; Kim, C.S.; Jo, K.; Kim, J.S. Osteomeles schwerinae extract prevents diabetes-induced renal injury in spontaneously diabetic Torii rats. Evid. Based Complement. Alternat Med. 2018, 2018, 6824215. [CrossRef]
- Cove-Smith, A.; Hendry, B.M. The regulation of mesangial cell proliferation. Nephron Exp. Nephrol. 2008, 108, e74−e79. [CrossRef]
- Siddiqi, F.S.; Advani, A. Endothelial-podocyte crosstalk: The missing link between endothelial dysfunction and albuminuria in diabetes. Diabetes 2013, 62, 3647−3655. [CrossRef]
- Tryggvason, K. Unraveling the mechanisms of glomerular ultrafiltration: Nephrin, a key component of the slit diaphragm. J Am Soc Nephrol. 1999, 10, 2440−2445.
- Sohn, E.J.; Kim, C.S.; Lee, Y.M.; Jo, K.H.; Shin, S.D.; Kim, J.H.; Kim, J.S. The extract of Litsea japonica reduced the development of diabetic nephropathy via the inhibition of advanced glycation end products accumulation in db/ db mice. Evid. Based Complement. Alternat Med. 2013, 2013, 769416. [CrossRef]
- Xue, R.; Zhai, R.; Xie, L.; Zheng, Z.; Jiang, G.; Chen, T.; et al. Xuesaitong protects podocytes from apoptosis in diabetic rats through modulating PTEN-PDK1-Akt-mTOR pathway. J. Diabetes Res. 2020, 2020, 9309768.
- Ruotasalainen, V.; Ljungberg, P.; Wartiavaara, J.; Lenkkeri, U.; Kestilä, M.; Jalanko, H.; Holmberg, C.; Tryggvason, K. Nephrin is specifically located at the slit diaphragm of glomerular podocytes. Proc. Natl. Acad. Sci. USA 1999, 96, 7962−7967. [CrossRef]
- Vilasane, A.; Chun, J.; Seamone, M.E.; Wang, W.; Chin, R.; Hirota, S.; Li, Y.; Clark, S.A. The NLRP3 inflammasone promotes renal inflammation and contributes to CKD. J. Am. Soc. Nephrol. 2010, 21, 1732−1744.
- Miyatake, N.; Shikata, K.; Sugimoto, H.; Kushiro, M.; Shikata, Y.; Ogawa, S.; Hayashi, Y.; Miyasaka, M.; Makino, H. Intracellular adhesion molecule 1 mediates mononuclear cell infiltration into rat glomeruli after renal ablation. Nephron 1998, 79, 91−98.
- Du, N.; Xu, X.; Gao, M.; Liu, P.; Sun, B.; Cao, X. Combination of Ginsenoside Rg1 and Astragaloside IV reduces oxidative stress and inhibits TGF-β1/Smads signaling cascade on renal fibrosis in rats with diabetic nephropathy. Drug Des. Dev. Ther. 2018, 12, 3517−3524.
- Hiragushi, K.; Sugimoto, H.; Shikata, K. Nitric oxide system is involved in glomerular hyperfiltration in Japanese normo- and micro-albuminutric patients with type 2 diabetes. Diabetes Res. Clin. Pract. 2001, 53, 149−159.
- Yoon J.J.; Park, J.H.; Lee, Y.J.; Kim, H.Y.; Han, B.H.; Jin, H.G.; Kang, D.G.; Lee, H.S. Protective effects of ethanolic extract from Rhizome of Polygoni avicularis against renal fibrosis and inflammation in a diabetic nephropathy model. Int. J. Mol. Sci. 2021, 22, 7230. [CrossRef]
- Athira, A.P.; Abhinand, C.S.; Saja, K.; Helen, A.; Reddanna, P.; Sudhakaran, P.R. Anti-angiogenic effect of chebulagic acid involves inhibition of the VEGFR2- and GSK-3β-dependent signaling pathways. Biochem. Cell Biol. 2017, 95, 563−570. [CrossRef]
- Wu, J.B.; Kuo, Y.H.; Lin, C.H.; Ho, H.Y.; Shih, C.C. Tormentic acid, a major component of suspension cells of Eriobotrya japonica, suppresses high-fat diet-induced diabetes and hyperlipidemia by glucose transporter 4 and AMP-activated protein kinase phosphorylation. J. Agric. Food Chem. 2014, 62 (44), 10717−10726. [CrossRef]
- Lin, C.H.; Wu, J.B.; Jian, J.Y.; Shih, C.C. (−)-Epicatechin-3-O-β-D-allopyranoside from Davallia formosana prevents diabetes and dyslipidemia in streptozotocin-induced diabetic mice. PLoS ONE 2017, 12(3), e0173984. [CrossRef]
- Lin, C.H.; Shih, Z.Z.; Kuo, Y.H.; Huang, G.J.; Tu, P.C.; Shih, C.C. Antidiabetic and antihyperlipidemic effects of the flower extract of Eriobotrya japonica in streptozotocin-induced diabetic mice and the potential bioactive constituents in vitro. J. Funct. Foods 2018, 49, 122−136. [CrossRef]
- Lin, C.H.; Hsiao, L.W.; Kuo, Y.H.; Shih, C.C. Antidiabetic and antihyperlipidemic effects of sulphurenic acid, a triterpenoid compound from Antrodia camphorata, in streptozotocin-induced diabetic mice. Int. J. Mol. Sci. 2019, 20(19), 4897; [CrossRef]
Figure 1.
The targeted genes effects of Ethyl acetate extract of Phyllanthus emblica L. (EPE) in human renal mesangial cell lysates by Western blot analysis with a primary antibody against TGF-β1 and Collagen IV. (A) Fruits of Phyllanthus emblica L.; (B) Representative blots in human renal mesangial cells; (C~D) Quantification of the expression levels of TGF-β1 and Collagen IV. All values are means ± S.E. +++ p < 0.001 compared with the control group; * p < 0.05, *** p < 0.001 compared with the HG group. The β-actin was used as the internal standard in each sample. HG: high glucose. EPE: Ethyl acetate extract of Phyllanthus emblica L.
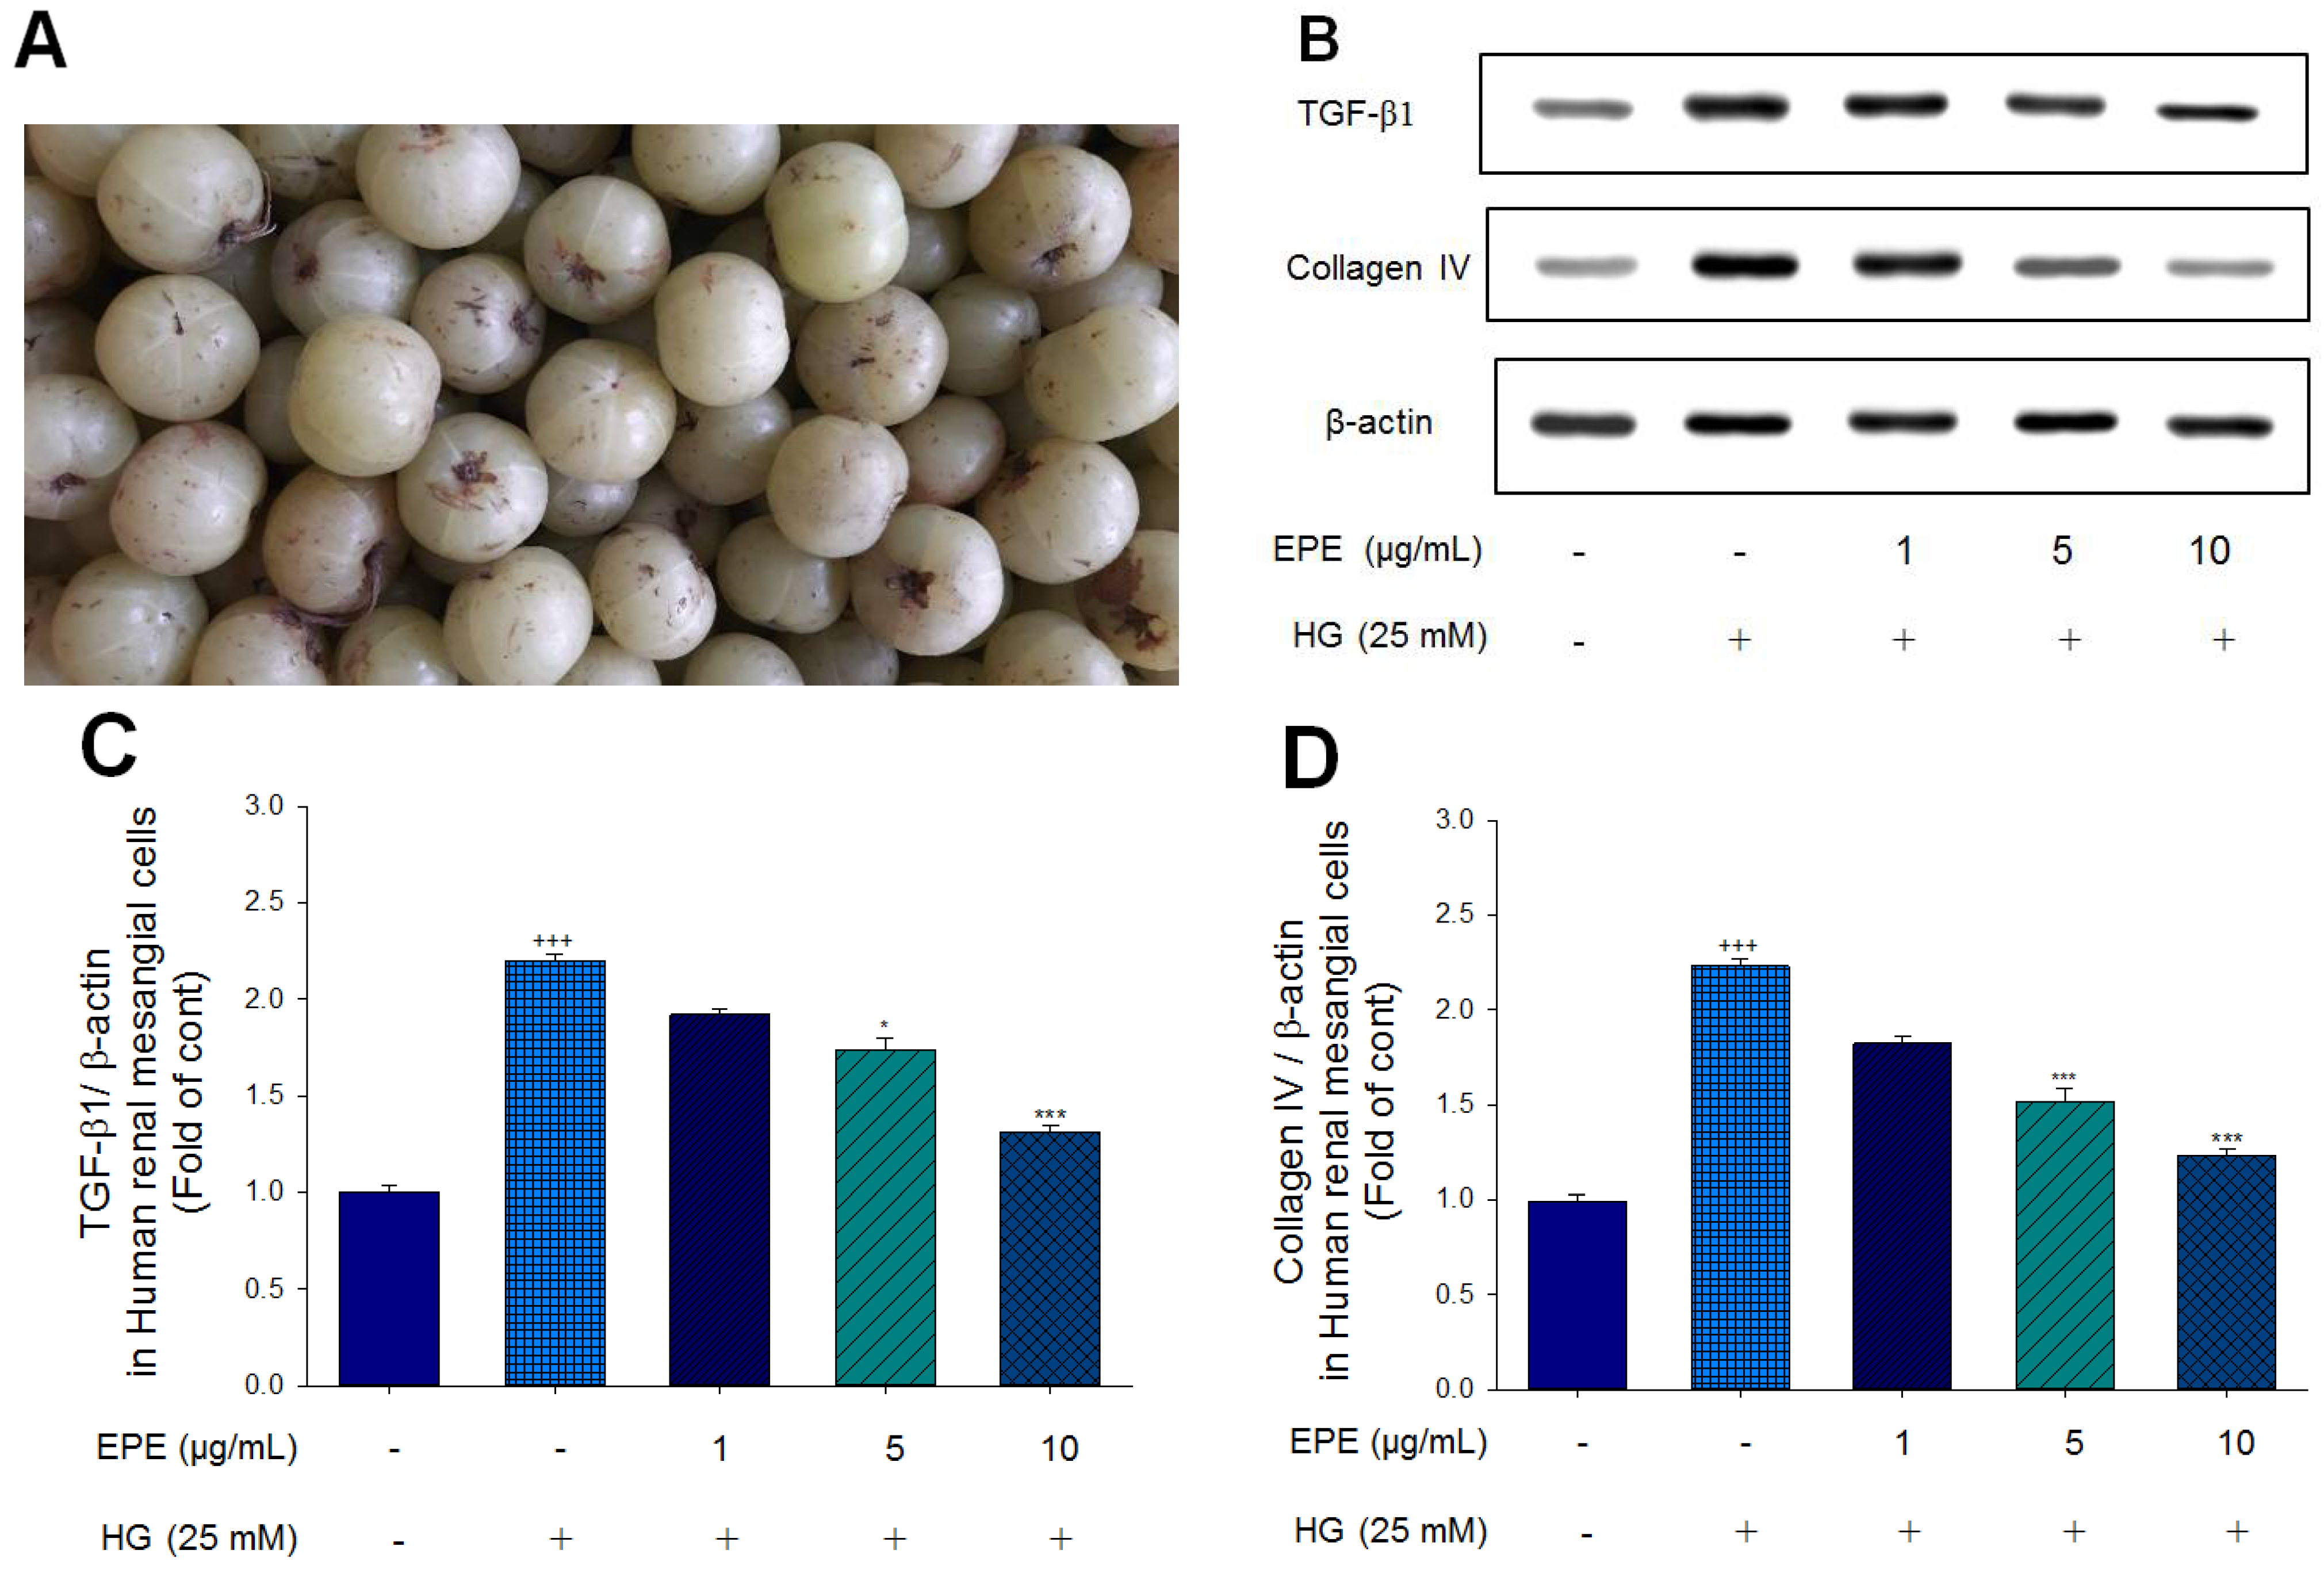
Figure 2.
Effects of ethyl acetate extract of Phyllanthus emblica L. (EPE) in db/db mice. P# # #<0.001 compared with the db/m group; P**<0.01, P***<0.001 compared with the db/db + vehicle (distilled water) (db/db) group. EPE, ethyl acetate extract of Phyllanthus emblica L. EPE1: 100, EPE2: 200, EPE3: 400 mg/kg body weight; AG: aminoguanidine (20 mg/kg body weight).
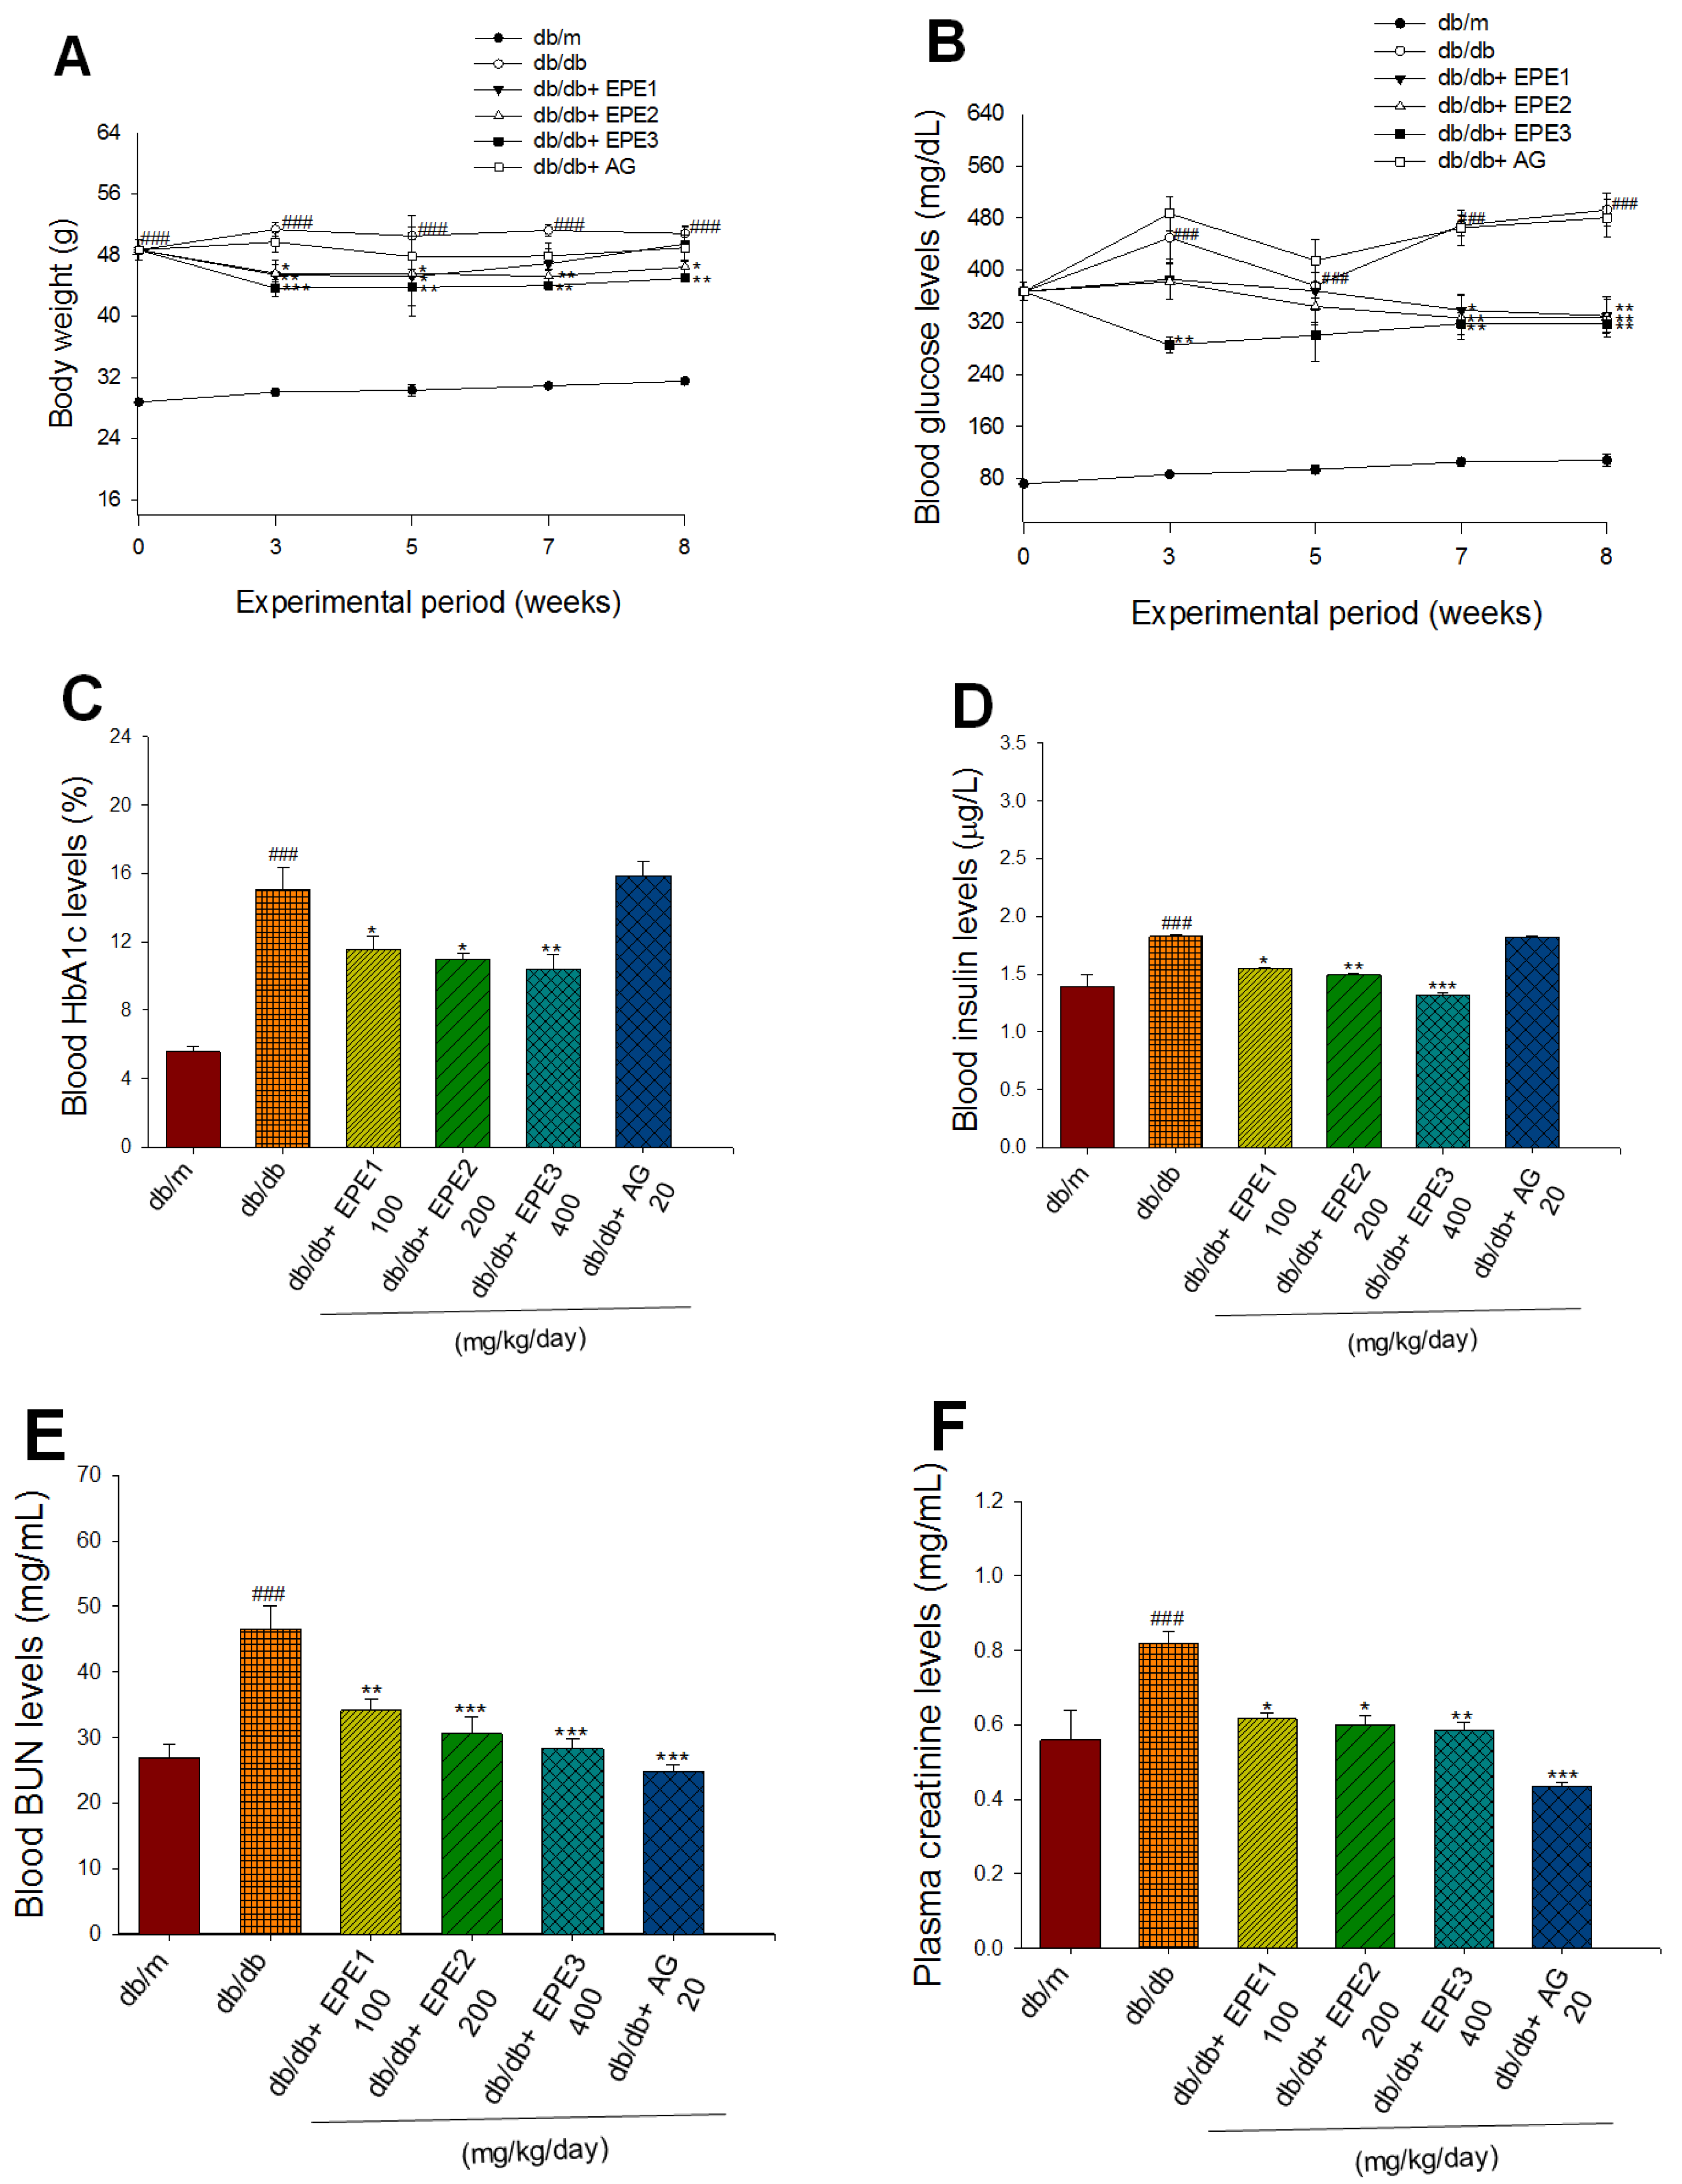
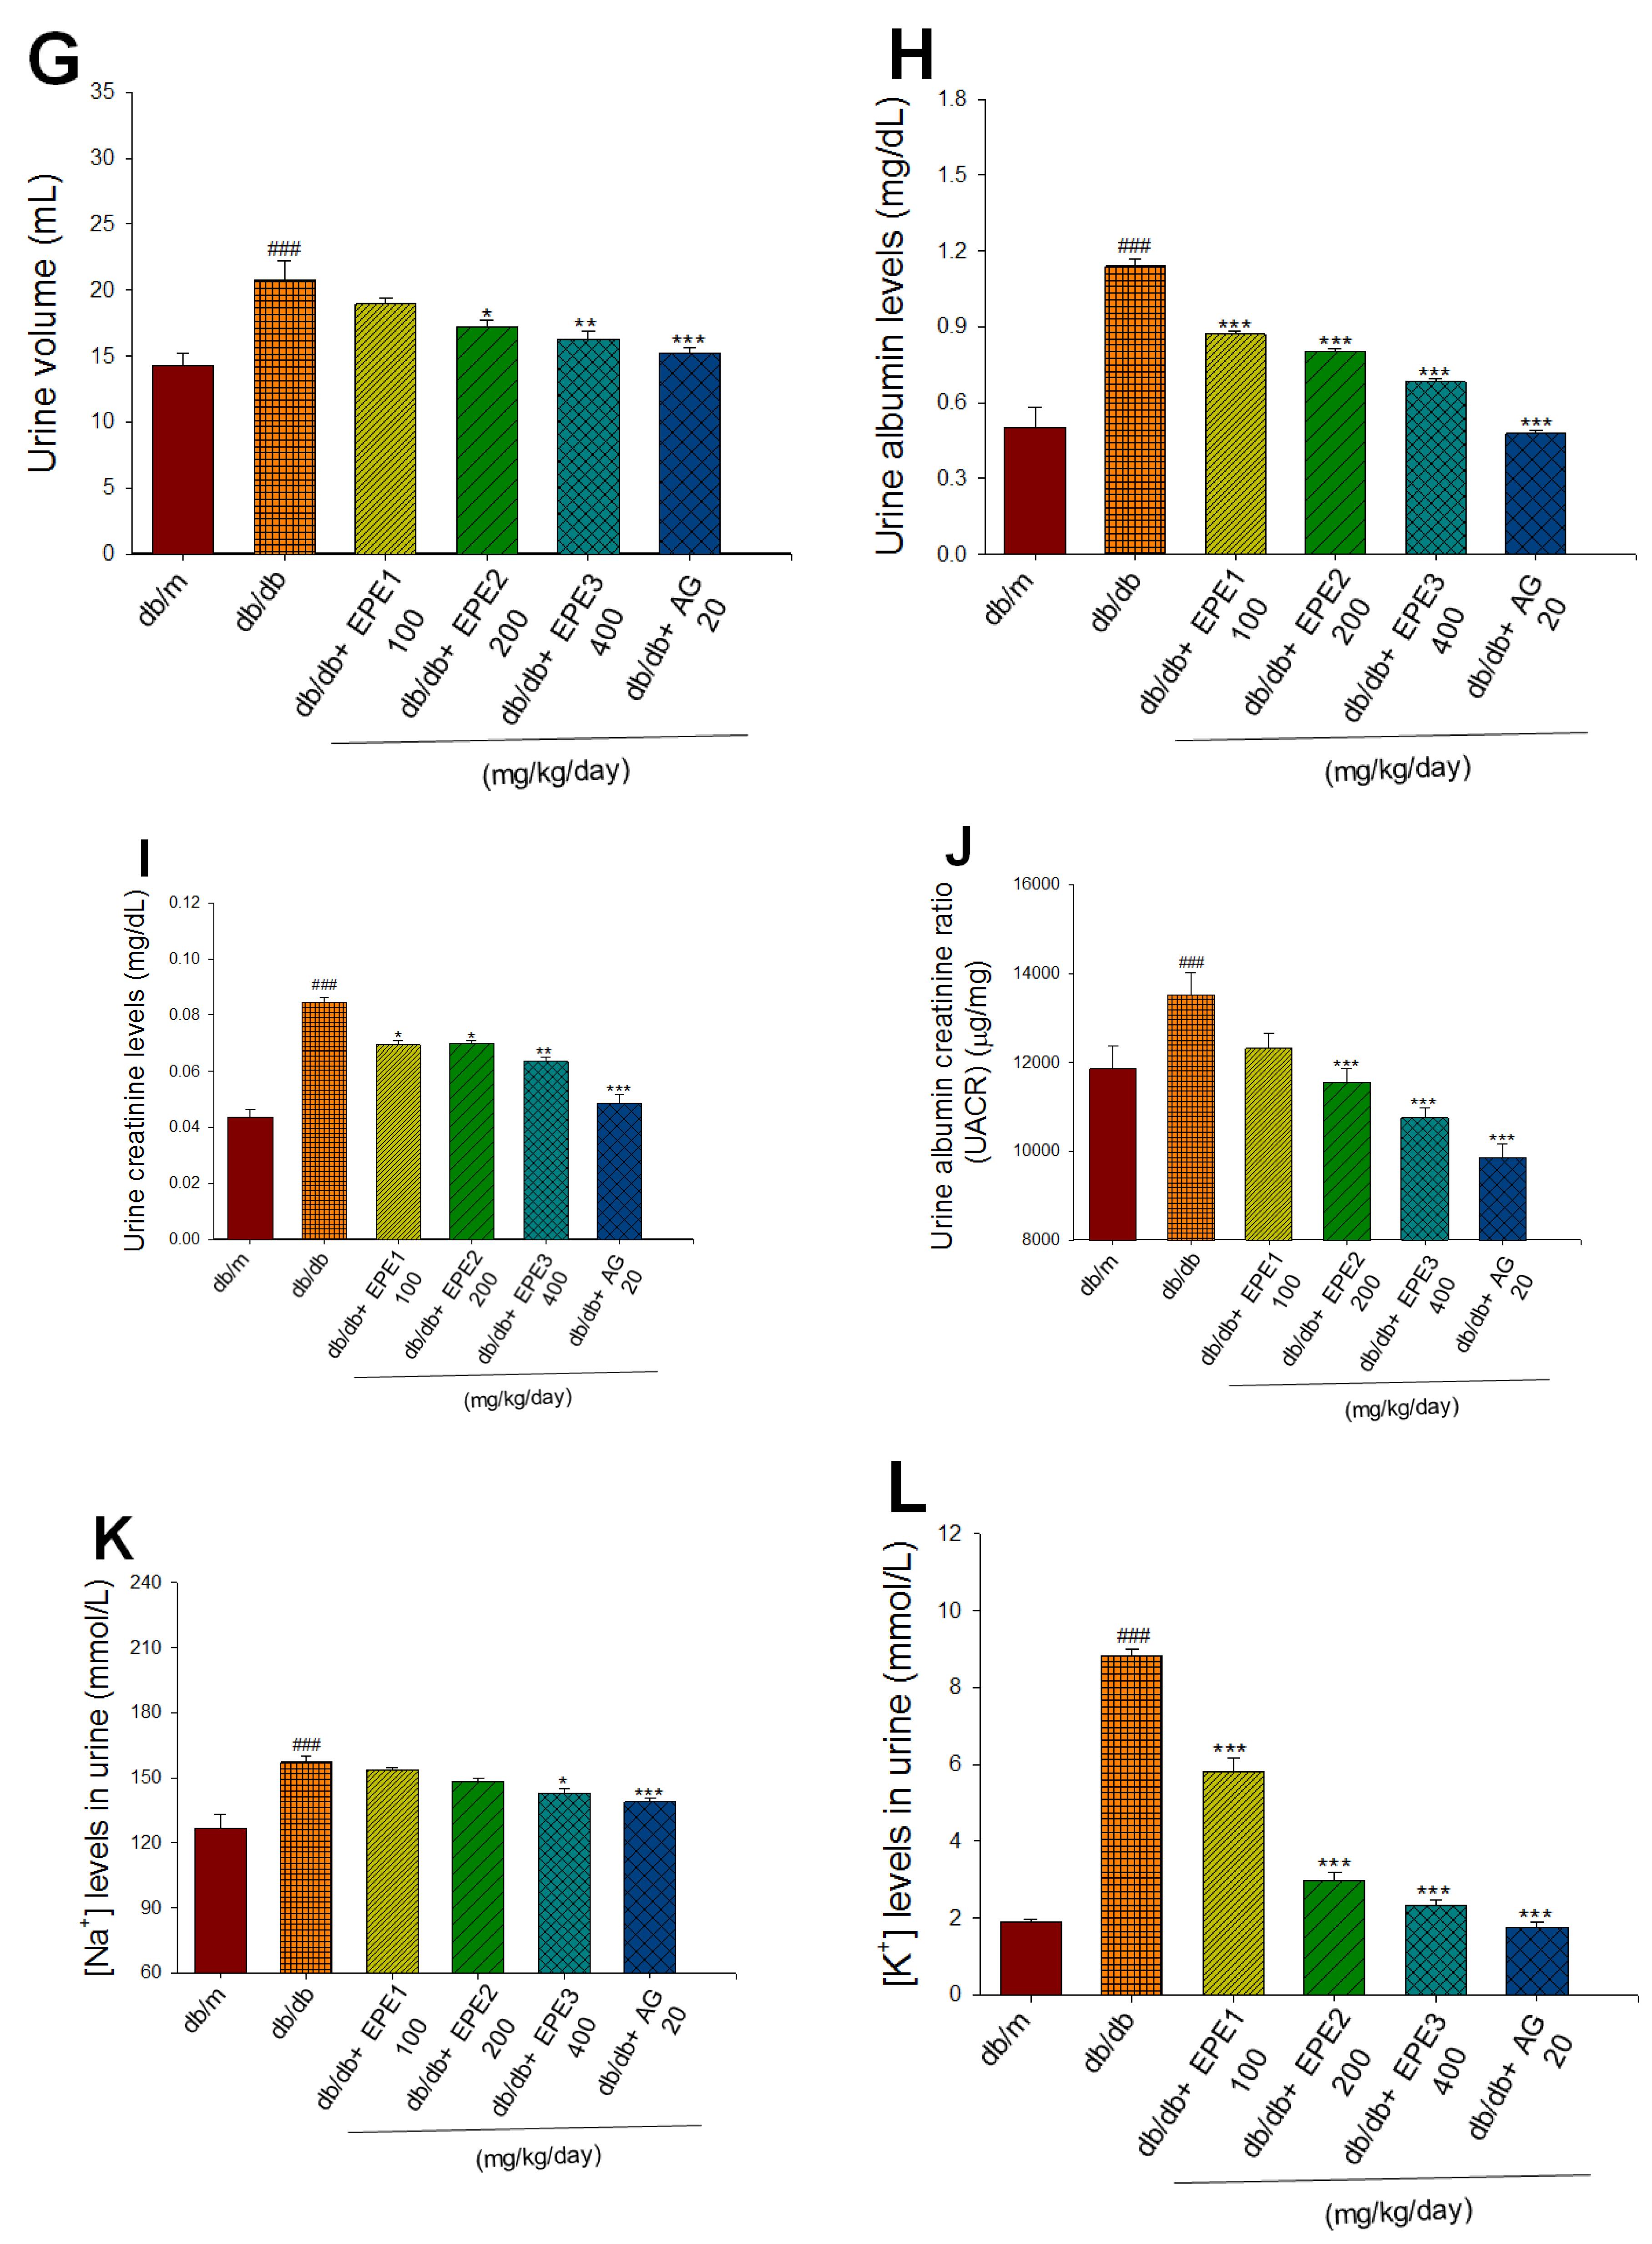
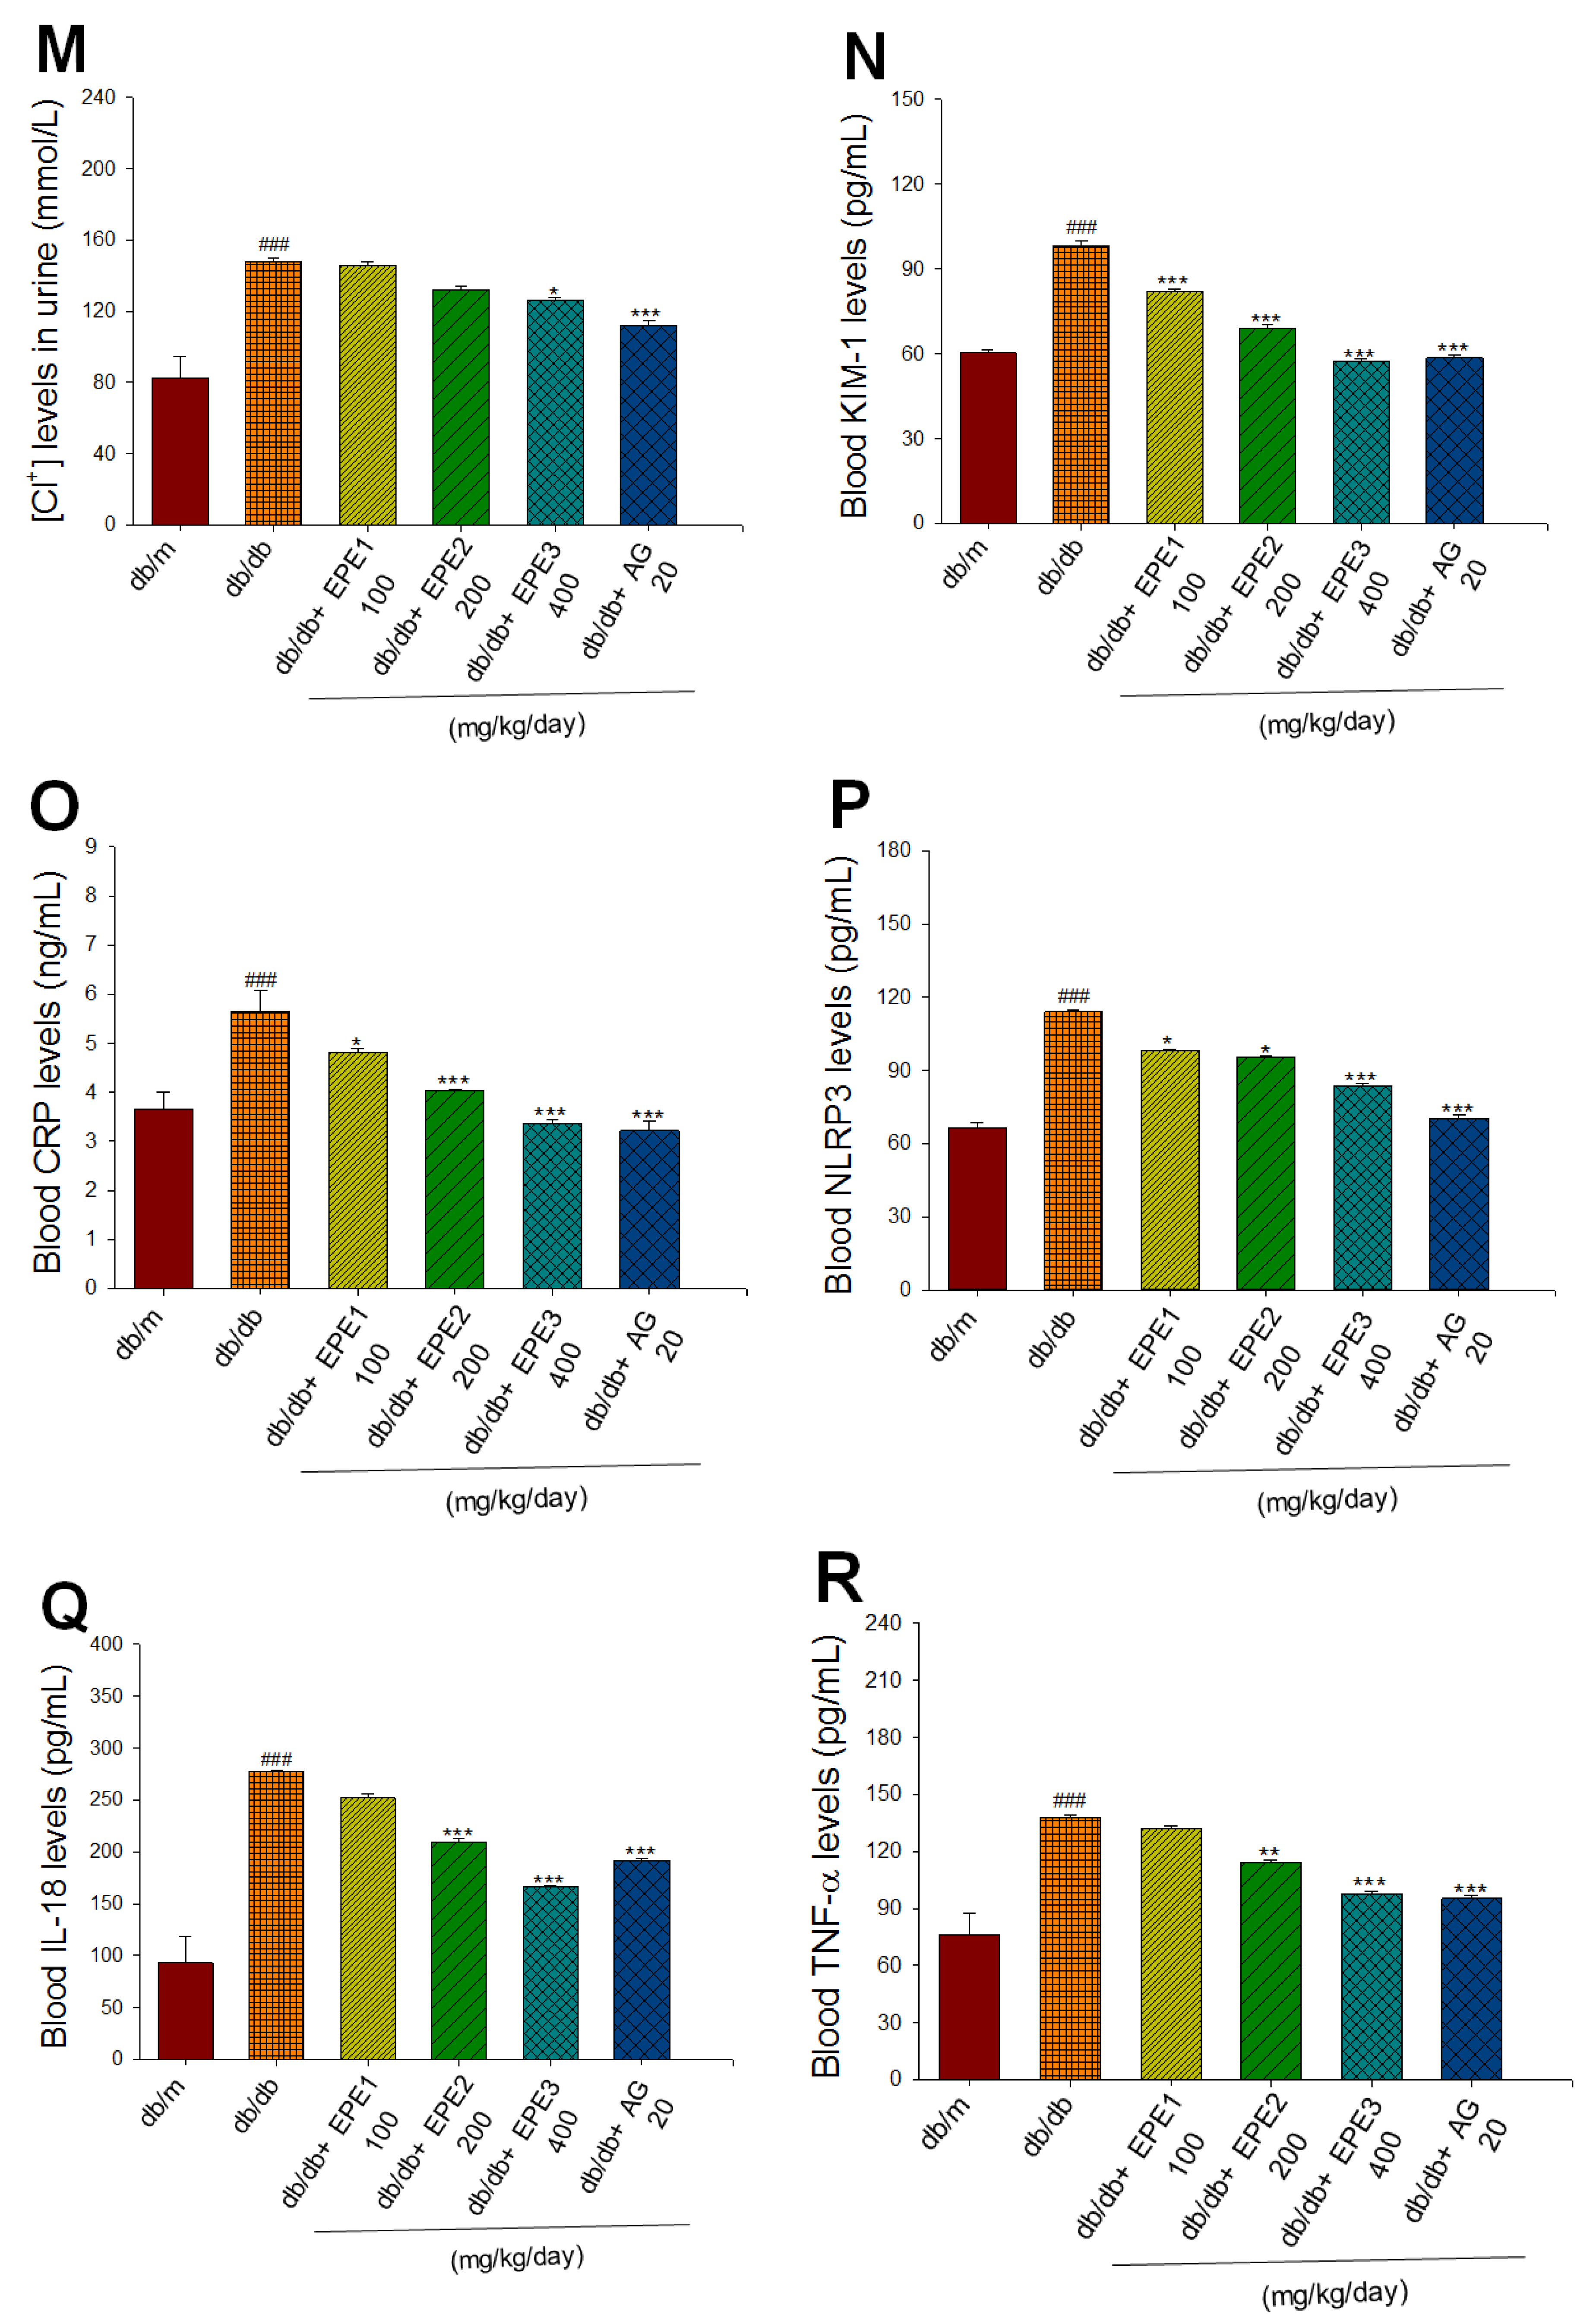
Figure 3.
Representative photographs of the kidney of ethyl acetate extract of Phyllanthus emblica L. (EPE) in db/db mice on (A) glomerular basement membrane in cortex and (B) mesangial matrix expansion in outer medulla by periodic acid Schiff (PAS) staining (magnification: 20 x 10); (C) expression levels of nephrin in the kidneys by immunochemistry staining. EPE: EPE1, EPE2, and EPE3 (100, 200, and 400 mg/kg body).
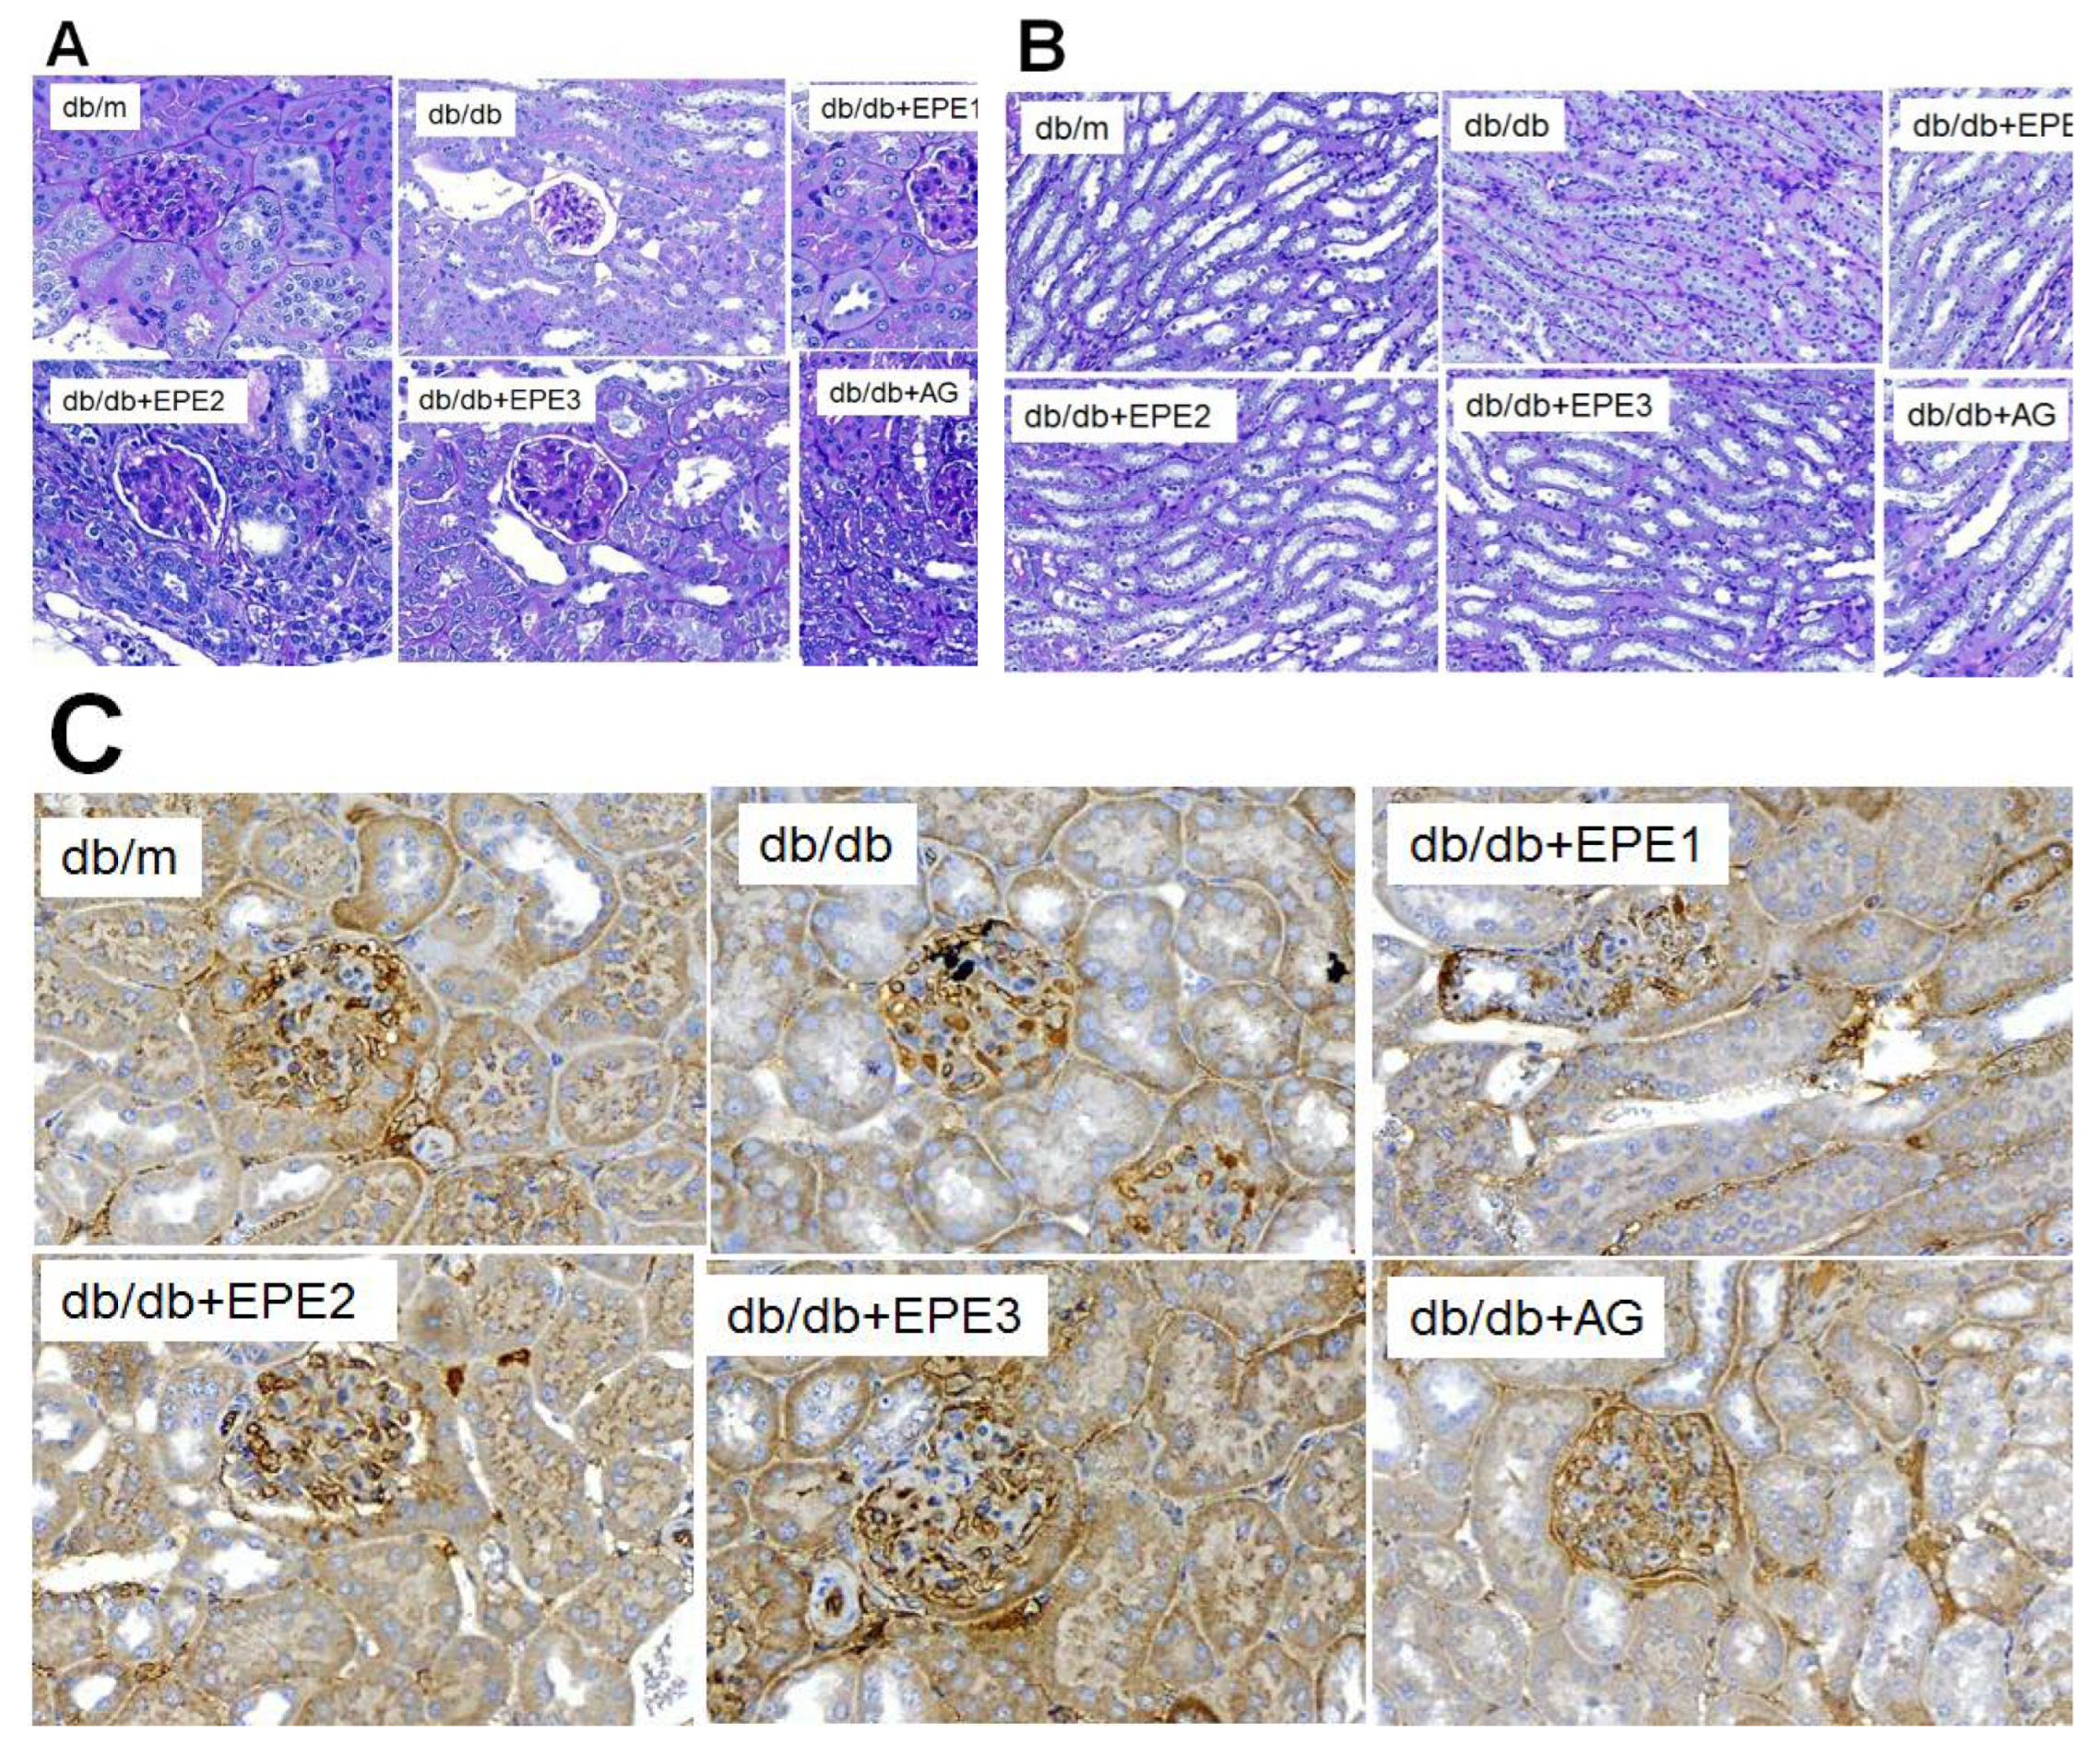
Figure 4.
The kidney target gene expression levels in db/db mice following treatment with ethyl acetate extract of Phyllanthus emblica L. (EPE) or aminoguanidine (AG, 20 mg/kg body weight) by Western blotting analysis on p-PKCα/ t-PKCα, VEGF, nephrin, TGFβ1, collagen IV, fibronectin, Smad4, p-Smad2/ t-Smad2, and p-Smad3/ t-Smad3. (A), (C), (E), and (G) Representative image; (B), (D), (F), and (H) quantification of the p-PKCα/ t-PKCα, VEGF TGFβ1, collagen IV, Smad4, p-Smad2/ t-Smad2, p-Smad3/ t-Smad3, p-NLRP3/ t-NLRP3, ICAM, and Capalase-1 to β-actin. Protein was separated by 12% SDS-PAG. ### P < 0.001 as compared to the db/m group; * P < 0.05, *** P < 0.001 compared to the db/db plus vehicle (distilled water) (db/db) group. All values are means ± SE (n = 8 per group). EPE, ethyl acetate extract of Phyllanthus emblica L. EPE: EPE1: 100, EPE2: 200, EPE3: 400 mg/kg body weight; AG: aminoguanidine (20 mg/kg body weight).
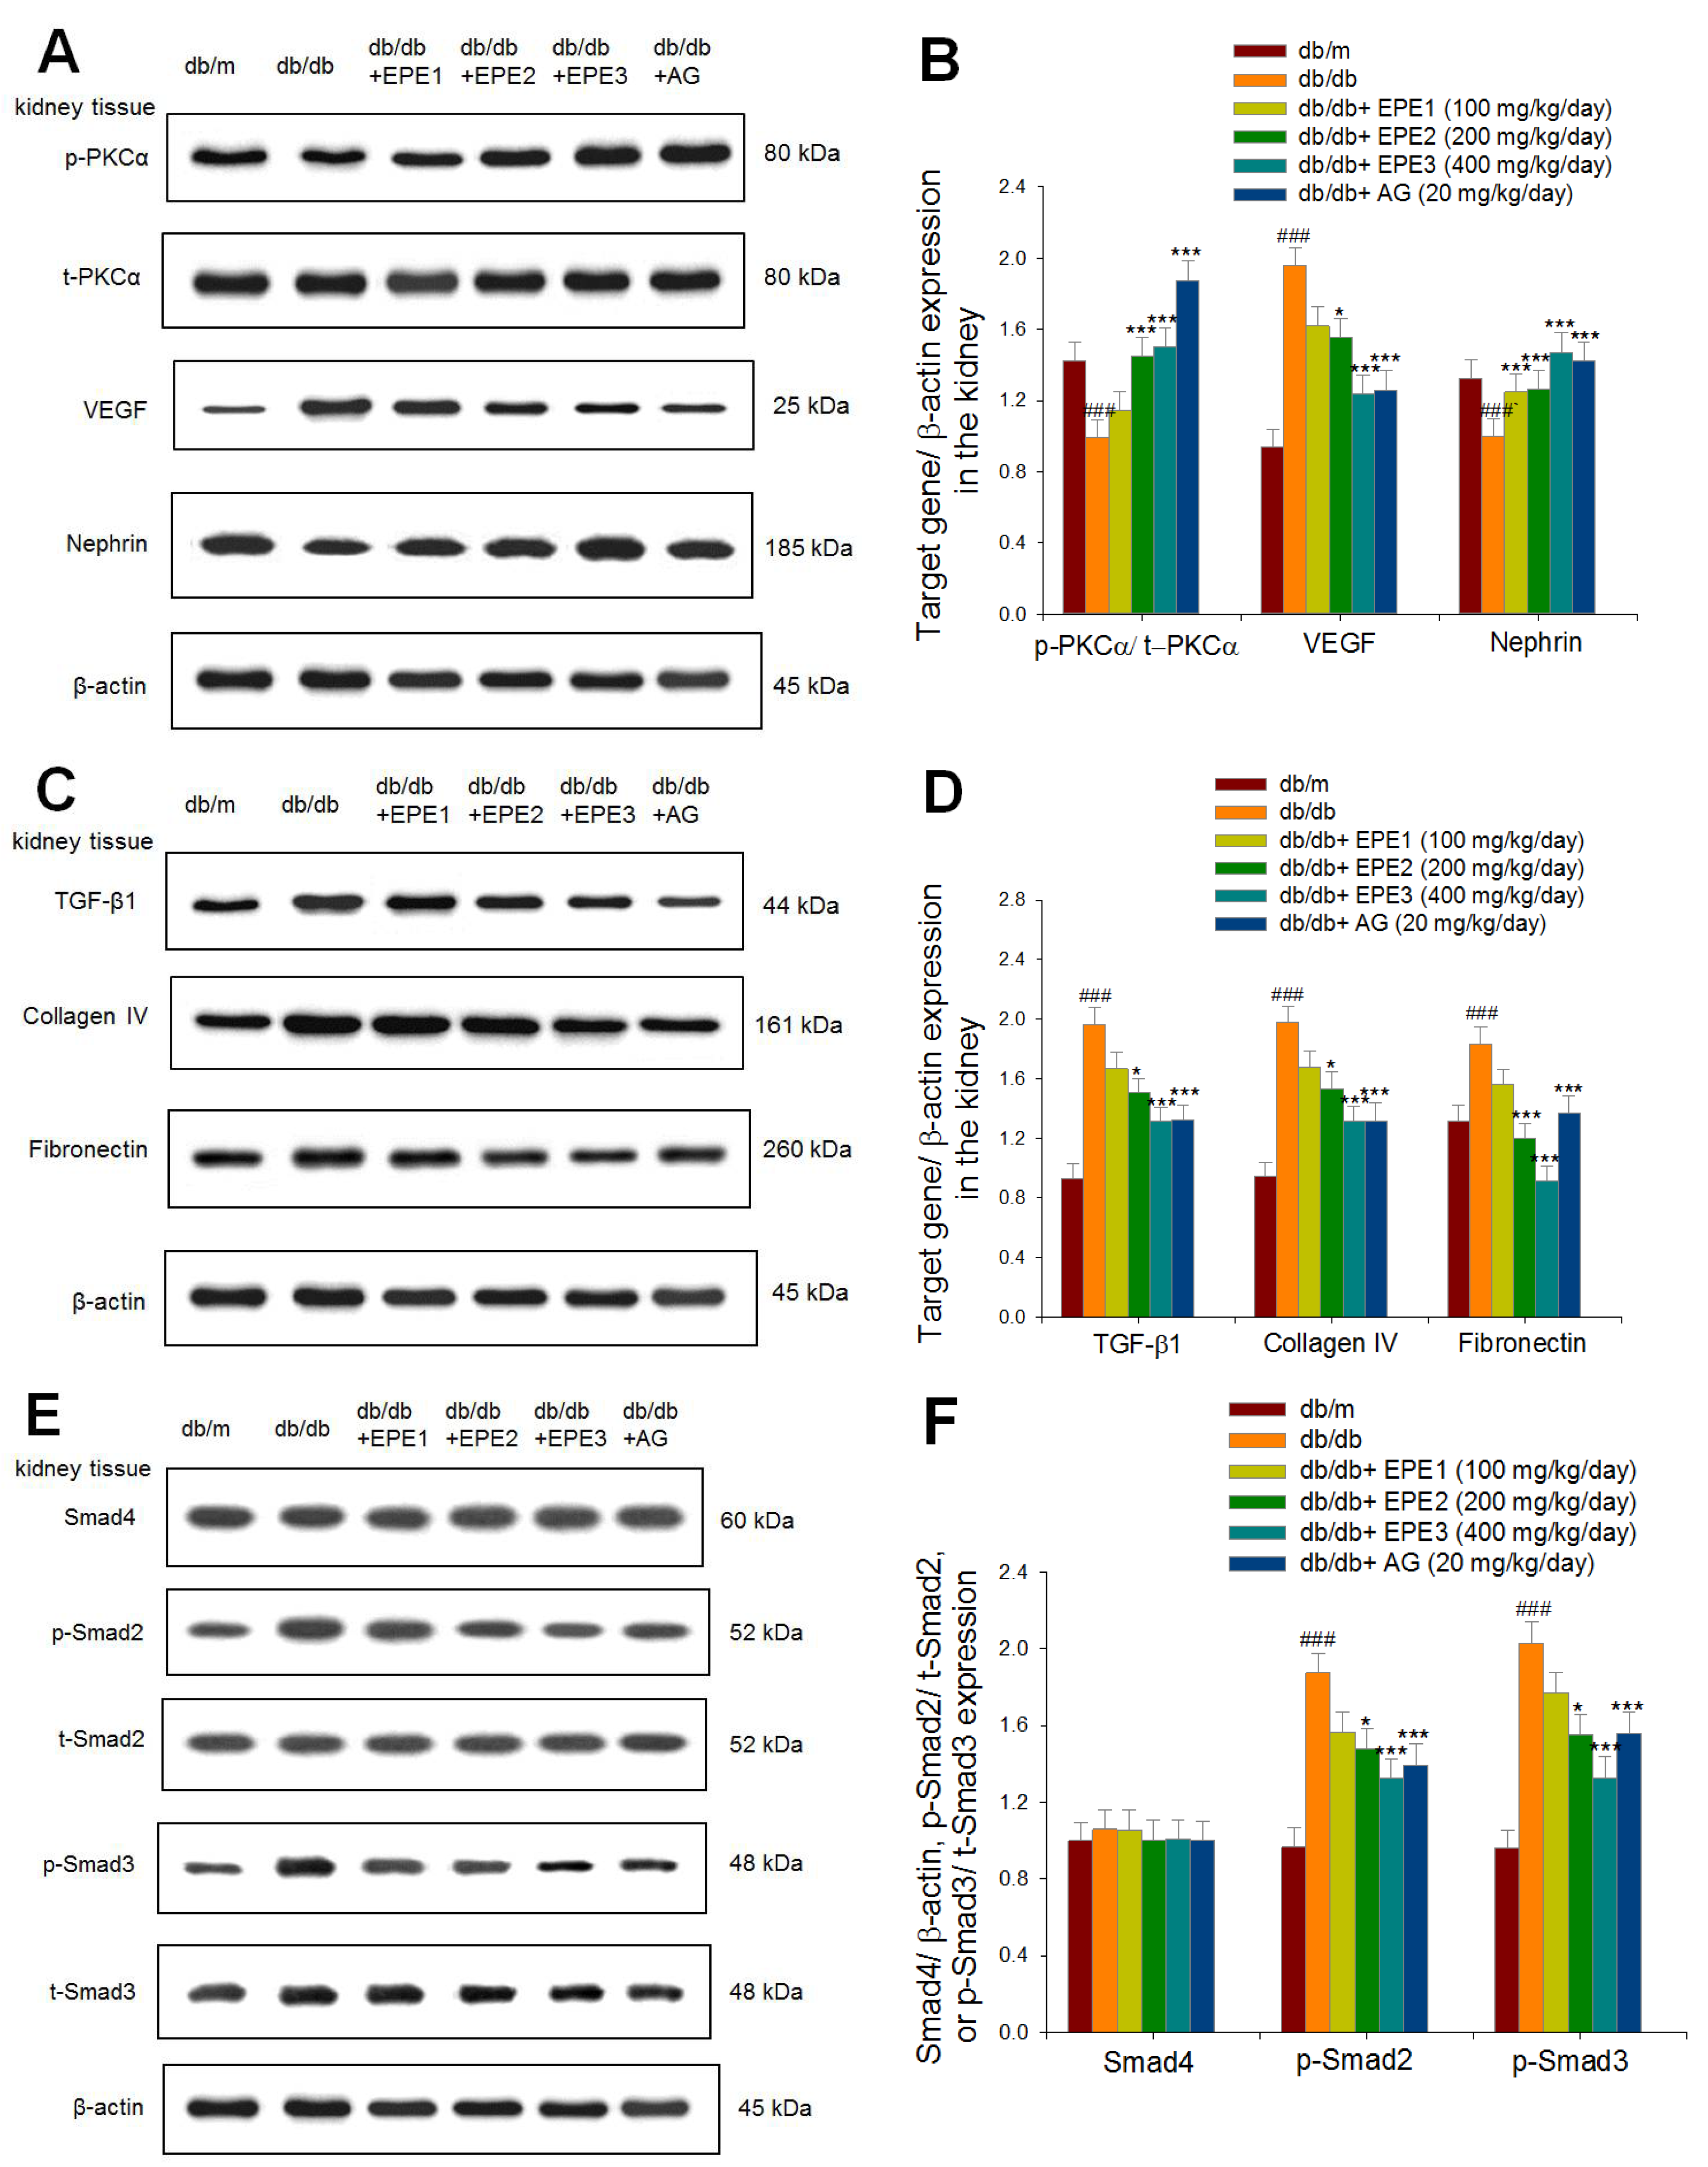
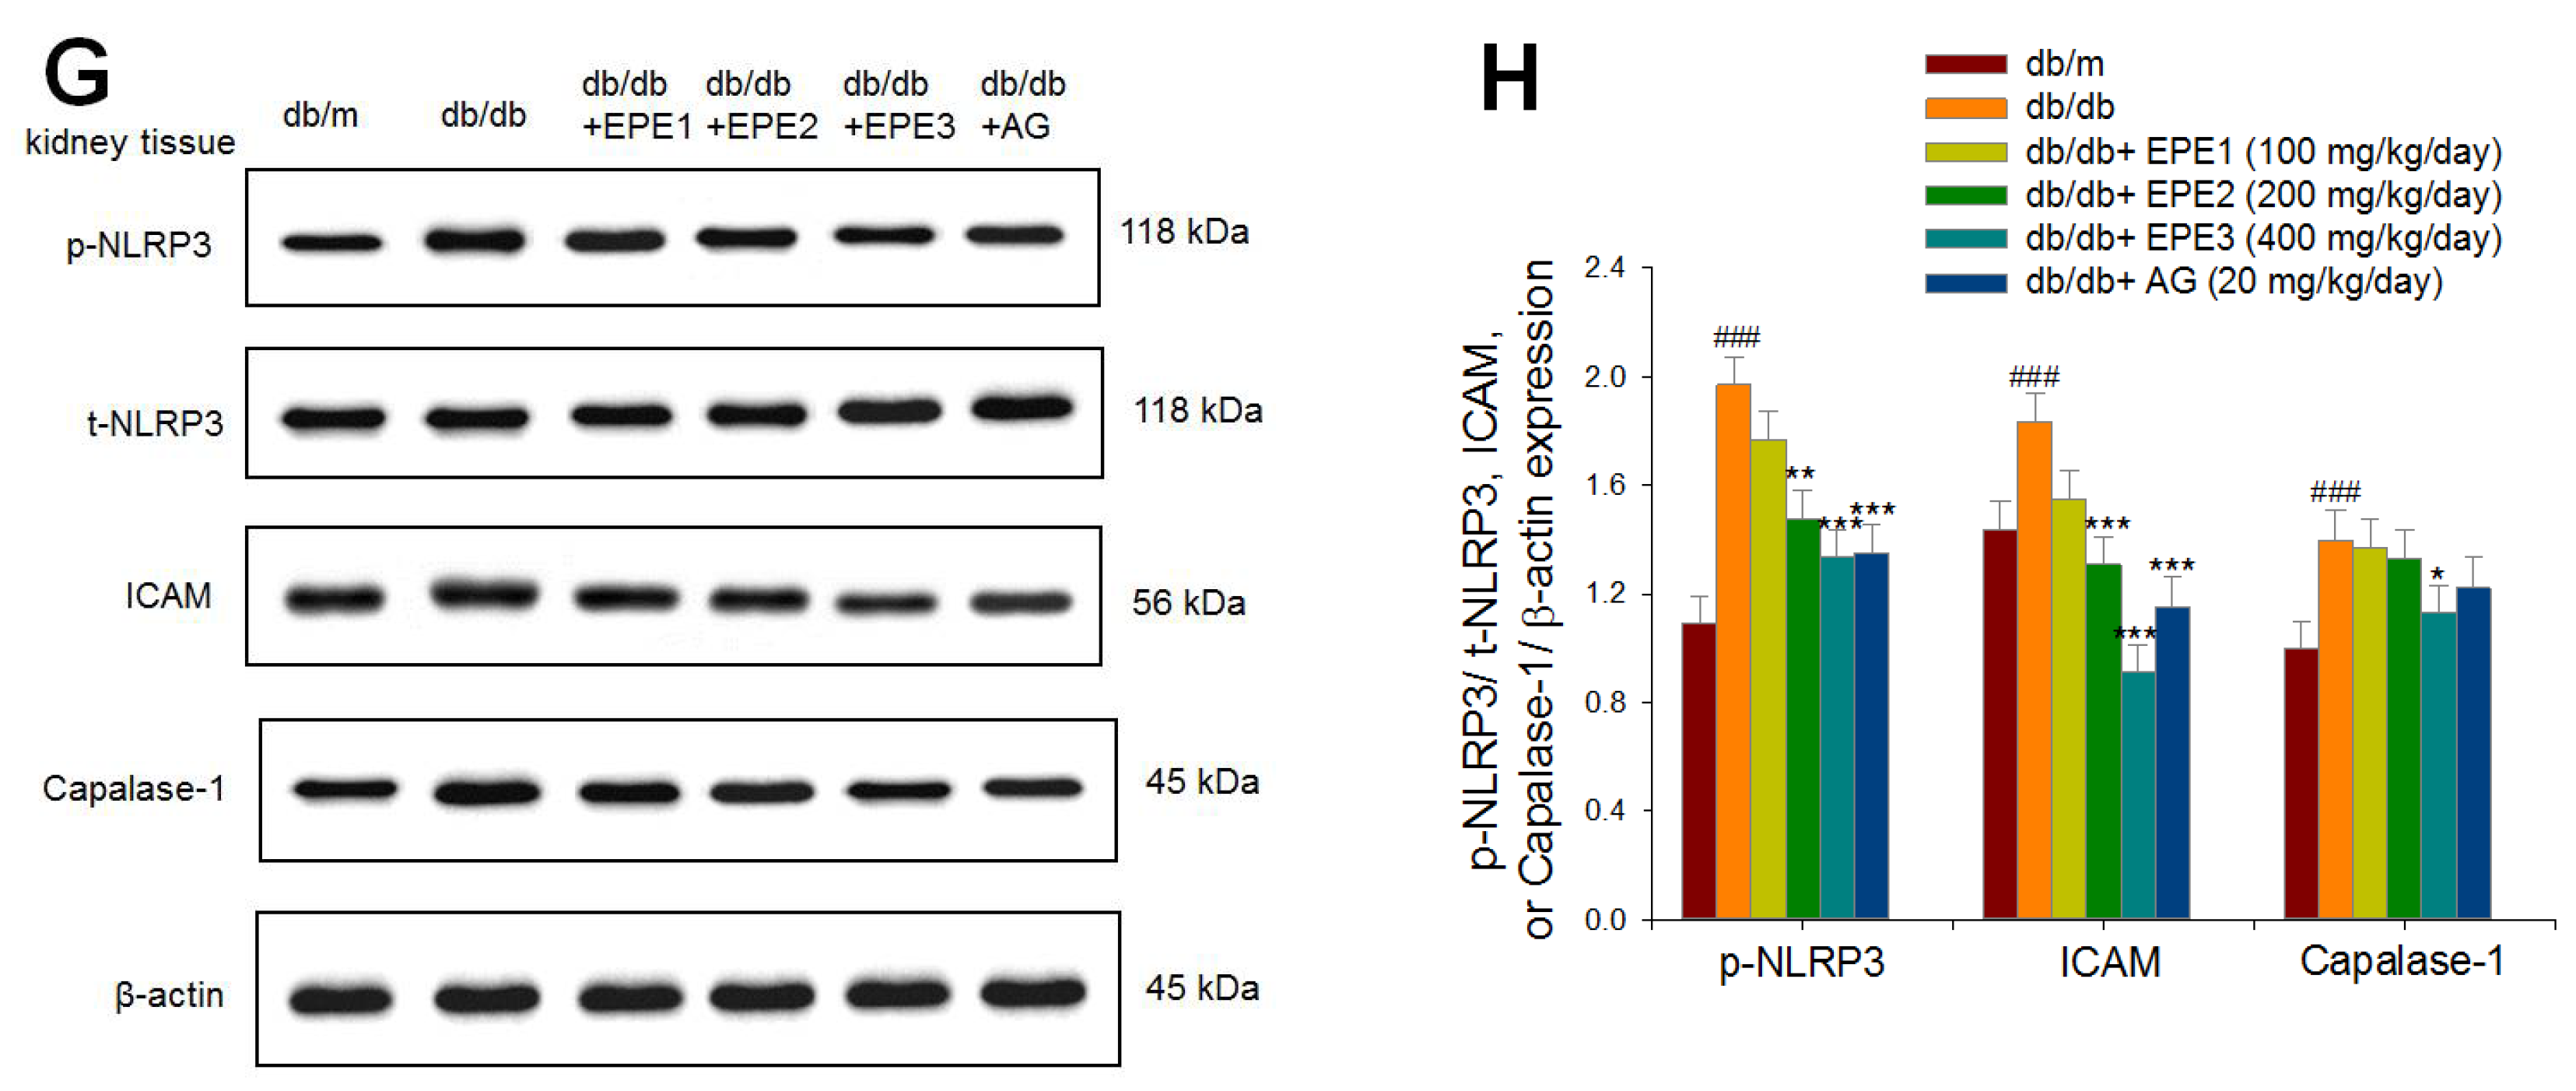
Figure 5.
Effects of seven fractions of EPE (EA) on expression levels of collagen IV, TGF-β1, VEGF, and KIM in Human Renal Mesangial (HRM) cells by Western blotting analyses. Human Renal Mesangial (HRM) cells were treated with seven fractions and equal amounts of lysates were resolved by SDS-PAGE and blotted for collagen IV, TGF-β1, VEGF, and KIM. (A)~(E) Effects of 7 fractions of ethyl acetate extract of Phyllanthus emblica L. (EtOAc soluble fractions) (EA-1, EA-2, EA-3, EA-A, EA-5, EA-6, and EA-7) on expression levels of Collagen IV, TGF-β1, VEGF, and KIM in HRM Cells by Western blotting analysis. Human Renal Mesangial (HRM) cells were treated with 7 fractions as described in the experimental procedures and equal amounts of lysates were resolved by SDS-PAGE and blotted for collagen IV, TGF-β1, VEGF, and KIM. (A) Representative blots for 7 fractions in HRM cells; (B~E) Quantification of the expression levels to β-actin. All values are means ± S.E. * p < 0.05, *** p < 0.001 compared with the control group.
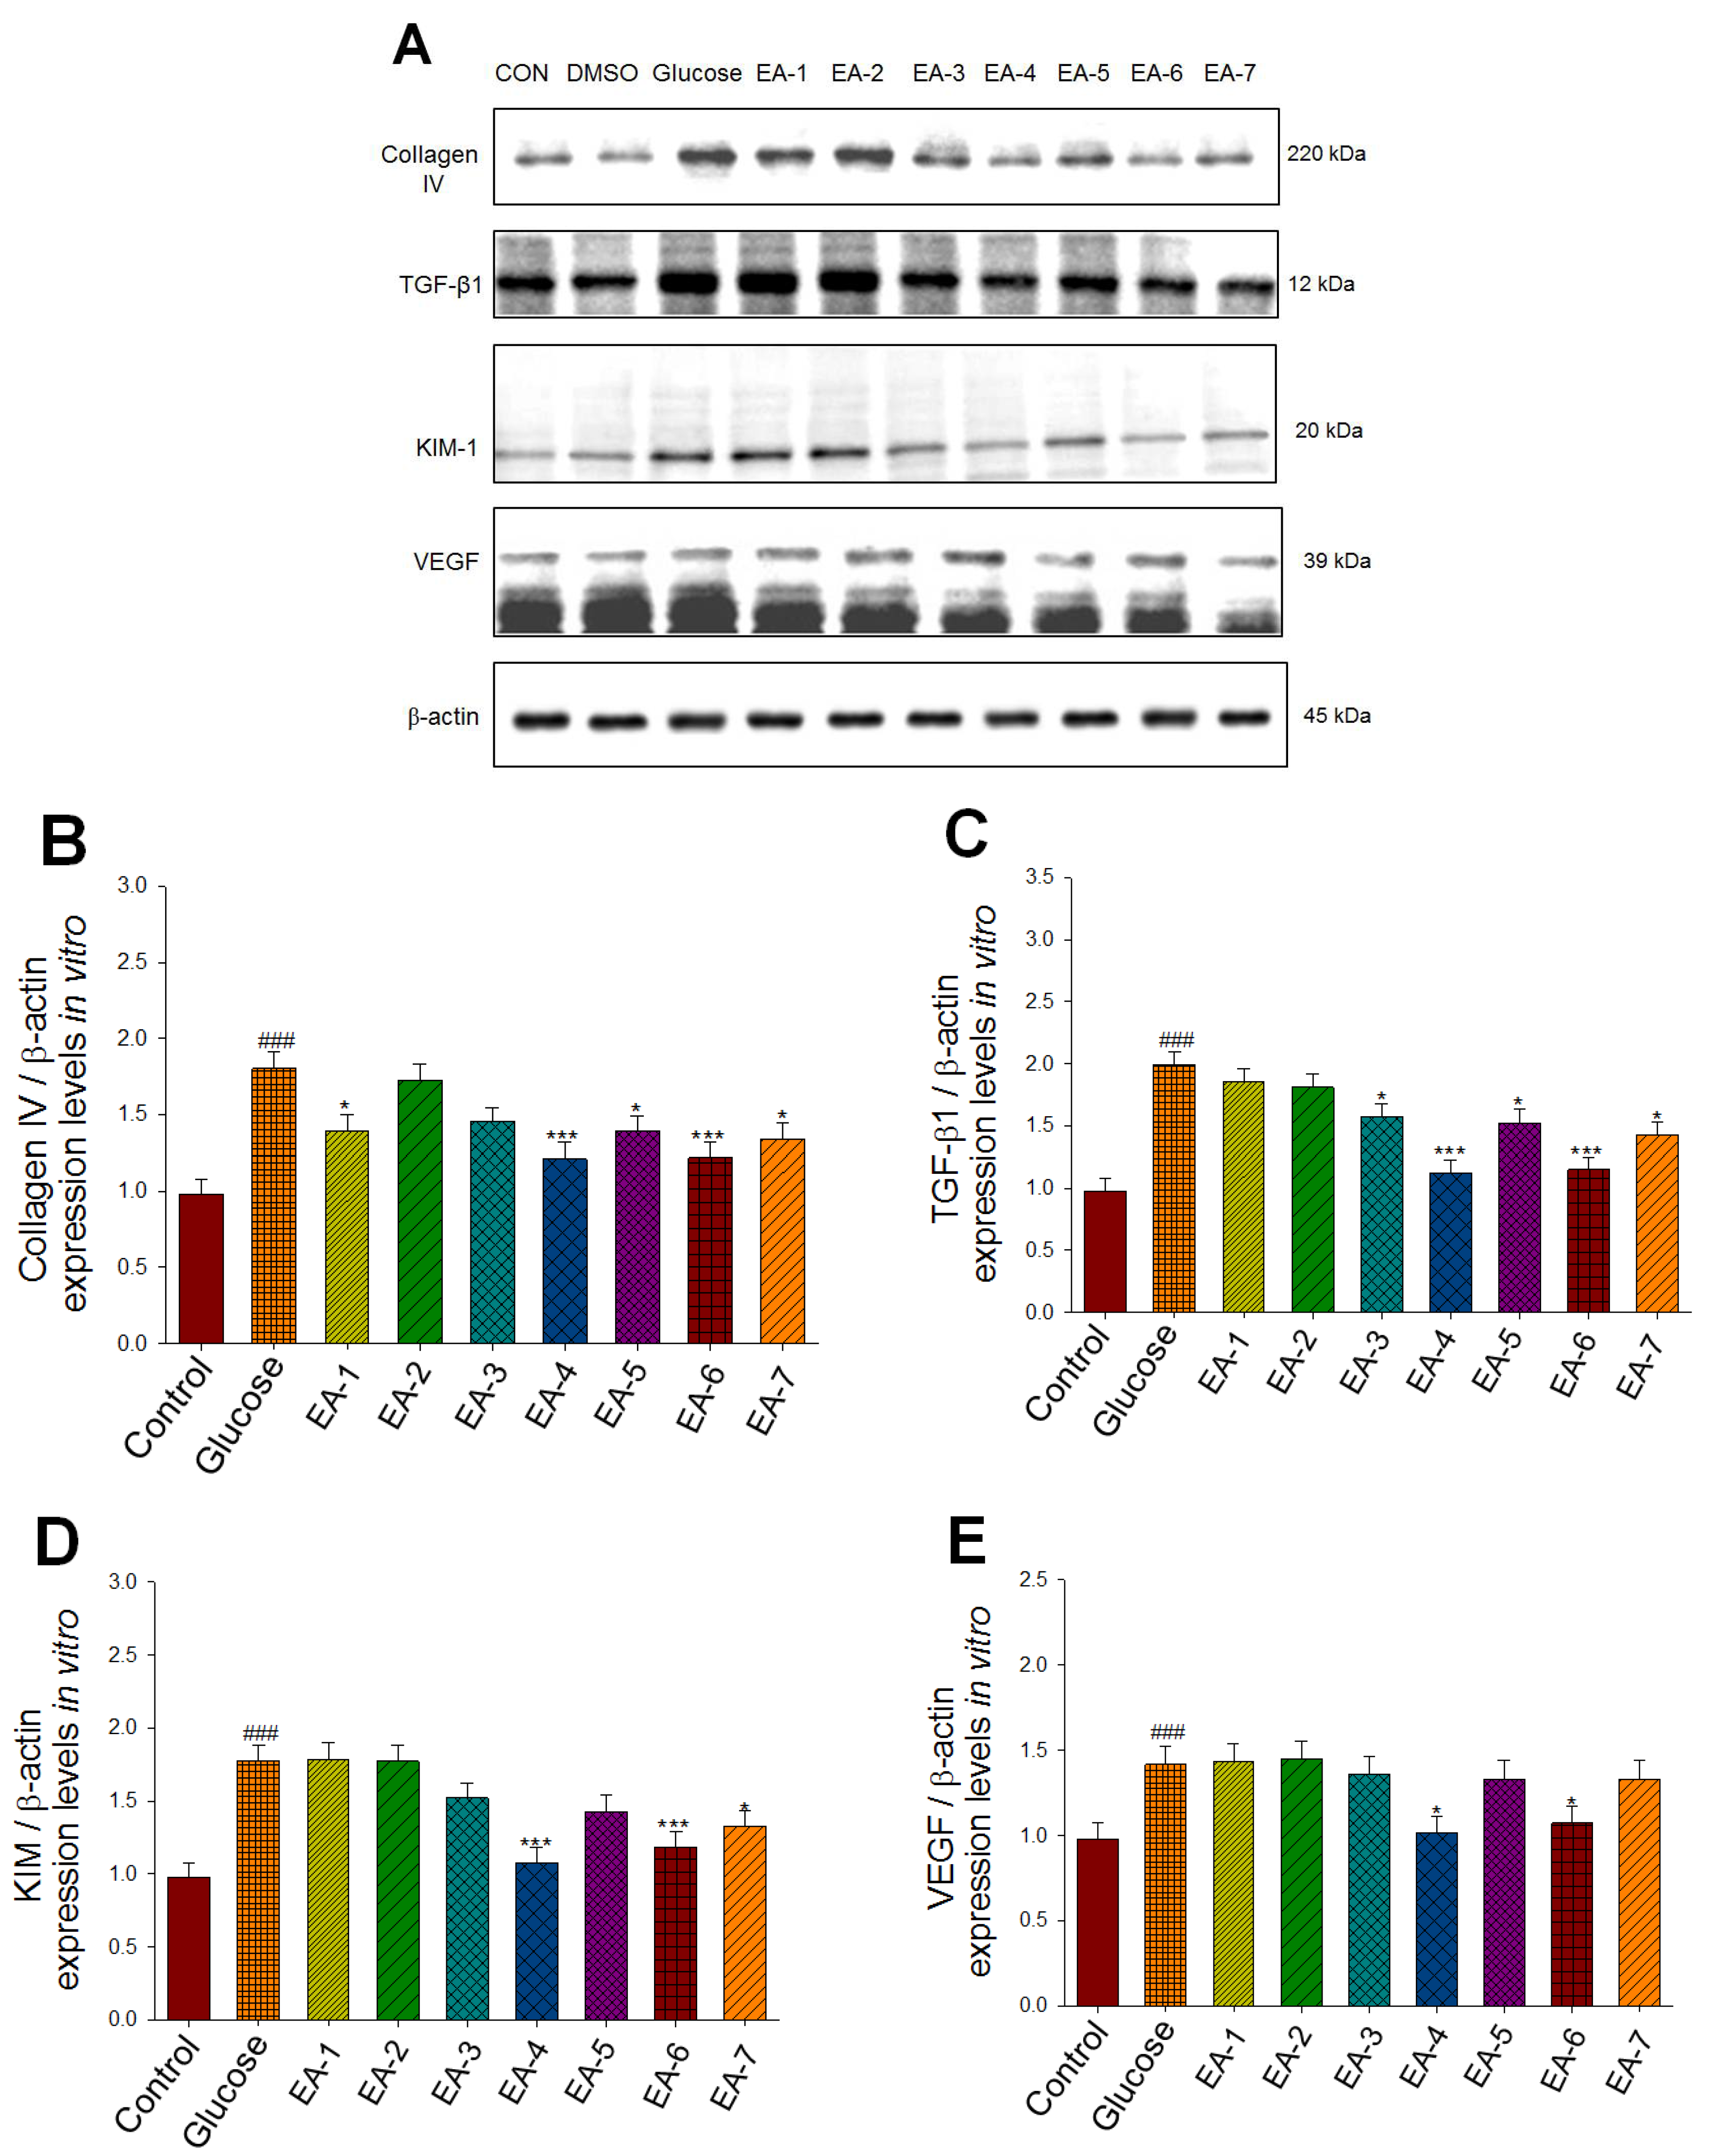
Figure 6.
Graphic abstract of Ethyl acetate extract of Phyllanthus emblica L. (EPE) on diabetic nephropathy in a db/db mouse model.
Figure 6.
Graphic abstract of Ethyl acetate extract of Phyllanthus emblica L. (EPE) on diabetic nephropathy in a db/db mouse model.
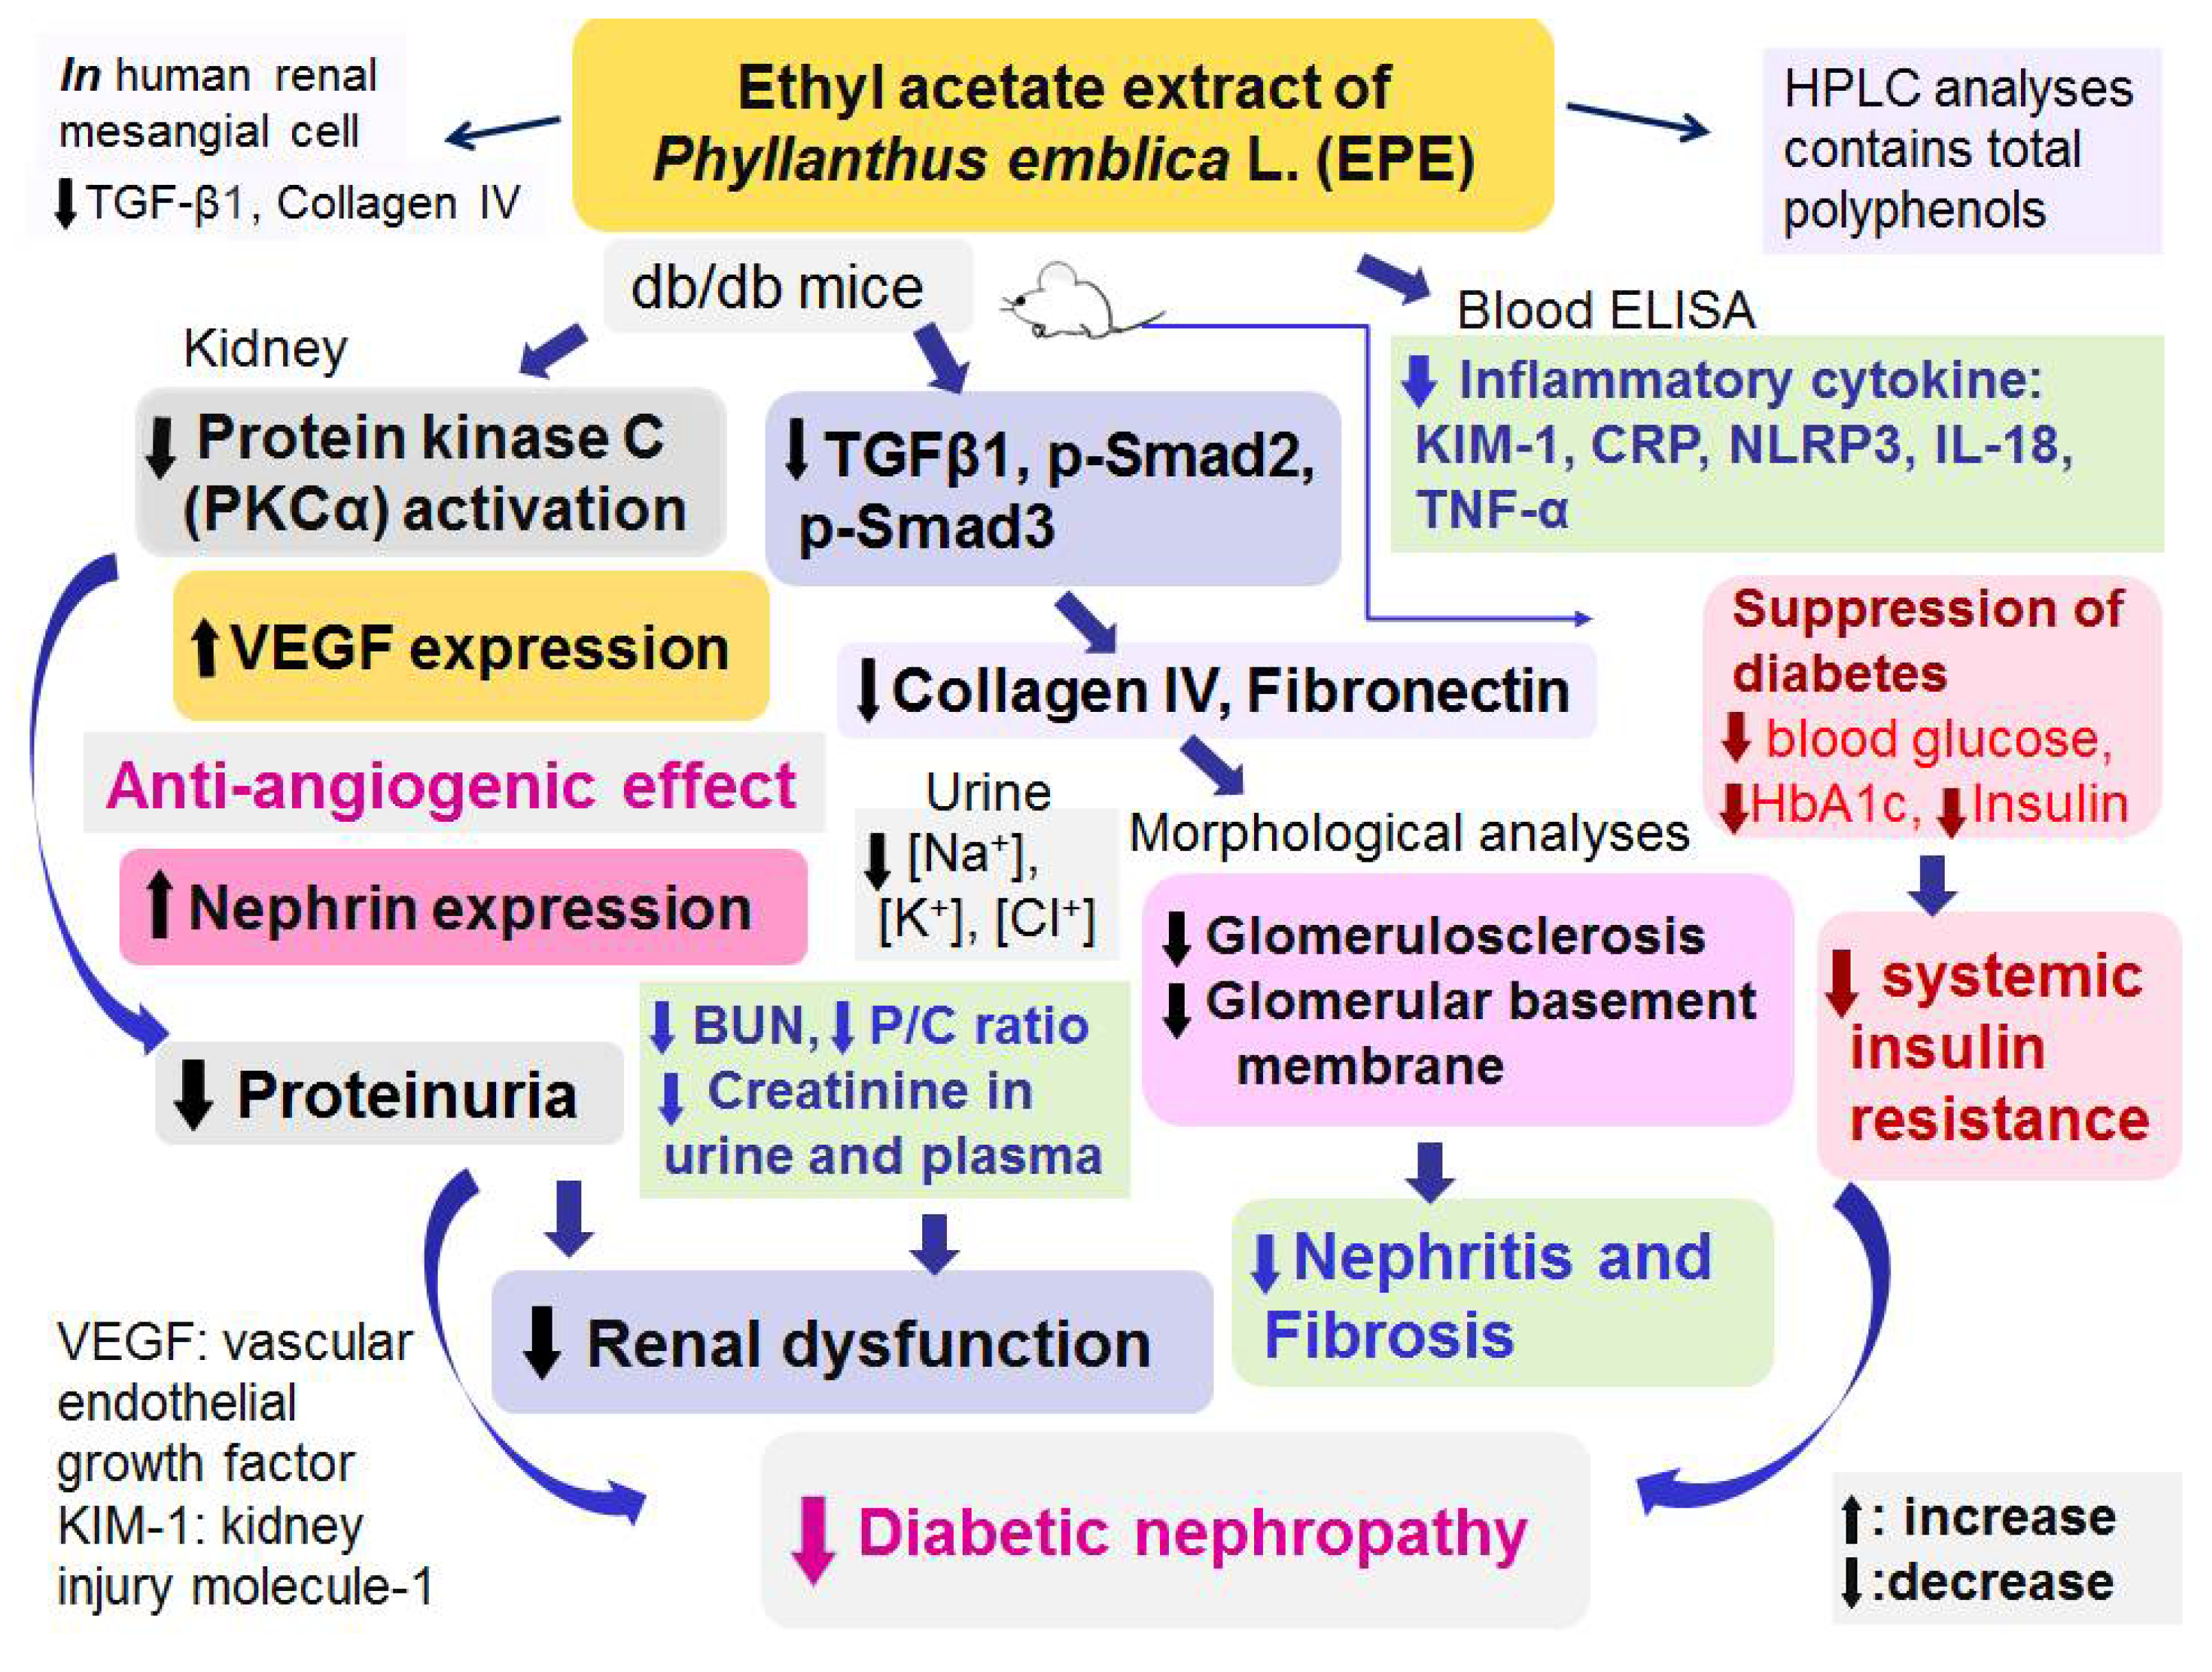

Table 1.
Effects of ethyl acetate extract of Phyllanthus emblica L. (EPE) on relative organ weights (g).
Table 1.
Effects of ethyl acetate extract of Phyllanthus emblica L. (EPE) on relative organ weights (g).
| Drug | Dose (mg/kg/day) |
Liver tissue (%) |
Kidney tissue (%) |
Pancreas (%) |
Skeletal muscle (%) |
|---|---|---|---|---|---|
| db/m | 5.8 ± 0.2 | 1.8 ± 0.2 | 0.5 ± 0.0 | 1.23 ±0.08 | |
| db/db | 4.9 ± 0.3### | 0.8 ± 0.1### | 0.6 ± 0.1 | 0.46 ± 0.08### | |
| db/db +EPE1 | 0.1 | 4.6 ± 0.2 | 0.7 ± 0.0 | 0.5 ± 0.1 | 0.38 ± 0.04 |
| db/db +EPE2 | 0.2 | 4.6 ± 0.2 | 1.0 ± 0.1 | 0.7 ± 0.0 | 0.52 ± 0.03 |
| db/db +EPE3 | 0.4 | 4.2 ± 0.2 | 0.9 ± 0.0 | 0.6 ± 0.1 | 0.51 ± 0.03 |
| db/db +AG | 0.02 | 3.8 ± 0.3* | 0.8 ± 0.1 | 0.3 ± 0.1* | 0.48 ± 0.05 |
All values are means ± S.E. (n=8). p# # #<0.001 compared with the db/m group; p*<0.05 compared with the db/db + vehicle (distilled water) (db/db) group. EPE, ethyl acetate extract of Phyllanthus emblica L. EPE: EPE1: 100, EPE2: 200, EPE3: 400 mg/kg body weight; AG: aminoguanidine (20 mg/kg body weight).
Disclaimer/Publisher’s Note: The statements, opinions and data contained in all publications are solely those of the individual author(s) and contributor(s) and not of MDPI and/or the editor(s). MDPI and/or the editor(s) disclaim responsibility for any injury to people or property resulting from any ideas, methods, instructions or products referred to in the content. |
© 2024 by the authors. Licensee MDPI, Basel, Switzerland. This article is an open access article distributed under the terms and conditions of the Creative Commons Attribution (CC BY) license (http://creativecommons.org/licenses/by/4.0/).
Copyright: This open access article is published under a Creative Commons CC BY 4.0 license, which permit the free download, distribution, and reuse, provided that the author and preprint are cited in any reuse.


