
Submitted:
01 May 2024
Posted:
02 May 2024
You are already at the latest version
Abstract
We previously reported nano-pulse treatment (NPT), a pulsed power technology, resulted in 4T1-luc mammary tumor elimination and a strong in situ vaccination, thereby completely protecting tumor-free animals against a second live tumor challenge. The mechanism whereby NPT mounts effective antitumor immune responses in the 4T1 breast cancer predominantly immunosuppressive tumor microenvironment (TME) remains unanswered. In this study, orthotopic 4T1 mouse breast tumors were treated with NPT (100 ns, 50 kV/cm, 1000 pulses, 3 Hz). Blood, spleen, draining lymph nodes and tumors were harvested at 4-hour, 8-hour, 1-, 3-, 7-day. Additional studies were conducted over 3-month posttreatment intervals for the analysis of frequencies, death and functional markers of various immune cells in addition to suppressor function of regulatory T cells (Tregs). NPT was verified to elicit strong in situ vaccination (ISV) against breast cancer and promoted both acute and long-term T cell memory. NPT abolished immunosuppressive dominance systemically and in the TME by substantially reducing Tregs, myeloid-derived suppressor cells (MDSCs), and tumor-associated macrophages (TAMs). NPT induced apoptosis in Tregs and TAMs. It also functionally diminished the Treg suppression capacity, likely explained by the downregulation of activation markers, particularly 4-1BB and TGFβ, and a phenotypic shift from predominantly activated (CD44+CD62L-) to naïve (CD44-CD62L+) Tregs. Importantly, NPT selectively induced apoptosis in activated Tregs and spared effector CD4+ and CD8+ T cells. These changes were followed by a concomitant rise in CD8+CD103+ tissue-resident memory T cells and TAM M1 polarization. These findings indicate that NPT effectively switches the TME and secondary lymphatic systems from an immunosuppressive to an immunostimulatory state allowing cytotoxic T-cell function and immune memory formation to eliminate cancer cells and account for the NPT in situ vaccination.
Keywords:
Nano-pulse treatment (NPT)
; in situ vaccination
; breast cancer
; tumor microenvironment
; immunosuppression
; apoptosis
; memory T cells
; regulatory T cells
; myeloid-derived suppressor cells
; tumor-associated macrophages
Introduction
While advances in immunotherapy, particularly checkpoint inhibitors, have been promising for breast cancer patients, clinical trials have shown that breast cancer is largely resistant to these measures [1-3]. One major challenge of effective immunotherapy for breast and other immunologically “cold” cancers is the immunosuppressive tumor microenvironment (TME), which is a complex network containing multiple types of immunosuppressive cells, chemokines, cytokines, physical barriers (stromal cells and extracellular matrix), chemical factors, metabolites, etc [4, 5]. Various approaches and strategies have been proposed and studied to target these TME immunosuppressive components and improve treatment outcomes [6, 7].
In situ vaccination (ISV), a clinical observation 130 years ago, has attracted increasing attention as a potential paradigm shift for cancer immunotherapy [8, 9]. Unlike conventional vaccines or systemic immunotherapies, ISV can overcome the immunosuppressive TME by direct administration of drugs/adjuvants into the tumor. Current advances in tumor biology, immunology, technological innovations, and targeted therapies have improved immune outcomes of ISV approaches. Nano-pulse Treatment (NPT), also known as nano-pulse stimulation (NPS) or nanosecond pulsed electric fields or electric pulses/ (nsPEFs/nsEPs), is a pulsed-power technology that compresses electric energy and releases it in high powered (generally 100 megawatts) nanosecond (1~999 ns) duration electric pulses [10, 11]. NPT has been demonstrated to effectively ablate tumors in multiple animal models [12-16]. In our previous studies, NPT ablated localized tumors in poorly immunogenic cancer models including orthotopic 4T1-luc mouse triple negative breast [12], N1S1 rat liver models and ectopic [15] Pan02 mouse pancreatic cancer [17]. Importantly, after the complete regression of primary tumors, NPT resulted in a 75-100% rejection of secondary live tumor challenges in these three cancer models, demonstrating its strong ISV effects. The 4T1 tumor model is a very aggressive and spontaneously metastatic malignancy with abundant immune suppressive cells in the TME, including regulatory T cells (Tregs), tumor-associated macrophages (TAMs), and myeloid-derived suppressor cells (MDSCs) [18, 19]. The mechanisms behind the NPT-induced ISV effect are not well understood. Considering immunosuppressive prevalence in the TME, the immune system must overcome these roadblocks prior to the generation of antitumor immunity. To further clarify how NPT counteracts the immunosuppressive TME to elicit a strong ISV effect, we investigated in this study the dynamic changes of major immunosuppressive cells (Tregs, MDSCs, and TAMs), the Treg suppressive activity, and the acute and long-term T cell immune memory formation.
NPT is a novel type of drug-free ISV approach that can ablate primary tumors to generate strong vaccine protection against the second live tumor challenge. In the breast cancer model ISV effect correlates with an acute rise in tissue-resident memory T cells and the formation of long-term T cell memory. NPT also selectively induced activated Treg cell apoptosis and reduced their functional suppressive capacity while preserving cytotoxic T cells. NPT also eradicated TAMs by directly killing them and causing late diminishment of MDSCs without evidence of the induced cell death mechanism.
Materials and Methods
Animals and Cell Lines
Female BALB/c mice (8–10 weeks of age) were purchased from Jackson Laboratory. The mice were housed and maintained at the ODU AAALAC accredited animal facility. All animal procedures in this study were approved by IACUC at Old Dominion University.
4T1-luc cells were provided by Dr. G Gary Sahagian at Tufts University and maintained in high glucose DMEM (ATCC® 30-2002TM) supplemented 10% FBS, NEAA and antibiotics (100 units/ml penicillin and 100 μg/ml streptomycin). 4T1-luc cells with passage number 2-7 were thawed for expansion. Cells with passage number 9-20 were used in the described experiments. Cells were tested with MycoAlert® Mycoplasma Detection Kits (Lonza) to exclude mycoplasma contamination.
In Vivo Nano-Pulse Treatment and the Secondary Live Tumor Challenge
Tumors were initiated by injecting female Balb/c mice with 1 x 10⁶ 4T1-luc cells in 50 μL DPBS (Life Technologies) in the left posterior mammary fat pad. The control group received the tumor inoculation only. The remaining mice underwent NPT on Day 11 following tumor inoculation (Suppl. Figure 1) when average tumor sizes were 6-8 mm or 60-100 mm3. In all studies, the NPT parameters included a pulse duration 100 ns, electric field strengths 40-50 kV/cm, 1000 pulses, and 3 Hz. Nanosecond electric pulses were delivered to the tumor tissue using a two-plate pinch electrode with an 8 mm diameter. Prior to treatment, all hair was thoroughly removed, and the injection site was briefly treated with Nair. The tumor mass and electrodes were covered with ultrasound gel to maintain a good tumor-electrode contact and prevent air accumulation that creates electrical breakdowns.
Animals with tumor free over 7 weeks were challenged orthotopically in the right posterior mammary fat pad with 0.5 x 10⁶ live 4T1-luc tumor cells. Tumor growth was monitored twice weekly by caliper measurements.
Tissue Harvesting and Processing for the Analysis of Immune Cells
The treated mice were euthanized 4 hours (4 hr), 8 hours (8 hr) (for local tissues only), and on Day 1 (D1), Day 3 (D3), and Day 7 (D7) post-NPT (Suppl. Figure 2). Their tumor tissues, tumor-draining lymph nodes (dLN), blood and spleens were harvested. Control tissues were obtained from mice with untreated tumors. Single cell suspensions from each tissue were prepared to analyze immune cells including CD3, CD4, CD8 and tissue-resident marker CD103. To examine effect memory and central memory T cells, 3 months post-NPT treatment tumor-free animals were euthanized. Spleens and blood were harvested. Spleens/blood of tumor bearing mice were used as control. Single cell suspensions were prepared from spleens or blood then stained with CD3, CD4, CD8, CD44 and CD62L antibodies.
To quantify IFN-γ production and IFN-γ producing T cells, splenocytes (2 x 10⁶/ml) 1 ml per well were incubated with media, tumor lysate (10 µg/mL) or plate bound low endotoxin/azide free LEAF anti-CD3 Ab (0.5 µg/mL in DPBS) in a 24-well plate. For intracellular cytokine staining, cells were incubated for 6 hrs and Monensin added for the final 4 hours. For IFN-g production, cells were incubated for 24 hr and supernatants were collected for ELISA assay (Biolegend). Preparation for single cell suspensions
The primary solid tumor, dLN, blood and spleen were collected and prepared into single cell suspensions for downstream analysis. The spleen and dLN were gently mashed through a 70 µm cell strainer into a conical tube. The dissociated spleen and the blood underwent RBC lysis to make cell suspensions for further analysis. For solid tumor processing, the fat and other surrounding tissues were removed. The tumor samples were washed with RPMI 1640 (Life Technologies) and cut into 1-5 mm3 pieces. The cut pieces were then dissociated with the Miltenyi Biotec tumor dissociation kit and the Gentlemacs Octo-dissociator (with heater) using the tough tumor dissociation protocol. The digest was then passed through a 70 µm cell strainer to remove clumps. Tumor single cell suspensions then underwent magnetic bead based CD45 TIL isolation (Miltenyi Biotec) to obtain CD45+ cells for downstream flow cytometric analysis.
Flow Cytometry To perform cell surface staining, single cell suspensions were washed with FACS buffer containing PBS with 2% FBS (Life Technologies) then incubated with anti-FcR (TruStain FcX™ PLUS, Biolegend) for 10 min on ice to block unspecific binding of antibodies. The following fluorochrome-labeled antibodies were used for Treg, MDSC and TAM labelling: CD4 FITC, CD8 APC/Cy7, CD3 BV510, CD25 APC, CTLA-4 PerCP/Cy5.5, PD-1 PE/Cy7, CCR4 BV421, 4-1BB APC, TGFβ BV421, CD45 Pacific Blue, CD11b PE, Gr-1 PE/Cy7, NKp46 APC, F4-80 FITC, and CD86 APC/Cy7. All cell surface antibodies were purchased from Biolegend.
For intracellular and intranuclear staining, single cell suspensions were first labelled with cell surface antibodies, followed by fixation and permeabilization using the Foxp3 transcription factor buffer set (Thermofisher Scientific). Permeabilized cells were then labelled with Foxp3 PE, Helios PerCP/Cy5.5, IL-17 PE/Cy7, RORγt PerCP-Cy5.5 and/or IFN-γ PerCP-Cy5.5 primary antibodies (Thermofisher Scientific). Cytokine staining using the above buffer and cytokine antibodies from Thermofisher Scientific was verified with the company’s in-house data as well as our own experimental data. This technique allowed us to co-stain for Foxp3, RORγt and IL-17 in the same panel to investigate for T cell reprogramming.
A sample Treg gating strategy is shown (Suppl. Figure 3) whereby Tregs are identified as CD3+CD8-CD4+CD25+Foxp3+ T cells. T effector and Tconv refer to non-Treg CD4 (CD3+CD8-CD4+CD25-Foxp3-) and CD8 (CD3+CD4-CD8+CD25-Foxp3-) T cells respectively.
For cell apoptosis studies, cells were labelled with Zombie NIR and Annexin V (Biolegend). Due to the sensitivity of the phosphatidylserine bond (for Annexin V binding) to the fixation/permeabilization process (for Foxp3 analysis), we did not incorporate Annexin V and Foxp3 co-staining in the same panel. To perform the cell apoptosis studies, freshly obtained single cell suspensions were first labelled with Zombie NIR using a serum-free PBS buffer. Cells were then washed with FACS buffer to perform cell surface staining. The labelled cells were then washed and resuspended in Annexin V binding buffer, stained with Annexin V, and immediately acquired by flow cytometry.
Stained cells were analyzed on a MACSQuant 10 Analyzer, BD FACS Calibur, or BD FACS Canto II at Old Dominion University and Eastern Virginia Medical School. The acquired data was analyzed using FlowJo software.
In Vitro Treg Suppression Assay
CD4+CD25+ Tregs were isolated from dLN of tumor-bearing mice and NPT-treated mice on post-treatment day 2. To obtain a sufficient quantity of Tregs, dLN from 2-3 mice were pooled together for each group. Spleen-derived CD8 responder (Tresp) cells were isolated from naïve mice by negative selection using magnetic beads (Stemcell Technologies). Purified responder cells were labelled with 5 µM CFSE (ThermoFisher Scientific) and plated in a 96-well round-bottom plate at a density of 4 × 10⁴ responder cells per well. CD4+CD25+ Tregs were co-incubated with CFSE-labelled responder cells at the Treg:Tresp ratios 1:1, 1:2 and 1:4. The plates were incubated at 37°C with 5% CO2 for 60 hours in the presence of CD3/CD28 activation beads (ThermoFisher Scientific). Responder cell proliferation was quantified by flow cytometry based on the dilution of the CFSE dye. Treg suppression was calculated in the following manner: %Suppression = [1-(%proliferating Tresp at Treg: Tresp ratio / %proliferating Tresp-only cells)] x100.
Statistical Analysis
All values were reported as the mean ± SD. Analysis of quantitative data, including CD4+/CD8+ T cells, MDSCs, Tregs, TAMs, and their phenotypic, functional and/or death markers, were performed by One Way ANOVA for multiple time-point comparisons or t-test between two groups with a minimum sample size of 3 mice per group. Animal survival was assessed with Kaplan-Meier Survival Analysis (LogRank test). The rate of ISV protection against a second live tumor challenge was analyzed with Chi-square test. Results were considered statistically significant at P-values less than 0.05. Statistical analyses were carried out using Vassarstats (http://vassarstats.net/) and SigmaPlot 12.5 (Systat Software, Inc).
Results
NPT Elicits Strong In Situ Vaccination (ISV) Protection
Following NPT of the primary tumors, mice that underwent complete tumor regression over 7 weeks were then challenged with a second live tumor. (Figure 1A). As shown in Figure 1B, a single NPT elicited a strong ISV effect with 81.5% (22/27) of the animals protected against a second live tumor challenge. This result validated our previous report that a single NPT achieved 100% (11/11) ISV protection in the same 4T1 model [12]. In contrast, none of age-matched naïve mice (0/14) were able to reject the secondary tumor challenges. Noticeably, a small percentage (18.5%, 5/27) of animals, which had been treated with NPT but failed to reject the live tumor challenging, gained a prolonged survival with an approximate 10-14 day (Figure 1B). This is likely because of a slow or delayed tumor growth in these animals at the initial 2-3 weeks following the second tumor challenge.
NPT Induces Antitumor Immune Memory Responses
To characterize early antitumor immune responses, the emergence of tissue resident memory T cells (Trms), the major cytotoxic cell type for eliminating tumors was examined. Following NPT, CD103+CD8+ Trm numbers (Figure 2A) were continuously elevated throughout the first week. The total cell counts significantly increased by 1.9- and 2.4-fold in the dLN by day-3 and day-7, respectively. Consistent with this initial acute local T cell response, the frequencies of both CD4+ and CD8+ memory T cells, both effector memory (Tem, CD44+CD62L-) and central memory (Tcm, CD44+CD62L+) T cells, subsequently increased three months post-treatment. Notably, the frequencies of CD8+ Tcms and Tems were elevated up to 85- and 10-fold in the blood, and 71- and 8-fold in the spleens of NP-treated animals, respectively. This is in contrast to untreated tumor-bearing animals (Figure 2B). Moreover, the numbers of functional cytotoxic T cells or IFN-γ+ CD8+ T cells in spleens were greatly increased up to 13-fold compared to levels in untreated tumor-bearing mice (Figure 2C). The frequencies of CD4+ Tcms and Tems were elevated up to 17- and 4-fold in the blood, and 15- and 4-fold in the spleens of NP-treated animals, respectively, in contrast to those untreated animals (Figure 2D). Similarly, IFN-γ+ CD4+ T cells in spleens were significantly increased up to 9-fold compared to levels in untreated tumor-bearing mice (Figure 2E). Importantly, these memory T cells in spleens also exhibited superior antitumor immunity indicated by the significantly higher production of IFN-γ. The levels of secreted IFN-γ were significantly increased 6- and 58-fold from the splenocytes of NP-treated mice in response to coculture with tumor lysate and CD3 activation, respectively. This is in contrast to those of untreated tumor-bearing mice (Figure 2F).
Considering the immunosuppressive dominance in the 4T1 tumor [20], we next sought to investigate how NPT elicited a strong ISV effect and antitumor immune memory in such an environment. Therefore, the major immunosuppressive cells in the blood, spleen, dLN and TME were examined.
NPT Overturns the Treg Dominance in the TME and Systemically
Treg frequency among CD4 T cells was assessed in the blood (Figure 3A & B), spleen (Figure 3C), dLN (Figure 3D), and TME (Figure 3F). In untreated mice, the Treg percentage among CD4 T cells was 18.6% in blood, 23.8% in spleen, 20.6% in dLN, and 49.5% in tumor tissues. After 4T1 tumor-bearing mice were treated with 100 ns NPT, a significant and sustained drop of Tregs was observed both systemically and locally. The frequencies of Tregs were decreased post-treatment by as much as 52.1% in the TME (4 hour), 42.2% in the dLN (Day 3), 52.3% in the blood (Day 3), and 19.7% in the spleen (Day 7) (Figure 3A-F). The Treg cell count decreased 4.4-fold by 4 hours and 8.1-fold by Day 3 from its untreated intratumoral baseline (Figure 1G). Tconv, in contrast, only decreased 1.4-fold by 4 hours and 2.3-fold from baseline by Day 3 post-treatment. These changes shifted the ratio of intratumoral Treg vs Tconv from 1:1 in untreated tumors, to 1:3 by 4 hours, and 2:7 by Day 3 post-treatment (Figure 1G).
NPT Selectively Eradicates Tregs but Spares CD8 and CD4 Tconv Cells
To understand why NPT resulted in a remarkable decrease in Tregs but less so among Tconv (Figure 3E & F), whether cell death occurred differentially in various subsets of T cells was determined. As shown in Figure 4A-C, both activated (CD44+CD62L-) and naïve (CD44-CD62L+) Treg subsets, were the only T cell populations to exhibit statistically significant increases in apoptotic changes. Activated Tregs exhibited the highest level of apoptosis, seen at 4 hours post-treatment (Figure 4B & D). Importantly, CD4 Tconv and CD8 T cells showed little or no change in apoptosis following NPT (Figure 4C).
Noticeably, all T cell groups, except for the naïve Treg subset, exhibited various levels of apoptotic death in the control mice (Figure 4C). Therefore, the percent changes among the T cell subsets from their baseline apoptotic status to post-NPT apoptosis at 4-hour post-treatment were evaluated. Changes in T cell subset apoptosis were calculated as follows: (% apoptosis at 4-hour post-treatment - % apoptosis in untreated control sample) / % apoptosis in untreated control sample. Tregs exhibited the highest change in apoptosis at 4 hours post-NPT. Activated Tregs, in particular, exhibited a 53.7% increase in apoptosis (Figure 4D), whereas CD8 T cells showed no change and CD4 Tconv had a small but insignificant increase in apoptotic death.
NPT Reduces Treg Suppression Capacity
In vitro Treg suppression assays were conducted to assess if NPT alters the Treg suppression function. Tregs were isolated and incubated with CFSE-labelled CD8 T cells at different Treg:CD8 ratios in the presence of activation beads. Tregs isolated from dLNs of NPT-treated mice exhibited a 50.5% reduced suppression capacity compared to those from untreated tumors (control group) at a 1:1 Treg:CD8 co-culture ratio (Figure 5A). To further explore why the Treg function was impaired, we next examined if various activation markers were altered by NPT. As seen in the Figure 5B, the activated (CD44+CD62L-) Tregs were the initially dominant Treg population in the dLN of tumor-bearing mice. These activated Tregs outnumbered naïve Tregs at a 2:1 ratio. Following NPT, the activated : naïve (CD44-CD62L+) Treg ratio shifted to 1:1 by Day 1, and naïve Tregs became the dominant Treg population by post-treatment Day 3, at an activated : naïve Treg ratio 1:2 (Figure 5B and D).
4-1BB, a T cell activation marker with significant immunotherapeutic potential, was expressed among Tregs in the dLN (Figure 5C and E), tumors (Suppl. Figure 4) and spleens (Figure 5F) of tumor-bearing mice. 4-1BB expression was not found among a) Tregs in the blood, b) Tregs in any healthy (naïve) mouse tissues (Suppl. Figure 5, negative control), or c) conventional CD4 (Suppl. Figure 5) or CD8 T cells of healthy or tumor-bearing mice. A significant reduction in the total number of 4-1BB+ Tregs in the dLN and spleen was observed in days 1-7 following NPT. Day 1 post-NPT had the most pronounced reduction, with a greater than 3-fold reduction in 4-1BB+ Tregs in both the dLN and spleen when compared to untreated tumor-bearing mice (Figure 5E and F). Interestingly, there was an early transient peak among 4-1BB+ Tregs, around 2-fold increase from baseline, by 4 hours post-NPT in the dLN followed by a 7-fold drop by 24 hours post-treatment (Figure 5C and E).
4-1BB+ Tregs were exclusively present among activated Tregs, and they were mostly absent among naïve Tregs in the dLN of tumor-bearing mice (Suppl. Figure 6A). A higher TGFβ expression was also found among 4-1BB+ and activated Tregs (Suppl. Figure 6B) when compared to their 4-1BB- and naïve Treg counterparts. Similar to the changes in 4-1BB expression, this elevated TGFβ expression among dLN Tregs had a transient increase at 4 hours post-NPT, followed by a decline in the days following treatment (Figure 5G and Suppl. Figure 5). While we could clearly observe the above phenotypic changes among dLN Tregs, the few remaining intratumoral Tregs post-NPT made it challenging to properly describe such phenotypic changes among TILs (Suppl. Figure 4).
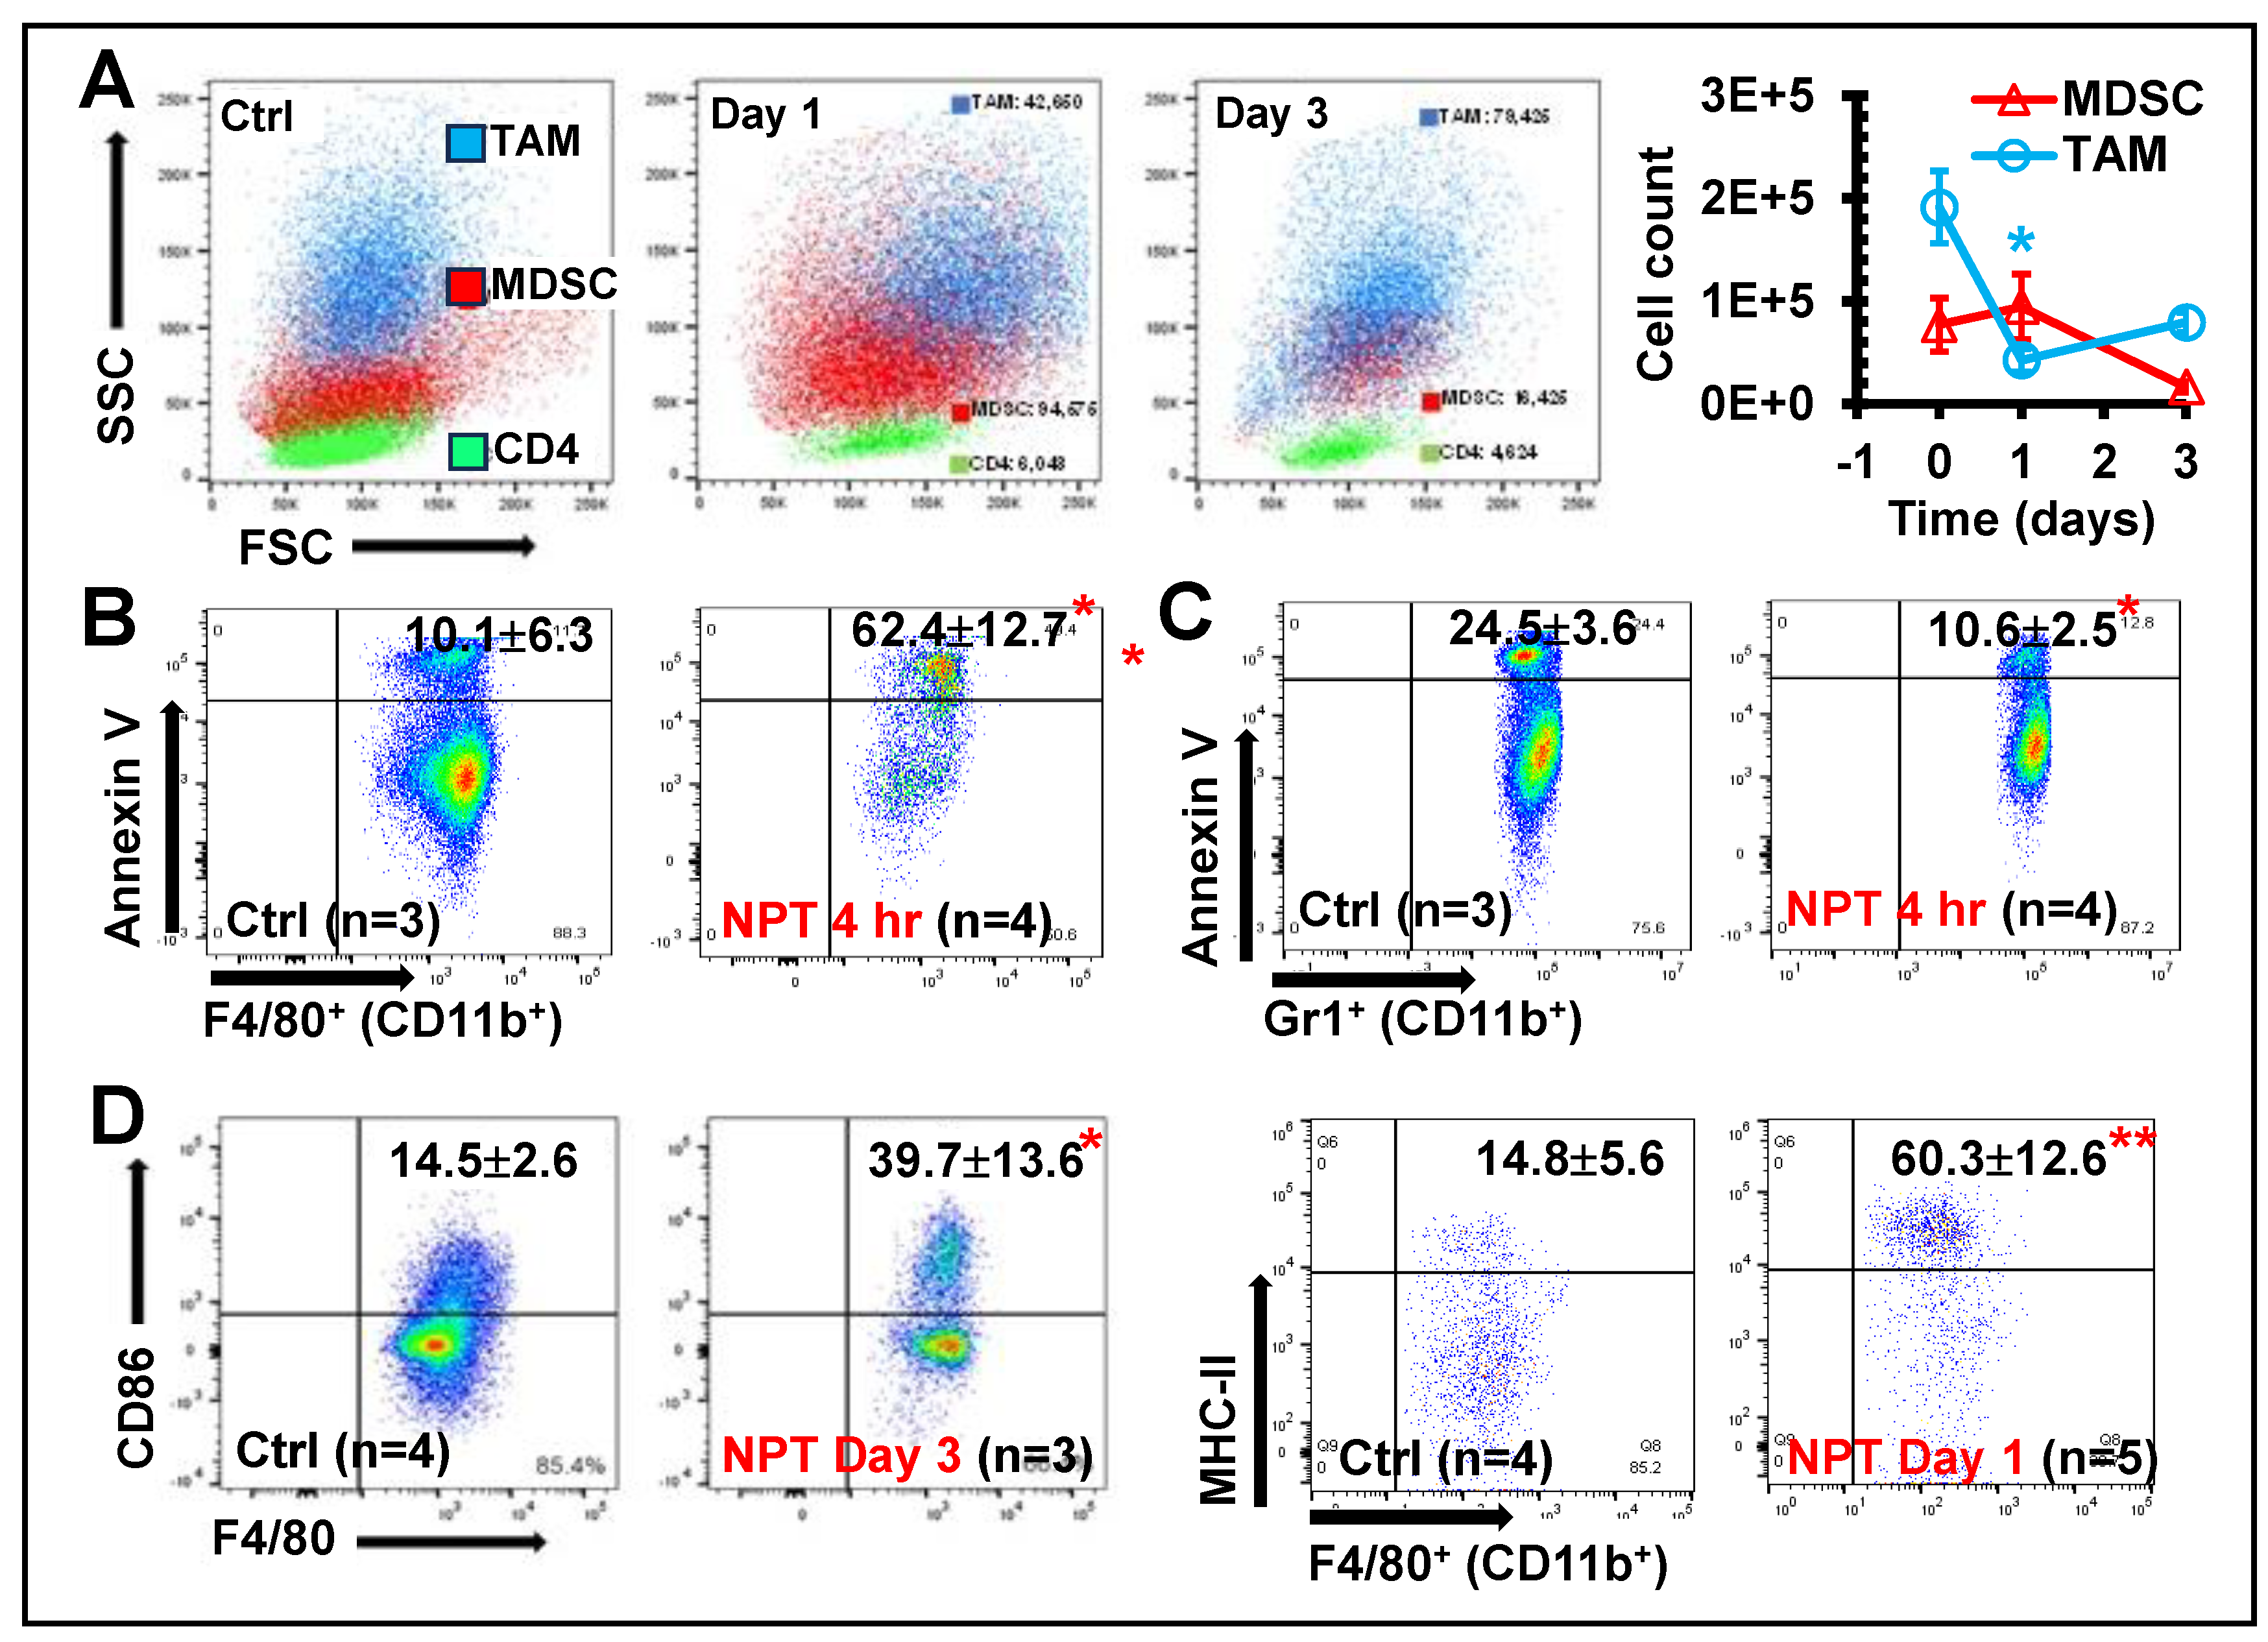
NPT Decreases MDSCs and TAMs with Distinctive Dynamics and Mechanisms
While investigating the intratumoral immune cell changes, backgating was performed to study the distribution of intratumoral TAMs (CD11b+ F4/80+), MDSCs (CD11b+ Gr-1+) and CD3+ T lymphocytes on the forward vs. side scatter plot and found that NPT affected these cell populations differently. TAMs showed a rapid decrease in cell count (by day-1 post-treatment) (Figure 6A), associated with a significant increase in apoptosis as early as 4 hours post-treatment (Figure 6B) and remained below control levels on day-3 post-treatment (Figure 6B). In contrast, MDSC cell counts remained at control levels one day after treatment but decreased by day-3 (Figure 6A). Notably, a 40% decrease in MDSC cell death markers was observed in the TME at 4 hours post-NPT (Figure 6C). To further classify TAMs as M1- and M2- phenotypes, the expression of CD80, CD86, and MHC-II was examined. Both CD86 and MHC-II expressions were significantly upregulated on the TAMs at 1-3 days post-NPT (Figure 6D).
Additionally, the impact of NPT on TAMs in the dLN and MDSCs in blood were assessed. TAMs in the dLN of untreated tumor-bearing mice made up 5.06% of the total CD45+ leukocyte population (Suppl. Figure 7A and B), and MDSCs made up 67.7% of the total blood leukocyte population (Suppl. Figure 7C and D). By day-3 post-NPT, TAM in the dLN and MDSC population in blood were decreased by 90% and 75%, respectively (Suppl. Figure 7). Noticeably, MDSCs made up a very small fraction of the dLN total leukocyte population (around 0.10%) and declined to a negligible value (less than 0.02%) following NPT.
Discussion
In situ vaccination is a 130-year-old concept that has had some efficacy but with initial controversies. The original approach came from reports by Dr. William Coley in the 1890s using microorganisms, a mixture of Streptococcus pyogenes and Serratia marcescens, to treat unresectable sarcoma. Although Coley developed a variety of strategies, the approach was not widely accepted because of minimal quality control of the microbial reagent caused a lack of reproducibility. In 1957 a study [21] showed that tumors could be recognized by the immune system beginning a slow increase in tumor immunotherapy research. In 1959, Bacilus Calmette-Guerin (BCG) was first reported as an ISV approach to treat mouse fibrosarcoma [22]. Later, clinical studies demonstrated its efficacy and safety in bladder cancer, which lead to the FDA approval of the first cancer immunotherapy in history. The BCG approach presented no cancer antigens but activated the immune system.
In addition to BCG, toll-like receptor (TLR) agonists, oncolytic viruses, cytokines, radiation and hypothermia [8], emerging novel drugs/technologies including checkpoint inhibitors, nanoparticles, electrochemotherapy (ECT) [23, 24], gene electro-transfer (GET) [25, 26] and NPT [12, 17, 27] can serve as ISV approaches as well. The most documented phenomenon but rare occurrence is the radiation oncologists’ term of an abscopal effect. In these rare cases irradiation shrinks one localized tumor then shrinks tumors outside the irradiated zone. Radiation damage to tumors can therefore stimulate systemic antitumor immunity leading to the regression of metastatic cancer. Like radiation, moderate hyperthermia with iron oxide nanoparticles and an alternating magnetic field induces local hyperthermia to damage tumors, demonstrating a promising potential of local hyperthermia treatment to induce anti-tumor immune responses [28]. A combination of ECT with peritumoral IL-12 GET enhanced successful tumor treatment as ISV [23]. It was also shown that the administration of three treatments of intratumoral plasmid encoding IL-12 GET to B16 melanoma cells had a therapeutic effect on primary tumors as well as distant lung nodes and exhibited resistance to challenges with live B16 cells [26].
Mechanistically there are two aspects for optimal ISV, both of which are satisfied by NPT, while the other strategies require two different treatments to embrace each attribute. The first feature is the conversion of the TME from immunosuppressive to immunostimulatory. The studies reported the regression of Tregs and TAMs by apoptosis and MDSC by another cell death mechanism. This event provided an environment for the simultaneous rise in CD8+CD103+ tissue-resident memory T cells and TAM M1 polarization. The second independent mechanism is the production of immunogenic cell death (ICD) molecules. NPT induced the release of ATP, calreticulin, and HMGB [12]. Our observations support NPT as a novel type of ISV approach. However, whether NPT can modify the TME, especially whether it can directly impact immune cells and their function, has not been explored. Our research discoveries here provide further insight into NPT-induced antitumor immunity of which NPT has a profound impact on immunosuppressive cells in the TME in this 4T1-luc model.
NPT appears to collapse all three major immunosuppressive cell populations in the TME. Interestingly, the distinctive cell frequency and death marker changes among each group hints at the involvement of distinctive population-specific intrinsic mechanisms. A rapid drop of cell counts concomitant with the presence of apoptotic death markers as early as 4 hours post-NPT occurs in both Tregs and TAMs. These results indicate NPT likely induces cell death or directly kills these suppressive cells. However, a delayed decrease of cell counts takes place in MDSCs at day-3 post-NPT. This result together with a reduction in apoptotic markers 4 hours post-treatment suggests an alternative mechanism behind how NPT diminishes MDSCs. Considering the increase of dendritic cells in the TME previously reported by our group in both 4T1 breast [12] and Pan02 pancreatic [13] cancer models, we suspect that NPT may shrink the MDSC population not by direct induction of cell death but rather by promotion of MDSC differentiation into dendritic cells (DCs). The differentiated DCs can further participate in antigen-presentation and promote antitumor T cell response. This postulate needs further investigation.
A significant discovery in this study is the selective cytotoxicity of NPT to Tregs while effector CD4+ and CD8+ T cells are spared. Treg predominance suggests worse outcomes for many cancer types, including breast, while a high CD8+ or CD8+/Treg ratio is associated with better prognosis [29-32]. A significant knockdown of Tregs and increase of effector CD4+ and CD8+/Treg ratios would favor the induction of antitumor immunity. Prior studies by Plaza-Sirvent et al. may help clarify the above selective cytotoxicity observation. The group demonstrated that Tregs had an increased sensitivity to apoptosis compared to Tconv [33]. This sensitivity was correlated with a lower expression of c-FlipL, a member of the extrinsic apoptosis family, among Tregs when compared to Tconv. Among Tregs, the increased sensitivity to apoptosis was mostly restricted to activated CD44+CD62L- Tregs when compared to naïve CD44-CD62L+ Tregs [33]. Mirandola et al. reported that both resting and activated CD8+ T cells showed a high expression of c-FLIPs as well [34]. These studies are consistent with our findings that the ratios of activated Tregs (CD44+CD62L-) to naïve Tregs (CD44-CD62L+) and Tregs to CD8+ T cells significantly decreased on days 1 and 3 after NPT. The lower c-FlipL expression in activated Tregs may explain why they are more vulnerable than their Tconv/CD8+ counterparts to apoptotic changes resulting from NPT. Our results also support a proposal by Drs. Overacre-Delgoffe and Vignali who suggested that Treg fragility may be a valuable target for effective antitumor immunity [35].
Another important finding is the ability of NPT to impair the Treg suppressive function, likely via the selective removal of the activated Treg (CD44+CD62L-) phenotype discussed above. The analysis of functional markers, including 4-1BB and TGFβ expression, further supports this concept. The expressions of both 4-1BB and TGFβ are dramatically diminished at 1-day post-NPT and remain at low levels for at least one week. These findings show a distinct contrast to results from radiotherapy, which has been studied as an ISV or enhancement for immune outcomes. Radiotherapy has been demonstrated to not only increase the frequency of Tregs by promoting their proliferation but also amplify their functional capacity [36-39]. Noticeably, the dynamics of Tregs are very different between radiotherapy and NPT. NPT rapidly shrinks Tregs as early as at 4 hours post treatment and sustains the low level for at least one week whereas radiotherapy expands Tregs 3 days after treatment then maintains the high level for 9-13 days [37, 39]. The mechanisms behind these distinct Treg responses between NPT and radiotherapy warrant further exploration.
We also note that 4-1BB is exclusively expressed among Foxp3+ CD4 Tregs in tumor-bearing mice, absent among other T cell subsets, and entirely absent in naïve mice T cells. 4-1BB expression on Tregs is also downregulated post-treatment, making it an excellent marker to track the impact of NPT on the local and systemic Treg dynamics. Additionally, studies suggest that 4-1BB is a valuable therapeutic target to enhance antitumor immunity [40, 41]. 4-1BB targeting therapy can greatly improve the efficacy of immunotherapy via the depletion of Tregs [40]. The depletion of 4-1BB+ Tregs can inhibit tumor growth, and Tregs lacking 4-1BB exhibit impaired suppressive function [41]. Although no systemic antibody is administered in our study, the depletion of 4-1BB+ Tregs can still be achieved by NPT. This non-drug approach to selectively deplete active Tregs has great potential for cancer immunotherapy because it should minimize immune-related adverse events commonly associated with systemic immunotherapy.
As the TME immunosuppressive prevalence is being removed, the initiation of antitumor immune responses is evidenced with rapid DC activation, TAM-M1 polarization and CD8+ Trm elevation. Thus, NPT encourages coordinate host changes in both the lymphoid and myeloid immune systems to shift from an immunosuppressive to an immunostimulatory performance as part of NPT-induced immune responses. Consequently, the dramatic increase of long-term effector and central memory T cells and their cytotoxic function is consistent with a strong ISV effect whereby the complete rejection (or delayed tumor growth) of the secondary tumor challenge is achieved following successful treatment of the primary tumor.
While this study did not examine other immunosuppressive cells such as tumor-associated fibroblasts, tumor-associated neutrophils, regulatory B cells, etc., the reversal of an immunosuppressive to an immunostimulatory TME supports these findings of ISV and a significant landscape for immunity in this model. The characterization of other immunosuppressive cells would be appropriate in the future study. Whether this reversed immunosuppression and induced ISV is NPT-parameter dependent is another topic that needs further investigation. So far, our available data implies that NPT with short durations, fast rise times, and high electric field strengths seem better than those with long pulse durations with low electric field strengths. NPT with 100 ns and 40-50 kV/cm was reported to result in 75-100% ISV protect in Pan02 pancreatic [17], 4T1 breast [12] and N1S1 liver cancer [27] models whereas NPT with 200 ns and 25-30 kV/cm only leads to 33.3% and 0% ISV protection in B16 melanoma [42] and Pan02 pancreatic cancer [13] models, respectively. Nevertheless, whether the NPT-induced ISV is tumor- intrinsic or NPT-parameter dependent can be determined by utilizing the same cancer model treated with various sets of NPT parameters. Our group is also investigating the molecular mechanisms of NPT-selective toxicity to Tregs over effector T cells and how NPT diminishes MDSCs without the induction of extra cell death.
Conclusions:
We demonstrated that NPT, a pulsed power technology, can be utilized as a non-drug electrical ISV approach for the ablation of primary tumors to induce a strong T cell immune memory response and protect animals against secondary tumor challenges in a poorly immunogenic mouse breast cancer model. NPT inverted the TME from immunosuppressive to immunostimulatory status via the destruction/reduction of Tregs, TAMs and MDSCs with the preservation of effector T cells and the promotion of TAM-M1 polarization and tissue-resident memory T cells. NPT undermined the suppressor function of Tregs and selectively eradicated activated Tregs. Consequently, long-term antitumor T cell memory was established to achieve ISV protection. These findings add pulsed-power technology as a novel ISV strategy, which makes it stand out among other ISV agents and modalities.
Funding
This work was supported by funding from the National Cancer Institute grant R21 CA229939 to S. Guo and funding from the Virginia Catalyst to S.J. Beebe and S. Guo.
Acknowledgments
The authors thank Dr. Piotr Kraj lab for his support and guidance on Tregs, Dr. Chunqi Jiang’s lab for her engineering support, Dr. Woong-Ki Kim for his expertise on macrophages and help with flow cytometry. We thank Dr. Yu Jing who manages the core lab, and SoBran personnel who manage the ODU animal facility.
Conflicts of Interest
S.J. Beebe owns stock in Pulse Biosciences, Inc. (Hayward, CA, USA). The other authors declare the research was conducted in the absence of any commercial or financial relationships that could be construed as a potential conflict of interest.
References
- Emens, L.A. , Breast Cancer Immunotherapy: Facts and Hopes. Clin Cancer Res, 2018. 24(3): p. 511-520.
- Santa-Maria, C.A. and R. Nanda, Immune Checkpoint Inhibitor Therapy in Breast Cancer. J Natl Compr Canc Netw, 2018. 16(10): p. 1259-1268.
- Wein, L. , et al., Checkpoint blockade in the treatment of breast cancer: current status and future directions. Br J Cancer, 2018. 119(1): p. 4-11.
- Lin, H.J. , et al., Breast Cancer Tumor Microenvironment and Molecular Aberrations Hijack Tumoricidal Immunity. Cancers (Basel), 2022. 14(2).
- Retecki, K. , et al., The Immune Landscape of Breast Cancer: Strategies for Overcoming Immunotherapy Resistance. Cancers (Basel), 2021. 13(23).
- Park, K., M. S. Veena, and D.S. Shin, Key Players of the Immunosuppressive Tumor Microenvironment and Emerging Therapeutic Strategies. Front Cell Dev Biol, 2022. 10: p. 830208.
- Barnestein, R. , et al., Immunosuppressive tumor microenvironment modulation by chemotherapies and targeted therapies to enhance immunotherapy effectiveness. Oncoimmunology, 2022. 11(1): p. 2120676.
- Sheen, M.R. and S. Fiering, In situ vaccination: Harvesting low hanging fruit on the cancer immunotherapy tree. Wiley Interdiscip Rev Nanomed Nanobiotechnol, 2019. 11(1): p. e1524.
- Castiello, L. , et al., In situ Vaccination by Direct Dendritic Cell Inoculation: The Coming of Age of an Old Idea? Front Immunol, 2019. 10: p. 2303.
- Schoenbach, K.H., S. J. Beebe, and E.S. Buescher, Intracellular effect of ultrashort electrical pulses. Bioelectromagnetics, 2001. 22(6): p. 440-8.
- Kolb, J.F., S. Kono, and K.H. Schoenbach, Nanosecond pulsed electric field generators for the study of subcellular effects. Bioelectromagnetics, 2006. 27(3): p. 172-87.
- Guo, S. , et al., Nano-pulse stimulation induces potent immune responses, eradicating local breast cancer while reducing distant metastases. Int J Cancer, 2018. 142(3): p. 629-640.
- Guo, S. , et al., Nano-Pulse Stimulation for the Treatment of Pancreatic Cancer and the Changes in Immune Profile. Cancers (Basel), 2018. 10(7).
- Edelblute, C.M. , et al., Moderate Heat Application Enhances the Efficacy of Nanosecond Pulse Stimulation for the Treatment of Squamous Cell Carcinoma. Technol Cancer Res Treat, 2018. 17: p. 1533033818802305.
- Chen, X. , et al., Long term survival of mice with hepatocellular carcinoma after pulse power ablation with nanosecond pulsed electric fields. Technol Cancer Res Treat, 2012. 11(1): p. 83-93.
- Nuccitelli, R. , et al., Nanosecond pulsed electric fields cause melanomas to self-destruct. Biochem Biophys Res Commun, 2006. 343(2): p. 351-60.
- Guo S., B. N.I., Edelblute C. M., Hornef J., Jiang C., Schoenbach K., Heller R. and Beebe S. J., Enhanced electric pulse technology for the ablation of pancreatic cancer. Pancreatic Cancer (Book), 2018. In Luis Rodrigo (Ed.)((in press)): p. Rijeka, Croatia: Intech.
- Geng, F. , et al., Doxorubicin pretreatment enhances FAPalpha/survivin co-targeting DNA vaccine anti-tumor activity primarily through decreasing peripheral MDSCs in the 4T1 murine breast cancer model. Oncoimmunology, 2020. 9(1): p. 1747350.
- Steenbrugge, J., et al., Comparative Profiling of Metastatic 4T1- vs. Non-metastatic Py230-Based Mammary Tumors in an Intraductal Model for Triple-Negative Breast Cancer. Front Immunol, 2019. 10: p. 2928.
- Ledys, F. , et al., Therapeutic Associations Comprising Anti-PD-1/PD-L1 in Breast Cancer: Clinical Challenges and Perspectives. Cancers (Basel), 2021. 13(23).
- Prehn, R.T. and J.M. Main, Immunity to methylcholanthrene-induced sarcomas. J Natl Cancer Inst, 1957. 18(6): p. 769-78.
- Old, L.J., D. A. Clarke, and B. Benacerraf, Effect of Bacillus Calmette-Guerin infection on transplanted tumours in the mouse. Nature, 1959. 184(Suppl 5): p. 291-2.
- Sersa, G. , et al., Electrochemotherapy of tumors as in situ vaccination boosted by immunogene electrotransfer. Cancer Immunology Immunotherapy, 2015. 64(10): p. 1315-1327.
- Roux, S. , et al., Tumor destruction using electrochemotherapy followed by CpG oligodeoxynucleotide injection induces distant tumor responses. Cancer Immunol Immunother, 2008. 57(9): p. 1291-300.
- Marrero, B., S. Shirley, and R. Heller, Delivery of interleukin-15 to B16 melanoma by electroporation leads to tumor regression and long-term survival. Technol Cancer Res Treat, 2014. 13(6): p. 551-60.
- Lucas, M.L. and R. Heller, IL-12 gene therapy using an electrically mediated nonviral approach reduces metastatic growth of melanoma. DNA Cell Biol, 2003. 22(12): p. 755-63.
- Chen, R. , et al., A protective effect after clearance of orthotopic rat hepatocellular carcinoma by nanosecond pulsed electric fields. Eur J Cancer, 2014. 50(15): p. 2705-13.
- Toraya-Brown, S. , et al., Local hyperthermia treatment of tumors induces CD8(+) T cell-mediated resistance against distal and secondary tumors. Nanomedicine, 2014. 10(6): p. 1273-1285.
- Shang, B. , et al., Prognostic value of tumor-infiltrating FoxP3+ regulatory T cells in cancers: a systematic review and meta-analysis. Sci Rep, 2015. 5: p. 15179.
- Jaaskelainen, M.M. , et al., The prognostic and predictive role of tumor-infiltrating lymphocytes (FoxP3 + and CD8 +) and tumor-associated macrophages in early HER2 + breast cancer. Breast Cancer Res Treat, 2023. 201(2): p. 183-192.
- Stenstrom, J., I. Hedenfalk, and C. Hagerling, Regulatory T lymphocyte infiltration in metastatic breast cancer-an independent prognostic factor that changes with tumor progression. Breast Cancer Res, 2021. 23(1): p. 27.
- Shou, J. , et al., Worse outcome in breast cancer with higher tumor-infiltrating FOXP3+ Tregs : a systematic review and meta-analysis. BMC Cancer, 2016. 16(1): p. 687.
- Plaza-Sirvent, C. , et al., c-FLIP Expression in Foxp3-Expressing Cells Is Essential for Survival of Regulatory T Cells and Prevention of Autoimmunity. Cell Rep, 2017. 18(1): p. 12-22.
- Mirandola, P. , et al., Activated human NK and CD8+ T cells express both TNF-related apoptosis-inducing ligand (TRAIL) and TRAIL receptors but are resistant to TRAIL-mediated cytotoxicity. Blood, 2004. 104(8): p. 2418-24.
- Overacre-Delgoffe, A.E. and D.A.A. Vignali, Treg Fragility: A Prerequisite for Effective Antitumor Immunity? Cancer Immunol Res, 2018. 6(8): p. 882-887.
- Muroyama, Y. , et al., Stereotactic Radiotherapy Increases Functionally Suppressive Regulatory T Cells in the Tumor Microenvironment. Cancer Immunol Res, 2017. 5(11): p. 992-1004.
- Sia, J. , et al., Regulatory T Cells Shape the Differential Impact of Radiation Dose-Fractionation Schedules on Host Innate and Adaptive Antitumor Immune Defenses. Int J Radiat Oncol Biol Phys, 2021. 111(2): p. 502-514.
- Anderson, B.E. , et al., Recipient CD4+ T cells that survive irradiation regulate chronic graft-versus-host disease. Blood, 2004. 104(5): p. 1565-73.
- Schaue, D. , et al., Maximizing tumor immunity with fractionated radiation. Int J Radiat Oncol Biol Phys, 2012. 83(4): p. 1306-10.
- Palmeri, J.R. , et al., CD8(+) T cell priming that is required for curative intratumorally anchored anti-4-1BB immunotherapy is constrained by Tregs. Nat Commun, 2024. 15(1): p. 1900.
- Freeman, Z.T. , et al., A conserved intratumoral regulatory T cell signature identifies 4-1BB as a pan-cancer target. J Clin Invest, 2020. 130(3): p. 1405-1416.
- Rossi, A. , et al., Mechanisms and immunogenicity of nsPEF-induced cell death in B16F10 melanoma tumors. Sci Rep, 2019. 9(1): p. 431.
Figure 1.
NPT tumor ablation results in in situ vaccination protection. A: NPT and tumor rechallenging
scheme. Female BALB/c mice with orthotopic tumors (6-8 mm) are treated with NPT.
Animals tumor free over 7 weeks are challenged orthotopically (4T1-luc) with 0.5 x 10⁶ live tumor
cells. Ctrl: age-matched naïve mice without prior NPT. NPT: mice tumor free over 7 weeks after NPT
(100ns, 40-50 kV/cm, 3 Hz and 1000 pulses) treatment are rechallenged with live tumor cells. B and C:
4T1 tumor growth and survival curves of animals following a second live tumor challenge: The
number of tumor free vs total mice are indicated. ***: p<0.001.

Figure 2.
NPT elicits antitumor memory response. A: Cell counts of CD8+ Trms in per million CD45+
cells in dLNs. D0, D3 and D7: Day-0, -3, and -7. B, D: CD8+ (B) and CD4+ (D) memory T cells in the
blood and spleens of mice. Tcm: CD44+CD62L+ T cells; Tem: CD44+CD62L- T cells. C, E: IFN-γ+ CD8+
(C) and CD4+ (E) T cells from splenocytes after 6-hour incubations with plate bound anti-CD3. F: IFN-
γ product of splenocytes after 24-hour incubations with tumor lysate. Groups: Tumor: untreated
tumor-bearing mice and NPT: NPT treated mice. Note: In B-F, tumor mice were at the end point for
euthanasia (age 15-16 weeks) while NPT-mice were euthanized post-treatment 3 months (age 21-22
weeks). N=3-5. Error bars: SD. *: p<0.05, **: p<0.01, and ***: p<0.001 (One-way ANOVA or t-test).
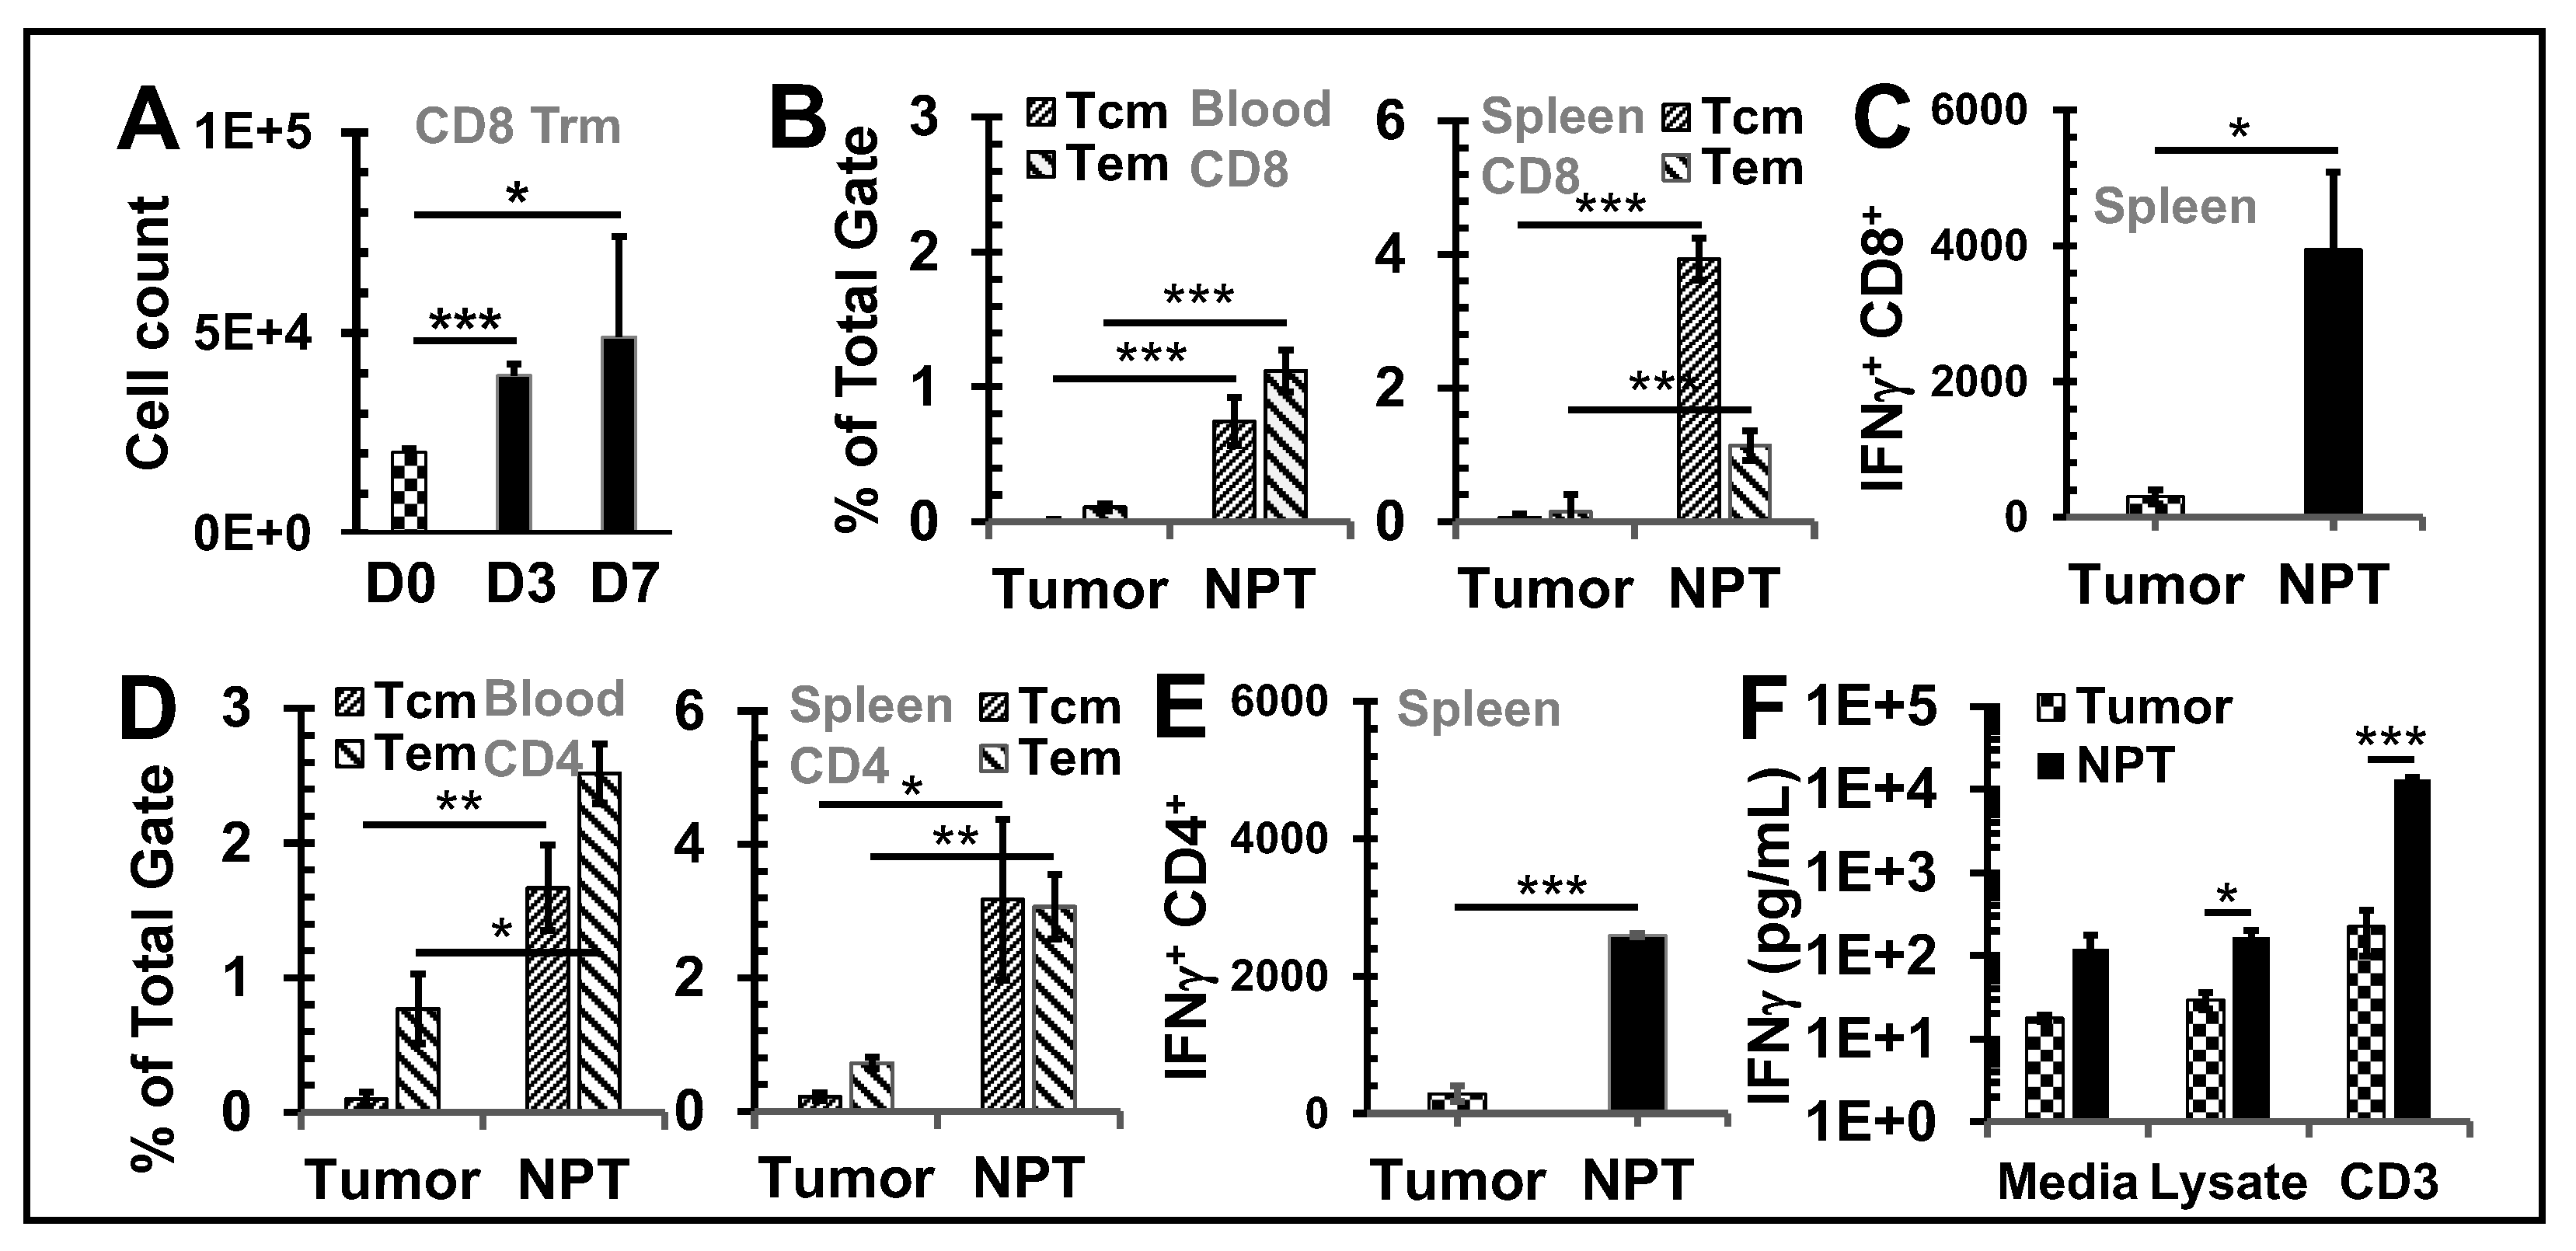
Figure 3.
NPT reverses the Treg dominance locally and systemically Breast tumors were established
with an injection of 1x10⁶ 4T1-luc cells into the posterior part of the mammary fat pad. The control
group (n=4) received the tumor inoculation only. The remaining mice underwent NPT (100 ns pulses,
50 kV/cm, 3 Hz, 1000 pulses) on Day 11 following tumor inoculation. The treated mice were
euthanized 4 hours (4hr), 8 hours (8hr), and on Day 1 (D1), Day 3 (D3), and Day 7 (D7) post-NPT.
Their tumor tissues, tumor-draining lymph nodes (dLN), blood and spleens were harvested. Control
tissues were obtained from mice with untreated tumors. A: Summary flow plots represent Foxp3+
Tregs and Foxp3- Tconv among the total CD4+ T cell population in the blood. B-D: Quantitative bar
graphs depict the percentage of Tregs among the CD4+ T cell population in blood (B), spleens (C) or
dLNs (D). E: The Tconv/Treg ratios dLNs. F: TIL Tregs are represented in quantitative bar graphs as
the percentage of Tregs among CD4+ TILs. G: A standardized CD4 Treg vs CD4 Tconv cell count. N=4
per group. Error bars, SD. **: p < 0.01 and *: p < 0.05 (one-way ANOVA).
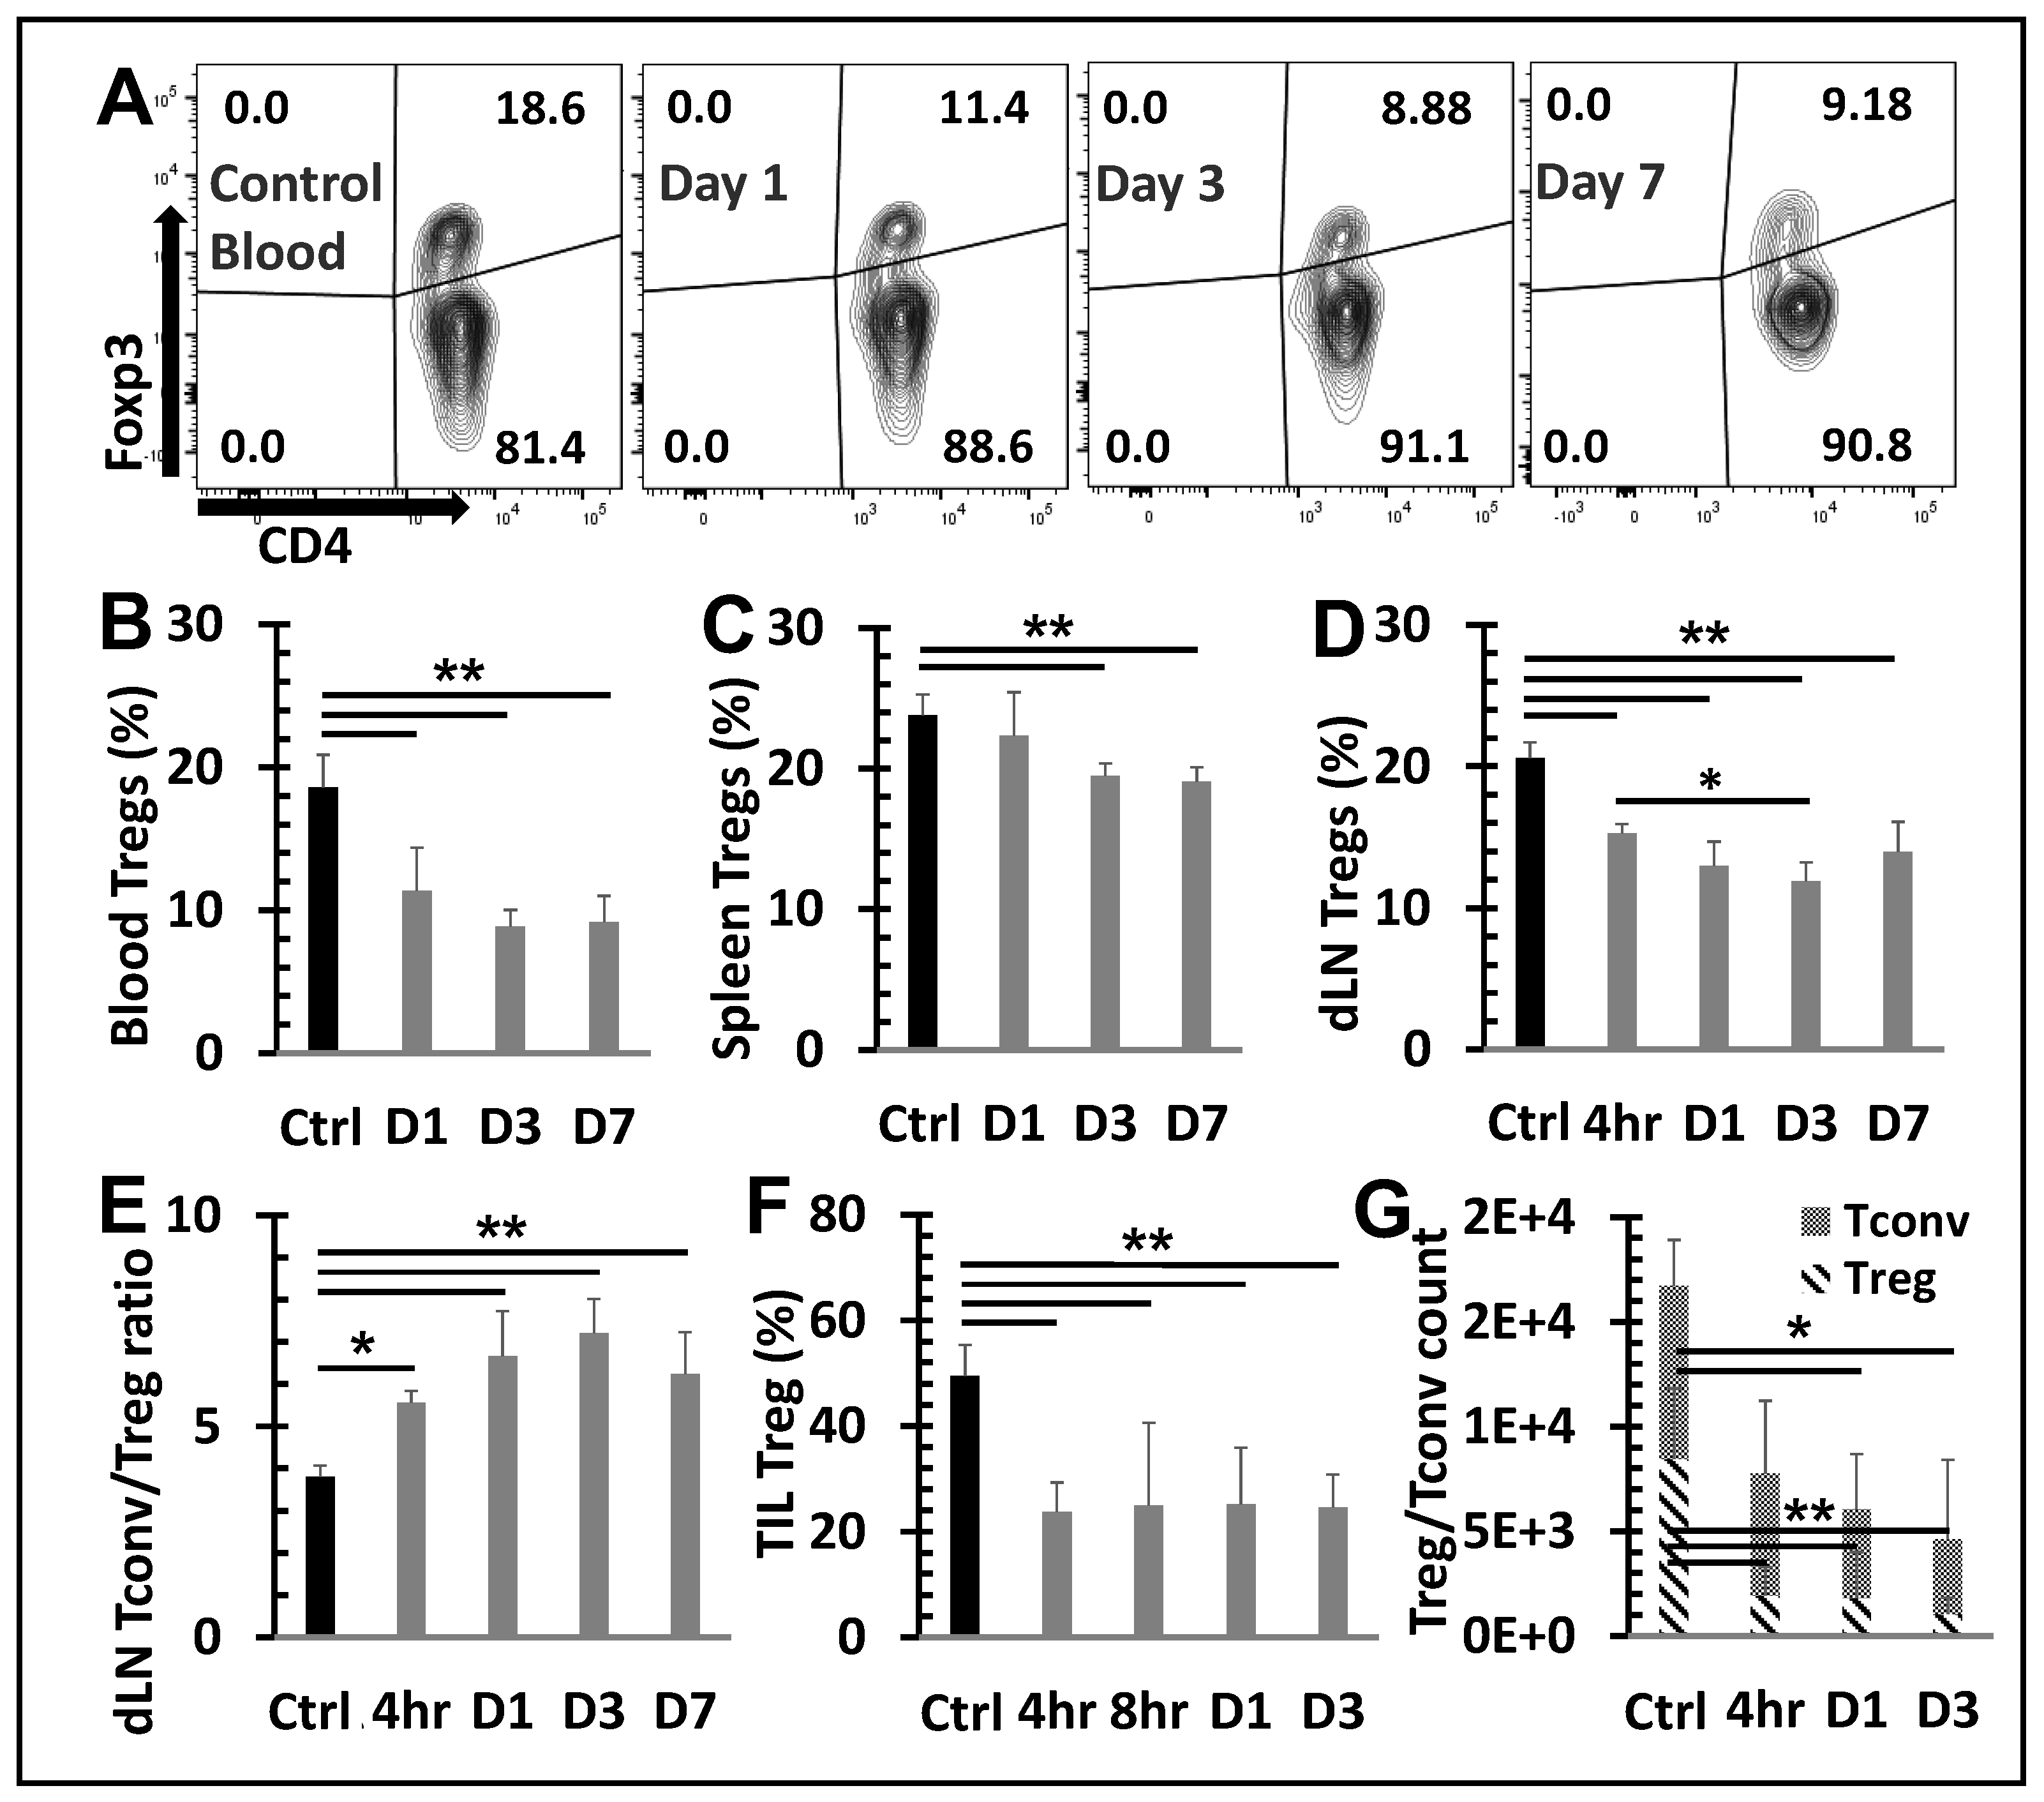
Figure 4.
Changes in apoptosis among T cells subsets following NPT.A and B, Summary flow plots
represent Annexin V expression among activated and naïve Treg subsets in the dLN at 4-hour and 1-
day post-NPT. C, Quantitative graph shows Annexin V expression among CD8, CD4 Tconv, CD4
total Treg, activated Treg and naïve Treg subsets in the dLN at 4-hour and 1-day post-NPT. N=4 per
group. Error bars, SD. D, Quantitative graph shows the percentage of Annexin V expression increase,
among the above subsets, from the untreated Control to 4-hour post-treatment. Error bars, SE. *: p <
0.05 and **: p < 0.01 (One-way ANOVA).
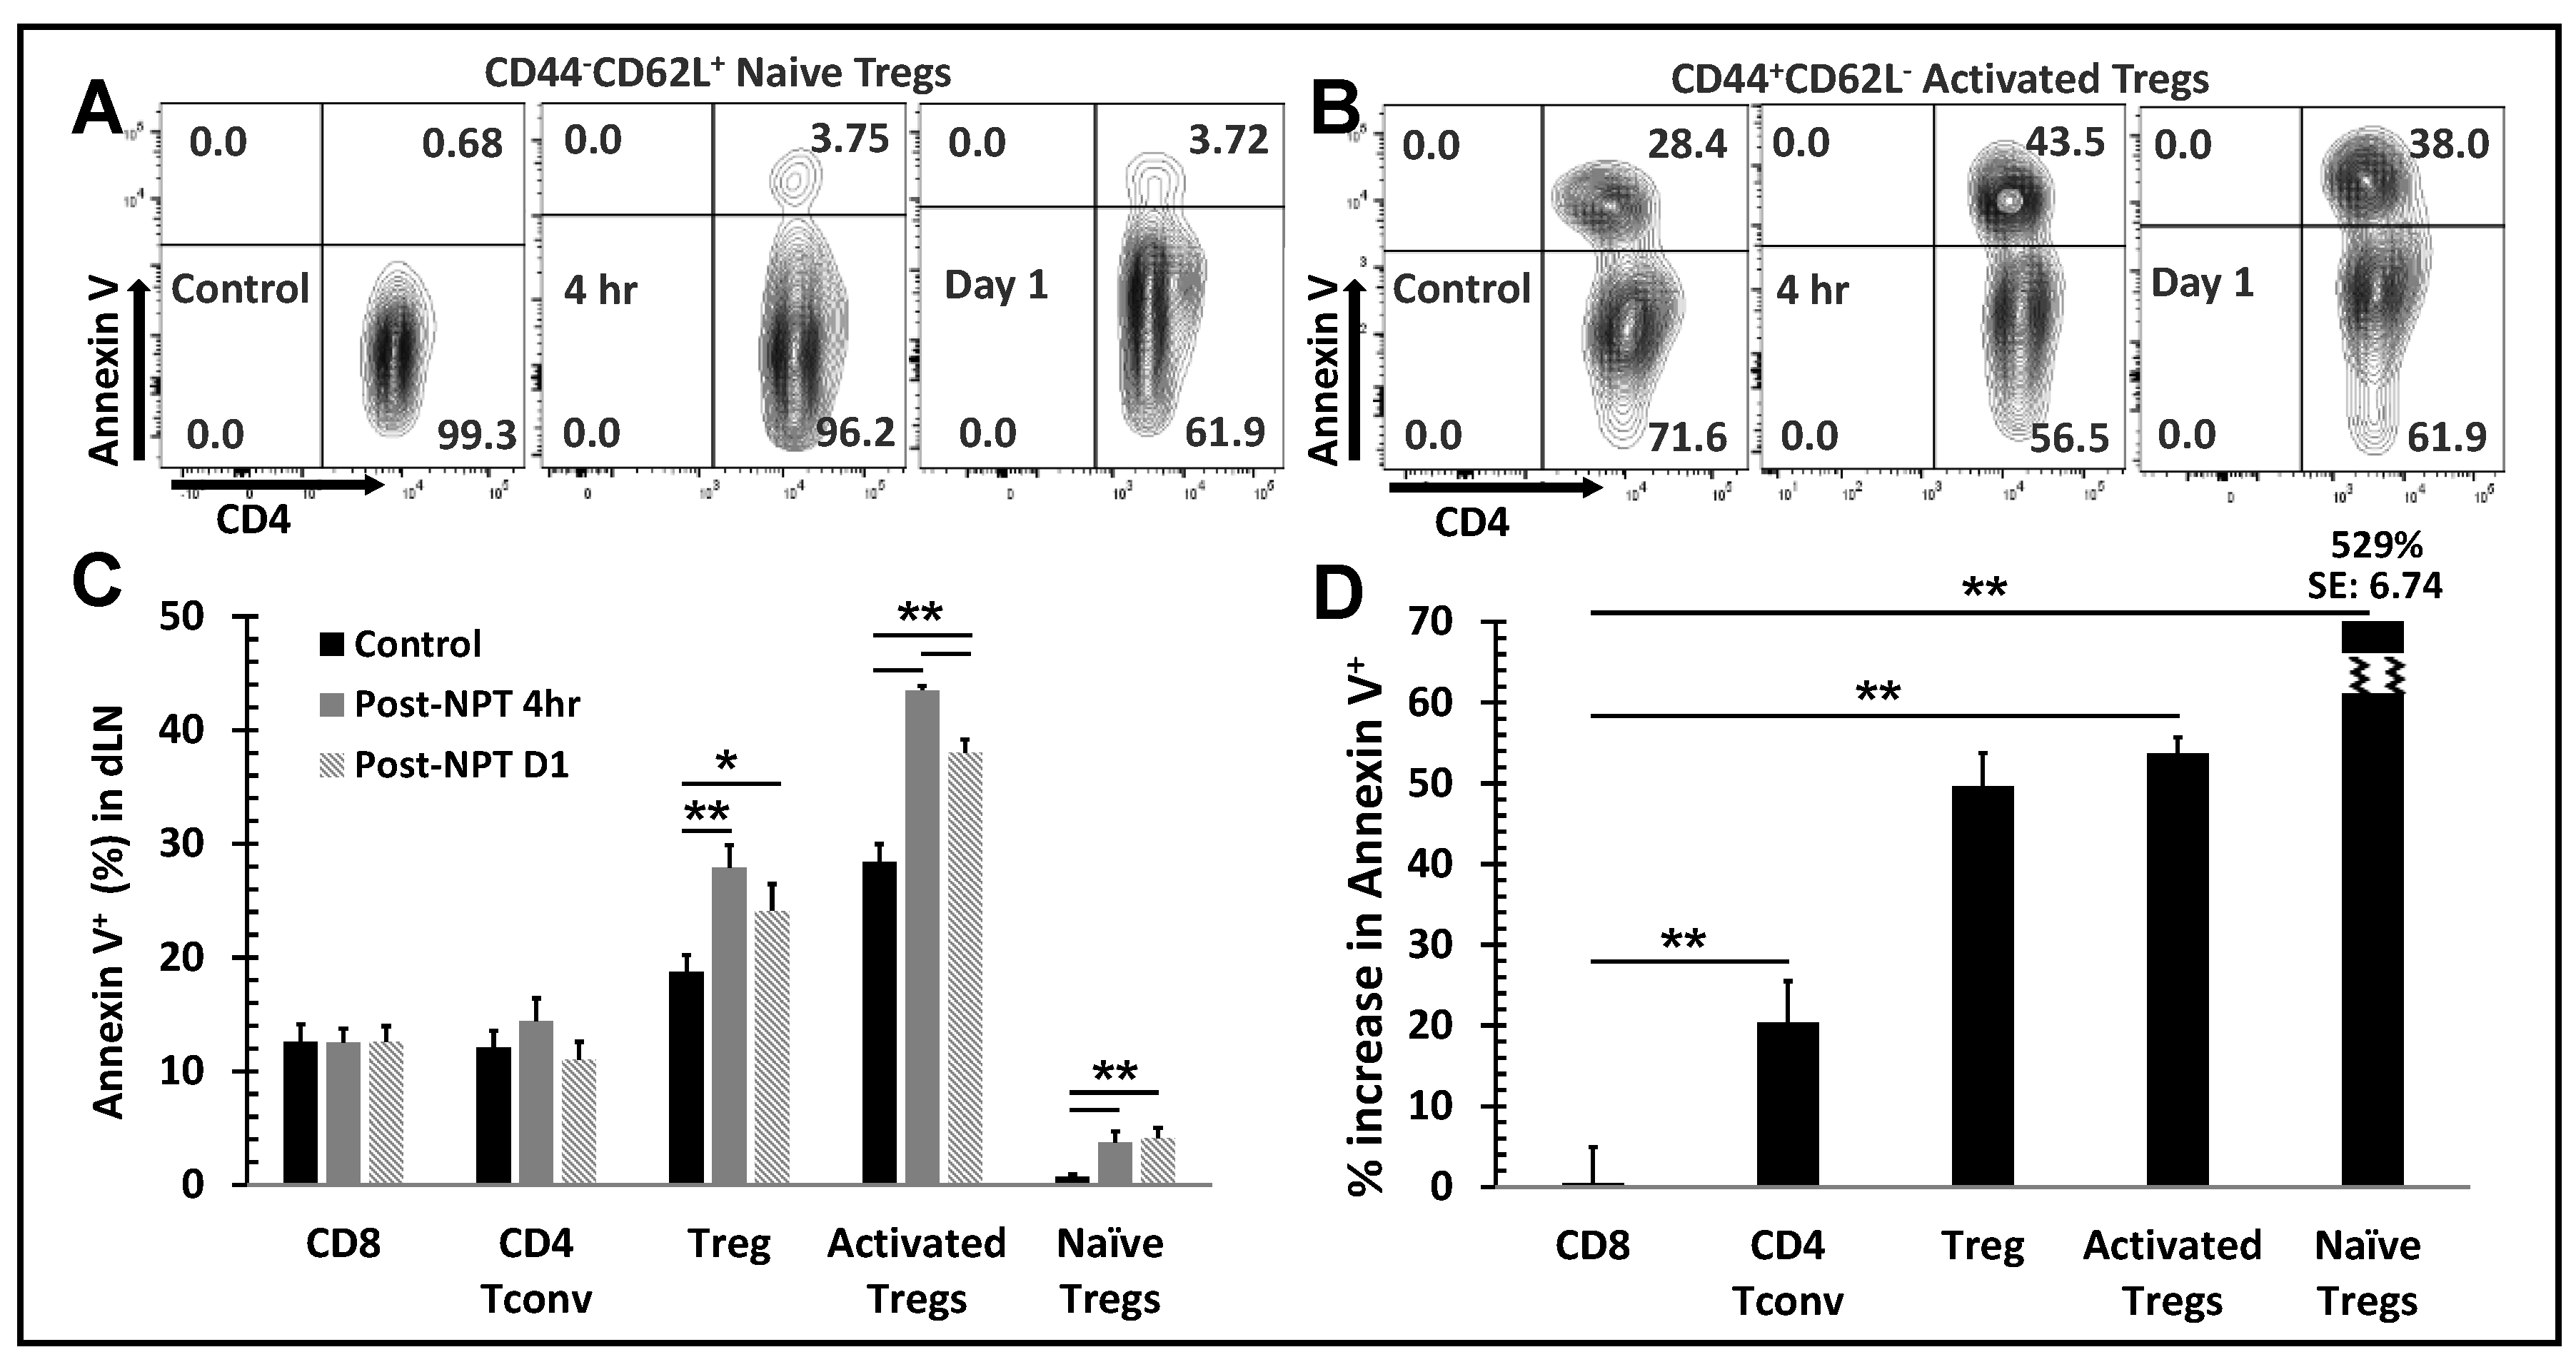
Figure 5.
NPT eradicates activated Tregs and impairs Treg function. A:In vitro suppression assay
showed a reduced functional suppression capacity of Tregs isolated from the NPS-treated mice. Tregs
isolated from dLNs of tumor-bearing (Ctrl) or NPT-treated (NPT) mice were incubated with CFSElabelled
responder cells at the Treg:Tresponder ratios 1:1, 1:2 and 1:4 for 60 hours in the presence of
CD3/CD28 activation beads. Responder cell proliferation was analyzed based on the dilution of the
CFSE dye. The quantitative plots represent the percentage suppression at each Treg:Tresponder ratio
in the control and treatment groups. B &D: Changes in activated and naïve Treg distribution in the
dLN are represented in the summary flow plots (B) and quantitative bar graphs (D). C, E&F:
Phenotypic changes in the 4-1BB activation marker expression among Foxp3+ Tregs are represented
in the summary flow plots (C) and quantitative bar graphs (E and F) in the dLN (C and E) and spleen
(F). G: Changes in the TGFβ expression among Tregs in the dLN is represented in the quantitative
bar graph. N=4 per group. Error bars, SD. *: p < 0.05 and **: p < 0.01 (One-way ANOVA).
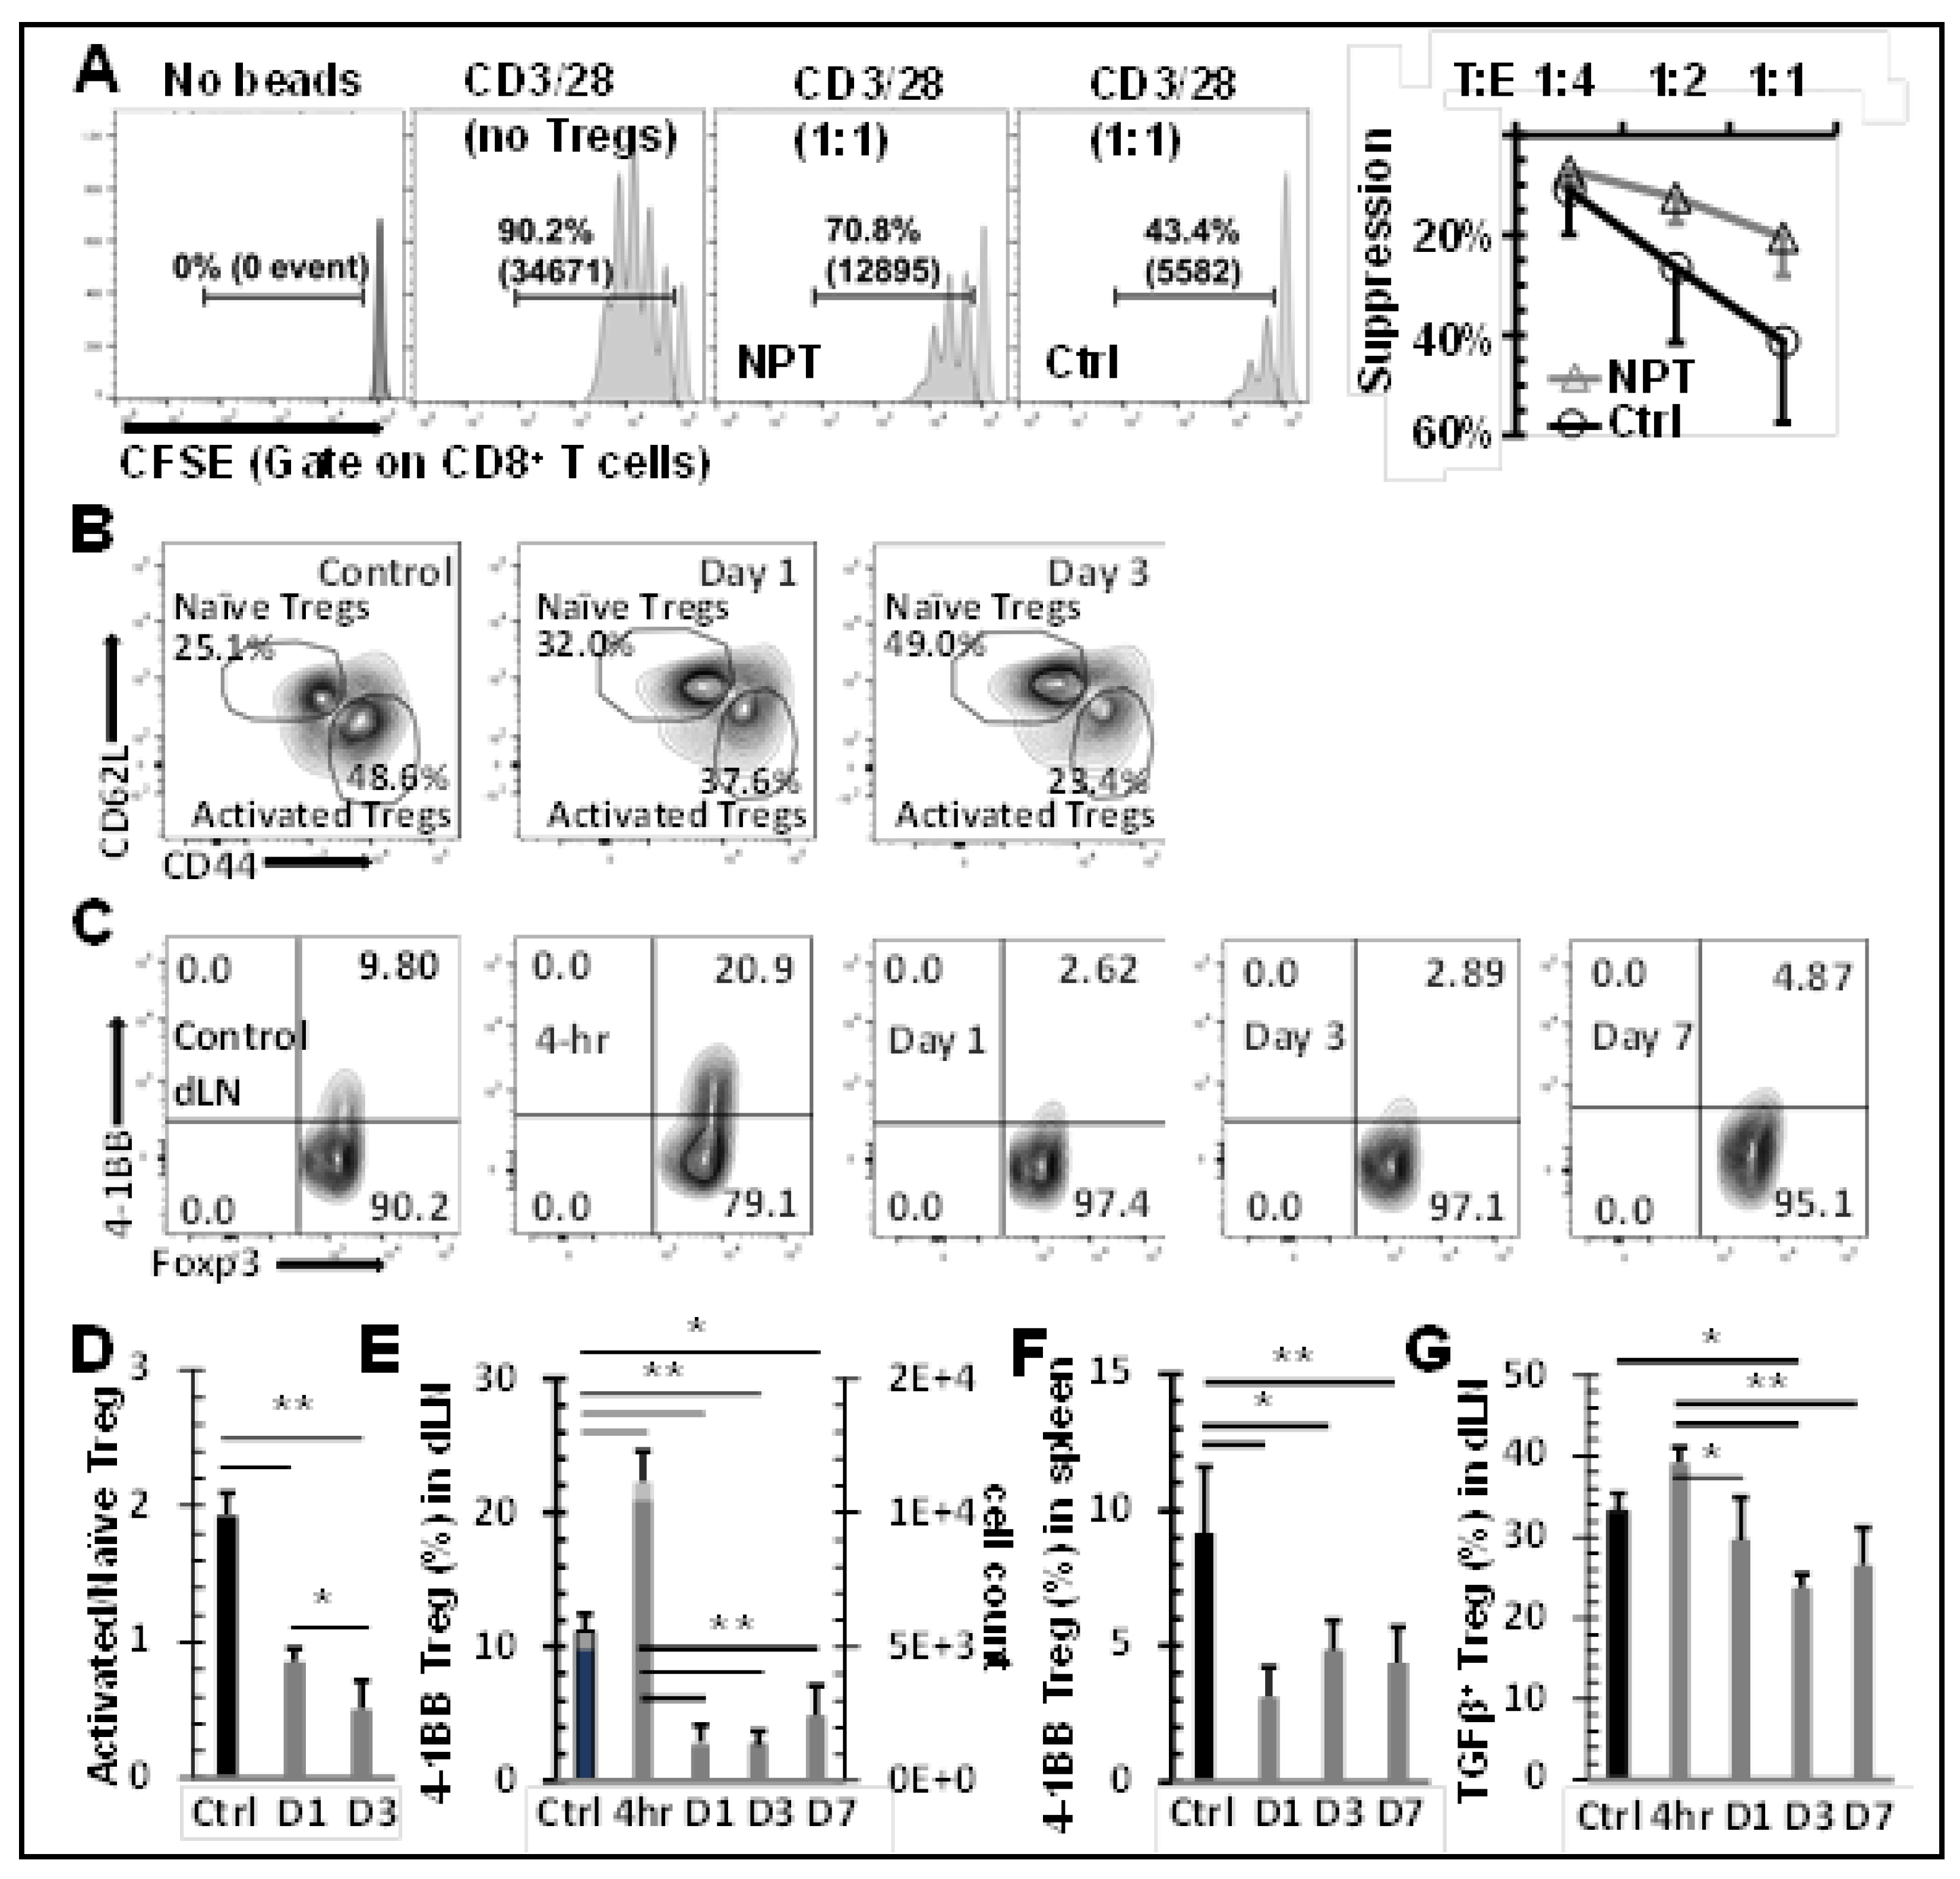
Figure 6.
NPT diminishes intratumoral TAMs and MDSCs with differential characteristics. A: Changes in intratumoral TAMs and MDSCs distribution at Day 1 and Day 3 post-treatment are shown
in a representative flow plot and quantitative graph. B &C: Intratumoral TAM (B) & MDSC (C)
apoptosis representative flow plot indicated with mean ± SD are shown at 4 hours post-NPT. D:
Changes in the CD86 and MHC-II costimulatory marker expression among TAMs were examined on
the day-1 or day-3 post-treatment. A representative flow plot with mean ± SD are shown. N =3-5 per
group. Error bars, SD. *: p < 0.05 and **: p < 0.01 (One-way ANOVA).
Disclaimer/Publisher’s Note: The statements, opinions and data contained in all publications are solely those of the individual author(s) and contributor(s) and not of MDPI and/or the editor(s). MDPI and/or the editor(s) disclaim responsibility for any injury to people or property resulting from any ideas, methods, instructions or products referred to in the content. |
© 2024 by the authors. Licensee MDPI, Basel, Switzerland. This article is an open access article distributed under the terms and conditions of the Creative Commons Attribution (CC BY) license (http://creativecommons.org/licenses/by/4.0/).
Copyright: This open access article is published under a Creative Commons CC BY 4.0 license, which permit the free download, distribution, and reuse, provided that the author and preprint are cited in any reuse.


