
Submitted:
30 April 2024
Posted:
30 April 2024
You are already at the latest version
Abstract
This study examines the nexus between oil prices and inflation in G20 economies, addressing critical gaps by adopting a comparative approach across three pivotal oil price downturns in 2008, 2014, and 2020 (COVID-19). The study utilized monthly time series data from January 2000 to December 2023 and the Bayesian Structural Time Series (BSTS) approach for causal impact analysis. The study found that during the global financial crisis (December 2007 to June 2014), advanced economies like Australia and the UK displayed varying degrees of negative absolute causal impact, aligning with the deflationary impact of falling oil prices. In contrast, emerging economies faced significant negative causal impacts. From June 2014 to January 2020, diverse inflation impacts were observed across G20 economies after a significant oil price decline. Advanced economies like Australia and emerging economies like Brazil experienced negative impacts, while others showed negligible effects. In the subsequent period from January 2020 to December 2023, amid the COVID-19 pandemic and substantial oil price decline, G20 countries exhibited varied inflation outcomes. Positive absolute effects indicated a notable rise in inflation with China standing out with a substantial negative impact. The wavelet coherence analyses also showed an asymmetrical impact of oil prices on inflation. The findings suggest that policymakers should adopt proactive and adaptive policy frameworks, considering the asymmetric responses of G20 economies to oil price dynamics.
Keywords:
Asymmetries
; Causal Impact
; G20 Countries
; Global Disruptions
; Inflation
; Oil Prices
; Wavelet Analysis
1. Introduction
In the macroeconomic debate, the relationship between oil prices and inflation has always been given a central position (Bernanke et al., 1997; Hamilton, 1996). It has strong connections, both forward and backward, with various economic and financial sectors, demonstrating its paramount importance in shaping economic policy and societal well-being (Farzanegan & Markwardt, 2009; Salisu et al., 2017). Oil serves as a critical raw material for transportation, energy production, and various industrial processes, and its price fluctuations affect everything from consumer purchasing power to central bank decisions (Lorusso & Pieroni, 2018; Segal, 2011). Accurately assessing the causal impact of oil price fluctuations on inflation is paramount for effective policy responses, mitigating economic instability, and protecting the well-being of millions of people (Abdulrahman, 2023; Kan & Serin, 2022; Nazlioglu et al., 2019). The 1970s bore witness to a significant surge in inflation, closely tethered to abrupt spikes in oil prices globally. The subsequent decades saw inflation diminish alongside downturns in oil prices (Barsky & Kilian, 2002; Nelson, 2005). Moreover, during the COVID-19 pandemic, in January 2020, global oil prices experienced a substantial decline. Surprisingly, despite this downturn in oil prices, there was an observed increase in inflation on a global scale. The apparent disparity in the trends of oil prices, and mixed findings in the prior literature leave room for ongoing debates and prompt a need for a more in-depth examination to investigate the relationship between WOP and inflation (Álvarez et al., 2011; Bernanke et al., 1997; Hamilton, 1996, 2003, 2011; Hooker, 1996; Renou, 2019; Sek, 2017; Wu & Ni, 2011).
Theoretical underpinnings by Bernanke (1983) posit that surges in oil prices prompted corporations to defer investments, precipitating a decline in overall production. Ferderer (1996) further contends that oil price instability impacted investment demands, elucidating the inverse correlation between oil prices and production, and the positive relationships between these prices and inflation. Bernanke et al. (1997) elucidated the potential of central banks to leverage monetary policy, adjusting interest rates to stabilize production, albeit at the cost of inflation escalation. Traditional linear models struggled to capture the subtle dynamics between oil price movements and inflation, as observed by Hamilton (2011). Nasir et al. (2020) and Raheem et al. (2020) utilized nonlinear models to analyze nonlinearity and asymmetry in the relationships between oil price shocks and inflation.
Recent studies have focused on asymmetric relationships and the pass-through effects. Examining this dynamic field, Salisu et al. (2017) found an asymmetric link between changes in oil prices and inflation, which has varying short- and long-term effects and mostly impacts net oil-importing nations. In the meanwhile, Sek (2017) investigated at how fluctuations in oil prices affected domestic pricing in Malaysia and found both symmetrical and asymmetrical impacts in a variety of industries. The study discovered that although changes in oil prices had a favorable effect on output growth, they eventually had a direct impact on inflation.
Choi et al. (2018) broadened the scope, examining the oil-inflation relationship across 72 economies. Their findings highlighted asymmetric relationships, indicating that a 10% rise in global oil inflation immediately increased average domestic inflation by around 0.4 percentage points. Focusing on specific African nations, Bala and Chin (2018) studied Algeria, Angola, Libya, and Nigeria. Using autoregressive distributed lag dynamic panels, their findings unveiled the asymmetric impacts of oil price changes on inflation. Whether oil prices soared or plummeted, the impact on inflation remained, with a more significant impact observed when prices took a dip. The study stressed the importance of cautious policymaking during periods of price decline suggested a contractionary monetary policy to reduce inflation rates and emphasized encouraging domestic food production. Khan et al. (2019) investigated the impact of asymmetric oil price shocks on economic activity in 13 Asian economies. Using a nonlinear autoregressive distributed lag approach, the study found evidence of both symmetric and asymmetric responses to positive and negative oil price changes. The impulse response analysis suggested limited asymmetric effects on GDP growth, with variations across countries.
Focusing on specifics, Li and Guo (2022) directed attention to BRICS countries using a multiple threshold nonlinear autoregressive distributed lag model (MTNARDL). Their findings revealed significant asymmetries in the case of China which indicates a more pronounced inflationary effect when oil prices decrease. Nusair and Olson (2021) expanded the focus to the ASEAN-5 countries using a nonlinear ARDL framework and found asymmetric effects of oil price changes on domestic output. They further revealed that rising oil prices had a larger impact on output than falling prices.
Although there is evidence in the literature that changes in oil prices have a positive correlation with inflation, further research is needed to fully comprehend the extent of these effects and how unequal they are. The magnitude of the causal impact over several oil price shock events has not been taken into account in previous research, primarily focuses on directional causality and co-movement (Beckmann & Czudaj, 2013; Nazlioglu et al., 2019; Sek, 2017). This research aims to address this gap by investigating the causal impact of oil price shocks on inflation in G20 nations and emphasizing potential asymmetries in responses to the oil price shocks.
This study builds on prior research by Escobari and Sharma (2020), Li and Guo (2022), Khan et al. (2019), and Mensi et al. (2023). It specifically investigates the asymmetric effects of oil price shocks on inflation. In contrast to conventional methods, our approach focuses on causal inferences by utilizing the BSTS technique to precisely measure the magnitude of causal impact during episodes of decreasing oil prices. A distinctive feature of our methodology lies in its comparative nature, delving into responses across distinct oil price shock episodes encompassing the years 2008, 2014, and 2020 (COVID-19). This approach allows to examine the inherently asymmetrical nature of causal impact. However, recognizing the limitations of merely scrutinizing the causal link between oil prices and inflation, our research responds to the observed “asymmetric impact” phenomenon highlighted in the existing literature. It posits that upward oil price shocks exert more distinct inflationary pressures than the disinflationary effects induced by downward shocks. To delve deeper, our study focuses explicitly on the three recent oil price downturns: 2008, 2014, and 2020.
The oil prices and inflation nexus for G20 economies hold paramount importance for several reasons. Firstly, the G20 economies collectively constitute over 80% of the global GDP (Taylan et al., 2022) and are an important indicator of global economic health when considering their inflationary tendencies. Secondly, oil remains a cornerstone of energy consumption across most G20 economies which leads to its price fluctuations as a potent driver of inflationary pressures (Renou, 2019). Finally, the sharp downturns of oil prices in 2008, 2014, and 2020 (COVID-19 pandemic) accentuate the need for a deeper understanding of the magnitude of causal impacts during these episodes.
The study’s results revealed asymmetries in both absolute and relative causal impacts. Developed economies grappling with deflationary pressures due to the drop in oil prices were juxtaposed against emerging economies that faced significant negative causal effects during economic downturns. The period spanning from January 2020 to December 2023 was characterized by the COVID-19 pandemic and a decline in oil prices with varying inflation outcomes and asymmetries across nations. The integration of wavelet coherence, partial wavelet coherence, and multivariate wavelet coherence analyses for checking robustness emphasizes varying strengths in the WOP-inflation relationship. The incorporation of exchange rates in Wavelet Coherence analysis signifies its influence, particularly in advanced developed countries. Our findings highlight the importance of tailored analyses and proactive policy frameworks that consider individual economic structures, geopolitical factors, and the influence of exchange rates to navigate the challenges posed by fluctuations in oil prices. This study addresses a research gap in the existing literature by not only confirming co-movements but also examining the magnitude of causal impact. The study’s emphasis on asymmetries in reactions to oil price shocks further deepens our comprehension of WOP-inflation dynamics. The inclusion of wavelet coherence analyses, as well as the consideration of exchange rates, further strengthens the reliability of the findings.
2. Methodology and Data
2.1. Causal Impact - Bayesian Structural Time Series (BSTS)
The Causal Impact based on the BSTS approach constitutes a robust framework for disentangling the causal relationship between WOP and inflation. This causal impact approach was introduced by Brodersen et al. (2015) which leverages state space models. The basic structure of the BSTS model can be expressed as follows:
where , , , and are observed inflation rate, hidden state vector, observation matrix, external covariates, and vector of coefficients respectively. is the innovation vector and is assumed to be normally distributed with mean zero and variance .
The study also considered exchange rates (ER) as another external covariate to account for the influence of exchange rate fluctuations on inflation. The state space model comprises three key components: the observation equation, the state transition equation, and the innovation processes. The state transition equation captures the dynamics of the hidden state vector over time:
where is the transition matrix, is the input matrix, and is the state innovation vector which is assumed to follow a normal distribution with mean zero and covariance matrix .
During the three separate oil price downturns (2008, 2014, and 2020), we individually apply the BSTS model. This entails fitting the model to the data observed in each downturn period and generating posterior samples to derive estimates of the causal impact of WOP on inflation.
The BSTS approach includes a counterfactual analysis that enables a comparison between observed inflation and what would have occurred without oil price changes (Bednar, 2021) (Brodersen et al., 2015). This counterfactual scenario serves as the foundation for quantifying the causal impact of WOP on inflation in each downturn.
This approach appropriately accommodates distinct economic conditions and responses to oil price shocks during different episodes. Such property offers flexibility in accommodating external covariates that make it suitable for our study’s objective of assessing the impact of WOP on inflation while considering the influence of exchange rates. The Bayesian framework provides a principled approach to uncertainty quantification which allows for more robust interpretations of the causal impact estimates (Brodersen et al., 2015).
Prior Distributions and Prior Elicitation
Assigning prior distributions to the model parameters is a crucial step in implementing the Bayesian approach. Let represent the vector of coefficients associated with the external covariates and its prior distribution is denoted as which captures our beliefs about the plausible values of these coefficients. Similarly, prior distributions are assigned to the parameters of the state space model. These priors incorporate information or beliefs about the plausible values of transition matrices, input matrices, and innovation variances (Box & Tiao, 2011) (Brodersen et al., 2015).
Inference
Inference in Bayesian analysis is the process of revising our assumptions about model parameters in light of observed evidence. The posterior distribution of the parameters is derived using the Bayes theorem given the observed inflation data yt:
This posterior distribution encapsulates updated information about the latent states and coefficients given the observed data and prior beliefs.
Markov Chain Monte Carlo (MCMC) methods are commonly employed to draw samples from the posterior distribution by using Gibbs sampling or Metropolis-Hastings algorithms (Box & Tiao, 2011) (Brodersen et al., 2015). This allows for the estimation of model parameters and latent states.
Evaluating Impact
The causal impact is evaluated by comparing the observed inflation with the counterfactual scenario where oil prices remain unchanged. This counterfactual is obtained by simulating the model forward in time which allows for an assessment of what inflation would have been in the absence of oil price changes. The causal impact is then determined by the difference between the observed and counterfactual inflation (Brodersen et al., 2015). For each of the three distinct oil price downturns in 2008, 2014, and 2020, separate counterfactual analyses are conducted.
2.2. Wavelet Coherence Analysis
Wavelet coherence analysis is employed to check the co-moments and robustness of findings. This section presents the methodology concerning Wavelet Transform Coherence (WTC), Partial Wavelet Coherence (PWC), and Multivariate Wavelet Transform Coherence (MWTC). This section builds upon the work laid out by earlier research (Aloui et al., 2018; Jiang & Yoon, 2020; Tiwari et al., 2019).
Wavelet Transform Coherence (WTC)
WTC is utilized to assess the coherence between WOP and INF at various time-frequency locations. Let X(t) and Y(t) represent two time series, and denote the WTC X(t) and Y(t) at frequency and time t. The formula for WTC is given by:
where is the cross-wavelet power, and and are the wavelet power spectra of X(t) and Y(t) respectively. WTC ranges from 0 to 1, with higher values indicating stronger coherence.
Partial Wavelet Coherence (PWC)
PWC extends WTC by considering the influence of a third variable, providing insights into the direct relationship between two variables after removing the effect of the third. Let Z(t) be the third time series (exchange rate). The PWC between X(t) and Y(t) given Z(t) at frequency and time t is given by:
The terms , and are cross-wavelet powers and wavelet power spectra involving the three variables. PWC allows for the identification of direct relationships between X(t) and Y(t) after accounting for the influence of Z(t).
Multivariate Wavelet Transform Coherence (MWTC)
MWTC extends the analysis to multiple variables, allowing for the simultaneous examination of coherence among WOP, INF, and ER. Let X(t), Y(t), and Z(t) represent the three time series. The MWTC between X(t), Y(t), and Z(t) at frequency and time t is given by:
where is the cross-wavelet power, and , and are the wavelet power spectra of X(t), Y(t), and Z(t) respectively. MWTC offers insights into the coordinated behavior and interactions among the three variables.
The time-frequency representation generated through wavelet analysis provides visual insights into the evolution of coherence over time and frequency. It allows for the identification of periods and frequencies where the relationships between WOP, INF, and ER are particularly prominent or weak.
2.3. Data
Examining monthly data on West Texas Intermediate crude oil prices and inflation rates based on the Consumer Price Index (CPI) across G20 economies, we delve into the dynamics of both net oil exporters and importers. Our analysis also includes the exchange rate as a control variable with the oil-inflation connection, as highlighted by Cerra (2019), Cologni and Manera (2008) and Günay (2018). For G20 nations utilizing the Euro, we introduce the Real Effective Exchange Rate (REER) as a control variable, aiming for a more comprehensive perspective. Unfortunately, the inclusion of other monthly variables was hindered by inconsistent data availability.
The sampled period spans from January 2000 to December 2023, capturing pivotal events such as the 2007 and 2014 oil price shocks and the disruptive circumstances of the COVID-19 pandemic in 2020. Data is sourced from the International Financial Statistics for Inflation (CPI and exchange rates) and WOP data from St. Louis (2023).
Table 1 offers a comprehensive glimpse into the inflation rates and WOP of G20 nations. In terms of descriptive statistics, the mean inflation rates vary notably, with Australia exhibiting a relatively higher mean of 2.86, while Japan records a significantly lower mean of 0.03. The standard deviations reveal the volatility of inflation, with Indonesia displaying higher fluctuations compared to the more stable inflation environment in the UK. The unit root test results of the ADF and PP statistics (Table 1) provide the stationarity of inflation and oil price series. The higher negative ADF and PP statistics indicate evidence against a unit root. Specific countries like Brazil, Canada, India, and others exhibit strong evidence against a unit root, pointing to stable inflation dynamics. Conversely, the UK and Germany showcase evidence against a unit root with less pronounced statistics, suggesting relatively consistent economic conditions. These unit root test results collectively lay the foundation for robust econometric analyses.
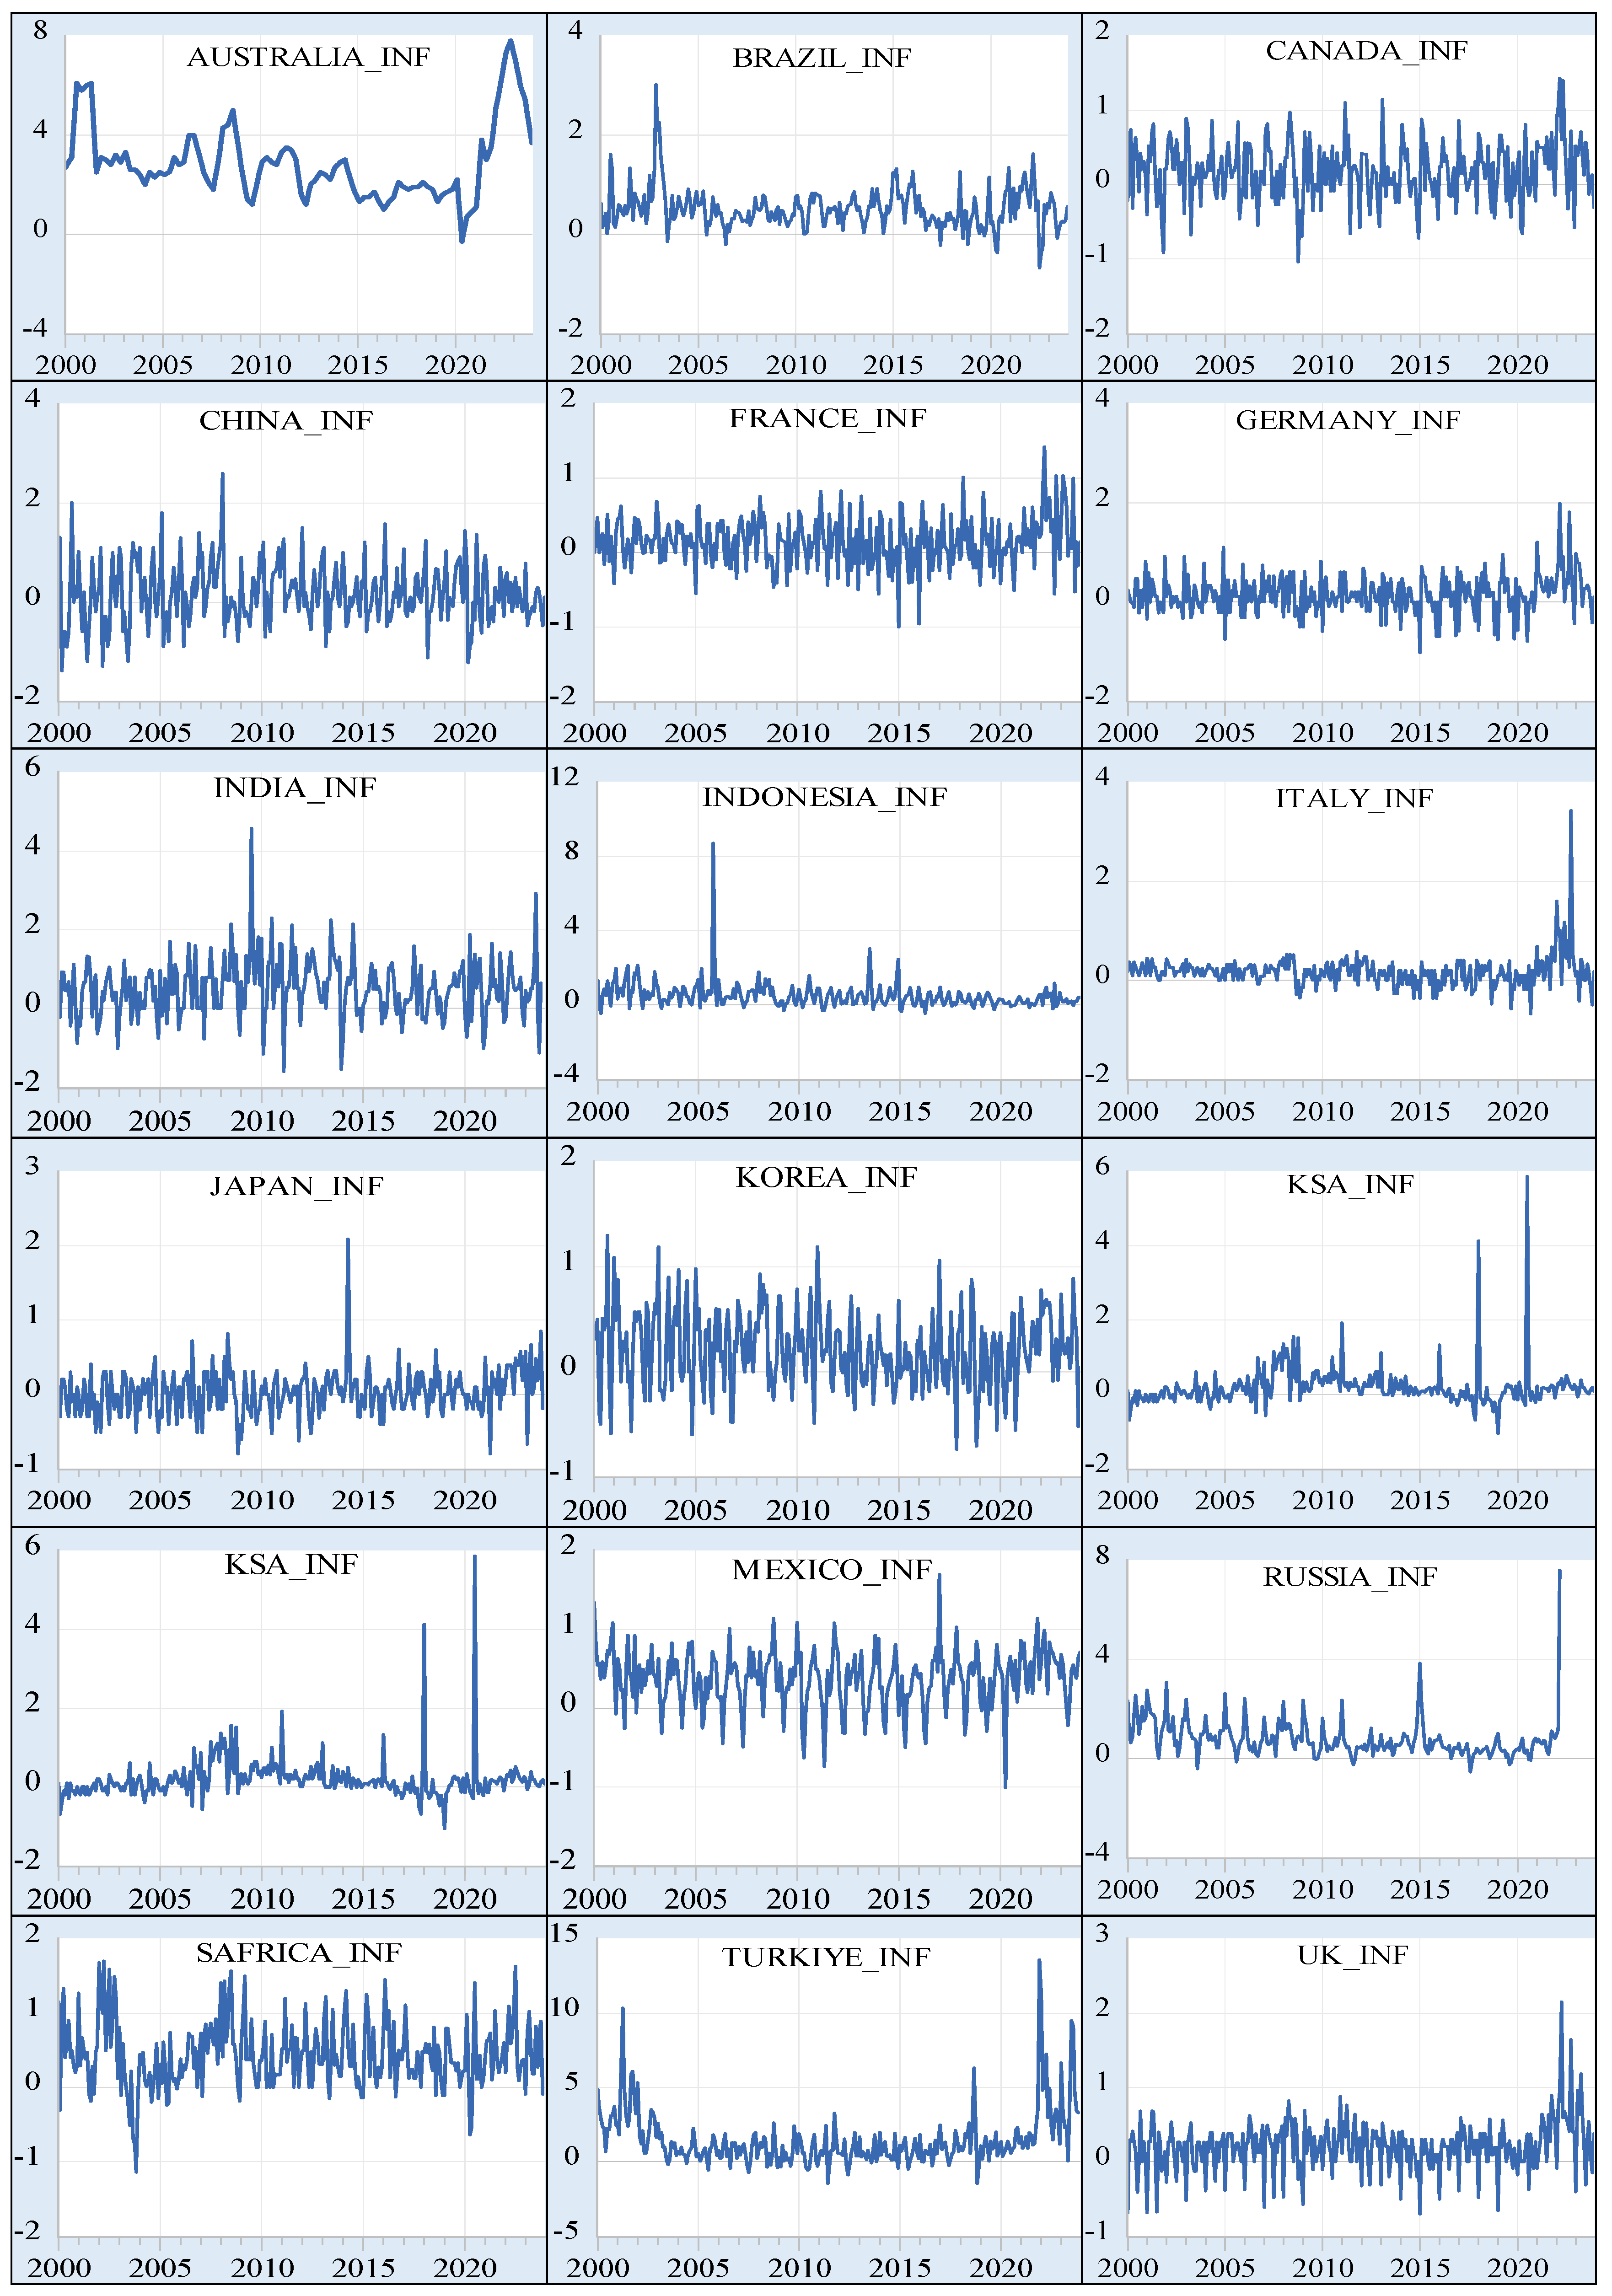
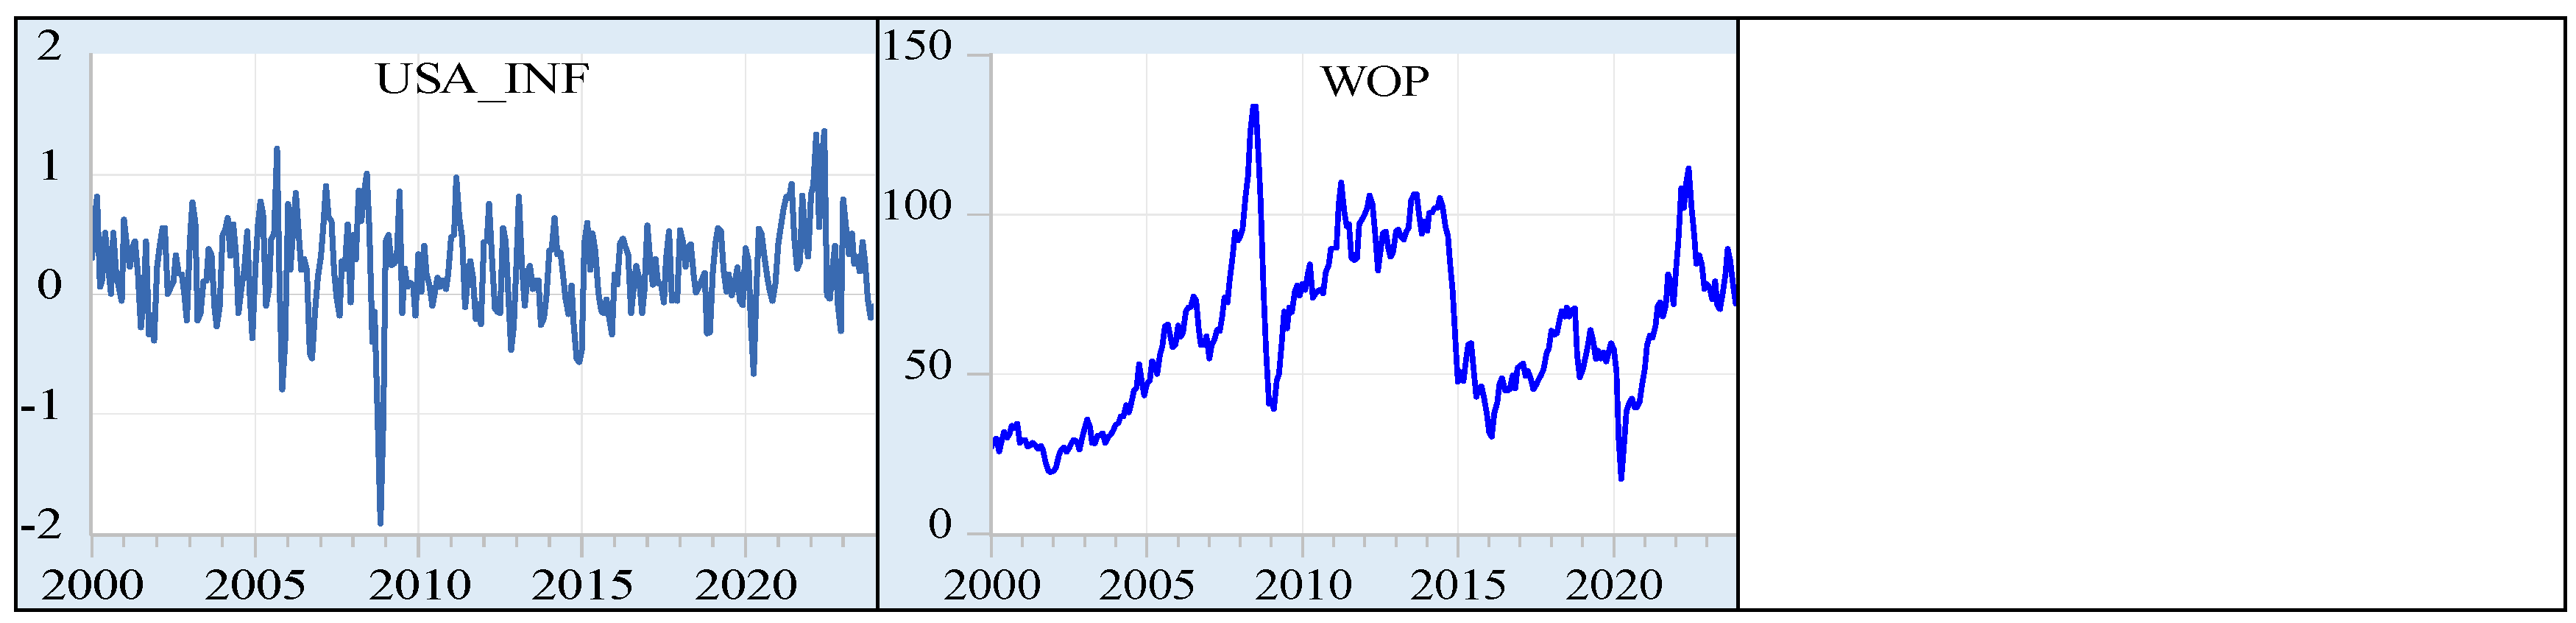
Figure 1 illustrates WOP and inflation rates for various G20 countries. Turkey stands out with the highest value at 13.58, indicating significant periods of elevated price increases. Australia, Brazil, and India also experience relatively high inflation rates. On the other end of the spectrum, Japan maintains the lowest maximum inflation at 2.09, reflecting a more restrained inflationary environment. Examining the downward movement of inflation values, several countries, including Canada, France, and Japan, report negative inflation. Turkey registers the lowest minimum inflation at -1.44, reflecting potential economic downturns during 2011. Notably, the global COVID-19 pandemic has contributed to a general increase in inflation rates across most countries. This trend aligns with the economic disruptions and increased government spending witnessed during the pandemic. Additionally, the WOP exhibits fluctuations, with a maximum value of 133.96 and a minimum value of 16.98. The decline in WOP during COVID-19 is likely influenced by reduced global demand amid lockdowns and travel restrictions. These observations highlight the interconnectedness of global economic factors, influencing inflation rates and energy markets across G20 nations.
Figure 1.
Inflation and WOP.
3. Results
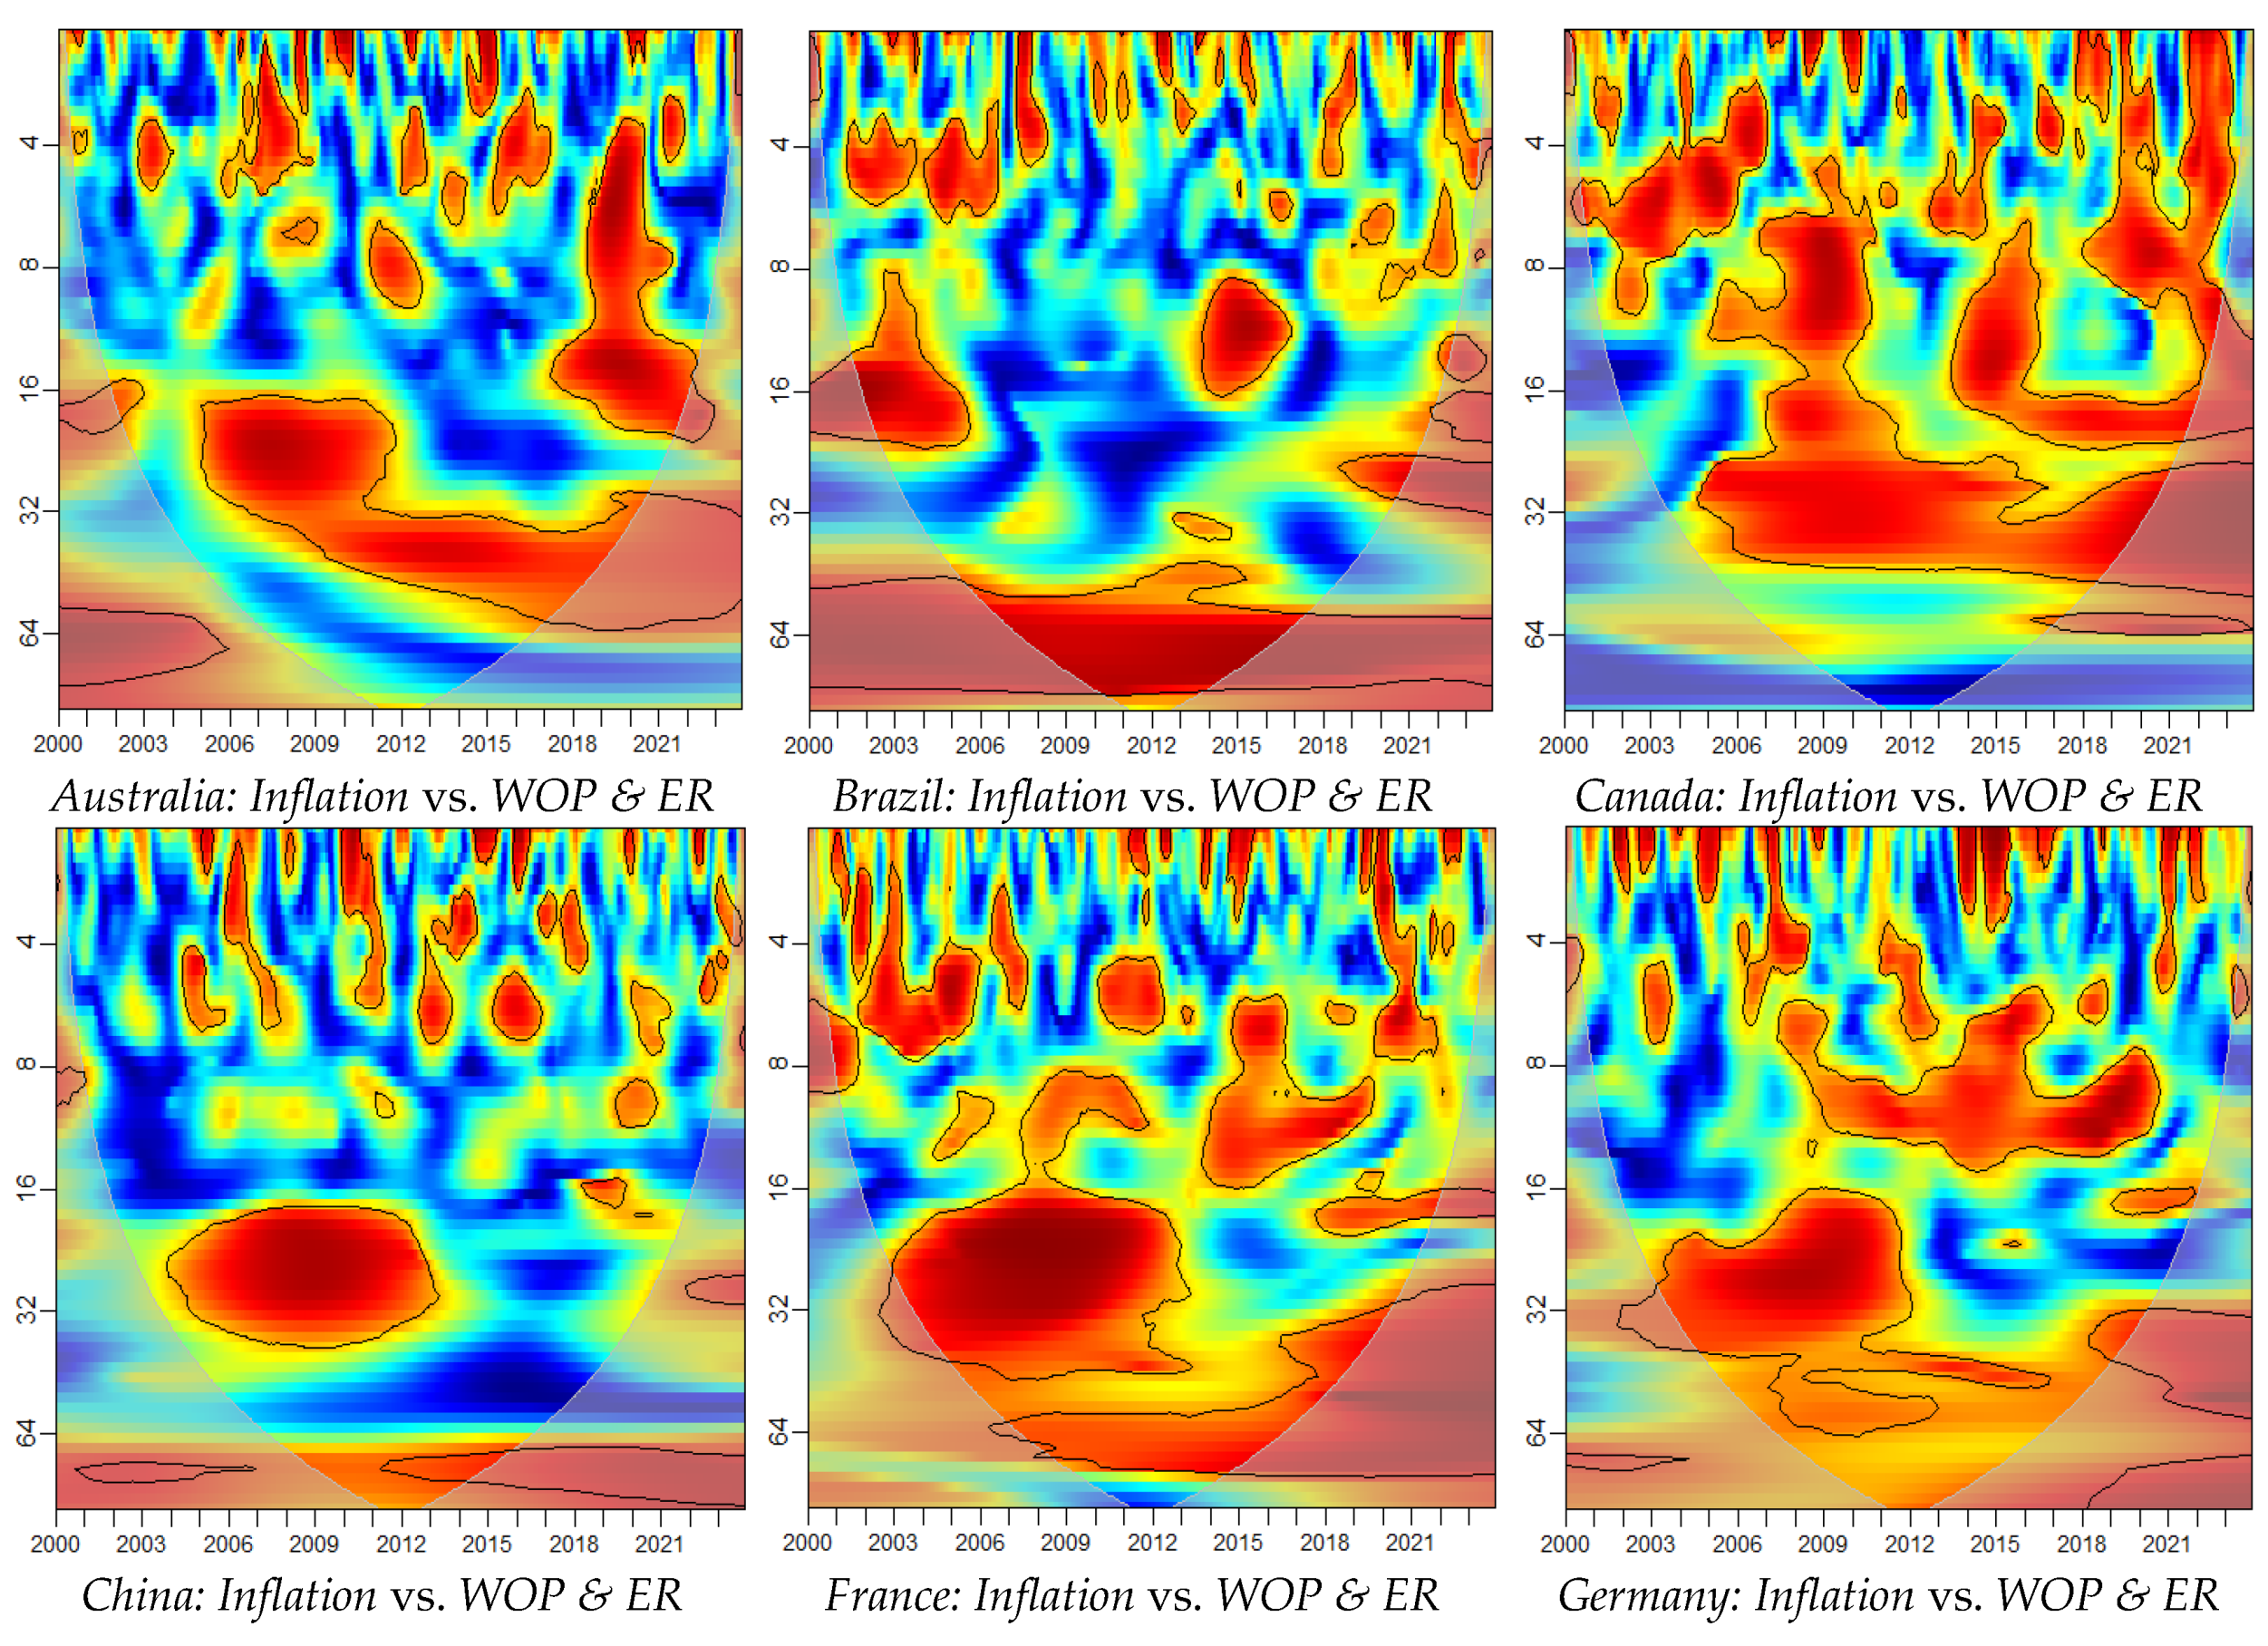
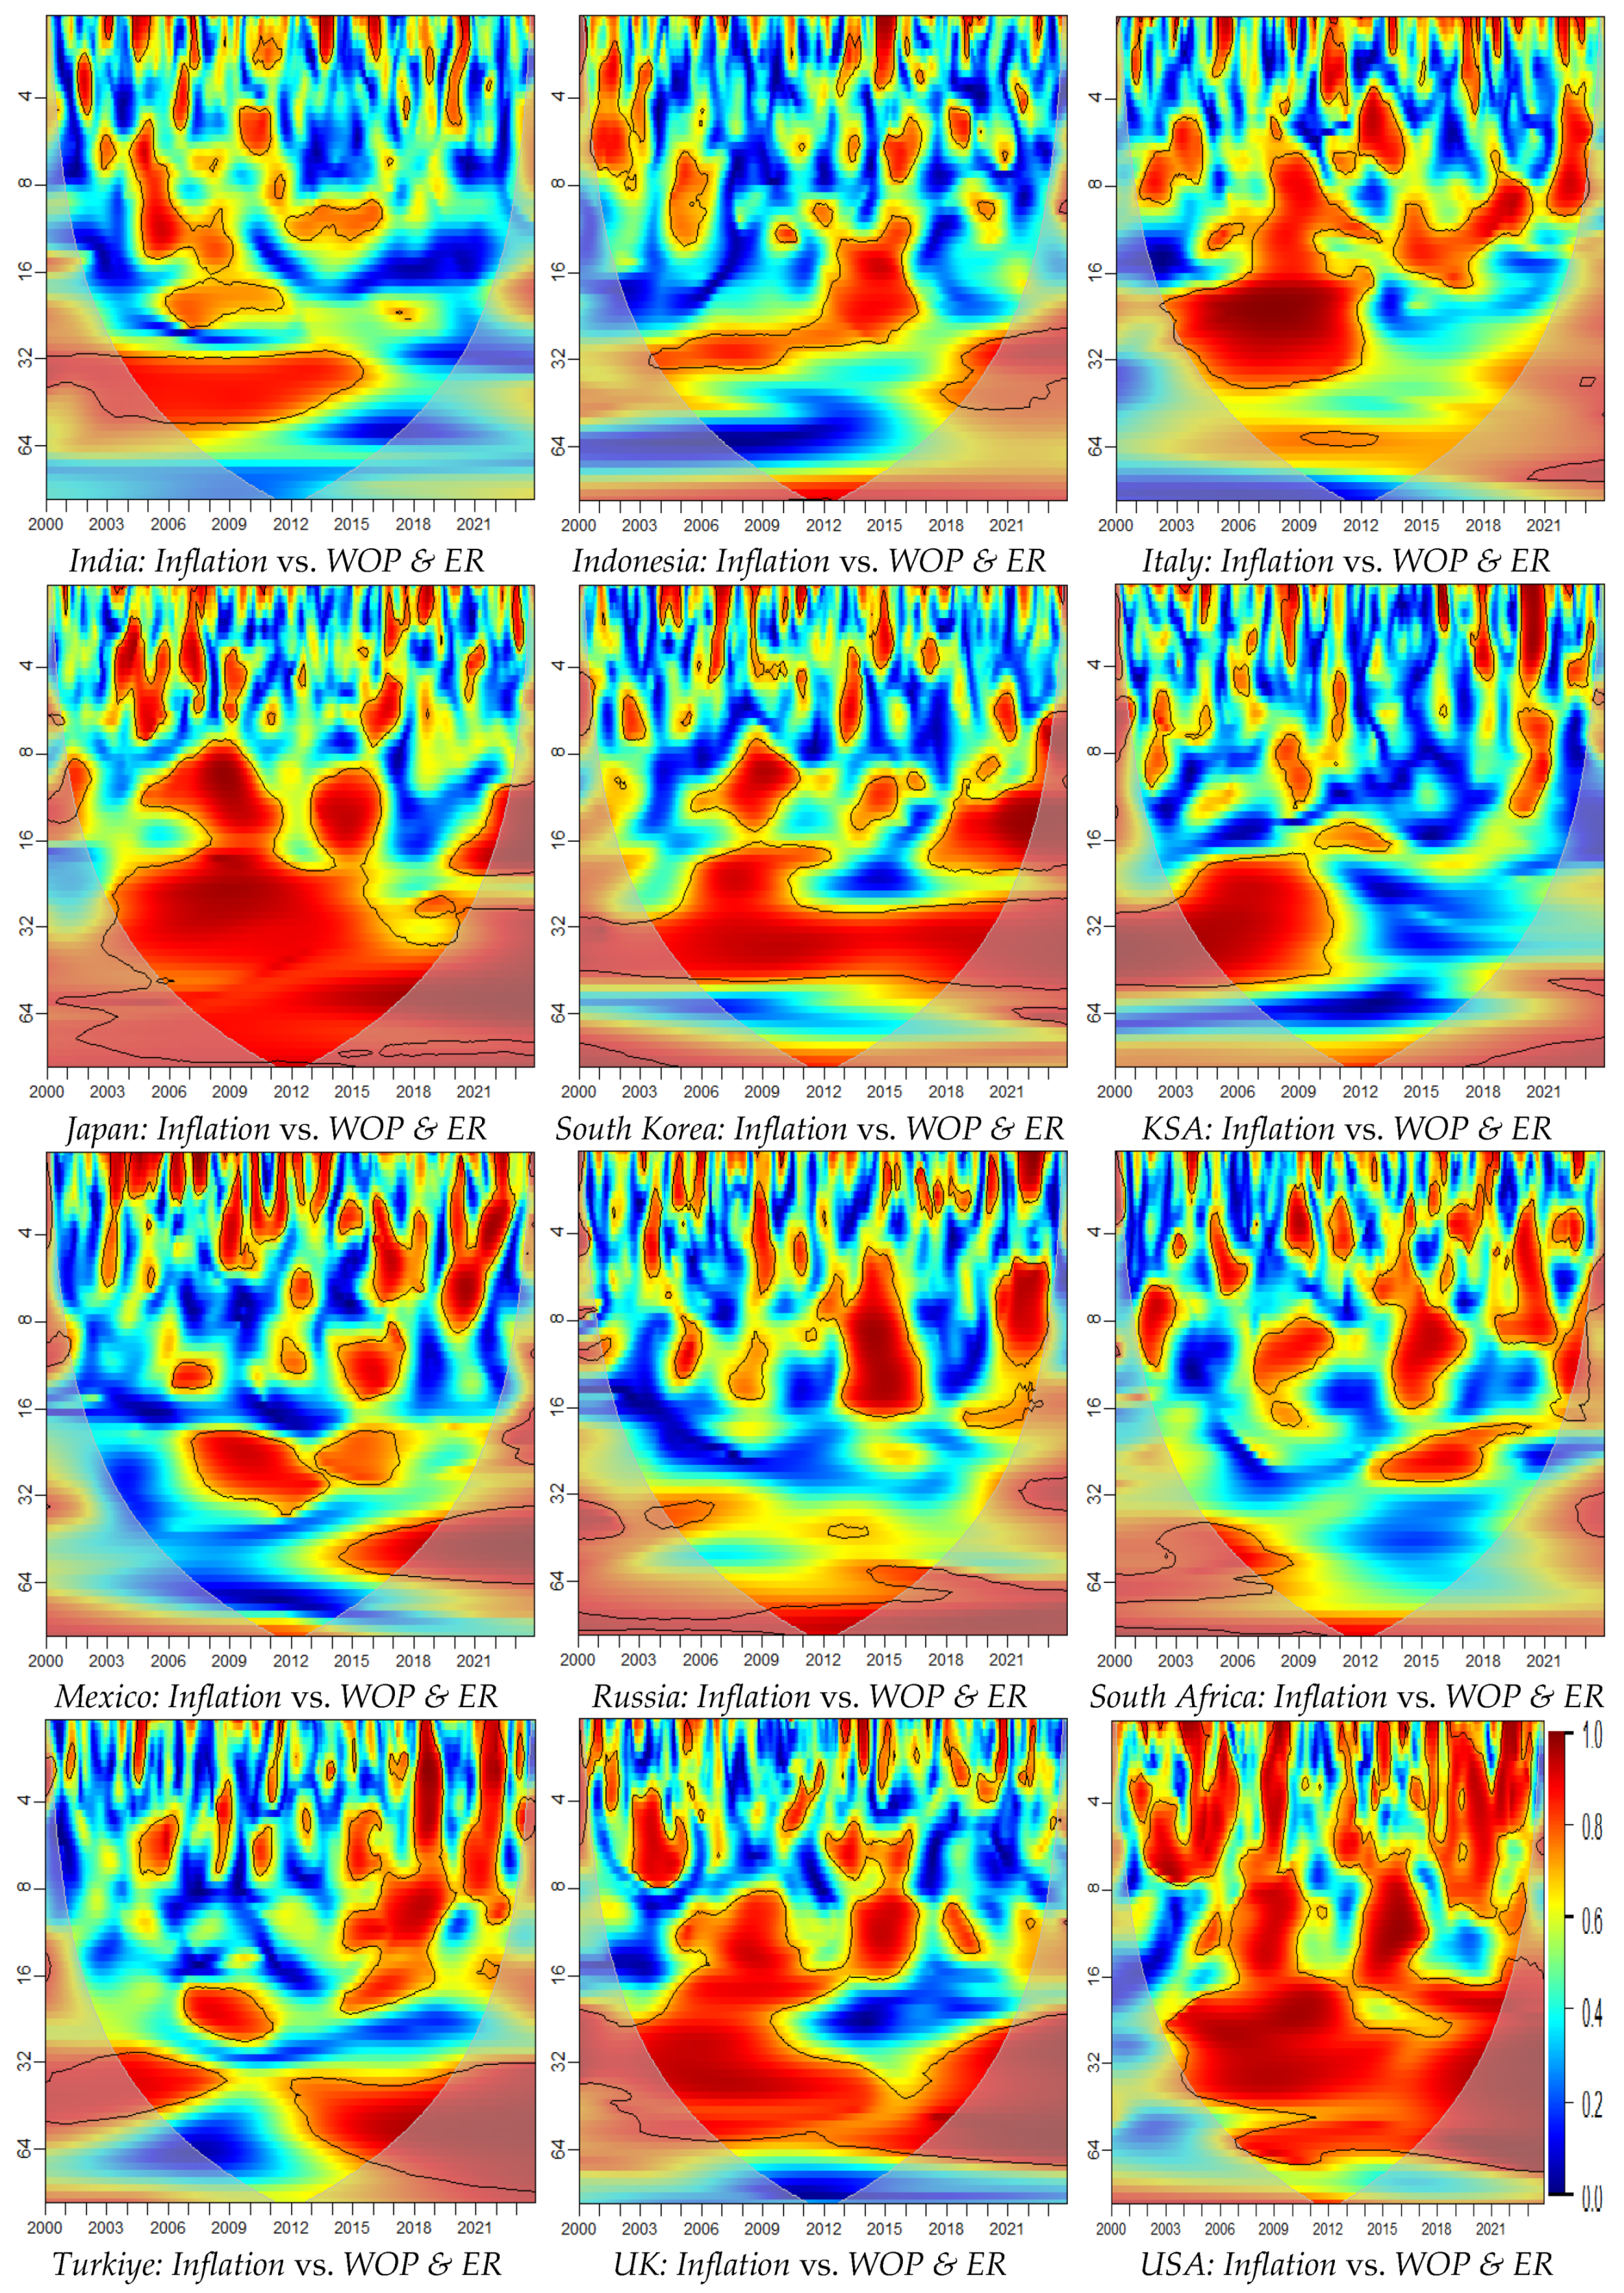
Table 2, Table 3 and Table 4 present the outcomes of the causal impact analysis, delineating the causal effects of three different periods of WOP downturns. Figure 2 provides a visual representation of the consistent causal impact across all G20 countries. Additionally, Figure 2, Figure 3, Figure 4 and Figure 5 showcase the results of WTC, PWC, and MWTC analyses.
Figure 2.
Causal Impact of WOP on Inflation.
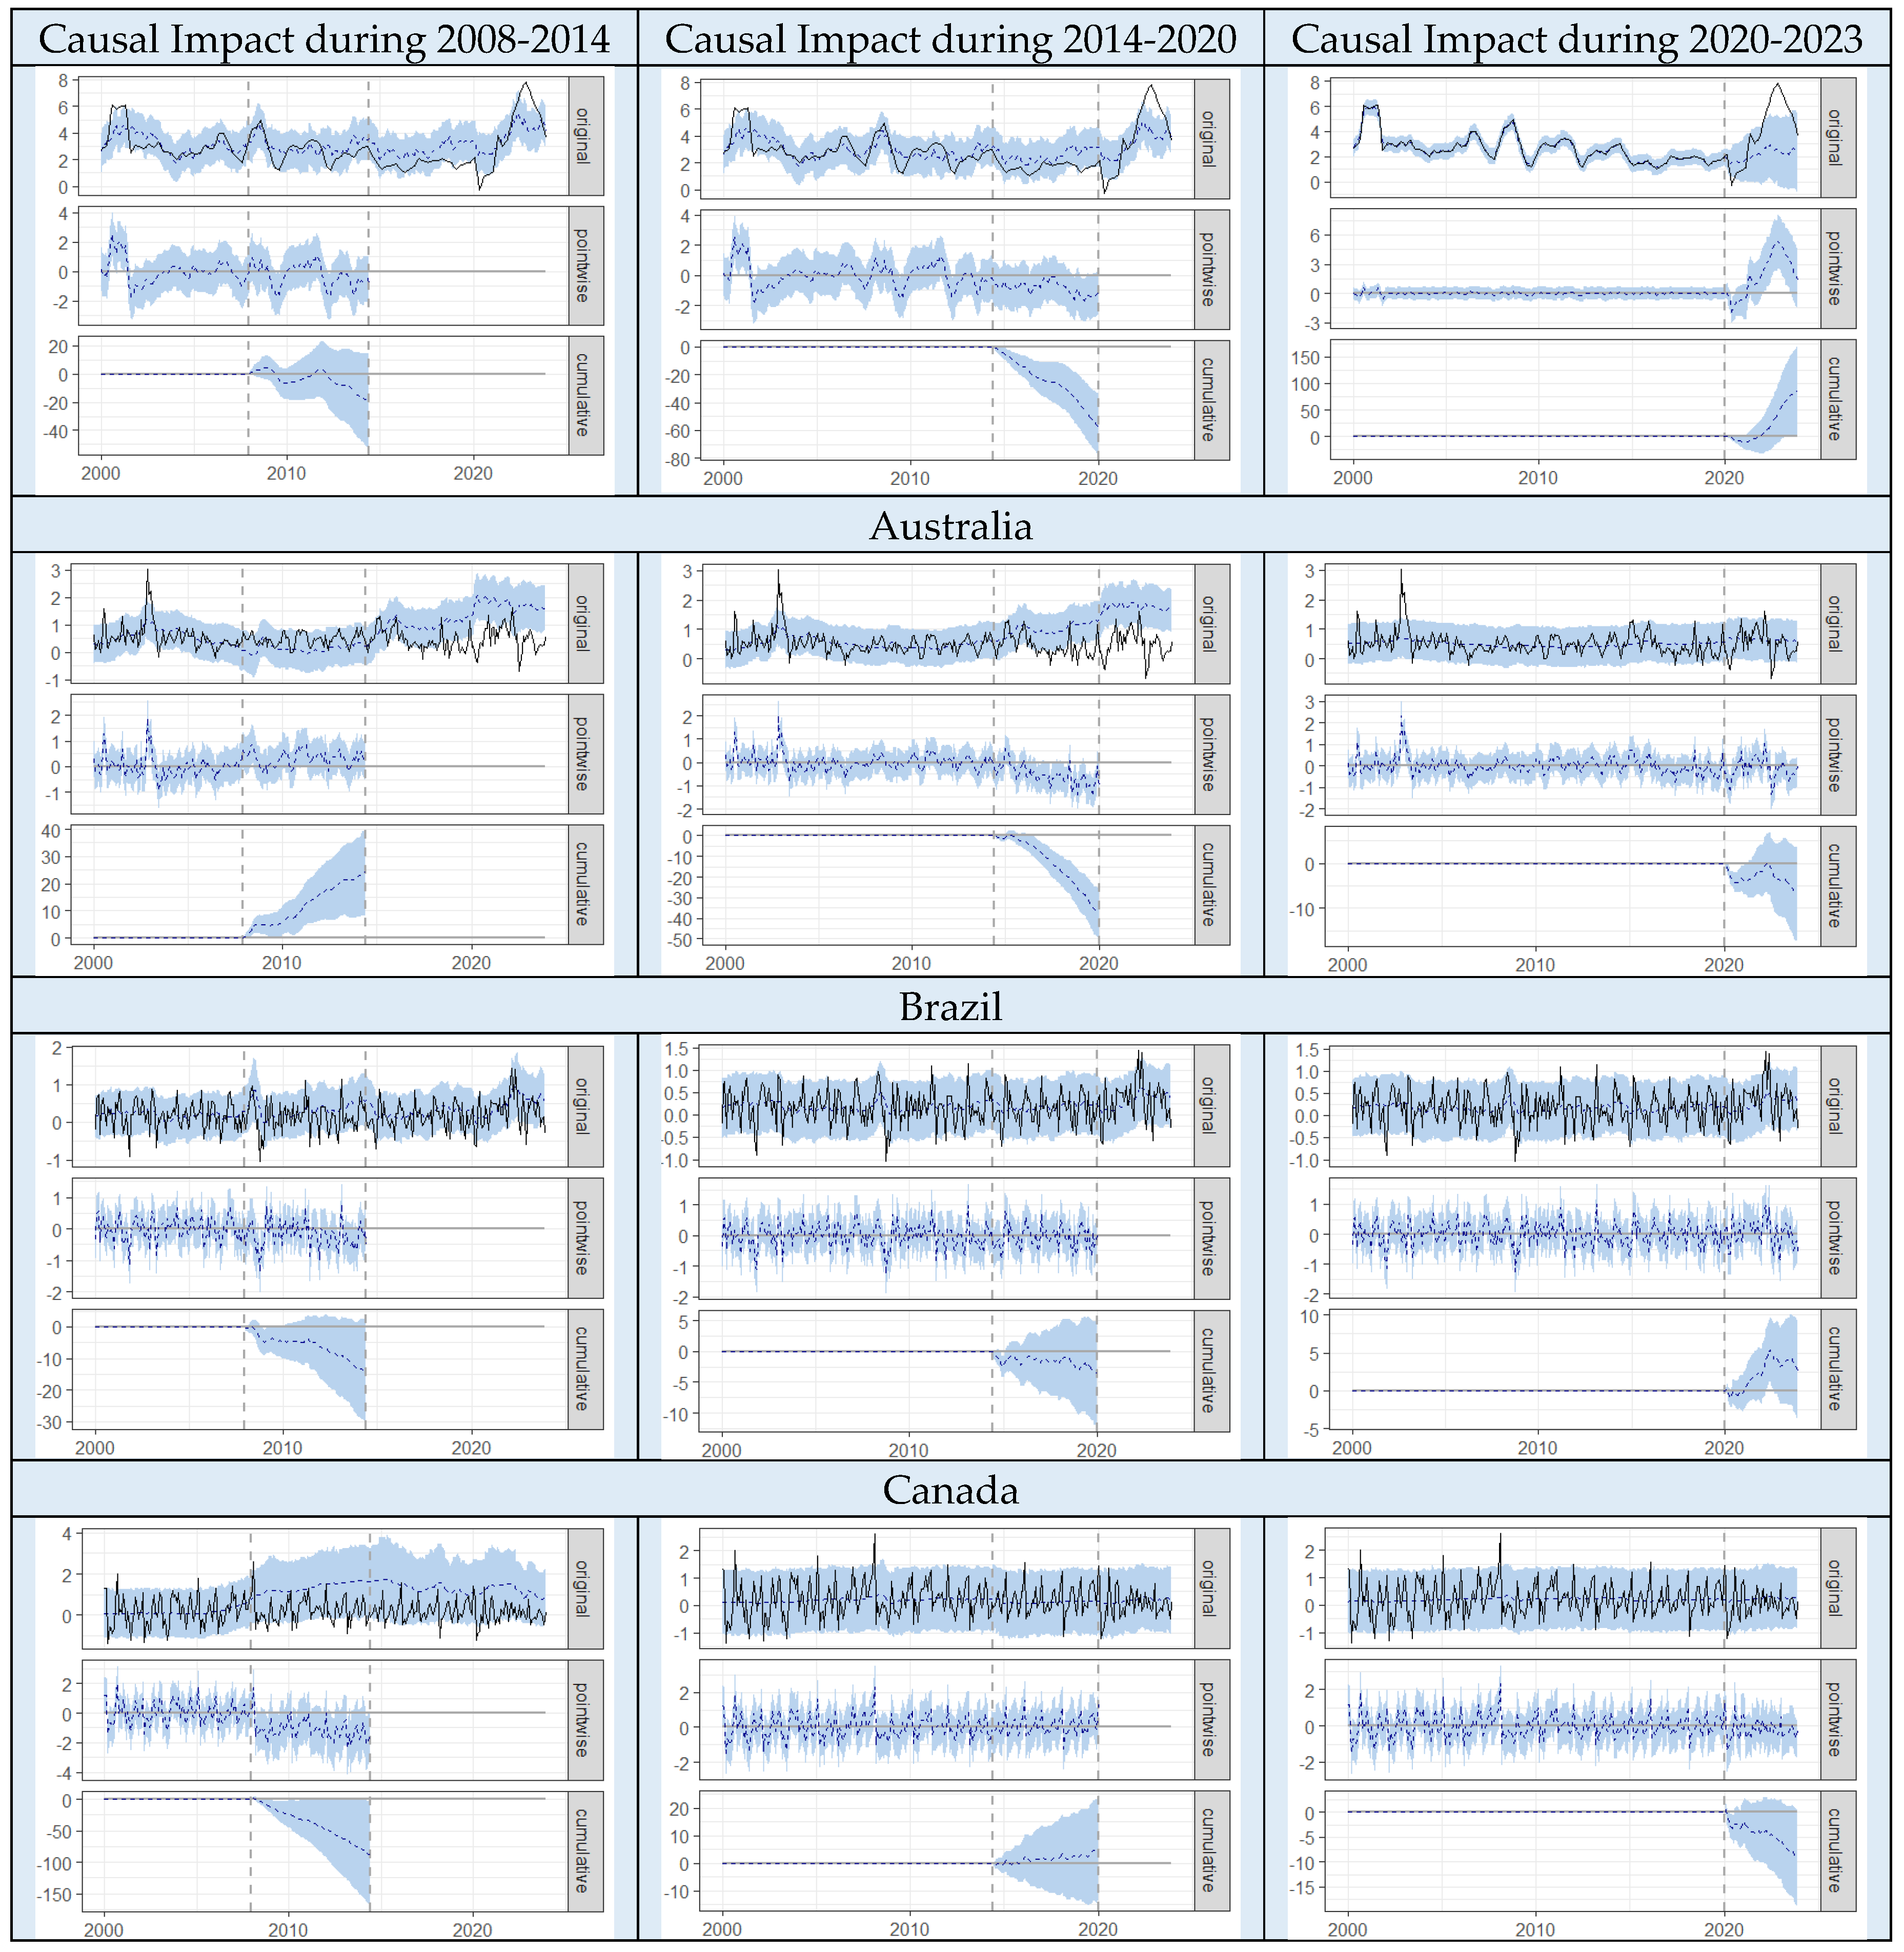
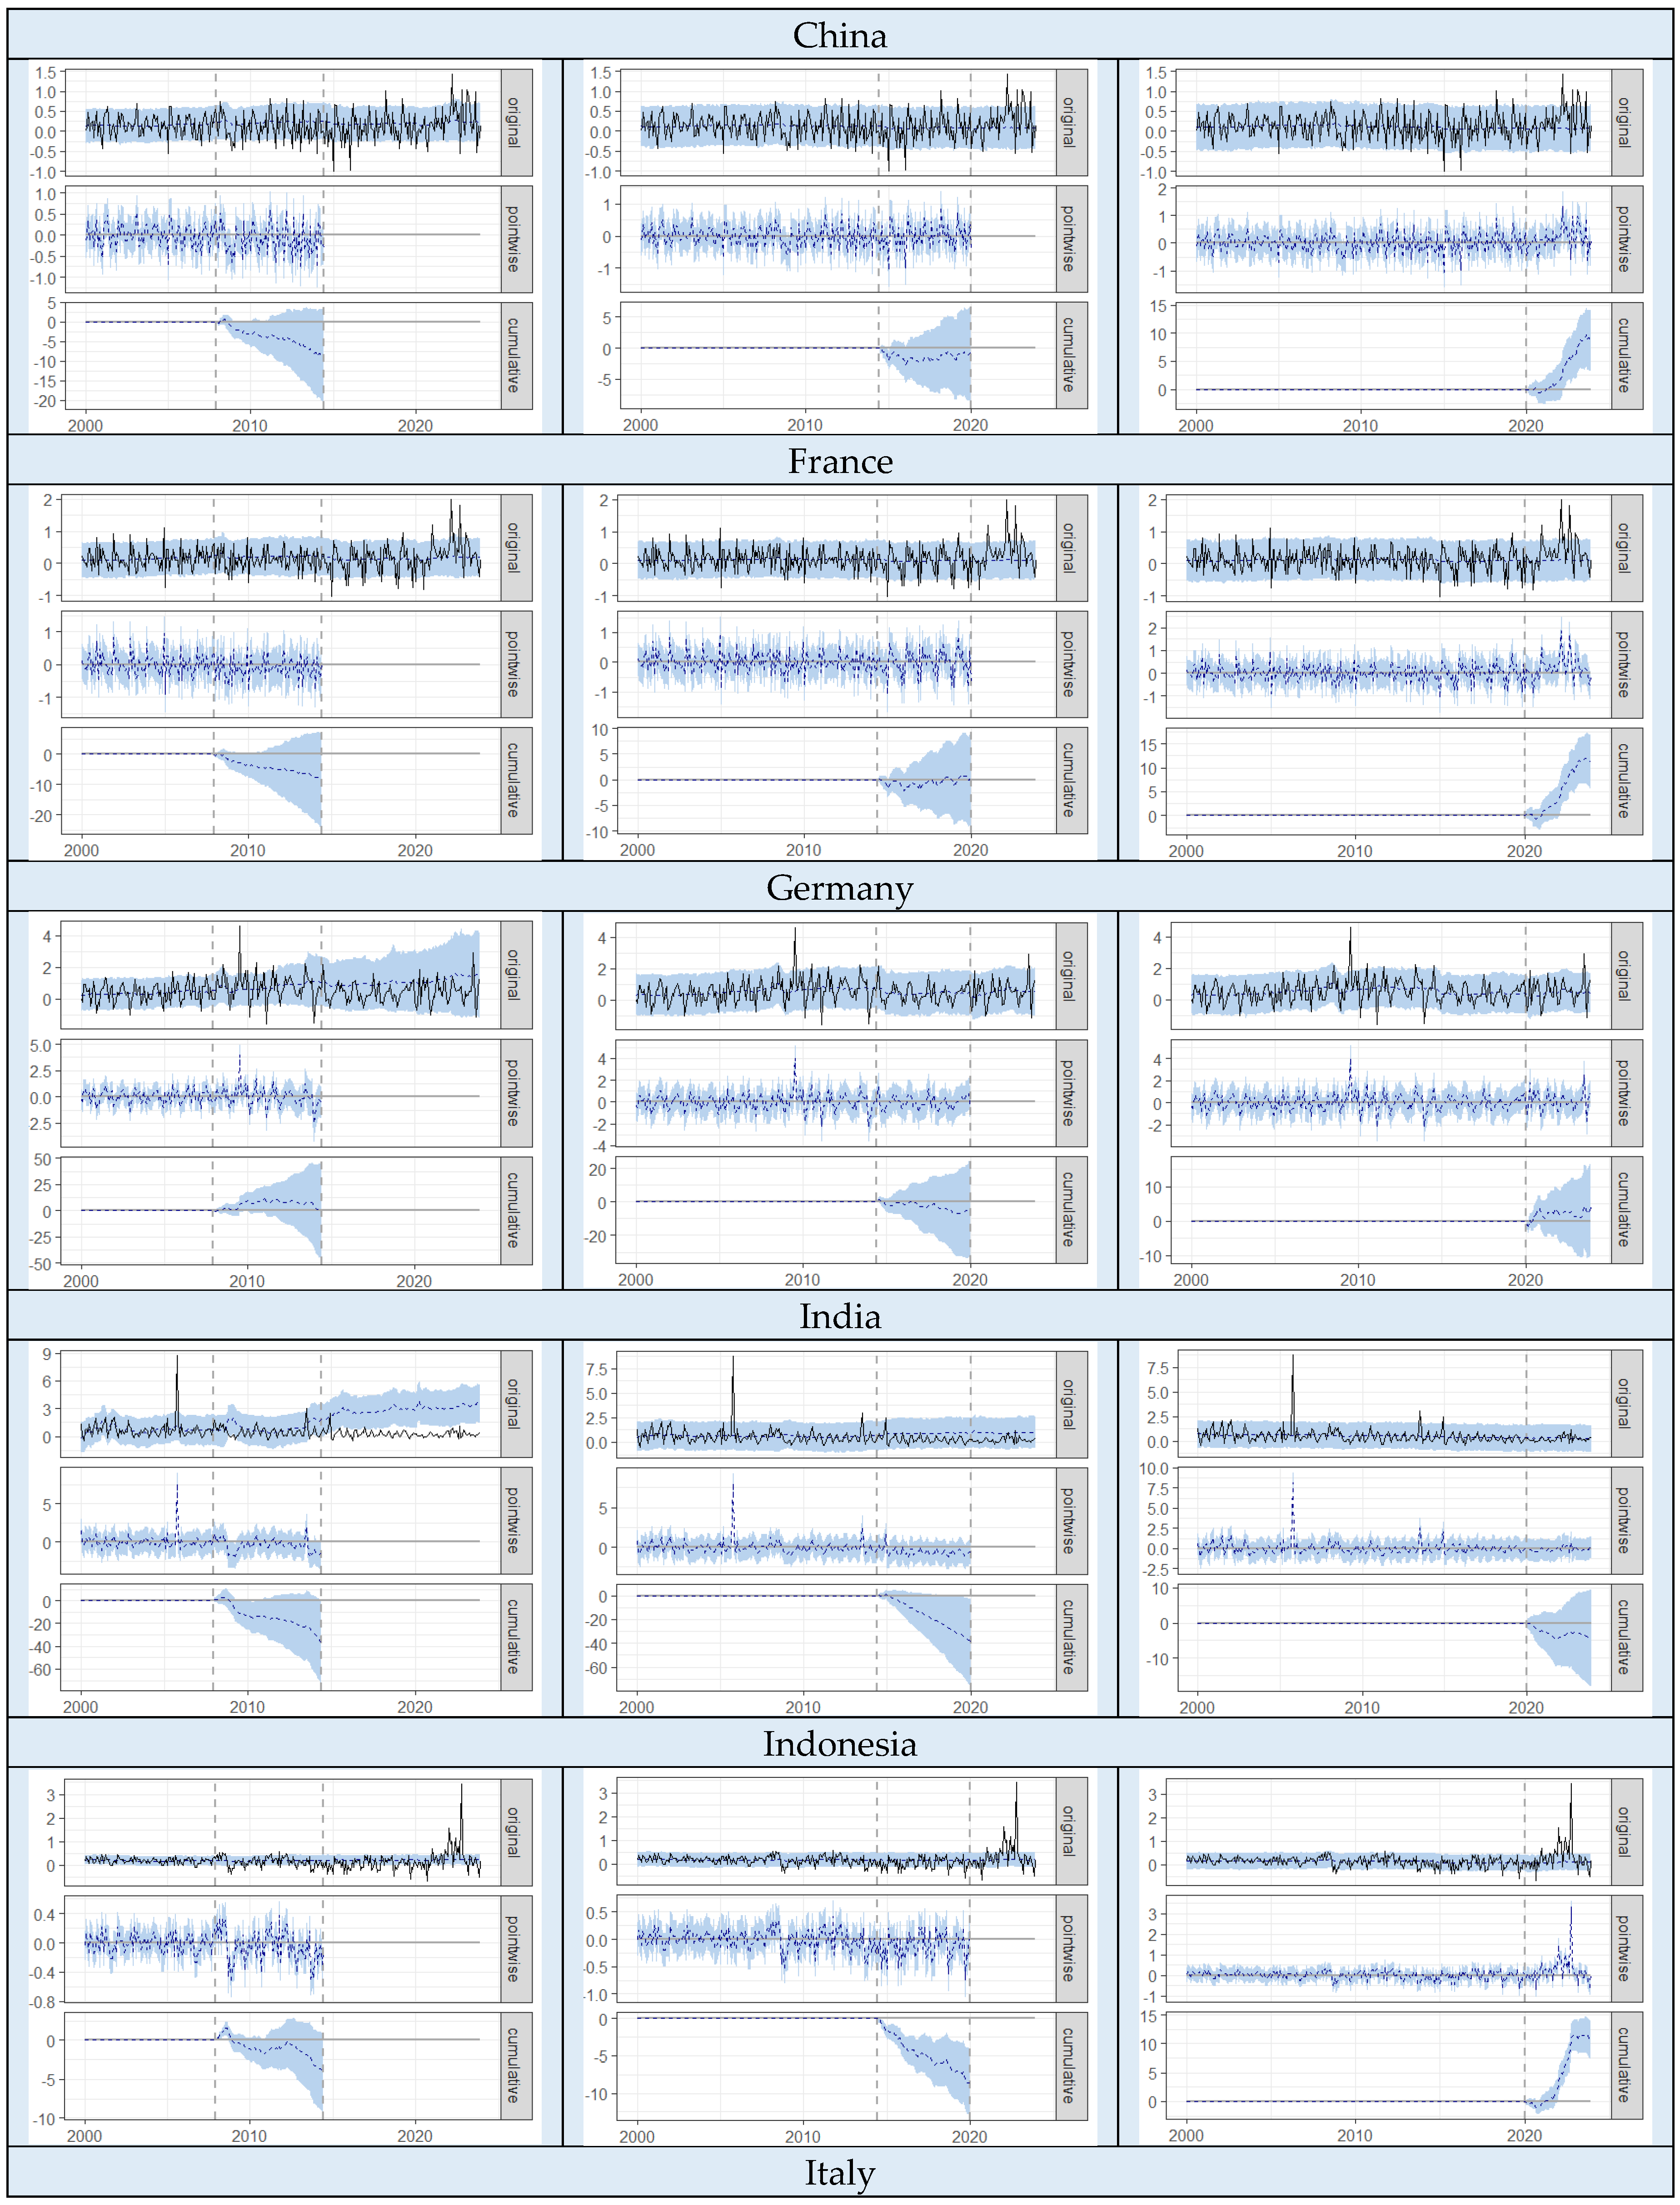
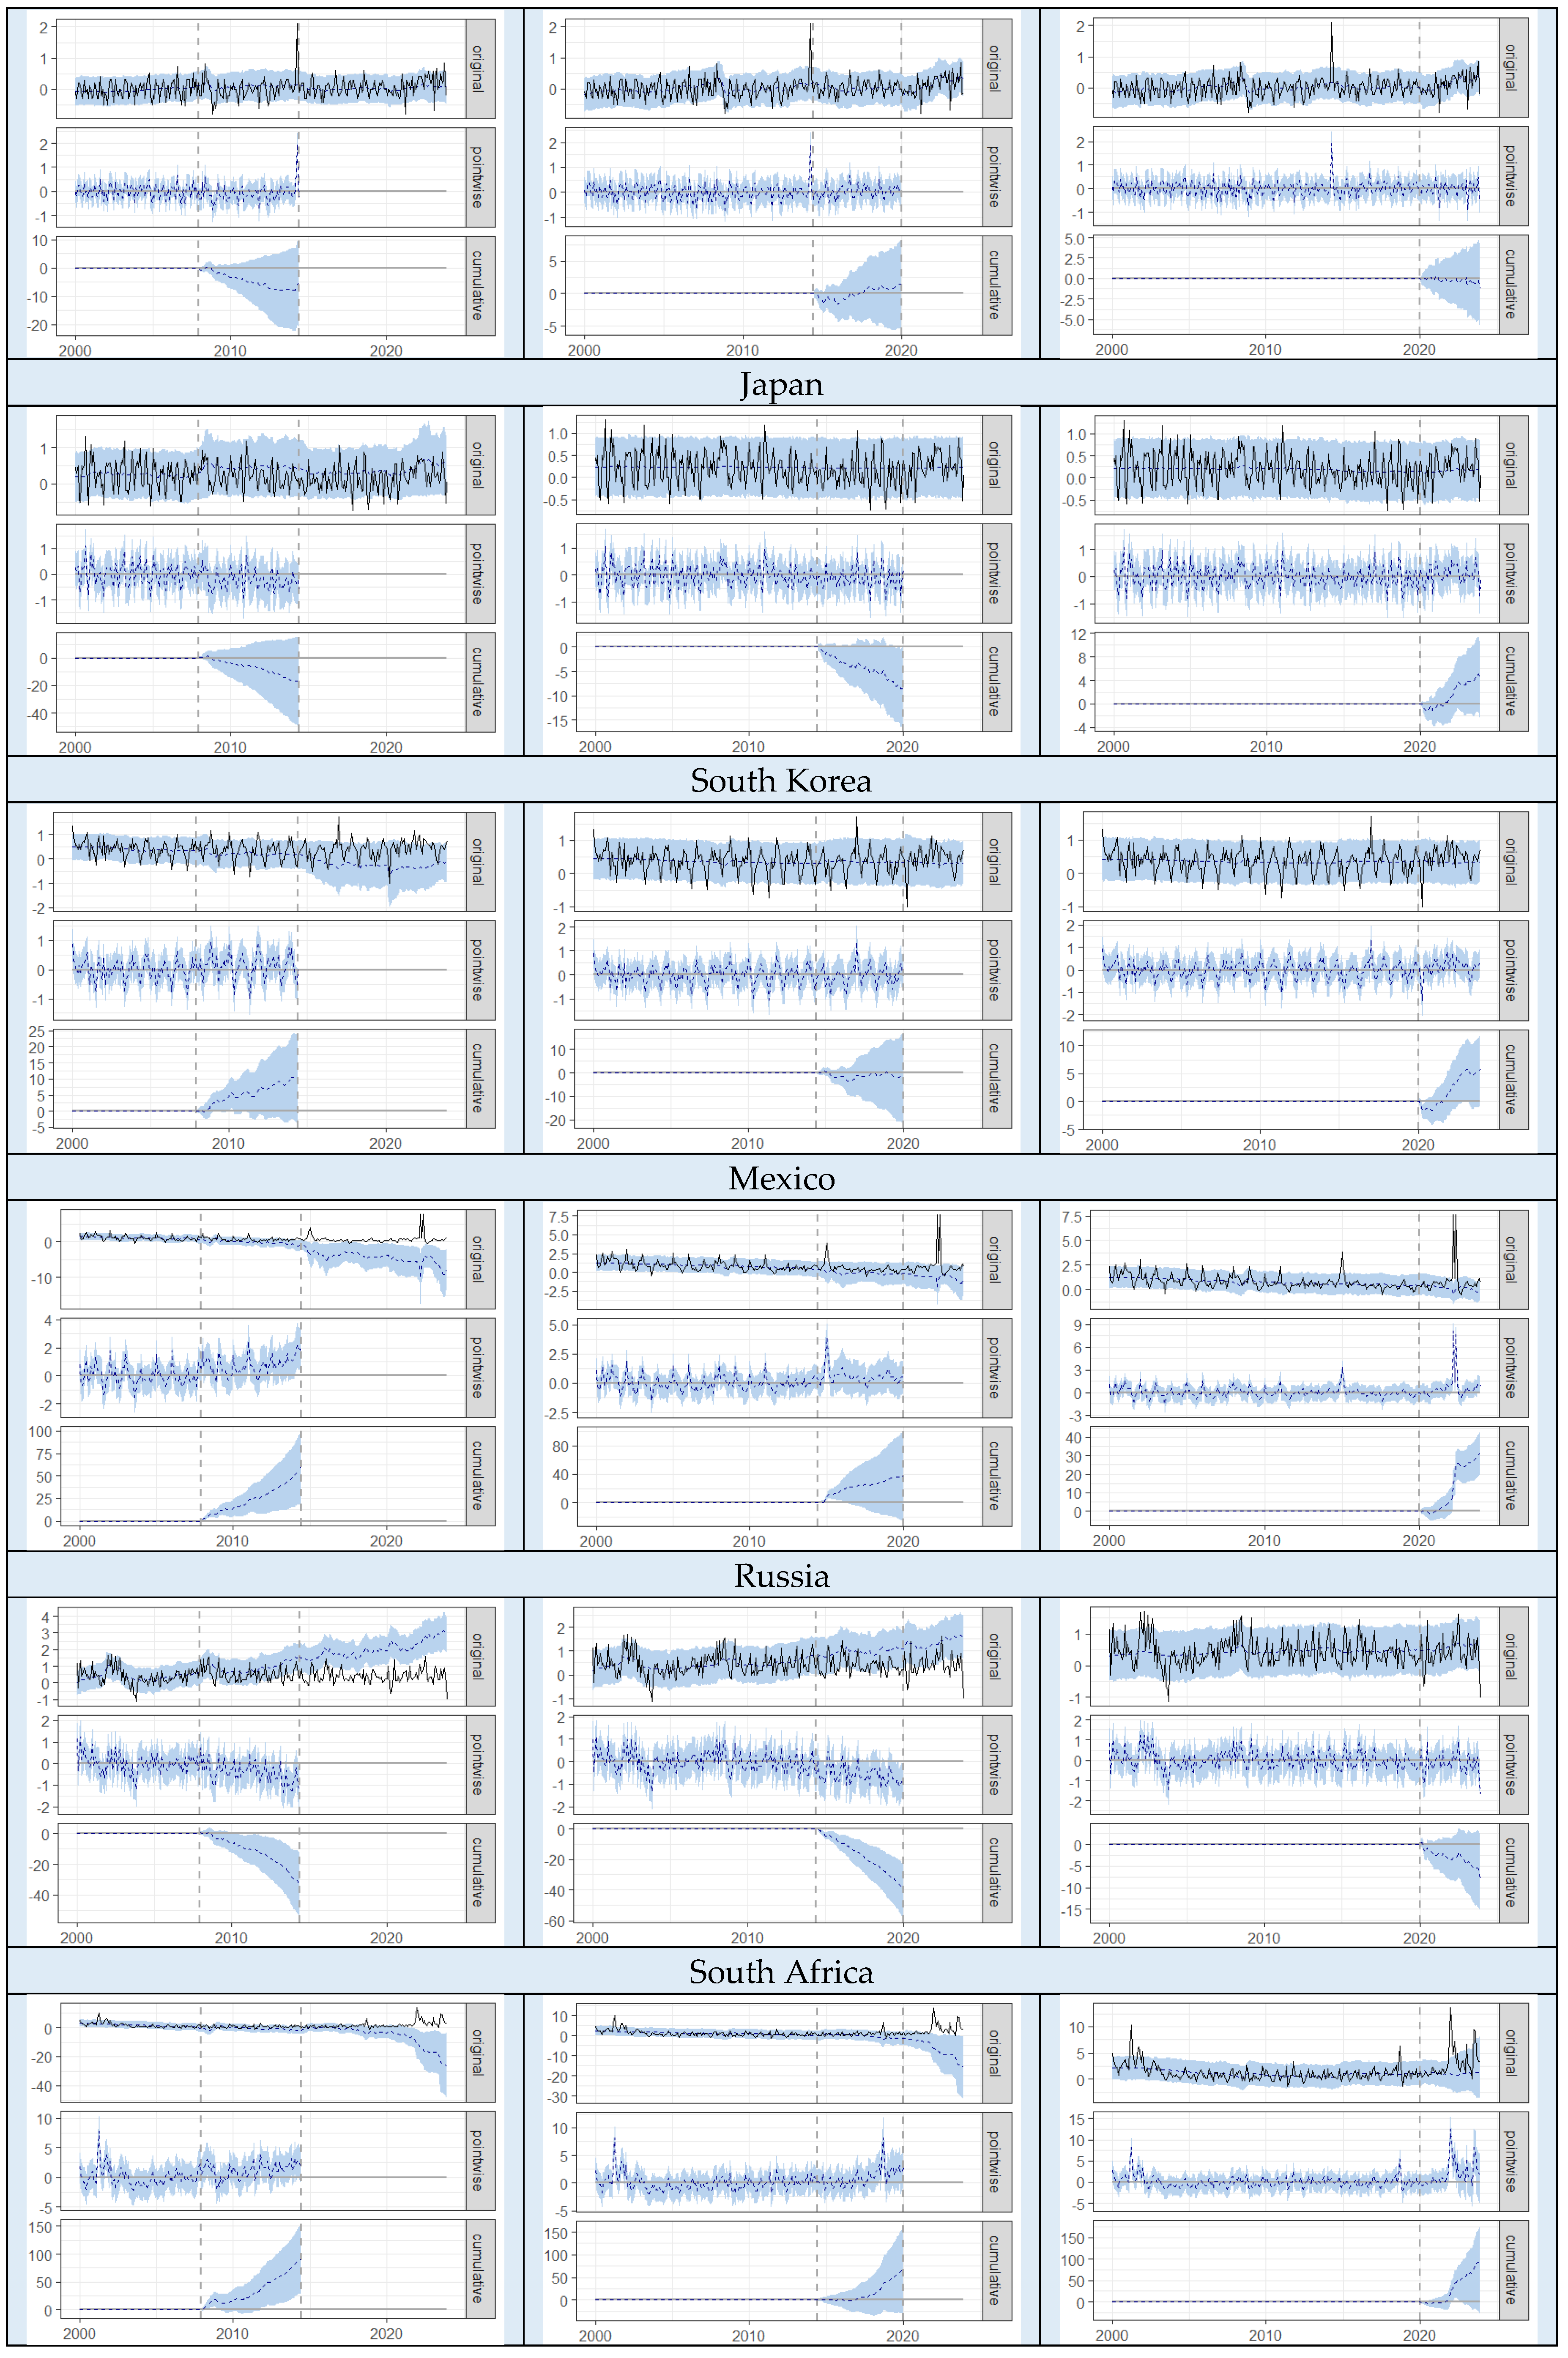
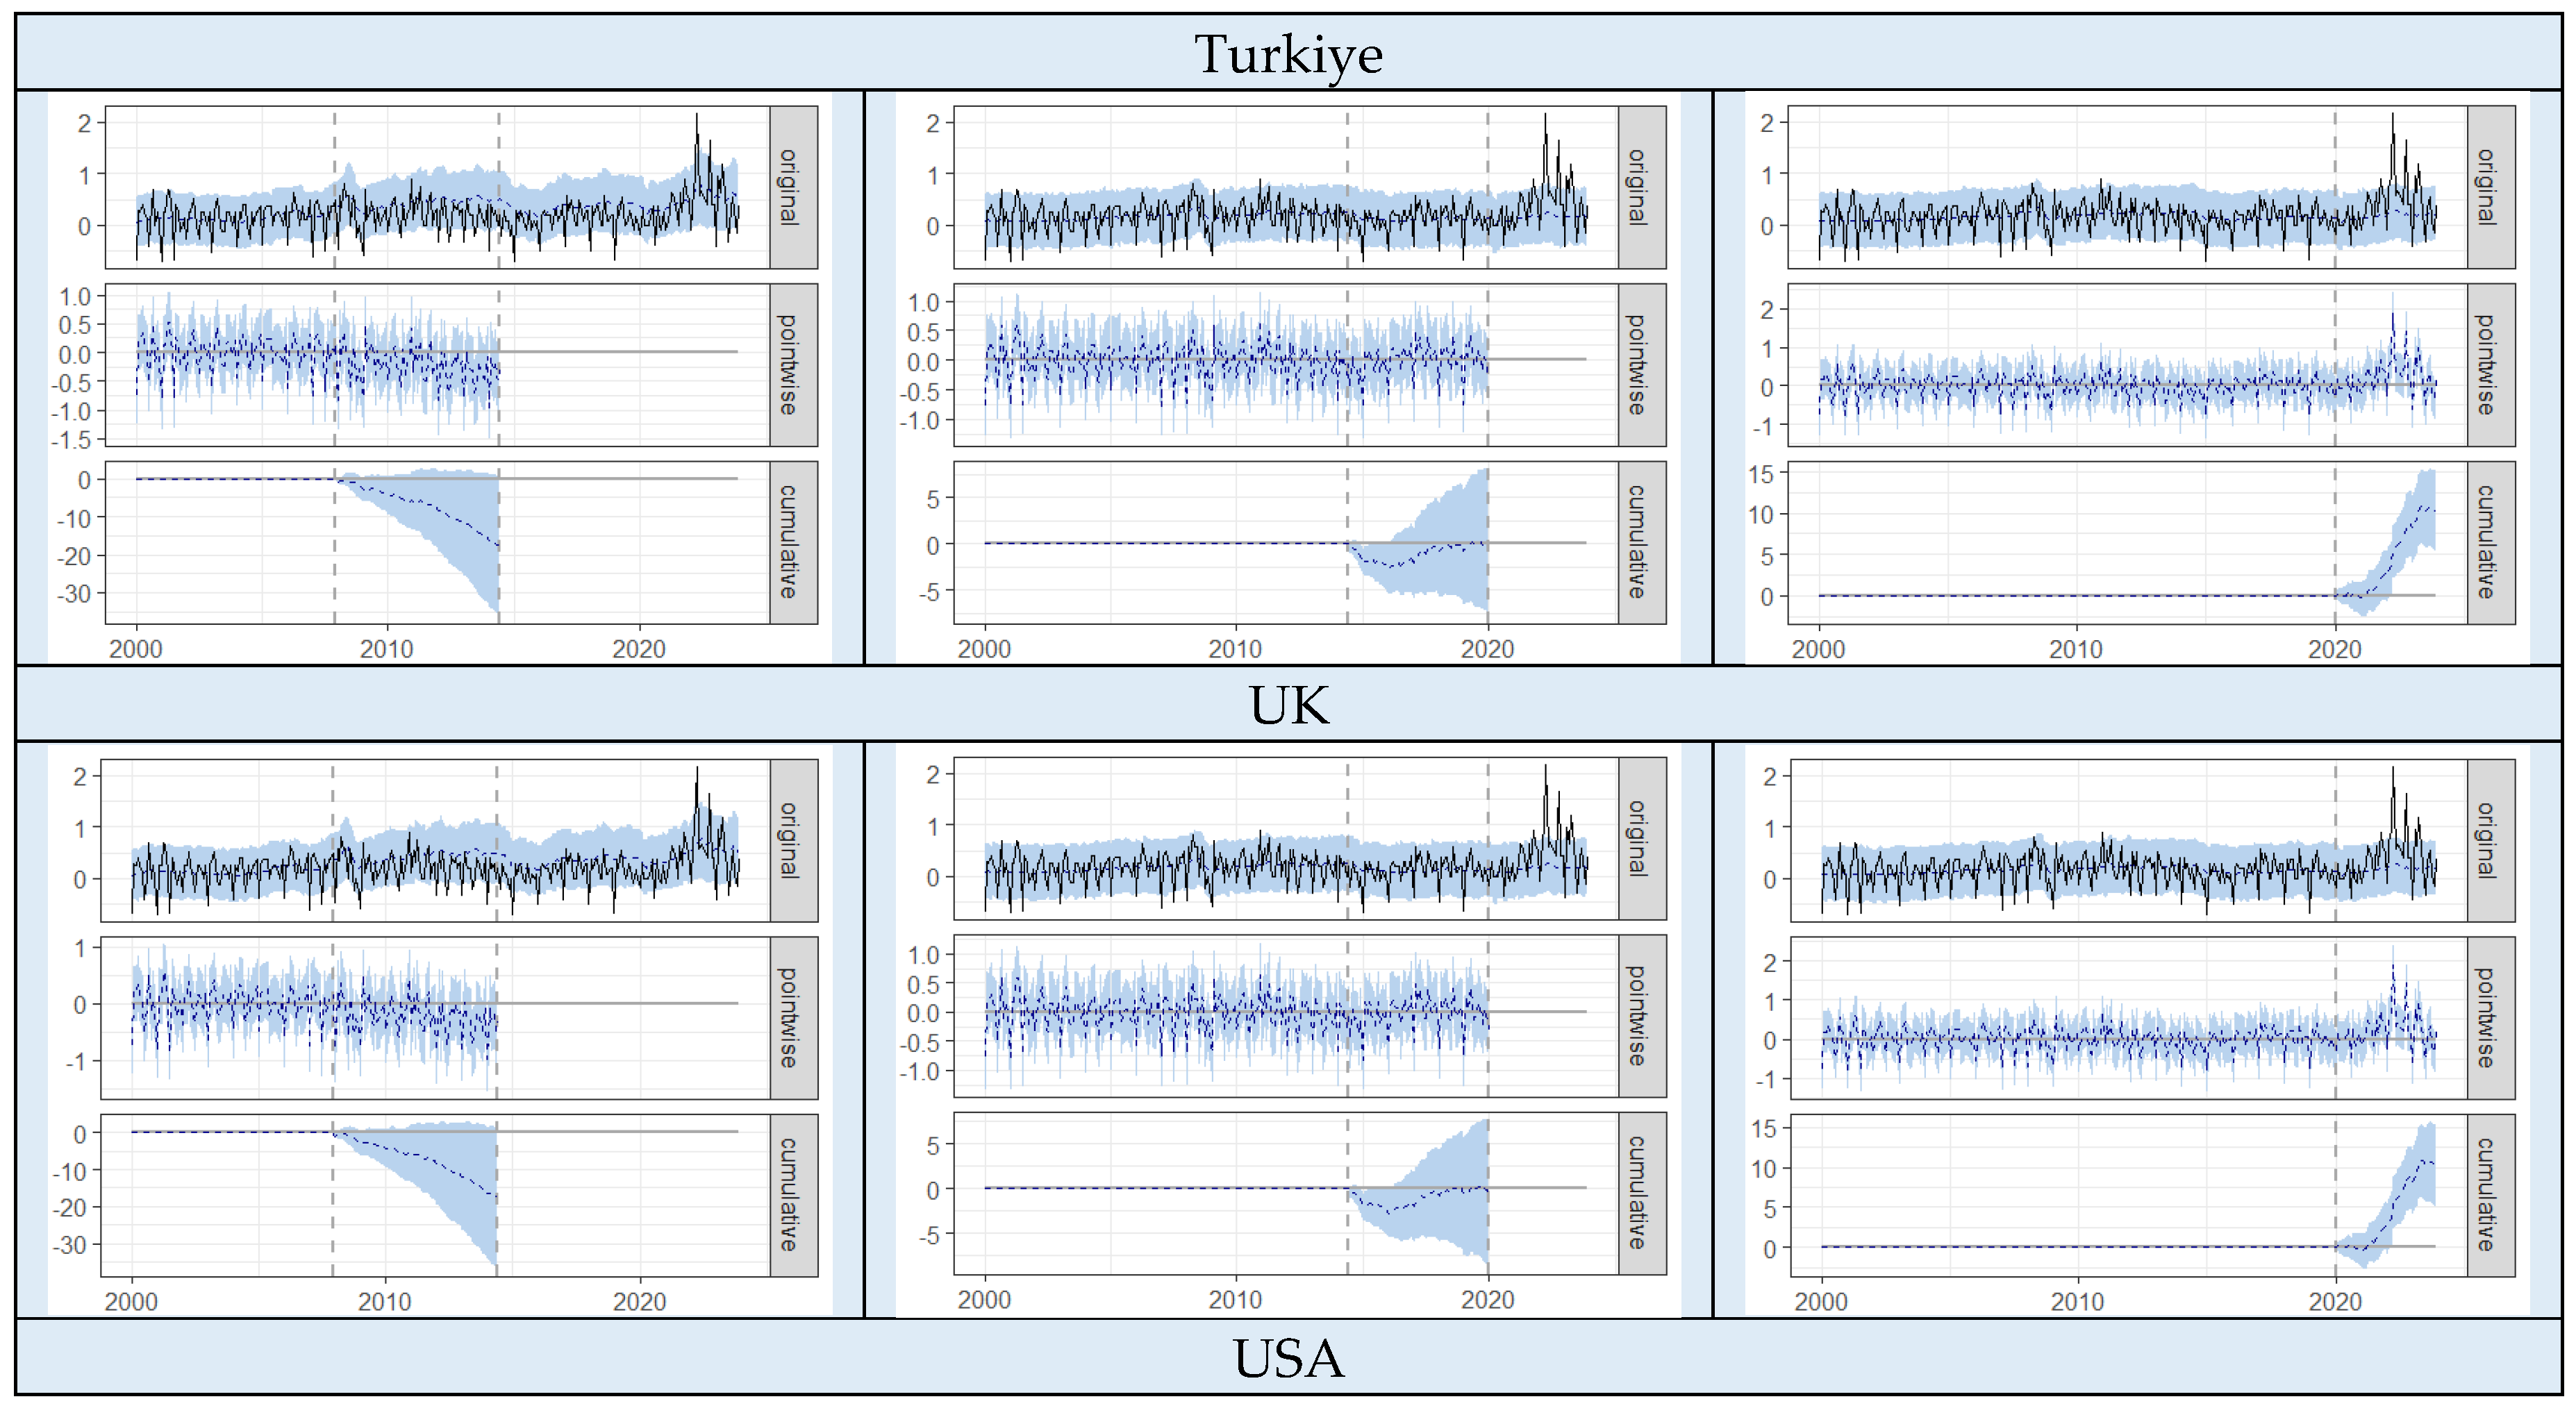
Figure 3.
Wavelet Transform Coherence.
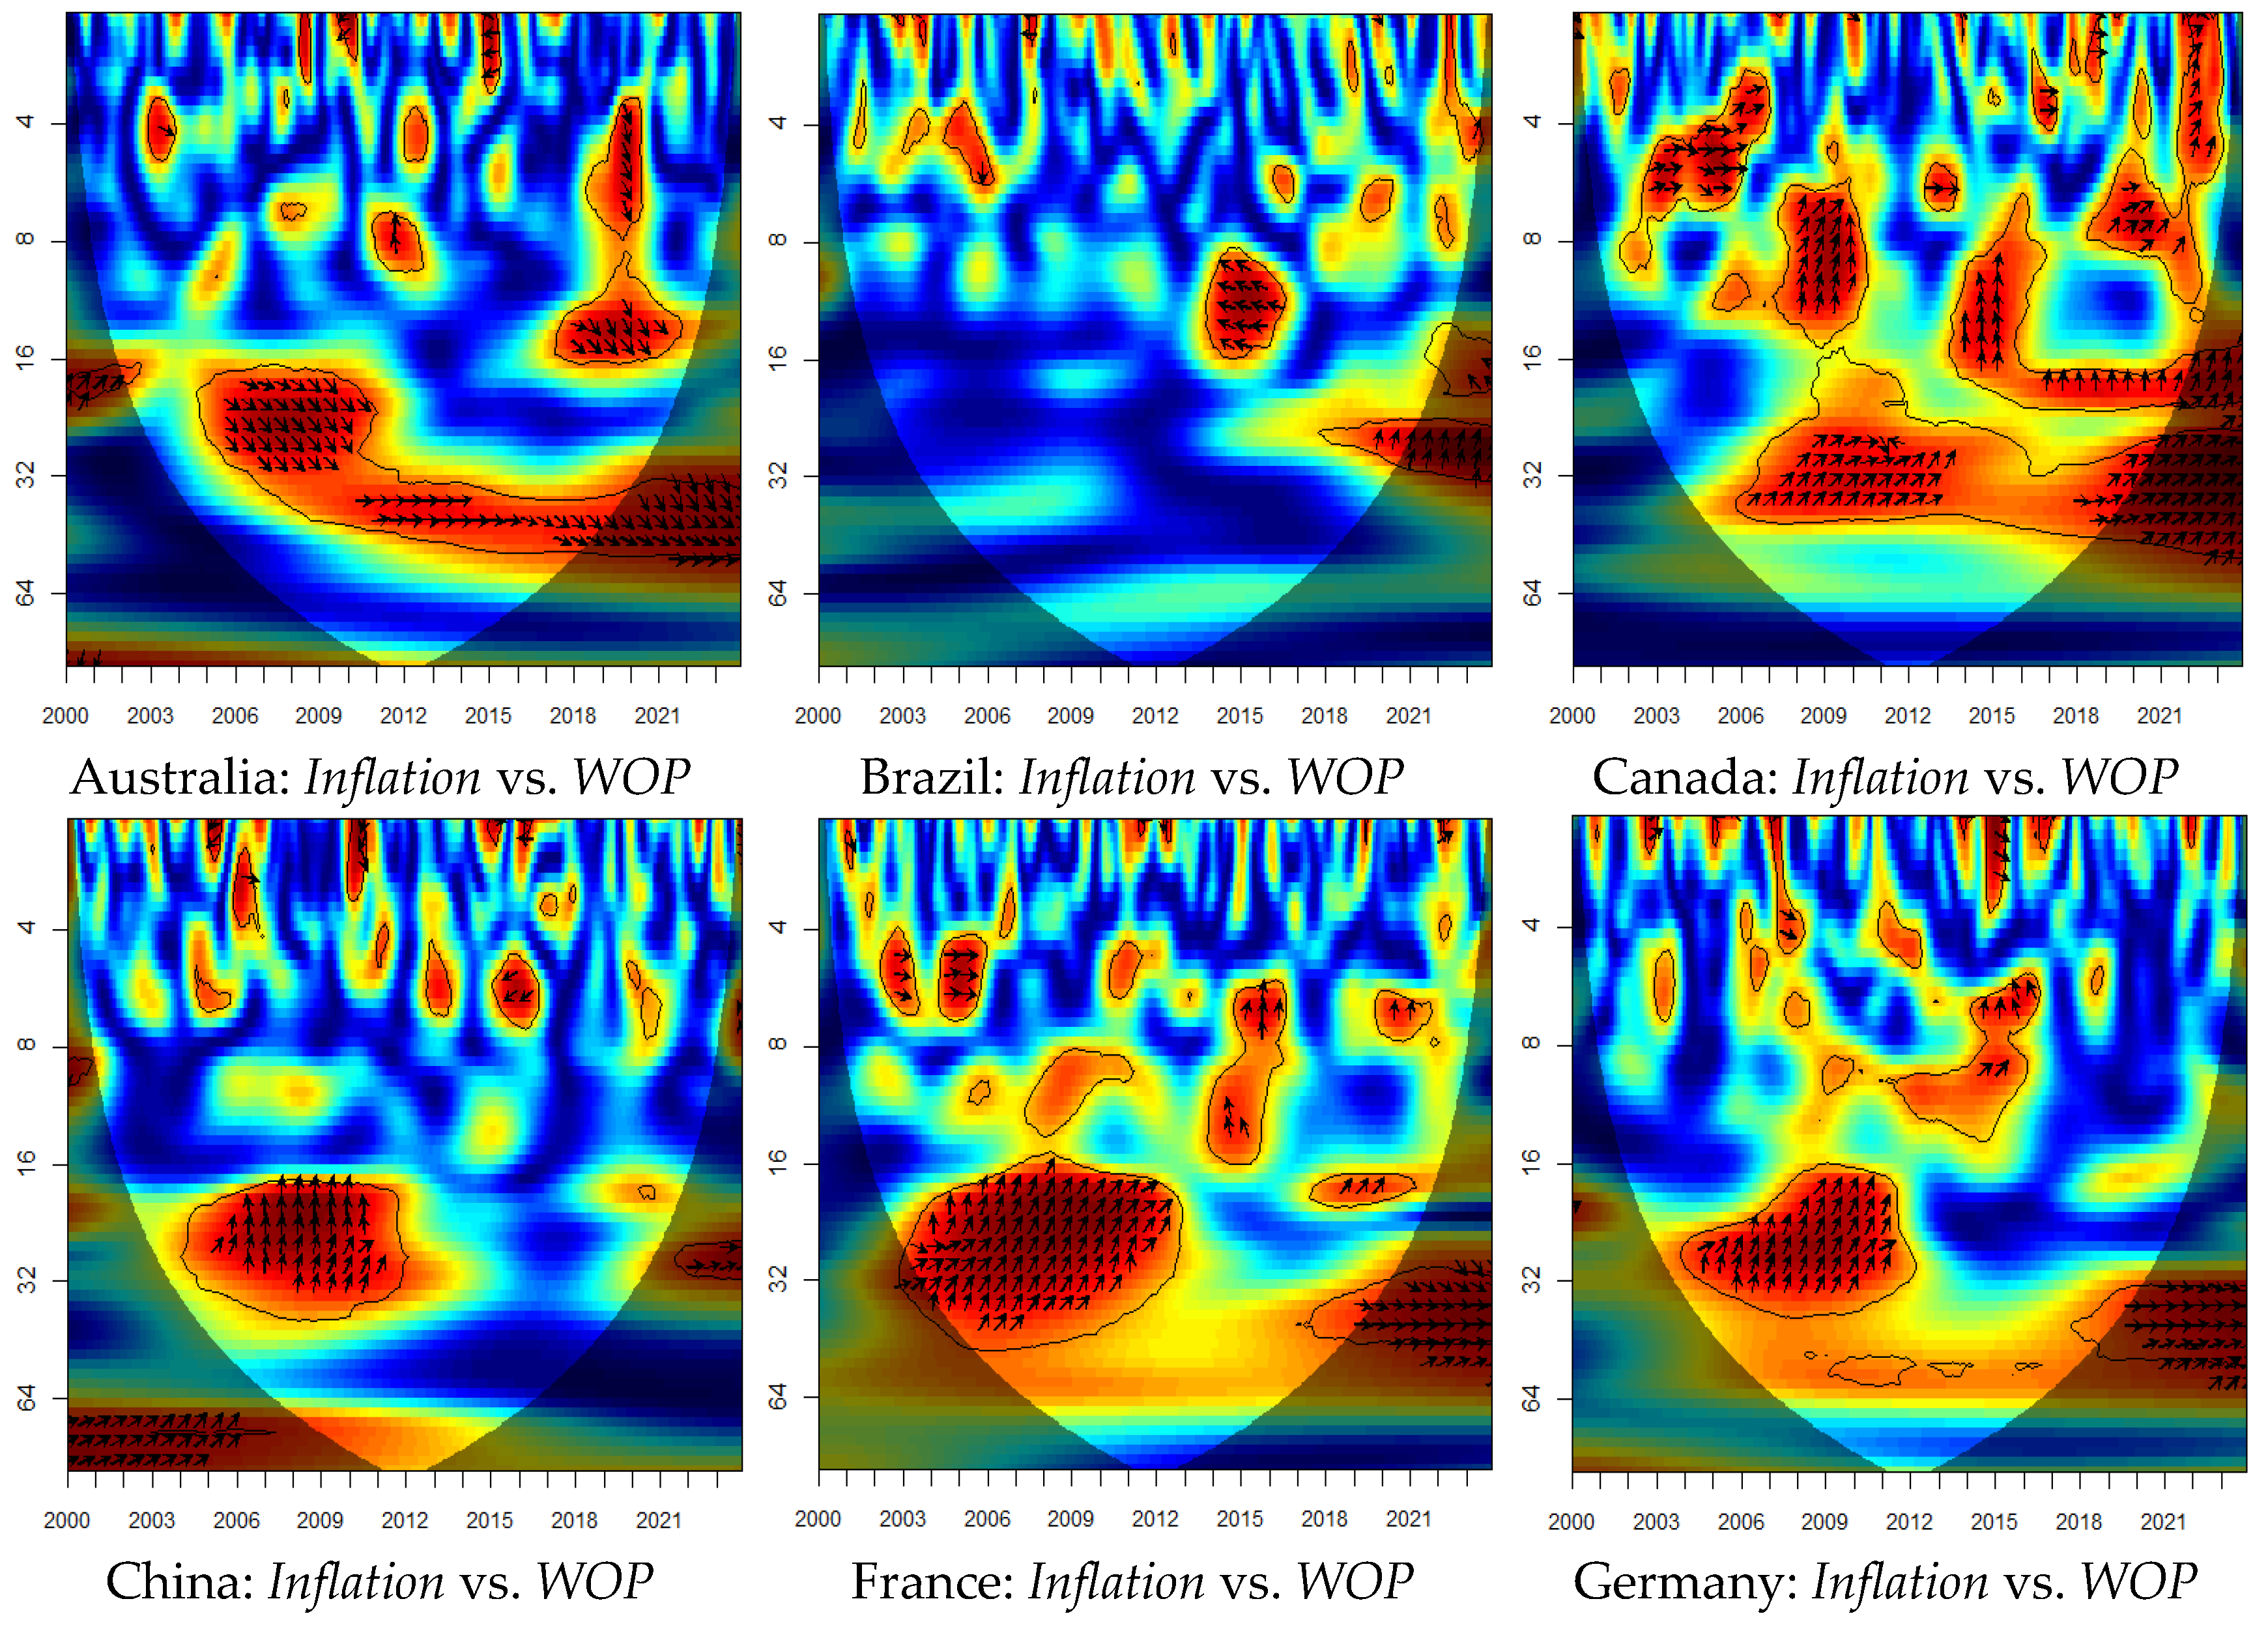
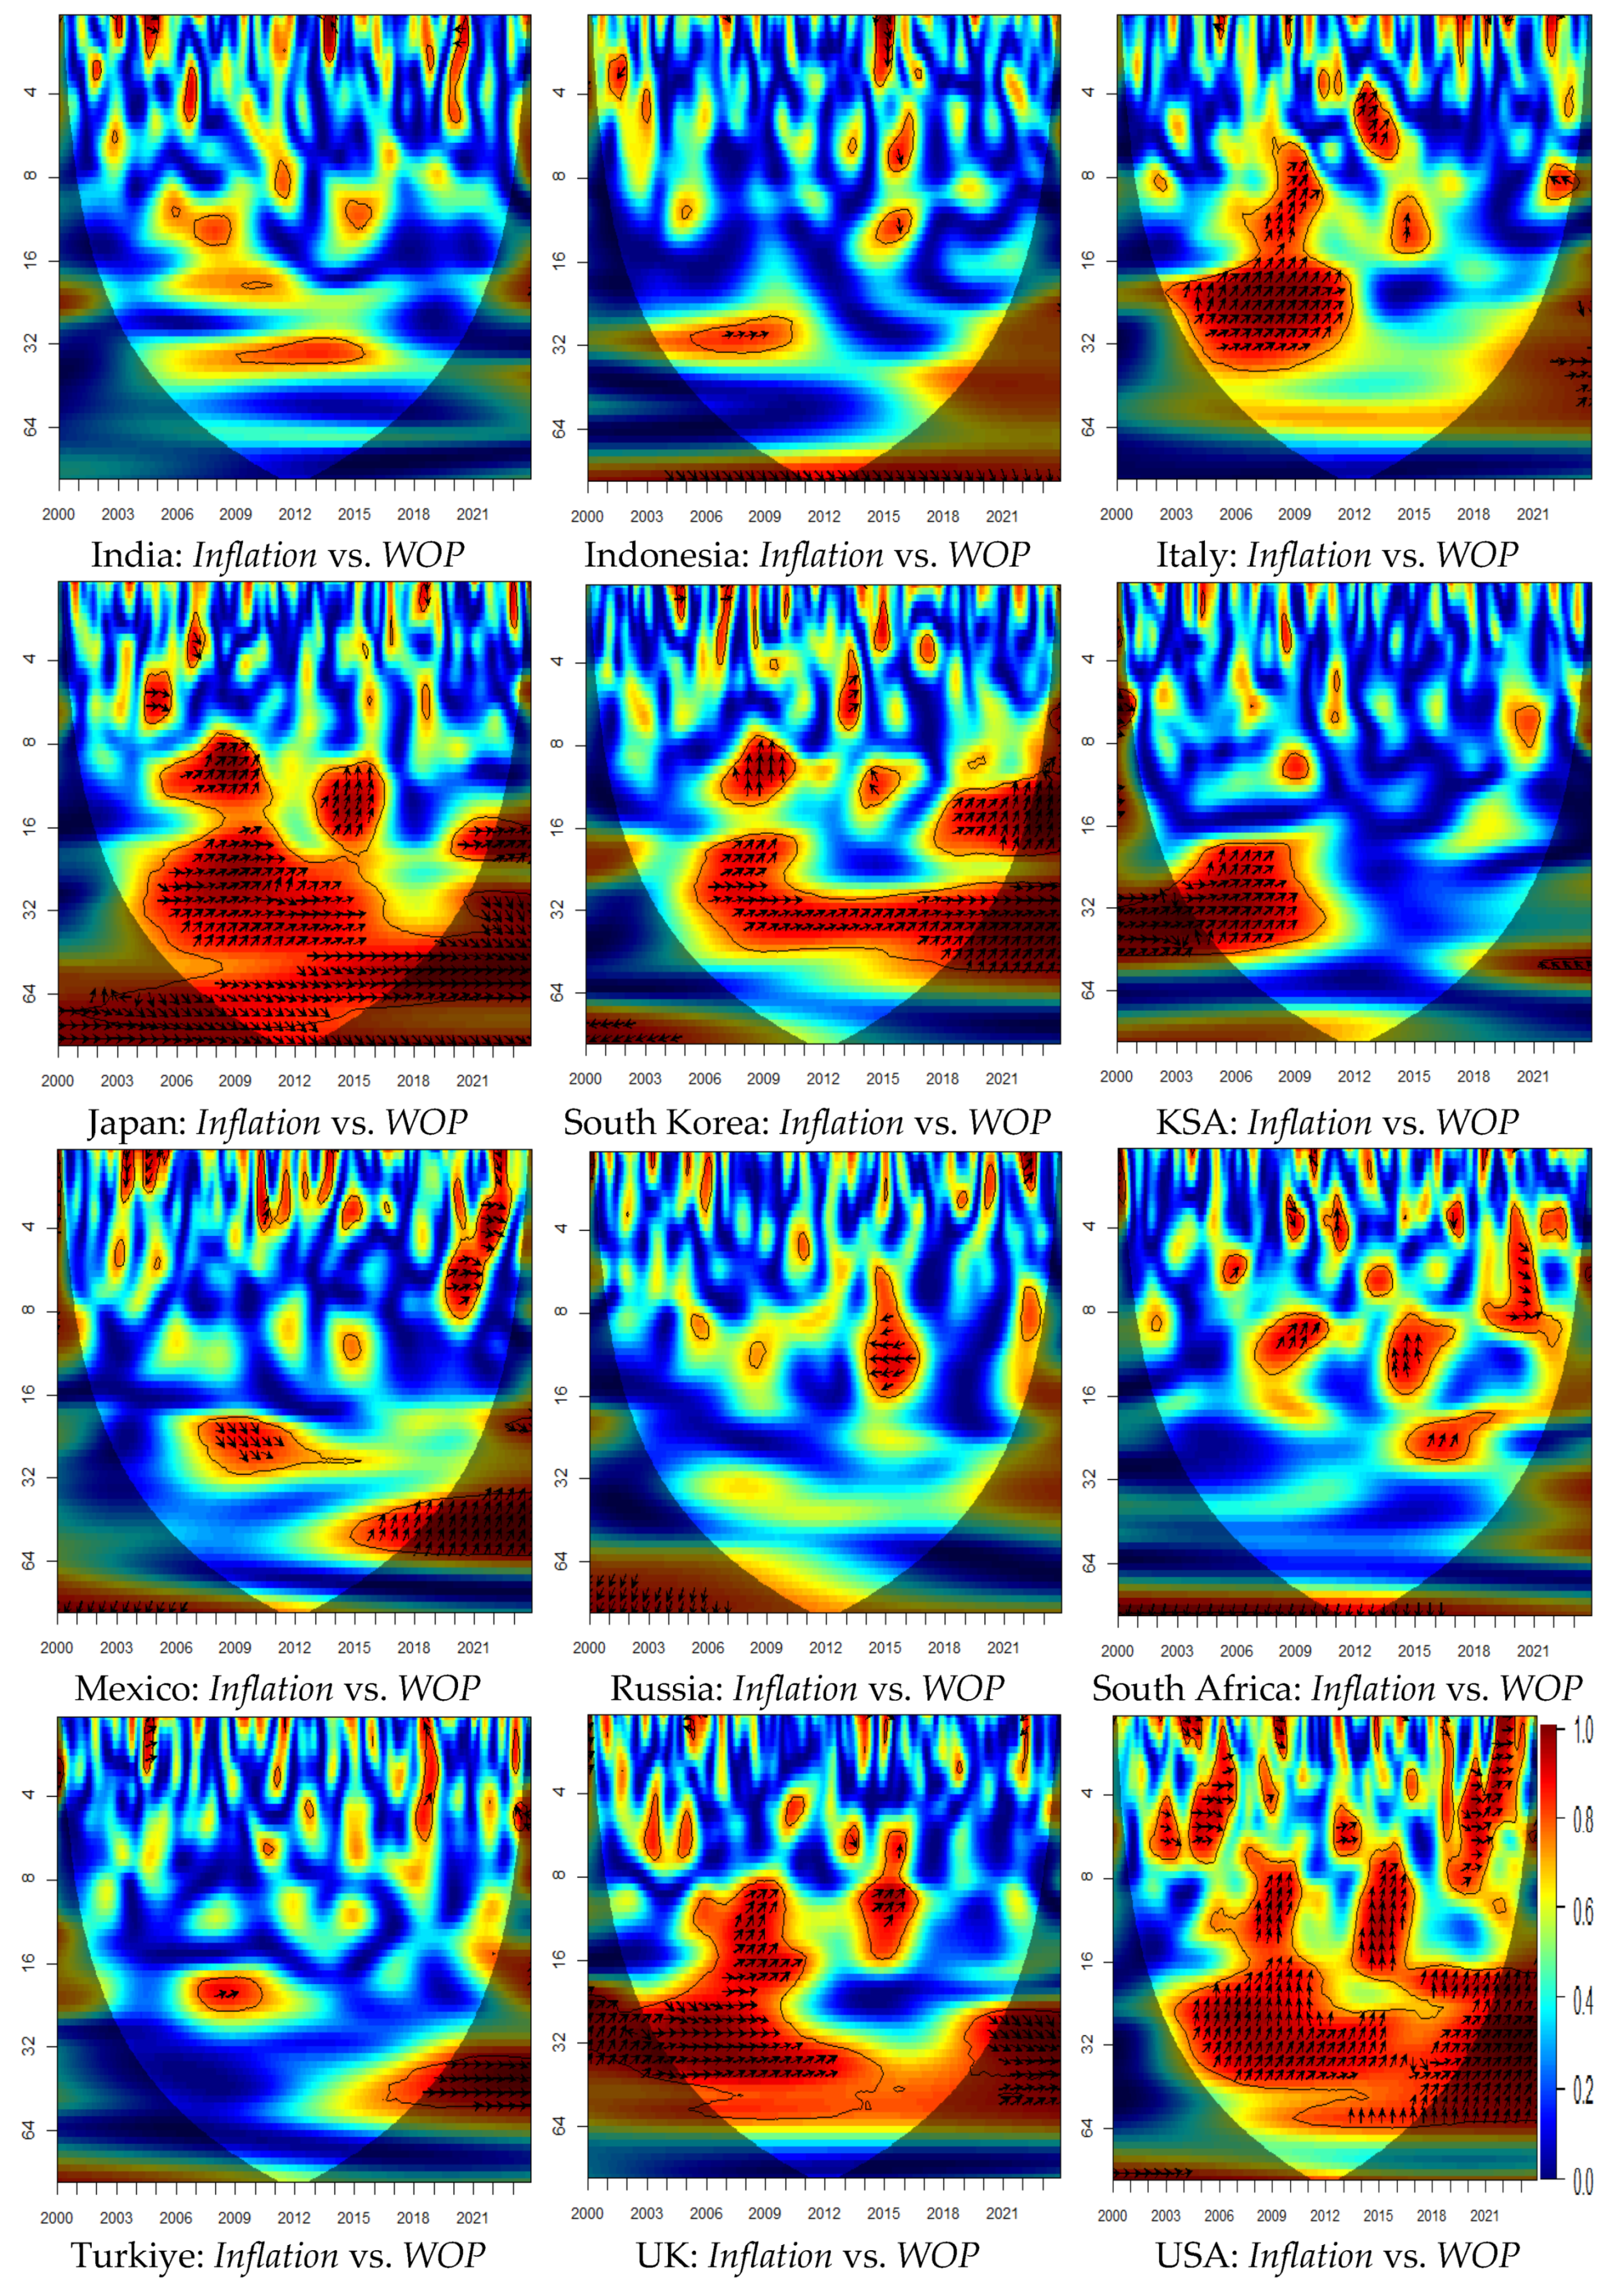
Figure 4.
Partial Wavelet Coherence.
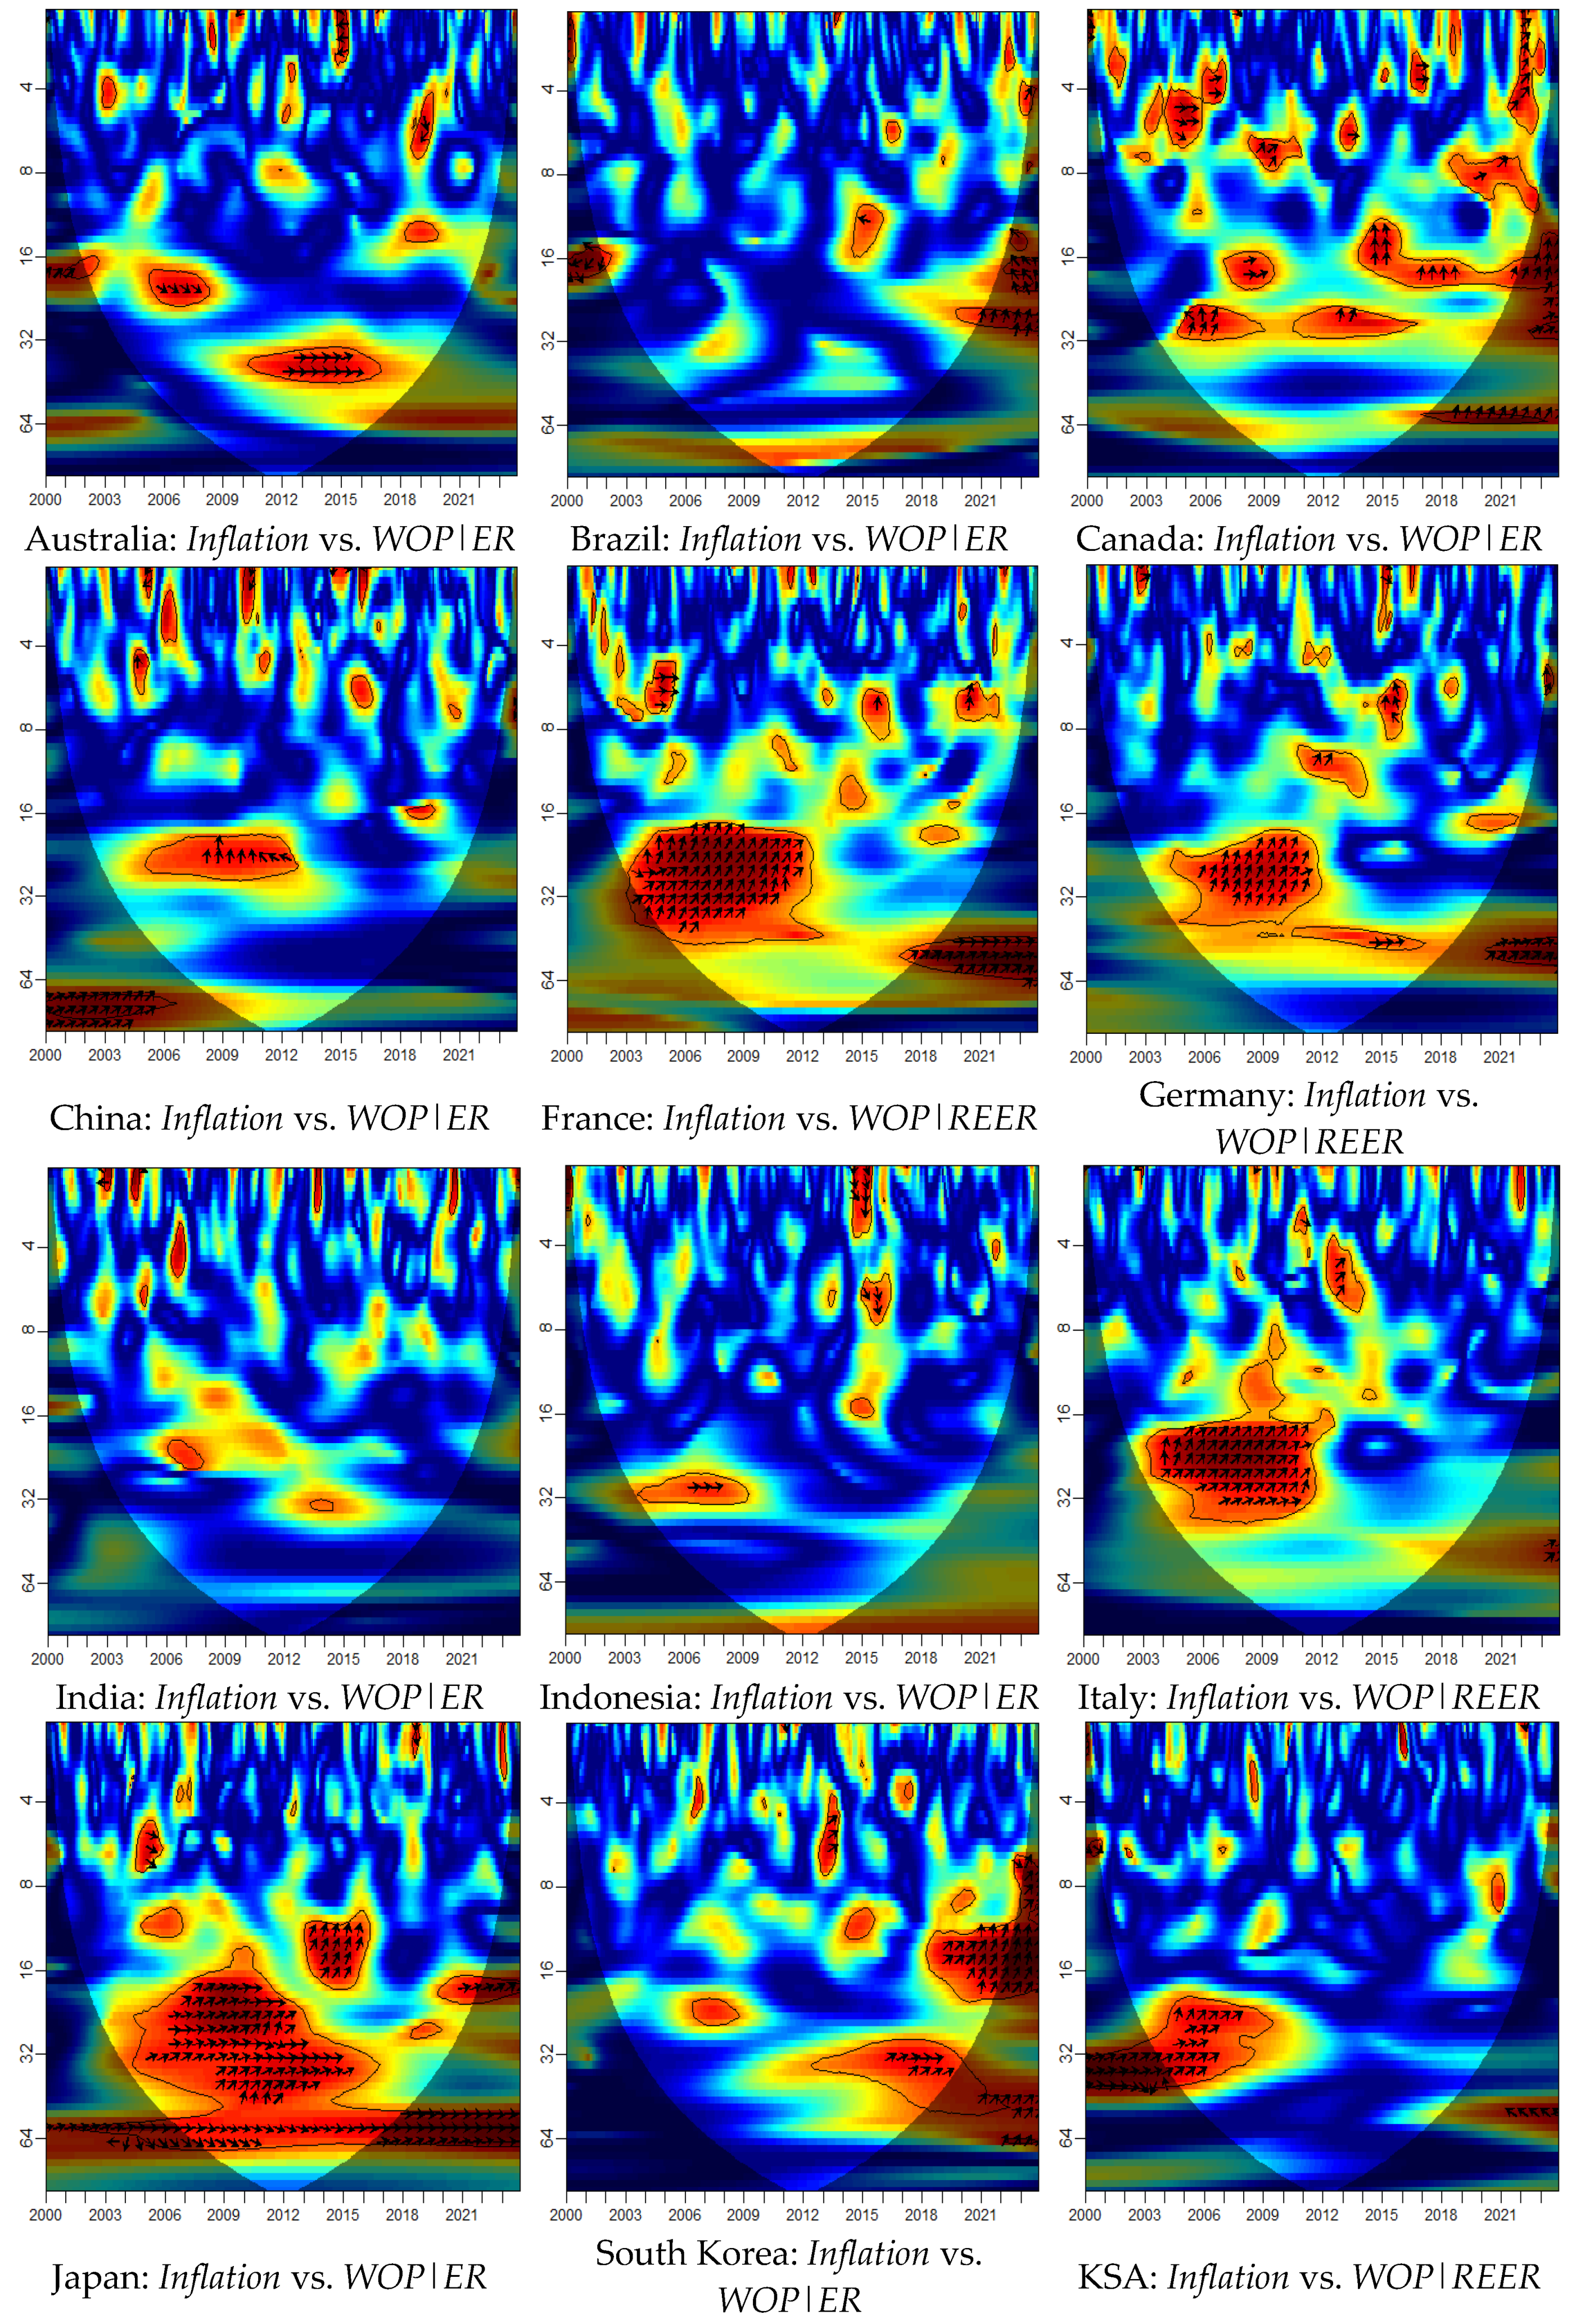
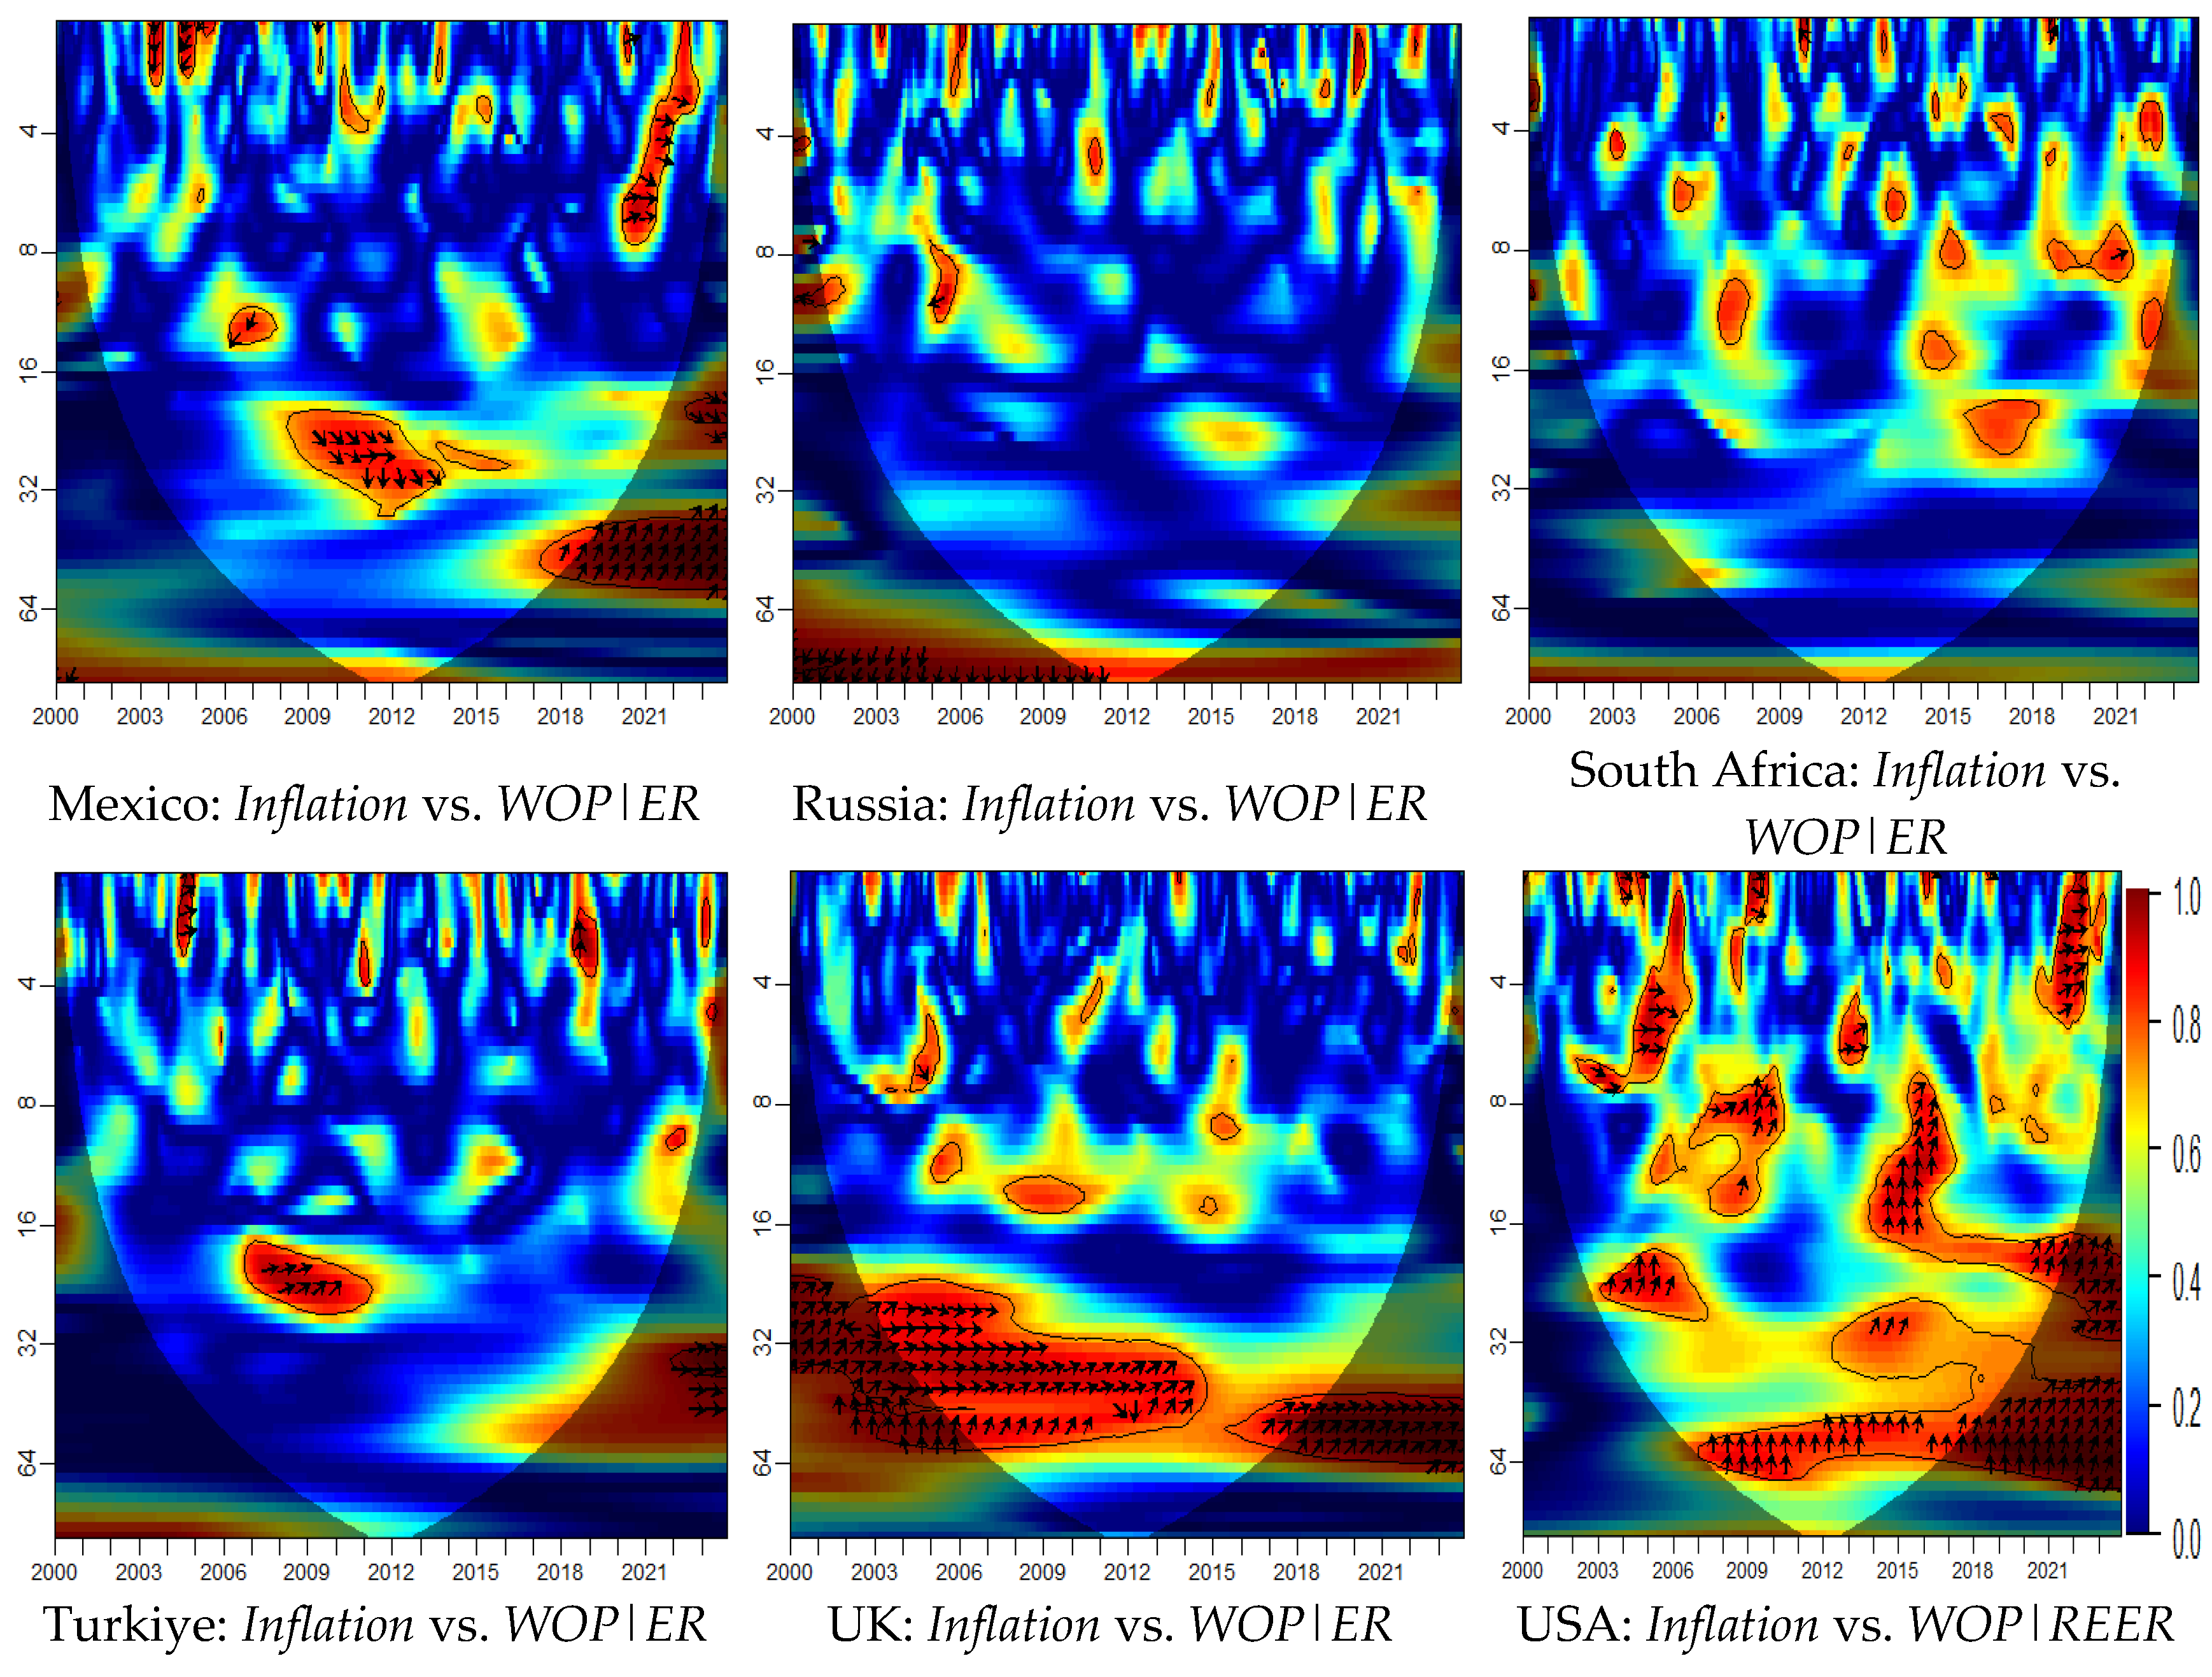
Figure 5.
Multivariate Wavelet Transform Coherence.
3.1. Causal Impact of Oil Prices on Inflation
Causal Impact of WOP on Inflation from 2007 to June 2014
During the period from December 2007 to June 2014, marked by the global financial crisis and a significant downturn in WOP. The causal impact of WOP on inflation during this period is reported in Table 2. The findings reveal a spectrum of economic responses to the relationship between oil price dynamics and the global financial crisis.
Countries like Australia witnessed a slight negative absolute effect, suggesting a modest decrease in inflation following the oil price downturn. In contrast, Brazil exhibited a substantial positive absolute effect. This disparity accentuates the varied economic responses of nations to the WOP downturn responses of inflation (Barsky & Kilian, 2002).
Canada, along with China, France, and Germany, demonstrated negative absolute effects, aligning with the conventional understanding that higher oil prices contribute to reduced economic activity and lower inflation (Hamilton, 1996). India displayed a marginal positive absolute effect, highlighting the resilience of its economy during the specified period, while Indonesia showed a significant negative absolute effect.
Italy, Japan, and South Korea exhibited negative absolute effects of varying magnitudes. Russia, unexpectedly, displayed a negative significant absolute effect of WOP on inflation, possibly due to unique geopolitical and economic factors in the region.
Mexico indicated a positive absolute effect, suggesting increased inflation, while South Africa displayed a substantial negative absolute effect, revealing a considerable decrease in inflation (Salisu et al., 2017). Turkiye exhibited a remarkably negative absolute effect, emphasizing the severity of the impact on inflation during this period. The UK and the USA both demonstrated negative absolute effects, indicating reduced inflation.
Relative effects, expressed as percentage changes in inflation, further accentuate asymmetries among countries. Brazil’s substantial 200.00% relative effect reflects a significant percentage increase in inflation while Russia and Turkiye exhibit large negative relative effects, indicating substantial percentage decreases, possibly due to specific economic challenges.

Table 2.
Posterior estimates - causal impact of oil prices on inflation during Dec. 2007 – Jun. 2014.
Table 2.
Posterior estimates - causal impact of oil prices on inflation during Dec. 2007 – Jun. 2014.
| Country | Actual | Prediction | 95% CI | Absolute effect | 95% CI | Relative effect | p |
|---|---|---|---|---|---|---|---|
| Australia | 2.80 | 3.00 | [2.6, 3.5] | -0.20 | [-0.71, 0.19] | -6.67% | 0.149 |
| Brazil | 0.48 | 0.16 | [-0.051, 0.37] | 0.32 | [0.11, 0.53] | 200.00% | 0.002 |
| Canada | 0.15 | 0.33 | [0.12, 0.54] | -0.18 | [-0.39, 0.03] | -54.55% | 0.053 |
| China | 0.22 | 1.40 | [0.3, 2.4] | -1.18 | [-2.2, -0.077] | -84.29% | 0.020 |
| France | 0.11 | 0.22 | [0.071, 0.38] | -0.11 | [-0.27, 0.039] | -50.00% | 0.072 |
| Germany | 0.11 | 0.22 | [0.018, 0.43] | -0.11 | [-0.32, 0.096] | -50.00% | 0.156 |
| India | 0.78 | 0.77 | [0.17, 1.4] | 0.01 | [-0.58, 0.61] | 1.30% | 0.494 |
| Indonesia | 0.47 | 0.95 | [0.46, 1.4] | -0.48 | [-0.95, 0.011] | -50.53% | 0.028 |
| Italy | 0.15 | 0.20 | [0.14, 0.27] | -0.05 | [-0.12, 0.014] | -25.00% | 0.059 |
| Japan | 0.03 | 0.10 | [-0.091, 0.29] | -0.07 | [-0.27, 0.12] | -74.00% | 0.218 |
| South Korea | 0.23 | 0.45 | [0.054, 0.86] | -0.22 | [-0.63, 0.17] | -48.89% | 0.152 |
| KSA | 0.38 | 0.55 | [0.36, 0.72] | -0.17 | [-0.34, 0.023] | -30.91% | 0.044 |
| Mexico | 0.34 | 0.21 | [0.033, 0.4] | 0.13 | [-0.062, 0.31] | 61.90% | 0.099 |
| Russia | 0.68 | -0.09 | [-0.61, 0.44] | 0.77 | [0.24, 1.3] | -831.18% | 0.001 |
| South Africa | 0.50 | 0.93 | [0.66, 1.2] | -0.43 | [-0.69, -0.16] | -46.24% | 0.001 |
| Turkiye | 0.66 | -0.53 | [-1.3, 0.23] | 1.19 | [0.43, 2] | -224.53% | 0.003 |
| UK | 0.21 | 0.44 | [0.2, 0.69] | -0.23 | [-0.47, 0.011] | -52.27% | 0.036 |
| USA | 0.16 | 0.33 | [0.16, 0.51] | -0.17 | [-0.34, 0.0082] | -51.52% | 0.035 |
Note: p is Bayesian posterior tail-area probability for the significance of causal impact.
Causal Impact of WOP on Inflation June 2014 – January 2020
The causal impact of WOP on inflation from June 2014 to January 2020 is reported in Table 3 and Figure 2. The Causal Impact findings reveal diverse impacts on inflation across countries. Noteworthy trends emerged as we examined the absolute effects which show distinctive patterns in this regard.
Australia witnessed a substantial negative absolute causal impact of WOP on inflation, aligning with established literature recognizing the deflationary impact of falling oil prices on advanced economies (Hamilton, 1996, 2003). Emerging economies such as Brazil, Indonesia, and South Africa Brazil displayed a significant negative absolute causal impact. The findings are consistent with studies recognizing the deflationary consequences of oil price downturns during this period in emerging markets (Barsky & Kilian, 2002)
Canada, India, and KSA exhibited a modest negative absolute causal impact, meanwhile, China, France, Germany, and the USA showed negligible absolute causal impact, suggesting a limited impact on inflation possibly influenced by their diverse economic structures. Italy and South Korea experienced a significant negative absolute effect, aligning with research that recognizes the deflationary impact of reduced oil prices on certain European economies. Japan’s positive absolute effect indicates a minor increase in inflation, reflecting the varied impact of oil price changes on different economies.
Mexico’s negligible absolute effect suggests a limited impact on inflation, possibly influenced by diverse economic factors shaping the Mexican economy. The absolute causal impact of WOP on inflation in Russia and Turkiye was remarkably high which reflects the vulnerability of emerging economies to external shocks.
The UK displayed a negligible absolute effect, suggesting a limited impact on inflation, potentially influenced by the diverse economic factors shaping the UK economy. Relative effects highlight percentage changes in inflation which show asymmetries among G20 economies. The heterogeneity in findings shows the importance of considering country-specific factors when analyzing the impact of oil price changes on inflation.
Table 3.
Posterior estimates - causal impact of oil prices on inflation during Jun. 2014 – Jan. 2020.
Table 3.
Posterior estimates - causal impact of oil prices on inflation during Jun. 2014 – Jan. 2020.
| Country | Actual | Prediction | 95% CI | Absolute effect | 95% CI | Relative effect | p |
|---|---|---|---|---|---|---|---|
| Australia | 1.70 | 2.50 | [2.2, 2.9] | -0.80 | [-1.2, -0.5] | -32% | 0.001 |
| Brazil | 0.45 | 1.00 | [0.83, 1.2] | -0.55 | [-0.75, -0.38] | -55% | 0.001 |
| Canada | 0.12 | 0.18 | [0.043, 0.3] | -0.06 | [-0.18, 0.081] | -33% | 0.208 |
| China | 0.21 | 0.12 | [-0.18, 0.39] | 0.09 | [-0.18, 0.39] | 75% | 0.261 |
| France | 0.07 | 0.08 | [-0.033, 0.2] | -0.02 | [-0.14, 0.097] | -23% | 0.387 |
| Germany | 0.08 | 0.09 | [-0.039, 0.22] | -0.01 | [-0.13, 0.12] | -8% | 0.456 |
| India | 0.38 | 0.45 | [0.02, 0.9] | -0.07 | [-0.52, 0.36] | -16% | 0.387 |
| Indonesia | 0.33 | 0.90 | [0.39, 1.4] | -0.57 | [-1.1, -0.057] | -63% | 0.020 |
| Italy | 0.04 | 0.17 | [0.099, 0.24] | -0.13 | [-0.2, -0.057] | -75% | 0.001 |
| Japan | 0.04 | 0.02 | [-0.088, 0.11] | 0.02 | [-0.075, 0.13] | 131% | 0.358 |
| South Korea | 0.09 | 0.21 | [0.082, 0.34] | -0.12 | [-0.25, 0.008] | -57% | 0.035 |
| KSA | 0.05 | 0.09 | [-0.031, 0.22] | -0.04 | [-0.17, 0.082] | -46% | 0.263 |
| Mexico | 0.34 | 0.36 | [0.077, 0.67] | -0.02 | [-0.33, 0.27] | -6% | 0.476 |
| Russia | 0.50 | -0.06 | [-1, 0.88] | 0.56 | [-0.38, 1.5] | 881% | 0.130 |
| South Africa | 0.39 | 0.97 | [0.73, 1.2] | -0.58 | [-0.85, -0.34] | -60% | 0.001 |
| Turkiye | 0.92 | -0.10 | [-1.6, 1.4] | 1.02 | [-0.44, 2.5] | 1048% | 0.088 |
| UK | 0.12 | 0.13 | [0.0027, 0.24] | -0.01 | [-0.12, 0.12] | -8% | 0.488 |
| USA | 0.12 | 0.19 | [0.049, 0.32] | -0.07 | [-0.21, 0.069] | -37% | 0.161 |
Note: p is Bayesian posterior tail-area probability for the significance of causal impact.
Causal Impact of WOP on Inflation January 2020 – December 2023
Over the span from January 2020 to December 2023, characterized by the dual impact of the COVID-19 pandemic and a substantial decline in oil prices, the Causal Impact findings in Table 4 offer a thematic perspective on inflation outcomes across countries, with a particular focus on their absolute effects.
Several G20 countries, including Australia, France, Germany, India, Italy, Saudi Arabia (KSA), Mexico, Russia, Turkey, the UK, and the USA, exhibited positive absolute effects, signifying a noteworthy rise in inflation. The magnitude of these increases varied, reflecting the distinctive economic structures, policy approaches, and challenges faced by each nation. South Korea, Mexico, and Turkey exhibited moderate positive absolute causal impact.
Canada, Japan, the UK, and the USA showed small positive absolute effects due to the oil price downturn in 2020. This suggests that economic structure, policy responses, and the repercussions of the COVID-19 pandemic may be the major contributing factors of the rise in inflation even in the presence of low oil prices. China stood out with a substantial negative absolute causal impact, emphasizing a significant decrease in inflation. The deflationary pressures experienced by China during the pandemic, affecting both domestic demand and global trade, played a pivotal role in this regard. South Africa displayed a moderate negative absolute causal impact on inflation. Japan’s negligible absolute effect suggests the limited impact on inflation, reflecting persistent challenges faced by the Japanese economy, including deflationary pressures and a cautious approach to monetary policy.
These findings illuminate notable asymmetries in inflation outcomes. The COVID-19 pandemic likely played a significant role in shaping relationships between WOP and inflation. The initial oil price decline in early 2020 might have dampened inflationary pressures in some countries (e.g., France, Germany), while the subsequent price rise throughout the period could have exacerbated inflation in others (e.g., Australia, Turkiye). Country-specific factors may also contribute to these asymmetries. For example, reliance on oil imports, monetary and fiscal policies, and the structure of the economy.
Table 4.
Posterior estimates - causal impact of oil prices on inflation during Jan. 2020 – Dec. 2023.
Table 4.
Posterior estimates - causal impact of oil prices on inflation during Jan. 2020 – Dec. 2023.
| Country | Actual | Prediction | 95% CI | Absolute effect | 95% CI | Relative effect | p |
|---|---|---|---|---|---|---|---|
| Australia | 4.00 | 2.20 | [0.36, 4] | 1.80 | [-0.004, 3.7] | 82% | 0.028 |
| Brazil | 0.51 | 0.65 | [0.43, 0.86] | -0.14 | [-0.35, 0.08] | -22% | 0.120 |
| Canada | 0.31 | 0.26 | [0.13, 0.4] | 0.05 | [-0.091, 0.18] | 19% | 0.259 |
| China | 0.04 | 0.23 | [0.042, 0.44] | -0.19 | [-0.4, -0.003] | -83% | 0.023 |
| France | 0.27 | 0.08 | [-0.033, 0.19] | 0.19 | [0.074, 0.3] | 255% | 0.001 |
| Germany | 0.35 | 0.11 | [-0.021, 0.24] | 0.24 | [0.11, 0.37] | 218% | 0.002 |
| India | 0.50 | 0.42 | [0.14, 0.7] | 0.08 | [-0.2, 0.36] | 19% | 0.289 |
| Indonesia | 0.24 | 0.32 | [0.022, 0.62] | -0.08 | [-0.38, 0.22] | -25% | 0.307 |
| Italy | 0.32 | 0.10 | [0.022, 0.17] | 0.23 | [0.15, 0.3] | 237% | 0.001 |
| Japan | 0.13 | 0.15 | [0.048, 0.26] | -0.02 | [-0.14, 0.08] | -13% | 0.329 |
| South Korea | 0.25 | 0.16 | [0.02, 0.3] | 0.09 | [-0.05, 0.23] | 56% | 0.103 |
| KSA | 0.24 | 0.05 | [-0.1, 0.21] | 0.19 | [0.03, 0.35] | 362% | 0.008 |
| Mexico | 0.47 | 0.34 | [0.21, 0.48] | 0.13 | [-0.018, 0.26] | 38% | 0.038 |
| Russia | 0.84 | 0.16 | [-0.11, 0.43] | 0.68 | [0.41, 0.95] | 425% | 0.001 |
| South Africa | 0.42 | 0.59 | [0.4, 0.78] | -0.17 | [-0.35, 0.021] | -29% | 0.041 |
| Turkiye | 3.10 | 1.10 | [-0.68, 3.7] | 2.00 | [-0.57, 3.8] | 182% | 0.063 |
| UK | 0.40 | 0.18 | [0.069, 0.28] | 0.22 | [0.12, 0.33] | 122% | 0.002 |
| USA | 0.37 | 0.34 | [0.14, 0.53] | 0.03 | [-0.16, 0.23] | 9% | 0.375 |
3.2. Wavelet Coherence Analysis
The figures from 3 to 5 depict the estimated wavelet coherence and the relative phasing of the two series spanning from January 2000 to December 2023. The visual representation describes the dynamics between oil price fluctuations and inflation across different time scales. A discernible black contour in wavelet coherence plots demarcates the 5% significance level. Warm colors like red highlight periods of robust co-movements and cooler shades like blue denote weaker associations. This visual distinction aids in swiftly identifying periods and frequencies where the nexus between oil prices and inflation is most prominent.
Arrows serve as essential indicators, following the principles outlined by Aloui et al. (2018), Torrence and Compo (1998), Tiwari et al. (2019), and Jiang and Yoon (2020). Those pointing right (→) show a positive correlation between WOP and inflation, left-pointing arrows (←) indicate a negative correlation. The arrow types and angles (↗, ↙, ↘, ↖) reveal the temporal sequence of causality relationships (WOP leads or lags Inflation). Notably, upward (↑) and downward (↓) arrows indicate that whether WOP leads or lags. This detailed visualization through wavelet coherence and arrows facilitates the interpretation of the relationships.
Figure 3 illustrates the dynamics of bivariate wavelet coherence between WOP and inflation across different countries. The majority of nations exhibit a robust and positive relationship which illustrates the influential role of oil prices in shaping inflationary dynamics. Russia, however, emerges as an exception to this trend and indicates a comparatively weaker correlation in this net oil-exporting country. In the cases of India and Indonesia, a discernible relationship between WOP and inflation is present. However, it appears less prominent than in other nations. This suggests varying degrees of strength across G20 economies.
A closer examination of the short and medium-run reveals the enduring nature of the WOP-inflation relationship. Significantly, during the financial crises of 2007-08, a compelling link between WOP and inflation emerges across almost all countries, particularly on intermediate and long-term scales. Brazil, however, deviates from this trend, displaying a weaker long-term connection during this tumultuous period. The directional information derived from the arrows in the analysis adds depth to our understanding. For the majority of countries, WOP emerges as a causal factor for inflation, highlighting the substantial impact of oil price fluctuations. Conversely, in Russia, the directional arrows suggest a weaker causal link from WOP to inflation, setting it apart from the observed patterns in other nations.
Analyzing the events, such as the 2014 decline in oil prices and the subsequent decrease in WOP in 2020 highlights their substantial impact on inflation dynamics across most countries. Intriguingly, in the case of KSA, the strength of this relationship appears less prominent compared to other G20 nations, signaling a unique economic response in this specific context as a net oil exporting country. These findings highlight the multifaceted nature of the correlation between WOP and inflation resulting from the distinctive economic and geopolitical contexts of each economy.
The study also utilizes PWC which isolates the direct relationship between two variables (inflation and WOP) by removing the indirect influence of a third variable (exchange rate) which can potentially affect both (Torrence & Compo, 1998). This visualization technique (Figure 4) allows to identify frequency-specific co-movements between inflation and WOP and a better understanding of their dynamic interactions across different timescales (Torrence & Compo, 1998).
In Figure 4, we observe distinct patterns indicating the correlation between WOP and inflation across various time frequencies in different countries. Small red and yellow clouds within the time-frequency range of less than 8 months signify a strong short-term correlation between WOP and inflation, with this association particularly prominent in North American countries like Canada and the USA. Similarly, during the medium-run time-frequency (8 to 32 months), a consistent correlation is noted, with heightened prominence in Canada, France, Germany, Italy, Japan, the UK, and the USA. In the long run, a high correlation is observed in most countries, except for India. Notably, during significant declines in WOP in 2008, 2014, and COVID-19, a consistent correlation is maintained from the short to the long run. The WOP correlation in 2008 is prominently observed across all countries, with a more pronounced effect during the decline in WOP associated with COVID-19 in all G20 countries, except for Russia, where the relationship is significant but comparatively less robust than in other G20 nations.
Figure 5 The purpose of a MWTC heat map, particularly in analyzing the relationship between inflation (dependent), oil prices (independent), and an additional variable like exchange rates, is to offer a holistic perspective on the interconnections across various time-frequency scales. MWTC heat maps enable the simultaneous examination of the coherence between inflation and oil prices while considering the impact of exchange rates. This visualization aids in identifying common regions of coherence, elucidating how these economic variables interact at specific time and frequency domains.
The MWTC results depicted in Figure 5 align almost with the patterns observed in the PWC analysis. However, the incorporation of the exchange rate as an additional variable intensifies the observed relationships between WOP and inflation. This enhancement suggests that the relationship between WOP and inflation is much stronger when considering the influence of exchange rates. This emphasizes the importance of including ER for a better understanding of the economic dynamics. Furthermore, the MWTC figures highlight that this strengthened relationship, particularly in the presence of exchange rate effects, is relatively more robust in advanced developed countries. Countries such as Canada, Japan, Germany, France, the UK, and the USA exhibit more prominent correlations between WOP and inflation. This observation aligns with existing literature (Wen et al., 2021).
4. Conclusion
This study investigated the causal impact of oil price dynamics on inflation for G20 economies during global oil disruptions spanning key episodes in 2008, 2014, and 2020 (COVID-19). The causal impact analysis based on BSTS allows to estimate the magnitude of the causal impact of oil price fluctuations on inflation. We extend our analysis by incorporating a wavelet coherence approach, offering a time-frequency perspective to discern patterns in the co-movements of oil prices and inflation over distinct timescales. Additionally, we conduct a robustness check using partial wavelet coherence, isolating the direct relationship between oil prices and inflation by removing the influence of a third variable (exchange rates).
The findings from the period of December 2007 to June 2014 highlight a spectrum of economic responses to the relationship between oil price dynamics and the global financial crisis. Notable asymmetries in absolute and relative effects highlight unique economic conditions and policy landscapes across G20 countries. Advanced economies like Australia and the UK displayed varying degrees of negative absolute effects, aligning with the deflationary impact of falling oil prices. Emerging economies exhibited significant negative impacts, emphasizing the challenges faced during the oil price downturn. The observed heterogeneity in the impact on inflation emphasizes the importance of considering individual economic structures and policy landscapes, contributing valuable insights for policymakers.
In the period from June 2014 to January 2020, marked by a significant oil price decline, our Causal Impact analysis (Table 3) reveals diverse inflationary impacts. Australia, an advanced economy, experienced a substantial negative causal impact, aligning with the deflationary consequences of falling oil prices. Similarly, emerging economies like Brazil, Indonesia, and South Africa displayed significant negative impacts. Canada, India, and KSA showed modest negative impacts, while China, France, Germany, and the USA demonstrated negligible impacts, possibly due to their diverse economic structures. Italy and South Korea experienced substantial negative effects on inflation. Japan saw a minor increase, Mexico showed a negligible impact, and Russia and Turkiye faced remarkably high absolute causal impacts, emphasizing emerging economies’ vulnerability to external shocks. The UK demonstrated a negligible effect, highlighting the need to consider country-specific factors. The subsequent period from January 2020 to December 2023 is characterized by the dual impact of the COVID-19 pandemic and a substantial decline in oil prices. Positive absolute effects in several economies indicated a noteworthy rise in inflation. China stood out with a substantial negative absolute causal impact. These findings signify the existence of asymmetric responses to inflation during the downturn of WOP.
The WTC, PWC and MWTC provided dynamic relationships between oil prices and inflation across different time scales. The visualizations highlighted varying degrees of strength in the WOP-inflation relationship, with notable exceptions such as Russia. The incorporation of exchange rates in MWTC analysis intensified the observed relationships, particularly in advanced developed countries.
Considering the asymmetries revealed in our analysis, policymakers are suggested to tailor strategies to address the diverse responses of G20 economies to oil price dynamics. Advanced economies grappling with deflationary pressures post-oil price declines should implement targeted fiscal stimulus and accommodative monetary policies to counter adverse impacts effectively. Conversely, emerging economies facing significant negative impacts should prioritize structural reforms and economic diversification to bolster resilience. Recognizing the amplified relationship between oil prices and inflation in the presence of exchange rate effects, policymakers should integrate exchange rate considerations into decision-making processes for more comprehensive policy planning. Furthermore, fostering energy transition initiatives and investments in renewable energy can enhance economic resilience, particularly for economies heavily reliant on oil. In essence, the formulation of a proactive and adaptive policy framework should be taken keeping in view the unique economic conditions of each country
References
- Abdulrahman, B.M.A. (2023). Effects of fuel prices on economic activity: Evidence from Sudan. https://www.researchgate.net/profile/Badreldin-Ahmed-Abdulrahman/publication/372440568_Effects_of_fuel_prices_on_economic_activity_Evidence_from_Sudan/links/64b6b9a28de7ed28baaaa118/Effects-of-fuel-prices-on-economic-activity-Evidence-from-Sudan.pdf.
- Aloui, C.; Hkiri, B.; Hammoudeh, S.; Shahbaz, M. A multiple and partial wavelet analysis of the oil price, inflation, exchange rate, and economic growth nexus in Saudi Arabia. Emerging Markets Finance and Trade 2018, 54, 935–956. [Google Scholar] [CrossRef]
- Álvarez, L.J.; Hurtado, S.; Sánchez, I.; Thomas, C. The impact of oil price changes on Spanish and euro area consumer price inflation. Economic modelling 2011, 28, 422–431. [Google Scholar] [CrossRef]
- Akeel, H.; Khoj, H. Is education or Real GDP per capita helped countries staying at home during COVID-19 pandemic: Cross-section evidence? Entrepreneurship and sustainability Issues 2020, 8, 841. [Google Scholar] [CrossRef] [PubMed]
- Bala, U.; Chin, L. Asymmetric impacts of oil price on inflation: An empirical study of African OPEC member countries. Energies 2018, 11, 3017. [Google Scholar] [CrossRef]
- Barsky, R.B.; Kilian, L. Oil and the macroeconomy since the 1970s. Journal of Economic Perspectives 2002, 18, 115–134. [Google Scholar] [CrossRef]
- Beckmann, J.; Czudaj, R. Is there a homogeneous causality pattern between oil prices and currencies of oil importers and exporters? Energy Economics 2013, 40, 665–678. [Google Scholar] [CrossRef]
- Bednar, O. The Causal Impact of the Rapid Czech Interest Rate Hike on the Czech Exchange Rate Assessed by the Bayesian Structural Time Series Model. Int. J. Econ. Sci 2021, 10, 1–17. [Google Scholar] [CrossRef]
- Bernanke, B.S. Irreversibility, uncertainty, and cyclical investment. The quarterly journal of economics 1983, 98, 85–106. [Google Scholar] [CrossRef]
- Bernanke, B.S.; Gertler, M.; Watson, M.; Sims, C.A.; Friedman, B.M. Systematic monetary policy and the effects of oil price shocks. Brookings papers on economic activity 1997, 1997, 91–157. [Google Scholar] [CrossRef]
- Box, G.E.; Tiao, G.C. (2011). Bayesian inference in statistical analysis. John Wiley & Sons. https://books.google.com.pk/books?hl=en&lr=&id=T8Askeyk1k4C&oi=fnd&pg=PR11&dq=Bayesian+inference+in+statistical+analysis&ots=jWI4rYgRO9&sig=pwxQNVfsEHM8EiTZtU1KPO1OsJ8&redir_esc=y#v=onepage&q=Bayesian%20inference%20in%20statistical%20analysis&f=false.
- Brodersen, K.H.; Gallusser, F.; Koehler, J.; Remy, N.; Scott, S.L. (2015). Inferring causal impact using Bayesian structural time-series models. [CrossRef]
- Cerra, V. How can a strong currency or drop in oil prices raise inflation and the black-market premium? Economic modelling 2019, 76, 1–13. [Google Scholar] [CrossRef]
- Choi, S.; Furceri, D.; Loungani, P.; Mishra, S.; Poplawski-Ribeiro, M. Oil prices and inflation dynamics: Evidence from advanced and developing economies. Journal of International Money and Finance 2018, 82, 71–96. [Google Scholar] [CrossRef]
- Cologni, A.; Manera, M. Oil prices, inflation and interest rates in a structural cointegrated VAR model for the G-7 countries. Energy Economics 2008, 30, 856–888. [Google Scholar] [CrossRef]
- Escobari, D.; Sharma, S. Explaining the nonlinear response of stock markets to oil price shocks. Energy 2020, 213, 118778. [Google Scholar] [CrossRef]
- Farzanegan, M.R.; Markwardt, G. The effects of oil price shocks on the Iranian economy. Energy Economics 2009, 31, 134–151. [Google Scholar] [CrossRef]
- Ferderer, J.P. Oil price volatility and the macroeconomy. Journal of macroeconomics 1996, 18, 1–26. [Google Scholar] [CrossRef]
- Günay, M. Forecasting industrial production and inflation in Turkey with factor models. Central Bank Review 2018, 18, 149–161. [Google Scholar] [CrossRef]
- Hamilton, J.D. This is what happened to the oil price-macroeconomy relationship. Journal of monetary economics 1996, 38, 215–220. [Google Scholar] [CrossRef]
- Hamilton, J.D. What is an oil shock? Journal of econometrics 2003, 113, 363–398. [Google Scholar] [CrossRef]
- Hamilton, J.D. Nonlinearities and the macroeconomic effects of oil prices. Macroeconomic dynamics 2011, 15, 364–378. [Google Scholar] [CrossRef]
- Hooker, M.A. What happened to the oil price-macroeconomy relationship? Journal of monetary economics 1996, 38, 195–213. [Google Scholar] [CrossRef]
- Jiang, Z.; Yoon, S.-M. Dynamic co-movement between oil and stock markets in oil-importing and oil-exporting countries: Two types of wavelet analysis. Energy Economics 2020, 90, 104835. [Google Scholar] [CrossRef]
- Kan, E.; Serin, Z.V. (2022). Analysis of cointegration and causality relations between gold prices and selected financial indicators: Empirical evidence from Turkey. https://openaccess.hku.edu.tr/xmlui/handle/20.500.11782/2618.
- Khan, M.A.; Husnain, M.I. U.; Abbas, Q.; Shah, S.Z. A. Asymmetric effects of oil price shocks on Asian economies: A nonlinear analysis. Empirical Economics 2019, 57, 1319–1350. [Google Scholar] [CrossRef]
- Li, Y.; Guo, J. The asymmetric impacts of oil price and shocks on inflation in BRICS: A multiple threshold nonlinear ARDL model. Applied Economics 2022, 54, 1377–1395. [Google Scholar] [CrossRef]
- Lorusso, M.; Pieroni, L. Causes and consequences of oil price shocks on the UK economy. Economic modelling 2018, 72, 223–236. [Google Scholar] [CrossRef]
- Mensi, W.; Rehman, M.U.; Hammoudeh, S.; Vo, X.V.; Kim, W.J. How macroeconomic factors drive the linkages between inflation and oil markets in global economies? A multiscale analysis. International Economics 2023, 173, 212–232. [Google Scholar] [CrossRef]
- Nasir, M.A.; Huynh, T.L. D.; Yarovaya, L. Inflation targeting & implications of oil shocks for inflation expectations in oil-importing and exporting economies: Evidence from three Nordic Kingdoms. International Review of Financial Analysis 2020, 72, 101558. [Google Scholar] [CrossRef]
- Nazlioglu, S.; Gormus, A.; Soytas, U. Oil prices and monetary policy in emerging markets: Structural shifts in causal linkages. Emerging Markets Finance and Trade 2019, 55, 105–117. [Google Scholar] [CrossRef]
- Nelson, E. The Great Inflation of the seventies: What really happened? Topics in Macroeconomics 2005, 5, 20121003. [Google Scholar] [CrossRef]
- Nusair, S.A.; Olson, D. Asymmetric oil price and Asian economies: A nonlinear ARDL approach. Energy 2021, 219, 119594. [Google Scholar] [CrossRef]
- Raheem, I.D.; Bello, A.K.; Agboola, Y.H. A new insight into oil price-inflation nexus. Resources Policy 2020, 68, 101804. [Google Scholar] [CrossRef]
- Renou, P.-M. Is oil price still driving inflation? The Energy Journal 2019, 40, 199–220. [Google Scholar] [CrossRef]
- Salisu, A.A.; Isah, K.O.; Oyewole, O.J.; Akanni, L.O. Modelling oil price-inflation nexus: The role of asymmetries. Energy 2017, 125, 97–106. [Google Scholar] [CrossRef]
- Segal, P. Oil price shocks and the macroeconomy. Oxford Review of Economic Policy 2011, 27, 169–185. [Google Scholar] [CrossRef]
- Sek, S.K. Impact of oil price changes on domestic price inflation at disaggregated levels: Evidence from linear and nonlinear ARDL modeling. Energy 2017, 130, 204–217. [Google Scholar] [CrossRef]
- Taylan, O.; Alkabaa, A.S.; Yılmaz, M.T. Impact of COVID-19 on G20 countries: Analysis of economic recession using data mining approaches. Financial Innovation 2022, 8, 81. [Google Scholar] [CrossRef]
- Tiwari, A.K.; Cunado, J.; Hatemi-J, A.; Gupta, R. Oil price-inflation pass-through in the United States over 1871 to 2018: A wavelet coherency analysis. Structural Change and Economic Dynamics 2019, 50, 51–55. [Google Scholar] [CrossRef]
- Torrence, C.; Compo, G.P. A practical guide to wavelet analysis. Bulletin of the American Meteorological society 1998, 79, 61–78. [Google Scholar] [CrossRef]
- Wen, F.; Zhang, K.; Gong, X. The effects of oil price shocks on inflation in the G7 countries. The North American Journal of Economics and Finance 2021, 57, 101391. [Google Scholar] [CrossRef]
- Wu, M.-H.; Ni, Y.-S. The effects of oil prices on inflation, interest rates and money. Energy 2011, 36, 4158–4164. [Google Scholar] [CrossRef]
Table 1.
Descriptive Statistics and Unit Root Tests – Inflation and WOP.
| Mean | Max. | Min. | Std. Dev. | Skewness | Kurtosis | Jarque-Bera | ADF | PP | |
|---|---|---|---|---|---|---|---|---|---|
| Australia_INF | 2.86 | 7.80 | -0.30 | 1.48 | 1.24 | 4.45 | 98.72a | -3.53a | -2.80c |
| Brazil_INF | 0.51 | 3.02 | -0.68 | 0.40 | 1.53 | 9.81 | 668.95a | -8.45a | -8.09a |
| Canada_INF | 0.18 | 1.43 | -1.04 | 0.39 | -0.01 | 3.38 | 1.77 | -13.14a | -12.75a |
| China_INF | 0.17 | 2.60 | -1.39 | 0.61 | 0.36 | 3.61 | 10.76a | -3.04b | -12.97a |
| France_INF | 0.14 | 1.42 | -1.00 | 0.34 | 0.10 | 3.89 | 10.03b | -2.35 | -17.11a |
| Germany_INF | 0.16 | 1.98 | -1.03 | 0.39 | 0.41 | 5.37 | 75.72a | -2.21 | -18.01a |
| India_INF | 0.50 | 4.58 | -1.60 | 0.72 | 0.65 | 6.46 | 162.46a | -2.93b | -12.37a |
| Indonesia_INF | 0.49 | 8.71 | -0.46 | 0.70 | 6.01 | 66.64 | 50334.57a | -13.19a | -13.16a |
| Italy_INF | 0.17 | 3.42 | -0.68 | 0.32 | 3.91 | 40.26 | 17391.34a | -7.95a | -15.40a |
| Japan_INF | 0.03 | 2.09 | -0.80 | 0.30 | 0.98 | 9.74 | 589.19a | -14.23a | -14.16a |
| Korea_INF | 0.21 | 1.30 | -0.74 | 0.37 | 0.12 | 2.93 | 0.72 | -2.92b | -12.52a |
| KSA_INF | 0.19 | 5.87 | -1.05 | 0.54 | 5.64 | 53.21 | 31782.95a | -14.82a | -15.34a |
| Mexico_INF | 0.38 | 1.70 | -1.01 | 0.36 | -0.42 | 4.33 | 29.72a | -3.80a | -9.56a |
| Russia_INF | 0.79 | 7.61 | -0.54 | 0.76 | 3.50 | 27.48 | 7215.26a | -5.25a | -5.42a |
| South_Africa_INF | 0.43 | 1.70 | -1.14 | 0.44 | 0.34 | 3.81 | 13.17a | -11.78a | -12.18a |
| Turkiye_INF | 1.45 | 13.58 | -1.44 | 1.87 | 2.81 | 14.27 | 1895.84a | -3.48a | -7.40a |
| UK_INF | 0.20 | 2.15 | -0.70 | 0.34 | 0.51 | 7.39 | 244.34a | -2.37 | -15.87a |
| USA_INF | 0.21 | 1.37 | -1.92 | 0.39 | -0.55 | 6.16 | 133.94a | -10.37a | -8.65a |
| WOP | 63.14 | 133.96 | 16.98 | 25.71 | 0.27 | 2.23 | 10.64a | -2.93b | -2.62c |
Note: a, b, and c are the level of significance at 1%, 5% and 10% respectively.
Disclaimer/Publisher’s Note: The statements, opinions and data contained in all publications are solely those of the individual author(s) and contributor(s) and not of MDPI and/or the editor(s). MDPI and/or the editor(s) disclaim responsibility for any injury to people or property resulting from any ideas, methods, instructions or products referred to in the content. |
© 2024 by the authors. Licensee MDPI, Basel, Switzerland. This article is an open access article distributed under the terms and conditions of the Creative Commons Attribution (CC BY) license (https://creativecommons.org/licenses/by/4.0/).
Copyright: This open access article is published under a Creative Commons CC BY 4.0 license, which permit the free download, distribution, and reuse, provided that the author and preprint are cited in any reuse.


