Submitted:
18 April 2024
Posted:
22 April 2024
You are already at the latest version
Abstract
The study, conducted at the Department of Medicine, Maulana Azad Medical College and associated Lok Nayak Hospital, aimed to investigate the prevalence of iron deficiency anaemia among anaemic overweight and obese individuals. Fifty participants were included after screening and consent, undergoing socio-demographic assessment, clinical evaluation, and laboratory investigations. Middle to old-aged individuals predominated (Mean ± SD: 54.54 ± 11.32 years), with females comprising 62%. All subjects were obese (mean BMI: 37.27 ± 5.71 kg/m²), with common comorbidities including hypertension (68%), diabetes (36%), and obstructive sleep apnea-hypopnea syndrome (32%). Nutritional deficiencies, particularly iron deficiency, were prevalent, affecting 62% of subjects, with 48% having iron deficiency alone. Anemia of chronic illness was observed in 38%. Laboratory parameters showed low hemoglobin (8.53 ± 1.23 g/dL), MCV (78.75 ± 10.13 fL), and elevated ESR (20.56 ± 21.47 mm/hour) and CRP levels (4.71 ± 3.32 mg/dL), indicating inflammation. Correlation analyses revealed negative associations between BMI and serum iron/ferritin and positive associations with serum hepcidin. The study underscores the significance of addressing nutritional deficiencies and monitoring iron status in obese populations, suggesting potential associations between obesity and iron metabolism. Further research is needed to explore these relationships for clinical management implications.
Keywords:
Anemia
; Iron Deficiency
; Obese Patients
1. Introduction
Obesity, characterized by an abnormal energy metabolism leading to the accumulation of excess fat, poses significant physical and psychological challenges. Recognized as a chronic ailment by the World Health Organization, it presents a substantial public health concern due to its association with heightened risks of cardiovascular issues, diabetes, and cancer [1,2].
The World Health Organization (WHO) and South Asian classification systems provide frameworks for categorizing individuals based on their body mass index (BMI) to identify overweight and obesity. According to WHO guidelines, individuals with a BMI between 25 and 29.9 are classified as overweight, while those with a BMI of 30 or higher are considered obese. This classification applies universally across diverse populations. However, the South Asian classification system recognizes that individuals from South Asian countries tend to have a higher percentage of body fat at lower BMIs compared to other ethnic groups. Therefore, South Asian criteria adjust the BMI cutoff points, defining overweight as a BMI between 23 and 24.9 and obesity as a BMI of 25 or higher. These nuanced classifications account for population-specific variations in body composition and provide tailored guidelines for assessing overweight and obesity within the South Asian demographic [3].

Table 1.
Classification of overweight and obese according WHO and South Asian.
| WHO(BMI) | SOUTH ASIAN(BMI) | |
| UNDERWEIGHT | <18.5 | <18.5 |
| NORMAL | 18.5- 24.9 | 18.5-22.9 |
| OVERWEIGHT | 25-29.9 | 23-24.9 |
| OBESE | More than 30 | More than 25 |
Obesity and iron deficiency represent widespread health challenges impacting numerous individuals worldwide. While excess weight and obesity are primary factors contributing to various chronic ailments like cardiovascular diseases, diabetes, and specific cancers, iron deficiency, or hypoferremia, stands out as the most prevalent single micronutrient insufficiency globally. If left untreated, iron deficiency can lead to iron deficiency anemia, a serious health condition characterized by fatigue, diminished productivity, and compromised maternal well-being, particularly during pregnancy. There is mounting evidence indicating a connection between obesity and iron deficiency, observed across different age groups, including children, adolescents, and adults. The correlation between obesity and hypoferremia is thought to be influenced significantly by hepcidin levels and low-grade chronic inflammation. While obesity is acknowledged as an increasingly important risk factor for iron deficiency, the precise mechanisms underpinning this relationship remain subject to debate [4,5,6].
Iron absorption in the intestine and its regulation are intricate processes crucial for maintaining iron balance in the body. In the small intestine, dietary iron is absorbed primarily in the duodenum and upper jejunum. This absorption is influenced by various factors, including the form of iron ingested, with heme iron being more readily absorbed than non-heme iron. Once absorbed by enterocytes, iron can be stored as ferritin or transported into the bloodstream via ferroportin (Figure 1). However, in the context of obesity, disruptions in iron metabolism may occur. Elevated levels of hepcidin, often observed in obesity-related low-grade inflammation, can impair iron absorption by promoting the degradation of ferroportin, thereby reducing iron efflux from enterocytes. This dysregulation can lead to hypoferremia and ultimately contribute to iron deficiency, despite adequate dietary intake. Consequently, obesity-associated alterations in iron metabolism highlight the complex interplay between metabolic health and iron homeostasis, underscoring the need for further research to elucidate these mechanisms and develop targeted interventions [7,8,9].
Hepcidin plays a pivotal role in regulating iron levels within the body, orchestrating a delicate balance between iron absorption, recycling, and storage. Produced primarily in the liver, hepcidin acts as a master regulator by binding to ferroportin, the protein responsible for exporting iron out of cells (Figure 2). This binding triggers ferroportin’s internalization and subsequent degradation, effectively inhibiting iron release into the bloodstream and reducing its availability for cellular uptake. However, in the context of obesity, dysregulation of hepcidin expression can occur, often in response to chronic low-grade inflammation associated with adipose tissue expansion. Elevated levels of hepcidin in obesity can disrupt iron metabolism by suppressing iron absorption in the intestine and impairing iron release from storage sites. Consequently, this dysfunction may contribute to hypoferremia and exacerbate the risk of iron deficiency despite sufficient dietary intake. Understanding the intricate interplay between hepcidin regulation and obesity-related alterations in iron metabolism is critical for elucidating the mechanisms underlying iron dysregulation in obesity and developing targeted therapeutic strategies to address this issue [10,11,12].
Present study sheds light on the high occurrence of iron deficiency anemia in overweight and obese individuals, primarily attributed to nutritional deficits. Through correlation analyses, this study helps to identified noteworthy connections among BMI, iron indicators, and hepcidin levels, hinting at a plausible link between obesity and iron regulation. Further, this study results were emphasize the necessity of addressing dietary inadequacies and regularly assessing iron levels in obese cohorts.
2. Materials And Methods
The study was conducted at the Department of Medicine, Maulana Azad Medical College, and associated Lok Nayak Hospital in New Delhi. It employed an observational, cross-sectional study design. The study population consisted of patients who had attended the Medicine Outpatient Department (OPD) and those who had been admitted to the wards of Lok Nayak Hospital. The study lasted for one year. Ethical approval for the study was obtained from the Institutional Ethics Committee (IEC) of Maulana Azad Medical College and associated Hospitals, with approval number 92/04/2022/No. 325. Additionally, the study was registered with the Clinical Trial Registry-India (CTRI) under registration number CTRI/2023/05/052907. Subjects meeting specific inclusion and exclusion criteria were enrolled after screening.
Inclusion criteria for the study comprised patients with a body mass index (BMI) greater than 22.9, aged between 18 and 65 years, of either sex, and willing to provide consent. Additionally, eligible patients had hemoglobin (Hb) levels below 13 g/dL for males and below 12 g/dL for females. Exclusion criteria included patients with renal or hepatic impairment, congestive heart failure, or those taking medications that could affect iron levels. Patients already admitted to the Intensive Care Unit (ICU) or Cardiac Care Unit (CCU), and those experiencing acute blood loss were also excluded.
The sample size calculation was based on a previous study by Pinhas-Hamiel et al., which reported a 17% prevalence of iron deficiency anemia in obese patients. Using a formula for sample size calculation, considering a 95% confidence interval, standard deviation, and a 5% margin of error, the estimated sample size was 84. However, a convenience sample size of 50 patients was chosen for this study.
The outcome variables included serum ferritin, serum iron, and Total Iron-binding Capacity (TIBC), along with Transferrin Saturation (TS%) calculated using the formula: TS% = (serum iron / TIBC) * 100, or (serum iron / transferrin) * 71.
2.1. Methodology
A predetermined proforma was used to assess socio-demographic factors such as age, gender, and place of residence. A detailed clinical history was obtained, including any chronic illnesses (such as chronic liver disease, chronic kidney disease, or heart failure), presence of comorbidities (such as diabetes, hypertension, OSAHS, or osteoarthritis), history of acute blood loss, and any other medical or surgical conditions. A comprehensive general physical examination, including measurements of height, weight, and BMI, as well as a systemic examination, was conducted. Laboratory investigations were conducted in accordance with the study protocol. These included hemogram with red blood cell indices and erythrocyte sedimentation rate (ESR), kidney function tests (urea, creatinine), liver function tests (alanine transaminase, aspartate transaminase, serum bilirubin, alkaline phosphatase), serum electrolytes, thyroid function tests, C-reactive protein (CRP), serum ferritin levels, serum iron levels, total iron-binding capacity (TIBC), serum B12 levels, serum folate levels, serum hepcidin levels, reticulocyte count, stool examination for microscopic blood, hemoglobin electrophoresis (as needed), upper gastrointestinal endoscopy (as needed), and bone marrow aspirate and biopsy (as needed).
2.2. Statistical Analysis
The data was entered in Microsoft Excel spreadsheet and analysis was done using Epi-Info, JASP and Statistical Package for Social Sciences (SPSS) version 25.0. Continuous variables are represented as mean ± SD or medians with Inter-quartile range. Categorical variables are represented as number and percentage (%). The variables were tested for normality with the Kolmogorov-Smirnov test for normality, Q- Q plots, visual inspection of the histograms and the z-scores for the degree of skewness and kurtosis. Spearman Rank correlation test was used to assess correlation between continuous quantitative variables. All tests of significance were two-tailed and statistical significance was defined as P < 0.05. Scatter diagrams were used to describe the relationship between two quantitative variables. Not all variables met the assumptions required for parametric; therefore, non-parametric tests (i.e., Mann-Whitney test, Spearman correlation) were used for all analyses for consistency. Appropriate graphs such as pie charts, bar diagrams and histograms have been constructed.
3. Results
A Prospective Observational study was undertaken at the Department of General Medicine, Maulana Azad Medical College, and affiliated Lok Nayak Hospital, New Delhi, lasting for one year. We screened all overweight and obese individuals attending the Medicine Outpatient Department (OPD) and wards for potential inclusion in our study. Following the application of specific inclusion and exclusion criteria, a total of 50 subjects were included in the study cohort. Subjects underwent comprehensive evaluations, encompassing detailed medical history-taking, general physical examinations, systemic examinations, and blood investigations.
Our findings were categorized into several parameters including: demographic parameters, anthropometric parameters and laboratory parameters related to the cause of anemia. Further, in present study the correlation analyses between various parameters was conducted, and the results were following:
3.1. Demographic Parameters
3.1.1. Age (Years)
Most of the subjects in present study were middle to old aged, in the age group 45 to 59 years (n = 25, 50%). 14 subjects (28%) were between 60 to 74 years, 7 (14%) were between 30 and 44 years, 3 were older than 75 years and 1 (2%) was below the age of 30 years. The Median (IQR) was 55.0 (46.0 - 64.0) and the Mean age was 54.54 ± 11.2. The same is showed in the following Table 2 and Figure 3.
3.1.2. Gender
3.1.3. Anthropometric Parameters
The following anthropometric parameters were considered in our study:
- Weight (kg)
- Height (cm)
- BMI (kg/m2)
3.1.4. Weight (kg)
The mean weight of subjects in present study was 93.34 ± 12.82 kg. The Median (IQR) was 90.0 (86.0 – 98.0) and the values ranged from a minimum value of 72.0 to a maximum of 140.0
The same is showed in the following Table 4.
3.1.5. Height (CM)
In our study, the height of subjects ranged from a minimum value of 145.0 to a maximum of
173.0. The Median (IQR) was 159.0 (154.0 - 163.0) and the Mean ± Standard Deviation was 158.6 ± 6.79.
The same is showed in the following Table 4.
3.1.6. BMI (KG/M2)
The BMI is one of the most frequently used measures of adiposity. Study was conducted on overweight or obese subjects. Therefore, it is no surprise that the minimum value of BMI was 28.8 and the maximum was 56.8. The Median (IQR) was 36.4 (33.6 - 39.3) and the Mean ± Standard Deviation was 37.27 ± 5.71.
Thus, all the subjects in our study were found to be obese. The same is showed in the following Table 4.
3.2. Cause of Anaemia
3.2.1. Criteria for Iron Deficiency Anemia
According to WHO 2022 guidelines, there are 5 criteria for defining iron deficiency anaemia which are following:
- Haemoglobin less than 12 gm/dL in females and less than 13 gm/dL in males
- Serum iron levels less than 65 mg/dL
- S. Ferritin levels less than 15 ng/dL if there is no inflammation and less than 30 ng/dL if there is inflammation is present (For inflammation CRP > 5mg/dL).
- Trans ferritin saturation (TS%) less than 20%
- Total iron binding capacity (TIBC) less than 267
In this study, we take one essential criteria (Haemoglobin less than 12 gm/dL in females and less than 13 gm/dL in males) and 3 additional criteria (S. iron levels, S. ferritin levels and TIBC). If 2 additional criteria out 3 were present then it was labelled as iron deficiency anaemia.
3.2.2. Criteria for B12 Deficiency Anemia and Folate Deficiency Anemia
- Serum B12 levels less than 200pg/dL
- Serum folate levels less than 4ng/dL
Of the 50 subjects, nutritional deficiencies were the most common cause, present in 31 (62%) of the subjects. The remaining 19 subjects (38%) were found to have anaemia of chronic illness. As far as nutritional deficiencies are concerned, iron deficiency was the most common aetiology, present in 24 (48%) of subjects. 3 subjects (6%) had a combined deficiency of Iron and Vitamin B12. Another 2 subjects (4%) were found to have a combined iron and folate deficiency. 1 subject (2%) had an isolated Vitamin B12 deficiency. The only remaining subject was found to have a combined deficiency of all three micronutrients - iron, folate and vitamin B12. The same is showed in the followingTable 5andFigure 5.
3.2.3. Laboratory Parameters
- ❖
- Haemoglobin (gm/dL)
Our study was conducted on obese and anaemic subjects only. The value of haemoglobin (g/dL) ranged from a minimum value of 5.6 to a maximum of 10.5. The Median (IQR) was 8.65 (7.8 - 9.4) and the Mean ± Standard Deviation was 8.53 ± 1.23. The same is showed in the following Table 6.
- ❖
- MCV (fL)
The MCV value indicates the average size of the RBCs. In our study, the MCV (fL) values ranged from values 53.0 through 99.0. The Median (IQR) was 78.0 (72.0 - 86.6) and the Mean ± Standard Deviation was 78.75 ± 10.13. The same is showed in the following Table 6.
- ❖
- ESR (mm/hour)
ESR is an acute phase reactant and is commonly elevated in inflammatory conditions. In our study, the average value of ESR (mm/Hour) was 20.56 ± 21.47 and the median (IQR) was 17.0 (12.0 - 23.0). The minimum value was 4.0 and the maximum was 155.0.
The same is showed in the following Table 6.
- ❖
- CRP (mg/dL)
Of the 50 subjects in our study, 20 (40%) had a CRP level of >5 mg/dL. The average CRP was 4.71 ± 3.32 mg/dL and the Median (IQR) was 4.0 (2.0 – 8.0) mg/dL. The same is showed in the following Table 6.
3.2.4. Iron (µg/dL)
Serum iron indicates the amount of iron circulating in the blood. In our study, the serum Iron (mcg/dL) of subjects ranged from a minimum value of 10.0 to a maximum of 65.0. The average levels were 21.56 ± 12.22 ug/dL. The same is showed in the following Table 7.
3.2.5. Ferritin (ng/mL)
The serum ferritin levels reflect the amount of iron stores in the body. In our study, ferritin values of subjects ranged from 8.03 through 516.0. The average ferritin level was 70.03 ± 109.59 ng/mL. The same is showed in the following Table 7.
3.2.6. Total Iron Binding Capacity (µg/dL)
The value of TIBC is commonly used for evaluating cases of anaemia. In our study, the average TIBC (µg/dL) was 333.66 ± 102.92 and the values ranged from 108.0 through 595.0. The same is showed in the following Table 7.
3.2.7. Transferrin Saturation (%)
Transferrin saturation reflects the amount of iron that is bound to transferrin. In our study, the transferrin saturation (%) ranged from a minimum value of 1.68 to a maximum of 27.43 and the Average transferrin saturation was 7.31 ± 5.25. The same is showed in the following Table 7.
3.2.8. B12 Levels (pg/mL)
In our study, the Vitamin B12 levels (pg/mL) ranged from values 150.0 through 1000.0. The Median (IQR) was 694.0 (345.0 - 807.0) and the Mean ± Standard Deviation was 606.54 ± 275.80. The same is showed in the following Table 7.
3.2.9. Folate Levels (ng/mL)
In our study, the average folate levels (ng/mL) were 12.09 ± 5.23 and the median was 10.34 (7.90 - 16.5). The values ranged from a minimum value of 3.06 to a maximum of 20.0. The same is showed in the following Table 7.
3.2.10. Hepcidin Levels
In our study, the levels of serum Hepcidin ranged from a minimum value of 240.15 to a maximum of 1637.18. The mean value was computed as 825.36 ± 326.39. The same is showed in the following Table 7.
3.2.11. Comorbidities
Obesity is commonly associated with multiple other Comorbidities such as diabetes, hypertension, atherosclerosis etcOf the 50 subjects in our study, hypertension was the most common co morbidity. A total of 34 subjects (68.0%) were diagnosed hypertensive and were taking antihypertensive medicines. Diabetes was the second most common comorbidity, with 18 (36%) subjects on anti-diabetic drugs. 16 (32%) subjects were suffering from Obstructive sleep apnoea hypoventilation syndrome (OSAHS), 9 (18%) had a history of coronary artery disease, 7 (14%) had a history of osteoarthritis of the knees and 2 (4%) subjects had a past history of cerebrovascular accidents. The same is showed in the following Table 8 and Figure 6.
3.3. Correlation Analysis
3.3.1. Serum Iron versus BMI
Our findings revealed a significant negative correlation between BMI and serum iron levels (Spearman’s rho = -0.645, p < 0.001). This indicates that as BMI increases, serum iron levels tend to decrease. Such a robust negative correlation suggests a potentially important physiological relationship between adiposity and iron metabolism. The same is showed in the following Table 9 and Figure 7.
3.3.2. Serum Ferritin versus BMI
3.3.3. Serum Hepcidin versus Weight
3.3.4. Serum Hepcidin versus BMI
3.3.5. Serum Hepcidin versus Haemoglobin
Our analysis revealed a correlation coefficient of -0.203 between haemoglobin levels and serum hepcidin concentrations, with a p-value of 0.158. Although this correlation did not reach statistical significance, it suggests a trend towards a weak negative association between these two variables. The same is showed in the following Table 13 and Figure 11.
4. Discussion
Several publications were found to be relevant to the topic of obesity and iron deficiency anemia. For instance, a review article by Zhao et al. (2015) reported a quantitative meta- analysis that showed a significant association between obesity and iron deficiency. Another study by Chowdhury et al. (2018) found a high prevalence of overweight and obesity among women of reproductive age in Bangladesh with iron deficiency anemia. Furthermore, a two- sample Mendelian randomization study by Chang et al. (2019) provided evidence of a potential causal association between obesity and iron deficiency anemia. Results of our study were similar to the results of Zimmermann et al. (2008), who studied the relationship between obesity and iron deficiency among healthy premenopausal women. They found that 22% of the women were considered overweight, and 20% were iron deficient. They measured the iron status indicators (hemoglobin and serum ferritin) and C-reactive protein (CRP) at pre- meal and two hours post-meal [13,14,15,16].
Most of the subjects in our study were middle to old aged, in the age group 45 to 59 years (n = 25, 50%). 14 subjects (28%) were between 60 to 74 years, 7 (14%) were between 30 and 44 years, 3 were older than 75 years and 1 (2%) was below the age of 30 years. The Median (IQR) was 55.0 (46.0 - 64.0) and the Mean age was 54.54 ± 11.2. Our study found that females constituted 62% of the study population (n = 31), while males represented only 38% of the study population (n = 19) Results are supported by the studies of Tanwi, Chakrabarty, & Hasanuzzaman, 2019, Adib Rad et al., 2019; Fongar, Godecke, & Qaim, 2019; Keding, 2016; Neymotin & Sen, 2011 [17,18,19,20,21,22].
In our study, we found that iron deficiency was the most common etiology of anemia, present in 24 (48%) of subjects. Nutritional deficiencies were the most common cause of anemia, present in 31 (62%) of the subjects, while the remaining 19 subjects (38%) were found to have anemia of chronic illness. We used one essential criterion (hemoglobin less than 12 gm/dL in
females and less than 13 gm/dL in males) and three additional criteria (serum iron levels, serum ferritin levels, and TIBC) to diagnose iron deficiency anemia. If two criteria out of three were present, then it was labeled as iron deficiency anemia. Our study also found that 3 subjects (6%) had a combined deficiency of Iron and Vitamin B12, while another 2 subjects (4%) were found to have a combined iron and folate deficiency. One subject (2%) had an isolated Vitamin B12 deficiency, and the only remaining subject was found to have a combined deficiency of all three micronutrients - iron, folate, and vitamin B12. The study’s results were similar to those of other studies, such as Wang T, et al. (2023), which found evidence of a potential causal association between obesity and iron deficiency anemia, and Aguree and Reddy (2021), which reported elevated levels of inflammatory markers and hepcidin in obese women of reproductive age, which may contribute to iron deficiency anemia [23,24].
In our study, we found that the hemoglobin (g/dL) value ranged from a minimum of 5.6 to a maximum of 10.5, with a median (IQR) of 8.65 (7.8 - 9.4) and a mean ± standard deviation of 8.53 ± 1.23. The MCV (fL) values ranged from 53.0 through 99.0, with a median (IQR) of 78.0 (72.0 - 86.6) and a mean ± standard deviation of 78.75 ± 10.13. The average value of ESR (mm/Hour) was 20.56 ± 21.47, with a median (IQR) of 17.0 (12.0 - 23.0), a minimum value of 4.0, and a maximum of 155.0. Of the 50 subjects in the study, 20 (40%) had a CRP level of >5 mg/dL, with an average CRP of 4.71 ± 3.32 mg/dL and a median (IQR) of 4.0 (2.0 – 8.0) mg/dL. The results of our study were similar to the results of other studies, such as Zhao et al. (2015) and Aigner et al. (2014), Till and Grundman (2011), Chowdhuryb et al. (2018), Ahirwar, R., & Mondal, P. R. (2019) [13,14,25,26,27].
Results of our study were similar to the findings of previous research. The serum iron levels in our study ranged from 10.0 to 65.0 µg/dL, with an average of 21.56 ± 12.22 µg/dL. This aligns with the importance of measuring serum ferritin levels for diagnosing iron deficiency anemia. The ferritin values in our study ranged from 8.03 to 516.0 ng/mL, with an average of 70.03 ± 109.59 ng/mL, reflecting the iron stores in the body. Additionally, the TIBC values ranged from 108.0 to 595.0 µg/dL, with an average of 333.66 ± 102.92 µg/dL, which is commonly used in evaluating anemia cases. The transferrin saturation levels in our study ranged from 1.68 to 27.43%, with an average of 7.31 ± 5.25%, reflecting the iron bound to transferrin. Furthermore, the B12 levels in our study ranged from 150.0 to 1000.0 pg/mL, with a median of 694.0 (IQR: 345.0 - 807.0) and a mean ± standard deviation of 606.54 ± 275.80 pg/mL. The folate levels averaged at 12.09 ± 5.23 ng/mL, with a median of 10.34 (IQR: 7.90 - 16.5) and values ranging from 3.06 to 20.0 ng/mL. Lastly, the hepcidin levels ranged from 240.15 to 1637.18, with a mean value of 825.36 ± 326.39. These results are in consensus with the many previous studies of Kumar A et al. (2022), Johnson-Wimbley TD & Graham (DY 2011) [26,28].
In our study we observed that among the 50 subjects, hypertension was the most common comorbidity, with 68.0% diagnosed as hypertensive and taking antihypertensive medicines. Diabetes was the second most common comorbidity, affecting 36% of the subjects. Additionally, 32% suffered from Obstructive Sleep Apnea Hypoventilation Syndrome (OSAHS), 18% had a history of coronary artery disease, 14% had osteoarthritis of the knees, and 4% had a past history of cerebrovascular accidents. Our results align with those of Safiri et al. (2021), who also reported a high prevalence of hypertension in their study. Further results align with the work of Zheng et al. (2021), emphasizing the importance of addressing OSAHS in overweight and obese individuals. Köseoğlu, F.D.; Özlek, B (2024) findings mirror those of Anemia and Iron Deficiency Predict All-Cause Mortality in Patients with Coronary artery disease, emphasizing the impact of comorbidities on mortality [29,30,31].
In our study, we investigated the relationship between BMI (Body Mass Index) and serum iron levels among anemic overweight and obese patients. Our findings revealed a significant negative correlation between BMI and serum iron levels (Spearman’s rho = -0.645, p < 0.001). This indicates that as BMI increases, serum iron levels tend to decrease. Such a robust negative correlation suggests a potentially important physiological relationship between adiposity and iron metabolism. Cepeda-Lopez and Baye (2020) discussed the complex relationship between obesity, iron deficiency, and anemia. They emphasized that obesity, characterized by chronic low-grade inflammation, can disrupt iron homeostasis and lead to systemic iron deficiency [32].
Our study shows the significant negative correlation between BMI and serum ferritin levels (Spearman’s rho = -0.723, p < 0.001). This indicates that as BMI increases, serum ferritin levels tend to decrease. Similarly study of Alam F et al., 2015 reveals that individuals with high BMI had high levels of Serum Ferritin despite low levels of iron with high levels of C- reactive protein. This might be caused due to inflammatory conditions prevailing in the presence of increased adipose tissue [33].
Our study found a significant positive correlation between weight and serum hepcidin concentrations (correlation coefficient = 0.728, p < 0.001). This suggests that as weight increases, serum hepcidin levels also tend to increase. The potential mechanisms underlying the correlation between weight and serum hepcidin concentrations in the study are not fully understood. However, studies have shown that hepcidin levels are disproportionately influenced by weight, with overweight patients with type 2 diabetes (T2D) having significantly elevated hepcidin levels compared to those with grade I obesity who have reduced levels. The sources of heterogeneity in the included studies remained high, and most studies did not control for confounders such as inflammation and obesity, which have an impact on hepcidin levels. Additionally, the quality of cumulative evidence in the study was low due to the observational nature of the included studies. Serum hepcidin levels have also been associated with obesity, with a high correlation between serum hepcidin and serum ferritin concentration in small samples of healthy persons Ndevahoma F et al., 2021, Vuppalanchi R et al., 2014 [34,35].
Our study found a weak negative correlation between serum hepcidin concentrations and serum hemoglobin levels (correlation coefficient = -0.203), although this did not reach statistical significance (p = 0.158). This suggests a trend towards a negative association between these two variables, meaning that as serum hepcidin levels increase, serum hemoglobin levels tend to decrease, and vice versa. Hemoglobin is a protein in your red blood cells that carries oxygen to your body’s organs and tissues and transports carbon dioxide from your organs and tissues back to your lungs. On the other hand, hepcidin is a hormone produced by the liver that regulates iron balance in the body. It inhibits the release of iron from cells, leading to decreased iron levels in the blood. The negative correlation between hemoglobin and hepcidin could suggest that as the body produces more hemoglobin (and therefore requires more iron), it may decrease the production of hepcidin to allow more iron to be released from cells. However, this correlation was not statistically significant in your study, indicating that the observed relationship could be due to chance. It’s important to note that this is a complex area and other factors could also be influencing the relationship between hemoglobin and hepcidin levels. Further research would be needed to fully understand the implications of these findings Ganz, T. (2003), Nemeth, E., & Ganz, T. (2006) and Tussing-Humphreys et al., (2012) [36,37,38].
5. Conclusion
The study emphasizes the complex relationship between obesity and iron deficiency, highlighting the challenges it poses for public health. While the exact mechanisms are not fully understood, emerging research suggests chronic inflammation and heightened levels of hepcidin play crucial roles in disrupting iron balance in obese individuals. Obesity has become a global epidemic, raising concerns about associated health complications, including disruptions in iron balance leading to hypoferremia. Chronic low-grade inflammation, driven by adipose tissue, influences hepcidin levels, hindering iron release into the bloodstream and resulting in hypoferremia. The implications of obesity-related hypoferremia are significant, requiring proactive measures such as systematic screening of iron status in obese individuals to prevent anaemia and associated complications. Clinical manifestations of anaemia may not be evident, necessitating periodic monitoring of iron markers, especially in vulnerable populations like children, adolescents, and women of childbearing age. Interventions targeting weight management, including dietary changes and exercise, offer promise in addressing obesity-related hypoferremia. Energy-restricted diets and regular physical activity not only facilitate weight loss but also improve metabolic health and reduce inflammation, factors crucial in managing iron metabolism.
6. Limitations of This Study
Our study encountered several limitations that warrant consideration. Firstly, the sample size was relatively small, consisting of only 50 subjects, which may restrict the generalizability of our findings to a wider population. Additionally, the research was conducted solely within a single center, which could introduce biases related to geographical and demographic factors. Moreover, due to its cross-sectional nature, the study could only capture a snapshot at one specific point in time, potentially limiting insights into temporal relationships between different parameters. Furthermore, we did not assess the influence of various treatment regimens on anemia or inflammation, thus overlooking a potentially significant confounding factor. Lastly, the absence of a control group further restricts the scope of our conclusions.
References
- Panuganti, K.K., M. Nguyen, and R.K. Kshirsagar, Obesity, in StatPearls. 2024, StatPearls PublishingCopyright © 2024, StatPearls Publishing LLC.: Treasure Island (FL) ineligible companies. Disclosure: Minhthao Nguyen declares no relevant financial relationships with ineligible companies. Disclosure: Ravi Kshirsagar declares no relevant financial relationships with ineligible companies.
- Fruh, S.M. Obesity: Risk factors, complications, and strategies for sustainable long-term weight management. J Am Assoc Nurse Pract 2017, 29, S3–s14. [Google Scholar] [CrossRef]
- Lim, J.U.; et al. Comparison of World Health Organization and Asia-Pacific body mass index classifications in COPD patients. Int J Chron Obstruct Pulmon Dis 2017, 12, 2465–2475. [Google Scholar] [CrossRef]
- Wang, T.; et al. Causal relationship between obesity and iron deficiency anemia: a two-sample Mendelian randomization study. Front Public Health 2023, 11, 1188246. [Google Scholar] [CrossRef]
- Cepeda-Lopez, A.C. ; I. Aeberli, and M.B. Zimmermann. Does obesity increase risk for iron deficiency? A review of the literature and the potential mechanisms. Int J Vitam Nutr Res 2010, 80, 263–70. [Google Scholar] [CrossRef]
- Hruby, A.; F.B. Hu. The Epidemiology of Obesity: A Big Picture. Pharmacoeconomics 2015, 33, 673–89. [CrossRef]
- Piskin, E.; et al. Iron Absorption: Factors, Limitations, and Improvement Methods. 2022, 7, 20441–20456. [Google Scholar] [CrossRef]
- Gulec, S. , G.J. Anderson, and J.F. Collins. Mechanistic and regulatory aspects of intestinal iron absorption. Am J Physiol Gastrointest Liver Physiol 2014, 307, G397–409. [Google Scholar] [CrossRef]
- Morgan, E.H. and P.S. Oates. Mechanisms and regulation of intestinal iron absorption. Blood Cells Mol Dis 2002, 29, 384–99. [Google Scholar] [CrossRef]
- Nemeth, E. and T. Ganz. The role of hepcidin in iron metabolism. Acta Haematol 2009, 122, 78–86. [Google Scholar] [CrossRef]
- Ganz, T. Hepcidin and its role in regulating systemic iron metabolism. Hematology Am Soc Hematol Educ Program 2006, 507, 29–35. [Google Scholar] [CrossRef]
- Collins, J.F. M. Wessling-Resnick, and M.D. Knutson. Hepcidin regulation of iron transport. J Nutr 2008, 138, 2284–8. [Google Scholar] [CrossRef]
- Zhao, L.; et al. Obesity and iron deficiency: a quantitative meta-analysis. Obesity reviews 2015, 16, 1081–1093. [Google Scholar] [CrossRef]
- Chowdhury, M.A.B. , M.M. Adnan, and M.Z. Hassan. Trends, prevalence and risk factors of overweight and obesity among women of reproductive age in Bangladesh: a pooled analysis of five national cross-sectional surveys. BMJ open 2018, 8, e018468. [Google Scholar] [CrossRef]
- Chang, J.-S.; et al. Interactive effects of dietary fat/carbohydrate ratio and body mass index on iron deficiency anemia among Taiwanese women. Nutrients 2014, 6, 3929–3941. [Google Scholar] [CrossRef]
- Zimmermann, M.B. and R.F. Hurrell. Nutritional iron deficiency. The lancet 2007, 370, 511–520. [Google Scholar] [CrossRef] [PubMed]
- Tanwi, T.S.; et al. Socioeconomic correlates of overweight and obesity among ever-married urban women in Bangladesh. BMC public health 2019, 19, 1–7. [Google Scholar] [CrossRef]
- Rad, H.A.; et al. Obesity and iron-deficiency anemia in women of reproductive age in northern Iran. Journal of education and health promotion 2019, 8, 115. [Google Scholar]
- Fongar, A.; et al. How well do different dietary and nutrition assessment tools match? Insights from rural Kenya. Public health nutrition 2019, 22, 391–403. [Google Scholar]
- Fongar, A. ; T. Gödecke, and M. Qaim. Various forms of double burden of malnutrition problems exist in rural Kenya. BMC public health 2019, 19, 1–9. [Google Scholar] [CrossRef]
- Keding, G. Nutrition transition in rural Tanzania and Kenya. Hidden Hunger 2016, 115, 68–81. [Google Scholar]
- Neymotin, F. and U. Sen. Iron and obesity in females in the United States. Obesity 2011, 19, 191–199. [Google Scholar] [CrossRef]
- Wang, T.; et al. Causal relationship between obesity and iron deficiency anemia: a two-sample Mendelian randomization study. Frontiers in Public Health 2023, 11, 1188246. [Google Scholar] [CrossRef]
- Aguree, S. and M.B. Reddy. Inflammatory markers and hepcidin are elevated but serum iron is lower in obese women of reproductive age. Nutrients 2021, 13, 217. [Google Scholar] [CrossRef] [PubMed]
- Aigner, E. , A. Feldman, and C. Datz. Obesity as an emerging risk factor for iron deficiency. Nutrients 2014, 6, 3587–3600. [Google Scholar] [CrossRef]
- Johnson-Wimbley, T.D. and D.Y. Graham. Diagnosis and management of iron deficiency anemia in the 21st century. Therapeutic advances in Gastroenterology 2011, 4, 177–184. [Google Scholar] [CrossRef]
- Ahirwar, R. and P.R. Mondal. Prevalence of obesity in India: A systematic review. Diabetes & Metabolic Syndrome: Clinical Research & Reviews 2019, 13, 318–321. [Google Scholar]
- Kumar, A.; et al. Iron deficiency anaemia: pathophysiology, assessment, practical management. BMJ open gastroenterology 2022, 9, e000759. [Google Scholar] [CrossRef]
- Safiri, S.; et al. Burden of anemia and its underlying causes in 204 countries and territories, 1990–2019: results from the Global Burden of Disease Study 2019. Journal of hematology & oncology 2021, 14, 1–16. [Google Scholar]
- Zheng, H.; et al. Anaemia, iron deficiency, iron-deficiency anaemia and their associations with obesity among schoolchildren in Guangzhou, China. Public Health Nutrition 2020, 23, 1693–1702. [Google Scholar] [CrossRef] [PubMed]
- Köseoğlu, F.D. and B. Özlek. Anemia and Iron Deficiency Predict All-Cause Mortality in Patients with Heart Failure and Preserved Ejection Fraction: 6-Year Follow-Up Study. Diagnostics 2024, 14, 209. [Google Scholar] [CrossRef] [PubMed]
- Cepeda-Lopez, A.C. and K. Baye. Obesity, iron deficiency and anaemia: a complex relationship. Public Health Nutrition 2020, 23, 1703–1704. [Google Scholar] [CrossRef] [PubMed]
- Alam, F. , A.S. Memon, and S.S. Fatima. Increased Body Mass Index may lead to Hyperferritinemia Irrespective of Body Iron Stores. Pak J Med Sci 2015, 31, 1521–6. [Google Scholar]
- Ndevahoma, F.; et al. Body weight and its influence on hepcidin levels in patients with type 2 diabetes: A systematic review and meta-analysis of clinical studies. Heliyon 2021, 7. [Google Scholar] [CrossRef] [PubMed]
- Vuppalanchi, R.; et al. Serum hepcidin levels are associated with obesity but not liver disease. Obesity 2014, 22, 836–841. [Google Scholar] [CrossRef]
- Ganz, T. Hepcidin, a key regulator of iron metabolism and mediator of anemia of inflammation. Blood 2003, 102, 783–788. [Google Scholar] [CrossRef] [PubMed]
- Nemeth, E. and T. Ganz. Regulation of iron metabolism by hepcidin. Annu. Rev. Nutr. 2006, 26, 323–342. [Google Scholar] [CrossRef]
- Tussing-Humphreys, L.; et al. Rethinking iron regulation and assessment in iron deficiency, anemia of chronic disease, and obesity: introducing hepcidin. Journal of the Academy of Nutrition and Dietetics 2012, 112, 391–400. [Google Scholar] [CrossRef]
Figure 1.
Iron absorption in intestine and regulation of iron.
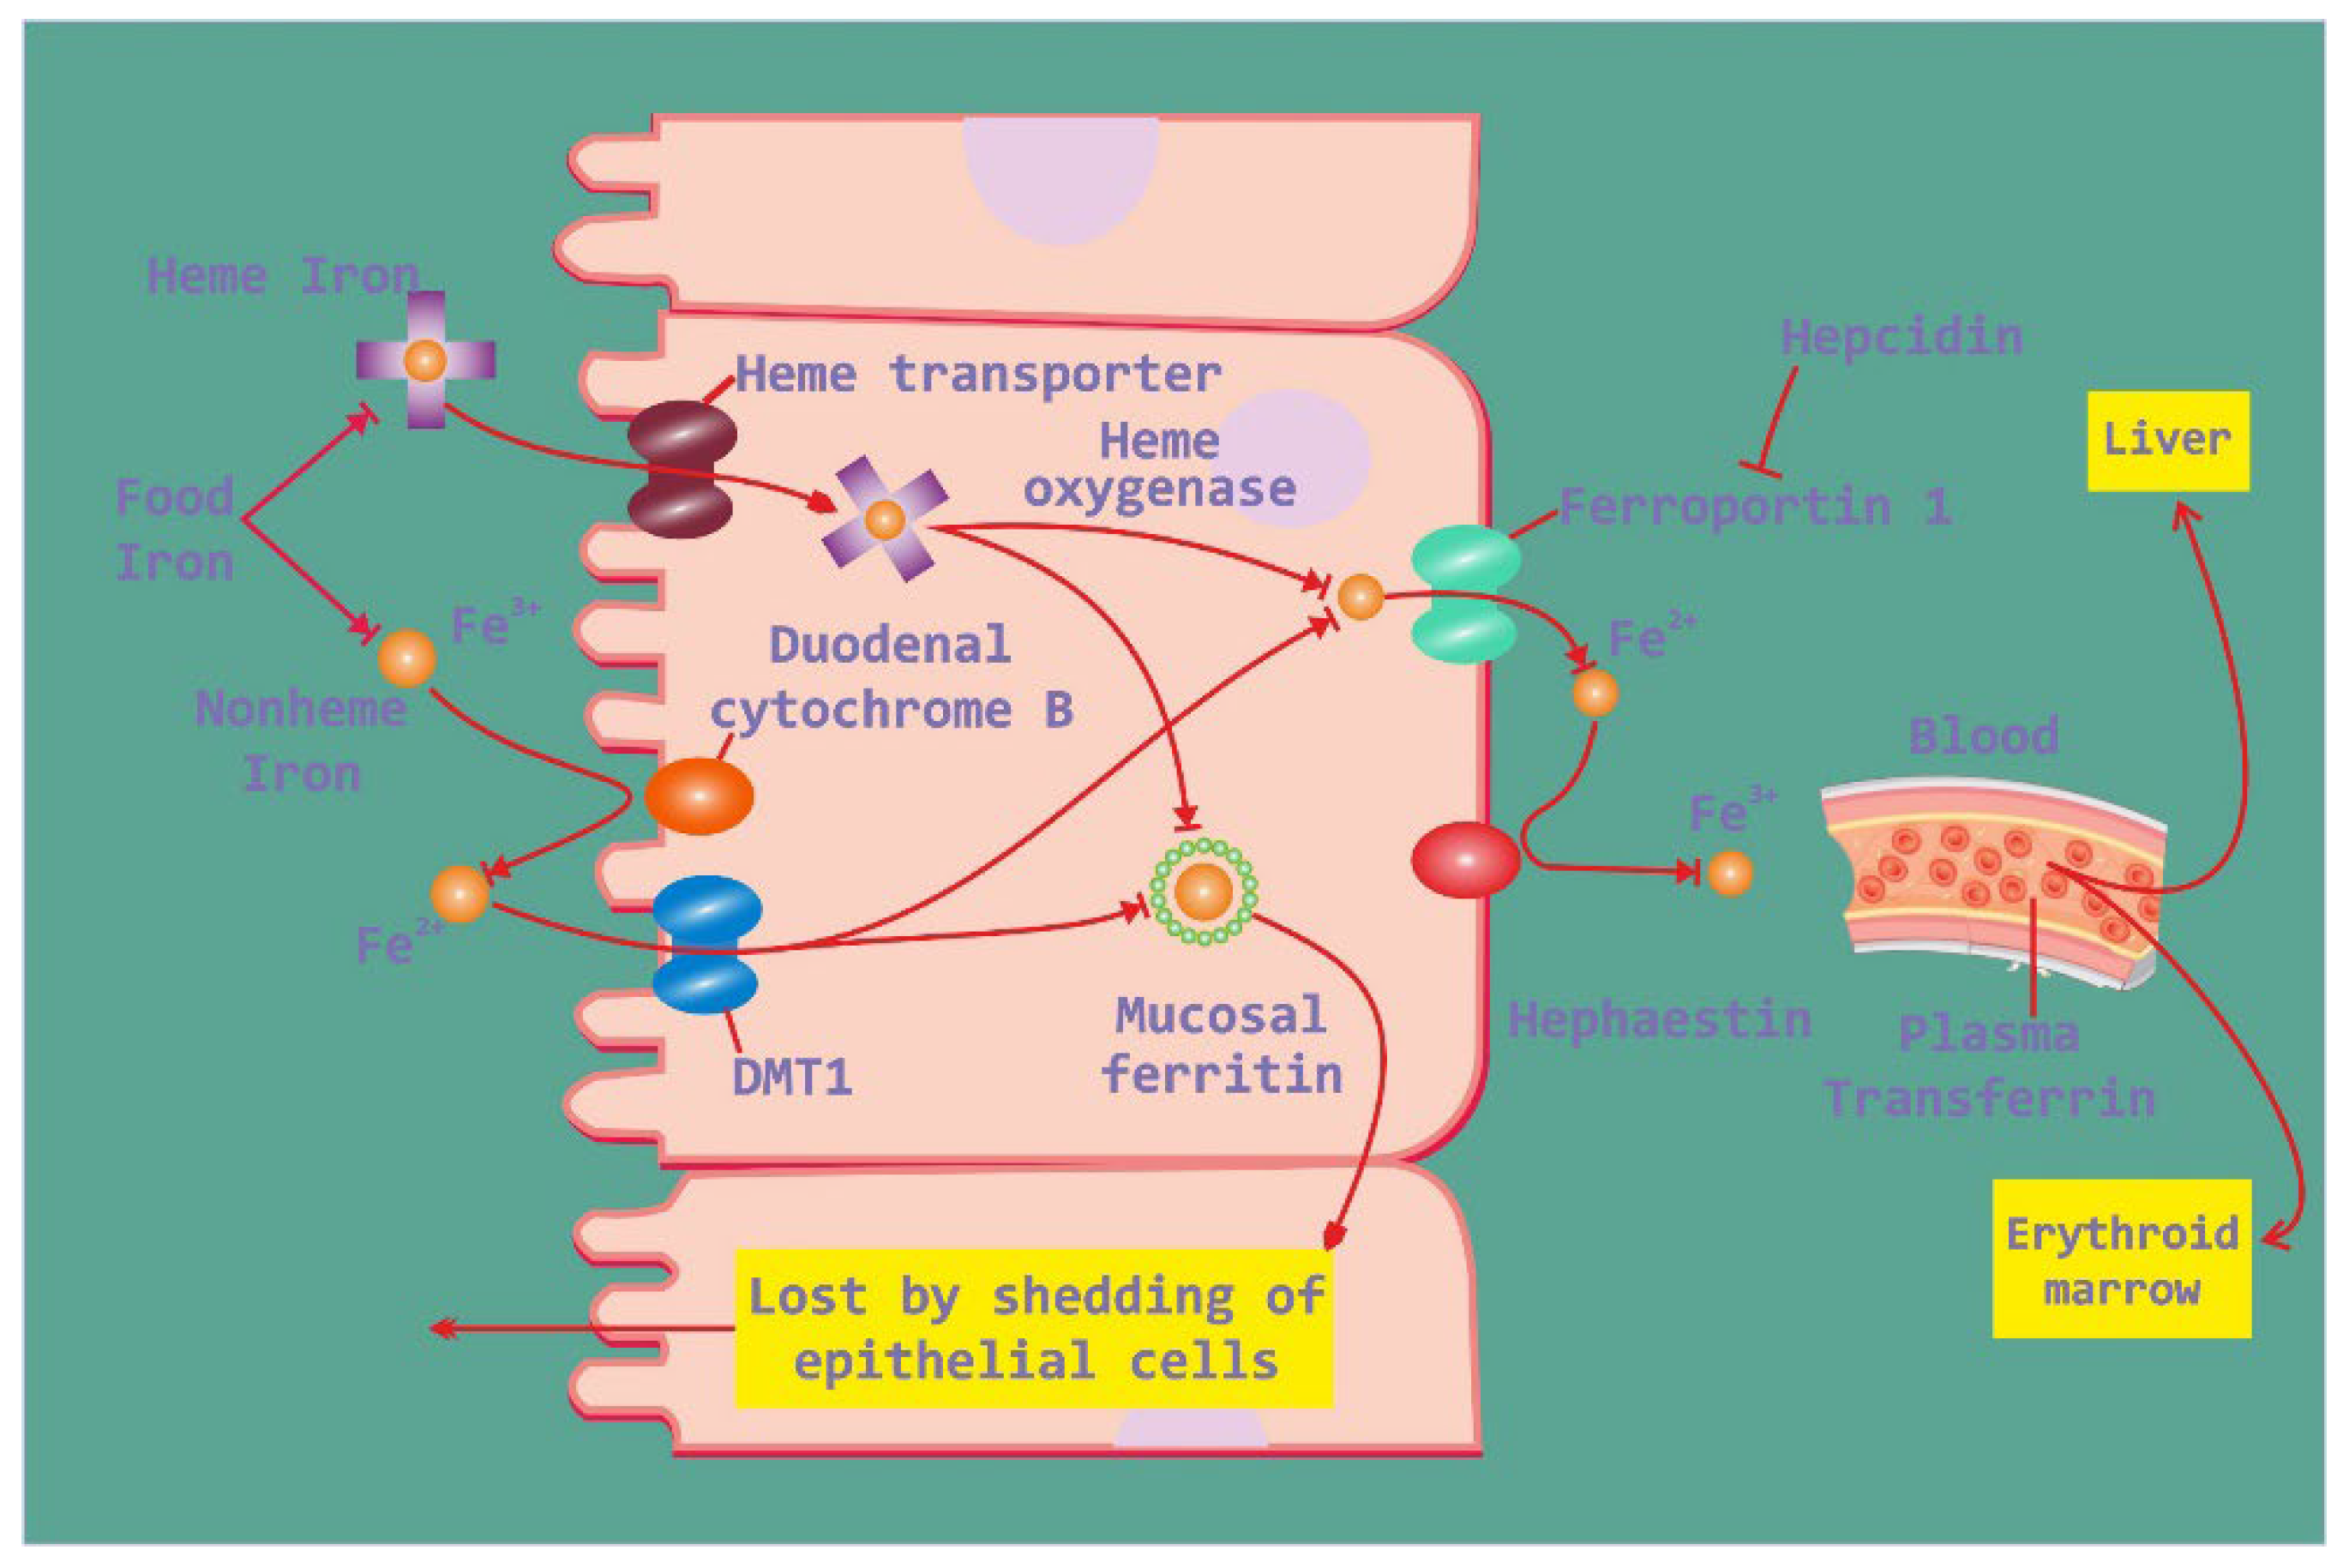
Figure 2.
Depicting iron regulation by hepcidin.
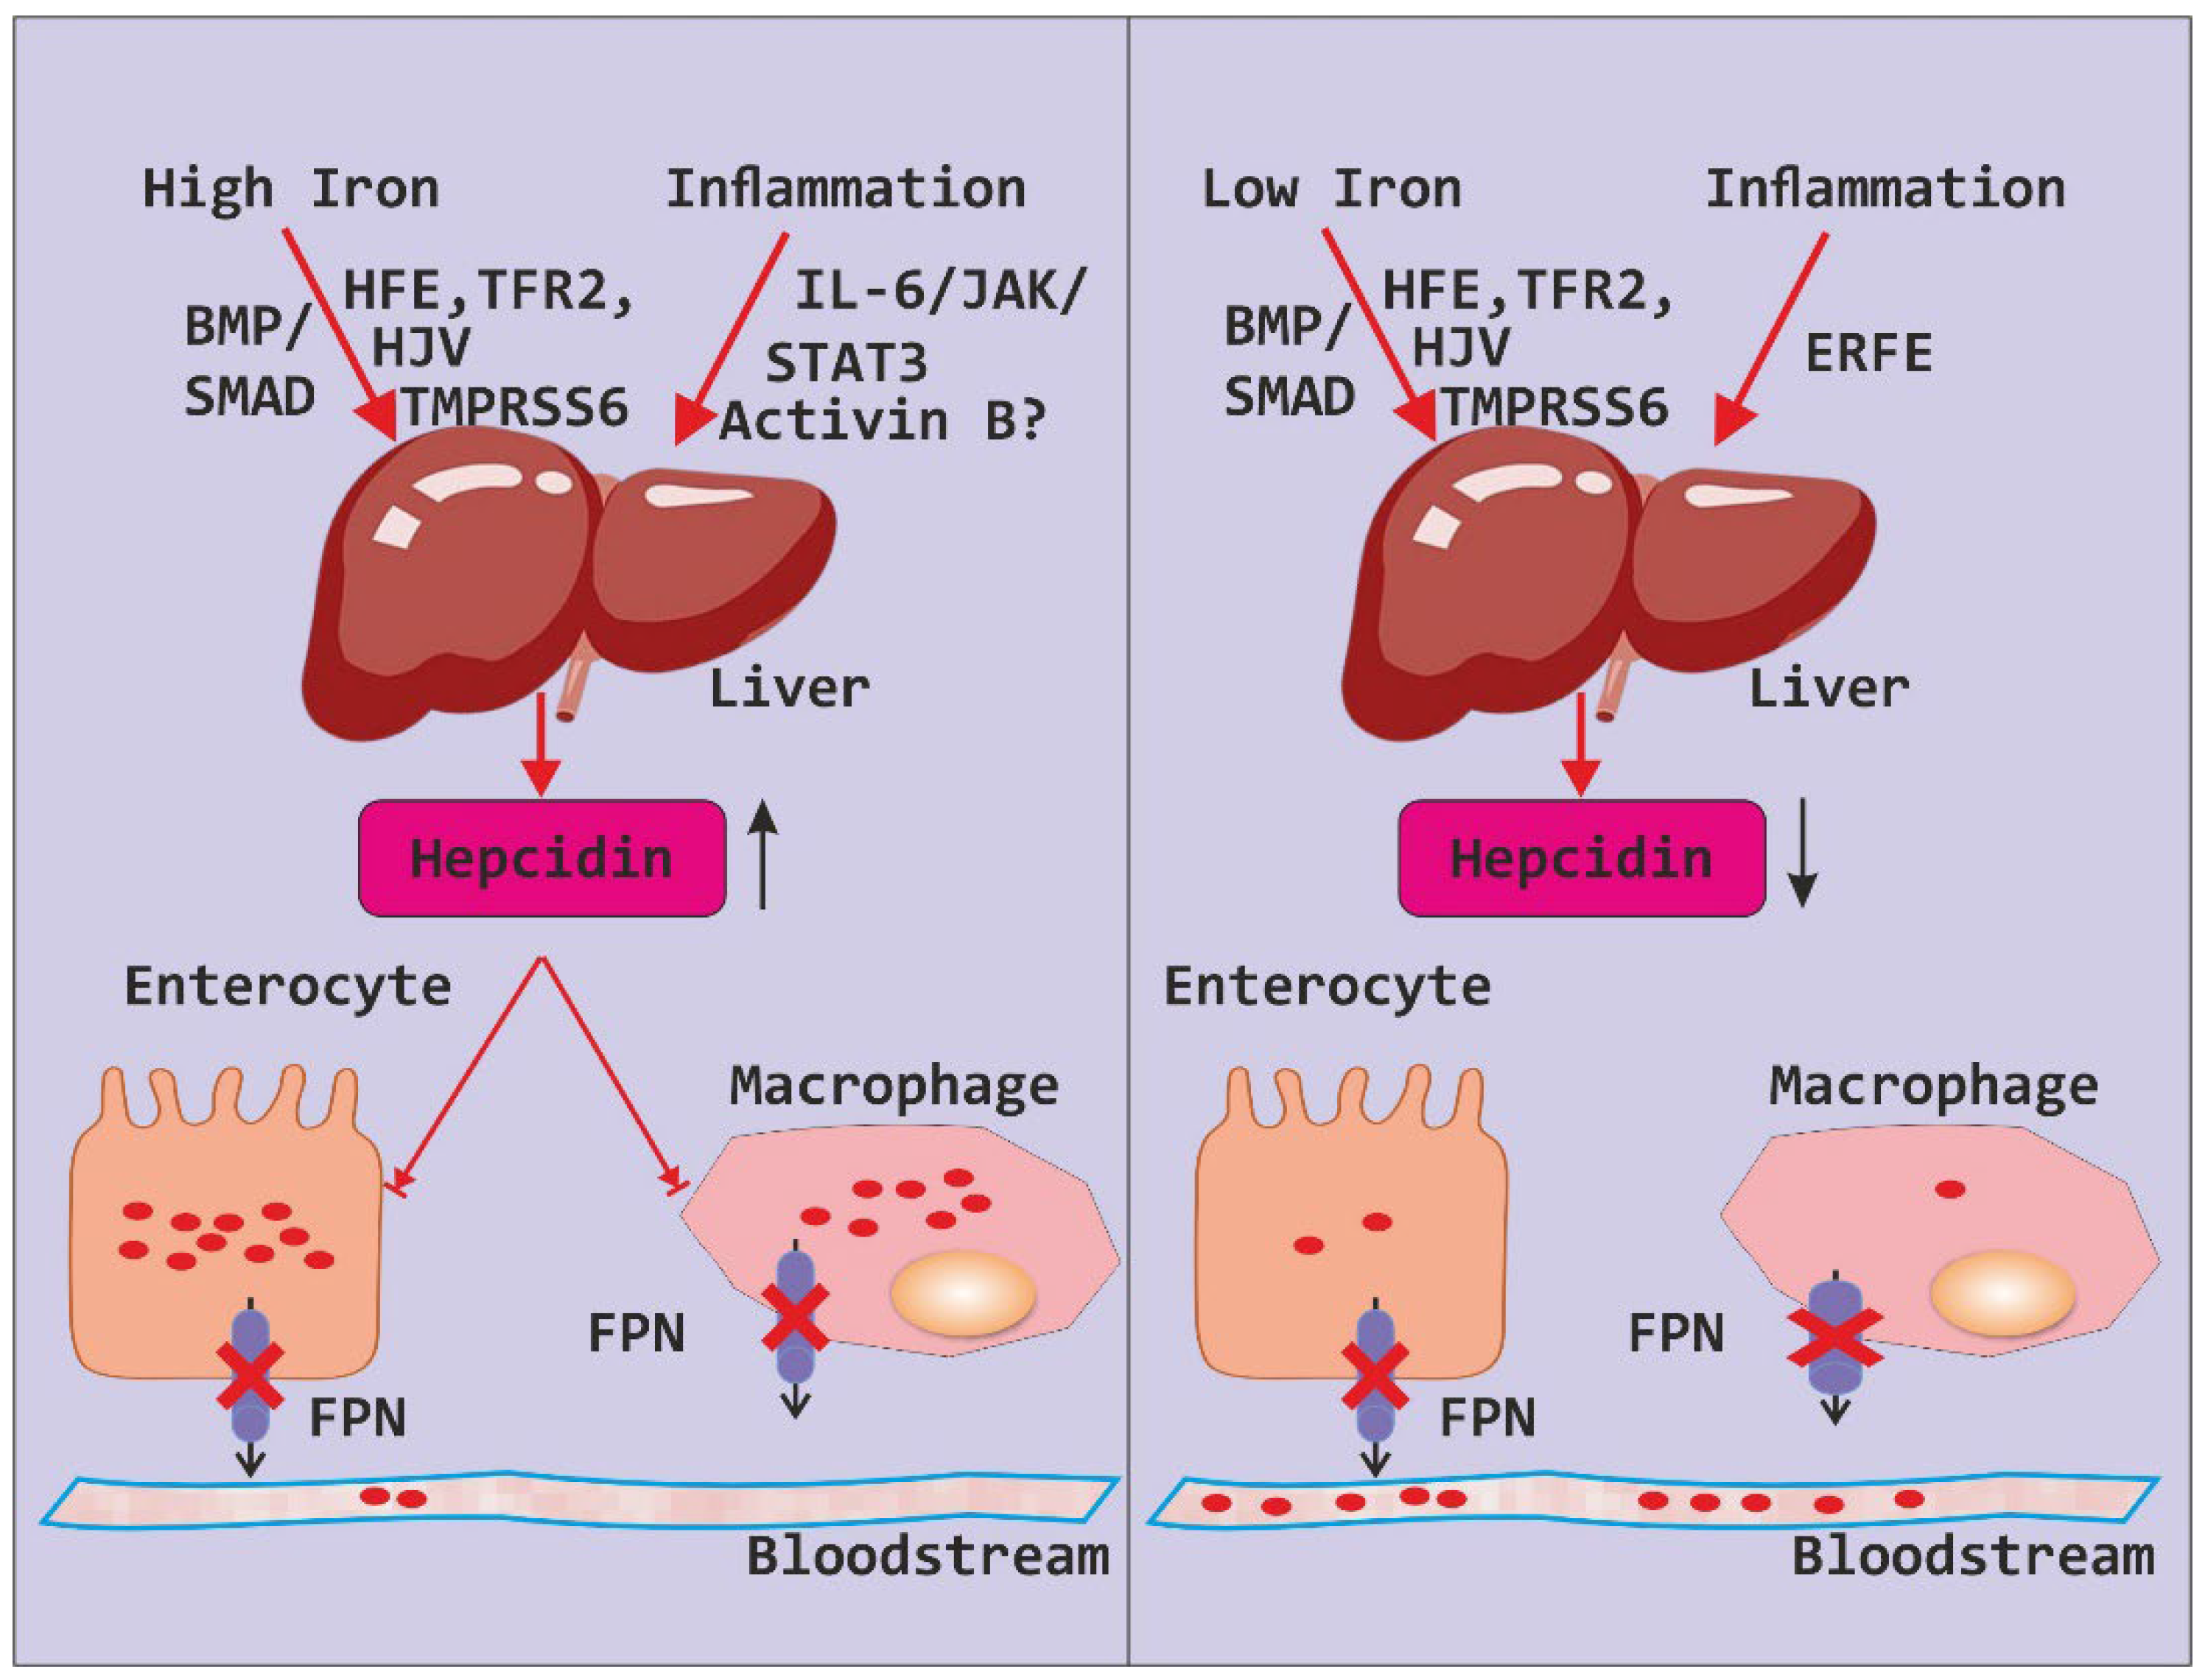
Figure 3.
Showing the distribution of subjects based on Age (Years).
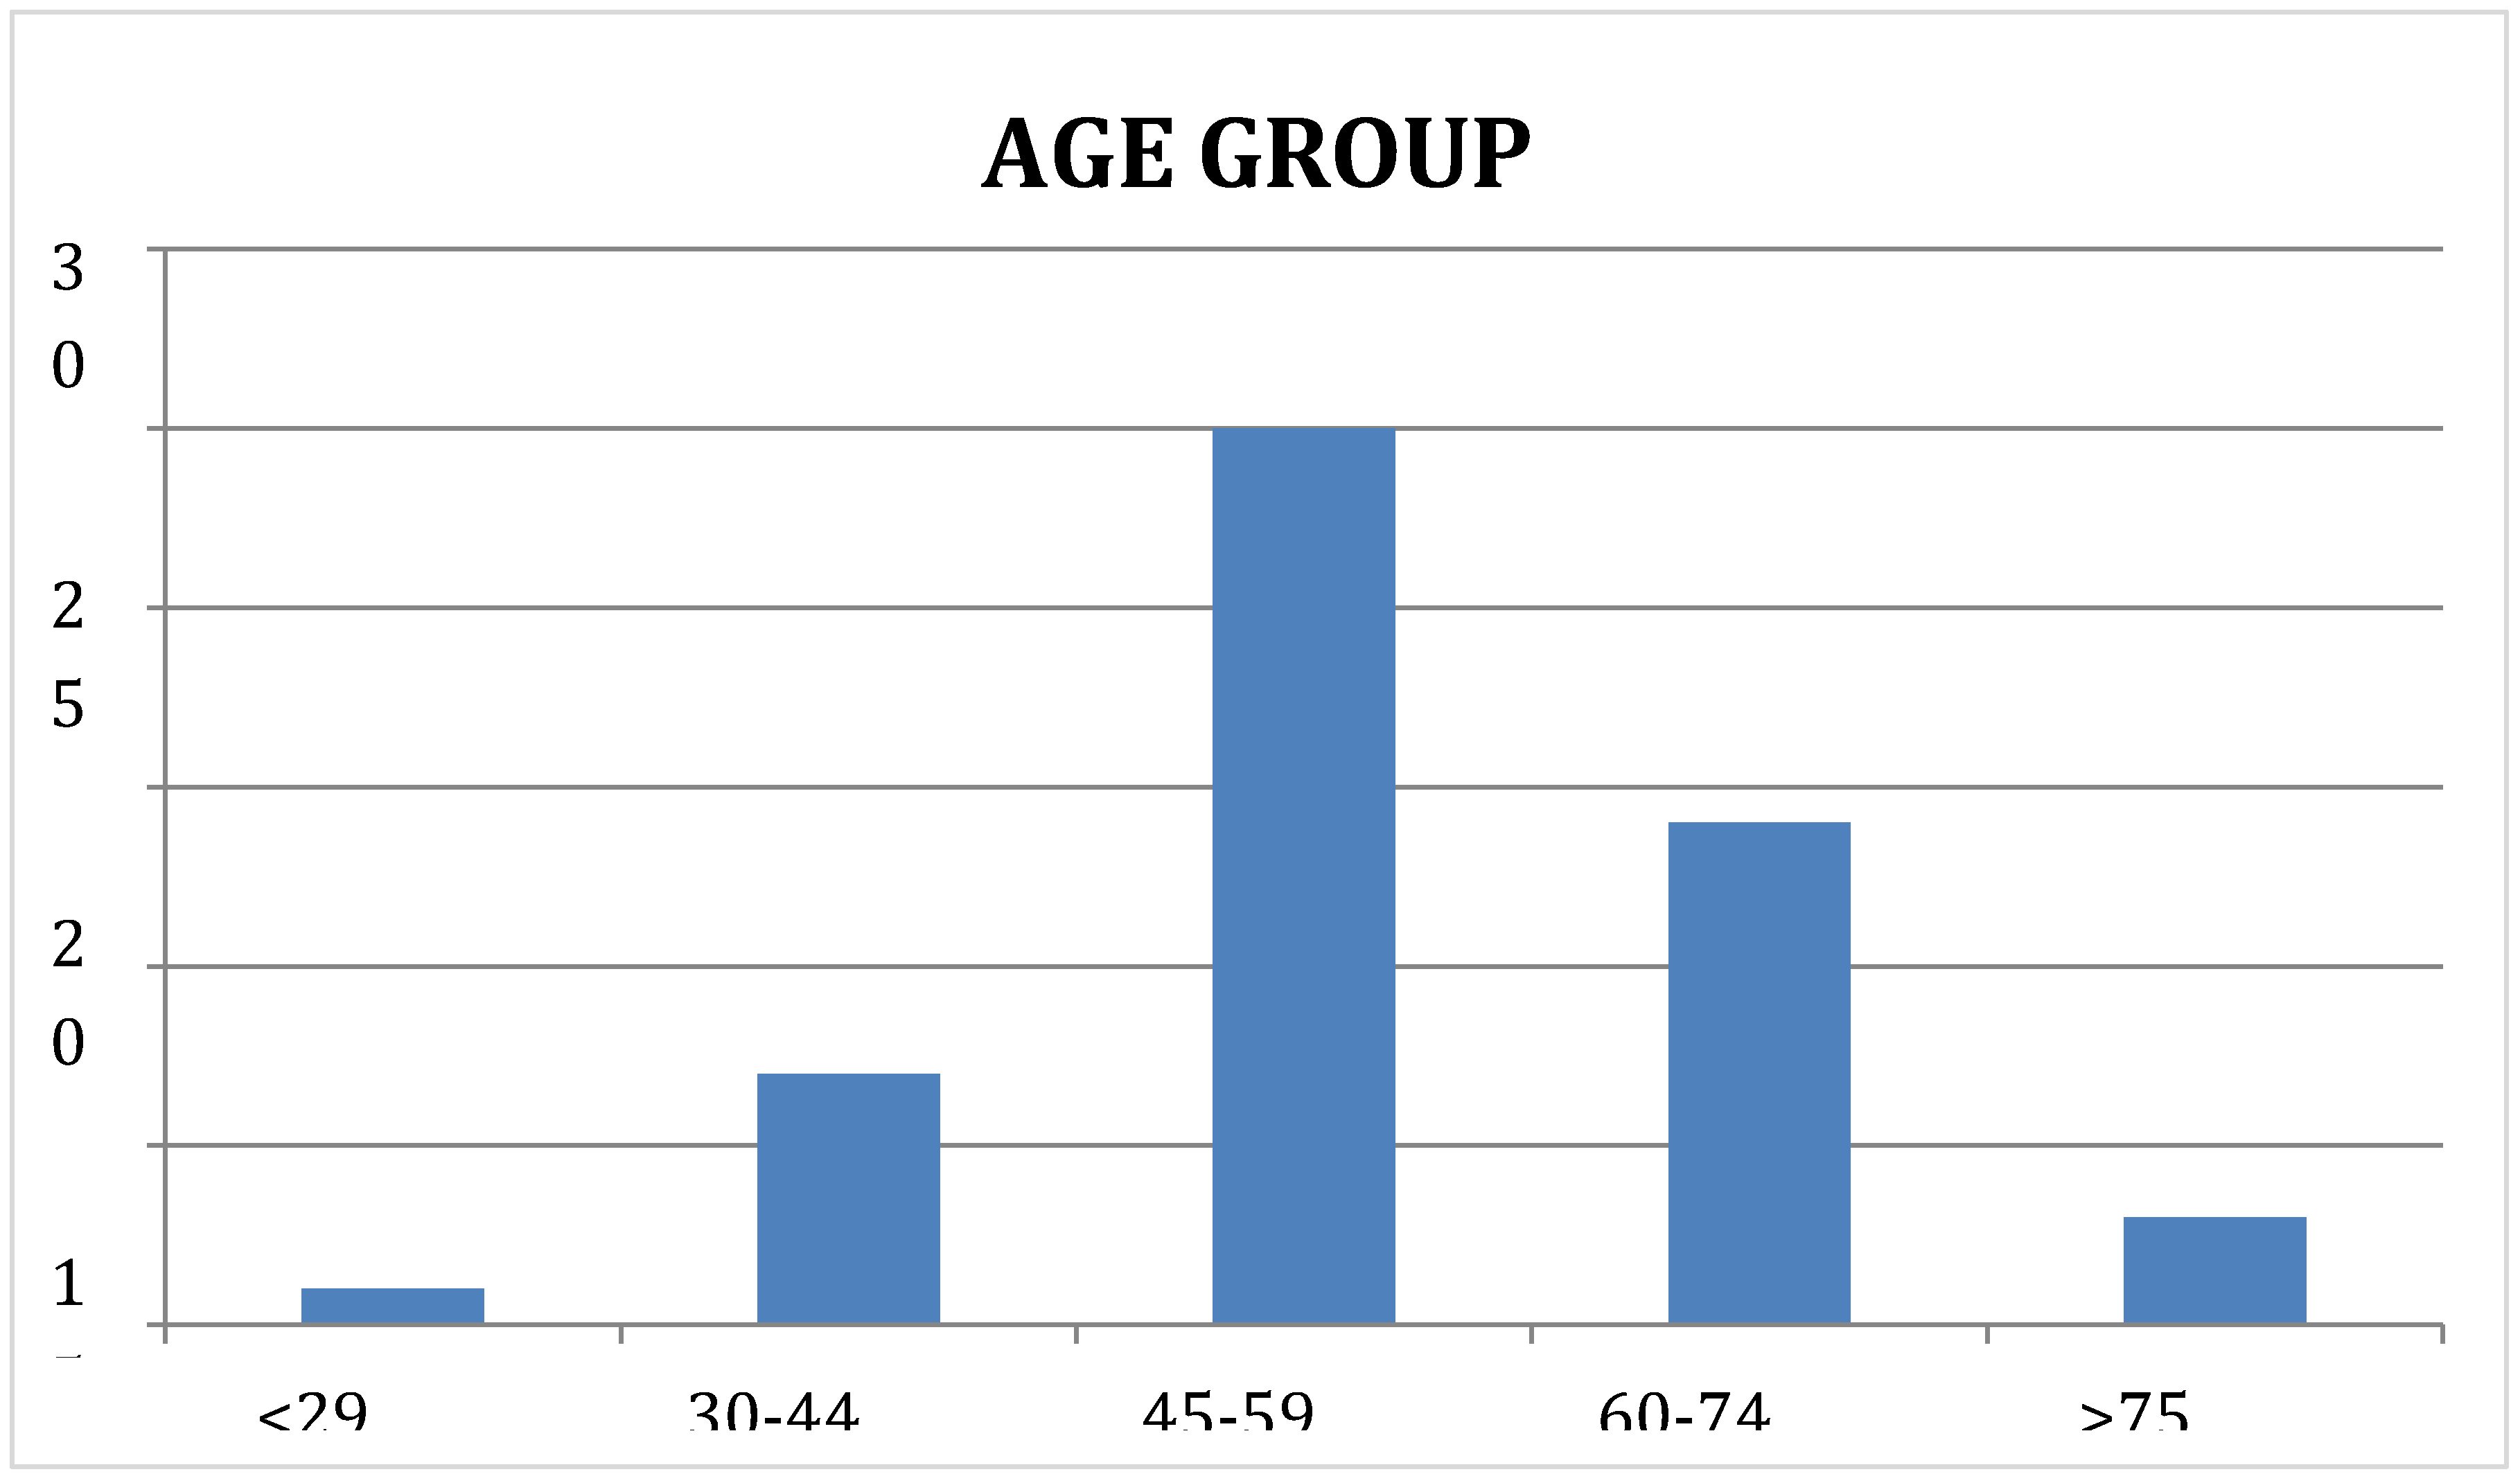
Figure 4.
Showing the distribution of subjects based on gender.
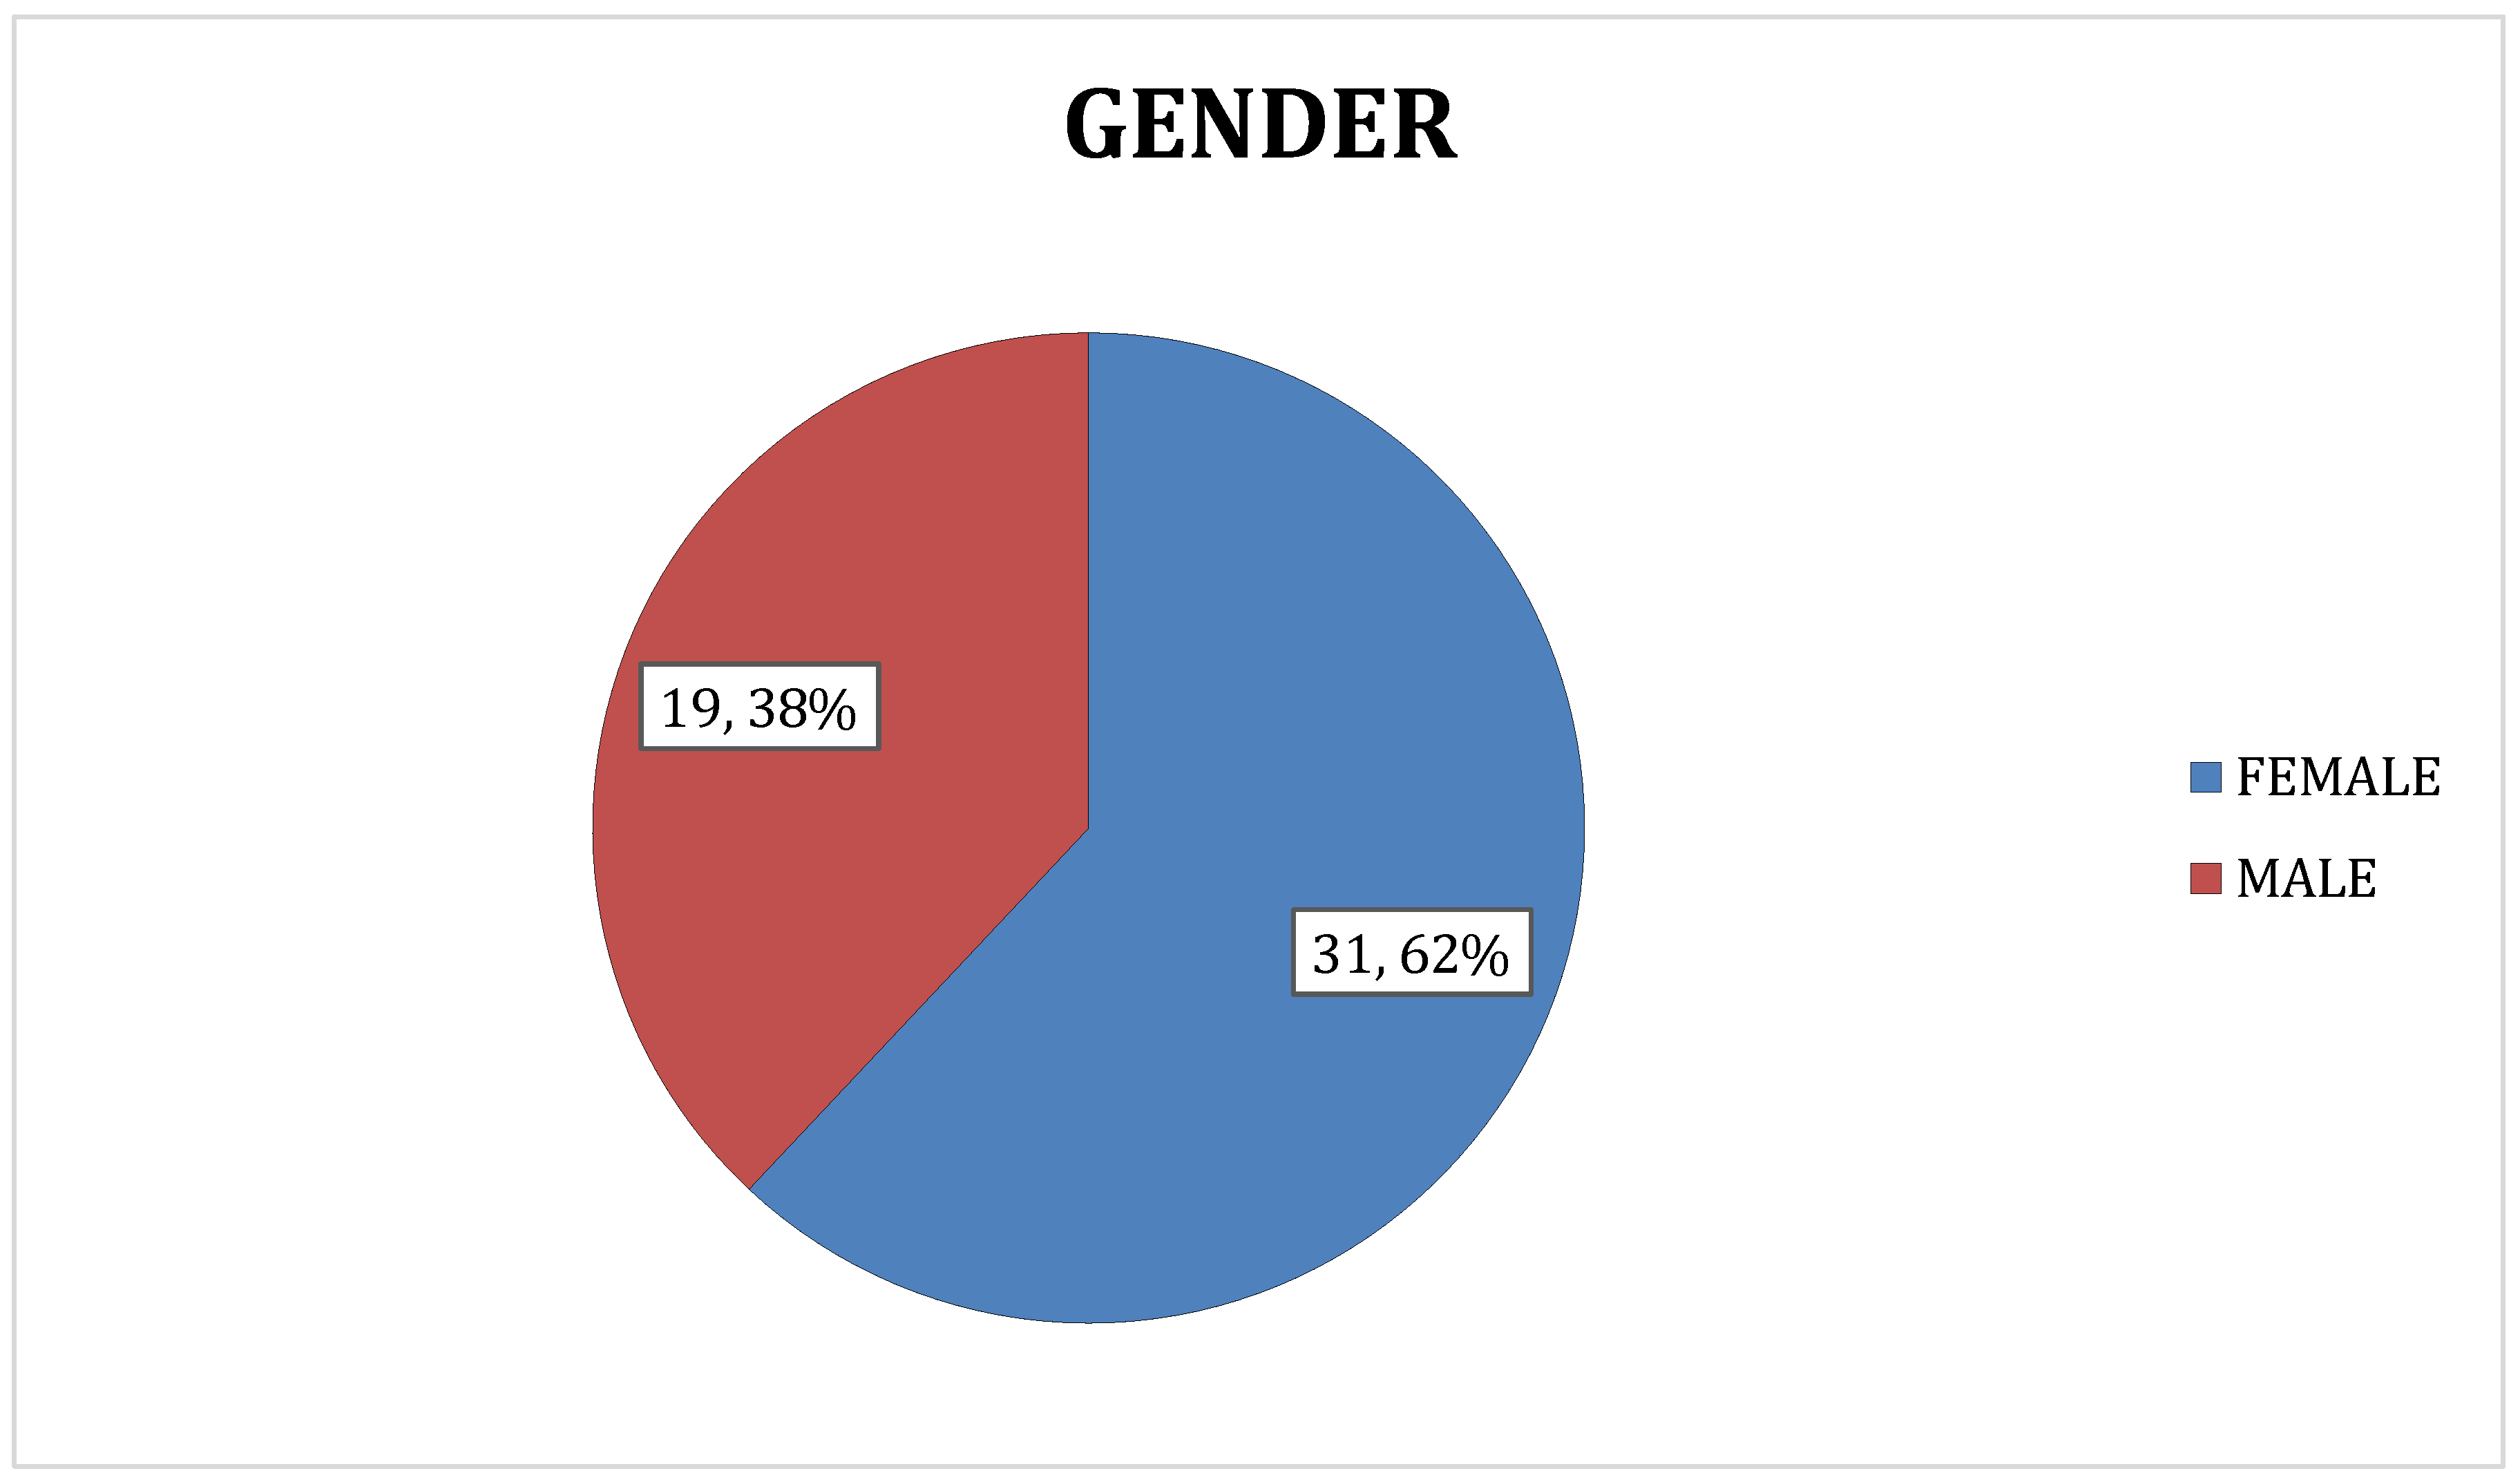
Figure 5.
Showing the distribution of subjects based on cause of anaemia.
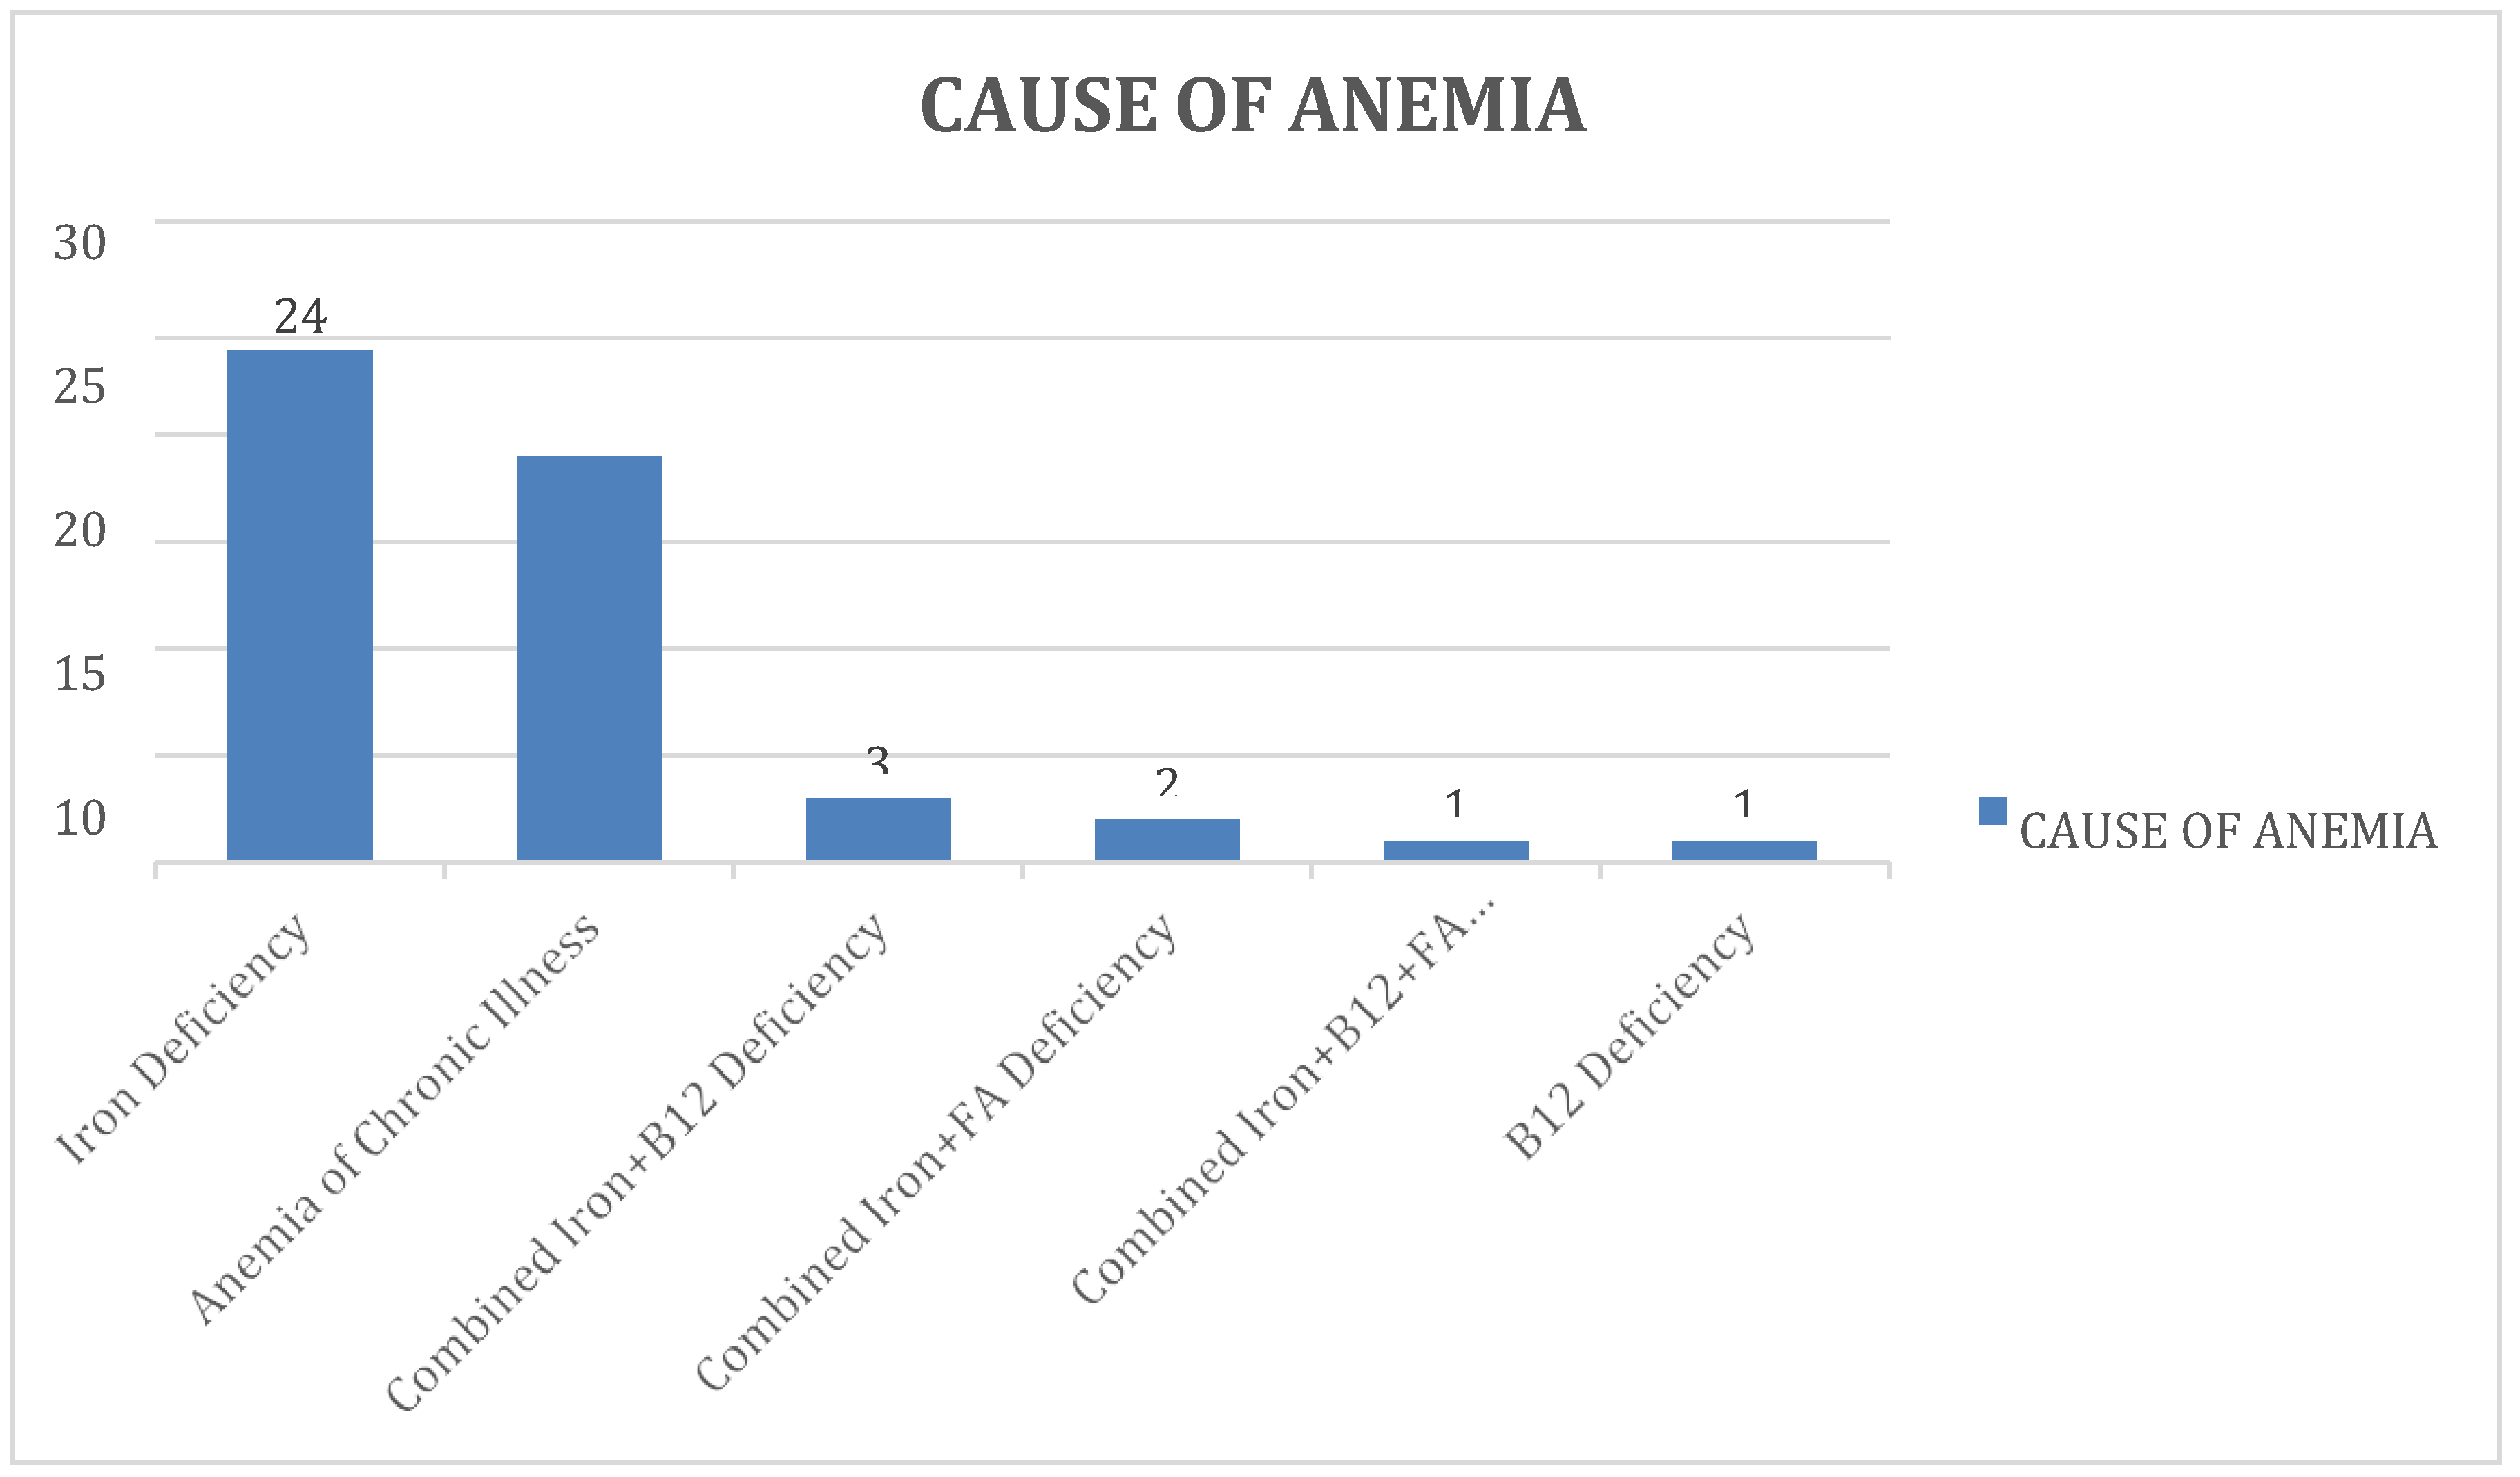
Figure 6.
Showing the distribution of subjects based on co-morbidity.
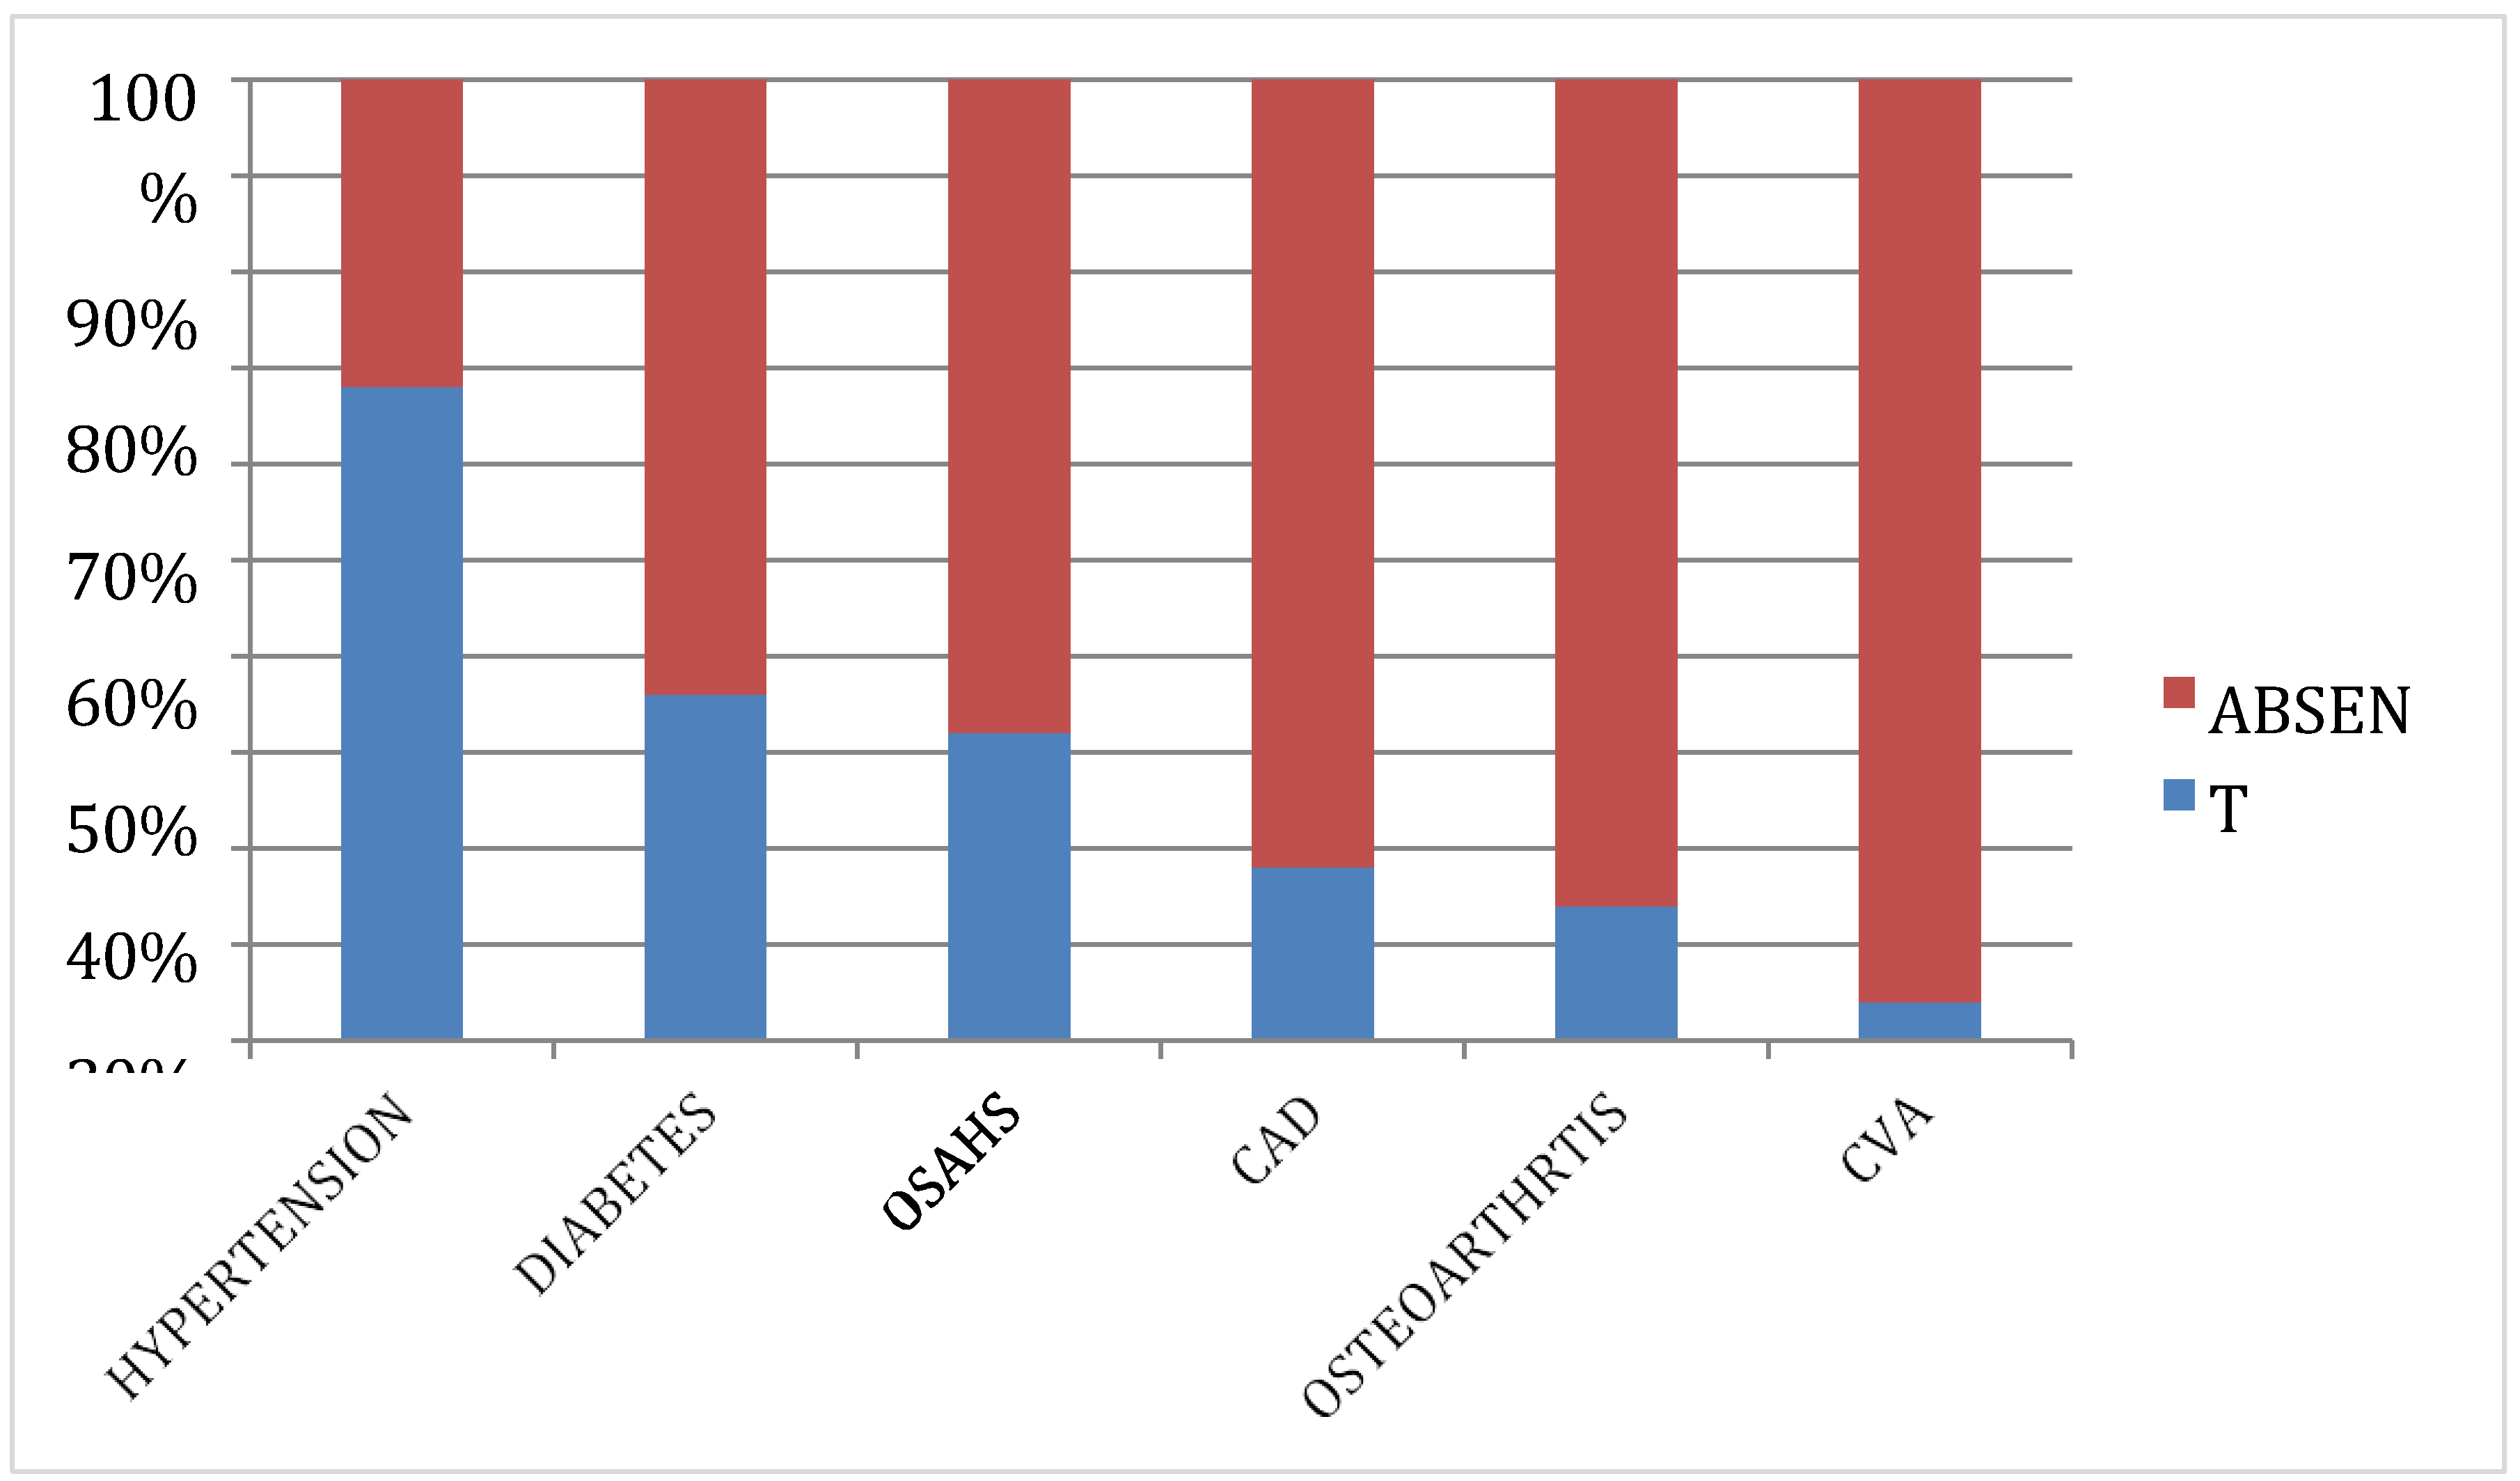
Figure 7.
Scatterplot between BMI (kg/m2) and Serum Iron (µg/dL).
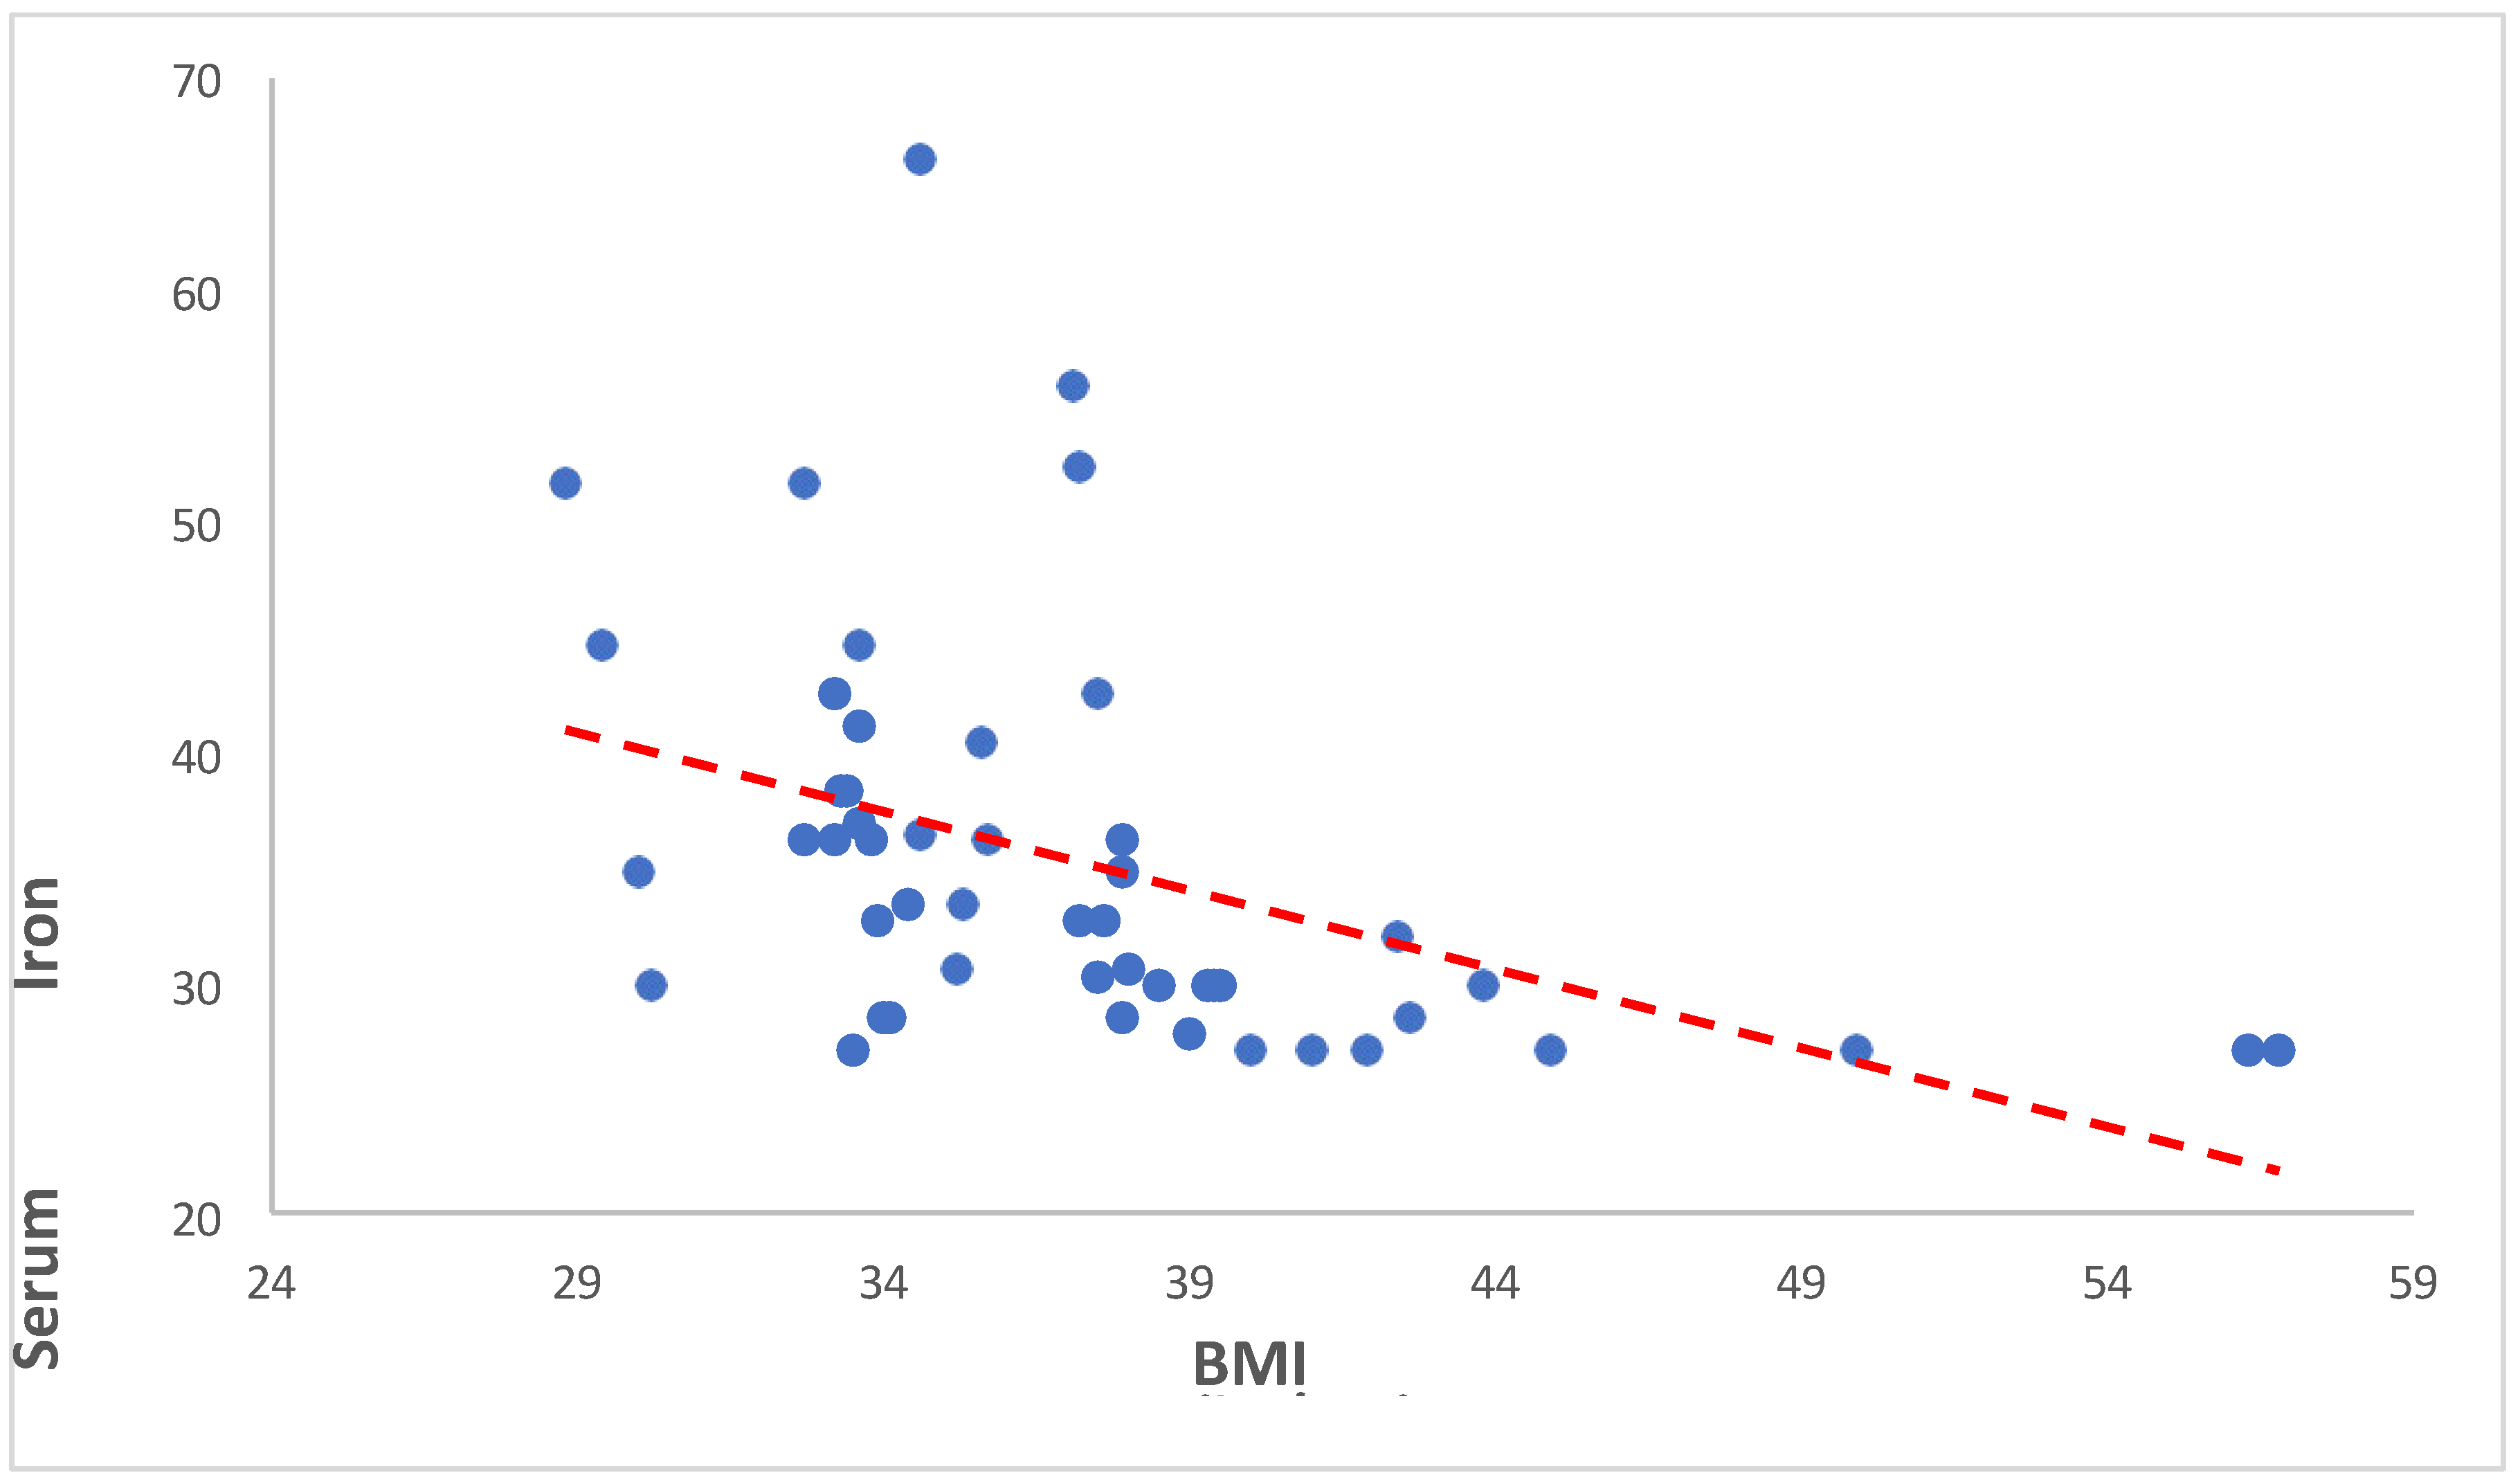
Figure 8.
Scatterplot between BMI (kg/m2) and Serum Ferritin (ng/mL).
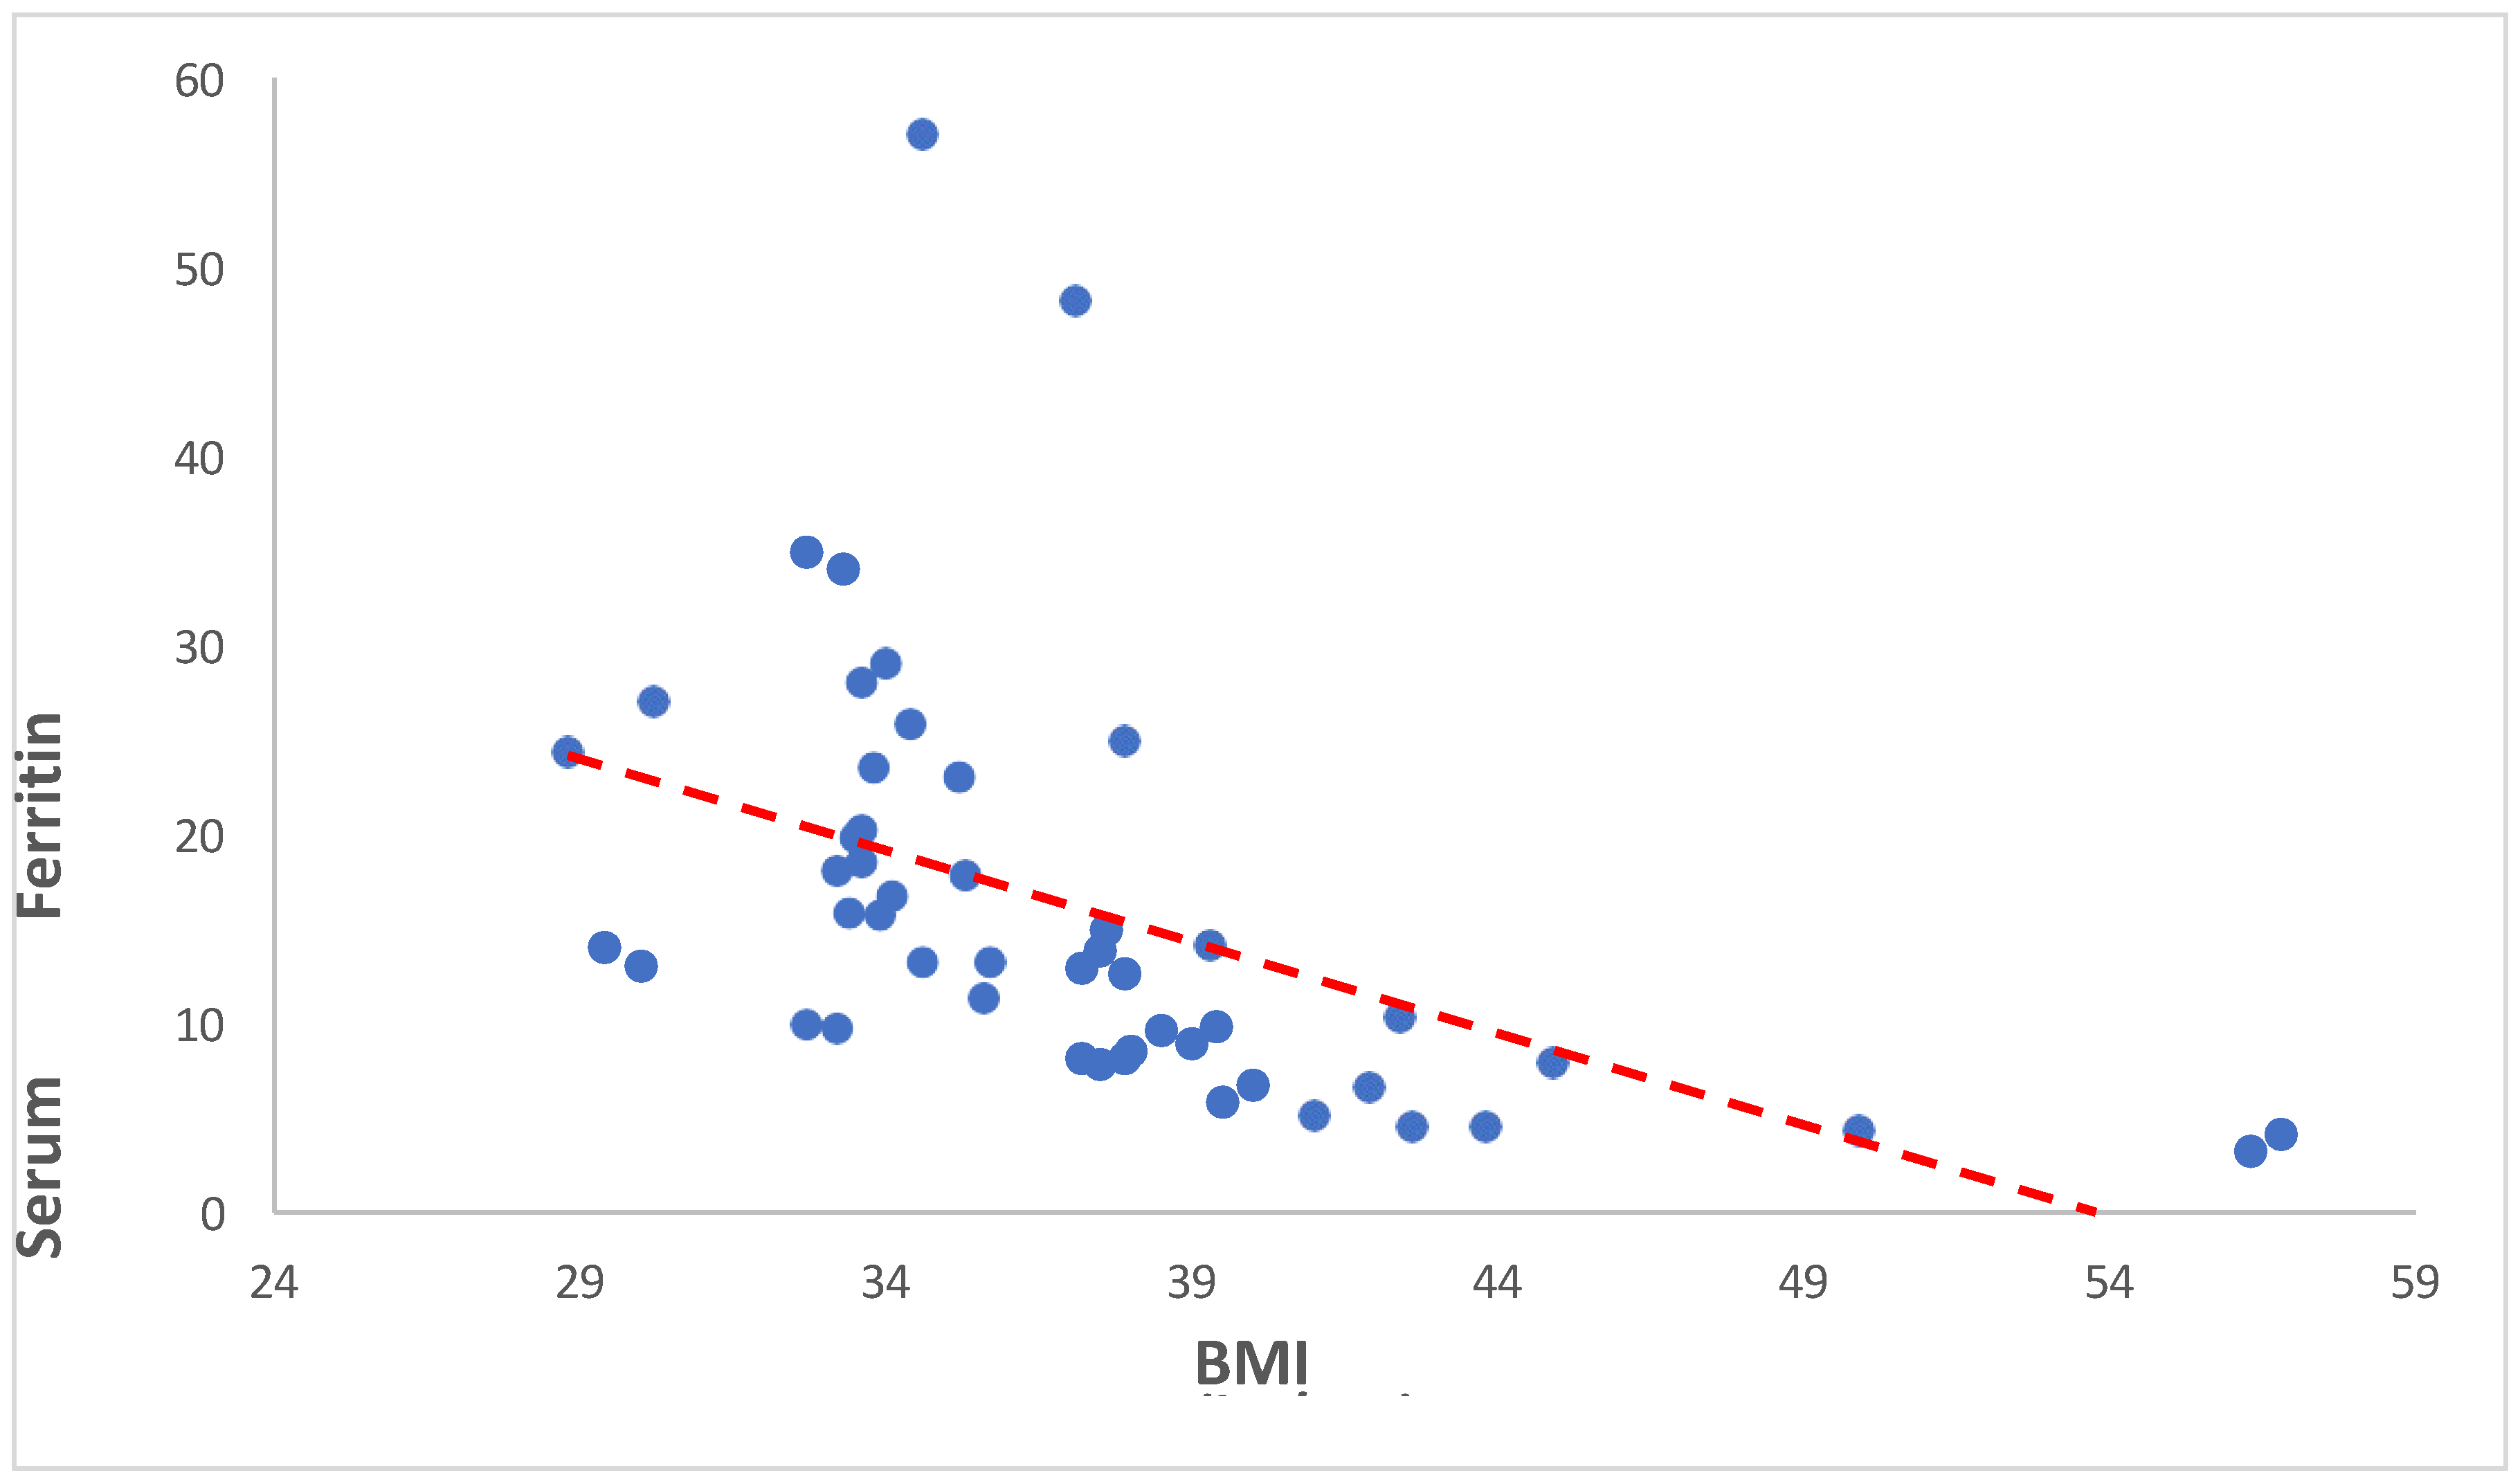
Figure 9.
Scatterplot between Weight and Serum Hepcidin (ng/mL).
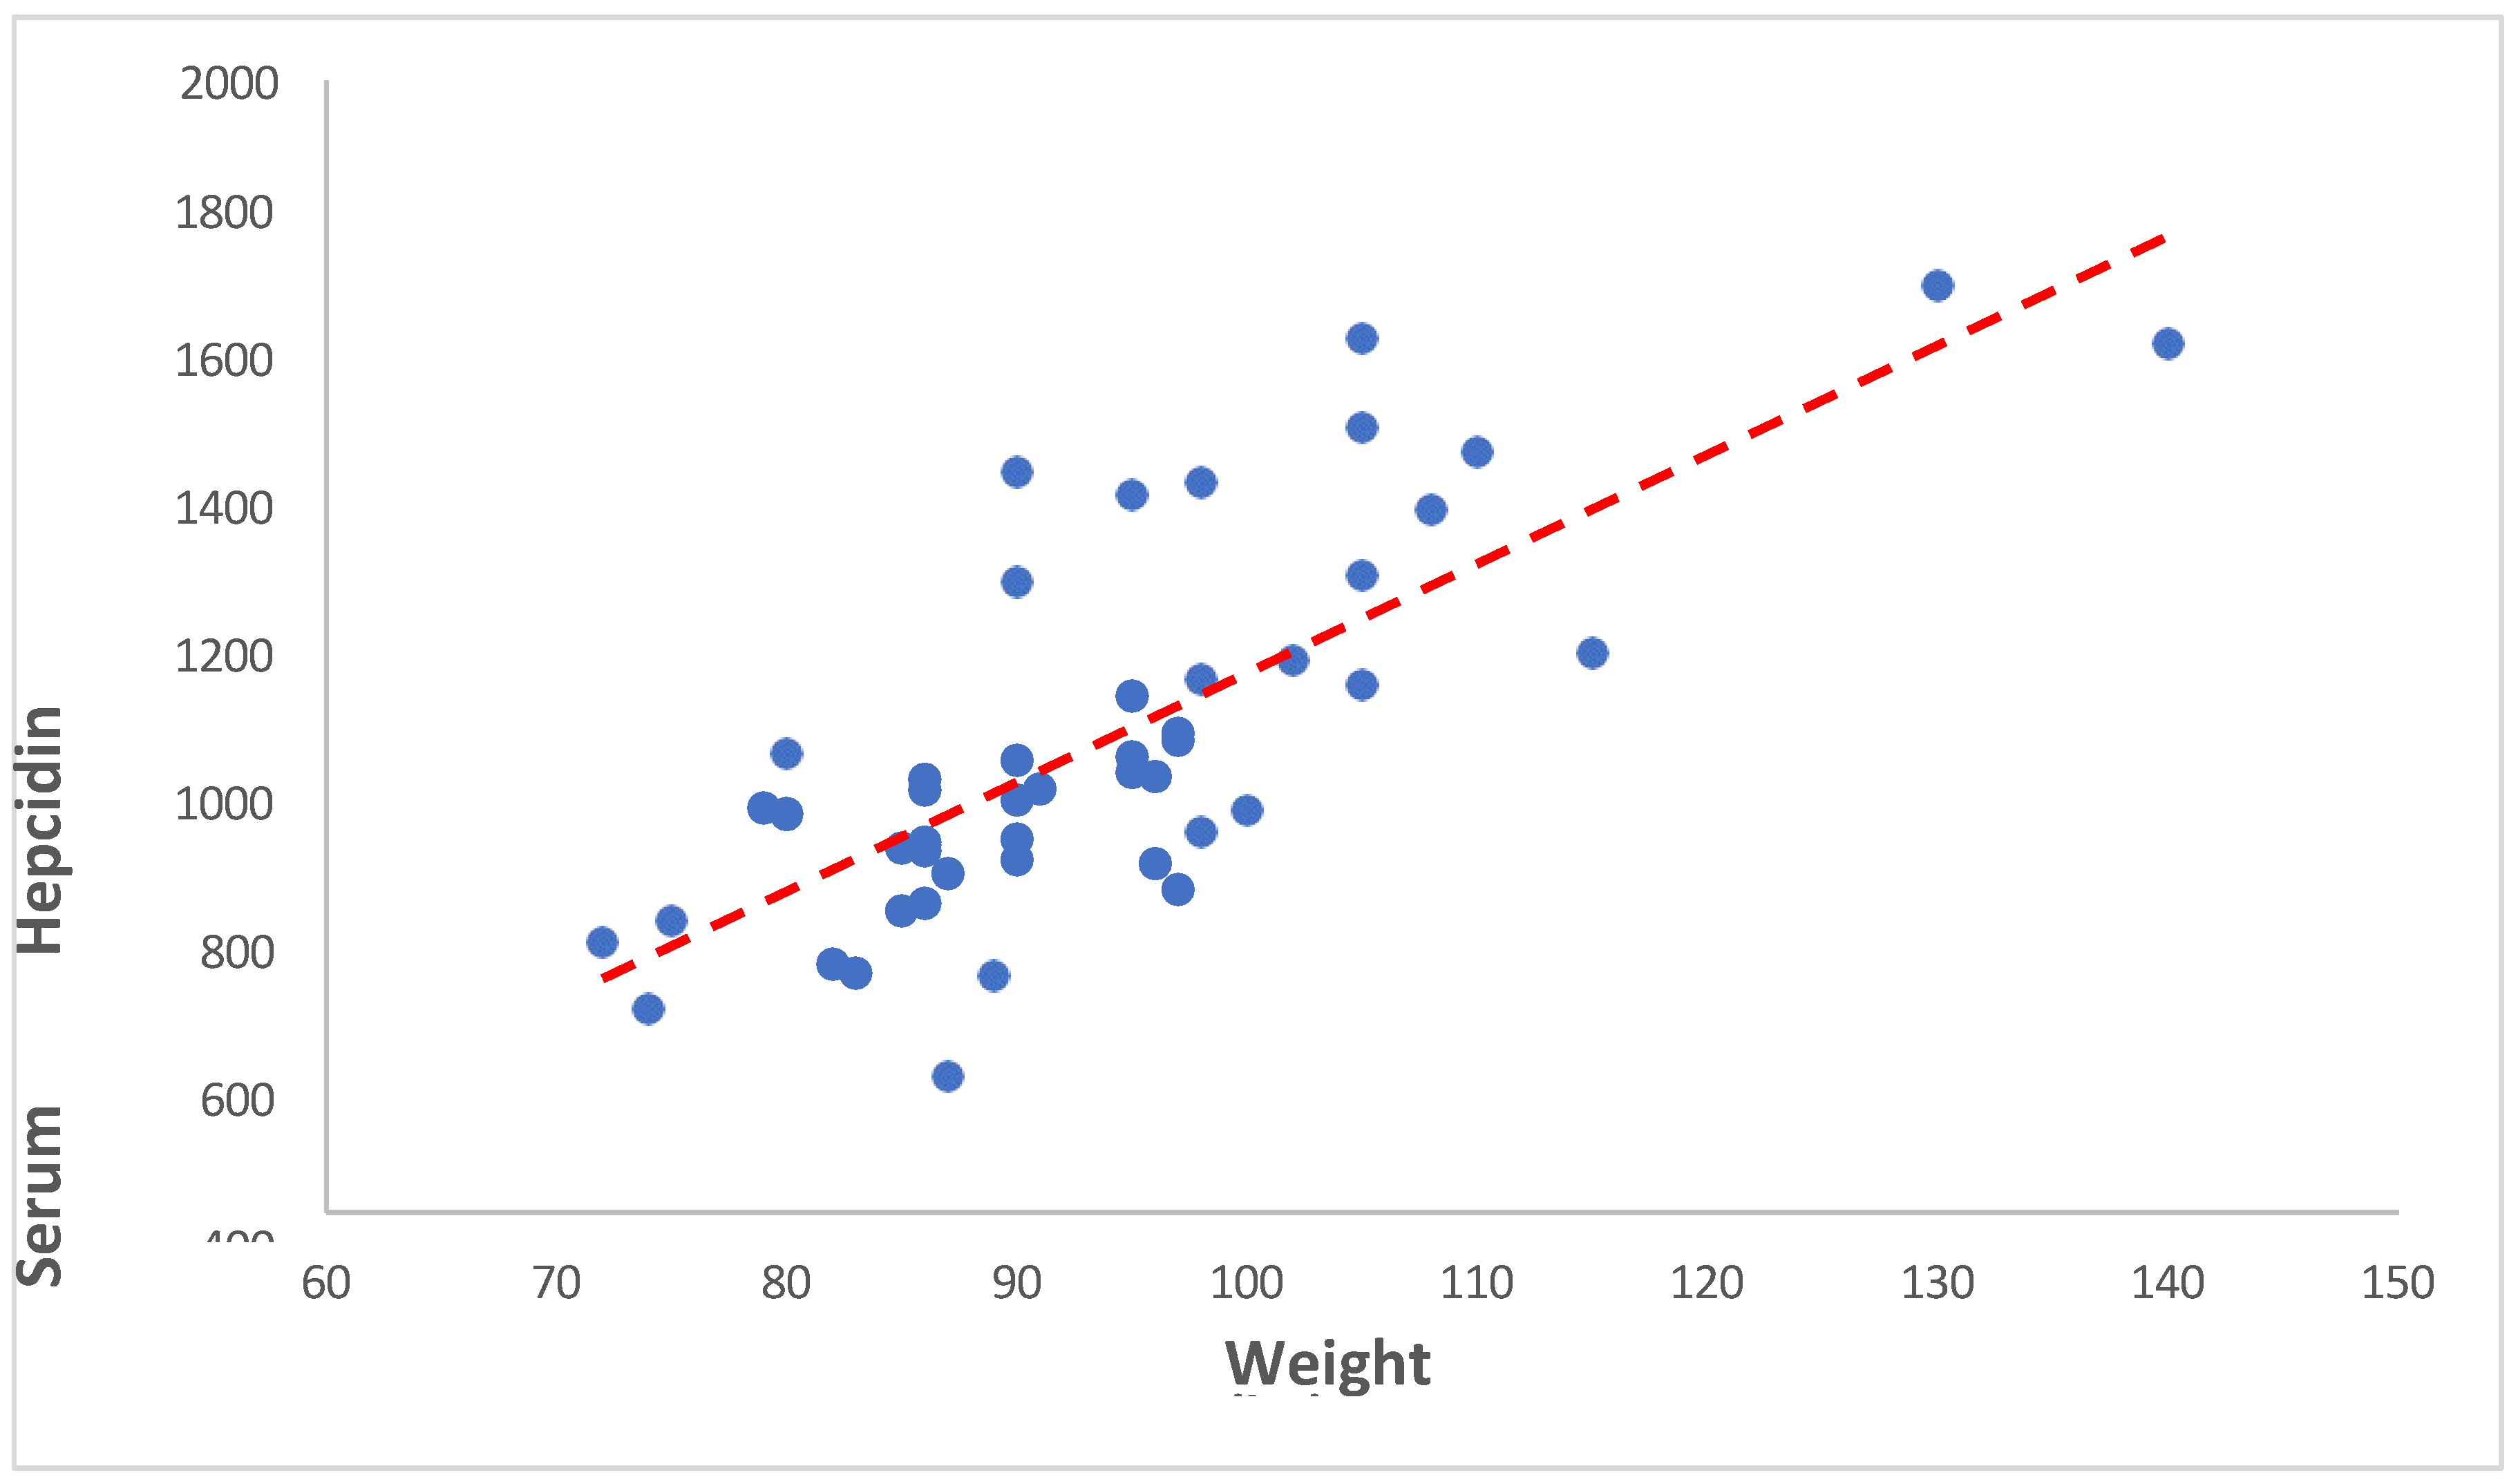
Figure 10.
Scatterplot between BMI and Serum Hepcidin (ng/mL).
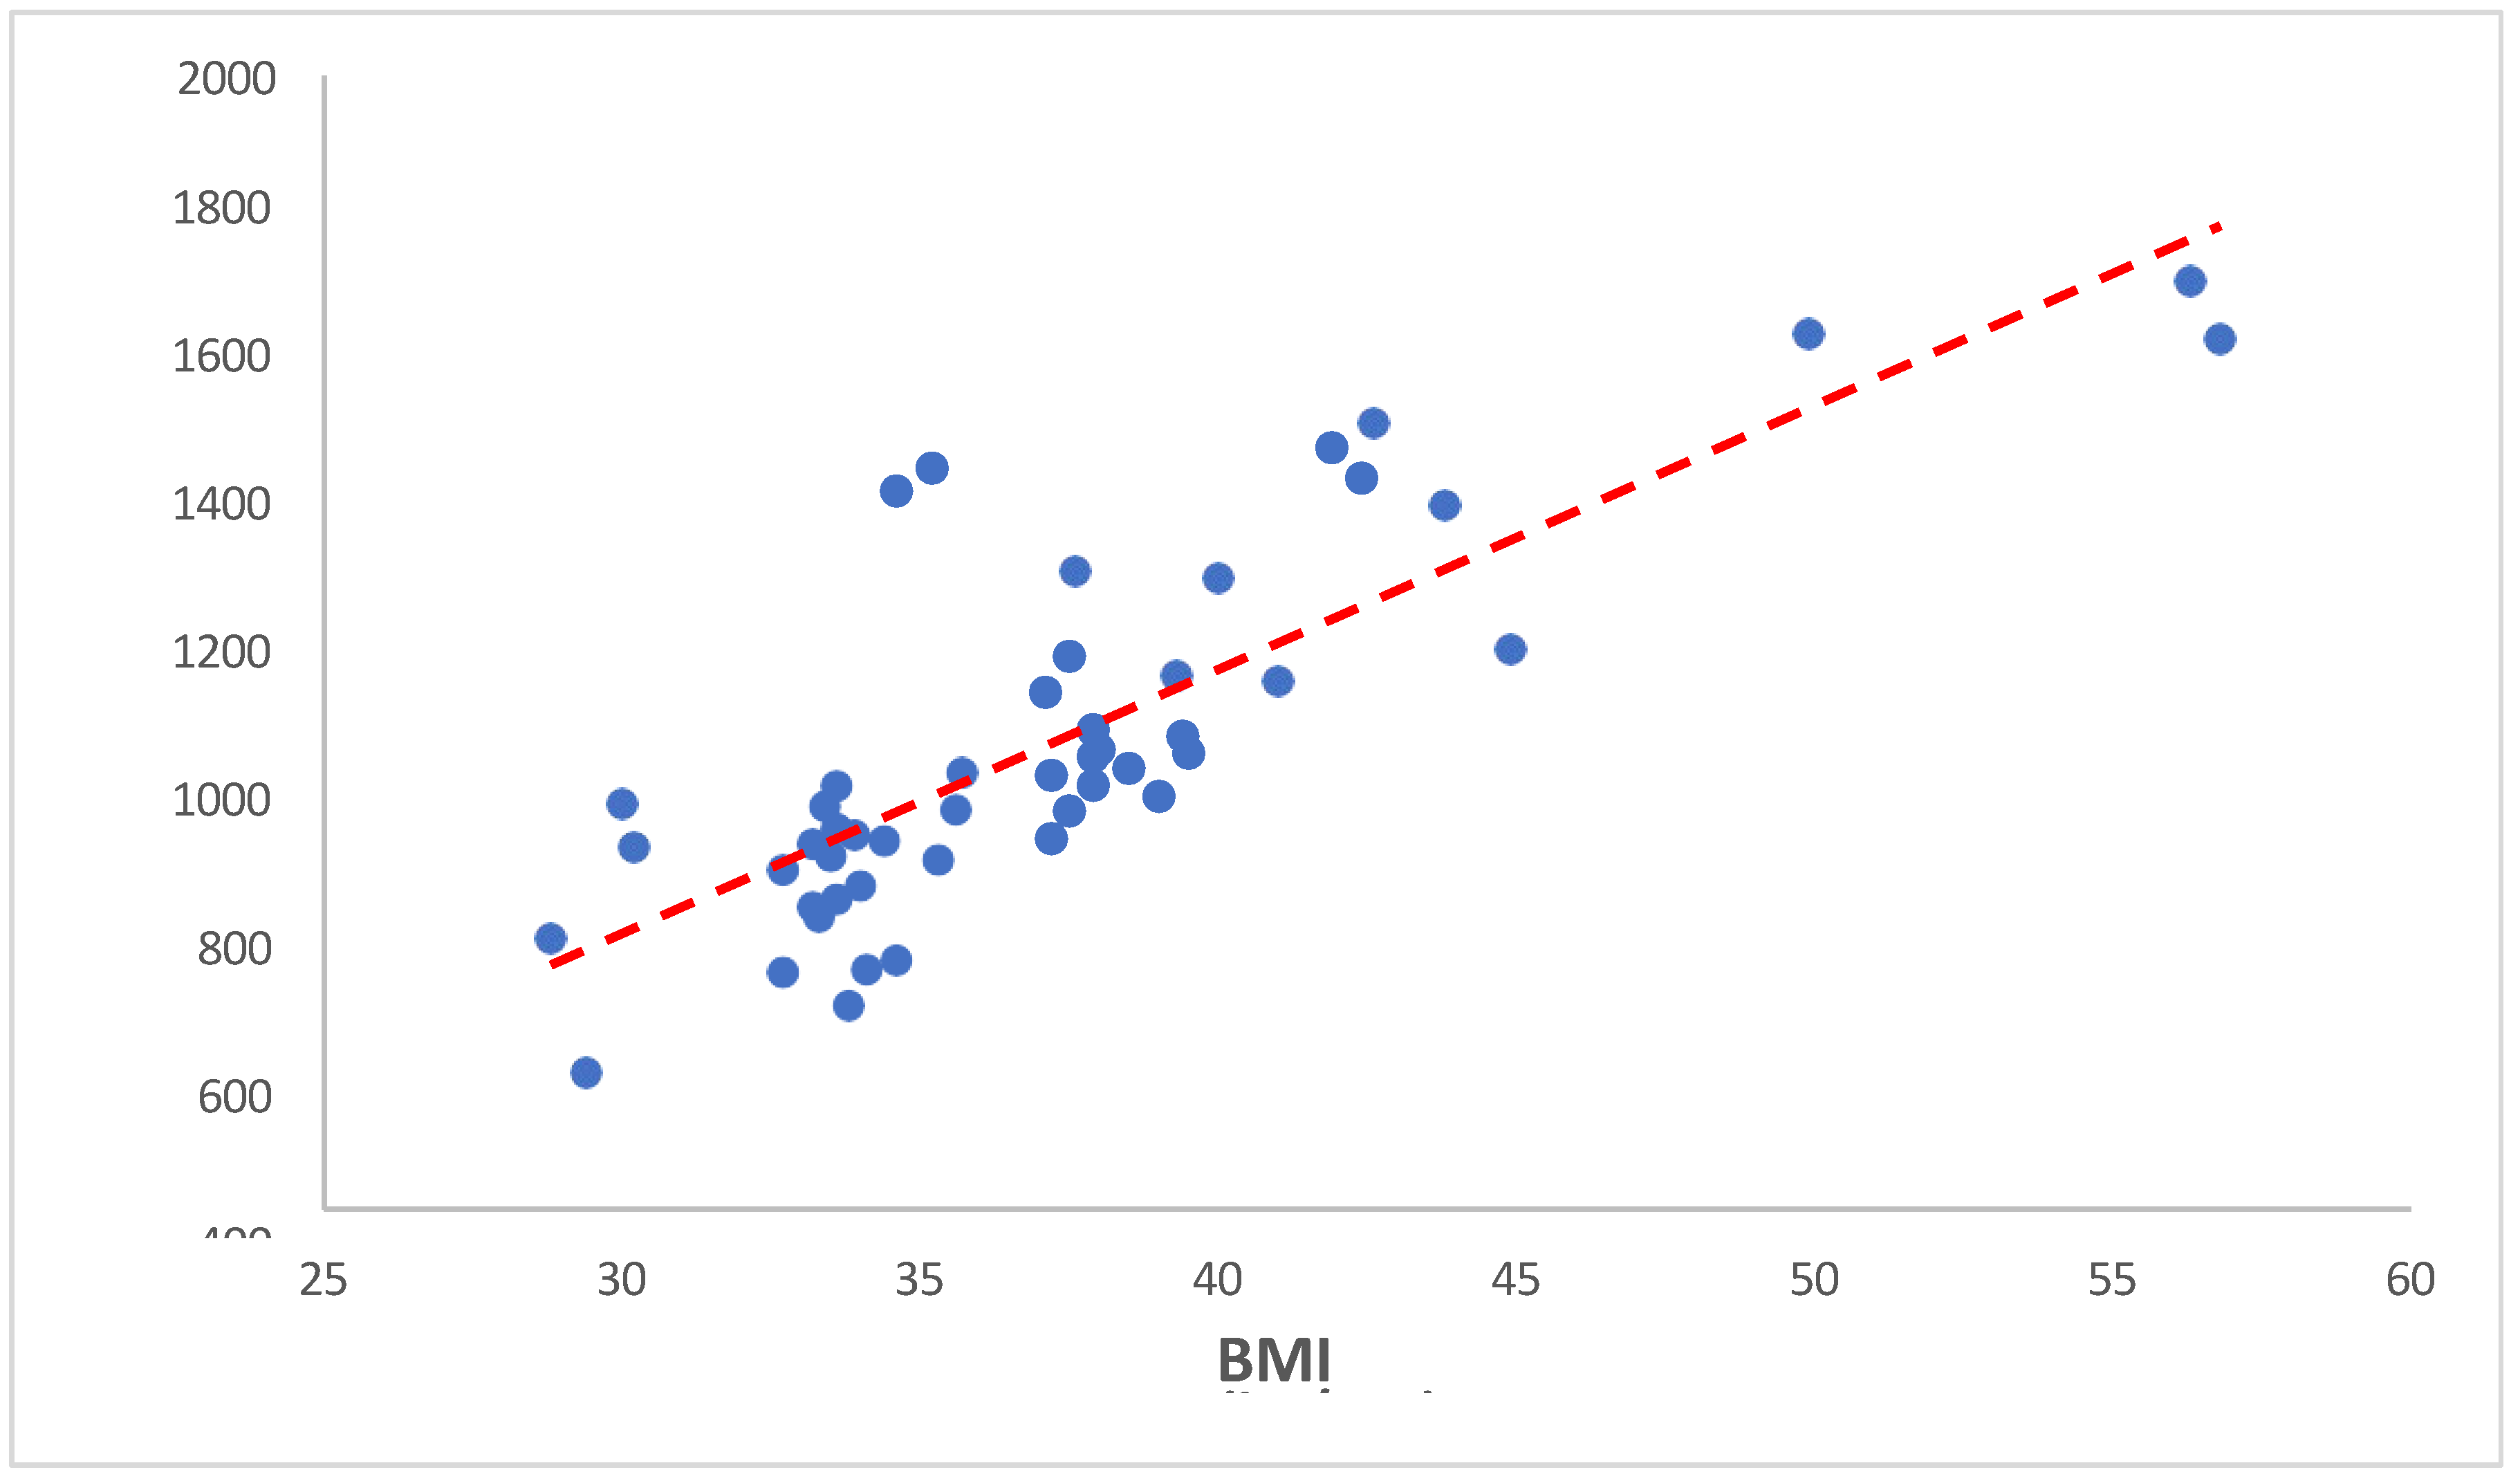
Figure 11.
Scatterplot between haemoglobin (g/dL) and Serum Hepcidin (ng/mL).
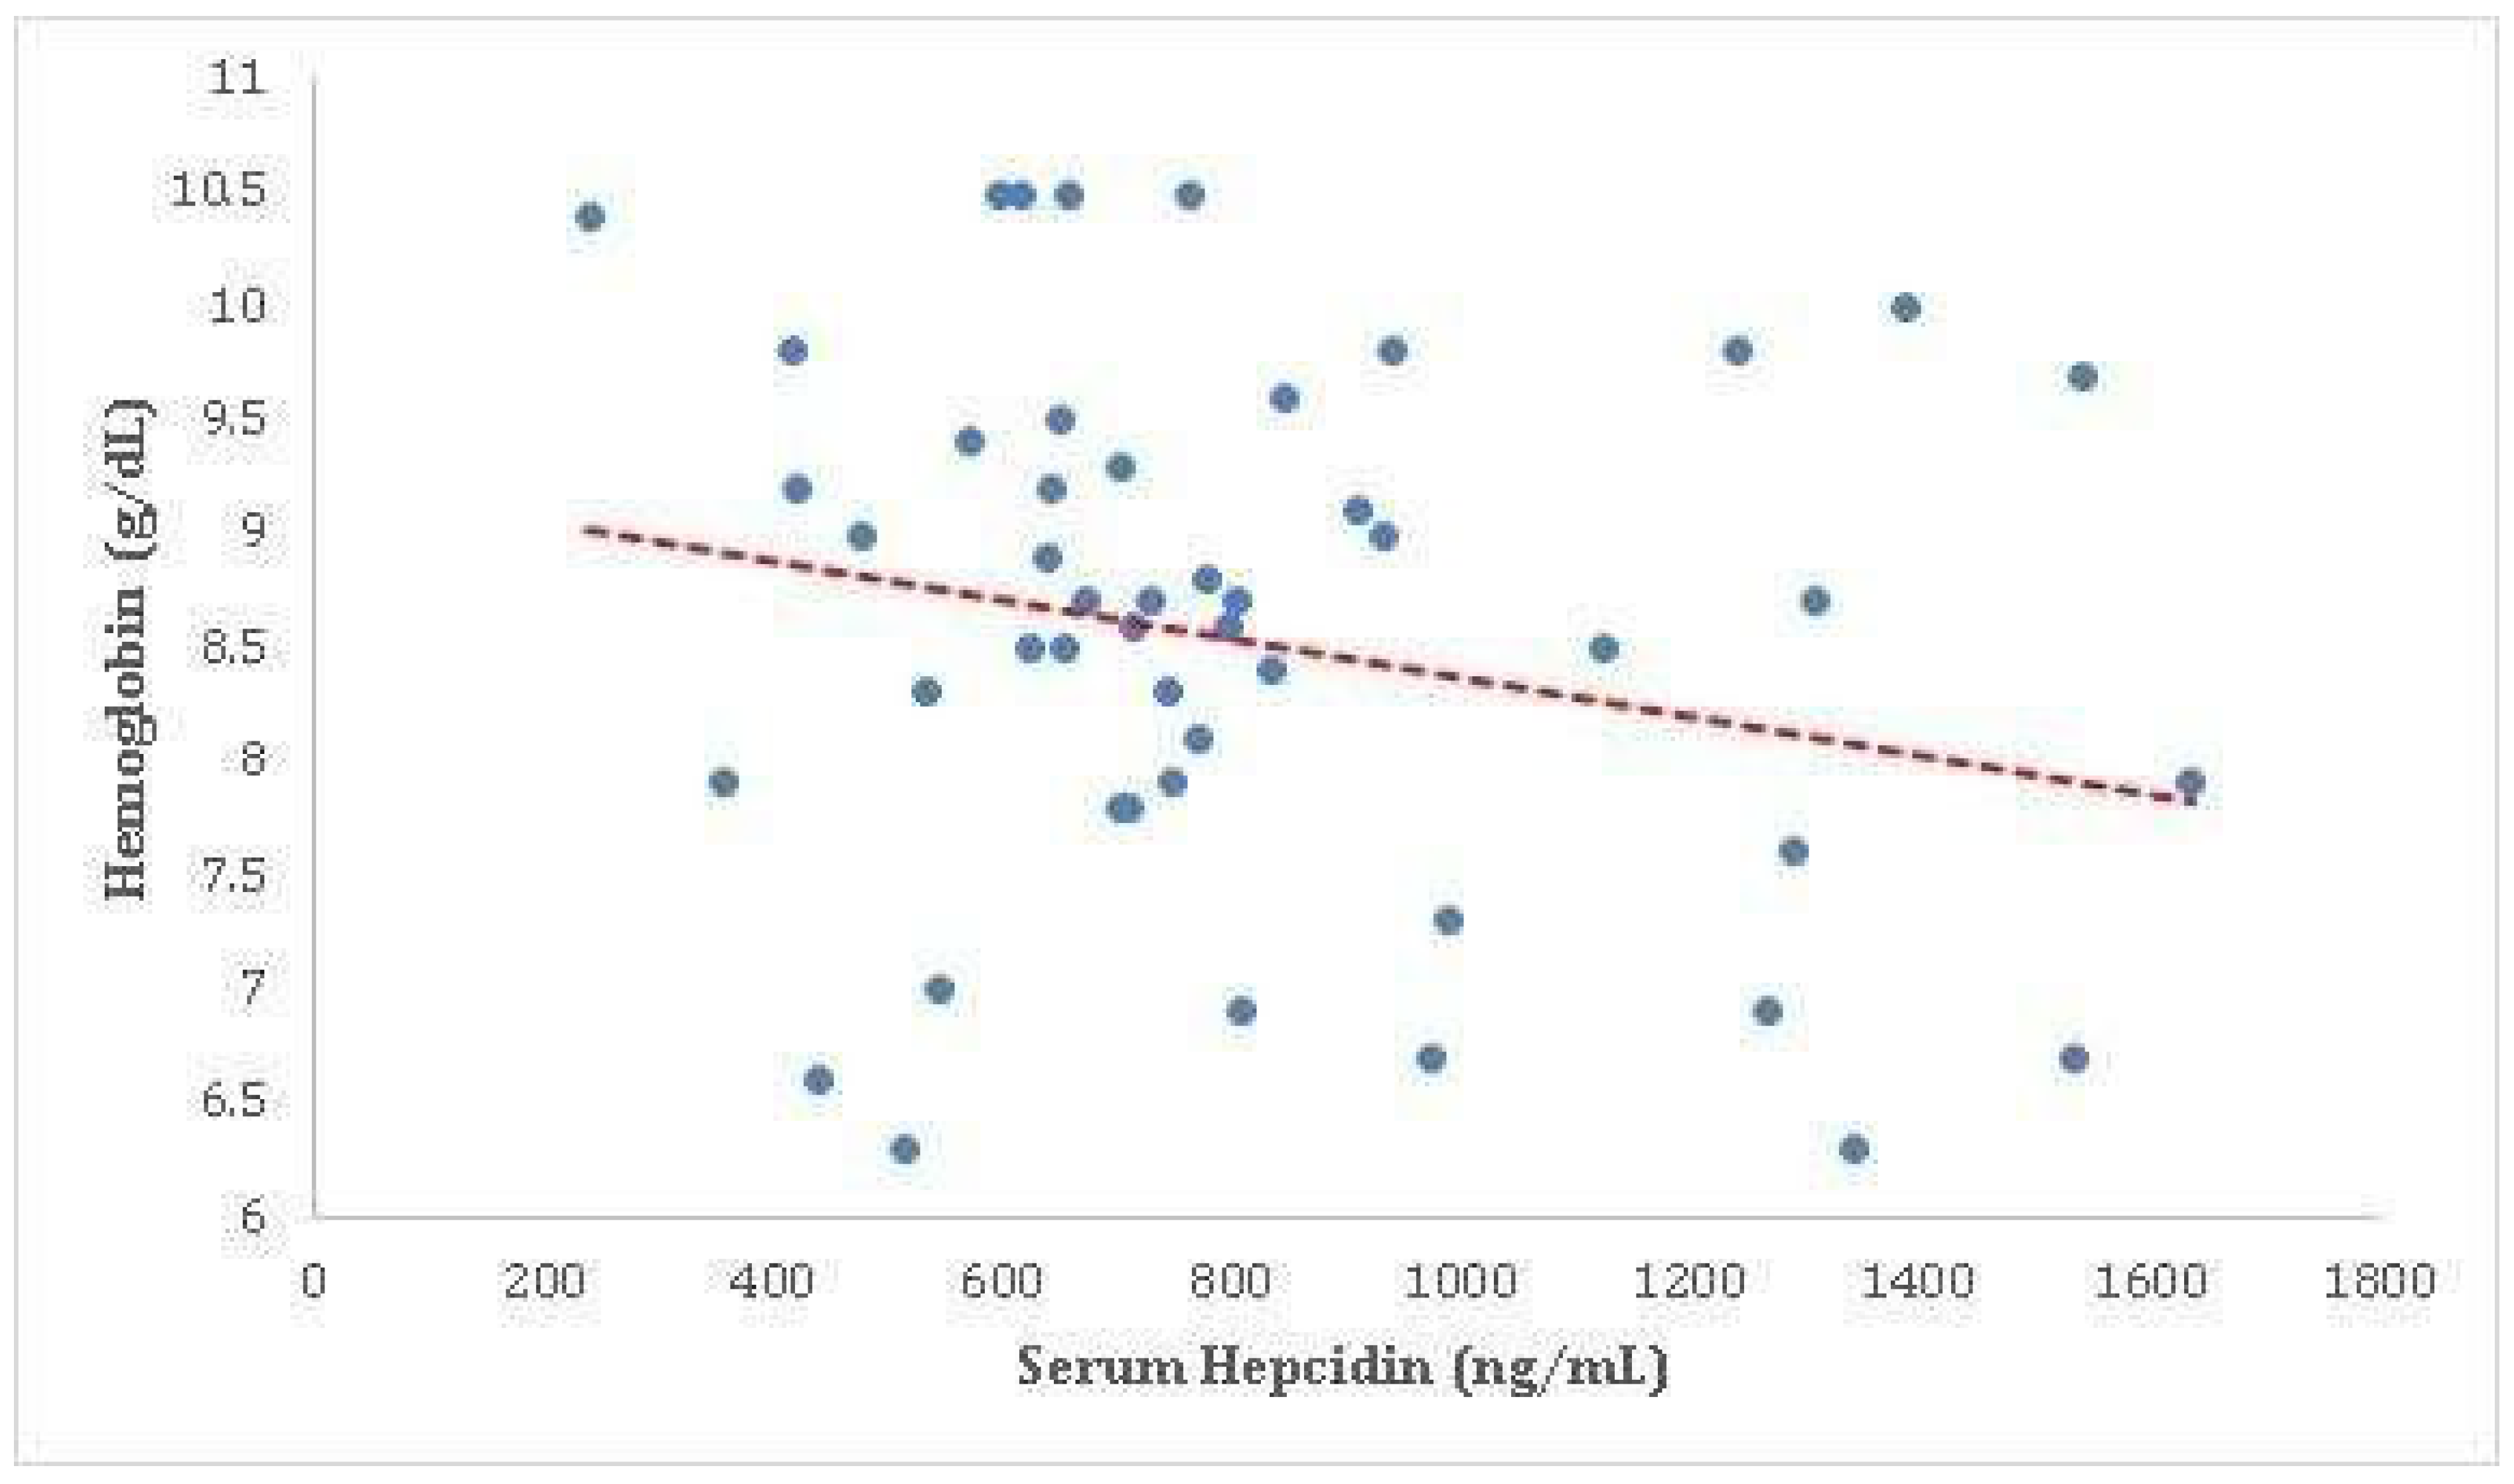
Table 2.
Showing the distribution of subjects based on Age (Years).
| AGE (YEARS) | Mean | 54.54 | |||
| Std | 11.32 | ||||
| Min | 28.0 | ||||
| Max | 80 | ||||
| AGE GROUP | GROUP | FREQUENCY | PERCENT | ||
| <29 YEARS | 1 | 2.0 | |||
| 30-44 YEARS | 7 | 14.0 | |||
| 45-59 YEARS | 25 | 50.0 | |||
| 60-74 YEARS | 14 | 28.0 | |||
| >75 YEARS | 3 | 6.0 | |||
Table 3.
Showing the distribution of subjects based on gender.
| GENDER | GROUP | FREQUENCY | PERCENT |
| FEMALE | 31 | 62.0% | |
| MALE | 19 | 38.0% | |
| TOTAL | 50 | 100% |
Table 4.
Showing the distribution of subjects based on anthropometric parameters.
| PARAMETERS | MEAN | STD | MIN | MAX |
|---|---|---|---|---|
| WEIGHT (KG) | 93.34 | 12.82 | 72.0 | 140 |
| HEIGHT (cm) | 158.6 | 6.79 | 145 | 173 |
| BMI (KG/m2) | 37.27 | 5.71 | 28.8 | 56.8 |
Table 5.
Showing the distribution of subjects based on cause of anaemia.
| Cause of Anaemia | GROUP | FREQUENCY | PERCENT |
| Iron Deficiency | 24 | 48.00% | |
| Anemia of ChronicIllness | 19 | 38.00% | |
| Combined Iron+B12Deficiency | 3 | 6.00% | |
| Combined Iron + FADeficiency | 2 | 4.00% | |
| Combined Iron+B12+FADeficiency | 1 | 2.00% | |
| B12 Deficiency | 1 | 2.00% | |
| TOTAL | 50 | 100% |
Table 6.
Showing the distribution of subjects based on laboratory parameters.
| PARAMETER | MEAN | STD | MIN | MAX |
|---|---|---|---|---|
|
Haemoglobin (gm/dL) |
8.53 | 1.23 | 5.6 | 10.5 |
| MCV (fL) | 78.75 | 10.13 | 53.0 | 99.0 |
|
ESR (mm/hour) |
20.56 | 21.47 | 4.0 | 155.0 |
| CRP (mg/dL) | 4.71 | 3.32 | 0.5 | 12.0 |
Table 7.
Showing the distribution of subjects based on iron parameters.
| PARAMETERS | MEAN | STD | MIN | MAX | |
|---|---|---|---|---|---|
| Serum Iron(mg/dL) | 21.56 | 12.22 | 10.0 | 65 | |
| Ferritin (ng/mL) | 15.97 | 11.04 | 3.2 | 57.0 | |
|
TIBC (microgm/dL) |
333.66 | 102.92 | 108.0 | 595.0 | |
| TS % | 7.31 | 5.25 | 1.68 | 27.43 | |
|
B12 (pg/mL) |
Levels | 606.54 | 275.8 | 150 | 1000 |
| Folate (ng/mL) | Levels | 12.09 | 5.23 | 3.06 | 20.0 |
| Hepcidin (ng/mL) | levels | 825.36 | 326.39 | 240.15 | 1637.18 |
Table 8.
Showing the distribution of subjects based on comorbidity.
| COMORBIDITY | GROUP | FREQUENCY | PERCENT |
| HYPERTENSION | 34 | 68.0% | |
| DIABETES | 18 | 36.0% | |
| OSAHS | 16 | 32.0% | |
| CAD | 9 | 18.0% | |
| OSTEOARTHRTIS | 7 | 14.0% | |
| CVA | 2 | 4.0% |
Table 9.
Showing the Spearman Rank Correlation analysis between BMI (kg/m2) and Serum Iron (µg/dL).
| Spearman’s rho | Serum Iron (µg/dL) | |
|---|---|---|
| BMI (kg/m2) | Correlation Coefficient | -0.645 |
| Sig. (2-tailed) | <0.001 | |
Table 10.
Showing the Spearman Rank Correlation analysis between BMI (kg/m2) and Serum Ferritin (ng/mL).
Table 10.
Showing the Spearman Rank Correlation analysis between BMI (kg/m2) and Serum Ferritin (ng/mL).
| Spearman’s rho | Serum Ferritin (ng/mL) | |
|---|---|---|
| BMI (kg/m2) | Correlation Coefficient | -0.723 |
| Sig. (2-tailed) | <0.001 | |
Table 11.
Showing the Spearman Rank Correlation analysis between Weight and Serum hepcidin.
| Spearman’s rho | Serum Hepcidin (ng/mL) | |
|---|---|---|
| Weight | Correlation Coefficient | 0.728 |
| Sig. (2-tailed) | <0.001 | |
Table 12.
Showing the Spearman Rank Correlation analysis between BMI and Serum hepcidin.
| Spearman’s rho | Serum Hepcidin (ng/mL) | |
|---|---|---|
| BMI | Correlation Coefficient | 0.817 |
| Sig. (2-tailed) | <0.001 | |
Table 13.
Showing the Spearman Rank Correlation analysis between Haemoglobin and Serum hepcidin.
| Spearman’s rho | Serum Hepcidin (ng/mL) | |
| Haemoglobin (g/dL) | Correlation Coefficient | -0.203 |
| Sig. (2-tailed) | 0.158 | |
Disclaimer/Publisher’s Note: The statements, opinions and data contained in all publications are solely those of the individual author(s) and contributor(s) and not of MDPI and/or the editor(s). MDPI and/or the editor(s) disclaim responsibility for any injury to people or property resulting from any ideas, methods, instructions or products referred to in the content. |
© 2024 by the authors. Licensee MDPI, Basel, Switzerland. This article is an open access article distributed under the terms and conditions of the Creative Commons Attribution (CC BY) license (http://creativecommons.org/licenses/by/4.0/).
Copyright: This open access article is published under a Creative Commons CC BY 4.0 license, which permit the free download, distribution, and reuse, provided that the author and preprint are cited in any reuse.


